trade costs of pakistan with its major trading partners
TRANSCRIPT
NUST JOURNAL OF SOCIAL SCIENCES AND HUMANITIES
Vol.3 No.2 (July-December 2017) pp. 232-264
Trade Costs of Pakistan with its Major Trading Partners:
Measurement and its Determinants
Saba Altaf*, Zafar Mahmood† and Shabana Noureen§
Abstract:
Trade costs are cited as an important determinant of volume of trade. Higher
trade cost is an obstacle to trade as it impedes the realization of gains from trade
liberalisation. Determinants of trade costs of Pakistan for the period 2003-2012 with
their major trading partners across Asia, European Union and North America are
investigated. Several gravity type variables have been used as trade cost determinants.
Trade costs for agricultural and non-agricultural sector are also calculated using a
micro-founded trade costs measure. Estimates of trade costs equivalents show a
declining trend of trade costs estimates over the period of study. Fully Modified
Ordinary Least Square estimation of the model shows that tariff rates and distances
between the trading partners increase the bilateral trade costs and thus adversely affect
trade. Results show that improvements in port infrastructure and membership of free
trade agreement significantly reduce the trade costs. Z-test shows that the effect of
determinants of trade costs for agricultural and non-agricultural sectors is invariant.
This paper recommends that the agreement on trade facilitation be implemented and
reduce the red tape at border crossings to cut down the trade costs.
Keywords: Trade Costs, Gravity Model, Liner Shipping Connectivity Index
1. INTRODUCTION
International trade is significantly affected by the trade costs
incurred locally and across the borders. Trade costs form a potentially
important barrier to trade. Higher trade costs are an obstacle to trade and
impede the realization of gains from trade liberalization,1 therefore
* Saba Altaf <[email protected]> is a graduate of Economics at School of Social
Sciences and Humanities (S3H), National University of Sciences and Technology,
Islamabad, Pakistan. † Zafar Mahmood <[email protected]> is Professor of Economics at School of
Social Sciences and Humanities (S3H), National University of Sciences and
Technology, Islamabad, Pakistan. §
Shabana Noureen <[email protected]> is a PhD Scholar at
Economics Department, School of Social Sciences and Humanities (S3H),
National University of Sciences and Technology, Islamabad, Pakistan.
233 Altaf, Mahmood and Noreen
special attention is given to trade costs. Owing to the importance of trade
costs in explaining the volume and direction of trade, international trade
economists are increasingly focusing upon trade costs and this has
become an area of key interest within the modern stream of international
trade research. The gradual decreeing of trade cost has been resulting
major risen in international trade thus this tremendous change has
brought improvement in every country for international trading over a
past years.
The pertinent question is what exactly are the trade costs? They
include all the costs incurred in getting a good to the final user, excluding
the marginal cost of producing the good itself. Hence, trade costs include
transportation costs (both freight costs and time costs), policy barriers
(tariffs and non-tariff barriers), information costs, contract enforcement
costs, costs associated with the use of different currencies, local
distribution costs (wholesale and retail) and legal and regulatory costs
[Singh, et al. (2014)].
Sources of trade costs are mainly divided into two main
categories. First category totally consists of bilateral factors to put
segregation between imported and exported and such factors are wide-
ly depending upon exogenous factors such as geographical distance,
common border or sharing a common language than particular policy
choices. The second category is composed of endogenous trade costs,
which are international connectivity such as air or maritime transport
services, tariffs and non-tariff measures, and other factors that facilitate
trade.
Evidence shows that with growing regionalism in the world,
countries have considerably reduced the tariff rates, i.e., 5% in
developed countries and 10 to 20% in underdeveloped countries
[Anderson and Van Wincoop (2004)]. With a drastic fall in tariffs on the
one hand, there are, on the other hand, some other barriers to trade that
are hampering the trade performance. Most important among those are
barriers relating to infrastructure quality besides the tariff and non-tariff
barriers, collectively these are referred to as policy barriers. Poor
1A growing literature has documented the impact of trade costs on the volume of trade
(see, for example, Anderson and Van Wincoop, 2004).
Trade Costs of Pakistan 234
institutions and poor infrastructure distort strategic trade policy focus,
not only in terms of the traditional mechanisms of tariffs and quotas but
also of infrastructure and logistics,2 the so-called ‘behind the border
issues’. Thus, besides the differences in economic size and endowments,
the differences in trade costs, which act as a friction to trade, is important
reason as to why some countries trade more than others.
In an increasingly globalized and networked world, trade costs
are of great importance from a policy perspective. This is because they
act as a determinant of the pattern of bilateral trade and investment as
well as of the geographical distribution of production. International trade
costs are large and vary widely across countries and sectors. These costs
are likely to be higher in developing countries as compared to the
developed countries due to the existence of substantial tariffs and non-
tariff measures accompanied by poor infrastructure, dysfunctional
transport and logistics.
Pakistan is a country heavily enriched with natural resources.
Pakistan’s major trade partners are Asian, European Union and North
American countries. These include China, USA, UK, India, Bangladesh,
Saudi Arabia, Malaysia, Japan, Germany and UAE. EU has now
emerged as Pakistan’s largest trading partner.3 Total trade between the
two amounts to about $10 billion with Pakistan’s share in EU market of
about 0.09% and the share of EU in Pakistani market is 11.39%. Pakistan
also has very strong trade ties with Asian economies like China, UAE,
Saudi Arabia, and Malaysia. The main reason behind massive trade of
Pakistan with Asian countries is low transportation costs, similarities of
consumer tastes and trading priorities. USA is also one of the strongest
trade partners of Pakistan.
The size of Pakistan’s current trade doesn’t truly reflect its trade
potential. This is mainly because the direction of Pakistan’s foreign
trade, which is trade cost dependent, has not changed virtually since its
independence. Keeping in view the trade potential of Pakistan and to
reap full benefits from international trade, it is thus imperative to have a
2See, for example, Khan and Weiss (2006), who explain how and why infrastructure
can assist the regional cooperation process. 3EUROSTAT (2013).
235 Altaf, Mahmood and Noreen
detailed insight into the determinants of trade costs. Pakistan needs to
pay serious attention to the trade costs because only then it will be in a
position to improve its ability to position better in global networks of
trade and production. A detailed study on the determinants and
calculation of trade costs will help identify the areas which need to be
given special attention to identify policies and measures that have a
significant effect on trade costs, and to prioritize them thus affecting the
overall trade flows and composition of trade consequently.
The research problem which is to be addressed and assessed in
this paper is “What are the factors that affect trade costs incurred by
Pakistan with its major trading partners”? The study uses a set of selected
trading partners of Pakistan due to the paucity of available data. The
main objective of the study is to measure the trade costs incurred by
Pakistan in agricultural and non-agricultural sector with its major trading
partners in three different regions of the world, i.e., Asia, Europe and
North America including USA, Germany, UK, Japan, China, UAE,
Saudi Arabia, Bangladesh, India and Malaysia and empirically
investigate the determinants of trade costs.
This area is virtually untapped in case of Pakistan. Therefore,
there is a need to have a research study that can show Pakistan’s position
in terms of trade costs and identify its determinants. Such a study can
provide insights that if properly targeted, trade costs can not only be
reduced but also proper policies can be formulated to help boost the
overall trade as well improving Pakistan’s position in global trade
network. This study would add to the literature by disaggregating trade
into two macro-sectors; agricultural and non-agricultural. Harmonized
System (HS)4 based on two digit level with its major trading partners in
three different regions of the world, i.e., European Union, Asia and
North America. The countries include USA, Germany, UK, Japan,
China, UAE, Saudi Arabia, Bangladesh, India and Malaysia.
4It is a coding system known for coding Harmonized Commodity Description of tariff
nomenclature. It is a system of International standard of names and codes in order to
classify traded products maintained by the World Customs Organization (WCO).

Trade Costs of Pakistan 236
2. LITERATURE REVIEW
Trade costs have become a key area of interest for researchers.
In this regard, it is important to understand which factors trigger the trade
costs of a particular economy. Existing literature draws attention to some
of important determinants of trade costs. This section sheds light on the
existing literature in this area.
Limao and Venables (1999) identified the determinants of
transport costs and showed how they depend on geography and
infrastructure. Tobit model was estimated for the year 1990 taking 93
countries. Distance, contiguity and landlocked-ness were taken as
geographical determinants and quality of transport and communication
infrastructure were studied as infrastructural determinants. They
discussed that land distance is much more costly than sea distance.
Landlocked countries have high transport costs which can be reduced by
better infrastructure facilities. They further argued that trade volume can
be increased by a factor of five if transport costs are halved. The study
highlighted the cost of being landlocked as far as bilateral trade flows
are concerned.
Arvis, et al. (2007) estimated the cost attached to landlocked-
ness with regards to the international trade. Based on empirical analysis,
the study found out that large proportion of least developed countries are
landlocked and their market access depends upon the availability of
trade corridor or a transit system. High degree of unpredictability
associated with transportation time increases the trade costs of
landlocked economies along with high freight charges. The study
highlighted the need for reliable logistic services which are hampered by
flaws in implementation of transit system. They pointed that the business
community should design and implement comprehensive trade facili-
tation strategies. In addition to the physical constraints, least developed
countries are also faced with a problem of widespread rent seeking
activities. Thus, they showed that high trade costs of LDCs are mainly
due to high transportation costs which explain major proportion of high
logistic costs and vulnerability of supply chains and these areas need to
be targeted specifically.
Novy (2007) analysed the patterns of trade costs of UK and USA
with 31 trading partners from a period of 1960-2002. His study found

237 Altaf, Mahmood and Noreen
out that tariff equivalents of trade costs for USA have declined over the
period of study with US showing lowest trade costs with Canada and
Mexico while UK exhibited a remarkable increase in its bilateral trade
costs over time. Novy used micro founded trade cost measure for the
calculation of trade costs. The main determinants of trade costs were
classified into geographical, historical and institutional factors. Distan-
ce, landlocked-ness and exchange rate volatility ad tariffs showed a
positive relationship with trade costs while common border,
membership of free trade agreement negatively affected the trade costs.
Olper and Valentina (2007) examined the patterns of inter-
national trade costs in processed foods industry for a large cross section
of developed and developing countries over the period of 1976-2000.
Panel data estimation technique with country and time fixed effects was
used in this study. Tariff equivalents of trade costs were taken as the
dependent variable and the independent variables were divided into four
categories as geographical factors, historical and cultural linkage,
institutional factors and infrastructure development. Their study found
out that geographical and historical factors dominate the infrastructural
and institutional determinants of trade costs. Empirical results showed
that tariff equivalents of trade costs for the Emerging countries declined
by 13% over the period of study. However, developing countries showed
a low reduction pattern thus highlighting a need for government to focus
on the issue in order to achieve the goal of economic growth. They also
highlighted the need for freer trade environment keeping in view the
influential role played by trade policy in reduction of trade costs.
Duval and Utoktham (2011) examined the trade costs of Indian
Mekong sub-region and also evaluated the policy related and other
factors in order to facilitate trade and reduce trade costs. Novy’s trade
cost measure has been employed for calculating the trade costs. Various
trade related factors which possibly effected the trade costs of the Indian
Mekong sub-region were found to be bilateral distance between the
trading partners, cultural distance, tariffs between the trading countries,
liner shipping connectivity index, internet users per hundred people, ease
of doing business and monetary costs of moving a container from factory
to port and port to warehouse. Cross sectional data set of 64 countries

Trade Costs of Pakistan 238
has been estimated for the year 2006 using the Ordinary Least Square
estimation.
The results show that trade costs between India and Mekong
countries are high. However, China, India, Thailand and most of other
Mekong countries are making progress in reducing trade costs among
themselves as compared to other countries like Japan and USA which is
mainly due to the enhanced regional connectivity. The study also
investigated the contribution of explanatory variables. Results revealed
that the natural barriers contribute about 22 percent to the total variations
in trade costs followed by the differences in maritime logistics and then
the trade related but non-trade specific measures such as credit
information, extent of information disclosure accounting for about 16
percent and 7 percent variations respectively in trade costs. The study
highlighted the importance of logistics and information technology
services regulation as important issues to reduce the trade costs.
Several researches have been conducted in different countries of
the world as far as measurement and determinants of trade costs are
concerned, but there is hardly any research on measurement of trade
costs of Pakistan and investigation of determinants of trade costs with
its major trading partners. Thus, the study at hand becomes all more
important to fill this research gap.
3. OVERVIEW OF THE ECONOMY IN THE CONTEXT
OF TRADE COSTS
Economic journey of Pakistan has faced serious global and
internal challenges since independence. Despite the critical circum-
stances, the country, however, managed to gain a momentum. In this
regard, the period of the 1960s was marked as the golden economic era
of Pakistan. Trade policies in that era focused on industrial development
and import substitution. Various incentives like tax rebates and exempt-
ions as well as export bonuses were offered on exports, which resulted
in a remarkable increase in export volume, with exports showing a
growth rate of 16.19%. In the late 1980s, due to increased economic
pressures and globalization forces, Pakistan initiated the process of trade
reforms and its intensity increased in the first half of the 1990s. Wide
239 Altaf, Mahmood and Noreen
ranging thorough liberalization programmes started in 1996-97 in the
agricultural sector. Government reduced average tariffs to a level of 15
percent compared to a high tariff rate of 51 percent in 1994/95 [WTO
(2007)]. Trade volumes of Pakistan increased sharply in the 2000s. Total
trade volume increased from $23,380 million in 2003 to $69,410 million
in 2013 [GOP (2014)].
Analysis of the trade costs of Pakistan for agricultural and non-
agricultural sector with its trading partners shows that on average
Pakistan is facing high levels of trade costs despite substantial fall in
tariffs worldwide. Quality of institutions and infrastructure differs across
countries thus causing a difference in their levels of trade and trade costs.
Therefore, today’s trade strategy goes beyond the traditional mechan-
isms of tariffs and quotas and includes “behind-the-border” issues, such
as the role of infrastructure and governance in supporting a well-
functioning trading economy. For instance, many studies show that
liberalisation of international transport services foster international trade
similar to tariff liberalization [Baier and Bergstrand (2001)].
Estimates of trade costs equivalents show that trade costs have
declined over the period of study thus showing an increase in
international trade volumes of the country (Table 1). It may be noted that
the agricultural sectors trade costs are comparatively higher than the non-
agricultural sector due to the existence of policy barriers including high
tariffs and non-tariff barriers. In addition, arguably the processing and
storage costs of agricultural commodities are higher than such costs on
industrial consumer goods.
Trade costs (TC) of Pakistan in agricultural and non-agricultural
sectors on average show a declining trend for the period 2003-2012
(Table 1). The reduction in trade costs (TC) is consistent with the
lowering of tariff rates. Tariffs not only make imports costly but also
discourage exports by raising the cost of imported inputs and act as an
implicit tax on exports. Thus, a fall in simple average tariff from 16.8%
in 2003 to 13.9% in 2012 has resulted into a rise in exports and imports,
also consistent with trade costs (TC) reduction.

Trade Costs of Pakistan 240
Table 1. Trend in Trade Costs of Pakistan for Agricultural &
Non-Agricultural Sectors
Year TC Agr TC NAgr LSCI Pak Tariff ΔER
(Dep/App)
TV
(US$ million)
2003 204.08 159.93 19.29 16.81 0.008759 23380
2004 202.70 156.51 20.18 16.17 0.021759 27905
2005 197.26 154.50 21.49 14.61 0.012992 34989
2006 196.02 150.13 21.82 14.79 0.00785 45032
2007 198.41 150.55 24.77 14.9 0.160433 47516
2008 192.14 150.01 24.61 14.08 0.186123 59018
2009 193.70 151.84 26.58 14.78 0.049439 52510
2010 189.23 148.15 29.48 14.51 0.014068 54000
2011 190.39 147.83 30.54 14.25 0.082774 65224
2012 187.70 144.94 31.97 13.99 0.09536 68540
Source: Authors’ estimations, except for LSCI, average tariff based on World Bank (2013) and trade volume
based on GOP (2013).
Note: Positive change in exchange rate represents depreciation and negative change in exchange rate represents
appreciation. LSCI stands for liner shipping connectivity index represents Port infrastructure, TV represents the
trade volume.
An analysis of changes in the nominal exchange rate (ER) shows
depreciation of nominal exchange rate (ER) over the period of study.
Depreciation of exchange rate (ER) has increased the bilateral trade
flows relative to domestic trade, thus, causing a reduction in overall trade
costs (TC). Hence, depreciation of nominal exchange rate (ER) is seen
as a factor helping in trade costs reduction.
Reduction in trade costs can also be attributed to improvement in
port infrastructure and shipment. Table 1 shows a significant improve-
ment in liner shipping connectivity index (LSCI) from 19% in 2003 to
32 % in 2012. More than 95% of total freight trade of Pakistan is sea
borne; an improved and efficient port infrastructure facilitates trade and
reduces trade costs. Keeping this in view, Ministry of Ports and Shipping
of Pakistan is focused to achieve the objective of modernization and
corporatization of ports introducing modern technology and data base in
line with the present day trends, reviving ship-owning in the private
sector by removing the impediments, and enhancing tonnage and
profitability of Pakistan National Shipping Corporation. Fulfilment of
these objectives will further enhance port efficiency, reduce the costs for
241 Altaf, Mahmood and Noreen
port users and enhance port management accountability; consequently
reducing trade costs.
3.1. Sectoral Trade Costs
In trade costs equivalent terms, Pakistan and UAE on average
have the lowest levels of trade costs in their bilateral trade, i.e., 146.5%
for agricultural sector and 104% for non-agricultural sector. Table 2 and
3 provide trade costs of agricultural and non-agricultural sectors. There
are many factors behind these lower trade costs between two partners;
these include geographical proximity, cultural linkage, no currency
restrictions from UAE, abundant energy supplies, and no corporate
taxation [Hamid and Hayat (2012)]. Trade costs between two countries
are expected to decline further with the decrease in oil prices, which will
reduce transportation costs.
Another interesting finding of trade costs analysis is that despite
being neighbouring countries, tariff equivalents of trade costs between
Pakistan and India are quite high, i.e., 218% for agricultural and 176%
for non-agricultural sector (Tables 2 and 3). Trade costs are not low
between these two countries owing to the economic, political and
military tensions. There is discriminatory stringent application of non-
tariff barriers by India, i.e., regulatory and safety requirements that
dampens Pakistani exports to India. Political uncertainty, strict pro-
cedures for licensing permits and visa hassles also act as barriers to trade,
thus increasing trade costs. India follows a restrictive trade regime
especially in case of agricultural goods which is depicted by the high
trade costs of agricultural sector. Similarly, for textile exports, India
observes a large number of non-tariff barriers including para-tariffs,
sanitary and photo sanitary (SPS) measures and pre-shipment inspection.
Some goods can only be imported through specified ports and road
routes between the two countries are only open for exports of limited
number of commodities. These bottlenecks on road and rail route and
weak and inadequate transportation links between the two countries
further increases the trade costs. Also, Pakistan maintained a “Positive
list” for the Indian imports until 2011, which only allowed the imports
of these 1,946 items from India. Later on the approach of “Negative list”

Trade Costs of Pakistan 242
was adopted by Pakistan which prohibited the import of 1209 items to
be imported from India. Positive list had also hindered the free flow of
goods between the two partners thus aggravating the overall trade costs
[Saleem, et al. (2014)]. With the adoption of a negative list, almost 85%
of goods can be imported from India compared to level of 25%
previously.
Pakistan and China are leading trading partners and neighbouring
countries, sharing a common border. However, bilateral trade costs
between two countries remain high. The government of China promotes
domestic consumption through structural tax reduction policies and there
is a strong domestic demand in China. Although, bilateral trade flows
between two countries are very large, yet China’s customs procedures
still require harmonization. Besides, its tariff regimes have not changed
substantially, which is a possible reason behind high trade costs.
In addition, China maintains restrictions, licensing and prohibit-
ions on grounds of state security and morality, all these factors add to the
levels of trade costs. Bilateral costs of trade between two countries can
be reduced by upgrading the Karakoram Highway which is the shortest
overland route between the two countries. Also, the construction of an
economic corridor is foreseen as a great opportunity to reduce the
staggering amount of time and distance consequently reducing the trade
costs. Long shipping routes between the two countries add to the costs
of trade which can be lessened by the construction of a direct corridor
from Kashgar to Gwadar, which is estimated to cut down the existing
costs associated to long distance by one-third of the current levels
[Kayani, et al. (2013)].
USA is also among the top ten major trading partners of Pakistan.
Trade costs between the two countries are high owing to the long
distance as well as many other contributing factors. USA’s domestic
trade relative to international trade with Pakistan is very high as
compared to Pakistan. The reason behind high values of domestic trade
is that there is an excellent working relationship between US
manufacturers and other distributors that provides wholesale customers
with access to barge product wherever and whenever they need it. Also,
there is an ease of transport (ground versus air/sea) which makes
domestic trade more feasible. Trade costs between two countries are high

243 Altaf, Mahmood and Noreen
because of large distance, stressed relationship between the government,
licensing and quality control requirements from USA government.
Pakistan is a country that is included in the list of Restricted Entities by
USA, imposition of non-tariff barriers makes textile and clothing
products of Pakistan suffer the most.
Table 2. Estimates of Trade Costs Equivalents for Agricultural Sector US Dollar (USD)
Year IND UAE CHN SA UK USA MYS JPN GMY BD
2003 241.26 148.28 222.76 217.26 190.21 205.22 200.31 239.38 224.92 151.18
2004 239.87 148.19 219.47 215.38 194.16 186.24 201.76 242.01 224.27 156.65
2005 217.54 142.31 207.87 210.65 191.83 201.09 199.33 240.87 220.86 150.09
2006 196.67 144.37 217.21 208.85 188.42 192.01 203.25 244.09 216.73 158.92
2007 222.88 148.86 196.07 208.87 190.65 193.84 199.07 233.54 218.59 151.07
2008 218.38 147.27 207.21 197.99 185.16 181.39 192.41 233.81 214.41 151.24
2009 221.74 146.92 206.35 199.52 184.25 190.03 180.85 229.68 212.57 150.12
2010 219.91 142.73 203.41 196.37 182.96 188.95 185.80 226.03 208.57 149.04
2011 213.50 149.18 199.91 206.34 181.23 192.93 179.77 219.32 209.42 149.82
2012 212.88 147.20 191.78 202.98 180.01 187.63 179.84 214.91 208.68 149.01
Avg. 218.66 146.53 206.62 204.42 192.68 191.93 192.24 232.57 209.76 151.71
Source: Authors’ calculations.
Note: IND stands for India, CHN stands for China, BD stands for Bangladesh, SA stands for Saudi Arabia, MYS
stands for Malaysia, JPN stands for Japan, GMY stands for Germany.
Pakistan and EU enjoy very strong and rapidly growing trade ties.
We have chosen two countries from EU, United Kingdom and Germany
for the purpose of trade costs analysis. Estimated trade costs show that
despite the fact there is no cultural or geographical proximity between
Pakistan and selected EU member states, trade costs on average are not
very large. A further decline in trade costs is expected to occur by the
GSP plus status granted by EU to Pakistan in 2014. Before that, Pakistan
was given a general GSP status, and Pakistani exports faced some sort
of non-tariff barriers like standard intellectual property rights, rules of
origin and competition policy.
Pakistan and Bangladesh have not been able to bring about a
significant reduction in their bilateral trade costs. Though trade between
two countries is growing progressively and has crossed $1 billion mark
but there is a need to develop trade facilitation strategies that can further
Trade Costs of Pakistan 244
reduce trade costs. At present there is no direct air link between two
countries, especially between Lahore and Dhaka. Infrequent shipping
arrangements between the two countries hamper flow of goods between
Pakistan and Bangladesh.
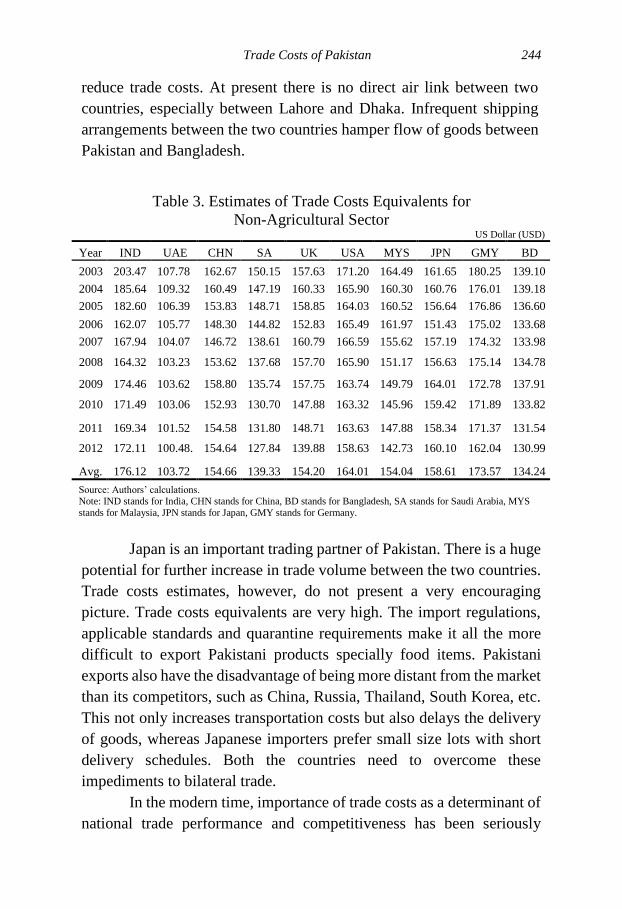
Japan is an important trading partner of Pakistan. There is a huge
potential for further increase in trade volume between the two countries.
Trade costs estimates, however, do not present a very encouraging
picture. Trade costs equivalents are very high. The import regulations,
applicable standards and quarantine requirements make it all the more
difficult to export Pakistani products specially food items. Pakistani
exports also have the disadvantage of being more distant from the market
than its competitors, such as China, Russia, Thailand, South Korea, etc.
This not only increases transportation costs but also delays the delivery
of goods, whereas Japanese importers prefer small size lots with short
delivery schedules. Both the countries need to overcome these
impediments to bilateral trade.
In the modern time, importance of trade costs as a determinant of
national trade performance and competitiveness has been seriously
Table 3. Estimates of Trade Costs Equivalents for
Non-Agricultural Sector US Dollar (USD)
Year IND UAE CHN SA UK USA MYS JPN GMY BD
2003 203.47 107.78 162.67 150.15 157.63 171.20 164.49 161.65 180.25 139.10
2004 185.64 109.32 160.49 147.19 160.33 165.90 160.30 160.76 176.01 139.18
2005 182.60 106.39 153.83 148.71 158.85 164.03 160.52 156.64 176.86 136.60
2006 162.07 105.77 148.30 144.82 152.83 165.49 161.97 151.43 175.02 133.68
2007 167.94 104.07 146.72 138.61 160.79 166.59 155.62 157.19 174.32 133.98
2008 164.32 103.23 153.62 137.68 157.70 165.90 151.17 156.63 175.14 134.78
2009 174.46 103.62 158.80 135.74 157.75 163.74 149.79 164.01 172.78 137.91
2010 171.49 103.06 152.93 130.70 147.88 163.32 145.96 159.42 171.89 133.82
2011 169.34 101.52 154.58 131.80 148.71 163.63 147.88 158.34 171.37 131.54
2012 172.11 100.48. 154.64 127.84 139.88 158.63 142.73 160.10 162.04 130.99
Avg. 176.12 103.72 154.66 139.33 154.20 164.01 154.04 158.61 173.57 134.24
Source: Authors’ calculations.
Note: IND stands for India, CHN stands for China, BD stands for Bangladesh, SA stands for Saudi Arabia, MYS
stands for Malaysia, JPN stands for Japan, GMY stands for Germany.
245 Altaf, Mahmood and Noreen
recognized by the developed countries. Their governments have been
critically analysing and performing research for making effective
policies for reduction of trade costs. On the other hand, developing
countries have been rather ignorant and little efforts have been made so
far at policy level to address this issue. Pakistan is not different from
other developing nations. By looking at trade costs estimates, we find
that the country still faces high bilateral trade costs viz a viz its major
trading partners. This shows government’s lack of policy attention
towards trade facilitation. Pakistan still exports large volume of agri-
cultural products, while trade costs for agricultural sector are sub-
stantially higher than that of non-agricultural sector, which speaks of
sectoral inefficiency and bias in policies. Thus, the key need is to identify
the primary sources of trade costs and formulate what government
should do to address them so that trade can be used to sustain high rate
of economic growth over a longer period of time.
4. THE TRADE COSTS MODEL
4.1. Theoretical Framework
Trade costs are cited as important determinant of international
trade. Given the nature and pattern of trade costs, the Gravity model of
international trade is most suitable to determine factors that affect trade
costs. This is because the model provides main link between trade flows
and trade barriers. The Gravity model has become a major pillar in
applied international economics [Evenett and Hutchinson (2002)]. It is
basically motivated by the Newton’s gravitational law in which the
gravitational force utilized among two bodies is determined by their
distance and mass. This model became popular in international
economics with the pioneering work of Tinbergen (1962). It relates
bilateral trade flows to the GDP, distance, and other factors including
trade barriers. Anderson (1979), Deardoff (1998), Hummels (1999),
Baier and Bergstrand (2001), Limao and Venables (2001) have applied
it in a wider sense to infer trade flow effects of institutions such as
customs unions, exchange rate mechanisms, ethnic ties, linguistic
identity and international borders.

Trade Costs of Pakistan 246
This paper makes use of Novy’s (2008) trade costs measure. This
is a micro founded measure of trade cost that has been derived from
Anderson and Van Wincoop (2003) model based on the Gravity
equation. The Gravity equation has been most widely used instrument
for modelling the bilateral trade flows. As a workhorse of international
trade, it relates countries bilateral trade with their economic sizes and
trade costs. This measure analytically solves the theoretical gravity
equation for the trade cost parameters that capture the barriers to
international trade.
Novy (2007) explained multilateral trade hindrance factors in
detail and solved that trade function too. These new strategies are
applicable to both international and domestic trade resistance. Basically,
when the cost of a particular product reduces then such items are shipped
out of countries and this implies that such hindrance have huge impact
on domestic trade too. Previous theories don’t justify this boarder
hindrance and also, they don't take domestic trade in any account. A
slight change in trade barriers can bring noticeable change in resources
and can shift recourses into tradeable and non-tradable sectors and this
will result in changes in trade flows (either bilaterally or multilaterally).
Hence, multilateral resistance of the trading countries explains domestic
trade very well so it is important to include domestic factor into the
equation also to address the home biased.
The motivation behind Novy’s approach was to overcome the
drawbacks that were associated with the theory-based gravity framework
by Anderson and Van Wincoop (2003), which imposed certain arbitrary
trade cost functions. The theory-based gravity formulation was a
refinement of the traditional gravity equation to include multilateral trade
resistance variables.
Anderson and Van Wincoop [AvW (2003)] derived a micro
founded trade cost measure based on a multi-country general equilibrium
model expressed as:
... (1)
where, 𝓧𝒊𝒋 is the bilateral trade from i to j, 𝓨𝓲 & 𝓨𝓳 are nominal income
of country i and j, 𝓨𝔀 is the world income, 𝚷𝓲 is the outward multilateral
resistance of country i, 𝓟𝓳 is the outward multilateral resistance of

247 Altaf, Mahmood and Noreen
country j, and 𝓽𝓲𝓳 is the bilateral trade cost measure, σ is the elasticity
of substitution between goods. The main innovation in AvW's (2003)
model is to incorporate exporter and importer price indices (Π and P )
such that trade not only depends on bilateral trade costs between the two
countries but also on the trade “resistance” they face with all of their
trading partners in the rest of the world. That is, country i is more likely
to trade with country j if πi is higher, meaning the multilateral resistance
of country i to all other partners is higher.
Using Equ. (1), consider the intra-national trade of country i as:
… (2)
and rewrite it as:
… (3)
which solves for country i's multilateral resistance. Multiplying Equ. (1)
with 𝓧𝓳𝓲, we obtain:
… (4)
substitute Equ. (3) for country i and j into (2), we can derive the bilateral
trade costs relative to domestic trade costs expressed as tariff equivalent
by subtracting 1:
… (5)
where,
τij = tariff equivalent trade cost (i.e., measures domestic trade relative to
bilateral trade).

Trade Costs of Pakistan 248
tij = international trade costs from country i to country j.
tji = international trade costs from country j to country i.
tii= intra-national trade costs of country i tjj denotes intra-national trade
costs of country j.
xij =international trade flows from country i to country j.
xji =international trade flows from country j to country i.
xii =intra-national trade of country i.
xjj =intra-national trade of country j.
σ denotes elasticity of substitution between all goods.5
τij is defined as a ratio of trade cost across national border relative to
trade cost within national border weighted by the elasticity of
substitution. It must be noted that τij is not directional, i.e., τij measures
the barrier between country i and j on average, so that it is a two-way
trade cost measure. Intuitively, it measures the bilateral trade cost for
both importing and exporting countries. Trade costs τij, thus represent the
geometric average of international trade costs between countries i and j
relative to domestic trade costs within each country. Intuitively, trade
costs are higher when countries tend to trade more with themselves than
they do with each other, i.e., as 𝑋𝑖𝑖𝑋𝑗𝑗/𝑋𝑖𝑗𝑋𝑗𝑖 increases. As the ratio falls
and countries trade more internationally than domestically, international
trade costs must be falling relative to domestic trade costs.
An additional advantage of Novy’s trade cost measure is that it
allows time-varying measurement of bilateral trade barriers. With
readily available trade and production data in tradable goods categories,
we are able to measure and explain the determinants of bilateral border
effects.
The gravity equation represents one of the greater successes in
empirical economics, as it describes the value of bilateral trade, which is
function of the market size of the importer as well as exporter, and
5See, Anderson and Van Wincoop (2003) for detailed discussion on elasticity of
substitution between goods. This thesis follows AVW’s and Novy (2008) σ=8, which
is the middle point of available estimates. Smaller value of σ results in higher trade
costs showing that consumers are irresponsive to prices and trade costs and consume
larger amounts of foreign goods.

249 Altaf, Mahmood and Noreen
distance among them [Lili (2011)]. Market sizes embody push and pull
factors that affect value of trade flows, and are usually characterized by
the GDP. Distance is generally measured by geographic distance among
two regions (absolute distance). It is anticipated that large distance
between trading partners leads to a decrease in trade, as trade will
become complicated and bring transaction costs. The basic Gravity
model is as the following:
𝑇𝑖𝑗 = 𝐺 (𝑌𝑖𝑌𝑗
𝐷𝑖𝑗) … (6)
where, Tij is bilateral trade volume, for sum of exports and imports; Yi
is country i's GDP; Yj is country j's GDP, Dij is the distance among
country i and country j; and G is a constant; and is independent of any
subscript as it links to a standard Gravity equation in the following form.
The multiplicative nature of Equ. (6) Suggests that by taking logs it can
be made linear in parameters:
lnTij = lnG + a1lnGDPi + a2lnGDPj - a3lnDij + εij … (7)
Objectives of this paper are to test the following two hypotheses:
H1: Connectivity constraints are more important trade deterrents than
tariff barriers.
H2: Determinants of trade costs have similar effect on agricultural and
non-agricultural sectors.
The relationship between trade costs and its determinants is
difficult to capture given the paucity of data on all the factors involved.
However, in order to explore the determinants of trade costs, our
empirical analysis has used several gravity-type variables including
distance, infrastructure development, exchange rate, tariff, area and two
dummy variables for contiguity and free trade agreement between the
trading partners.
Trade Costs of Pakistan 250
4.2. Empirical Model
Following Novy (2007), joint observation of non-bilateral
variables for country i and j are constructed by multiplying the single
country variables to lead to symmetric and constant interaction effects.
All variables are taken in the log natural form.
τij = ƒ (DIST, TARIFF, EXCH, LSCI, AREA, CONT, FTA) … (8)
where, τij is the dependent variable representing tariff equivalent of
trade costs, DIST is the distance among Pakistan and partner country,
TARIFF is the product of tariffs imposed by Pakistan and other trading
partner, EXCH is the official exchange rate with respect to Pakistan
(taken in current US dollars), LSCI is the linear shipping connectivity
index of Pakistan and partner country, AREA represents product of land
area of two trading partners, CONT and FTA are dummies for
contiguity and free trade area, which take the value one if two partner
countries are contiguous and members of FTA and zero otherwise.
Distance appears in the Gravity model as proxy of remoteness or
transportation costs implying that coefficient of distance is expected to
have a positive impact on trade costs. This paper uses liner shipping
connectivity index (LSCI) as a measure of infrastructure development of
the trading countries. Our model includes a dummy variable to show
common border with the trading partner. Those countries that share a
common border are reflected by a unitary value of dummy variable,
known as contiguity. Common border again is a proxy for transportation
and information costs, which tend to be lower for contagious trading
partners as they are well aware of consumer’s choices and trading
prospects, thus making mutual trade less costly. Coefficient of conti-
guity is expected to be negative.
Ample land is an indicator of big economy and bigger population
with high domestic demands. In order to fulfil that high demand foreign
goods are also accepted and larger countries have cultural diversity,
residents have greater acceptability for a variety of cultures, which calls
for greater imports [Saleem and Mahmood (2014)]. Thus, trade
increases and overall trade costs decrease. Coefficient of area of trading

251 Altaf, Mahmood and Noreen
partners is expected to have a negative sign. Another dummy has also
been included to evaluate the effect of Free Trade Area (FTAs) on trade
costs. Dummy for FTA is expected to have a negative impact on trade
costs.
Tariffs and exchange rate are two policy related or institutional
determinants of trade costs. Tariffs imposed by partner countries are
used as a measure of restrictiveness to trade flows. Aggravation of tariffs
imposed by the trading partners is expected to increase the bilateral trade
costs, not only it affects imports but the level of exports also declines if
tariffs are imposed on raw materials. Issues of duty draw back further
add to the level of trade costs. Thus, overall international trade declines
and intra national trade increases consequently increasing trade costs.
Exchange rate is used as a measure of competiveness in
international trade flows. The study uses official exchange rate as a
determinant of trade costs. Increase in nominal exchange rate leads to an
increase in overall volume of trade is a well-established fact. An increase
in trade flows with nominal depreciation therefore leads to decline in
trade costs as trade flows and trade costs are inversely related. Keeping
this in view, coefficient of exchange rate is expected to have a negative
sign.
4.3. Empirical Specification
The general empirical model reported in Equ. (8) is transformed
as the following econometric equation, which links tariff equivalents of
trade costs with its determinants and is given as:
τij = β0 + B1EXCHijt + B2TRit*TRjt + B3DISTij + B4LSCIit*LSCIjt +
B5CONTij + B6AREAi*AREAj + B7FTAijt + εijt … (9)
In our opinion, model in Equ. (9) will help us determine the
impact of these variables on trade costs of Pakistan. The findings from
this model will have important implications for the policy, as it will help
the policy makers to figure out those areas that can bring about
significant reductions in trade costs and prioritize policies accordingly.
Trade Costs of Pakistan 252
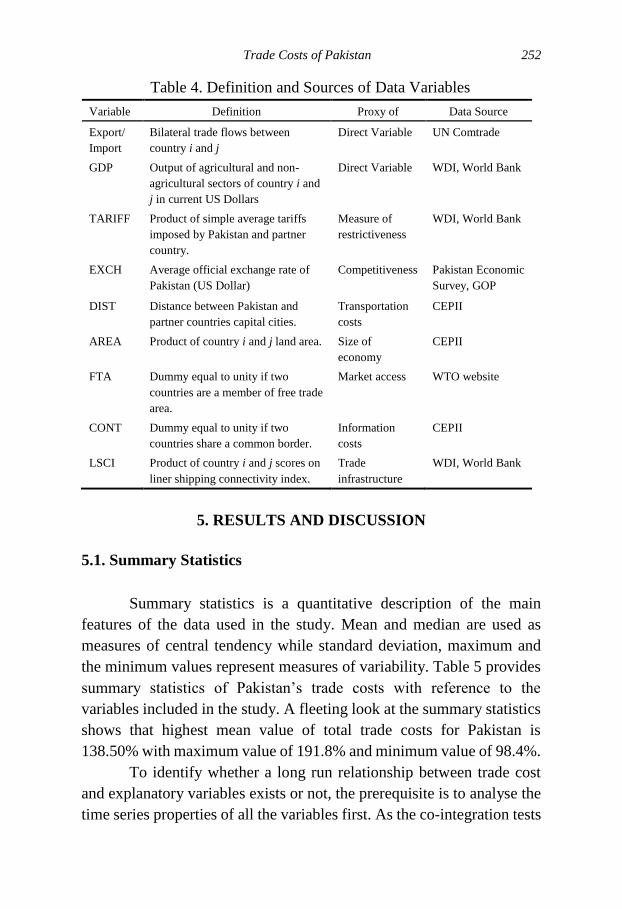
Table 4. Definition and Sources of Data Variables
Variable Definition Proxy of Data Source
Export/
Import
Bilateral trade flows between
country i and j
Direct Variable UN Comtrade
GDP Output of agricultural and non-
agricultural sectors of country i and
j in current US Dollars
Direct Variable WDI, World Bank
TARIFF Product of simple average tariffs
imposed by Pakistan and partner
country.
Measure of
restrictiveness
WDI, World Bank
EXCH Average official exchange rate of
Pakistan (US Dollar)
Competitiveness Pakistan Economic
Survey, GOP
DIST Distance between Pakistan and
partner countries capital cities.
Transportation
costs
CEPII
AREA Product of country i and j land area. Size of
economy
CEPII
FTA Dummy equal to unity if two
countries are a member of free trade
area.
Market access WTO website
CONT Dummy equal to unity if two
countries share a common border.
Information
costs
CEPII
LSCI Product of country i and j scores on
liner shipping connectivity index.
Trade
infrastructure
WDI, World Bank
5. RESULTS AND DISCUSSION
5.1. Summary Statistics
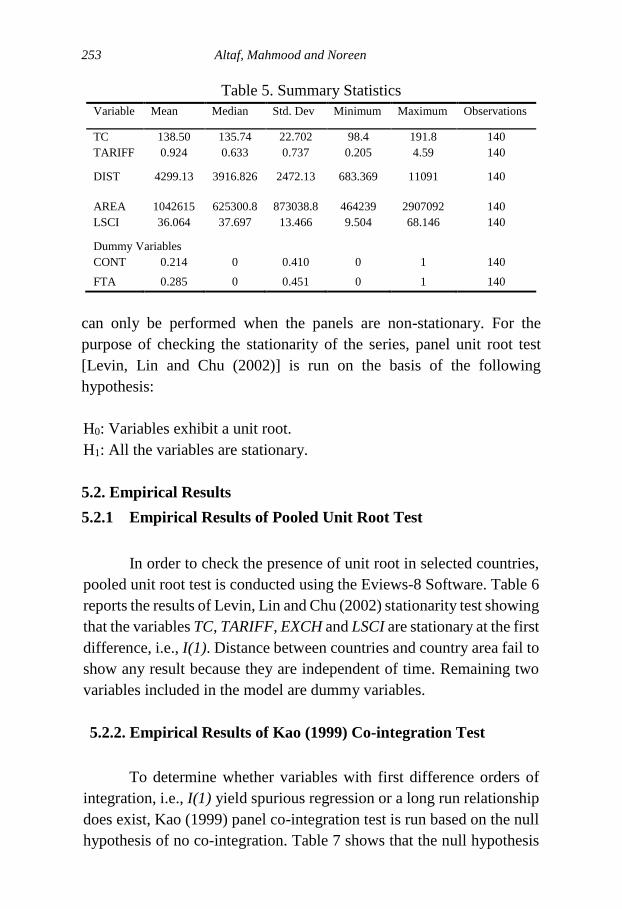
Summary statistics is a quantitative description of the main
features of the data used in the study. Mean and median are used as
measures of central tendency while standard deviation, maximum and
the minimum values represent measures of variability. Table 5 provides
summary statistics of Pakistan’s trade costs with reference to the
variables included in the study. A fleeting look at the summary statistics
shows that highest mean value of total trade costs for Pakistan is
138.50% with maximum value of 191.8% and minimum value of 98.4%.
To identify whether a long run relationship between trade cost
and explanatory variables exists or not, the prerequisite is to analyse the
time series properties of all the variables first. As the co-integration tests
253 Altaf, Mahmood and Noreen
Table 5. Summary Statistics
Variable Mean Median Std. Dev Minimum Maximum Observations
TC 138.50 135.74 22.702 98.4 191.8 140
TARIFF 0.924 0.633 0.737 0.205 4.59 140
DIST 4299.13 3916.826 2472.13 683.369 11091 140
AREA 1042615 625300.8 873038.8 464239 2907092 140
LSCI 36.064 37.697 13.466 9.504 68.146 140
Dummy Variables
CONT 0.214 0 0.410 0 1 140
FTA 0.285 0 0.451 0 1 140
can only be performed when the panels are non-stationary. For the
purpose of checking the stationarity of the series, panel unit root test
[Levin, Lin and Chu (2002)] is run on the basis of the following
hypothesis:
H0: Variables exhibit a unit root.
H1: All the variables are stationary.
5.2. Empirical Results
5.2.1 Empirical Results of Pooled Unit Root Test
In order to check the presence of unit root in selected countries,
pooled unit root test is conducted using the Eviews-8 Software. Table 6
reports the results of Levin, Lin and Chu (2002) stationarity test showing
that the variables TC, TARIFF, EXCH and LSCI are stationary at the first
difference, i.e., I(1). Distance between countries and country area fail to
show any result because they are independent of time. Remaining two
variables included in the model are dummy variables.
5.2.2. Empirical Results of Kao (1999) Co-integration Test
To determine whether variables with first difference orders of
integration, i.e., I(1) yield spurious regression or a long run relationship
does exist, Kao (1999) panel co-integration test is run based on the null
hypothesis of no co-integration. Table 7 shows that the null hypothesis
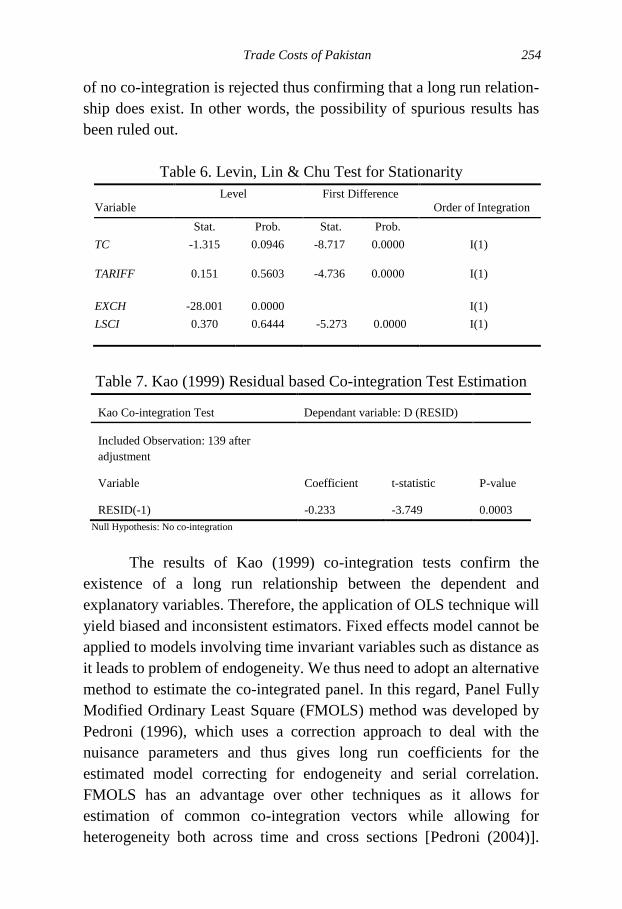
Trade Costs of Pakistan 254
of no co-integration is rejected thus confirming that a long run relation-
ship does exist. In other words, the possibility of spurious results has
been ruled out.
Table 6. Levin, Lin & Chu Test for Stationarity
Variable
Level First Difference
Order of Integration
Stat. Prob. Stat. Prob.
TC -1.315 0.0946 -8.717 0.0000 I(1)
TARIFF 0.151 0.5603 -4.736 0.0000 I(1)
EXCH -28.001 0.0000 I(1)
LSCI 0.370 0.6444 -5.273 0.0000 I(1)
Table 7. Kao (1999) Residual based Co-integration Test Estimation
Kao Co-integration Test Dependant variable: D (RESID)
Included Observation: 139 after
adjustment
Variable Coefficient t-statistic P-value
RESID(-1) -0.233 -3.749 0.0003
Null Hypothesis: No co-integration
The results of Kao (1999) co-integration tests confirm the
existence of a long run relationship between the dependent and
explanatory variables. Therefore, the application of OLS technique will
yield biased and inconsistent estimators. Fixed effects model cannot be
applied to models involving time invariant variables such as distance as
it leads to problem of endogeneity. We thus need to adopt an alternative
method to estimate the co-integrated panel. In this regard, Panel Fully
Modified Ordinary Least Square (FMOLS) method was developed by
Pedroni (1996), which uses a correction approach to deal with the
nuisance parameters and thus gives long run coefficients for the
estimated model correcting for endogeneity and serial correlation.
FMOLS has an advantage over other techniques as it allows for
estimation of common co-integration vectors while allowing for
heterogeneity both across time and cross sections [Pedroni (2004)].

255 Altaf, Mahmood and Noreen
Thus, the resultant estimates are more consistent, free of serial
correlation and endogeneity.
5.2.3. Empirical Results of FMOLS: Total Merchandise Trade
Results of fully modified ordinary least square model show that
trade costs equivalents for selected trading partners of Pakistan are
significantly dependent on the explanatory variables included in the
model.
Table 8 shows the estimated results of determinants of trade costs
for overall merchandise trade with Pakistan’s major trading partners.
Dependent variable is the log of trade costs equivalents for total
merchandise trade.
The results depict that nominal exchange rate (EXCH) is
statistically significant at 1% level and has a negative sign. There is an
inverse relationship between depreciation of nominal exchange rate and
trade costs. In other words, with depreciation of the exchange rate, total
volume of trade rises. As trade goes up, intra-national trade goes down
resulting into a decline in trade costs. The coefficient for exchange rate
suggests that 1% depreciation of exchange rate reduces trade costs by
0.03% (Table 8). This result is consistent with the findings of Singh, et
al. (2012). Thus, an increase in international trade greater than the
increase in intra-national trade as a result of currency depreciation
implies that it has become easier for countries to have more trade
internationally rather than trading internally, which is tantamount to a
decline in trade costs. It is pertinent to note that with depreciation of
nominal exchange rate it is realized that the growth in total bilateral trade
with selected countries over the period of 2003-2012 is 50.4%, which is
larger than the growth of intra-national trade which increased by 37.2%.
Tariffs always act as an obstacle to international trade, thus,
increasing the trade costs. Imposition of tariffs not only decreases the
level of imports as well as exports, because tariffs imposed on imported
raw materials and inputs used in production of export tables, causing a
switch towards intra-national trade leading to increase in trade costs.
Thus, increase in tariffs adversely affects overall trade flow. Here,
product of tariffs imposed by Pakistan and its trading partner is used,

Trade Costs of Pakistan 256
reflecting degree of market access in two countries, which leads to
increase in trade costs. Estimated coefficient sign for this variable is
positive but is statistically insignificant. Results show that 1 % increase
in tariffs will increase the trade costs by 0.02% (Table 8). These results
are in line with the findings of Novy (2013) and Wincoop, et al. (2004).
* Significant at 1%, ** significant at 5%.
Distance, area and common border are geographic determinants
of trade costs. Distance between the trading partners affects the physical
transport cost. Geographic distance between the trading countries is a
hindrance to bilateral trade flows. Estimated results show that
geographic distance between Pakistan and its trading partners is
positively related to the trade costs (Table 8). It indicates that 1%
increase in distance increases the trade costs by 0.28%. Our result is
consistent with the study of Duan and Jason (2012).
The regression coefficient of the variable land area of Pakistan
and the trading partner is negative and statistically significant at 1%
Table 8. Empirical Results of FMOLS: Total Merchandise Trade
Variable Coefficient Std. Error t-Statistics p-values
TARIFF( TRi*TRj) 0.019663 0.051249 0.383675 0.7020
EXCH -0.028292 0.009666 -2.927088 0.0042*
LSCI( LSCIi*LSCIj) -0.179337 0.045527 -3.939140 0.0002 *
DIST 0.278061 0.071994 3.862296 0.0002 *
AREA(Areai*Areaj) -0.047967 0.015814 -3.159048 0.0031 *
CONT -0.131884 0.099674 -1.323153 0.1888
FTA -0.166789 0.071971 -2.31745 0.0224**
C 2.644451 0.553275 4.779636 0.0000*
R-squared 0.678589 Mean dependent var 4.916574
Adjusted R-squared 0.656313 S.D. dependent var 0.181657
S.E. of regression 0.106496 Sum squared resid 1.145483
Durbin-Watson stat 0.592009 Long-run variance 0.028958
257 Altaf, Mahmood and Noreen
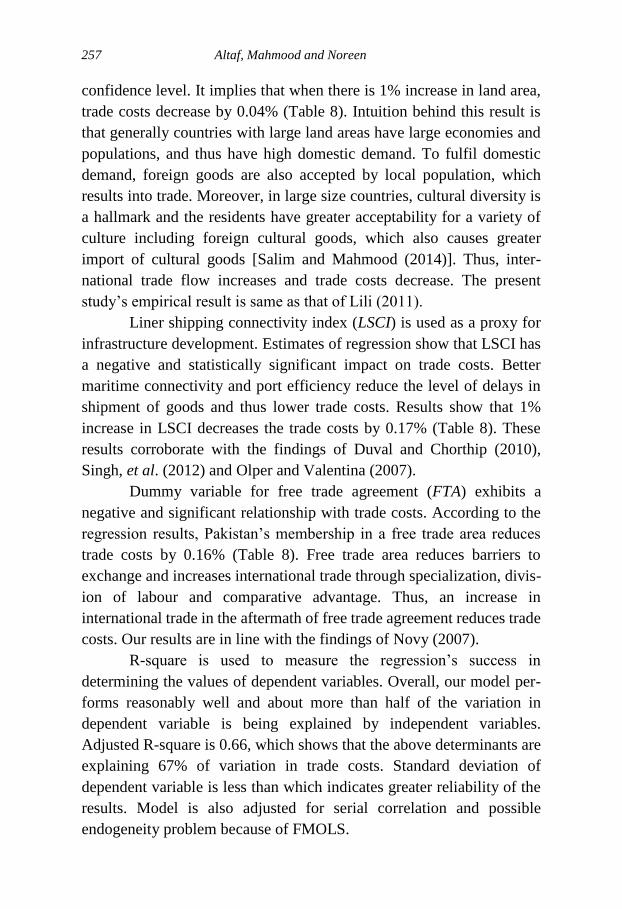
confidence level. It implies that when there is 1% increase in land area,
trade costs decrease by 0.04% (Table 8). Intuition behind this result is
that generally countries with large land areas have large economies and
populations, and thus have high domestic demand. To fulfil domestic
demand, foreign goods are also accepted by local population, which
results into trade. Moreover, in large size countries, cultural diversity is
a hallmark and the residents have greater acceptability for a variety of
culture including foreign cultural goods, which also causes greater
import of cultural goods [Salim and Mahmood (2014)]. Thus, inter-
national trade flow increases and trade costs decrease. The present
study’s empirical result is same as that of Lili (2011).
Liner shipping connectivity index (LSCI) is used as a proxy for
infrastructure development. Estimates of regression show that LSCI has
a negative and statistically significant impact on trade costs. Better
maritime connectivity and port efficiency reduce the level of delays in
shipment of goods and thus lower trade costs. Results show that 1%
increase in LSCI decreases the trade costs by 0.17% (Table 8). These
results corroborate with the findings of Duval and Chorthip (2010),
Singh, et al. (2012) and Olper and Valentina (2007).
Dummy variable for free trade agreement (FTA) exhibits a
negative and significant relationship with trade costs. According to the
regression results, Pakistan’s membership in a free trade area reduces
trade costs by 0.16% (Table 8). Free trade area reduces barriers to
exchange and increases international trade through specialization, divis-
ion of labour and comparative advantage. Thus, an increase in
international trade in the aftermath of free trade agreement reduces trade
costs. Our results are in line with the findings of Novy (2007).
R-square is used to measure the regression’s success in
determining the values of dependent variables. Overall, our model per-
forms reasonably well and about more than half of the variation in
dependent variable is being explained by independent variables.
Adjusted R-square is 0.66, which shows that the above determinants are
explaining 67% of variation in trade costs. Standard deviation of
dependent variable is less than which indicates greater reliability of the
results. Model is also adjusted for serial correlation and possible
endogeneity problem because of FMOLS.

Trade Costs of Pakistan 258
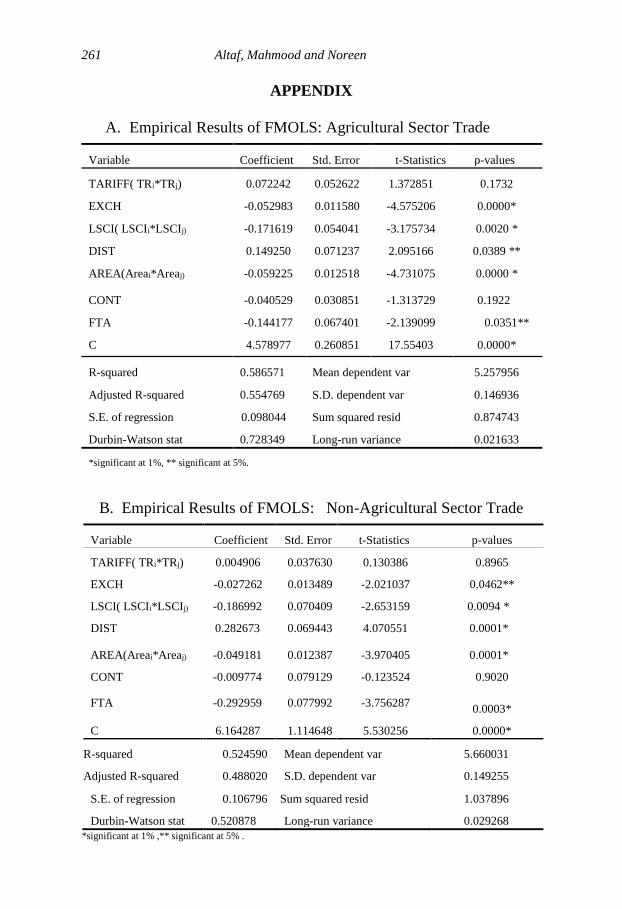
Estimation results for trade costs equivalents for agricultural and
non-agricultural sectors along with the z-test results of cross model
coefficients comparison are given in Appendix, the included explanatory
variables yield same statistical relationship with the dependent variable
as in the case of total merchandise trade.
6. CONCLUSION AND POLICY IMPLICATIONS
This study analysed the estimates of trade costs for overall trade,
agricultural trade and non-agricultural trade of Pakistan with its major
trading partners across Asia, Europe and North America over the period
2003-2012. Moreover, it examined the relationship between trade costs
and its major determinants using the panel data estimation techniques.
The study adds to the literature by disaggregating trade into two macro-
sectors, agriculture and non-agriculture. Existing studies only used total
trade, without attempting on sectoral trade details.
Despite the fact that international economy has considerably
integrated, our analysis of tariff equivalents of trade costs emphasises
that large unexploited gains can be reaped by further reducing the wedge
between the cost of producing a good and price paid by ultimate
consumer, i.e., by cutting down the trade costs.
Our estimates of trade costs reveal that Pakistan’s trade costs are
following a disproportionate pattern with its trading partners. Although,
the estimates show a considerable reduction in trade costs, yet they
indicate that substantial room remains for lowering them further. High
bilateral trade costs with some of its very largest trading partners in
particular calls for policies that can effectively reduce trade costs
between the trading partners. Policy makers need to address the
dynamics of higher trade costs in order to improve country’s absolute
and relative position in the global trade.
At the sectoral level, costs of trade for agricultural sector tend to
bypass the costs of trade for non-agricultural sector. The fact that
agricultural trade costs in many developing countries are relatively
larger than that of the non-agricultural sector suggests that focusing on
trade facilitation efforts for agricultural sector would be particularly

259 Altaf, Mahmood and Noreen
productive for Pakistan as WTO’s agreement on trade facilitation also
emphasis on the release of perishable goods at the earliest possible.
In addition to mapping out the level of trade costs of Pakistan in
the recent decade, we used econometric method to investigate various
determinants of trade costs. For this purpose, we decompose the trade
cost components into various policy and non-policy features. A key
finding is that distance, maritime transport and trade facilitation matter
for trade costs. Two areas which are highly amenable to policy
intervention for reduction of trade costs are the trade infrastructure and
free trade areas with the trading partners. UNCTAD’S liner shipping
connectivity index is a more important source of trade costs than tariffs.
This is because better shipment connectivity with the trading
partners efficiently improves transportation routes thus reducing time
and other costs. Similarly, we find that free trade agreements also play a
significant role in reducing the costs of trade; this implies that the FTAs
of modern era including a fall of non-tariff and behind the border
regulatory measures will be helpful to achieve the target of trade costs
reduction. Empirical analysis allowed to identify those trade facilitation
measures and policies which are most effective determinants of trade
costs. It suggests that an increase in geographical distance between
trading partners, and tariffs are positively linked with the trade costs.
However, land area and common border between trading partners,
nominal depreciation of exchange rate, liner shipping connectivity index
and membership of a free trade area all because a decline in trade costs.
The benefits of trade as an engine of economic growth and
sustainable development as well as means of poverty reduction can only
be achieved if these high trade costs are controlled. Higher trade costs
lower the competitiveness, thus limiting the potential benefits of trade.
Pakistan is a developing country and trade can turn out to be a helpful
instrument to achieve sustainability and economic welfare provided
these large trade costs are taken care of.
The study evidently shows that there is ample room for reduction
in trade costs if proper policy actions are taken. Findings of the study
have the following implications for policy making:

Trade Costs of Pakistan 260
Pakistan should actively participate in WTO’s agreement on
trade facilitation and reduce the red tape at border crossings to
cut down the trade costs.
Shipment of perishable agricultural goods must be expedited and
releasing these goods at the earliest could help reduce trade costs.
Improve port connectivity, cargo handling and means of
transportation, i.e., roads, railways and air links.
In addition to tariff reduction, NTB’s must be streamlined and
harmonized to reduce trade costs.
Effect of longer distance can be limited by the development of
both hard and soft infrastructures by applying modern
technological methods: internet, publicity campaigns and
electronic media.
Initiation of mega projects like CPEC can bring about the much
needed trade costs reduction.
261 Altaf, Mahmood and Noreen
APPENDIX
A. Empirical Results of FMOLS: Agricultural Sector Trade
Variable Coefficient Std. Error t-Statistics p-values
TARIFF( TRi*TRj) 0.072242 0.052622 1.372851 0.1732
EXCH -0.052983 0.011580 -4.575206 0.0000*
LSCI( LSCIi*LSCIj) -0.171619 0.054041 -3.175734 0.0020 *
DIST 0.149250 0.071237 2.095166 0.0389 **
AREA(Areai*Areaj) -0.059225 0.012518 -4.731075 0.0000 *
CONT -0.040529 0.030851 -1.313729 0.1922
FTA -0.144177 0.067401 -2.139099 0.0351**
C 4.578977 0.260851 17.55403 0.0000*
R-squared 0.586571 Mean dependent var 5.257956
Adjusted R-squared 0.554769 S.D. dependent var 0.146936
S.E. of regression 0.098044 Sum squared resid 0.874743
Durbin-Watson stat 0.728349 Long-run variance 0.021633
*significant at 1%, ** significant at 5%.
B. Empirical Results of FMOLS: Non-Agricultural Sector Trade
Variable Coefficient Std. Error t-Statistics p-values
TARIFF( TRi*TRj) 0.004906 0.037630 0.130386 0.8965
EXCH -0.027262 0.013489 -2.021037 0.0462**
LSCI( LSCIi*LSCIj) -0.186992 0.070409 -2.653159 0.0094 *
DIST 0.282673 0.069443 4.070551 0.0001*
AREA(Areai*Areaj) -0.049181 0.012387 -3.970405 0.0001*
CONT -0.009774 0.079129 -0.123524 0.9020
FTA -0.292959 0.077992 -3.756287 0.0003*
C 6.164287 1.114648 5.530256 0.0000*
R-squared 0.524590 Mean dependent var 5.660031
Adjusted R-squared 0.488020 S.D. dependent var 0.149255
S.E. of regression 0.106796 Sum squared resid 1.037896
Durbin-Watson stat 0.520878 Long-run variance 0.029268
*significant at 1% ,** significant at 5% .
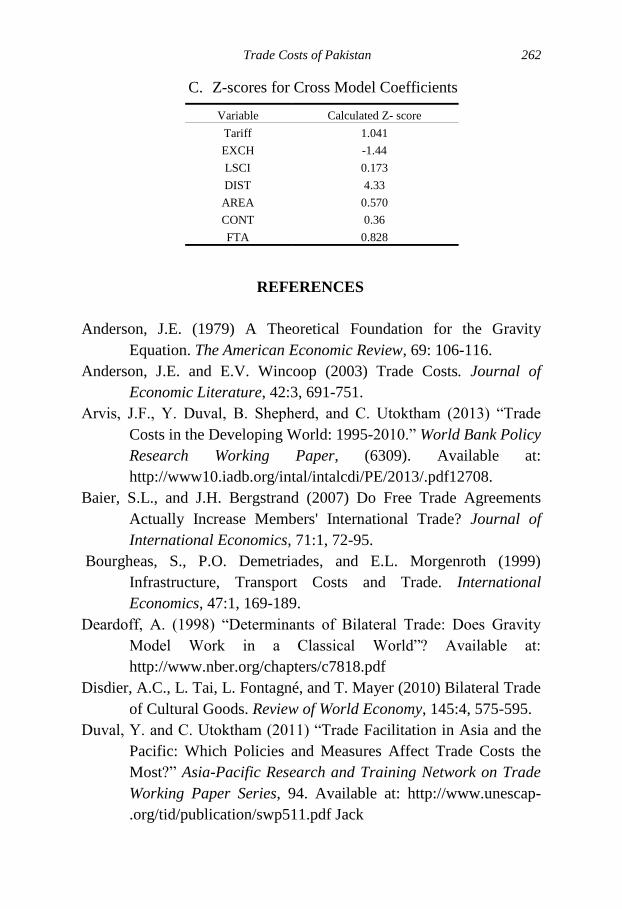
Trade Costs of Pakistan 262
C. Z-scores for Cross Model Coefficients
Variable Calculated Z- score
Tariff 1.041
EXCH -1.44
LSCI 0.173
DIST 4.33
AREA 0.570
CONT 0.36
FTA 0.828
REFERENCES
Anderson, J.E. (1979) A Theoretical Foundation for the Gravity
Equation. The American Economic Review, 69: 106-116.
Anderson, J.E. and E.V. Wincoop (2003) Trade Costs. Journal of
Economic Literature, 42:3, 691-751.
Arvis, J.F., Y. Duval, B. Shepherd, and C. Utoktham (2013) “Trade
Costs in the Developing World: 1995-2010.” World Bank Policy
Research Working Paper, (6309). Available at:
http://www10.iadb.org/intal/intalcdi/PE/2013/.pdf12708.
Baier, S.L., and J.H. Bergstrand (2007) Do Free Trade Agreements
Actually Increase Members' International Trade? Journal of
International Economics, 71:1, 72-95.
Bourgheas, S., P.O. Demetriades, and E.L. Morgenroth (1999)
Infrastructure, Transport Costs and Trade. International
Economics, 47:1, 169-189.
Deardoff, A. (1998) “Determinants of Bilateral Trade: Does Gravity
Model Work in a Classical World”? Available at:
http://www.nber.org/chapters/c7818.pdf
Disdier, A.C., L. Tai, L. Fontagné, and T. Mayer (2010) Bilateral Trade
of Cultural Goods. Review of World Economy, 145:4, 575-595.
Duval, Y. and C. Utoktham (2011) “Trade Facilitation in Asia and the
Pacific: Which Policies and Measures Affect Trade Costs the
Most?” Asia-Pacific Research and Training Network on Trade
Working Paper Series, 94. Available at: http://www.unescap-
.org/tid/publication/swp511.pdf Jack

263 Altaf, Mahmood and Noreen
Duval, Y. and C. Utoktham (2011) “Trade Costs in the India-Mekong
Sub-region: Identifying Policy Priorities for Trade Facilitation”.
Working Paper 04/11, Trade and Investment Division, Bangkok:
UNESCAP. Available at:
www.unescap.org/-tid/publication/swp9411.pdf.
Evenett, S.J., and W.K. Hutchinson (2002) The Gravity Equation in
International Economics: Theory and Evidence. Scottish Journal
of Political Economy, 49:5, 489-490.
GOP (various editions) “Pakistan Economic Survey”. Finance Division,
Government of Pakistan.
Hamid, N. and S. Hayat (2012) The Opportunities and Pitfalls of
Pakistan’s Trade with China and Other Neighbours. The Lahore
Journal of Economics, 17, 271-292.
Hoekman, B., and A. Nicita (2011) Trade Policy, Trade Costs, and
Developing Country Trade. World Development, 39:12, 2069-
2079.
Hummels, D.L. (1999) Toward a Geography of Trade Costs. Available
at: http://papers.ssrn.com/sol3/papers.cfm?abstract_id=160533
Kayani, F.N., M. Ahmed, T.A. Shah and U.N. Kayani (2013) China-
Pakistan Economic Relations: Lessons for Pakistan. Pakistan
Journal of Commerce and Social Sciences, 7:3, 454-462.
Khan, A. H. and J. Weiss (2006) “Infrastructure for Regional
Cooperation”, Paper Presented at LAEBA, Third Annual
Conference on ‘Regional Integration and Regional Cooperation
in Asia and Latin America: The Role of Regional Infrastructure’
Organised by the Asian Development Bank Institute (ADBI) and
Inter-American Development Bank (IDB), Seoul, 16-17
November.
Leamer, E.E. and J. Levinsohn (1995) “International Trade Theory: The
Evidence”. In G.M. Grossman and K. Rogoff (eds.) Handbook of
International Economics, vol. 3, Amsterdam: Elsevier.
Levin, A., F. Lin and C.J. Chu (2002) Unit Root Tests in Panel Data:
Asymptotic and Finite Sample Properties. Journal of
Econometrics, 108, 1–24.
Lili, X. (2011) “The Factors on Trade of Chinese Cultural Goods: An
Empirical Analysis Based on Panel Data”. School of Economics

Trade Costs of Pakistan 264
and Business Administration. Available at: http://www.econ.-
core.hu/file/download/sebawsh/QU_RUXIAO.pdf.
Limao, N. and A.J. Venables (2001) Infrastructure, Geographical
Disadvantage, Transport Costs and Trade. World Bank Economic
Review, 15:3, 451-479.
Lionetti, S. and R. Patuelli (2010) Trading Cultural Goods in the Era of
Digital Piracy. Working paper 40-09.The Remini centre for
economic analysis, Remini, Italy.
Novy, D. (2013) “Gravity Redux: Measuring International Trade Costs
with Panel Data”. CEP Discussion Papers dp1114, Centre for
Economic Performance, LSE.
Olper, A., and V. Raimondi (2008) Explaining National Border Effects
in the QUAD Food Trade. Journal of Agricultural Economics,
59:3, 436-462.
Olper, A., and V. Raimondi (2009) Patterns and Determinants of
International Trade Costs in the Food Industry. Journal of
Agricultural Economics, 60:2, 273-297.
Pedroni, P. (2000) Fully Modified OLS for Heterogeneous Cointegrated
Panels. The Review of Economics and Statistics, 83:4, 727-31.
Saleem, N., S. Jabeen, S. Omer, and M.A. Hanan (2014) Indo-Pakistan
Trade Relations: A Critical Discourse: Analysis of Daily Dawn.
South Asian Studies, 29:1, 309-320.
Saleem, S. and Z. Mahmood (2014) Cultural Goods as a Transformative
Force in the Global Economy: A Case of Pakistan. Available at:
http://www.nust.edu.pk/INSTITUTIONS/Schools/S3H/Researc
h/Documents/Saba%20Salim-3.pdf.
Singh, S. and S.K. Mathur (2014) “Trade Costs of India within Asia:
Measurement and its Determinants”. Working Paper No: 746.
Retrieved from: http://www.freit.org/WorkingPapers/Papers/-
TradePolicyRegional/FREIT746.
WTO (2007) World Trade Report: Trade in a Globalizing World.
Geneva: World Trade Organization.