trade and foreign exchange liberalization, investment ... · important determinants of fdi flows....
TRANSCRIPT

CERDI, Etudes et Documents, E 2004.30
1
Document de travail de la série
Etudes et Documents
E 2004.30
Trade and Foreign Exchange Liberalization,
Investment Climate, and FDI in the MENA Countries
by
Khalid Sekkat* Free University of Brussels, Belgium
and
Marie-Ange Véganzonès-Varoudakis*
CERDI, CNRS, Université d’Auvergne, Clermont Ferrand, France
* The views expressed in this paper are those of the authors, not of their institutions.

CERDI, Etudes et Documents, E 2004.30
2
Summary
Despite some progress in economic policy – in macroeconomic stability in the 1980s,
and in structural reforms in the 1990s – the MENA countries have failed to attract
foreign direct investments (FDI). This may be due to several factors. In this paper we
empirically verify from a panel of 72 countries – among which are 8 MENA
economies – that, during the 1990s, the low level of trade and foreign exchange
liberalization compared to East Asia and Latin America played a determinant role in
the low level of total FDI in the MENA economies, particularly in manufacturing. The
paper also highlights the role of other factors, such as physical infrastructure,
political environment and macroeconomic conditions, in explaining total FDI flows to
the different regions. These results stress the importance of accelerating the pace of
reform in the MENA economies.
* The views expressed in this paper are those of the authors, not of their institutions.
CERDI, Etudes et Documents, E 2004.30
3
Trade and Foreign Exchange Liberalization,
Investment Climate, and FDI in the MENA Countries
by
Khalid Sekkat
Free University of Brussels, Belgium
and
Marie-Ange Véganzonès-Varoudakis
CERDI, CNRS, Université d’Auvergne, Clermont Ferrand, France
I. Introduction
Many authors attribute the disappointing growth and employment in the
MENA countries to the region’s low-level integration in the world economy (e.g.,
Makdissi et al, 2000; Dasgupta et al, 2003). Excepting oil exports, the region scores
the second lowest export-to-GDP ratios in the world, after Sub-Saharan Africa. In
term of FDI, the picture is similar.
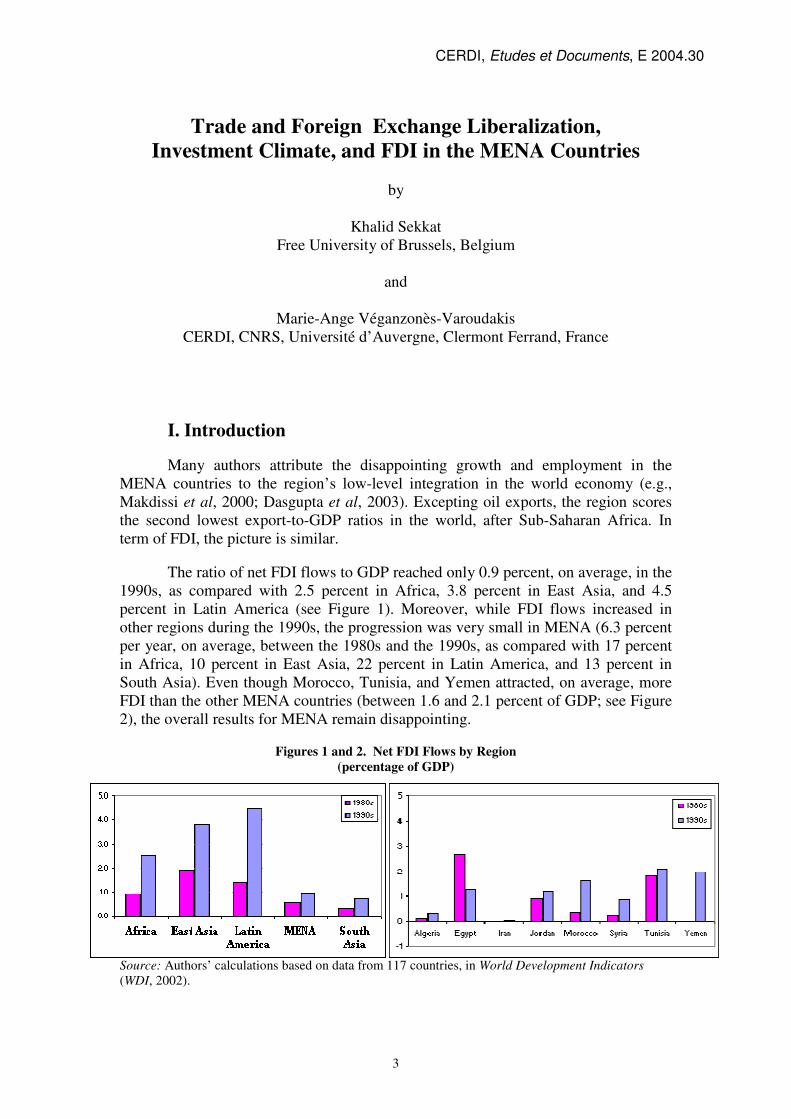
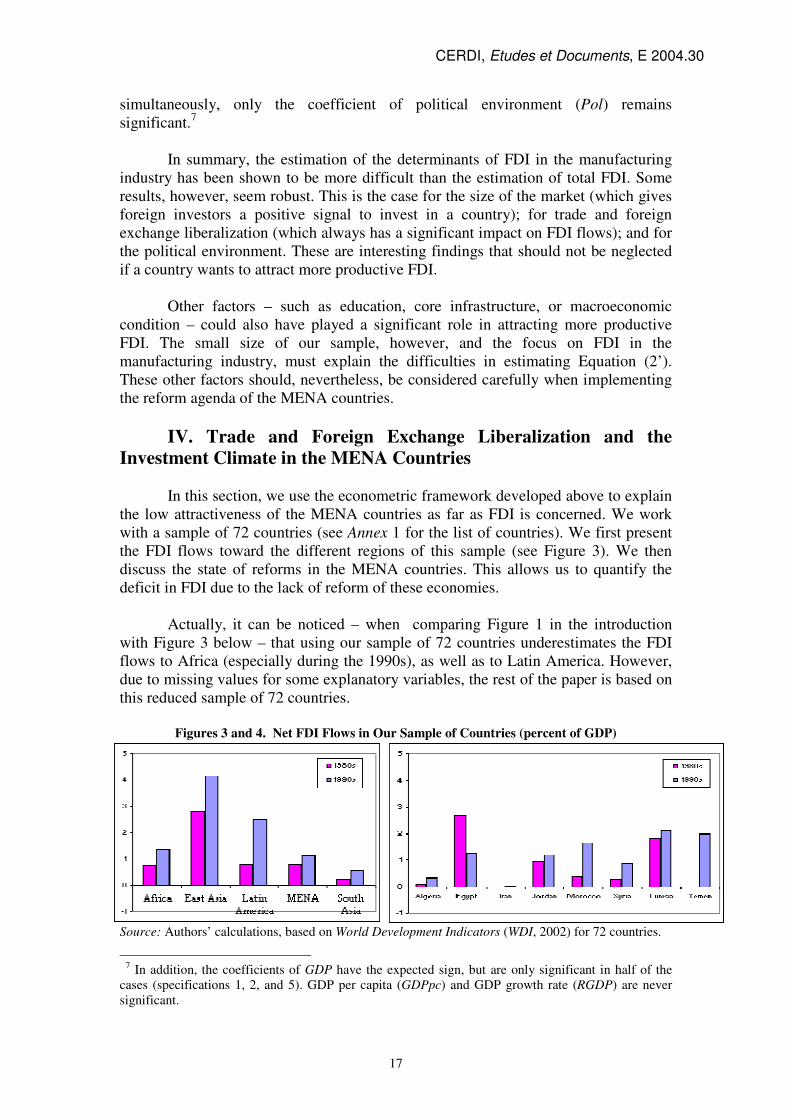
The ratio of net FDI flows to GDP reached only 0.9 percent, on average, in the
1990s, as compared with 2.5 percent in Africa, 3.8 percent in East Asia, and 4.5
percent in Latin America (see Figure 1). Moreover, while FDI flows increased in
other regions during the 1990s, the progression was very small in MENA (6.3 percent
per year, on average, between the 1980s and the 1990s, as compared with 17 percent
in Africa, 10 percent in East Asia, 22 percent in Latin America, and 13 percent in
South Asia). Even though Morocco, Tunisia, and Yemen attracted, on average, more
FDI than the other MENA countries (between 1.6 and 2.1 percent of GDP; see Figure
2), the overall results for MENA remain disappointing.
Figures 1 and 2. Net FDI Flows by Region
(percentage of GDP)
Source: Authors’ calculations based on data from 117 countries, in World Development Indicators
(WDI, 2002).
CERDI, Etudes et Documents, E 2004.30
4
The region’s poor export and FDI performance has been related to the
prolonged application of inward-looking strategies based on import-substitution
(Nabli and De Kleine, 2000) – strategies abandoned by a number of countries in other
regions during the 1980s, as part of their process of economic reform. These countries
achieved a greater outward orientation, and created a favorable climate for trade and
investment, by lowering trade barriers, privatizing many industries, and reforming the
foreign-exchange market. The MENA countries are also implementing some of the
same reforms, but at a slower pace (Nabli and Véganzonès-Varoudakis, 2004).
Recent economic research has shown that open economies tend to adjust more
rapidly from primary-intensive to manufactures-intensive exports (Sachs and Warner,
1995). One study (Sekkat and Varoudakis, 2002) focused specifically on MENA and
investigated whether trade policy reforms can increase the share of manufactured
exports in GDP. The results suggest that trade policy matters for the region’s
performance. Similar conclusion were reached by Achy and Sekkat (2003), and by
Nabli and Véganzonès-Varoudakis (2003), regarding the impact of exchange rate
policy in the MENA countries.
As far as FDI is concerned, Hufbauer et al (1994) have shown that trade
liberalization plays a significant and consistent role in the investment stock locations
of the United States and Japan, and that the size and openness of host countries are
important determinants of FDI flows. The relationship between FDI flows and the
exchange rate was examined by Cushman (1985), who found significant reductions in
U.S. direct investment associated with increases in the current real value of foreign
exchange, and very strong reductions associated with the expected appreciation of real
foreign exchange. Goldberg and Kolstad (1995) showed that volatility contributes to
the internationalization of production. In contrast to the relationship between exports
and liberalization, no comparable studies (to our knowledge) were conducted for FDI
inflows to the MENA countries.
Conducting such an investigation is important because the MENA region is
losing the opportunity of attracting FDI and of benefiting from its effects on growth.
In this regard, the literature suggests that FDI inflows represent additional resources
that increase a country’s output and productivity, encourage local investment, and
stimulate the development and dispersion of technology. This is particularly the case
in the manufacturing industry. The role of FDI as engine of growth in developing
countries is supported by the findings of UNCTAD (1992), Blomstrom et al (1992),
and De Gregorio (1992). The role of FDI as a catalyst for local investment was
investigated by Agosin and Mayer (2000) who found a positive externality from FDI
to domestic investment in Asia. Finally, Borensztein et al 1998 found a positive
impact of FDI on the development and dispersion of technological skill, provided
there is enough human capital in the host country.
Given the demonstrated importance of FDI as an engine of growth, the
objective of this paper is to examine whether the reforms undertaken by some MENA
countries can help improve their ability to attract FDI. For this purpose, we have
designed an econometric model of the determinants of FDI – total as well as in
manufacturing. To highlight the MENA specificity, the empirical analysis involves
comparisons with Latin America, East and South Asia, and Sub-Saharan Africa. The
model includes traditional determinants of FDI (such as GDP for the size of the
CERDI, Etudes et Documents, E 2004.30
5
country, GDP per capita for wealth, and GDP growth rate for future market
opportunities); as well as indicators of trade and foreign exchange liberalization. In a
second step, the model is enlarged to consider other factors that also affect a country’s
investment climate (human capital, physical infrastructure, political environment and
macroeconomic conditions).
The paper is organized as follows: Section 2 introduces the literature. Section
3 presents the econometric analysis. Section 4 analyses the state of reforms in the
MENA economies and implications for attracting FDI flows to the region. Section 5
concludes.
II. Review of the Literature
II.1. Impact of FDI on the Host Country
In many developing countries, policymakers are very concerned with FDI
inflows, which are viewed as necessary for improving economic performance. FDI
inflows are expected to: (a) increase output and productivity; (b) encourage local
investment; and (c) stimulate the development and dispersion of technology. While
the impact on output and productivity seems to be non-controversial, the others are
still debated among economists.
By increasing capital stock, FDI is supposed to rise a country’s output and
productivity by promoting the more efficient use of existing resources, and by
absorbing unemployed resources. A well-documented study by UNCTAD (1992)
lends clear support to the role of FDI as an engine of growth in developing countries –
a conclusion reached independently by Blomstrom et al (1992). The higher efficiency
of FDI was also examined empirically by De Gregorio (1992), who used a panel of 12
Latin American countries to show that the higher efficiency came from the
combination of foreign advanced management skills with domestic labor and inputs,
and that FDI is about three times more efficient than domestic investment.
FDI is also expected to act as a catalyst for local investment by
complementing local resources and providing a signal of confidence in investment
opportunities. The relationship between FDI and domestic investment was examined
empirically by Agosin and Mayer (2000), who investigated the extent to which FDI
crowds in or crowds out domestic investment. In their model, the effects of FDI on
investment are allowed to differ across countries, depending on domestic policy and
the nature of FDI inflows (new activities or existing activities), and across sectors
dependent on technology. FDI was expected to be complementary to domestic
investment if it is oriented to high-technology sectors, and to substitute for domestic
investment if it directly competes with local firms. A testable version of the
theoretical model was estimated using a panel of 32 countries over the period 1970-
96. The results suggested the presence of a crowding-out effect (negative externality)
in Latin America and a crowding-in (positive externality) in Asia. In Africa, FDI was
found to increase domestic investment one for one (neutral externality). These results
are different from those obtained by Borensztein et al (1998), who found a positive
but non-significant effect of FDI on domestic investment for a sample of 69
developing countries.

CERDI, Etudes et Documents, E 2004.30
6
FDI can stimulate the development and dispersion of technological skills
through transnational corporations’ internal transfers, and through linkages and
spillovers among domestic firms. The recent growth literature has highlighted the
dependence of growth rates on domestic technology catching up to that of the rest of
the world. Findlay (1978) suggested that foreign direct investment increases the rate
of technological progress in the host country through a “contagion” effect from the
more advanced technology, management practices, etc., used by the foreign firms.
Wang (1990) incorporates this idea into a model in which the increase in knowledge
applied to production is a function of FDI. On the empirical front, Borensztein et al
(1998) examined the role of FDI in the process of technology diffusion and economic
growth in developing countries. They tested positively the effect of FDI flows on
economic growth in 69 developing countries through a process of catching up with
the level of technology of the investing foreign firm. Their results reveal also a strong
complementarity between FDI and human capital. FDI has an overall positive effect
on growth, but its magnitude depends on the stock of human capital available in the
host country. FDI can even have a negative effect on growth in countries with low
levels of human capital. The results are robust to a set of alternative specifications.
Borensztein et al (1998) finally indicate that there is a positive, though not highly
significant, relationship between FDI and domestic investment.
II.2. Determinants of FDI Inflows
The literature puts forward various motivations for FDI. An early analysis by
Hymer (1960) emphasized the competitive advantages that the foreign firm may
obtain relative to host firms, through the use of its intangible assets in research and
development, and through advertising in the foreign market (Caves, 1971). Another
approach focused on the product life cycle hypothesis (Vernon, 1966). In the early
stage of its life, the product is produced by the innovating company in its domestic
market. In the second stage, the company exports to other industrialized countries
and probably invests in these countries. In the third stage, the product is completely
standardized, and the rise of price competition leads the company to invest in
developing countries to get cheaper labor. These approaches were supported
empirically by various authors (Caves, 1974; Kin and Lyn, 1986; Mansfield et al,
1979), all of whom found that the advantage of the U.S. multinationals in terms of
research and development and advertising allowed them to possess monopolistic rents
over domestic firms. These theories do not explain, however, why leading firms adopt
FDI rather than trade or licensing, for example. Williamson (1975) provided the most
convincing answer by showing that firms may prefer internationalization (FDI)
because market transactions may encounter substantial costs.
While these analyses highlight the benefits of undertaking FDI, the issue of
choosing a given host country is not completely clarified. The eclectic theory of FDI
suggests, among other things, that the chosen foreign country must present location
advantages that make it a more attractive site for FDI than other countries (Dunning,
1981 and 1988). Given the objective of the study, our literature review focuses on the
determinants of host country attractiveness.
An early survey by Agarwal (1980) summarized the basic economic
determinants of country attractiveness with respect to FDI. He suggested three main
factors: (a) the difference in the rate of return on capital across countries; (b) the

CERDI, Etudes et Documents, E 2004.30
7
portfolio diversification strategy of investors; and (c) the market size of the host
country. The difference in the rate of return is dependent on incentives for foreign
investors and the supply of cheap labor. Empirical evidence, however, shows that
incentives provided by the host country have only a marginal effect on FDI. Agarwal
explained this unexpected finding by the fact that incentives are generally
accompanied by a set of restrictions and requirements. The supply of cheap labor
appears to be a more convincing explanation of FDI. Overall, empirical evidence on
the relationship between inter-country differences in the rates of return and FDI does
not provide any conclusive results. This ambiguous finding is due, according to
Agarwal, to statistical and conceptual problems. Theoretically, FDI is a function of
expected profits, but available data are on reported profits. In addition, reported
profits may not be similar to actual profits, since transactions between the parent
company and its affiliates are subject to intra-company pricing rather than market
pricing.
The portfolio diversification hypothesis stresses the fact that investors select
their locations taking into account both expected profits and perceived risk. The
assumption is that portfolio diversification helps reduce the total risk as long as
returns are highly correlated within the country, and weakly correlated between the
home and host countries. The empirical evidence in favor of this hypothesis remains
weak. Some authors attempted to understand why multinational companies tend to
contribute more to FDI than to portfolio investments, when portfolio investments are
more likely to provide a better instrument for geographical diversification. They
argued that this preference might be due either to the absence of organized security
markets (the case of developing countries), or to the high inefficiencies of these
markets when they exist.
Finally, FDI is considered to be a function of output or sales in the host
market, which is usually approximated by GDP or GNP. Most empirical studies
reviewed by Agarwal (1980) have lent support to the relationship between FDI and
the market size of the host countries. This view is, however, challenged by Lucas
(1993). Focusing on seven East Asian countries (Indonesia, Malaysia, Philippines,
Singapore, South Korea, Thailand, and Taiwan) over the period 1960-87, he
considered two measures of market size – the export market and the domestic market.
The results revealed a weak relationship between the size of domestic market and the
volume of FDI, and a high degree of responsiveness of FDI to incomes in major
export markets. This may reflect the outward orientation of foreign firms located in
this region. FDI inflows were also found to be more responsive to wages in the host
country than to the cost of capital, including taxes. Allessandrini and Resmini (1999)
investigated the determinants of FDI inflows in Central and Eastern Europe and in the
Mediterranean region over the period 1990-97, and got different, and mixed, results.
For Central and Eastern Europe, the results indicated a significant positive effect of
market size and openness on FDI decisions, while human capital and the degree of
industrialization seemed to be negatively related to FDI flows. For the Mediterranean
region, the degree of industrialization and human capital positively affected FDI
flows, whereas openness and risk factors had a negative effect, and market size
seemed to play an insignificant role.

CERDI, Etudes et Documents, E 2004.30
8
II.3. Trade Policy and FDI
Analyses of the role of economic policy in attracting FDI have historically
been concerned with commercial, exchange rate, and investment incentive policies,
the latter including grants, subsidies, tax abatement, loan guarantees, and interest
subsidies. Grubert and Mutti (1991) found that incentive schemes designed to attract
FDI flows were effective in altering foreign investment decisions. Brewer (1993)
pointed out that these policies can either increase or decrease market imperfections,
and therefore increase or decrease levels of FDI. He made a distinction between
policies that affect FDI directly (capital controls, government transfer pricing policies,
labor policies, intellectual property laws), and those with indirect effects (monetary
policies, including exchange rate management). Loree and Guisinger (1995)
suggested that the effect of policies on FDI may differ between developing and
developed countries. They clearly stated, on the basis on their empirical analysis, that
raising incentive levels is not an easy way to attract more FDI flows.
Blomstrom and Kokko (1997) examined the effects of liberalization on FDI.
They showed that trade liberalization and a reduction in investment restrictions have
different effects on FDI, depending on the host country’s motives for wanting to
engage in FDI. There is the tariff-jumping argument, in which trade and factor
mobility are viewed as substitutes. The other view is that the major motive for FDI is
the exploitation of intangible assets in the host country. Trade liberalization is likely
to decrease intra-regional FDI flows if the tariff-jumping argument is valid, because
exporting from the home country becomes more attractive than FDI as a way of
serving the regional market. But if the motivation behind FDI is the exploitation of
intangible assets, then a reduction in trade barriers can enable multinationals to
operate more efficiently across international borders. This is especially the case for
vertical FDI. The net impact of liberalization is therefore determined by the structure
and motives for pre-existing investment.
On the empirical side, Hufbauer et al (1994) showed that trade liberalization
of the host countries plays a significant and consistent role in the investment stock
decisions of the United States and Japan. The size and openness of the host countries
are important determinants of FDI flows; but host country policies still play a less role
than historical patterns, market size, or per capita income. Belderbos (1997) analyzed
data on Japanese firms in the electronic sector in order to reveal the link between FDI
and protectionists measures, and in particular to determine whether such measures
taken by the European Union and the United States have led to Japanese tariff-
jumping FDI. He uses a logit model that tries to explain a Japanese firm’s decision to
build a production unit in a given region. The results show that anti-dumping actions
in the European Union are highly threatening for Japanese exports, and are likely to
induce tariff-jumping FDI. Just the beginning of an anti-dumping action is enough to
induce a Japanese firm to start investing without waiting for the outcome. Thus, tariff
barriers appear to increase FDI. Belderbos also found asymmetric effects of anti-
dumping actions on big and small foreign producers.
Girma et al (1999) looked at the role of trade policy and anti-dumping actions
in determining the distribution of Japanese FDI inflows across sectors in the United
Kingdom. They used a Tobit model in which the dependent variable was either
employment or fixed assets in Japanese subsidiaries based in the UK. That study

CERDI, Etudes et Documents, E 2004.30
9
found that trade barriers acted as an incentive to Japanese FDI in the UK, mainly due
to the anti-dumping cases brought against Japan. Anti-dumping cases against other
countries reduced the level of Japanese FDI – one explanation being that these cases
helped Japanese exports by penalizing competitors. Girma et al also found evidence
that Japanese firms are attracted to highly integrated sectors across Europe; and that
protection appears to be an important factor in determining the increase in Japanese
FDI.
II.4. Exchange Rate and FDI
An early study by Cushman (1985) analyzed the theoretical effects of real
exchange rate risk and expectations on direct investment, and then used econometric
models to test for risk and expected effects on U.S. outflows. The theoretical part of
the paper considered four types of models with a two-period time frame, where the
firm implements capital investment in the first period in order to realize profits in a
future period in which price levels, the nominal exchange rate, and the real exchange
rate are uncertain. The difference among the four models is that: (a) in the first case,
the firm sells the output abroad using foreign inputs, and can finance its capital at
home or abroad; (b) in the second case, the firm produces and sells abroad, exports a
domestically produced intermediate good to the foreign subsidiary, and finances its
capital domestically; (c) in the third model, the firm produces and sells domestically,
imports an intermediate good from its foreign subsidiary, and finances its capital at
home; and (d) in the fourth model, the firm chooses between capital purchased and
financed at home, with output for sale in the foreign market, and capital purchased
abroad but financed at home, with output sold in the foreign country.
The theoretical results showed that the direct effect of risk (expected real
foreign currency appreciation) is to decrease the foreign cost of capital, which in turn
stimulates direct investment. When the costs of the other inputs are affected, induced
changes in productivity or in output prices may offset the direct effect. If this happens,
then direct investment is reduced.
In the empirical part of the models the dependent variable was the FDI
outflows. The explanatory variables were the stock of direct investment at the
beginning of the period; corporate cash flows in the U.S., lagged by one year; real
domestic GDP; real foreign GDP; the capital cost at the national level; the capital cost
at the foreign level; the real exchange rate; a variable anticipating the movements in
the real exchange rate; and two alternative measures for exchange rate risk. The
results showed significant decreases in U.S. FDI, linked with increases in the current
value of foreign exchange. There was also evidence that increases in risk consistently
raise direct investment.
The relationship between FDI flows and exchange rate was also examined by
Froot and Stein (1991), using a model in which relative wealth, and therefore, the
exchange rate, has a systematic effect on FDI. As the domestic currency depreciates,
the wealth of foreign entrepreneurs rises relative to that of domestic entrepreneurs, so
that (all else equal) more foreign entrepreneurs undertake foreign investment. The
empirical implementation of the model showed that FDI inflows are negatively
correlated with the value of the dollar. The paper thus supports the claim that a
CERDI, Etudes et Documents, E 2004.30
10
depreciated currency can stimulate in buying control of productive corporate assets
abroad.
Goldberg and Kolstad (1995) examined the implications for FDI when both
foreign demand and the exchange rate are subject to random real shocks. They
assumed risk aversion with a two-period model in which a horizontally integrated
multinational produces only for the foreign market, using a combination of domestic
and foreign capacity. During the first period, the firm decides and commits to its
production capacity in the domestic and foreign plant locations. During the second
period, uncertainty in exchange rates and demand are resolved, with domestic and
foreign affiliates producing at capacity and taking prices that clear the market.
Investors repatriate their profits and payments for investment capacity are made.
Empirically in this model, the dependent variable is the FDI outflows with
respect to domestic investment. The explanatory variables are the lagged real
exchange rate volatility; the lagged variability in the real demand of the host country;
the correlation between the real exchange rate and the lagged real GDP; and the real
GDP of the host country. There is evidence that exchange rate volatility tends to
stimulate the share of investment activity located abroad. Real depreciation of the host
country currency was associated with reduced investment shares to foreign markets.
Finally, the study shows that exchange rate volatility can contribute to the
internationalization of production activity without reducing economic activity in the
home country.
Finally, Castanaga et al (1998) investigated the impact of economic policy on
FDI in developing countries using two data sets – the first concerning aggregate FDI
inflows over the period 1970-95; and the second concerning FDI from the United
States, by sector of destination, over the period 1983-84. The study had three main
findings: (a) that exchange rate distortions (as measured by the black market
premium) in the host country do not appear to have a negative effect on FDI flows;
(b) that growth expectations exert a strong effect on FDI; and (c) that the corruption
index seems to be negatively related FDI flows.
III. The Empirical Analysis
III.1. Trade and Foreign Exchange Liberalization
As shown above, previous empirical studies differ with respect to FDI
specifications. The differences concern both the variables to be included in the
specification and their definition (nominal versus real measures, and levels versus
growth rates). A common specification relates nominal FDI to GDP, per capita GDP,
and the growth rate of GDP (see UNCTAD, 1998). Here, we adopt this basic
specification, to which we first add indicators of trade and foreign exchange
liberalization:
Log( µααααα +++++= LibRGDPGDPpcGDPFDI 43210 )log()log() (1)
With FDI: nominal FDI
GDP: nominal GDP of the host country
CERDI, Etudes et Documents, E 2004.30
11
GDPpc: real per capita GDP
RGDP: real GDP growth rate of the host country
Lib: trade and foreign exchange liberalization indicator
µ : error term.
GDP captures the size of the host country’s internal market. A higher GDP is
assumed to imply better market opportunity and more attractiveness for FDI ( )α1 0> .
GDPpc is related to the wealth of the resident of the host country and then to demand
effectiveness. A higher real GDP per capita is also assumed to increase the
attractiveness for FDI ( )α2 0> . The RGDP reflects the dynamism of the host country
and its future market size. An increase in the growth rate of real GDP characterizes a
dynamic economy, which may be more attractive for investors ( )α3 0> .
Finally, we expect trade and foreign exchange liberalization to contribute to a
friendly climate for business and investment, and to lead to more FDI inflows
( )04 >α . A synthetic indicator of trade and foreign exchange liberalization is
provided by Sachs and Warner (1995). This is a dummy variable (S-W) that takes the
value one for the years during which a country was classified as liberalized, and the
value zero otherwise. A country is classified as liberalized according to the following
criteria: (a) non-tariff barriers covering less than 40 percent of traded goods; (b)
average tariff rates below 40 percent; (c) a black market premium (BPM) of less than
20 percent; (d) no extreme controls in the form of taxes, quotas, or state monopolies
on exports; and (e) the country is not considered a socialist country.
Equation (1) was first estimated using the dummy variable (S-W). We then
split this indicator into two components, one concerning openness to trade, and the
other concerning the exchange market.
Trade openness measured as the ratio of trade to GDP has been used
extensively in the literature. This ratio is simply not appropriate for the case of
MENA countries, since several MENA countries have unusually high trade ratios,
reflecting in part the nature of their factor endowment (oil in particular). We
therefore use an indicator that corrects for this bias. This indicator is calculated as the
ratio of imports plus exports to GDP. From this, we have deducted the “natural trade
openness” of the economies (Frankel and Romer,(1999),1 as well as the exports of oil
and mining products. Thus, the indicator reflects more the trade policy (TPol) of a
country than the simple trade openness ratio.
Regarding the exchange market, we use the dollar real exchange (RER), its
volatility (RERVol), and BMP. The latter – which is a widely used measure of
distortion in foreign exchange market – as well as RER volatility and appreciation, are
expected to affect negatively FDI flows.
1 The natural openness of an economy takes into account the size and the distance of the markets of the
countries concerned.

CERDI, Etudes et Documents, E 2004.30
12
µααα
ααααα
+++
+++++=
)log()()log(
)log()()log()log()(
765
43210
BMPRERVolRER
TPolRGDPGDPpcGDPFDILog (1’)
Equations (1) and (1’) were estimated using a sample of cross-section and time
series data. The sample includes annual data from 1990 to 1999 and covers from 48 to
72 countries (excluding OECD and East European countries; see Annex 1 for the list
of countries). We used the panel data econometric methodology. Tests of fixed and
random effects were conducted to select the most adequate models. The estimates are
heteroskedastic consistent.
Table 1. Trade and Foreign Exchange Liberalization (dependent variable: logarithm of net FDI)
Specifications Specification 1 Specification 2 Specification 3 Specification 4 Specification 5
Variables Coef. t-stat. Coef. t-stat. Coef. t-stat. Coef. t-stat. Coef. t-stat.
GDP 1.57 (6.95) 2.35 (7.35) 1.90 (4.76) 2.06 (6.23) 1.57 (3.99)
GDP per capita 1.37 (2.72) 0.06** (0.08) 0.41** (0.50) 0.05** (0.06) 0.79** (0.90)
GDP growth 0.01** (1.33) 0.01** (1.35) 0.02** (1.24) 0.01** (1.19) 0.02** (1.13)
Indicator S-W 0.49 (2.01)
Real exchange rate -0.50** (-1.64) -0.28** (-0.47) -0.41** (-1.39) -0.21** (-0.36)
Trade policy 1.00 (2.57) 1.00 (2.18) 0.99 (2.47) 0.99 (2.12)
Black market prem. -0.18 (-2.80) -0.18 (-2.57)
RER volatility -0.30 (-2.94) -0.26 (-2.25)
Number countries 72 49 48 49 48
Number obs. 646 434 298 428 295
AR2 0.84 0.84 0.83 0.85 0.83
Fixed effects F(71,570) = 12.7 F(48,380) = 13.2 F(47,244) = 7.5 F(48,373) = 13.6 F(47,240) = 7.4
Random effects CHISQ(3) = 39.1 CHISQ(5) = 45.7 CHISQ(6) = 148.5 CHISQ(5) = 23.4 CHISQ(6) = 16.9
Note: Data have been compiled from World Development Indicators (WDI, 2002).
**: not significant (probability > 90 percent).
Source: Authors’ estimations.
Table 1 reports the estimation results. There are four specifications: the first
incorporates the Sachs-Warner indicator; and the remaining three include trade policy
and various combinations of exchange market indicators. The fixed effects and the
random effects tests support the focus on the fixed effects model.
In specification 1, all the coefficients are significant (except for GDP growth,
RGDP), with the expected sign. This is the case of the coefficient of the Sachs-
Warner indicator of trade and foreign exchange liberalization (S-W), and it indicates
that trade and foreign exchange reforms increase total FDI inflows. In the other
specifications, the coefficients of per capita GDP (GDPpc), GDP growth (RGDP),
and real exchange rate (RER) are never significant, while also having the expected

CERDI, Etudes et Documents, E 2004.30
13
sign. In contrast, the coefficients of trade policy (TPol), BMP and exchange rate
volatility (RERVol), are consistently significant across specifications.
In other words, a high degree of host country trade openness clearly increases
total FDI inflows. In addition, exchange rate volatility and distortions in the foreign
exchange market have a negative impact on total FDI inflows. These results are
consistent with Lucas (1993), who found a high degree of responsiveness of FDI to
incomes in major export markets for Asian countries, and related it to the outward
orientation of foreign firms located in that region. Note also that Hufbauer et al
(1994) found that the size and trade openness of the host country is an important
determinant of FDI flows.
III.2. Investment Climate
The results outlined above lend clear support to the hypothesis of positive
impact of trade and foreign exchange liberalization on total FDI inflows. However,
international evidence (see Dasgupta et al, 2003) suggest that companion policies
aimed at strengthening the investment climate would be needed to further increase the
attractiveness of a country for foreign investment.
First, the availability of adequate human capital can be seen as a necessary
condition for FDI because of its complementarily with FDI (Borensztein et al, 1998).
The availability of infrastructure also appears to be an important determinant of FDI
inflows to developing countries (Wheeler and Mody, 1992). Finally, sound political
environment and economic policies are encouraging factors for foreign investors, due
to the role they play in lowering profit uncertainty (Agarwal, 1980; Schneider and
Frey, 1985).
One can, therefore, wonder whether trade and foreign exchange liberalization
still play a prominent role in attracting FDI once other determinants are taken into
account. To disentangle the role of these various determinants, we augmented and re-
estimated equation 1, using separate indicator for each determinant. The indicators
were then introduced simultaneously (see Equation (2)).
We used the aggregate Sachs and Warner (1995) index of trade and foreign
exchange liberalization (S-W), and did not introduce a similar split as in Table 1.
Otherwise – given the missing observation for exchange rate variables (RER and
RERVol) and BMP on the one hand, and for the additional variables on the other hand
– we would have ended up with a very limited number of observations.
As an indicator of human capital, we used the secondary school enrollment
ratio (Enrol2). The number of fixed telephones phones per capita proxied the
availability of infrastructure (Phone). The indicators of macroeconomic conditions
and political environment were drawn from the International Country Risk Guide
(2000), which assigns a numerical value to a predetermined range of risk components.
The scale awards the highest value to the lowest risk, and the lowest value to the
highest risk. The economic risk rating (Eco) provides an assessment of a country’s
current economic strengths and weaknesses,2 while the aim of the political risk rating
2 The economic risk rating consists of 5 indicators: GDP per capita, real GDP growth, annual inflation
rate, budget, and current account balance as a percentage of GDP.
CERDI, Etudes et Documents, E 2004.30
14
(Pol) is to provide a means of assessing the political stability and the good governance
of a country3 (see International Country Risk Guide, 2000).
µαααα
ααααα
++++
+−++++=
)()()log()2log(
)()()log()log()(
8765
43210
PolEcoPhoneEnrol
WSRGDPGDPpcGDPFDILog (2)
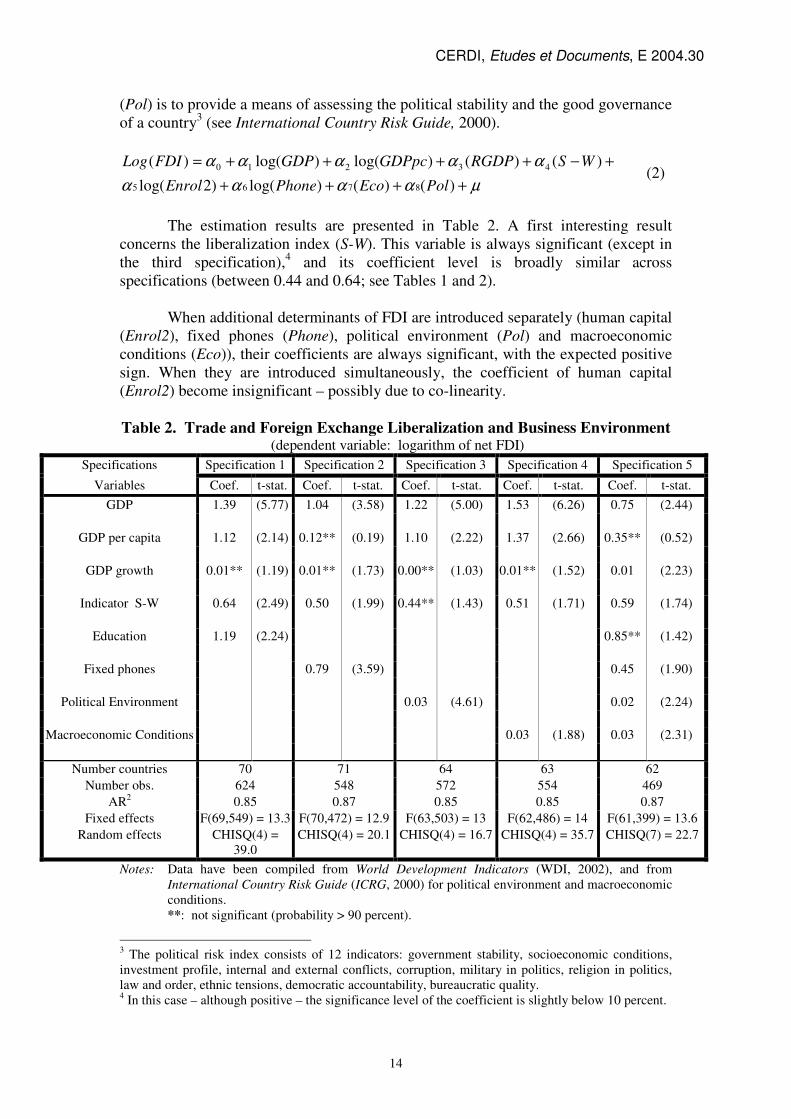
The estimation results are presented in Table 2. A first interesting result
concerns the liberalization index (S-W). This variable is always significant (except in
the third specification),4 and its coefficient level is broadly similar across
specifications (between 0.44 and 0.64; see Tables 1 and 2).
When additional determinants of FDI are introduced separately (human capital
(Enrol2), fixed phones (Phone), political environment (Pol) and macroeconomic
conditions (Eco)), their coefficients are always significant, with the expected positive
sign. When they are introduced simultaneously, the coefficient of human capital
(Enrol2) become insignificant – possibly due to co-linearity.
Table 2. Trade and Foreign Exchange Liberalization and Business Environment (dependent variable: logarithm of net FDI)
Specifications Specification 1 Specification 2 Specification 3 Specification 4 Specification 5
Variables Coef. t-stat. Coef. t-stat. Coef. t-stat. Coef. t-stat. Coef. t-stat.
GDP 1.39 (5.77) 1.04 (3.58) 1.22 (5.00) 1.53 (6.26) 0.75 (2.44)
GDP per capita 1.12 (2.14) 0.12** (0.19) 1.10 (2.22) 1.37 (2.66) 0.35** (0.52)
GDP growth 0.01** (1.19) 0.01** (1.73) 0.00** (1.03) 0.01** (1.52) 0.01 (2.23)
Indicator S-W 0.64 (2.49) 0.50 (1.99) 0.44** (1.43) 0.51 (1.71) 0.59 (1.74)
Education 1.19 (2.24) 0.85** (1.42)
Fixed phones 0.79 (3.59) 0.45 (1.90)
Political Environment 0.03 (4.61) 0.02 (2.24)
Macroeconomic Conditions 0.03 (1.88) 0.03 (2.31)
Number countries 70 71 64 63 62
Number obs. 624 548 572 554 469
AR2 0.85 0.87 0.85 0.85 0.87
Fixed effects F(69,549) = 13.3 F(70,472) = 12.9 F(63,503) = 13 F(62,486) = 14 F(61,399) = 13.6
Random effects CHISQ(4) =
39.0
CHISQ(4) = 20.1 CHISQ(4) = 16.7 CHISQ(4) = 35.7 CHISQ(7) = 22.7
Notes: Data have been compiled from World Development Indicators (WDI, 2002), and from
International Country Risk Guide (ICRG, 2000) for political environment and macroeconomic
conditions.
**: not significant (probability > 90 percent).
3 The political risk index consists of 12 indicators: government stability, socioeconomic conditions,
investment profile, internal and external conflicts, corruption, military in politics, religion in politics,
law and order, ethnic tensions, democratic accountability, bureaucratic quality. 4 In this case – although positive – the significance level of the coefficient is slightly below 10 percent.
CERDI, Etudes et Documents, E 2004.30
15
Source: Authors’ estimations.
In fact – as a first step of our empirical analysis – we can conclude that the
impact of trade and foreign exchange liberalization is robust and consistent across
specifications. This impact is rather strong: one standard deviation of the S-W
indicator leads to an increase of 0.2 point of the log of FDI. Our results also confirm
that a friendly business climate complements trade and foreign exchange reforms in
further attracting FDI. This is the case for physical infrastructure (proxied by the
number of fixed phones per capita), the improvement of which shows a significant
impact on FDI (one standard deviation leading to an increase of 0.11 point of the log
of FDI), as well as for the political environment and the macroeconomic conditions of
the countries5 .
III.3. FDI in Manufacturing
In the previous section, we have empirically validated the positive role of
trade and foreign exchange liberalization, as well as of the climate investment, on
total FDI flows to the developing world. Since FDI in manufacturing is more
productive than total FDI, it is interesting to ask the question of its determinants.
In this section, we have investigated whether trade and foreign exchange
liberalization, as well as the investment climate, constitute pertinent explanatory
factors of a country’s attractiveness in terms of FDI flows to the manufacturing
industry. Equation (2) has been tested by replacing total FDI by FDI in
manufacturing.
µαααα
ααααα
++++
+−++++=−
)()()log()2log(
)()()log()log()(
8765
43210
PolEcoPhoneEnrol
WSRGDPGDPpcGDPmanufFDILog (2’)
Equation (2’) has been estimated using a sample of 20 to 26 countries from
1990 to 1999 (see Annex 1 for the list of countries). Due to the lack of information on
FDI in manufacturing, our sample has been substantially reduced. As before, we used
panel data econometric techniques.6
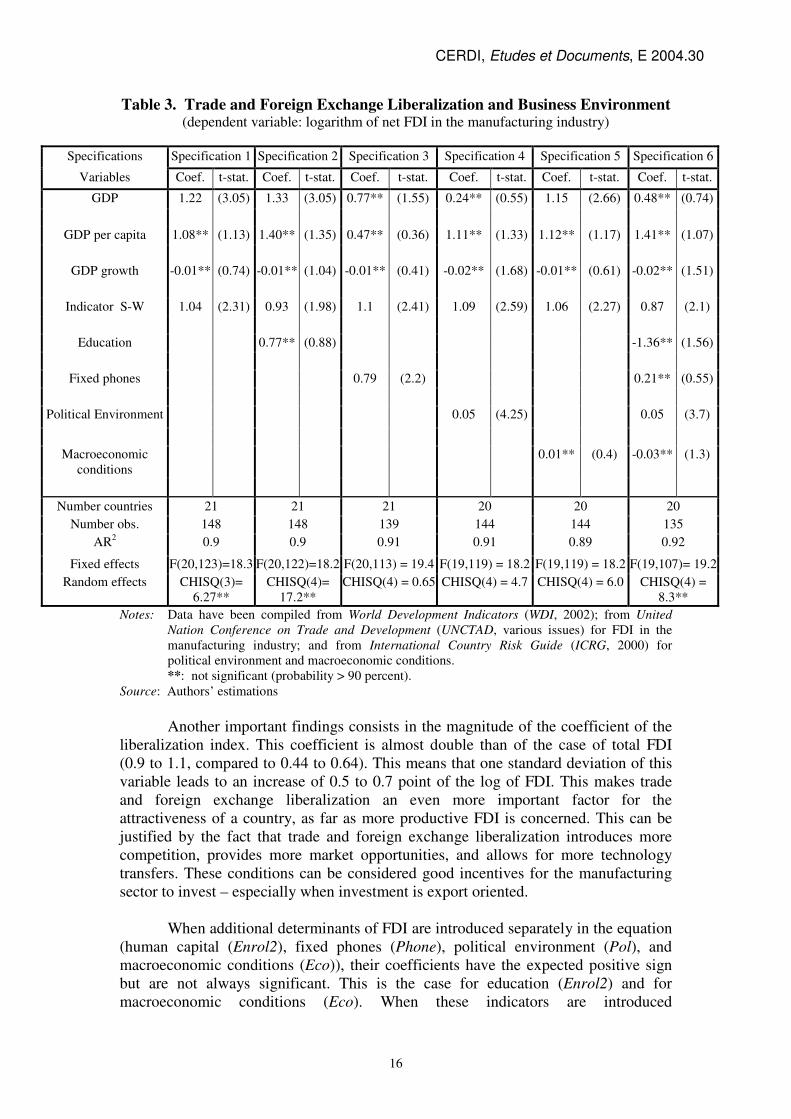
The estimation results are presented in Table 3. As before, the liberalization
index (S-W) is positive and significant in all specifications. The impact of trade and
foreign exchange liberalization on FDI inflows (total and in manufacturing) is
therefore robust and consistent.
5 In addition, our estimations show that the coefficients of the control variables (GDP, GDPpc, and
RGDP) are comparable to those in the first specification in Table 1. Like the latter, only the GDP
coefficient is consistently significant across specification, but unlike it, the two other coefficients
became significant in many instances.
6 Half of the tests for fixed or random-effect models concluded in favor of fixed-effect models
(specifications 1, 2, and 6). However, we always present the results of the fixed-effect model. This is
justified by the fact that random-effect models are difficult to interpret, and that there is no reason to
choose such models in our case. Our estimates are heteroskedastic consistent.
CERDI, Etudes et Documents, E 2004.30
16
Table 3. Trade and Foreign Exchange Liberalization and Business Environment (dependent variable: logarithm of net FDI in the manufacturing industry)
Specifications Specification 1 Specification 2 Specification 3 Specification 4 Specification 5 Specification 6
Variables Coef. t-stat. Coef. t-stat. Coef. t-stat. Coef. t-stat. Coef. t-stat. Coef. t-stat.
GDP 1.22 (3.05) 1.33 (3.05) 0.77** (1.55) 0.24** (0.55) 1.15 (2.66) 0.48** (0.74)
GDP per capita 1.08** (1.13) 1.40** (1.35) 0.47** (0.36) 1.11** (1.33) 1.12** (1.17) 1.41** (1.07)
GDP growth -0.01** (0.74) -0.01** (1.04) -0.01** (0.41) -0.02** (1.68) -0.01** (0.61) -0.02** (1.51)
Indicator S-W 1.04 (2.31) 0.93 (1.98) 1.1 (2.41) 1.09 (2.59) 1.06 (2.27) 0.87 (2.1)
Education 0.77** (0.88) -1.36** (1.56)
Fixed phones 0.79 (2.2) 0.21** (0.55)
Political Environment 0.05 (4.25) 0.05 (3.7)
Macroeconomic
conditions
0.01** (0.4) -0.03** (1.3)
Number countries 21 21 21 20 20 20
Number obs. 148 148 139 144 144 135
AR2 0.9 0.9 0.91 0.91 0.89 0.92
Fixed effects F(20,123)=18.3 F(20,122)=18.2 F(20,113) = 19.4 F(19,119) = 18.2 F(19,119) = 18.2 F(19,107)= 19.2
Random effects CHISQ(3)=
6.27**
CHISQ(4)=
17.2**
CHISQ(4) = 0.65 CHISQ(4) = 4.7 CHISQ(4) = 6.0 CHISQ(4) =
8.3**
Notes: Data have been compiled from World Development Indicators (WDI, 2002); from United
Nation Conference on Trade and Development (UNCTAD, various issues) for FDI in the
manufacturing industry; and from International Country Risk Guide (ICRG, 2000) for
political environment and macroeconomic conditions.
**: not significant (probability > 90 percent).
Source: Authors’ estimations
Another important findings consists in the magnitude of the coefficient of the
liberalization index. This coefficient is almost double than of the case of total FDI
(0.9 to 1.1, compared to 0.44 to 0.64). This means that one standard deviation of this
variable leads to an increase of 0.5 to 0.7 point of the log of FDI. This makes trade
and foreign exchange liberalization an even more important factor for the
attractiveness of a country, as far as more productive FDI is concerned. This can be
justified by the fact that trade and foreign exchange liberalization introduces more
competition, provides more market opportunities, and allows for more technology
transfers. These conditions can be considered good incentives for the manufacturing
sector to invest – especially when investment is export oriented.
When additional determinants of FDI are introduced separately in the equation
(human capital (Enrol2), fixed phones (Phone), political environment (Pol), and
macroeconomic conditions (Eco)), their coefficients have the expected positive sign
but are not always significant. This is the case for education (Enrol2) and for
macroeconomic conditions (Eco). When these indicators are introduced
CERDI, Etudes et Documents, E 2004.30
17
simultaneously, only the coefficient of political environment (Pol) remains
significant.7
In summary, the estimation of the determinants of FDI in the manufacturing
industry has been shown to be more difficult than the estimation of total FDI. Some
results, however, seem robust. This is the case for the size of the market (which gives
foreign investors a positive signal to invest in a country); for trade and foreign
exchange liberalization (which always has a significant impact on FDI flows); and for
the political environment. These are interesting findings that should not be neglected
if a country wants to attract more productive FDI.
Other factors – such as education, core infrastructure, or macroeconomic
condition – could also have played a significant role in attracting more productive
FDI. The small size of our sample, however, and the focus on FDI in the
manufacturing industry, must explain the difficulties in estimating Equation (2’).
These other factors should, nevertheless, be considered carefully when implementing
the reform agenda of the MENA countries.
IV. Trade and Foreign Exchange Liberalization and the
Investment Climate in the MENA Countries
In this section, we use the econometric framework developed above to explain
the low attractiveness of the MENA countries as far as FDI is concerned. We work
with a sample of 72 countries (see Annex 1 for the list of countries). We first present
the FDI flows toward the different regions of this sample (see Figure 3). We then
discuss the state of reforms in the MENA countries. This allows us to quantify the
deficit in FDI due to the lack of reform of these economies.
Actually, it can be noticed – when comparing Figure 1 in the introduction
with Figure 3 below – that using our sample of 72 countries underestimates the FDI
flows to Africa (especially during the 1990s), as well as to Latin America. However,
due to missing values for some explanatory variables, the rest of the paper is based on
this reduced sample of 72 countries.
Figures 3 and 4. Net FDI Flows in Our Sample of Countries (percent of GDP)
Source: Authors’ calculations, based on World Development Indicators (WDI, 2002) for 72 countries.
7 In addition, the coefficients of GDP have the expected sign, but are only significant in half of the
cases (specifications 1, 2, and 5). GDP per capita (GDPpc) and GDP growth rate (RGDP) are never
significant.
CERDI, Etudes et Documents, E 2004.30
18
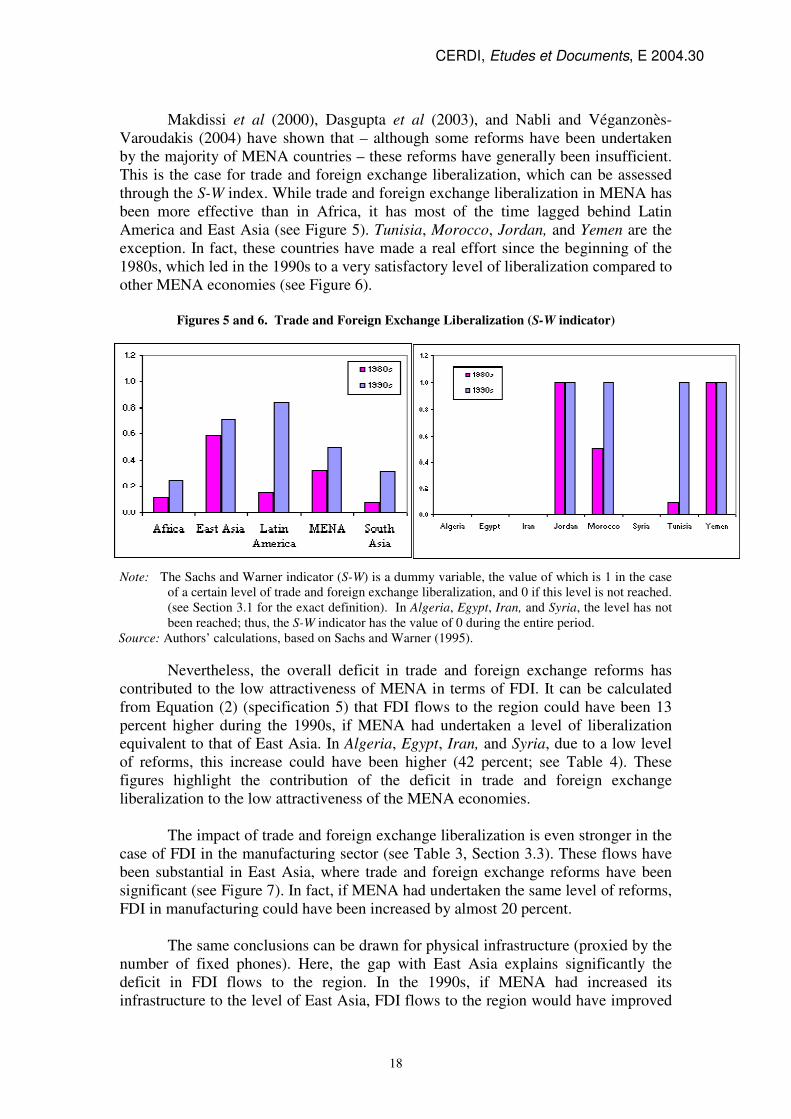
Makdissi et al (2000), Dasgupta et al (2003), and Nabli and Véganzonès-
Varoudakis (2004) have shown that – although some reforms have been undertaken
by the majority of MENA countries – these reforms have generally been insufficient.
This is the case for trade and foreign exchange liberalization, which can be assessed
through the S-W index. While trade and foreign exchange liberalization in MENA has
been more effective than in Africa, it has most of the time lagged behind Latin
America and East Asia (see Figure 5). Tunisia, Morocco, Jordan, and Yemen are the
exception. In fact, these countries have made a real effort since the beginning of the
1980s, which led in the 1990s to a very satisfactory level of liberalization compared to
other MENA economies (see Figure 6).
Figures 5 and 6. Trade and Foreign Exchange Liberalization (S-W indicator)
Note: The Sachs and Warner indicator (S-W) is a dummy variable, the value of which is 1 in the case
of a certain level of trade and foreign exchange liberalization, and 0 if this level is not reached.
(see Section 3.1 for the exact definition). In Algeria, Egypt, Iran, and Syria, the level has not
been reached; thus, the S-W indicator has the value of 0 during the entire period.
Source: Authors’ calculations, based on Sachs and Warner (1995).
Nevertheless, the overall deficit in trade and foreign exchange reforms has
contributed to the low attractiveness of MENA in terms of FDI. It can be calculated
from Equation (2) (specification 5) that FDI flows to the region could have been 13
percent higher during the 1990s, if MENA had undertaken a level of liberalization
equivalent to that of East Asia. In Algeria, Egypt, Iran, and Syria, due to a low level
of reforms, this increase could have been higher (42 percent; see Table 4). These
figures highlight the contribution of the deficit in trade and foreign exchange
liberalization to the low attractiveness of the MENA economies.
The impact of trade and foreign exchange liberalization is even stronger in the
case of FDI in the manufacturing sector (see Table 3, Section 3.3). These flows have
been substantial in East Asia, where trade and foreign exchange reforms have been
significant (see Figure 7). In fact, if MENA had undertaken the same level of reforms,
FDI in manufacturing could have been increased by almost 20 percent.
The same conclusions can be drawn for physical infrastructure (proxied by the
number of fixed phones). Here, the gap with East Asia explains significantly the
deficit in FDI flows to the region. In the 1990s, if MENA had increased its
infrastructure to the level of East Asia, FDI flows to the region would have improved

CERDI, Etudes et Documents, E 2004.30
19
by 26 percent. This percentage could have been even higher in the case of Yemen (54
percent), Morocco (34 percent), Algeria (32 percent), and Egypt (30 percent), these
countries having been charaterized by a low development in physical infrastructure
(see Table 4 and Figures 8 and 9).
Figure 7. Net FDI Flows to GDP (percent)
Note: Morocco and Tunisia are the only two MENA countries for which data were available. Their
average of total FDI and of FDI in manufacturing is higher than the MENA average
Source: Authors’ calculations, based on United Nation Conference on Trade and Development
(UNCTAD, various issues), for 26 countries (see Annex 1).
Figures 8 and 9. Number of Fixed Phones per Capita
Source: Authors’ calculations from World Development Indicators (WDI, 2002) for 72 countries.
Finally, the deficiencies in the political environment and the economic
conditions of the MENA countries have also participated in the low attractiveness of
the region. This has been the case for Yemen, Algeria, and to a lesser extent, Iran and
Syria. These countries could have benefited from higher FDI flows, which would
have resulted in a 60 percent increase in FDI in Algeria, 50 percent in Yemen, 32
percent in Iran, and 25 percent in Syria (see Table 4).
Globally, if all these factors were improved at the same time, the region’s
attractiveness could have been raised by 65 percent. In this case, FDI flows could
have reached 2 percent of GDP instead of 1.2 percent. As seen previously, some
countries that have lagged behind in terms of reforms would have benefited even
more from a higher level of reforms. Attractiveness to FDI could have increased by
138 percent in Algeria, about 100 percent in Yemen and Egypt, 89 percent in Iran, and
71 percent in Syria (see Table 4).

CERDI, Etudes et Documents, E 2004.30
20
It can, however, be noticed that efforts to reform the economy have globally
paid off less in MENA than in some other regions – East Asia, in particular. In fact,
MENA is characterized by unexplained factors (such as characteristics of the
production function or resource endowments) that are embodied in the fixed effects of
the regression, and that participate in lowering the FDI flows to the region. This
negative impact has been strong in Iran, which has, in addition, been characterized by
insufficient reforms. But this factor also explains that FDI flows to Jordan and
Morocco have been disappointing, despite good policies compared to the MENA
average (see Table 4).
Actually, if MENA had, in addition to reforms, benefited from the same fixed
effects as East Asia, then FDI flows to the two regions would have been rather
similar. These flows would have even been stronger in the case Jordan, Morocco, and
Tunisia. This result should not hide, as shown previously, the significance and the
payback of reforms in attracting foreign investors. This is an important message to
policymakers, which should not be forgotten when implementing the reform agenda
of the MENA economies
Table 4. Net FDI Flows to GDP in the 1990s (percent)
Actual Increase (%) with improvement in Tot Potential F.Effects Potential with
T & FE Reform Infrast. Eco. Stab. Pol. Stab. F. Effects
Algeria 0.3 42 32 23 40 138 0.8
Egypt 1.3 42 30 9 16 97 2.5 -4.0 3.1
Iran 0.03 42 15 19 13 89 0.1 -8.6 0.2
Jordan 1.2 0 22 5 8 35 1.6 -6.4 5.1
Morocco 1.6 13 34 8 7 61 2.6 -5.4 5.7
Syria 0.9 42 16 15 10 83 1.6 -4.6 2.6
Tunisia 2.1 36 26 7 2 71 3.6 -4.6 5.8
Yemen 2.0 0 54 28 19 101 4.0 -2.3 1.5
MENA 1.2 13 26 12 14 65 2.0 -5.1 3.9
E-Asia 4.2 -3.5
Source: Authors’ calculations, based on econometric results
V. Conclusion
In this paper, we have shown, for a panel of 26 to 72 countries studied during
the 1990s, that trade and foreign exchange liberalization constitutes a key factor for
the attractiveness of a country in terms of FDI. This result is robust regardless the type
of FDI (total or in manufacturing); the indicator of trade and foreign exchange
liberalization; and the specification used. The addition of variables of the investment
climate – such as human capital, physical infrastructure, political environment and
macroeconomic conditions – reinforces our findings.
Our results extend the conclusions of various authors on the determinants of
FDI. In particular, they confirm and enlarge the role of trade and foreign exchange
liberalization – see Hufbauer et al. (1994) in the case of trade openness; and Cushman
(1986) and Goldberg and Kolstad (1995) for the real exchange rate. Our findings also
validate the role of non-traditional determinants of FDI – such as investment climate
– which have not been systematically taken into consideration up to now.
CERDI, Etudes et Documents, E 2004.30
21
As far as MENA is concerned, the weak FDI record of the region can be
explained by the lack of economic reforms. This is the case for trade and foreign
exchange liberalization, which – despite some progress in the 1990s – has been
insufficient compared to the more successful economies of East Asia and Latin
America. Actually, the deficit in reforms has constituted a real obstacle for foreign
investors in countries such as Algeria, Egypt, Iran, and Syria. This obstacle has been
even higher for foreign investment in manufacturing. Even if some economies, such
as Tunisia, Morocco, Jordan, and Yemen can be considered leaders in the field of
trade and foreign exchange reforms, progress needs to be made by other MENA
countries if they want to attract more FDI.
The same conclusions can be drawn for physical infrastructure, for which the
gap compared to East Asia has contributed to the deficit in FDI flows to the region.
All MENA countries need to make a substantial effort to improve their infrastructure
endowment. Algeria, Egypt, Yemen, and Morocco, however, have to pay special
attention to their deficit in infrastructure, if these countries want to catch up with more
advanced economies. Similarly, progress in the political environment and the
macroeconomic conditions would have substantially increased FDI flows to Algeria,
Yemen, Iran, and Syria. Actually, FDI flows to MENA could have significantly
increased, and reached 2 percent of GDP (compared to 1.2 percent), if all of these
factors – trade and foreign exchange liberalization, development of infrastructure,
political environment and macroeconomic conditions – had improved at the same
time. However, this still would have been inferior to what was achieved in East Asia
(4.2 percent of GDP).
All of this being said, it is the unexplained factors (embodied in the fixed
effects of the regression) that cause the payoff of reforms to be lower in MENA than
in East Asia. This has been particularly the case of Jordan and Morocco, where
reforms did not materialize into high FDI flows. In Algeria and Iran, reforms would
have suffered from even more negative unexplained factors. These negative fixed
effects constitute a serious handicap for the region. They imply that efforts to reform
the economy need to be stronger in MENA compared to other regions, particularly
East Asia, if MENA wants to attract more FDI. This should not be forgotten when
implementing the reform agenda of the MENA countries.
Finally, even if education does not seem to have played a clear role in
attracting FDI flows, this factor should be considered carefully because of its
importance in explaining the growth performances of the region (see Nabli and
Véganzonès-Varoudakis, 2004).

CERDI, Etudes et Documents, E 2004.30
22
References
Agosin Manuel R. and Ricardo Mayer (2000), Foreign Investment in Developing Countries:
Does It Crowd in Domestic Investment?, United Nation Conference on Trade and
Development, Working Paper 146, Vienna.
Allessandrini Sergio and Laura Resmini (1999), “The determinants of FDI: a comparative
analysis of EU flows into CEEs and the Mediterranean countries”, Paper presented at the
Economic Research Forum (ERF) , Cairo.
Achy, Lahcen. and Khalid Sekkat (2003), “The European single currency and MENA's
exports to Europe”, Review of Development Economics 7 (4)
Agarwal, Jamuna P. (1980), “Determinants of foreign direct investment: a survey”,
Weltwirtschaftliches Archiv 116.
Belderbos. R. (1997), “Anti-dumping and tariff jumping: Japanese firms’ DFI in the
European Union and the United States”, Weltwirtschaftliches Archiv 133.
Blomstrom, M. and Ari Kokko (1997), Regional Integration and Foreign Direct Investment,
National Bureau of Economic Research Working Paper 6019, Cambridge, Massachusetts.
Blomstrom, M., R. Lipsey, and R. Zejan (1992),. What Explains Developing Country
Growth?, National Bureau of Economic Research Working Paper 4132, Cambridge, Massachusetts.
Borensztein, J., J. De Gregorio, and J-W. Lee (1998), “How does foreign direct investment
affect economic growth?”, Journal of International Economics 45.
Brewer, Thomas L. (1993), “Government policies, market imperfections, and foreign direct
investment”, Journal of International Business Studies 24 (1).
Campa, J. and Linda Goldberg (1999). “Investment, pass-through, and exchange rates: a
cross-country comparison”’ International Economic Review 40 (3).
Castanaga V., J. Nugent, and B. Pashamova (1998), “Host country reforms and FDI inflows:
how much difference do they make? “. World Development 26 (7).
Caves, Richard E. (1971), “International corporations: The industrial economics of foreign
direct investment”, Economica. 38.
Caves, Richard E. (1974), “Causes of foreign direct investment: foreign firms’ share in
Canadian and United Kingdom manufacturing industries”, Review of Economics and
Statistics 56 (3).
Cushman, David O. (1985), “Real exchange rate risk, expectations, and the level of direct
investment”, Review of Economics and Statistics 67 (2).
Dasgupta, D., M. Nabli, C. Pissarides, and A. Varoudakis (2003), Making trade work for
jobs: international evidence and lessons for MENA, Middle East and North Africa Working
Paper Series (32), Washington DC: The World Bank
CERDI, Etudes et Documents, E 2004.30
23
De Gregorio, J. (1991), Economic growth in Latin America, IMF Working Papers
91/71, Washington D. C. :International Monetary Fund
Dunning, John D. (1981), “Explaining the international direct investment position of
countries: toward a dynamic or development approach”’ Weltwirtschaftliches Archiv 117 (1).
Dunning, John D. (1988), “The eclectic paradigm of international production:
a restatement and some possible extensions”, Journal of International Business Studies 19
(1).
Findlay, R. (1978), “Relative backwardness, direct foreign investment, and the transfer of
technology: a simple dynamic model”, Quarterly Journal of Economics 92 .
Frankel, J.A. and D. Romer (1999), “Does trade cause growth? “, American Economic Review
89 (3).
Froot, Kenneth A. and Jeremy C. Stein (1991), “Exchange rates and foreign direct
investment: an imperfect capital markets approach”, Quarterly Journal of Economics 106 (4).
Girma, S., D. Greenaway, and K. Wakelin. (1999), Anti-dumping, Trade Barriers and
Japanese Direct Investment in the UK, Research Paper 99/4, Centre for Research on
Globalization and Labour Markets, University of Nottigham.
Goldberg, Linda S. (1993), “Exchange rate and investment in United States Industry”, Review
of Economics and Statistics 75 (4).
Goldberg Linda S. and Charles D. Kolstad (1995), “Foreign direct investment, exchange rate
variability and demand uncertainty”, Journal of International Economics 36 (4).
Grubert, H. and J. Mutti (1991), “Taxes, tariffs and transfer pricing in multinational
corporate decision making”, Review of Economics and Statistics Vol. 73.
Hufbauer Gray, Darius Lakdawalla, and Anup Malani (1994), “Determinants of direct foreign
investment and its connection to trade”, UNCTAD Review.
Hymer, S. (1976), The International Operations of National Firms: A Study of Direct
Foreign Investment (written in 1960), Cambridge, MA: MIT Press.
International Country Risk Guide (2000), The Political Risk Service Group, Inc, East
Syracuse, New York.
Kim, Wi S. and Esmeralda Lyn (1986), “Excess market value, the multinational corporation
and Tobin’s q-ratio”, Journal of International Business Studies 17 (1).
Loree, David W. and Stephen E. Guisinger (1995), “Policy and non-policy determinants of
U.S. equity foreign direct investment”, Journal of International Business Studies 26 (2).
Lucas, Robert E. B. (1993), “On the determinants of direct foreign investment: evidence from
East and Southeast Asia”, World Development 21 (3).
Makdisi S., Fattah Z. and I. Limam (2000), “Determinants of growth in the MENA
countries”, background paper presented at the World Bank-sponsored workshop on Global
Development Network, Pragues, June9-11.

CERDI, Etudes et Documents, E 2004.30
24
Mansfield, Edwin, Anthony Romero, and Samuel Wagner (1979), “Foreign trade and U.S.
research and development”, Review of Economics and Statistics 61 (1).
Nabli, M. and A. I. De Kleine (2000), “Managing global integration in the Middle East and
North Africa”. In B. Hoekman and H. Kheir-El-Din (eds.), Trade Policy Developments in the
Middle East and North Africa. Washington DC: The World Bank.
Nabli, M. K. and M.A. Véganzonès-Varoudakis (2003), “Exchange rate regime and
competitiveness of manufacture exports: the case of the MENA countries”, In H. Hakimian
and J.B Nugent (eds.), Trade Policy and Economic Integration in the Middle East and North
Africa: Economic Boundaries in Flux. London: Curzon-Routledge London.
Nabli, M. K. and M.A. Véganzonès-Varoudakis (2004), Reforms and Growth in the MENA
Countries: New Empirical Evidence, Middle East and North Africa Working Paper Series
(36), Washington DC: The World Bank
Sachs, J. and A. Warner (1995), Economic Reform and the Process of Global Integration,
Brookings Papers on Economic Activity 1, Washington DC.
Schneider, Friedrich and Bruno S. Frey (1985), “Economic and political determinants of
foreign direct investment”, World Development 13 (2).
Sekkat K. and A. Varoudakis (2002), “The impact of exchange and trade policy reforms on
manufactured exports in North Africa”, Development Policy Review 20 (2).
United Nation Conference on Trade and Development (UNCTAD, 1992), World Investment
Reports, Vienna.
United Nation Conference on Trade and Development (UNCTAD, various issues), World
Investment Reports, Vienna.
Vernon, Raymond (1966), “International investment and international trade in the product
cycle”, Quarterly Journal of Economics 80.
Wang, Jian-Ye (1990), “Growth, technology transfer, and the long-run theory of international
capital movements”, Journal of International Economics 29 (3-4).
Wheeler, David and Ashoka Mody (1992), “International investment location decisions: the
case of U.S. firms”, Journal of International Economics 33 (1-2).
Williamson, Oliver (1975), Markets and Hierarchies: Analysis and Antitrust Implications,
New York, NY: Free Press.
World Development Indicators (WDI, 2002), World Bank, Washington DC.

CERDI, Etudes et Documents, E 2004.30
25
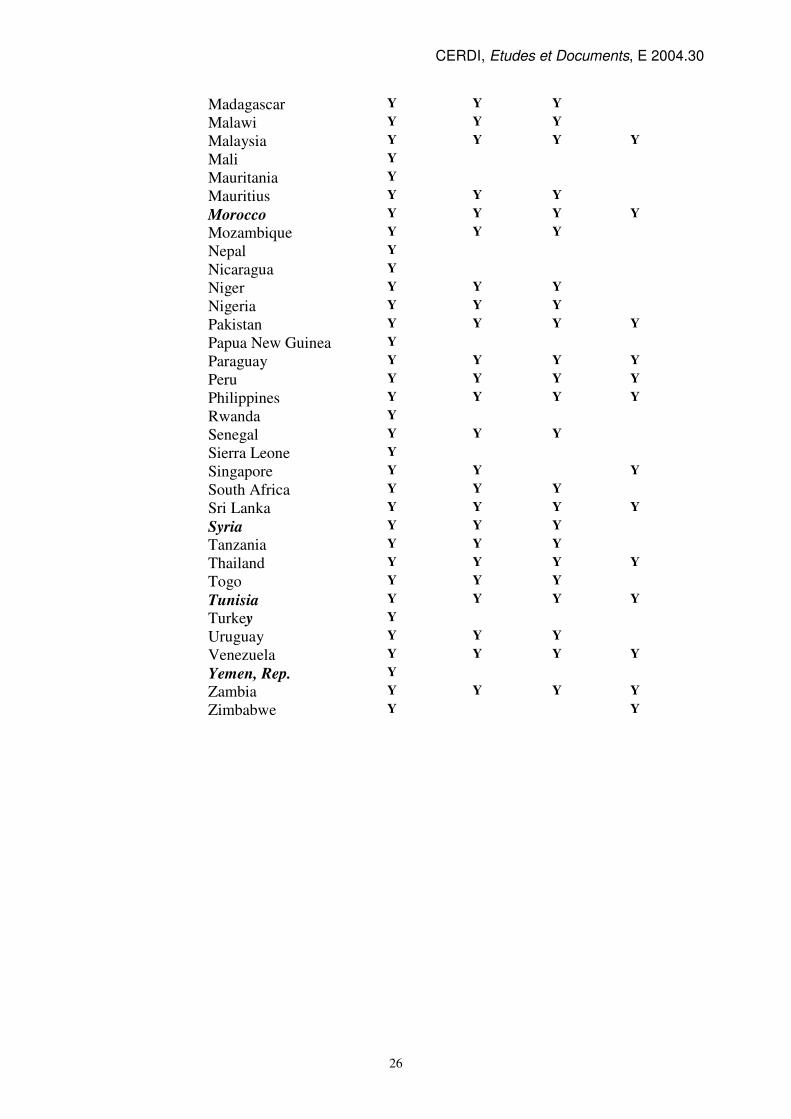
Appendix 1
List of Countries in Our Various Samples
Country Sample 72 Sample 49 Sample 48 Sample 26
Angola Y
Argentina Y Y Y Y
Bangladesh Y Y Y Y
Benin Y
Bolivia Y Y Y Y
Botswana Y Y Y
Brazil Y Y Y Y
Burkina Faso Y Y Y
Cameroon Y Y Y
Central African
Republic
Y
Chad Y
Chile Y Y Y Y
China Y Y Y Y
Colombia Y Y Y Y
Congo, Rep. Y
Costa Rica Y Y Y Y
Cote d'Ivoire Y Y Y
Cyprus Y
Dominican Republic Y
Ecuador Y Y Y Y
Egypt Y Y Y
El Salvador Y Y Y
Ethiopia Y Y
Gabon Y
Gambia Y Y Y
Ghana Y Y Y
Guatemala Y Y Y
Guinea Y
Guinea-Bissau Y
Haiti Y
Honduras Y
India Y Y Y Y
Indonesia Y Y Y Y
Iran. Y Y Y
Israel Y Y Y
Jamaica Y
Jordan Y Y Y
Kenya Y Y Y Y
Kuwait Y Y
CERDI, Etudes et Documents, E 2004.30
26
Madagascar Y Y Y
Malawi Y Y Y
Malaysia Y Y Y Y
Mali Y
Mauritania Y
Mauritius Y Y Y
Morocco Y Y Y Y
Mozambique Y Y Y
Nepal Y
Nicaragua Y
Niger Y Y Y
Nigeria Y Y Y
Pakistan Y Y Y Y
Papua New Guinea Y
Paraguay Y Y Y Y
Peru Y Y Y Y
Philippines Y Y Y Y
Rwanda Y
Senegal Y Y Y
Sierra Leone Y
Singapore Y Y Y
South Africa Y Y Y
Sri Lanka Y Y Y Y
Syria Y Y Y
Tanzania Y Y Y
Thailand Y Y Y Y
Togo Y Y Y
Tunisia Y Y Y Y
Turkey Y
Uruguay Y Y Y
Venezuela Y Y Y Y
Yemen, Rep. Y
Zambia Y Y Y Y
Zimbabwe Y Y