tracking unsaleables information to decrease package
TRANSCRIPT

TRACKING UNSALEABLES INFORMATION TO DECREASE PACKAGE DAMAGE AND PRODUCT LOSS
By
Thomas Charles Sanders
A THESIS
Submitted to Michigan State University
In partial fulfillment of the requirements For the degree of
Packaging--Master of Science
2014

ABSTRACT
TRACKING UNSALEABLES INFORMATION TO DECREASE PACKAGE DAMAGE AND PRODUCT LOSS
By
Thomas Charles Sanders
The literature review summarizes some of the joint grocery industry reports on
unsaleables, discusses technologies that are being used to track distribution data, define and
describe reverse logistics, and discuss types of grocery damage.
This research explores seven case studies. Two independent and three large retail chains
are chosen to represent a range of unsaleables management strategies. Three manufacturers are
chosen because they deal extensively with unsaleables. Flow diagrams are developed to show the
flow of unsaleable goods and information.
It is found that there is an opportunity for electronic data exchange in reverse logistics
that can help in the tracking and sharing of unsaleable product information. This research
recommends seven reason codes to put unsaleable products in clearly defined categories for
retailers to use when gathering unsaleables data: beyond code date, recall, theft, discontinued
product/promotions/product launches, seasonal, damage and other. These reason codes were
chosen to put unsaleable products in clearly defined categories. It is recommended that
manufacturers gather more granular information in their audits.
A list of standard tests for package damage is formed to judge package performance
when damage is found to be a problem. A more scientific approach to determine shelf-life and
ship-life is recommended along with a longer ship-life to better facilitate first-in, first-out (FIFO)
inventory management.

iii
ACKNOWLEDGMENTS
I would like to thank everyone involved in the completion of this thesis. Especially my
major professor Dr. Diana Twede, who provided me with the opportunity to do this research, and
my committee members Dr. Robb Clarke and Dr. Judith Whipple for their continued support and
guidance in researching and writing this thesis. It would not have been possible without their
understanding when I was struggling and pointing me in the right direction when I was having
trouble deciding which direction to go in with the research.
I would also like to thank the Michigan State University School of Packaging and their
staff and advisors for their commitment to my education throughout my studies. Furthermore, I
would like to thank my fellow graduate students for their friendship and support in studying for
classes.
Thanks to everyone involved in the funding and support of this research. Especially
Food Marketing Institute and MSU’s Center for Packaging Innovation and Sustainability for
providing the funding for this research. Thanks to the advisory panel, Jeanne von Zastrow from
FMI, Meghan Stasz from GMA, Gail Tavil from Conagra Foods, Joan Pierce from AMERIPEN,
and Erin Simon from the World Wildlife Foundation for their letters of support and contribution
to the research. Thanks to the retailers, manufacturers, and third-party unsaleables providers for
taking the time to offer information about their unsaleables process.
Last but not least, I would like to thank my friends and family for their support.
Especially my parents for supporting me both financially and emotionally when I was struggling.
I could not have completed this thesis without their constant love and support.

iv
TABLE OF CONTENTS
LIST OF TABLES ......................................................................................................................... vi LIST OF FIGURES ...................................................................................................................... vii KEY TO ABBREVIATIONS ...................................................................................................... viii INTRODUCTION .......................................................................................................................... 1 CHAPTER ONE: SELECTED LITERATURE REVIEW ............................................................. 3
1.1 Summary of FMI/GMA Joint Industry Reports .................................................................... 3 1.1.1 Product Reclamation Centers (FMI/GMA 1990) ........................................................... 4 1.1.2 Improving Unsaleables Management Business Practices – Joint Industry Recommendations (FMI/GMA 2005a) ................................................................................... 9 1.1.3 2005 Unsaleables Benchmark Report (FMI/GM 2005b) ............................................. 12
1.1.4 2006 Unsaleables Benchmark Report (FMI/GMA 2006) ............................................ 13
1.1.5 2008 Joint Industry Unsaleables Report: The Real Causes and Actionable Solutions (FMI/GMA 2008) .................................................................................................................. 15
1.1.6 A Study of Unsaleables: State of ARP 2012 (FMI 2012) ............................................ 20
1.2 Information Systems in SCM .............................................................................................. 21 1.2.1 Communication Technology ........................................................................................ 23 1.2.2 Auto ID ......................................................................................................................... 24
1.3 Product Flow in the Reverse Supply Chain ........................................................................ 25 1.3.1 What is Reverse Logistics? ........................................................................................... 25 1.3.2 Why Do Products Need to Enter the Reverse Supply Chain? ...................................... 27
1.3.3 Where Do Products Go in the Reverse Supply Chain? ................................................ 28
1.3.4 Who is Responsible for the Various Processes in the Reverse Supply Chain? ............ 29
1.3.5 How Does Reverse Logistics Affect the Bottom Line? ............................................... 30
1.4 Grocery Damage versus Sustainability ............................................................................... 32 1.4.1 Damage Reproduction Testing ..................................................................................... 34
CHAPTER TWO: METHODOLOGY ......................................................................................... 36
2.1 Interview Questions............................................................................................................. 37
2.2.1 Questions for Manufacturers ........................................................................................ 37 2.2.2 Questions for Retailers and Third -party Providers ...................................................... 38
CHAPTER THREE: RESULTS ................................................................................................... 40
3.1 Retailer 1: Uses a Third-party Provider to Handle All Unsaleables ................................... 40
3.1.1 Who Aggregates Data? ................................................................................................. 41 3.1.2 Where Does the Information Go? ................................................................................. 42 3.1.3 How Does Retailer 1 Share Data? ................................................................................ 42 3.1.4 Success Story: Bags and Labels ................................................................................... 42
3.2 Retailer 2: Donates to a Charity .......................................................................................... 44

v
3.2.1 Who Aggregates Data? ................................................................................................. 45 3.2.2 Where Does the Information Go? ................................................................................. 45 3.2.3 How Does Retailer 2 Share Data? ................................................................................ 45 3.2.4 Success Story: Bags ...................................................................................................... 46
3.3 Retailer 3: Uses a Third-party Reclamation Center ............................................................ 48 3.3.1 Who Aggregates Data? ................................................................................................. 48 3.3.2 Where Does the Information Go? ................................................................................. 49 3.3.3 How Does Retailer 3 Share Data? ................................................................................ 49 3.3.4 Success Story: Crushed Cans ....................................................................................... 49
3.4 Independent Retailers 4 and 5, Supplied by Wholesaler ..................................................... 51 3.4.1 Who Aggregates Data? ................................................................................................. 51 3.4.2 Where Does the Information Go? ................................................................................. 52 3.4.3 Success Story: Out-of-Date Mayonnaise ...................................................................... 52
3.5 Manufacturer A ................................................................................................................... 54
3.5.1 Success Story: Hold Packaging (and Everybody Else) Responsible ............................ 55
3.6 Manufacturer B ................................................................................................................... 55
3.6.1 Success Story: Improved Packaging Due to Damage Information .............................. 56
3.7 Manufacturer C ................................................................................................................... 56
3.7.1 Success Story: Improved Packaging Due to Damage Information .............................. 57
3.8 Third-party Reclaim and Audit Service Provider ............................................................... 58 CHAPTER FOUR: FINDINGS AND RECOMMENDATIONS................................................. 59
4.1 Proactive versus Reactive Unsaleables Practices ................................................................ 59 4.2 Retail Unsaleables Data ...................................................................................................... 60
4.3 Manufacturer Unsaleables Data .......................................................................................... 64 4.4 Recommended Unsaleables Reporting Format ................................................................... 65 4.5 Reason Code Justification ................................................................................................... 66
4.6 Reason Code Assignment, Scanning and EDI Recommendations ..................................... 67
4.6.1 In-Store Retail Scanning and Reason Code Assignment.............................................. 67
4.6.2 Reclamation Center Scanning and Reason Code Assignment ..................................... 68
4.6.3 Symbol, Software and Electronic Data Exchange (EDI) ............................................. 68
4.6.4 Opportunities for EDI ................................................................................................... 70 4.6.5 Audit Recommendations for Reason Codes and Standard Tests for Different Types of Damage .................................................................................................................................. 71
4.7 Shelf-life .............................................................................................................................. 76
4.7.1 Ship-life ........................................................................................................................ 77
4.7.2 Shelf-life Estimation Testing ........................................................................................ 78 4.7.3 Standardized Expression of Shelf-life .......................................................................... 80
4.8 Unsaleables as a Collaborative Effort ................................................................................. 81 CHAPTER FIVE: CONCLUSION............................................................................................... 83 REFERENCES ............................................................................................................................. 84

vi
LIST OF TABLES
Table 1: Manufacturer Unsaleable Rates…………………...........................................................14
Table 2: Retailer 1 and Retailer 3 Reporting Format……………………………….……………62
Table 3: Recommended EDI Data……………………………………………………………….70
Table 4: Test for Type of Damage to Product……………………………………...……………72

vii
LIST OF FIGURES
Figure 1: Retailer 1 Process Map…………………………………………………………...……43
Figure 2: Retailer 2 Process Map…………………………………………..…………………….47
Figure 3: Retailer 3 Process Map………………………………………………………………...50
Figure 4: Independent Retailer Process Map…………………………………….………………53

viii
KEY TO ABBREVIATIONS
ARP – Adjustable Rate Policy
ASCX12 – Accredited Standards Committee
ASTM – American Society for Testing and Materials
Auto ID – Automatic Identification
CEO – Chief Executive Officer
CFO – Chief Financial Officer
COO – Chief Operating Officer
CPG – Consumer Packaging Goods
DC – Distribution Center
DSD – Direct Store Delivery
EDI – Electronic Data Interchange
FIFO – First In/First Out
FMI – Food Marketing Institute
GDSN – Global Data Synchronization Network
GM – Gross Margin
GMA – Grocery Manufacturing Association
ID – Identification
INV – Inventory
ISTA – International Safe Transit Association
JIR – Joint Industry Report
MPI – Ministry for Primary Industries
NDR – Net Disposable Revenue

ix
PSE – Pseudoephedrine
QC – Quality Control
R1 – Retailer 1
R2 – Retailer 2
R3 – Retailer 3
RFID – Radio Frequency Identification
SCM – Supply Chain Management
SKU – Stock Keeping Unit
TAPPI – Technical Association of the Pulp and Paper Industry
TV – Television
U.S. – United States
UK – United Kingdom
UN – United Nations
UPC – Universal Product Code
URF – Unsaleables Reporting Format
UV – Ultra Violet
XML – Extensible Markup Language
YTD – Year to Date

1
INTRODUCTION
Unsaleables have been a prominent problem for food manufacturers and retailers. The
problem has also created business for third-party providers that specialize in managing
unsaleables-related product and problems; it also results in offering a steady flow of product to
food banks and other secondary markets.
There have been many benchmark reports published in the last twenty years that track the
state of industry practices, break down unsaleables data, and offer recommendations for
improvement. Although three alternative unsaleables policies have been used (Swell, Joint
Industry Report and Adjustable Rate Policy) there has consistently been a lack of statistical
information regarding damage versus other reasons for unsaleable status. Although the UPC
barcode has been used to sort and track unsaleable products, and some information is gathered by
the retailer, it is usually not shared with manufacturers in any degree of detail that could be used
to make decisions about packaging adequately, shelf life or other management considerations.
This thesis reports the current state of unsaleable products in the U.S. grocery industry. It
begins with a review of the past twenty years of research in the management of reverse logistics
and the tracking and sharing of unsaleables data. These reports were conducted jointly by The
Food Marketing Institute (FMI) and the Grocery Manufacturing Association (GMA).
The grocery industry has developed reimbursement policies that aim for shared
responsibility. The joint industry reports have identified two main issues with unsaleables. One
issue is in the collaboration needed to identify the root causes of unsaleables. The second issue
is in deciding on sharing the cost of unsaleables. The research will aim to find a way for
manufacturers and retailers to collect useful data, and measure the food waste and unsaleables
generated by specific packaging and supply chain initiatives.

2
The research investigates the current flow of unsaleables information. It answers the
questions: where does the information go, who pays for what, how information could feed back
to decision-makers, and how information can be used to assign proper test methods for damage?

3
CHAPTER ONE: SELECTED LITERATURE REVIEW
The literature review looks at previous studies and reports done on unsaleables. The first
section will cover previous studies on unsaleables that were done by FMI and GMA. The next
section will cover different types of information systems used in the supply chain and reverse
supply chain. The third section will look at the flow of products and information in the reverse
supply chain. The final section of the literature review will look at different kinds of damage
done to groceries.
1.1 Summary of FMI/GMA Joint Industry Reports
This section of the literature review covers the information discussed in previous
FMI/GMA joint industry reports. It shows the industry history of unsaleables practices starting
with the original 1990 JIR policy. Next, it summarizes a report of the industry changes that have
occurred from the original JIR policy in 1990 to the year 2005. This allows for a brief history of
industry practices while being able to focus more on what has been happening in more recent
years. It then summarizes the joint industry reports from the years 2005, 2006, 2008 and 2012.
This includes important figures and data from the reports, as well as recommendations and
findings from each report.
There are three main types of reimbursement policies for unsaleables, Joint Industry
Report (JIR), swell and Adjustable Rate Policy (g). The main idea behind JIR is that
“manufacturers cover pre- and post- handling and reclamation center costs for products returned
from retailers. The title for the product is returned to the manufacturer as the product enters the
reverse value chain” (FMI/GMA 2008, 4). This policy is somewhat outdated as many companies
are moving away from it in favor of a swell or ARP policy.

4
According to the Joint Industry Unsaleables Steering Committee, “one reason for cost
declines may be a decrease in the percent of total unsaleables volume covered by "JIR" policies
and sent to reclamation centers for processing and data collection” (FMI/GMA 2006, 5). Swell
is an older policy that is still widely used in the industry today. Swell “provides a fixed
reimbursement rate across all product categories” (FMI/GMA 2008, 4). The original policy
provided a 6% direct product cost to retailers but as the price of products increased, this yielded
an unfairly high reimbursement rate and values had to be adjusted.
ARP is the newest and most widely used policy in the industry. This policy uses product
category-specific reimbursement rates that are set based on periodic audits and re-evaluations of
the value chain (FMI/GMA 2008).
1.1.1 Product Reclamation Centers (FMI/GMA 1990)
This report gives manufacturers, distributors and reclamation centers a guideline to go by
when discussing the responsibility and ownership of products when they are deemed unsaleable.
“The guidelines are purely voluntary and are not legally binding on the industry or any
individual firm” (p. v). “The study measures costs of handling unsaleables all the way back
through the distribution channel, including identifying and measuring different options that may
be used in a reclamation center”(p. v). The report outlines the original JIR policy. For the
purposes of this report, there is focus on flow of product, who is responsible for product, and
reclamation center operations.
The following items are the manufacturers’ responsibility: unlabeled or mislabeled
product, improperly sealed product, product that is not the right weight, broken glass, crushed,
dented or collapsed product, swollen cans, manufacturer withdrawal, moldy package, rusted can,
leakers, and soiled, stained, or sticky cans. The manufacturer is also responsible for hidden

5
damage, and when there is insufficient packaging or a bad distribution design. The only type of
damage for which the retailer should have full responsibility are cut packages. It recommends
shared responsibility between manufacturer and retailer for defaced product, expired product,
and spoiled or perishable goods.
Another area where damage occurs is in the warehouse. Products that are damaged prior
to getting to the retailers dock, and customer pick-ups should not be processed through a
reclamation center. These items should be shipped directly back to the manufacturer. On the
other hand, damage that occurs in the retailer warehouse or during transportation from the
retailer warehouse to the retailer store should go through reclamation and should be the retailer’s
responsibility.
The report recommends items that should not be handled through the typical reverse
supply chain system. Infestations should be discarded at the retail location as a shared
responsibility between retailer and manufacturer. Product recalls and government-regulated
items usually have a standard government procedure that should be followed. Product loss due
to natural disaster should be negotiated between the manufacturer and the supplier prior to doing
business together. The following situations should also be negotiated in advance between the
supplier and the retailer: customer returns, items that were guaranteed to sell by the
manufacturer, retail discontinued items, and manufacturer discontinued items. When there is
partial damage to a case at wholesale and retail, the product that is not damaged should be
consolidated and returned to the normal distribution system, and the damaged product should be
sent to the reclamation center for processing.
The proper removal of unsaleables at the retail level is important “to present the best
possible store and product image, control cost for both the manufacturer and distributor, provide
6
information and identification necessary to eventually lessen damage in the system, prevent
further damage to the product as it moves through the process, and provide for acceptable
methods of disposal” (p.6). The following are the necessary steps in properly removing
unsaleables from the retailer shelves to be sent through reclaim. First, “product should be
removed from the selling area and/or backroom as soon as damage is noted” (p.6). Second,
unsaleable product should be placed in its designated work area. Third, if the UPC code is
missing, identifiable items should have the proper UPC written on them, and unidentifiable items
should be destroyed for safety purposes. Finally, if product can be made presentable enough to
be resold, it should be.
The designated work areas should have the proper equipment, be located in the store,
have one person responsible for the area and should be sorted in the following four groups: (1)
food, food service, personal care and paper products (2) other non-food (3) toxic products (4) pet
food. The final thing that has to happen at the store is the product being prepped for return.
There should be a store tag placed on the inside and outside of a suitable container for shipping.
For frozen or refrigerated goods, only the packaging should be retuned, and for all other goods
the product and the package should be returned. Finally, product should be palletized using full
tiers. Food and safe non-food items should be on the top of the pallet above toxic items.
The next step for the unsaleable products is transportation to the reclamation center.
Most of the time, product is transported to a distribution center before a reclamation center. If
this is the case, the product should be transported from the distribution center in a timely manner.
Toxic product should not be stacked on top of edible products and the individual store items
should be kept separate from one another.

7
After transportation, the product is brought to the reclamation center which has ten
important components of operation. The first step is in unloading the product, and, in doing so,
the product should be checked for any infestation or leaking of toxic materials and product.
The second step is staging to process the products. The products should be processed as
quickly as possible on a first in/first out (FIFO) basis with enough of a staging area to hold a half
of a week’s volume.
The third step is preparation which includes four steps: (1) a safety check for broken
glass and sharp objects, which should be removed (2) a sanitation check for infested or
contaminated products, which should be removed and the manufacturer contacted (3) an
unauthorized product check for items that are unauthorized for credit, which should be removed
and handled the way the manufacturer and distributor agreed and (4) “whenever possible the
preparers per-box travel time should be minimized” (p.8).
The fourth step of the reclamation process is scanning and tagging. The “product is
scanned (or otherwise recorded), basic information should be gathered and attached to the
container in a manner which does not obliterate the UPC” (p.8). If a product has to be destroyed,
the product information label should be put on a plastic cup with the UPC of the product and a
description of why the product is not there. The label should include “store or warehouse
identification, quantity scanned, vendor pay number, manufacturer sort code, date, description,
and UPC” (p.8).
The fifth step is sorting of the products. They should be sorted as early as possible by
manufacturing division, broker, and with other sorts considering cost.

8
The sixth step is storing of the products with separation between current and prior billing
periods. When product is stored, food and non-food products should be kept separate, and allow
access to manufacturers for 21 days after the invoice period.
The seventh step is invoicing. The invoice should occur on a regular cycle.
Manufacturers should be given 21 days to review invoiced materials before billing, and make
payments for products within 30 days of billing. The invoice should include: “description, UPC,
product cost, warehouse damage indicated separately, quantity, cost extension, invoice number
for billing, billing period, and credit items identified”(p.9).
The eighth step is review of the unsaleable products by the vendor. The appointments for
these reviews should be set up in advance, and if there is no need for review by a manufacturer,
the reclamation center should be notified so the product can be disposed of as quickly as
possible. “If product UPCs or stickers are not available for the inspection, the manufacturer
should not be responsible to reimburse the distribution” (p.10). The manufacturer and distributor
should review the damaged products as to reduce the total number of unsaleables in the future.
The ninth reclamation step is product disposition. “The party incurring financial
responsibility for products processed through the reclamation center should determine the
method of disposal” (p.10). Recycling and repacking of product should be the number one
priority when sending an item through reclaim. This will “recapture some of the value of the
product or packaging” (p.10). The next priority lies in donating the products, then resale by the
retailer, then salvage, with destruction of the product being the final priority. Destruction should
only be considered when all other options have been exhausted.
The tenth is not so much a process, but is choosing the proper personnel to run the reclamation
center. There are six personnel categories that are recommended:

9
• clerical- researches unscannable items, invoices vendors, files, performs general office
activities
• manager – supervises, trains, settles with vendors
• preparer – unloads trucks, moves in-bound items to line, prepares item for scanner, sorts,
discards, rejects
• scanner – scans items
• tagger – tags items, sorts selected items
• sorter – sorts items by path destination
1.1.2 Improving Unsaleables Management Business Practices – Joint Industry Recommendations
(FMI/GMA 2005a)
The purpose of this report was to revise “existing guidelines for industry practices
influencing the products that became unsaleables in the supply chain” (p.4). This report fills the
gap between 1990, when unsaleables and JIR policies were first defined, and 2005 based on the
major changes in the industry. In this report, “unsaleables are defined as consumer products
which are removed from the primary channel of distribution for any reason and which may or
may not be processed through product reclamation centers” (p.5). There are three main problems
that FMI and GMA recognizes in the negations between manufacturers and distributors: both
sides believe the other side is being fair in unsaleable negotiations, “each side wants the other
side to be fair, [and] sales agents and wholesalers find it especially difficult to successfully
collaborate with trading partners to control unsaleables costs”(p.4).
There was a huge increase in the total amount of unsaleables from the first 1995
benchmark report to the 2004 report from 0.75% to 1.06%. There are several reasons for this
increase in the total amount of unsaleables as there have been many “significant changes in

10
industry practices and conditions since 1990” (p.7). The focus of the 1990 JIR policy was
damaged goods, but today, reclamation centers deal with a slew of unsaleable products,
including product recalls. There has been a shift from the manufacturers using JIR, to either
adjustable rate or swell allowances that are applied by different manufacturers in different ways.
“Most companies have developed policies covering unsaleables business practices” (p.7), and
there can be conflict with trading partners when their policies do not agree. In 1990, most
reclaim centers were operated by wholesalers and retailers, but by 2005 they were operated by
outside companies. “Environmental regulations for landfills are more stringent now. Deductions
are now used more often for claims and payments” (p.7). “Service companies pick up for some
manufacturers at reclamation centers, where products are held for shorter time periods. Salvage
revenue is significant for some retailers and some manufacturers. [Finally], New Bioterrorism
Act recordkeeping requirements cover reclamation centers and exclude food banks” (p.7).
Three main observations were made about the importance of reclamation centers and
their role in unsaleables. The first is that “reclamation centers are currently the most efficient
way to remove unsaleable products from the supply chain and that they are viable tools for
unsaleables management” (p.9). The second looks at what would happen if all the reclamation
centers ceased operations. It was concluded that the negative implications to the supply chain
outweigh the positive ones if all reclamation centers ceased. The reason this is thought to be true
is that, “manufacturers and distributors would not be able to readily remove or recall damaged or
otherwise compromised products from distribution in the supply chain and would lose
centralized data for root cause corrections”(p.9). The final observation is that reclamation
centers were in a consolidation phase, driven by retailers and wholesalers, which was expected to
result in fewer processing facilities.

11
The report focuses on the most widely used policy, the ARP policy. There are four main
attributes that an ARP policy should hold. The first attribute is that “the policy should be based
on statistically sound data that measures the performance of a manufacturer’s products and
packages throughout the entire supply chain” (p.11). This data should be used to, show where
there can be improvements in the performance of the company’s supply chain, and establishing
the rates that the manufacturer will use to compensate customers for unsaleables. The second
attribute is that the measurement and evaluation of the rate of compensation be ongoing and
adjusted as needed. The rate will change with time as there are changes in the company’s
products and other activities, and the rate should reflect those changes. The third attribute is,
“the policy should address all causes of and responsibility for unsaleables in a way that fairly
acknowledges the challenges and costs associated with the way in which the company does
business with its trade partners” (p.11). Lastly, an ARP policy should have a commitment to
continuously improve the policy.
Manufacturers need to decide how they will determine the rate of reimbursement. In
calculating the rate for an ARP policy, three methods are used. The first is for the manufacturer
to use a national average that is applied to all of its customers. This rate could be for one product
line, like a different rate for two different products, or one rate for all products provided by the
manufacturer. The second way is to calculate a different average for each channel of distribution
to customers. “One average per channel may be calculated for all products or separate averages
may be calculated for product groups” (p.14). The third way a rate can be determined is by a
geographic average. This would be a different rate for each major market area where the
manufacturer has customers. “This could be one rate for all of the manufacturer’s products or
channel-specific or product group-specific averages could be calculated” (p.14). “The task force

12
recommends that individual manufacturers conduct a robust supply chain audit and consider the
results of that audit across the three major variables when choosing the appropriate type or types
of rate averaging”(p.15).
1.1.3 2005 Unsaleables Benchmark Report (FMI/GM 2005b)
The purpose for publishing this report was to “provide the consumer packaging goods
(CPG) industry with valuable tools to manage and reduce the costs of unsaleables in the total
supply chain” (p.2). The findings and answers to interview questions are intended to give
individual companies a way to compare their practices and numbers with those of the rest of the
industry to improve their own operations and reduce total unsaleables. This is done by trying to
“refine the definitions of unsaleables costs for distributors and manufacturers” (p.2). This can
prove to be a difficult task due to companies using different methodologies and policies for
unsaleables. The information in this report is collected “from 50 manufacturers, 26 distributors
(wholesalers and retailers) and four companies that provide services in the unsaleables or reverse
distribution supply chain” (p.3). The information in this study only included U.S. customer data
from manufacturers and U.S. sales from distributors. 29 of the 50 manufacturers provided
information from 2004.
Manufacturers had the second consecutive decrease in total unsaleables in 2003 and
2004. The average company paid 1.18% of gross sales on unsaleables in 2002, 1.11% in 2003
and 1.06% in 2004. Of all the outlets that manufacturers distribute to, “the supermarkets and
mass retailers showed the largest decline in manufacturer unsaleables rate” (p.6). From this
information it would be expected that the incidence of unsaleables be the least in supermarkets,
but over one third of the survey respondents do not know which channel they distribute to have
the least amount of unsaleables. The payments of unsaleables is mostly invoice deductions at

13
39%, then swell or adjustable rate allowances at 38%, then reclamation center invoices at 21%,
and store claims at only 2% of respondents. Case returns were put back into the forward supply
chain by 60% of distributors, 25% moved product to closeout liquidation, 9% destroyed product
and only 6% donate product.
Since there were only about half the distributors surveyed as manufacturers, there was not
as much data available for distributors and there is only data for 2003 and 2004. The distributors
that were surveyed showed a decrease in unsaleables from 0.84% of sales in 2003 to 0.76% of
sales in 2004, but “the total ‘gap’ increased from 6% to 6.7% of their unsaleables costs from
2003 to 2004”(p.9). The reason for this gap is thought to be “a decrease in the percent of total
unsaleables volume covered by ‘JIR’ policies and sent to reclamation centers for processing and
data collection” (p.9). Dry grocery products accounted for 55% of distributor costs of
unsaleables, 16% is from Health and beauty care, 13% from dairy, 8% from frozen goods, and
8% from general merchandise.
Manufacturers that experienced an increase in unsaleables believed the driving force
behind the increase were discontinuations, product introductions, loss of focus and seasonal
returns and recalls. According to distributors, the major factors affecting unsaleables were
manufacturers moving from JIR to a swell or ARP, manufacturers having lower reimbursement
rates, increased damage due to poor packaging and expired product.
1.1.4 2006 Unsaleables Benchmark Report (FMI/GMA 2006)
Unsaleables are defined in this report as “products removed from their normal channel of
distribution, regardless of the reason for removal” (p.2). This is a very different definition of
unsaleables from the 1990 JIR which only included damaged goods. This report “excludes data
published in prior years’ reports. The steering committee decided to focus on current data and

14
conditions rather than historical information. Where prior year data are reported, they represent
answers to questions asked in this year’s survey and may differ from data published previously”
(p.2). “Survey participants provided annual data for 2005, or their most recent fiscal year and for
2004” (p.3). The data included “warehouse-delivered product and excluded data about direct
store delivery (DSD) products, fresh meat, bakery, produce and deli products” (p.3).
Manufacturers only included U.S. consumer data and distributors only included U.S. sales and
data. It should also be noted that in this report, retailers are referred to as distributors.
This report does not have a lot of information on recommendations for the management of
unsaleables, but it offers a lot in the way of benchmark data that can be used by companies to
compare where they stand in regards to other companies. The table below shows a drop in total
unsaleables, and a lower average unsaleables rate for manufacturers using an ARP or swell
policy over some other policy.
Table 1: Manufacturer Unsaleable Rates
Manufacturer Unsaleable Rates 2004 2005
Company average 1.13% 1.05%
Industry-weighted average 0.88% 0.81%
ARP or swell allowances 0.81% 0.72%
Policy other than ARP or swell 0.96% 0.92%
In 2005, only 75% of the manufacturers that were surveyed knew the channel-specific
data for their unsaleables. This means that 25% of the companies did not know through which
channel they had the highest rate of unsaleables. Of these manufacturers, it was found that most
of the unsaleable payments were to chain drug stores, followed by supermarkets. But, when
comparing the unsaleables payments to the gross sales from the company, supermarkets paid out
more compared to sales than drug stores. This shows that “manufacturer efforts to reduce the
15
incidence of unsaleables would most likely yield the greatest supply chain improvements when
focused on the supermarket and chain drug store channels” (p.6).
As opposed to manufacturers, distributors saw an increase in their total percent of
unsaleables. The distributor unsaleables cost as a percent of sales among the companies that
took the survey was 1.13% in 2004 and 1.17% in 2005. “Some distributors reported that their
total receipts for unsaleables from manufacturers were 5.9% below their total costs for
unsaleables in 2005” (p.11). The distributors were getting smaller payments from manufacturers
than their total unsaleables cost. “Distributors on the Joint Industry Unsaleables Steering
Committee pose that one reason for cost and receipt declines may be a decrease in the percent of
total unsaleables volume covered by “JIR” policies and sent to reclamation centers for
processing and data collection”(p.11).
The main reasons for increased unsaleables for manufacturers was believed to be the
same as the increases outlined in the 2005 report in the previous section, with the addition of
PSE legislation. The main issues for distributors is the same as the issues stated in the previous
report as well, with the addition of a lack of collaboration between trading partners, the
Bioterrorism Act and the handling of hazardous materials.
1.1.5 2008 Joint Industry Unsaleables Report: The Real Causes and Actionable Solutions
(FMI/GMA 2008)
The purpose of this report is to “discover and analyze the underlying causes of
unsaleables throughout the value chain and identify actionable solutions companies can adopt
and customize” (p.2). The report consists of two phases: data collection and analysis, which
includes surveys and interviews with manufacturers and distributors, and validating and

16
synthesizing findings given by the survey respondents. There were 73 companies that were
surveyed and all of them gave data for the U.S. for 2007.
Unsaleables are an avoidable cost that represent “1% to 2% of gross sales on average”
(p.6), or $15 billion dollars annually. There are four main trends that are affecting and changing
the industry, thus leading to an increase in the number of unsaleables. The first is “the
accelerating pace of new product introductions” (p.6). Products are being introduced to the
market very quickly that are not generating revenue, with no way to reduce high inventory for
failed launches. The second is that “the expiration date of many products is now visible to the
customer” (p.6). Manufacturers do not want a customer to get a product that is spoiled with an
expiration date that is still valid, so they are more conservative with the date they post on the
package. The third reason is that “companies are increasing the use of eco-friendly packaging”
(p.6) that may save money or reduce waste but fails in the distribution system, creating more
damaged products. The fourth reason is “companies continue to focus on growing the health and
wellness platform, exacerbating the first trend as product formulations are changed and new
products to capitalize on this trend are introduced” (p.6). All of these trends are contributing to
the change and increase in the types of unsaleables. “Now discontinued, expired, seasonal and
other non-damaged products account for over 50% of all unsaleables” (p.6).
The next section of this report covers the five key findings in the state of unsaleables
management. The findings are:
• Root causes driven by the same fundamentals
• Damages are only half the problem
• It’s time to bring planning to unsaleables management
• Unsaleables reduction requires balanced incentives
17
• Unsaleables is now a ‘C’ level agenda item.
These findings will be described in detail in the next few paragraphs.
The first finding is “root causes driven by the same fundamentals” (p.7). There are four
root causes affecting both manufacturers and retailers that result in about 50% of the total
unsaleables. The first is that according to manufacturers, plan-o-gram and assortment changes
account for 12% of the root cause of unsaleables, and according to retailers, 21% of unsaleables
is caused by a lack of external collaboration on product launches and discontinuations. “These
two causes are closely related as plan-o-gram changes reflect retailer decisions around
discontinuations/launches” (p.8). If these two facets are not communicated well between the
manufacturer and retailer, a change in one will have an adverse effect on the other. The second
root cause is that according to manufacturers, 12% of unsaleables is due to a lack of product
rotation, and according to retailers, 14% is caused by code dating standards and procedures.
Retailers are saying that manufacturers are not delivering products with a visible and easy-to-
understand best-by date on the package, and manufacturers are saying retailers are not rotating
product on the shelf properly and product is going bad on the back shelf. The third root cause is
that manufacturers are saying 11% and retailers are saying 10% of unsaleables are caused by a
lack of collaboration in regular business. They both agree that there is a lack of communication
on inventory management on a day to day basis. Finally, manufacturers say 10% of unsaleables
is caused by product delivery and handling practices, and retailers say 10% is caused by product
packaging design and changes. Manufacturers feel most damage is caused by distribution from
the retailer warehouse to shelf, and retailers believe that while damage is caused while in retailer
possession, it is due to a lack of protection of the product by package design or materials.

18
The second finding associated with the state of unsaleables management is that “damages
are only half the problem” (p.11). “Although the average unsaleables rate has remained
relatively constant, the proportion of unsaleables due to damages is noticeably declining” (p.11).
Product damage as a cause of unsaleables has decreased “from 58% to 48% since 2003” (p.11).
Discontinued and expired products account for the largest increase in unsaleables from 2005 to
2007, while most retailers reported that damages decreased or stayed the same.
The third finding associated with the state of unsaleables management is that “it’s time to
bring planning to unsaleables management” (p.13). In the past, companies would deal with
unsaleables with more of a reactive philosophy by executing on existing problems. In order for
the industry to move forward in unsaleables handling, companies need to start planning based on
historical trends and forecasting.
There are four main focus areas that need to be examined for future planning. They are
collaboration on product discontinuations and launches, inventory planning, trade promotion and
mark-down planning, and SKU rationalization. “Industry analysis indicates that collaborating
with trading partners on product launch and discontinuation can decrease unsaleables cost by as
much as 0.3% of sales which represents $15 million dollars a year for a $5 billion company”
(p.14). A simple way to collaborate is to provide trading partners with more lead time on
discontinued products. Inventory planning is the next area that needs focus for future planning.
There is an average loss of $23 million for every $1 billion in sales due to stock-outs.
Furthermore, “half of grocery retailers indicated that more than 5% of the inventory is near
expiration at any given time” (p.15). The next factor that needs more collaboration deals with
trade promotions. Trade promotions can be very beneficial to a manufacturer’s gross sales if
they do well, but they often result in an oversupply of product due to un-met retailer

19
commitments. “Combining sophisticated trade promotions management with better forecasting,
inventory management and promotions planning over the life of the product can lead to revenue
growth and cost reductions, including lower unsaleables costs” (p.16). The final collaborative
planning focus area is in SKU rationalization. SKU rationalization is manufacturers having a
formalized process for deciding which products they keep, and which products they discontinue.
“The most effective SKU rationalization programs occur on a quarterly basis with sales,
marketing, finance and operations all coming together to evaluate the economic contribution of
high priority items where all parties have aligned incentives” (p.16).
The fourth finding in managing unsaleables is that “unsaleables reduction requires
balanced incentives” (p.17). There has been a huge shift in larger manufacturers from a JIR
policy to an ARP policy. Since there is more cost sharing between retailers and manufacturers
with the ARP policy, there are more disputes on what the reimbursement policy should be.
When there is a lack of communication and discrepancies between retailers and manufacturers,
the ultimate cost lies on the shoulders of the consumer. Since retailers are feeling cheated about
their returns policy, they are more likely to reject saleable product at the receiving dock because
of partial damage. The price of this hits the manufacturer first, but also drives the price of the
product up so it ultimately hits the consumer. The ultimate goal of this finding is to open the
lines of communication between retailers and manufacturers so that reasonable policies can be
formed that are agreeable on both sides.
The fifth and final finding is that “unsaleables is now a ‘C’ level agenda item” (p.23).
What is meant by “C” (corporate) level is that it has not had the attention of CEOs, CFOs and
COOs. Now, in order for there to be a real reduction of unsaleables, the executives of both
manufacturers and retailers need to be directly involved in their management. “Companies with
20
senior executive attention on unsaleables experienced unsaleables rates about 0.5% of sales
lower than those with limited to no executive attention” (p.23). The current trend in most
companies is that there has been an increase in senior executives’ involvement in unsaleables,
and in order for unsaleables to continue to decline this trend needs to continue.
1.1.6 A Study of Unsaleables: State of ARP 2012 (FMI 2012)
The purpose of the adjustable rate policy (ARP) is to reward retailers when they have a
reduced rate of unsaleables, and to penalize retailers when their unsaleables rates are high.
Currently, this concept has failed in doing this. The idea behind an ARP policy is to use periodic
audits to adjust reimbursement rates based on the rate of unsaleables during the audit period.
“The responsibility for unsaleable product was determined to be 20% for the retailer and 80% for
the manufacturer” (p.8).
There are four main things that have had a negative effect on the supply chain since the
introduction of ARP in 1996. The first is open code dating. Since there is an expiration date on
the package, customers are more aware of expired product on the shelf, thus expired product in
reclamation. The second is the food broker business model has changed. “Brokers reduced their
presence at the retail shelf resulting in an increase in the amount of damaged and out-of-date
product in the retailers’ reclamation process” (p.3). The third is new environmental
sustainability initiatives. Using less packaging for the sake of sustainability has led to a
reduction in protection and an increase in damage. This is discussed in greater detail later in the
literature review. The final thing is an increase in new product failures and discontinuations.
ARP does not cover the product that sent through the retail reclamation process due to product
failures and discontinuations. So the retailer is penalized for something that is the manufacturer’s
responsibility.
21
One major problem with ARP is that dollar gaps “are a significant financial problem for
retailer trading partners” (p.11). The retailers are incurring a greater cost, and manufacturers are
benefiting from it. This is having a major effect on retailer profitability. The manufacturers are
using the ARP to make up for the shortcomings of their supply chain system. A solution for
these gaps would involve the trading partners to agree upon a reasonable rate that would be fair
for both parties. This would include a clearly defined definition of which party is responsible for
the product at certain points in the supply chain. Another issue with the current ARP system is
that the rate of reclamation is increasing while the ARP payouts are decreasing. This gap is
leading JIR manufacturers to switch to an ARP system because of the benefits of lower payouts.
The retailer should not be responsible for paying the increasing money gap and they need to re-
evaluate their ARP model as soon as possible.
1.2 Information Systems in SCM
Understanding the supply chain and the flow of information is crucial in the reduction of
unsaleables. It is very important to know who owns products at certain points in the supply
chain, and who is responsible for a product when it is damaged. This starts with data collection.
Products need to be tracked from the import of raw materials to the manufacturer, to customer
checkout at the retailer, as well as data collection on the event of a return. Without a system for
data collection, there is going to be discrepancy as to who owns what, as product is delivered
through the supply chain. “Whenever there are differences of opinion, they are typically driven
by different perspectives on the amount of unsaleables as well as who owns the process within
the supply chain where the unsaleables occur” (Karolefski 2007, 2). This section outlines the
typical method of collecting data in purchasing, shipping and receiving.

22
Information sharing in the forward supply chain has grown drastically in the last few
decades. Once the technology was available to track product in the forward supply chain down
to the SKU level in real time, it was demanded by customers. Customers wanted real time
tracking data that could be used to reduce inventory requirements, increase flexibility of resource
allocation, and use information transfer to facilitate collaboration among trading partners.
There are many benefits to a fully functional supply chain data system. The data system
allows a firm to respond to changes in the supply chain in a timely manner because they have
access to real time data. The system also allows the firm to process large amounts of information
in a very complicated system of transactions and planning. Finally, the data system results in a
huge increase in resource utilization which results in increased performance, which leads to
customer satisfaction. With all these benefits, there are still many places in the system that can
result in disaster for the firm. It is very important that all the information in the system is
accurate. For example, if the weight of a product is wrong in the data system, the system will
estimate an inaccurate number of products allowed on a truck load and this will result in an issue
with logistics. (Bowersox 2010)
The information sharing systems and databases that have been developed for tracking of
product are in place because they were demanded by the customer, and fulfilled by the suppliers.
They have led to an increase in efficiency, and decrease duplications and inconsistencies in the
central databases. The functions of the information sharing systems span across the whole
supply chain system from customer accommodations, logistics, manufacturing, purchasing, and
inventory deployment. But the tracking of product by the manufacturer stops once the retailer
has possession of the product. At this point, the data is no longer shared between manufacturer
and retailer, and this is where the majority of products become unsaleable.
23
The retailer does not share information with the manufacturer on the product until the
product becomes unsaleable and is required to go through the reverse logistics system. This
system is explained in detail later in the literature review.
1.2.1 Communication Technology
With the increasing complexity of supply chain systems, data systems would be nearly
impossible to maintain if it were not for the use of communication technology. This section of
the report will discuss the use of global data synchronization network (GDSN) and extensible
markup language XML systems, and the use of automatic identification that is typically used in
the forward and reverse supply chain.
There are currently over 20,000 trading partners using some kind of a GDSN system for
monitoring the progress of trade goods (Bracken 2013). With a GDSN system, it allows
suppliers to enter data into a system one time and share the data among its many customers, and
allows retailers to access the data from many suppliers in one location (Bracken 2013). The
most common GDSN system is electronic data interchange (EDI), which is “direct computer-to-
computer exchange of business documents in standard formats to facilitate high-volume
transactions” (Bowersox 2010, 121). There are currently no common standards in regards to the
transfer of information in an EDI system, but in order for this system to work, there at least needs
to be a standard between suppliers and retailers. EDI is used more commonly among businesses
that need to handle large amounts of data because they are expensive to set up and they are used
to handle very large amounts of information.
The next common system used for information transfer is XML, which is “a flexible
computer language that facilitates information transfer between a wide range of applications and
is readily interpretable by humans” (Bowersox 2010, 127). An example of the way a data
24
transmission looks is, <address> 123 main st. <address>. The information between the carrots
tells the system where the information is to go; in this case, the ‘123 main st.’ is what will be
seen on the form under the address. XML has many benefits. The system is inexpensive to set
up, it is easily convertible to HTML so it is easy to maintain, and it is easily adjustable in case
for a need for deviation from standard forms. (Bowersox 2010)
1.2.2 Auto ID
The most common forms of automatic identification in the retail environment are
barcodes and radio frequency identification (RFID). These two forms of identification are
placed on individual products, shipping containers, pallet loads and truck loads for tracking of
information to be used in databases as described above. These systems are very useful because
they reduce the error associated with human inputs, and they are a huge time saver when it
comes to entering and looking up data. (Clarke 2011)
RFID is used mostly in the retail industry for tracking of containers and their contents in
warehousing and transportation. It is also used as an anti-theft device that will sound an alarm if
someone tries to leave the store with unpaid product. Since there is a high cost associated with
RFID, most manufacturers do not use it. But the manufacturers that do use it, only use it to track
whole pallet loads or cases of product. (Clarke 2011) To get the SKU information of products,
barcodes are the preferred method of tracking. Barcodes are used to track individual items,
cartons, containers, pallets and rail cars. Product information is scanned and sent to the central
database to track product progression through the supply chain using barcodes. Barcodes are
used at the retail store as well. They are used to ring up customer receipts, provide inventory
control at the store level, and used for the tracking of restocking needs. Barcodes are also the
main use in the tracking of product in the reverse supply chain. Since all the information on the

25
product is on the barcode, it is the easiest way to track product going through the reverse supply
chain. (Bowersox 2010)
1.3 Product Flow in the Reverse Supply Chain
The first section of this part of the review covers the process of reverse logistics. It
answers the questions: what is reverse logistics? Why do products need to enter the reverse
supply chain? Who is responsible for the various processes in the reverse supply chain? Where
do products enter the reverse supply chain? And how does reverse logistics affect the bottom
line?
1.3.1 What is Reverse Logistics?
In order to define reverse logistics, it is important to first define logistics. There are
several definitions for logistics, but the following definition gives a really good all-encompassing
view of what logistics is and how it is utilized. "Logistics refers to the responsibility to design
and administer systems to control movement and geographical positioning of raw materials,
work-in-process, and finished inventory at the lowest total cost"(Bowersox 2010, 22). Basically,
logistics involves the whole process of moving goods through the supply chain, from raw
materials to the finished product, and then moving finished product from the manufacturer to the
retailer to the customer, and all this while minimizing costs wherever possible.
Knowing what logistics involves, it is easy to define reverse logistics. “Reverse logistics
can be defined as the reverse process of logistics” (Krumwiede 2002, 327). Many companies
define reverse logistics in different ways depending on their specific need. Reverse logistics was
first defined as a means of recycling used and excess packaging (Krumwiede 2002). Now,
retailers and manufacturers view the definition of reverse logistics in different ways. “Retailers
see reverse logistics as a way to get product that has been returned by a consumer back to the

26
vendor. Manufacturers tend to view reverse logistics as the process of receiving defective
products or reusable containers back from the user” (Krumwiede 2002, 327). The authors in the
paper titled Going Backwards: Reverse Logistics Trends and Practices, gives a more objective
definition of reverse logistics. They define reverse logistics as, “the process of planning,
implementing, and controlling the efficient, cost effective flow of raw materials, in process
inventory, finished goods and related information from the point of consumption to the point of
origin for the purpose of recapturing value, or proper disposal”(Rogers 1998, 2). Looking at the
two definitions, the conclusion can be drawn that “a reverse logistics flow is much more reactive
[than a forward logistics flow], with much less visibility” (Tibben-Lembke 2002, 272).
Now that reverse logistics has been defined, it is important to view the flow of
information and product in the supply chain and the reverse supply chain. The forward logistics
information flow is as follows: sales forecast, planned shipments to DC, shipment to DC,
shipment to store, put away at store, actual sales, and actual sales information is sent to sales
forecast and shipment to store to adjust shipments. The forward logistics product flow goes from
the distribution center, to the store, is put away at the store, and the sale is made. The reverse
logistics information flow goes from the customer returning an item, to return information going
to the distribution center, to sortation and disposition decision making. The reverse logistics
product flow goes from the customer returning an item, to items collected at the store, to
collection at the distribution center, to sortation and disposition decision making, and finally, the
product goes to disposition destination. (Tibben-Lembke 2002)
This shows that reverse logistics is compiled of four main processes that need to be
maintained to have an effective returns program. The first process is gatekeeping which “is the
screening of defective and unwarranted returned merchandise at the entry point into the reverse
27
logistics process” (Rogers 1998, 38). The second process is collection, which “is the
accumulation of the products for the reverse logistics system” (Meade 2002, 287). The third
process is sortation, which “is deciding what to do with each product” (Meade 2002, 287). The
final process is disposition, which “is the sending of the products to their desired destination”
(Meade 2002, 287).
1.3.2 Why Do Products Need to Enter the Reverse Supply Chain?
There are several reasons a product may need to enter the reverse supply chain. These
reasons include five main types of returns: “consumer returns, marketing returns, asset returns,
product recalls and environmental returns” (Rogers 2002, 3). Consumer returns are products that
are bought by a customer at a retailer and are then returned to the store. The largest number of
consumer returns are due to defects and “buyers’ remorse”. “Marketing returns consist of
product returned from a position forward in the supply chain, often due to slow sales, quality
issues, or need to reposition inventory”(Rogers 2002, 3). In other words, these are products that
are returned because they, in some way, give the company a marketing advantage. Either they
no longer look good to a company’s image, are not selling well, or the company finds it makes
more money with the product elsewhere. “Asset returns consist of recapturing and repositioning
of an asset” (Rogers 2002, 3). These products are not sold to customers. Rather they are used to
move product, such as reusable containers, totes and racks. Product recalls are products that
must be returned to the manufacturer because of safety or quality issues. “Recalls can be
voluntary or mandated by a government agency” (Rogers 2002, 4). Environmental returns
include dealing with and disposing of products that are considered hazardous materials. These
types of products are heavily regulated by the UN and other government agencies, such as the
Environmental Protection Agency. (Rogers 2002,)

28
Among the above categories of returns, there are several more specific reasons a product
must enter the reverse supply chain. These are known as reason codes. Each company has their
own set of reason codes based upon their specific needs. But these codes can be put into five
main categories: damage, discontinued, expired, seasonal, and no apparent damage. (FMI 2008,
12)
1.3.3 Where Do Products Go in the Reverse Supply Chain?
As stated previously, a product enters the reverse supply chain any time it leaves the
forward supply chain. This can happen at almost any point in the forward logistics process.
Anytime from manufacture to post-sale, product can incur some kind of defect that makes selling
the product unfavorable. This section of the review will focus on the disposition of products once
they have entered the reverse supply chain. Once a product is in the reverse supply chain, a firm
has four options for the disposition of a product. These four are: reuse, product upgrade,
material recovery and waste management. (Hazen 2011)
Reuse is only really an option when a product is returned by a customer and is still in new
condition. Other than the store putting the product back on the shelf, the product can be
“shipped laterally to another retailer, shipped back to the distributor, or shipped to any other
place within the forward or reverse supply chain where stock levels require such an item” (Hazen
2011, 248). The issue with reuse is if it is not properly forecasted and accommodated for, the
variability of the product can cause a “bullwhip effect within the supply chain and can lead to
increased inventory” (Hazen 2011, 249). To avoid this, each item that is returned should be
accounted for when ordering new product and offset product in the forward supply chain. (Hazen
2011)

29
“The product upgrade alternative is concerned with repairing, refurbishing, or
remanufacturing an item in order to extend the life of and derive value from the original core
unit” (Hazen 2011, 249). This option involves taking a product that is no longer able to be sold
and, in some way, making it acceptable for sale again. “If executed properly, product upgrade
can create profitable business opportunities through recapturing value that would otherwise have
been lost” (Hazen 2011, 249).
Material recovery involves the taking valuable parts of a product out that can be used
elsewhere. This process occurs when a product has reached the end of its useable life, and rather
than completely destroying the product, part of the product is recycled for reuse. This can often
be difficult as it can be more profitable to destroy the product rather than recycle it. (Hazen
2011)
Once a product has been determined completely useless by a company it is destroyed and
goes through the waste management disposition. (Hazen 2011) This option is the last option to a
company because they want to get as much value out of products as they can.
1.3.4 Who is Responsible for the Various Processes in the Reverse Supply Chain?
“Three choices can be made with respect to the development of reverse logistics
functions: do nothing, develop an internal reverse logistics function, or find a third-party reverse
logistics provider and partner with them” (Meade 2002, 285). This section of the review will
discuss these three options, their pros and cons to a business and who is responsible for the
processes.
The first option is to do nothing. Doing nothing with reverse logistics means everything
that cannot be sold is being thrown away, or sent to the manufacturer. Product is only sent to the
manufacturer if that is what the manufacturer requests of the product. This might seem like a lot

30
less annoyance than to deal with the products, but it is a huge waste of resources and can actually
cost more than the other two options.
The second option is handling the reverse logistics process internally. This option has
some handling of returns in-house which can be disruptive to the rest of the organization’s
operations (Meade 2002). This is also known as decentralized reverse supply chain with pre-
ponement. In this process product returns and unsaleables are evaluated in the retailer or resellers
facility and either restocked, scrapped or sent to a test and repair facility. This method requires
testing specialty in the retailer or resellers facility to determine the proper mode of transport
through the reverse supply chain. The product that is sent to the test and repair facility is then
sent to be refurbished for resale or to a facility to recover parts from the product that can be used
elsewhere. (Kumar 2011)
The final option is to partner with a third party reverse logistics provider. This is known
as centralized efficient reverse supply chain, in which, unsaleable goods and product returns are
taken from the store and placed in a centralized evaluation and test facility. From this facility the
products are either restocked, refurbished, parts are recovered from the product or the product is
scrapped completely. This method of reverse supply chain “sacrifices speed over cost efficiency
and is typically applicable to products with shorter time/ value depreciation” (Kumar 2011, 5).
After product is processed through the centralized evaluation and testing facility, credit is issued
to the retailer, and “the retailer or reseller doesn’t partake in any product evaluation” (Kumar
2011, 5).
1.3.5 How Does Reverse Logistics Affect the Bottom Line?
“Business organizations exist for the benefit of shareholders and stakeholders. When
making the disposition decision, one must always consider the bottom line” (Hazen 2011, 259).

31
Throughout the distribution system, there is going to be damaged, outdated, and returned
products. This is why reverse logistics is needed. Without a well formed and implemented
reverse supply chain, there can be a huge loss in product resulting in a huge hit to a company’s
bottom line. As stated in the document Reverse logistics disposition decision-making, “Costs will
endure to be a primary consideration in business decision-making”, and how the reverse supply
chain is handled is a business decision that affects the profitability of a business (Hazen 2011,
258). With a good reverse supply chain in place, the impact of goods that make their way
through the reverse supply chain has a minimal effect on the bottom line. This section of the
review looks at how companies are using reverse logistics as a strategic advantage to reduce cost
of unsaleable products.
The first thing that needs to be discussed when considering the bottom line is the return
policy. This may beg the question, what does a company’s return policy have to do with reverse
logistics? According to an article in Warehousing Forum, "Reverse logistics is all about
customer satisfaction. There is a direct relationship between customer satisfaction and the
company's return policy"(Greve 2012, 1). That being said, there are two main findings that
pertain to the return policy. The first is that the return policy has a great influence on where, and
how much people shop. The second finding is that some people abuse the return policy. An
example of abusing returns policies is people might buy a big screen TV right before the Super
Bowl and then return it in a week or two. (Skinner 2008) There was never any real intention of
buying the new TV, but they found a way to acquire a big screen TV for free for the Super Bowl
party.
When product goes through the reverse supply chain there is an asset loss of about 45%.
This loss is due to restock, refurbish, repair and remanufacture, and salvage costs, along with

32
product loss from scrapped product. There is also an asset loss due to product’s value decreasing
over time. (Kumar 2011). A “large retailer found that 25% of the profit of the entire firm was
derived from its reverse logistics improvements during its initial phase” (Rogers 1998, 18).
There is evidence of cost savings if you just look at the historical data that was presented in the
FMI studies above. Every year, as the systems for managing unsaleables and reverse logistics
improved, the companies would see a reduced cost associate with unsaleable products.
1.4 Grocery Damage versus Sustainability
There are three main ways in which companies are working to make their products more
sustainable. The first is in light-weighting the package, the second is to look for an alternative
material for the package that is more recyclable and more environmentally friendly to process,
and the third is to eliminate secondary packaging. (Connolly 2009) But these practices can lead
to many problems in the integrity of the package in distribution.
To relate the effect “sustainable packaging” has on the damage incurred by products, the
definition of sustainable must first be defined. This is not an easy term to define as there is not a
set rule that defines something as being sustainable or not. The term sustainable means different
things to different people and business entities. “One of the most cited interpretations of
‘sustainability’ comes from a 1987 report by the Bruntland Commission on Environment and
Development (formerly the World Commission on Environment and Development) that defines
sustainability as ‘development that meets the needs of the present without compromising the
ability of future generations to meet their own needs.’ The definition [of sustainable] has
evolved into addressing three measurements—environment, economic and social, a trio that is
often referred to as the ‘Triple Bottom Line,’ and recognizes responsibility to all three

33
measurements” (Egan 2012, 22). The long and short of it is, the definition is constantly changing
and can be interpreted in different ways.
Beverage companies have been at the forefront of light-weighting activities. This should
be fairly obvious to anyone who has bought a case of water from the store in the last few years.
It seems like every time you go the store the bottle walls get thinner and thinner. The question
is, how far can the light-weighting process be taken before product damage starts costing more
money than a company is saving on materials? There are many benefits to light-weighting. The
largest benefit is that there is a cost reduction due to less use of materials, both to the
manufacturer and the consumer. The package is also seen as more environmentally accepted
since there is an increase in recycled product or less material in the landfills. But with these
benefits, it is easy for manufacturers to get carried away with the potential savings and reduce
too much. It is important not to lose sight of the purpose of the package, getting the product in
the package to the end consumer without damage. When a bottle is not strong enough to make it
through the supply chain to the end consumer or even too weak to make it through the bottling
process at the manufacturing plant, there is an issue with excessive light-weighting. (Koss 2009)
Companies are finding that a more sustainable approach to packaging efforts is leading to
an increase in sales. The reason is that environmental friendliness is very important in consumer
buying decisions. The more the packaging can convey the efforts the company is making to
make their packaging more sustainable, the more likely a consumer is going to be to choose that
product over another product. (Connolly 2009)
A quote from Sustainable Packaging in the Fridge and Freezer explains company efforts
for sustainable packaging in a very good way that needs to be considered in all company
sustainability models. “Food companies must never lose sight that wasted food is the poorest

34
sustainable outcome. Regardless of how recyclable, reusable, biodegradable or compostable the
package is or how few resources its production and distribution consumed, if the refrigerated or
frozen food product is never sold—because it exceeded the expiration date or due to freezer
burn—it fails and the sustainable contributions of the package are lost” (Egan 2012, 22).
While companies are making all these packaging changes to make product more
sustainable and appealing to the consumer to increase sales, they need to also consider if the
changes they are making are resulting in more product in the reverse supply chain. If a change in
the packaging decreases cost of materials, and increases sales because of customer appreciation
of the sustainability effort, the product could still be less sustainable if more product is ending up
in the reverse supply chain due to the change.
This raises a very important question when looking at the balance between sustainability
and damage. How does a company know if the packaging change is causing more product in the
reverse supply chain? Tests can be done to ensure a packages integrity but they are time
consuming and expensive, and companies do not want to spend time and money on something if
they do not have to. This is why accurate and actionable information is very important in
unsaleables management. If a company can have access to information on where and when
damage is occurring on the product and in the supply chain, more accurate tests can be applied to
specific types of damage, and the problem may even be able to be fixed without testing.
1.4.1 Damage Reproduction Testing
Standard distribution dynamics tests do not aim to reproduce specific types of damage,
but rather aim to simulate a series of dynamic forces that are likely to occur. Examples of this
include impact, vibration and compression tests. (ASTM and ISTA) On the other hand, types of
damage vary by package and product type. For example, cans dent, flour bags break and apples

35
bruise. As damage information becomes more specific, there is an opportunity to develop tests
that better reproduce the damage.
For example, there is no standard test specific to denting damage of cans. The usual
impact test for full boxes does not accurately replicate the denting damage in cans that is seen in
the supply chain system. The reason is believed to be that most cases that are dropped in
distribution are dropped on an edge or corner onto a yielding surface and not flat on a hard
surface. This type of impact is the leading cause of damage to cans because it offsets the
alignment of the cans and the edges of the cans cause dents in the sides of neighboring cans. To
replicate this type of damage, the standard drop test needs to be modified. This is done by
orienting the box on a shock machine so that the impact will occur on the edge of the box in
contact with a high density Polyethylene foam cushion on the table surface. (Goff and Twede
1979)
Cans were found to perform better in tightly wrapped containers, rather than the standard
corrugated box. Tighter packaging was found to reduce the main kind of damage done to cans,
the can-to-can damage that occurs by offset cans in the corrugated container. Shrink wrap was
considered as an option that might be better suited for can distribution. The benefits include that
the fork lift operators can see the cans and sort out damaged product at an early stage in
distribution. Catching damaged product early is a good way to reduce unnecessary shipping of
damaged product which will reduce shipping cost. One of the outputs from this research is a
table of common grocery damage types and some recommendations for tests to reproduce each
type. (Goff and Twede 1979)

36
CHAPTER TWO: METHODOLOGY
Qualitative research methods were chosen for this study because it was unclear what
would be uncovered, and because the goal is to gather information on a process and information
flow. Quantitative information in this case would only allow for comparative observation and
would not allow for actionable information. Qualitative research gives the opportunity for
comparing the process from each retailer and manufacturer, and gives information that can be
compared to find the best solution to the problem.
The case study method was chosen for this research for many reasons. The first among
them is that the information in this study is exploratory. The questions being asked in the
research are meant to explore actions being taken by businesses. The case study approach also
allows for behavioral analysis of business decision making as it pertains to unsaleables practices.
It allows for comparative analysis of business practices and mapping of information and product
flow.
The case study method was also used because data was collected through a series of
phone and in-person interviews. The study is comparing cases of several different firms. There
were a total of five retailers interviewed, three manufacturers, and two third-party reclamation
center providers, one of which was a donation center. Two of the retailers are small and
independent, and the other three are large chains. The purpose of the interviews was to map
process and information flow, discover who carried the responsibilities of the unsaleable product
(and when the responsibility shifted), and understand methods of reimbursement, product
disposition and information sharing.
There is a large amount of data transfer and sharing between the manufacturer and the
retailer when the product is being shipped to the retail facility. Once product is no longer in

37
possession of the manufacturer, the two entities stop communicating about the product until the
product becomes unsaleable. The goal of the interviews was to find out when the transfer of
responsibility happens from the manufacturer to the retailer (and back again if the product
becomes unsaleable), what the means of tracking data through the reverse supply chain are, what
actions are being taken to reduce unsaleables and how disposition decision making is made for
unsaleable product.
Information flow is analyzed and strategies are compared. The best practices of each
firm are evaluated and considered for recommendation as industry standards.
2.1 Interview Questions
The interview questions were what the team came up with before starting the interview,
but during the interviews other questions arose. This is the list of questions that were
predetermined. The manufacturer interviews were conducted over the phone or by an in person
meeting. The retailer interviews were conducted in person at the retail location with an
accompanied tour of the operations; with the exception of one interview that was done over the
phone. The third-party and donation center interviews were also conducted in person with an
accompanied tour of operations. It is also important to note that some retailers and
manufacturers did not want to disclose certain details of their operation and would not answer
some questions.
2.2.1 Questions for Manufacturers
Each interview started with the simple request to “Tell us about your unsaleables
program”. This request answered many of the questions the research posed, and brought up new
questions. The following, list the set of predetermined questions that were asked of each
manufacturer.

38
What types of information does your company receive from retailers about unsaleables? Costs?
SKU-specific? Reason codes?
Who (what position in the company) is the unsaleables information gatekeeper? What
information do they have?
Who (what job position) is responsible for negotiating swell or adjustable rate damage
allowances?
What kind of unsaleables information would the company like to have? SKU-specific? Cost?
Reason codes?
Does the company contract with third-party providers to do audits of unsaleables on your behalf?
Does the company have a specific set of “reasons” for unsaleables that they can share? Do they
have a way to assign “blame” for those reasons (manufacturer vs. retail)?
How does your company use the unsaleables information that it does have?
2.2.2 Questions for Retailers and Third -party Providers
The questions asked in this section are the predetermined questions asked of the retailers
on the store visits, and the third party providers on the facility visits. The general idea of these
visits was to gain information on how they track unsaleable product and what channels the
product goes through. The following is not all the questions that were asked during the
interview, but are a general idea of what types of questions were asked.
Example questions:
Who is in charge, and how many, and which people determine the disposition of the product?
Who decides, and how is it decided what makes a product unsaleable?
Where does the product go when it leaves the retail facility?
How is information shared with your manufacturers?

39
How is product tracked when going through the reverse supply chain?
What is done with unsaleable information after it is collected?
What is the difference between JIR, ARP and swell policies?

40
CHAPTER THREE: RESULTS
It should be noted that first, the product is shipped from the manufacturer (vendor) to the
retail or wholesale distribution center (DC). If damaged products are found on arrival at the DC
(“over, short or damaged”), they are either disposed of or sent back to the vendor for a credit.
This system is a well-established part of the transaction. The following case profiles map the
route of products that are deemed to be unsaleable after the retailer has assumed ownership, and
the route of information generated by the process.
3.1 Retailer 1: Uses a Third-party Provider to Handle All Unsaleables
Items that are removed from the store floor, and returns received by the store are sent to
the back room of the store and sorted. If rejected products are considered hazardous, the
products are wrapped in heavy duty bags and placed in buckets with the proper hazardous waste
class. The UPC code is scanned to remove it from the store’s inventory. If the product cannot
be reclaimed, the product is destroyed at the store. If the product can be reclaimed, it is scanned
at the store and then packed into banana boxes. A new bar ID code assigned to the box is
associated, in the computer system, with the scanned contents. The boxes are palletized,
identified by a bar-coded pallet tag that is correlated with all of the boxes, and sent back to the
DC.
Next, trucks are cross-docked at the DC and the pallet code is scanned. This identifies
every box and individual product UPC that is on a pallet. Likewise, the full truck has a seal
identification that is associated with the pallet IDs on the truck.
The products are transported to the third-party reclamation center where the pallet ID is
scanned and moved to a holding station. From the holding station, the pallets are moved to the
scanning stations. When scanned, the box ID tells the scanner what was placed in each box.
41
Then the boxes are unpacked, each individual item is scanned, and the computer directs the
worker to the proper disposition destination. There is a new UPC generated for each item and
the handler has three options for disposition; destroy, send to liquidation, or send back to the
manufacturer.
If the product is sent back to the manufacturer, the product is placed in a color-coded tote
based on its disposition. The items are then scanned again for verification and boxed to be sent
back to the manufacturer.
If the product is to be sent to liquidation (usually resale on the secondary market), the
items are placed in banana boxes that are going to the same disposition. A new label is
generated and placed on each box. The boxes are then palletized based on disposition and a new
pallet ID is generated. The full pallets are then placed in a liquidation holding station.
Depending on disposition, the product is either donated, shipped to a secondary market, or the
product is destroyed.
3.1.1 Who Aggregates Data?
The third-party provider is responsible for collecting data for the retailer and
consolidating the information into weekly reports. Before the third party was used, Retailer 1 did
not have the information that they currently have to track, understand and negotiate allowance
programs. The third-party reports contain various pieces of information that the retailer can use
to pinpoint major problems and improve the process of reducing unsaleables.
The third-party reports include: the number of returns by store, the number of returns by
UPC, and the percent of product that has been destroyed, moved to secondary market, donated or
returned to the vendor. Sometimes, the retailer will put a program in place for the third-party
provider to track the progress of specific products. This is common among items that tend to

42
have a high level of returns. An example of such a program is the tracking of seasonal products,
or products that tend to go out of code date regularly. The third-party tracks the progress of
these programs to determine the most efficient way to reduce returns on these products.
3.1.2 Where Does the Information Go?
Once the retailer has the report from the third-party provider, the retailer compiles a one-
page report for each vendor that is given to the retailer’s merchandiser. The merchandiser then
uses this information to negotiate damage allowances with the vendors.
3.1.3 How Does Retailer 1 Share Data?
The vendors have access to the information from the third-party provider, but the retailer
does not have a good sense of how often the vendor looks at the information. The only vendors
that seem to discuss returns with the retailer are the vendors that have the product returned to
them.
When a vendor notices they are having problems with a specific product, they will
sometimes come to the retailer with new packaging changes. This will sometimes result in a
decrease of returns for that product. There is very little direct sharing of information between the
retailer and the vendor because there is a lack of trust when it comes to unsaleables. The only
time there is any routine sharing is in negotiation of the returns rate.
3.1.4 Success Story: Bags and Labels
When Retailer 1 found excessive damage to some bags and labels, the unsaleables
manager met with the vendors to identify the opportunities for packaging improvement. When
the manufacturers did change the package, Retailer 1 tracked the reduction in damage, and
rewarded the manufacturers with a lower ARP rate.

43
Figure 1: Retailer 1 Process Map

44
3.2 Retailer 2: Donates to a Charity
Unsaleable products are moved to the back room and sorted. Products are returned to the
shelves, discarded, moved to the markdown section, moved to hazardous waste, returned, or sent
to a food bank charity. Disposition is based on the negotiated agreement with the manufacturer
and the condition of the goods. Discard is specified by some manufacturers and is used if the
package is too damaged for use. The markdown option has grown based on positive feedback
from “loyalty card” customers. Instead of paying a third-party reclamation center that generates
20% of cost in the secondary market, the food bank option has been chosen. The company has a
philanthropic philosophy and prefers the combined financial benefits of selling marked-down
product in its own stores and receiving 16% of cost in donation tax credits.
An experienced worker is responsible for scanning and sorting unsaleable products in the
back room. This worker is knowledgeable about the system and how it works. A wrist-mounted
scanner prompts the worker to enter a reason code and determine its disposition. There are ten
reason codes to choose from: theft, reclaim, corporate/brand damage, mispick, quality damage,
out of date, warehouse returns, item recall, daily donation, and warehouse damage. Retailer 2 has
found that limiting the number of reason codes and employing knowledgeable store-level
personnel are keys to a reliable system.
If the product is sent to markdown, a new barcode is generated and placed over the old
barcode, and the product is put in the markdown section to be sold. If the product cannot be sold
in markdown, it is taken off the shelf and moved to the back room to be processed again. If the
rejected product is a hazardous material, it is placed in a bin with the proper hazmat class, and
these items are picked up by a third-party entity. If the product is destined for the food bank, the
items are placed in banana boxes, each box tagged with the store number and division, and the

45
boxes are shipped to the retailer’s DC. At the DC, the products from multiple stores are
consolidated onto pallets and shipped to the reclaim center that supplies the food bank.
At the reclaim center, the items are scanned and sorted. Products that are to be held for
the vendor are packed in boxes and then shipped to another center for processing. At the second
processing center the products are reconditioned or salvaged if possible. Products that are to be
donated are loaded onto pallets, and then volunteers take the products off the pallet to be sorted
into gaylords based on the product type. The gaylords are then shipped to the food bank
location.
3.2.1 Who Aggregates Data?
The information is collected in two places: from back-room scans and from scans at the
reclamation center. Both scanning systems are owned by Retailer 2.
3.2.2 Where Does the Information Go?
The information that is collected at the retail store is kept by the retailer for internal use,
but is not routinely shared with a manufacturer, in part because of mutual mistrust. Items that
cause the most problems are reported to Retailer 2’s category managers once per period. Retailer
2 uses the data to pinpoint problem products and to change processes to reduce the number of
unsaleables.
3.2.3 How Does Retailer 2 Share Data?
The information gathered at the reclamation center is visible to both retailer and vendor.
This data, which does not include the reason codes, is accessible to vendors through a
portal to the reclamation database.
46
3.2.4 Success Story: Bags
Two vendors supply a product packed in bags. One company switched to stronger bags,
cut the rate of unsaleables in half, and was rewarded by negotiating a better unsaleable
allowance. The company that did not make the change was denied an allowance reduction,
based on the fact that Retailer 2 had the data to support the denial. Retailer 2 believes that other
retailers gave both companies the allowance reduction because they did not have the data to
show the difference.

47
Figure 2: Retailer 2 Process Map

48
3.3 Retailer 3: Uses a Third-party Reclamation Center
If there is damage upon arrival to a store, the product is put in boxes in the transportation
damage section to be sent to reclaim. All other products are stocked on the shelves. From here
the product is either sold, rejected due to damage or out-of-date, or discontinued due to lack of
sales. If the product is sold, the product is sometimes returned, and in that case it is moved to the
back room for processing. If the product is discontinued, it is moved to a markdown section of
the store and, if it is not sold, is eventually moved to the back room. All rejected product is
moved to the back room for sorting.
The product is sorted at the store into three categories: transportation damage, out-of-
code date, and all other damage. Once the product is sorted into these three categories, it is
shipped back to the retailer’s DC, where it is consolidated with other stores’ unsaleables and
shipped to the reclamation center. At the reclamation center, the product is scanned and either
returned to the manufacturer, sold through secondary markets, donated or sent to salvage.
3.3.1 Who Aggregates Data?
Retailer 3 uses an ARP return policy. They adjust their rates using data from the
reclamation center as well as a series of periodic audits. Retailer 3 generates data at the
reclamation center, and has its own office there. It prepares reports at the SKU-level for
manufacturers with the following categories: out-of date and transportation damage -- compared
to total sales in units, dollars gross margin and unsaleable rate.
Retailer 3 has nine years of audit data, sorted by UPC and tracked by causes. The audits
are conducted by a third-party provider. The unsaleables manager says, “Granularity happens on
the tail end, especially once we find something with a problem.”

49
Retailer 3 is committed at the highest level in the company to managing unsaleables.
The unsaleables department, which reports to operations, is powerful. It has its own P&L out of
which the department pays for reclaim and gets salvage sales. Retailer 3 has an experienced
analyst to track data from the reclamation center and audits, and the company manages the
process by holding the unsaleables managers of each store accountable for reducing damage, and
by fiercely negotiating unsaleable agreements with vendors.
3.3.2 Where Does the Information Go?
Reports are generated for internal management use. Reports are all-inclusive, not just a
function of the audit.
Retailer 3 does not give manufacturers access to the actual data, but does share the SKU-
level data from the reclamation center.
3.3.3 How Does Retailer 3 Share Data?
If there is a serious problem with a specific product, Retailer 3 contacts the manufacturer
to find out what is causing the problem. When this happens, the manufacturer sends someone to
the store so they can see what the problem is first hand. Other than that, the company does not
require any previous damage control testing for products. Information on the SKU level is
shared with manufacturers in the form of a monthly report.
3.3.4 Success Story: Crushed Cans
Retailer 3 found a large number of dented cans “all of a sudden,” across some of one
manufacturer’s SKUs. This triggered a meeting with the manufacturer and a “battle” until a
senior manager confessed to purchasing inferior cans. Access to timely data was sufficient proof
to force the manufacturer to compensate the retailer for full value. Some other retailers did not
get the same compensation.

50
Figure 3: Retailer 3 Process Map
51
3.4 Independent Retailers 4 and 5, Supplied by Wholesaler
The product that does not sell is moved to the back room and either destroyed, sent to
reclaim, or sent to markdown. If the product is sent to markdown, a new barcode is placed on
the item and it is moved to the markdown section of the store. This product is either sold or, if it
does not sell in the allotted time, it is rejected and moved to the back room. There is a chart in
the back room that tells the workers the disposition of the items. If the item is on the chart, it is
destroyed at the store. If the product is not on the chart, the item UPC is scanned and the items
are placed into banana boxes. If the item is perishable, the product is dumped and just the
packaging goes into the banana box. The banana boxes are then shipped to the wholesaler’s DC.
The wholesaler deals with reclamation, and the process was not followed any further.
3.4.1 Who Aggregates Data?
Since the wholesaler gives compensation for unsaleables, there is not any type of third-
party reclamation that is visible to the retailers. The items going back to the wholesaler are
scanned at the retail store for internal use only, and the wholesaler does not have access to this
data. The wholesaler gives the retailers a quarterly report, but the retailer does not match it up
with the scan data because it is not worth the time. The retailer accepts the wholesaler’s swell
allowance for the products.
Retailer 4 even goes so far as to assign reason codes, just in case the company might
sometime in the future want them. It has great concerns about out-of-date product, because
when the company buys, it has no information about a given lot’s shelf-life. Retailer 4 would
most like manufacturers to better communicate code dates as part of the purchasing process, and
a date on each shipping container would be even better.

52
Overall, the independents seem to do the best job of minimizing and salvaging
unsaleables in the store. One respondent summed it up: “I have no power, no illusion. I take
what I can get and minimize what goes back, period.”
3.4.2 Where Does the Information Go?
The information is used internally and is not shared with vendors or the wholesaler.
3.4.3 Success Story: Out-of-Date Mayonnaise
Independent retailers, like these, once ordered full pallet loads of products that were
offered on discount by wholesalers. Mayonnaise, which is in high demand in the summertime,
was cited as an example where forward buys may have been made to gain a discount as well as
ensure product availability. Formerly, when the mayonnaise was packed in glass jars, it had a
much longer shelf-life. However, since changing the packaging to plastic, the shelf-life for
mayonnaise is shorter. Smaller retailers can no longer purchase in larger quantities as they risk
increasing unsaleables due to out-of-date codes. Ordering in smaller quantities, more frequently,
not only adds costs to retailers, but may also increases the risk of stock outs at the store.

53
Figure 4: Independent Retailer Process Map

54
3.5 Manufacturer A
Manufacturer A adjusts its rate of reimbursement on an annual basis. Because the
information gathered by retailers varies greatly, the manufacturer does not necessarily trust the
data. Instead, retailer feedback is just one type of data Manufacturer A uses.
Manufacturer A relies more on data from audits conducted internally and by third parties
to propose the returns rate policy. The third-party performs over 100 weeklong audits per year,
at retail stores and DCs, and at the manufacturer’s DC, simultaneously all over the country. It
analyzes the data by plant and even by trailer. The third-party has about thirty reason codes,
including cut open, open flaps, crush (vertical, horizontal and corner), ink rub, visual, code date
is missing or misprinted, etc.
Manufacturer A has the vision of applying quality control principles to distribution. The
information gathered in these audits is shared with the retailers so they have the opportunity to
improve, and it is used internally to rate packing lines and packaging teams. The company is
proud of the fact that its audits and unsaleables management focuses on improvement and not
just accounting.
The manufacturer heavily invests time and money into gathering information from the
audits. This company has nine personnel that work on the unsaleables team. These personnel
have elevated status, above the common “shrink manager.” Their status gives them protection
from blame and continuity as they uncover problems. The unsaleables team reports their findings
and data to sales, and the salespeople execute the policy. Through taking a proactive approach in
monitoring and gauging its unsaleables, this manufacturer has been able to reduce its total
unsaleables and reimbursement rates tremendously.
55
The data Manufacturer A collects from external and internal audits is not only used to
determine reimbursement rates, but is also shared with customers so the customer can work on
areas where they may be lacking. Most customers seem to appreciate this information. The
information that is gathered is used primarily in annual meetings to negotiate the unsaleables
rate.
Manufacturer A relies more on its own audit data than data generated by retailers. The
main reason is a lack of trust. The manufacturer looks at information gathered by retailers, but
does not use the data for ARP negotiation. Just as retailers look at and consider the audit
information from Manufacturer A. The third-party gives a non-discriminatory look at the data
and determines the reimbursement rate.
3.5.1 Success Story: Hold Packaging (and Everybody Else) Responsible
Manufacturer A “turns data into dollars.” It knows the contribution to damage from
every packing line, plant and DC. The company creates goals, metrics and accountability,
including holding their Packaging professionals responsible for excess damage. It gives
packaging professionals a broader viewpoint, cradle-to-grave. For example the manufacturer
found problems with open perforations that the Packaging department went on to solve.
3.6 Manufacturer B
This manufacturer uses a policy for its unsaleables that is in line with the original 1990
JIR policy. It uses a third party to provide audits to adjust the rate based on real-time, fact-based
data at the SKU level.
The data that Manufacturer B would like from retailers is SKU-level with reason codes as
to what specifically the damage was, and where on the package the damage occurred.

56
Every retailer has a different format, and Manufacturer B would very much like to have
an EDI standard implemented with fields that everyone is familiar with. For example, over 98%
of all customers pay via EDI, which can be a model for unsaleables information interchange too.
When Manufacturer B conducts audits, it uses eleven reason codes: tear, puncture (top,
middle or bottom), foreign material, top or bottom failure, closure failure, dented product,
crushed vertically, crushed horizontally, can leaking and can swell.
There are twenty people who work in the unsaleables department. These personnel spend
a lot of time on customer audits. Along with these twenty people, there is an operations manager
as well as two data analysts who work on identifying more significant trends in damage and
returns.
3.6.1 Success Story: Improved Packaging Due to Damage Information
In 2002, Manufacturer B’s audits identified top and bottom closure failure and puncture
as the biggest problems. Since then, the manufacturer has adopted a stronger package that
reduced these failures by 60%. Through working with the customer to reduce its share of
unsaleables, this company has reduced its reimbursement rate 36%, from 1.25% to 0.8%.
3.7 Manufacturer C
Manufacturer C uses an ARP that is adjusted on the basis of audits performed by a third-
party service. The manufacturer uses the audit information and applies statistical algorithms to
the data to determine the ARP reimbursement rate.
Manufacturer C also gets information from retailers, but it uses this information more as
a basis for comparing retailers than for determining the reimbursement rate. It is difficult to
partner with retailers in a systematic way because they use different tracking methods.

57
Manufacturer C has an unsaleables team that tracks and manages damage with the help of
thirty-five supply chain personnel, some fully dedicated to a customer or region. They are the
ones who negotiate the ARP. Manufacturer C has a cross-functional unsaleables advisory board
that meets quarterly to discuss the ARP rates.
If there is an unusual damage spike for a specific product, Manufacturer C and the retailer
will have a discussion about the issues with that product and come to an agreement on the course
of action. This could include further reimbursement for the damaged product and/or an in-depth
look at the cause of the unusual damage spike. The manufacturer has a new program for
acquiring reclamation data to make the ARP more robust: partnering with a firm that associates
reason-codes to the unsaleable product.
Another concern is that product can show up in secondary markets in a truly unsaleable
condition. For example the manufacturer found its product being sold in garbage bags.
3.7.1 Success Story: Improved Packaging Due to Damage Information
Manufacturer C improved its packaging as a reaction to high unsaleable rates on certain
products. It used to sell a granular product in expensive, but sturdy, three-gallon plastic pails.
The company wanted to find something less expensive so it changed to paper bags. But when the
bags experienced more damage, tearing and leaking, Manufacturer C began experimenting with
boxes. The manufacturer is having problems with the boxes at the weak points where the handles
are located, so it is now looking into a poly-woven reinforcement for the box that is strong
enough to handle the weight of the product. In another example, overhang on the pallet caused
significant damage to one SKU. Over a period of time, Manufacturer C was able to rework the
packaging so there was no more overhang and damage was reduced. Another problem
Manufacturer C faced involved paper labels coming off its plastic bottles due to scuffing from

58
vibration in transportation. To solve this problem, the company changed the paper label to a
sturdier plastic label.
These problems were identified by the collecting and sharing of information in the
reverse supply chain and audits.
3.8 Third-party Reclaim and Audit Service Provider
Third parties play an important role in the grocery unsaleables process. There are two
types: reclamation centers and audit service providers. These third parties are the current
gatekeepers of information.
The reclamation centers process some or all of a retailer’s unsaleables, providing an
accounting of the volume and cost. They resell most of the goods on the secondary market, or
(depending on the terms of the agreement with retailer and manufacturer) return or destroy them.
They are willing to provide data at whatever scale is desired by the retailer. They charge for the
service on a per-package basis, and reimburse the retailer a percentage of the resell price.
Audit service providers may or may not be affiliated with a reclamation center. They
contract primarily with manufacturers, but also sometimes with retailers, to conduct market
audits. They survey every product in a limited number of markets and distribution centers for a
prescribed length of time. The number of saleable products is compared to unsaleable, and
reason codes are associated with all unsaleables. Audit service providers have a large arsenal of
extremely specific reason codes. For example, glue failures are distinguished from cut-open
damage and bags that are open on the top are distinguished from bottom-end failures, as well as
from tears and punctures in the body of the bag.

59
CHAPTER FOUR: FINDINGS AND RECOMMENDATIONS
This section summarizes the results from the report produced for the sponsors of this
study (Twede, Whipple, Clarke and Sanders 2014) and amplifies on the packaging implications.
4.1 Proactive versus Reactive Unsaleables Practices
Retailers and manufacturers deal with unsaleables in two main ways: proactively or
reactively. Proactive strategies are those that deal with unsaleables by trying to manage and
reduce the number of unsaleables. Reactive strategies are those that try to dispose of unsaleables
as easily and inexpensively as possible without trying to reduce the number of unsaleables in the
reverse supply chain.
Proactive retailers use several different strategies and they have executive management in
charge of the practices. They reduce and manage unsaleable product through internal efforts and
by working with third-party retailer providers. Strategies include: making unsaleables
management a part of the sustainability initiative, using it as a tool to reduce cost of disposal,
partnering with local food banks to give back to the community, and utilizing tools like a
markdown section for items that are close to being expired. The proactive retailers show
initiative from the top down. Getting senior management involved in dealing with unsaleables
management ensures the necessary resources are available for proactive approaches.
The proactive retailers incorporate new and more sophisticated information tracking
systems. Apart from simply tracking information, they also share it with manufacturers to
strategies new unsaleables reducing practices.
On the other hand, smaller, independent retailers have a more reactive approach. The
main focus for dealing with unsaleables is to use a markdown in the store only, trying to sell off
60
as much product as possible in the store. If they could not sell the product, it was either discard
or sent back to the wholesaler.
Proactive manufacturers collaborate with retailers by sharing information, using third-
party auditing processes, and conducting audits internally. An example of proactive
collaboration with retailers is to make packaging changes to products that are damaged
consistently in the same way. By collaboration, they are able to discover the problem with the
packaging and remedy the situation at a lower expense than if the manufacturer attempted to do
it alone. Auditing is done by many manufacturers to discover weak areas, and used as a tool to
effectively reduce unsaleables.
Another reason for a proactive approach to unsaleables is to protect the integrity of the
manufacturers’ products. One manufacturer reported one of their products being sold in a
second-hand store in garbage bags. By taking a proactive approach, they were able to discover
this and find the root cause of the problem and fix it.
All three of the manufacturers that were interviewed are classified as proactive, but there
was reported reactive behavior by manufacturers includes collecting data but doing nothing with
it, and disposing of product that still had potential value.
4.2 Retail Unsaleables Data
All retailers interviewed, proactive and reactive, have unsaleable data. The barcodes are
scanned on all unsaleable products at the retail store for stock-keeping and disposition purposes,
and sometimes reason codes are assigned. There is further scanning done at reclamation centers
if one is used.
Retailers use data for at least one of the following purposes:

61
1. Product is removed from inventory and sorted based on the manufacturer agreement into
resell, donate, or return to manufacturer.
2. Data is aggregated by the store to better manage unsaleables on the store level. This
includes rewarding good store performance and punishing bad store performance.
3. Data collected by stores is used to negotiate ARP rates with manufacturers.
Proactive retailers go a step further by using the data collected by manufacturers to
identify improvement opportunities. These retailers use the data that is collected in negotiations
with manufacturers in the ARP rate, and use the information to recommend improvements for
packaging and inventory control.
Granular data is very important in order for a retailer to continually improve its strategy.
By tracking information at the SKU level, or the vendor level, retailers can calculate detailed
cost information. They can determine unsaleables as a percent of store sales and/or as a percent
of vendor total reclaim. This information can be shared with vendors to find areas where they
can improve.
Retailers 1 and 3 make the information collected at the third-party reclamation center
available to manufacturers in the form of a monthly report. Retailer 2 allows direct access of
information at the reclamation center by use of a cloud-based sharing system.
Retailer 1 separates damage, recall and “store throw to compactor” on their reports for
ARP negotiation. This provides a powerful tool for negotiating ARP rates with manufacturers,
but the lack of SKU level data hinders their ability to identify opportunities for improvement.
The SKU-level data is available to both the retailer and the manufacturers electronically, but it is
rarely used unless there is a specific noticeable problem that needs to be addressed.

62
Retailer 3 has a slightly more advanced process than Retailer 1. Retailer 3 is committed
from the top of the company to managing unsaleables. They have a powerful department that
reports to operations, and they have their own P&L from which they pay for reclaim and get
salvage sales. On top of the third-party audits that are shared with manufacturers, Retailer 3 also
conducts its own audits that are sorted by UPC and tracked by causes, and have nine years of
audit data.
Table 2 shows information that is included in two retailer’s unsaleables reports that they
share with manufacturers. The two retailers use the same third-party reclamation center for
processing unsaleables, but the way and extent to which they share data is quite different. If
there was a standard way for data sharing, manufacturers would know which stores need more
focus in the distribution channel. Since there are so many different ways of conveying the same
information, it can be hard to determine unsaleable rates.
Table 2: Retailer 1 and Retailer 3 Reporting Information
Company name Retailer 1 Retailer 3
Type of reporting Annual report YTD report
Length of Information on
report 2 years of information YTD information
Periods 13 periods/year YTD monthly
Type of information quantity and cost quantity and cost
SKU level? Yes or No NO YES
Sub Categories
Processed in reclaim:
Damage review, NDR
Review, Recall Review;
Processed at store: Store
throw to compactor; Vendor
total
UPC, Description of product,
UPC status, Year to date, out
of date, transportation
damage, sales, GM $, cost $,
Unsaleables rate%

63
Table 2 (cont’d)
Vendor Total information
Store sales (mix), Total non-
saleables, Total NDR Value,
Grand total, Actual non-
saleable %
Vendor ID, YTD total reclaim
$, YTD total Sales $, YTD GM
$, YTD total net sales $,
Unsaleable rate %, Swell
payment $, Warehouse
Dump $, YTD total reclaim
Campbell’s $, YTD Swell
payment $, YTD loss/Gain $
Warehouse dump details
Vendor #, vendor name,
UPC, Description, Item, Total
Cases, Total cost, DC, Period,
Reason
Calculations
Total non-saleables = Vendor
Total extended cost - NDR
review extended cost
Cost = sales $ - GM $
Grand total = store sales
(mix) + total non-saleables +
total NDR Value
Unsaleables rate at sku level
% = YTD $ INV/Cost
Actual non-saleables % =
Total non-saleables/Grand
total * 100%
Unsaleables rate total % =
YTD Total reclaim/YTD total
net sales
The retailer with the most granular data is Retailer 2. They have ten reason codes to
which they assign unsaleables: theft, reclaim, corporate/brand damage, mispick, quality damage,
out of date, warehouse returns, item recall, daily donation, and warehouse damage. They are able
to keep data consistent by using fewer reason codes, as well as having a couple well trained
employees handle all the scanning and disposition of unsaleables. Retailer 2 uses internal
reporting to compare stores, and identify manufacturer problems that are discussed during ARP
negotiations. They do not share reason code data directly with manufacturers, but they do
provide the manufacturers real time data as items are scanned at the reclamation center.
Retailers 4 and 5 are smaller independent retailers. They collect unsaleables data, but
lack the resources and power to use the information to their advantage.
64
The information that retailers collect is mostly used as evidence in ARP negotiations with
manufacturers, and to reward or punish certain stores for performance.
4.3 Manufacturer Unsaleables Data
Most manufacturers conduct audits of their own and/or use a third-party provider to
conduct audits. They use audits for personal data collection and in ARP negotiations to assess
retailers’ claims. Some of the audits conducted for manufacturers are performed by third party
providers who also provide reclamation services to the retailers.
The audits conducted on the manufacturer end tends to be in much greater detail with
many more reason codes than retailers use. Manufacturers use as many as 100 reason codes that
are very specific to package type. They go into such detail with reason codes because they want
to narrow down exactly when and where the problem occurred in the supply chain. For example,
manufacturers of bagged dog food has different reason codes for top seal failure and bottom seal
failure. The reason is that one is sealed by the manufacturer and one is sealed by their supplier,
so they can tell if it is a problem with their sealer or the supplier’s.
Most of the audits conducted for manufacturers are done by third-party providers. They
might also receive supplemental data from retailers, but they may mistrust the data for
negotiation of reimbursement rates. Through audits done by third-party providers,
manufacturers can get causal data. So if they realize a certain package is being damaged in the
same way over and over, they can strengthen the package in that area. For example, one
manufacturer was having a high rate of damage on one package. To reduce this damage they
strengthened the package for a certain kind of damage. They thought this would fix the problem,
but through the audits they found the problem was in the seal on the bag. They were able to
strengthen that seal to reduce leaking because of the audit information.

65
Manufacturers receive information on a quarterly basis from retailers, but this
information is mostly used in the negotiation of the reimbursement rate by the retailer. The
information can offer some insight to the manufacturer about which products have a high rate of
unsaleables, but the information is not granular enough to determine what the problem might be.
They can, however, use this information to look further into one of their products.
4.4 Recommended Unsaleables Reporting Format
There is currently no standard way for retailers and manufacturers to track and report
unsaleable data. Each one has a unique set of reason codes and different ways of passing
information between parties. Therefore, it would be beneficial for all parties if they used a
standard Unsaleables Reporting Format (URF) on the SKU level.
A URF would enable retailers to track the impact of package and shelf-life changes,
compare the performance of their stores’ stock rotation and handling operations, and make it
easier for them to compare vendors. The following list of codes are chosen to reduce the
probability of error and keep tracking and information exchange simple.
1. Beyond code date
2. Recall
3. Theft
4. Discontinued product, promotions and launches
5. Seasonal
6. Damage
7. Other
A system like this allows for easy electronic transmission of data, and make it easy to
analyze and calculate the largest contributor to unsaleables. By tracking by SKU, it makes it

66
easy for manufacturers to see the most common failures in package protection so they can
improve packaging changes. This also makes it easy to benchmark industry statistics to work
towards a solution.
4.5 Reason Code Justification
The small number of reason codes are chosen to simplify judgment and sorting. The
seven codes are chosen to make it easy to classify unsaleable types, and give manufacturers and
retailers actionable information. The following describes the stipulations of each code.
1. Beyond-code date: These are items that have exceeded the designated code date assigned by
the manufacturer. Since the code date is visible on the package, it is easy to assess and
determine what to do with the product. Some stores choose to sell these items at a discount a
short time before the code date expires
2. Recall: These items are recalled by either the manufacturer or the government, and are to be
removed because of liability reasons. These need to be tracked to prevent resale on a secondary
market, for customer safety and to allow for testing, detection and prevention.
3. Theft: This is a hard one to track since it is mostly only known about by gaps in inventory.
Sometimes the product is stolen and the package is left behind, making it easier to track. It is
important to track to compare theft problems across retail locations, and to see what products are
more likely to be stolen so proper action can be taken to reduce theft.
4. Discontinued products, promotions and product launches: It is usually a collaborative effort
between the manufacturers and retailers to decide to add or remove a product from the product
portfolio or the store shelves. When the promotion is over, or a product is discontinued, there is
leftover inventory that needs to be removed from the distribution chain.

67
5. Seasonal: Seasonal items have a short window to move product, so proper alignment with
respect to supply and demand is crucial. Good forecasting is important for determining the
proper amount of product to try and move, but there is often product leftover. Depending on the
shelf life of the product, it can be saved for future sale, but it is usually removed from stores and
distribution.
6. Damage: To cut down on mislabeled damage types, it is decided to put all damaged product
under one category. By tracking by SKU, it is easy to determine trends in products that have
damage, and find out what the greatest cause of damage is for that product. It also gives a
performance of package change that is easy to measure in the early stages of the change.
7. Other: This code is assigned to any product that does not fit the description of the previous
codes. An example is a store that has a policy to not put any product returned by customers back
on the store shelves. This product does not fit any of the descriptions above, so it is placed in the
other category.
4.6 Reason Code Assignment, Scanning and EDI Recommendations
Scanning and reason code assignment can occur in two places in the reverse supply
chain; at the retail store, and/or at a reclamation center. Both of these will be discussed next.
4.6.1 In-Store Retail Scanning and Reason Code Assignment
Scanning in the back room of a retail store needs to take place to deduct unsaleable
product from inventory, determine disposition, and assign reason codes. The same employee that
scans the product should be responsible for assigning a reason code. This gives several
advantages: store employees are familiar with store operations and policies regarding reason
codes, and the reason codes can easily be entered into the handheld devise after the product is
scanned.

68
4.6.2 Reclamation Center Scanning and Reason Code Assignment
Product is scanned at reclamation centers for accounting and disposition purposes, and
employees can assign reason codes. The employees at these centers are trained in sorting for
audits, so they have methods for training employees for code determination. Reclamation
centers could go so far as to combine the reclamation data for retailers and the audit data for
manufacturers, thus creating a collaborative information system that could be shared among
parties.
4.6.3 Symbol, Software and Electronic Data Exchange (EDI)
Retailers’ information about unsaleables is currently being shared with manufacturers in
a wide variety of ways, and reporting is done at different periods. Different retailers use
different software programs and methods of tracking unsaleables data making a computer based
data exchange between retailers and manufacturers very difficult. If would require
manufacturers to have all the different software that its retailers use to track data for meaningful
data transfer and sharing. This discontinuity results in data not being transferred in a way that is
actionable and could benefit the whole supply chain.
All retailers are capturing unsaleables data at the SKU level using the UPC barcode, but
what is done with the information varies based on the specific retailer’s corporate goals. The
barcode is an excellent way to track data, but what is done with the information once it is
scanned should be integrated.
One of the main uses of information technology is in the tracking of product in the supply
chain so vendors can evaluate the travel history of the product. The reverse supply chain involves
many operations including: testing and refurbishing at multiple facilities, routing of vehicles

69
between facilities, and scheduling of operations. All these operations need to be tracked and
information technology can be a powerful tool in aiding in these functions. (Kumar 2011)
One application that would help in benefiting the transfer of data between all members of
the supply chain is Electronic Data Exchange (EDI). This system was discussed earlier in the
section on communication technology. The basic idea behind EDI is that it allows for sharing of
business documents between computers using the internet. It can be used for internal or external
use, and can coordinated regardless of the different computer systems that different trading
partners use. EDI would replace paper documents with electronic ones, increasing speed of
transfer of information and reducing the clutter and inconvenience of paper copies.
With current systems of paper transactions, there are many different operations that must
take place: extensive keying in of information, faxing, mailing, express deliveries and other
transactions that can result in errors and high cost. EDI could reduce the manual data entry and
manual transfer of documents, reducing the amount of errors, improve cycle times, and save
money.
The standards for EDI are set and maintained by the Accredited Standards Committee,
ASCX12, which is chartered by the American National Standards Institute. There are currently
over 50 EDI transaction sets for supply chain management, but the transaction set for non-
conformance is currently too general to be applied to unsaleables.
One of the largest hurdles with implementing an EDI system is the amount of initial
startup cost, a personnel increase, and a training period. But once all the initial costs and
inconveniences are over, the system will save time and money in the long run.
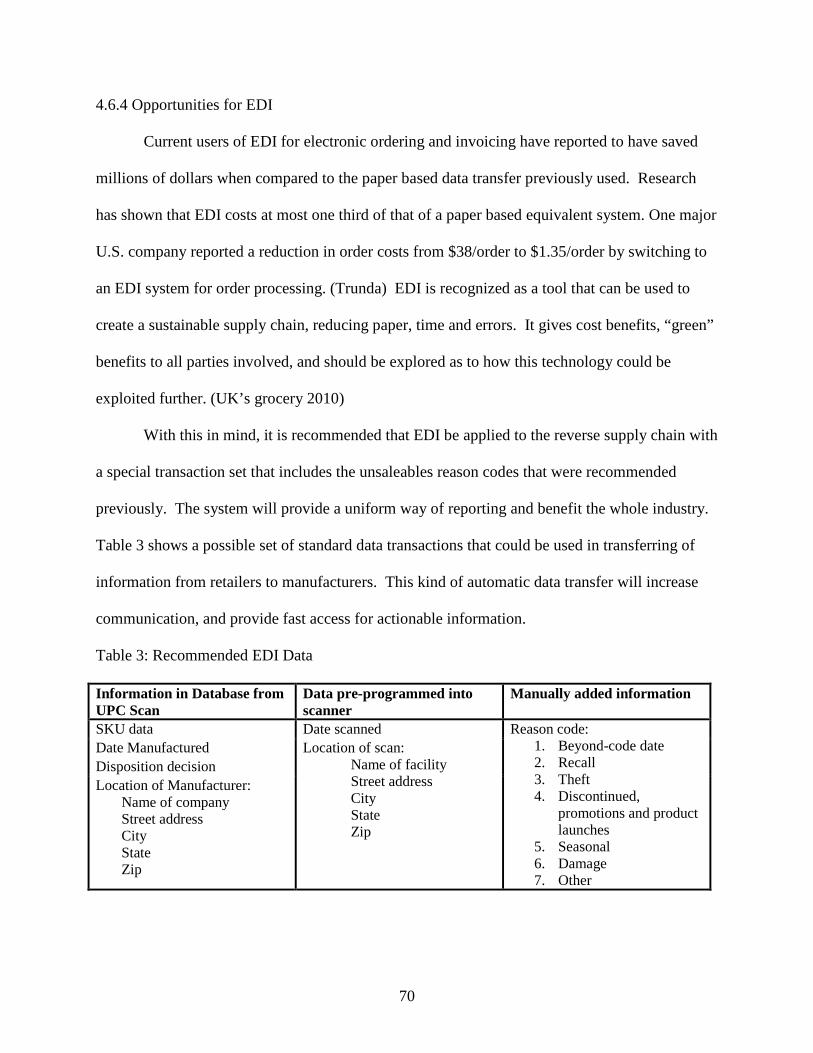
70
4.6.4 Opportunities for EDI
Current users of EDI for electronic ordering and invoicing have reported to have saved
millions of dollars when compared to the paper based data transfer previously used. Research
has shown that EDI costs at most one third of that of a paper based equivalent system. One major
U.S. company reported a reduction in order costs from $38/order to $1.35/order by switching to
an EDI system for order processing. (Trunda) EDI is recognized as a tool that can be used to
create a sustainable supply chain, reducing paper, time and errors. It gives cost benefits, “green”
benefits to all parties involved, and should be explored as to how this technology could be
exploited further. (UK’s grocery 2010)
With this in mind, it is recommended that EDI be applied to the reverse supply chain with
a special transaction set that includes the unsaleables reason codes that were recommended
previously. The system will provide a uniform way of reporting and benefit the whole industry.
Table 3 shows a possible set of standard data transactions that could be used in transferring of
information from retailers to manufacturers. This kind of automatic data transfer will increase
communication, and provide fast access for actionable information.
Table 3: Recommended EDI Data
Information in Database from UPC Scan
Data pre-programmed into scanner
Manually added information
SKU data Date scanned Reason code: 1. Beyond-code date 2. Recall 3. Theft 4. Discontinued,
promotions and product launches
5. Seasonal 6. Damage 7. Other
Date Manufactured Location of scan: Name of facility Street address City State Zip
Disposition decision Location of Manufacturer: Name of company Street address City State Zip

71
4.6.5 Audit Recommendations for Reason Codes and Standard Tests for Different Types of
Damage
With the limited number of unsaleables codes recommended previously, there is an
opportunity for further coding for manufacturer audits. In many instances, manufacturers want
more granular data for audits, in particular with respect to damage. With this being the case,
there is an opportunity for retailers or reclamation centers to assign more specific reason codes
with respect to damage. An example of this data could be classified as (1) crushed or dented, (2)
torn, punctured or cut; (3) all other damage. (FMI/GMA 2006)
In most cases, when manufacturers do audits, they use damage codes that are more
granular and specific for each package type. For example, manufacturers might have a different
reason code for bag closure failure on the top of the bag and the bottom of the bag. The reason is
the bag manufacturer seals the bottom of the bag and they seal the top of the bag after filling.
This specific damage identified by specific codes helps manufacturers and supply chain
specialists analyze and identify the root causes of the failures. Table 4 produces some typical
types of damage. Some of these, like crush, open closure, cut, infested, etc. apply to all package
types. Others are more specific. Examples include, crazing and hazing, which is exclusive to
plastics, and dents and rust, which are exclusive to cans.
Table 4 also presents an attempt to recommend standard test methods to reproduce
specific damage modes. The damage types marked with QC are damage that may not be
determined with standard tests, but can be checked as part of a quality control practice on a
regular basis to ensure package integrity. A big thing relating to unsaleables that is missing from
the table is determining shelf life. Shelf life is one of the largest causes of unsaleable product
and will be discussed in greater detail later. It should also be noted that for a number of damage

72
modes, no standard test is shown. This may indicate a gap in package testing technology, as was
illustrated by the can dent story in the literature review, as well as test development to break
bagged flour and bruise fresh fruit in boxes. (Goff and Twede 1979)
Table 4: Test for Type of Damage to Product
Damage Type Test Code Description of Test All packages
Crush ASTM D642
Test Method for Determining Compressive
Resistance of Shipping Containers,
Components, and Unit Loads
TAPPI 804
Compression test for fiberboard shipping
containers
Open closure ASTM D2063/D2063M
Standard Test Methods for Measurement of
Torque Retention for Packages with
Continuous Thread Closures Using Non-
Automated (Manual) Torque Testing
Equipment
Improperly sealed ASTM F2391
Standard Test Method for Measuring Package
and Seal Integrity Using Helium as the Tracer
Gas
Top/middle/bottom location
Cut
Leaking
ASTM D3078
Determination of Leaks in Flexible Packaging
by Bubble Emission
ASTM D5094
Gross Leakage of liquids from Containers with
Threaded or Lug-Style Closures
ASTM D4991
Leakage Testing of Empty Rigid Containers by
Vacuum Method
Infestation
Unlabeled or mislabeled QC
Over/short weight or partially filled QC
Crushed, dented or collapsed ASTM D6537
Standard Practice for Instrumented Package
Shock Testing For Determination of Package
Performance
Soiled, stained, sticky, etc.
Misprinted code date QC

73
Table 4 (cont’d)
Labels
Coming off ASTM D5252/D6252M
Standard Test Method for Peel Adhesion of
Pressure-Sensitive Label Stocks at a 90° Angle
Scuffing ASTM D5264
Standard Practice for Abrasion Resistance of
Printed Materials by the Sutherland Rub
Tester
Bad print QC
Off-center QC
Cans
Dent,
Middle or near chime location
Swells
Rust
Cartons
Cut-open ASTM D5330/D5330M
Standard Specification for Pressure-Sensitive
Tape for Packaging, Filament-Reinforced
Compression: clamp vs top-to-bottom vs corner
ASTM D642
Determining Compressive Resistance of
Shipping Containers, Components, and Unit
Loads
ASTM D7030
Standard Test Method for Short Term Creep
Performance of Corrugated Fiberboard
Containers Under Constant Load Using a
Compression Test Machine
ASTM D4577
Standard Test Method for Compression
Resistance of a Container Under Constant
Load
ISTA 4AB Enhanced Simulation performance Test
ISTA 2A
Packaged-Products Weighing 150 lbs. or less,
Partial Simulation Performance Test
ISTA 1A
Packaged-Products Weighing 150 lbs. or less,
Partial Simulation Performance Test
ISTA 3A
Packaged-Products Weighing 150 lbs. or less,
for Parcel Delivery System Shipment, General
Simulation Performance Test

74
Table 4 (cont’d)
Compression: clamp vs top-to-bottom vs corner (cont’d)
ISTA 2B
Packaged-Products Weighing Over 150 lbs.,
Partial-Simulation Performance Test
ISTA 1B
Packaged-Products Weighing Over 150 lbs.,
Non-Simulation Integrity Performance Test
ISTA 3E
Unitized Loads of Same Product, General
Simulation Performance Test
TAPPI 802 OM Drop test for fiberboard shipping containers
TAPPI 803 Puncture test of container board
TAPPI 804
Compression test for fiberboard shipping
containers
Bags
Torn
Burst ASTM D5487
Standard Test Method for Simulated Drop of
Loaded Containers by Shock Machines
Pouches
Torn ASTM F1278
Standard Guide for Use and Handling of
Flexible Retort Food Pouches in the
Processing Environment
Plastic bottles
Crazing, hazing ASTM F791
Standard Test Method for Stress Crazing of
Transparent Plastics
Stress-crack ASTM D5419
Standard Test Method for Environmental
Stress Crack Resistance (ESCR) of Threaded
Plastic Closures
Leaking closure ASTM D2911
Standard Specification for Dimensions and
Tolerances for Plastic Bottles
Missing closure or induction seal QC
Tamper-evident features breached
Fresh produce
Bruising
Rotten
Infestation

75
Table 4 (cont’d)
Glass bottles
Broken ASTM C149
Standard Test Method for Thermal Shock
Resistance of Glass Containers
Clear causes
Pallet overhang
Rail switching damage ASTM D5277
Standard Test Method for Performing
Programmed Horizontal Impacts Using an
Inclined Impact Tester
Obviously it would be very time consuming and expensive to apply testing of this nature
to all products a manufacturer produces. This is where the accurate and granular collection of
unsaleables data can become utilized. A product that is suffering from the same type of damage
over and over can be subject to a specific test that will determine the weak points of the package
where improvement is needed, and relative performance of alternatives.
For example, with less granular data, it might be realize that water bottle flats are
becoming unsaleable. Okay, but what is making them unsaleable? Maybe go so far as to say
they are unsaleables because of damaged. Okay but what is the damage? Is it crushed? Leaking?
Are they not full? Is there a puncture? The more granular the data about where the damage
occurs on the package, the more likely the proper test is administered. So it is realized there is
high damage on water bottles. Drop tests, vibration tests, vacuum tests and crush tests are then
administered to see which one yields the most damage or is the weakest point and adjust the
packaging based on the results. This could be a huge waste of time and money, especially if the
weakest point is not even where the product is failing.
Granular data, such as the product is unsaleable because the bottle is crushed, allows for
the knowledge to run a compression test to see if the product can handle the force of the

76
distribution channel. With this granular data, it is possible to avoid over spending and increase
product integrity.
Also, the moment a package becomes damaged is very important. Going back to the
water bottle example, a test might be run on the water bottle for the distribution channels from
manufacturer to retailer and the crush damage is well within the threshold of what is expected in
that distribution channel. But product is still coming back unsaleable for crush damage. Without
knowing that the damage was actually occurring in transit from the retailer distribution center to
the retailer store, money is being wasted testing the conditions of the manufacturer distribution
channels when that is not the problem.
4.7 Shelf-life
The research found that one of the most common reasons a product becomes unsaleable
is that the sell-by, use-by, or best-by date that is clearly readable by consumers on the package
has expired. Open code dating was something that was pushed by Walmart in 2004 and quickly
picked up by most manufacturers. Walmart demanded that all of their suppliers put an expiration
date on the package, or they would not be able to sell their products in Walmart stores. This
quickly translated to all grocery chains as customers demanded it and manufacturers found it
easier to put code dates on all products rather than just product going to Walmart. Many
companies already had code dates on product prior to this push, but did not have code dates on
all products, or used a “closed” code date that could not be decoded by consumers.
The result of this push for open code dating is that there are many different definitions for
the date, and a non-uniform determination of what the code should be. Many manufacturers put
a code date on the product that expires far before the product is truly unsaleable. Reasons for
this may be to prevent the spoilage before the code date expires. Or, in the case of cereal, the

77
product may become a little stale, but is not a safety issue. But manufacturers do not want to sell
product that is less than their high quality, so they make sure to put a date on the box that will
expire far before the product goes bad. This type of code dating takes the blame off of the
manufacturer, while forcing many retailers to reject product resulting in edible product that is
“expired” in the reverse supply chain. Some products can even be good years after the code date
expires. An example is vinegar. Before open-code dating, vinegar had a shelf-life of seven
years. The date on vinegar now is about one years. There is even a joke about vinegar among
many people in the field. What is going to happen to vinegar after one year? Will it turn to
vinegar?
4.7.1 Ship-life
The standard ship-life of grocery products is 90 days. That means the manufacturer can
hold the product to within 90 days of the expiration date before shipping the product to the
retailer’s DC. This gives very little time for the retailer to ship the product to the individual
retailers, and get the product on store shelves and sold before the product expires. One retailer
that was interviewed said that 38% of their dry goods become unsaleable because of expiration,
and the number is even higher for refrigerated goods. This high number of expired goods was
attributed to the short ship-life of the product.
For the reasons stated above, it is recommended that the ship-life of the product be
increased. This will give retailers a better opportunity to cycle through product in a FIFO
management style, instead of trying to have to search for the product that is closest to expiring
and getting it on the shelves as soon as possible. The problems with stock rotation will vary
from one retailer and retail location to the next.
78
4.7.2 Shelf-life Estimation Testing
Shelf-life estimation should be based on scientific research for each product and package
type. Different package types experience different types of degradation throughout their life, and
provide varying degrees and types of protection. When choosing a package type for a product, it
is important to consider what type of protection is most important in protecting the product.
There are five basic package materials that are used to protect product: plastics, metal
(aluminum and steel), paper, glass, and wood. Each of these package materials experience a
different type of degradation and have a limited amount of time they will protect the product
based on the storing and shipping environment. Packages will undergo several different kinds of
degradation including: oxidation, chemical, thermal, mechanical, UV and biodegradation.
Degradation does not affect packages in one way, but is a combination of several different kinds
of degradation. (Selke 2013)
Plastics can be affected by all degradation types and the degree to which the plastic is
affected depends on the chemical makeup of the polymer, the processing history, additives, and
other contaminants. This can lead to leaching of product into the package, migration of plastic
into the product, and permeation of chemicals through the package from outside environments
into the product. It can also cause weakness in the package, decreasing the amount of weight it
can handle. This can cause spoilage of the product, off flavors and quality loss. (Selke 2013)
Metals have problems with corrosion due to oxidation and chemical product interactions.
This can be reduced by the use of coatings and laminates. This can result in oxidation of the
product which will result in spoilage or a loss in product quality. (Selke 2013) Dents are also a
problem for metals. It will not necessarily make the product spoil faster, but it does make the
product unappealing to consumers. This can result in expired product in the reverse supply chain

79
When it comes to glass, the biggest problem with protection is in protecting against UV
radiation. Without the use of additives like UV inhibitors, clear glass will let UV light into the
package that can cause off flavors and spoilage in many products. (Harte 2014)
Paper and wood will undergo similar types of degradation because they are made of the
same base material. Moisture absorption into the package can occur, which can cause an
increase in moisture in the product causing spoilage. With paper and wood, small insects can be
an issue resulting in infestation. When this occurs the product must be disposed of and cannot be
salvaged. (Selke 2013)
With all these different factors that can affect the package, which ultimately results in
quality loss, it is important to determine which package is best for the product, and how long the
product is still edible with acceptable quality. The use of active packaging can reduce quality
loss by absorbing deteriorative elements before it can reach the product. These can include:
oxygen absorbers, desiccants, carbon dioxide absorbers or emitters, ethylene absorbers,
antimicrobials, UV light absorbers and antioxidants. This can reduce degradation and extend
product shelf life. (Harte 2014)
When testing for shelf-life for consumer goods, it is recommended that ASTM E2454
“Standard Guide for Sensory Evaluation Methods to Determine the Sensory Shelf Life of
Consumer Products” be used. (ASTM 2014) This test standard goes through the process
necessary to determine the shelf-life of a product based on sensory changes of the product. This
can include texture, taste and flavor. It does not necessarily mean the product is unsafe for
consumption, it might because these signs can be a sign of spoilage, but it means the product is
less than quality. (ASTM 2014)
80
When determining shelf-life, it is important to define shelf-life more precisely. It can be
defined as either minimum durability or technical shelf-life. Minimum durability is amount of
time under normal storage conditions that the product is still marketable, and the product can still
be good after this time. Technical shelf-life is the period of time under normal storage
conditions that the product can no longer be consumed. (Coles and Kirwan 2011)
4.7.3 Standardized Expression of Shelf-life
Most manufacturers already have a way of determining the usable life of the product,
depending on product type, and packaging usage. The problem is manufacturers are setting the
code dates so far before product expires, it is hard to get all the product sold before that date goes
bad. So this section will cover a way to standardize the definition of shelf-life.
There are many benefits to open code dating. Including easy recognition of expired
product, ensuring customers that product is still good, and customers knowing when they should
dispose of product that might make them sick. So the big question is, what should the code date
standard be? Should it be best-by, sell-by or use-by? There are benefits of each. A sell-by date
would allow for easy recognition by the retailer of when they should no longer sell product. A
use-by date would offer customers a definitive date where product should no longer be
consumed. A best-by date gives more of a suggestion of when to get rid of product, but it gives
customers an option to consume product after the date expires at their own discretion.
Sell-by dates do not offer any benefit to the customer. The customer might know if it is a
good idea to buy the product, but how long after the product is bought is it still good? Since one
of the main purposes of open code dating is to help the customer, it is recommended that a sell-
by date be used on the shipping container, but not the product.

81
When choosing between best-by and use-by dates for product, the Ministry for Primary
Industries in New Zealand gives good guidance when making the decision. If the product is
meant to provide the consumer the sole source of nutrition for a specific period, and there is a
potential loss of nutrition for that time period, then a use-by date should be used. A use-by date
should also be used if the pathogenic microorganisms in the product exceed safe level and the
food can become poisonous if consumed. (MPI 2012)
A best-by date should only be used when the product can retain its sensory, chemical,
physical and microbiological characteristics to quality, and when the shelf-life is under two
years. (MPI 2012).
4.8 Unsaleables as a Collaborative Effort
This research found that there is a serious distrust between manufacturers and retailers on
the topic of unsaleables. Manufacturers do not trust retailers’ unsaleables data, so they conduct
their own audits. Retailers don’t trust manufacturers to be fair in ARP negotiations, so they have
to collect their own data to fight for a fair rate. This might not be a product of general business
distrust, but a product of the history of the way this part of the industry was handled. In previous
years, negotiations generally occur on a periodic bases with very little sharing of information
between meetings. Both sides collect their data and fight for the upper hand in negotiations to
receive what they believe to be a fair rate. This might work to determine a rate of
reimbursement, but it does not help build a trust between trading partners and can leave one side
feeling cheated. This can turn into resentment, driving the business partners further apart until
there is no communication unless absolutely necessary, hence the no sharing of data until it is
time for rate negotiations.

82
Recommendations focus on ways to better communicate and share data. If partners start
to share data more completely and openly without being so secretive, it will not only help reduce
total unsaleables, but could also improve the relationships between business partners. This could
create a more open relationship where frequent sharing of information can result in a
collaborative and active effort to reduce unsaleables on both sides. One of the easiest ways to
start this open sharing of data is with the implementation of an EDI program as discussed in
previous sections. This, in collaboration with granular unsaleables data, will allow both sides to
see what the other is doing and where they are getting their information for negotiations. A
collaborative effort to reduce unsaleables on both sides will be more beneficial than each side
making a case to present to the other to try to grab a bigger slice.
One of the manufacturers interviewed goes so far as to apply a quality control system to
distribution. The information they gather in their audits is shared with the retailers so they can
improve upon their system, as well as use the information internally to rate packaging lines and
teams. This is the kind of collaborative effort that should be modeled when it comes to
unsaleables management. A full sharing of data to improve the whole system can go a long way
in unsaleables reduction.

83
CHAPTER FIVE: CONCLUSION
Unsaleables is an area that most companies do not consider as a source of profit. But
unsaleables should be on the forefront of upper management’s mind as an opportunity for
strategic advantage rather than with as the problem comes along without much thought from
upper management. There needs to be a department dedicated to reducing unsaleables as it can
be seen as a valuable opportunity rather than an inevitable problem.
Gathering and, more importantly, sharing of information among trading partners is very
important to the health of a company’s unsaleables initiative. Unsaleables management should
be more than just a bidding war to reduce rates. It should be a collaborative effort of information
gathering and sharing, and cross-functional involvement to find root causes of problems.
Proper data collection and sharing can lead to the right packaging tests and changes that
are necessary to fix root causes. It will reduce unnecessary spending on tests that do not need to
be done, and give information needed to test package performance in the correct way.
Shelf-life should be based on science and standardized to reduce the incidence of
consumer confusion, and along with reducing good product in the reverse supply chain. Audit
information can reveal shelf-life problems that can be adjusted to reduce the incidence of out of
date product.
Sharing and collaboration, along with proactive practices, will go a long way in reducing
unsaleables cost. Unsaleables should be more than a bidding war for the lowest possible price,
and a systems approach to unsaleables management should be the focus of a healthy relationship
and unsaleables practice.

84
REFERENCES

85
REFERENCES
American Society for Testing and Materials. 2014. ASTM Standards (updated annually). West Conshohocken, PA : ASTM International
Bowersox, Donald J., David J. Closs and M. Bixby Cooper. 2010. Supply Chain Logistics
Management. McGraw-Hill/Irwin.
Bracken, Jim, Mike Mowad and Victor Bell. 2013 “The Sustainable Packaging Coalition July Open
Forum: GS1 Standards for the Global Protocol on Packaging Sustainability(GPPS)”.
Presentation, webinar. July 15.
Clarke, Robb. 2011. “Packaging RFID For The Real World”. Lecture. Packaging 444 from
Michigan State University, East Lansing, MI, Fall Semester
Connolly, Kate Bertrand. 2009. “Sustainable Packaging: How Green It Grows”. Brand Packaging.
April. Pg. 6-14
Coles, Richard and Mark Kirwan. 2011. Food and Beverage Packaging Technology: Second
Edition. The Atrium, Southern Gate, Chichester, West Sussex, UK. Blackwell Publishing
Ltd.
Egan, Tom. 2012. “Sustainable Packaging in the Fridge and Freezer”. Refrigerated &Frozen
Foods. PMMI. November. Pg. 22-25. www.RFFmag.com
FMI/GMA. 1990. Product Reclamation Centers: A Joint Industry Report. Prepared by Willard
Bishop Consulting Ltd., with sponsorship also by NACDS, NGA, Food Distributors
International and NFBA. Washington, DC: FMI.
http://www.gmaonline.org/downloads/research-and-reports/productrecl.pdf
FMI/GMA. 2005a. Improving Unsaleables Management Business Practices – Joint Industry
Recommendations. Washington, DC: FMI and GMA.
http://www.gmaonline.org/downloads/research-and-
reports/UnsaleablesManagementPracticesReport.pdf
FMI/GMA. 2005a. 2005 Unsaleables Benchmark Report. Prepared by Raftery Resource
Network Washington, DC: FMI and GMA.
http://www.gmaonline.org/downloads/research-and-
reports/2005UnsaleablesBenchmark.pdf
86
FMI/GMA. 2006. 2006 Unsaleables Benchmark Report. Prepared by Raferty Resource Network.
Washington, DC: FMI and GMA. http://www.gmaonline.org/downloads/research-and-
reports/2006UnsaleablesBenchmarkFinal.pdf
FMI/GMA. 2008. 2008 Joint Industry Unsaleables Report: The Real Causes and Actionable
Solutions. Prepared by Deloitte. Washington, DC: GMA and Deloitte.
http://www.gmaonline.org/downloads/research-and-
reports/UnsaleablesFINAL091108.pdf
FMI. 2012. “A Study of Unsaleables: State of ARP 2012”. Prepared by Strategic Global
Connections LLC. Washington, DC: FMI and Strategic Global Connections.
Goff, James and Diana Twede. 1979. Boxes, Bags and Cans: Performance of Packages for the Transportation of Agricultural Products, School of Packaging Special Report No. 14. East Lansing, MI: Michigan State University School of Packaging.
Greve, Curtis and Jerry Davis. 2012. “Warehousing Forum: An Executive’s Guide to Reverse
Logistics”. The Ackerman Company. Volume 27, Number 9. August.
GS1 UK. 2010. UK’s Grocery Sector Saves £650 Million a Year by Automating Business
Transactions in the Supply Chain. London, UK: GS1 UK.
Harte, Bruce. 2014. “Food Packaging PKG 485”. Class lecture, Packaging Development from
Michigan State University, East Lansing, MI. June 1.
Hazen, Benjamin T., Dianne J. Hall, and Joe B. Hanna. 2011. “Reverse logistics disposition
decision-making: Developing a decision framework via content analysis”. Emerald Group
Publishing Limited. International Journal of Physical Distribution & Logistics
Management. Vol. 42, No. 2 October 24. Pg. 248-250, 258-259
International Safe Transit Association. 2012. ISTA Test Protocols, updated periodically. East
Lansing, MI: ISTA. http://www.ista.org/pages/procedures/ista-protocols.php
Karolefski, John. 2007. “Cracking Down On Unsaleables”. Food Logistics. Cygnus Business
Media. Fort Atkinson, United States. Jan/Feb. Pg.2 -6
Koss, John Peter. 2009. “Lightweighting: Pros & Cons”. Beverage World. January 15. Pg. 60
Krumwiede, Dennis W., and Chwen Sheu. 2002.”A Model for Reverse Logistics Entry by Third-
Party Providers”. Elsevier Science Publishers. October. Pg. 325 – 327

87
Kumar, Nandan, Arnab Chatterjee. 2011. “Reverse Supply Chain: Completing the Supply Chain
Loop” Cognizant 20-20 insights. Cognizant. 500 Frank W. Burr Blvd., Teaneck, NJ.
January.
Meade, Laura and Joseph Sarkis. 2002. “A Conceptual Model for Selecting and Evaluating Third-
Party Reverse Logistics Providers”. Supply Chain Management: An International Journal.
Volume 7, Number 5. Pg. 283 – 295
Ministry for Primary Industries (MPI). 2012. “How to Determine the Shelf-life and Date Marking
of Food: A Draft Guidance Document”. Crown Copyright. Wellington, New Zeland.
Rogers, Dale S., et.al. 2002. “The Returns Management Process”. The International Journal of
Logistics Management. Volume 13, Number 2. Pg. 3-4
Rogers, Dr. Dale S., and Dr. Ronald S. Tibben-Lembke. 1998. “Going Backwards: Reverse
Logistics Trends and Practices”. Reverse Logistics Executive Council. University of
Nevada, Reno. Center for Logistics Management. Pg. 2
Selke, Susan. 2013. Topics include packaging degradation and recycling. Class lecture,
Sustainability and Recycling Packaging Materials from Michigan State University, East
Lansing, MI, Fall semester.
Skinner, Lauren R., Paul T. Bryant and R. Glenn Richey. 2008. “Special Issue Paper: Examining
the impact of reverse logistics disposition strategies”. International Journal of Physical
Distribution & Logistics Management. Emerald Group Publishing Limited. Volume 38 No.
7. Pg. 518-539.
Technical Association of the Pulp and Paper Industry. 2009. TAPPI Standards. Updated
periodically. 15 Technology Parkway South, Norcross, GA. www.tappi.org
Tibben-Lembke, Ronald S. and Dale S. Rogers. 2002.“Differences between forward and reverse
logistics in a retail environment”. Supply Chain Management: An International Journal.
Volume 7, Number 5. Pg. 271 – 282
Trunda, Tom, and Falk Von Westarp. “EDI Solutions in Large Companies – A Case Study with
3Com.” EDI solutions in Large Companies – A Case Study with 3Com. 3Com, n.d. Web
http:/www.is-
frankfurt.de/fileadmin/user_upload/publicationsNew/EDIsolutionsinlargecompaniesA.h
tm

88
Twede, Diana, Judith Whipple, Robb Clarke and Tom Sanders. 2014. “Unsaleables are
Unsustainable: Developing an Appetite for Reducing Unsaleables”. East Lansing,
Michigan State University. Publication pending by FMI.