tracking the use, uptake and conditions for … the use, uptake and conditions for sustainability of...
TRANSCRIPT

Tracking the Use, Uptake and Conditions for sustainability of Communication products
R8400 - Annex C
James K. Ndufa1, Pascal C. Sanginga2 Quareish Noordin3 and Sarah Kayanga4
1Kenya Forestry Research Institute, Maseno, Kenya
2International Centre for Tropical Agriculture, Kampala, Uganda
3 World Agroforestry Centre, Kisumu, Kenya
4Uganda National Farmers Federation, Kampala, Uganda
This publication is an output from a project R8400 funded by the UK Department for International Development (DFID) for the benefit of developing countries. The views expressed are not necessarily those of DFID.
December 2005
Table of content
Table of content ........................................................................... IIList of Tables .............................................................................. IIIList of Figures.............................................................................. III1. Introduction.............................................................................. 12. Methodology ............................................................................. 23. Results and Discussion ................................................................. 3
3.1. Distribution of communication materials ................................... 33.2. Profile of target institutions................................................... 73.3. . Use and Usefulness of communication products ........................113.4. Stakeholders’ assessment of the Usefulness of the communicationproducts..................................................................................123.5. Uptake promotion of the products ..........................................193.6. Expected impact on use of products ........................................203.7. Conditions for Sustainability of products...................................21
4. Lessons learnt and Recommendations..............................................215. Conclusions .............................................................................24Appendix 1: Tracking the use of communication products .........................25
II

List of TablesTable 1: Number of institutions tracked by category ................................ 3Table 2: Distribution of different communication products .............................. 4Table 3: Profile of Target institutions for uptake promotion of communication
products ................................................................................ 9Table 4: Number of institutions that have read used and found product useful11
List of FiguresFigure 1: A map showing distribution of communication products in Uganda.... 5Figure 2: COSOFAP mandate area, partners and coverage .......................... 6
III

1. Introduction
Over the years, a number of research products under the Natural Resources SystemsProgramme in Eastern Africa have been and continue to be generated. However, theuptake and utilisation of research results and products has been limited. Against this background a project titled “Advancing the Use of the Products of NRM ResearchProjects in Eastern Africa” was initiated by NRSP previous projects in Uganda andKenya. The project aimed at developing and encouraging a more efficient, proactiveand sustainable communication strategies for the uptake promotion of research products from four NRSP supported projects in Kenya and Uganda. The projectdeveloped a total of 11 communication products on various aspects of naturalresources management (See Annex B).
It was hypothesized that promotion of communication products will create moreawareness, knowledge and capacity among selected target institutions, which willenable them to accelerate adoption and impacts of improved NRM technologies andinnovations by small- scale farmers. To test these hypotheses, an end of project evaluation sought to investigate, monitor and evaluate the process and the effectiveness of alternative communication and uptake promotion strategies within the context of Uganda and Kenya. The study aimed to answer several researchquestions, including:
What are the communication needs and expectations of the differentstakeholders? What products are needed by what stakeholders, and in whatformat? What are the effective mechanisms for engaging with the stakeholders,building consensus and defining their interests, priorities, and participationstrategies in the UP plan? How do we reach the marginalized groups, especially women and the rural poor?How effective are the different promotional materials and delivery processesfor different target groups, e.g. resource poor farmers, developmentorganizations, policy makers, donor organizations? Are there significant differences in the uptake of technology-based NRM products, and process-based research products?What would be alternative communication strategies to achieve greater impactand uptake of technology and process research products What are the necessary conditions for effective use and promotion of NRMresearch products?What lessons can we learn from the UP experience? What are the constraints,challenges and opportunities for sustainability of the UP plan? What experiences do we learn from the Consortium approach?
This report results from a tracking survey of the distribution, use and potential uptakeof communication products to a variety of stakeholders and target institutions, andattempts to provide answers to these questions. Although still preliminary, the reportbrings out the key issues and stakeholder assessment of the usefulness of the different
1

products, and strategies for promoting their uptake and sustainability. The rest of the report is divided in three main sections. Section 2 describes the methodology of thesurvey, target institutions and content of the checklist. Section 3 presents the results of the study by profiling the target institutions and analysing the distribution of the products. It then investigates stakeholders’ perception of the usefulness of the different products and modifications that need to be made to make the products moreuseful to the end users. The sections that follow examine uptake promotionpathways, the expected impacts of the different products, and the conditions for sustainability. The concluding section of the report presents a set of lessons and recommendations that can be derived from this study.
2. Methodology
From a methodological point of view, it is important to note that a key limitation of this report relates to timing of the tracking survey. At the inception of the project, itwas expected that the monitoring and evaluation component would be conducted atleast three months after distribution of the products when most people would haveused the products. However due to different factors, particularly underestimation ofthe time necessary to develop, review, pre-test, adapt, produce and disseminatecommunication materials, the tracking study was only possible only three to four weeks, and in some cases two weeks, after distribution of the different products. Thismeant that the exercise was done when a number of target institutions had not hadtime and opportunities to use the products in real field situations. Secondly, thetracking study was conducted towards the end of the year when many TI are preparingannual reports, attending meetings and are involved in different activities, includingpolitical campaigns. In some cases, the target institutions had closed for Christmasholiday. Finally, the survey could only last a few days to allow time for report writingand analysis of the results before the end of the year.
In Uganda a total of 24 target institutions were surveyed in eight districts in eastern,central and south-western Uganda. These included districts that were involved in thedifferent projects (Kapchorwa, Mbale, and Kabale) as well as other districts whereproducts were distributed (Kampala, Mbale, Sironko, Pallisa, Kisoro) as shown in Figure1. In Kenya a subjective sample of 44 target institutions was selected from the originalpopulation of target institutions that got the communication products. The samplingwas based on the type of organisation, geographical coverage. The target institutionswere surveyed in 14 districts were covered. These included districts that wereinvolved in different projects (Siaya, Vihiga, Kericho and Busia) as well as otherdistricts where products were distributed (Kisumu, Bondo, Teso, Kisii, Homabay,Migori, Kakamega, Nyando, Butere/Mumias and Rachuonyo) as shown in Figure 2. Theconvenience sample included government agriculture departments, NGOs, CBOs andprivate sectors that are agricultural related. A key factor in determining sample sizewas the evidence that the organisation has received the communication products.
2

Table 1: Number of institutions tracked by category
Category of institution Uganda Kenya
Non-government organizations 7 12Government agricultural departments 6 6Community based organization 7Farmer associations/organizations 4 10Private 5 3Research Institution 2 4Policy makers 2Total 24 44
Representatives of these institutions were interviewed face-to-face by the using asimple checklist on the following key aspects:
1) Profile of target institution
2) Distribution and use of different products
3) Stakeholders’ perceptions of usefulness of different communication products
4) Assessment of different products in terms of clarity and utility
5) Needs for modification of different products
6) Institutional communication and information sharing mechanisms
7) Changes to be made in the products and the communication strategy
8) Uptake promotion pathways9) Conditions for sustainability of uptake of communication products10) Stakeholders’ Perceptions of potential Impacts
Data analysis is still descriptive at this stage given time constraints. Information istabulated, and the main lessons and conclusions are highlighted.
3. Results and Discussion
3.1. Distribution of communication materials
The distribution of products followed the stakeholder analysis conducted in Phase A, and subsequent workshops where stakeholders were consulted on their communicationneeds. Table 2 below shows the production and distribution of different products. The target institutions that received the products were also supposed to distribute them to the end users, particularly field staff and farmers organizations/groups. However thedistribution to the users was further marred by the fact that the products were few.
3

For example with the exception farmer associations/organization there was no farmergroup that received the products.
Table 2: Distribution of different communication products
Product Characteristics
Numberof copies
Number of institutionsUganda Kenya
01. You are loosing your soil Poster 500 24 8602. Bridging research and
development in soil fertilitymanagement
Handbook(63pp)
500 24 84
03. The power of visioning Handbook(134pp)
500 24 84
04. A guide to SCOBICS Handbook(32pp)
1000 24 86
05. DSS for better landmanagement
Poster 1000 24 86
06. DSS for striga management andcontrol
Poster 1000 24 86
07. Integrated striga controlstrategies for increased cropyield and soil fertility
Poster 1000 24 86
08.Improve soil fertility/foodsecurity/income generation:Plant dual purpose soybean
Poster 1000 24 86
09. DSS for nutrients deficiency diagnosis and corrective measures
Poster 1000 24 86
010. Type for improved fallow species suitable for soilfertility improvement
Poster 1000 24 86
011. Improve soil fertility andincrease crop yields usingfertilizer trees
Poster 1000 24 86
An important observation is that the Kenya component produced a total of eightproducts (4-11), and more copies (1000) per product, compared to Uganda component,which had three products (1-3) with 500 copies each. However, there wereconsiderable differences in the process of producing and distributing the products, as well as in the quality, content and audience of the products. . The Uganda productsare meant to relatively professional audience, and in some cases to developmentprofessional with minimum higher education levels whereas the Kenya products meant to cut across the information divide between the professional audience, the community service providers and the farmers on the ground. The relatively higher quality (paper quality, photographs, and graphics) and length of products in Uganda,as per recommendation from reviewers and pre-testing meant that production cost was higher and therefore limited number of copies.
4
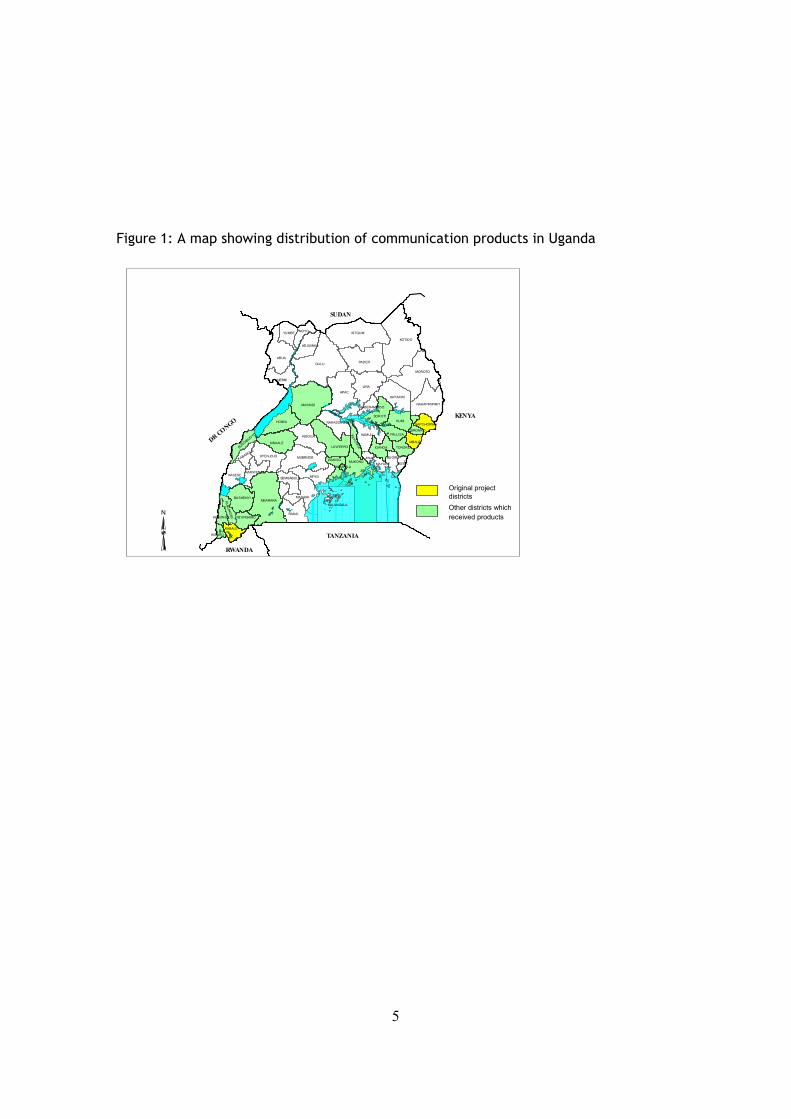
Figure 1: A map showing distribution of communication products in Uganda
GULU
KOTIDO
LIRA
MUKONO
KITGUM
APAC
MASINDI
MBARARA
PADERARUA
MOROTO
HOIMA
BUGIRI
RAKAI
KALANGALA
MPIGI
MUBENDE
KAMULI
KUMI
MASAKA
LUWEERO
KATAKWI
MAYUGE
KIBOGA
KIBAALE
NEBBI
SOROTI
KASESE
BUSHENYI
NAKAPIRIPIRIT
KYENJOJOWAKISO
YUMBE
IGANGA
MOYO
ADJUMANI
PALLISA
NAKASONGOLA
KABALE
TORORO
MBALE
KAMWENGE
SEMBABULE
NTUNGAMO
KAYUNG
A
KABAROLEBUNDIBUGYO
RUKU
NG
IRI
JINJA
KAPCHORWA
KANUNGU
BUSIA
SIRONKO
KABERAMAIDO
KISORO
KAMPALA
N
SUDAN
KENYA
DRCONGO
RWANDA
TANZANIA
Original projectdistrictsOther districts whichreceived products
5

Figure 2: COSOFAP mandate area, partners and coverage
The distribution process was also different. In Kenya there was already an existingConsortium for Scaling Up Options for Increased Farm Productivity in westernKenya (COSOFAP) through which it was relatively easy to reach the target institutions,which were also able to reach more end users. Product distribution in Uganda wasdone directly to a number of target institutions. It is important to note that “ThePower of Visioning” Handbook was distributed to other institutions in Uganda,Ethiopia, Malawi, Kenya, Tanzania and Colombia where both AHI and CIAT haveongoing partnerships and collaboration with a number of institutions. The Handbookwill also be posted to both CIAT Africa and AHI website to allow greater access.
Assessing the most effective way of distributing communication products, comparingthe two approaches, remains a research challenge. In both Kenya and Uganda therewere differences in institutional set up and arrangements for communication. In somecases, communication is centralized, whereby the Head Office or Project Manager would be the central place to deposit information which is then shared to field offices
6

and staff according to their responsibilities and work plans. It is argued that this willensure that the products are considered as organization property, and the linemanagers will ensure their proper distribution to and use by field staff. Field staff willbe in the obligation to use the products as part of their work, and provide feedback to the project manager or unit. More people and staff in the organization can then usethe products, rather than being considered as individual properties kept in officedrawers or people’s homes.
However, we also found that in a number of cases, there was no evidence thatproducts delivered to the Head office will eventually reached the end users or fieldstaff. In many cases they ended up in the office shelves, some times still in the formof their delivery. In this case, more proactive strategies were necessary to reach field staff. The challenge is to assess organizational culture and information sharingmechanisms of different target institutions and before distribution to determine the most effective ways of distributing products.
3.2. Profile of target institutions
Results of stakeholder analysis and subsequent stakeholders workshops carried out inStage A revealed a range of target institutions for uptake promotion of NRSP products in Uganda and Kenya. However, given the time constraint, our M&E focused on sevencategories of the target institutions based on their role and participation in the promotion and use of communication materials. These are:
Local, national and international NGOsResearch organizations Government departments of agriculture, environment and planningPolicy makers in local and national levelPrivate sectorFarmer association/organizationCommunity based organization
It is important to note that in Uganda the ultimate beneficiaries of small-scale farmerswere not included in the sample because it was clear that they had not had access to the products, and had not had opportunities to use them. Only in a few cases, the products had reached farmers. Evaluating the use and impacts of these products atfarm level at this time would not provide meaningful results.
In total, twenty-four organizations were interviewed in Uganda. These are diverse bytheir coverage, number of years of activities, number of technical field staff, estimated number of their beneficiaries and type of activities. Many of these organizations have national coverage, operating in several districts in the country, orregion of the country. As shown in Table 3 Some institutions such as the Uganda National Farmer Federation have national coverage, reaching over 200000 of farmersthrough 73 members’ organisations representing several farmers groups (average of3000 farmers per member).
In Kenya though, demand for these products have stemmed from their use by COSOFAPand partners during training, workshops and trade exhibitions. Partners requested formore copies or if they could photocopy such and distribute to their clients or members. Similarly, there have been increased demands of research products and
7

extension materials from the other projects. Farmers who have participated in someof the NRSP projects have noted remarkable improved soil fertility and increasedyield, and many of these are gaining access to advisory and support services. As aresult more farmers within and beyond the pilot sites are demanding to participate inthe research, and to benefit from the technology developed. Out of the field days heldat such sites and networking with Ministry staff, many farmers from adjacent villages have also expressed desire to implement such technologies and have requested for help hence the inclusion of small farmer organisation and CBO ensured that the primary beneficiaries (small-scale) farmers were part of up scaling process. Of the 10 farmers organization interviewed, 9 are made up of a group of 50 – 300 small-scalefarmers. Likewise, all the seven CBO’s interviewed deal 1 – 25 farmer groups of 200 – 500 small scale farmer. All the research institutions interviewed had a nationalcoverage, as were many of the NGOs.
8

Table 3: Profile of Target institutions for uptake promotion of communication productsin Uganda
Organization/institution Number ofyears
Number ofstaff (whereproducts were delivered)
Areas ofcoverage/Number ofDistricts
Number of beneficiaries
Non Governmental Organisations (7)A2N 15 15 11 100,000VECO 11 8 11 *UNFFE 13 10 53 220000Africare 9 40 5 42,336Prime West-Kabale 1.5 20 6 1000sPrime West –Kisoro 1 3 1Nature Uganda 6 12 3Research organizations (2)Africa Highlands Initiative
8 10 2***
ARDC 5 12 4Government Departments (6) Mbale DistrictAgricultural Office
*** 32 28subcounties
60,000
Kisoro District ExtensionCoordinator
14 23 35000
Kapchorwa *** 23 16subcounties
30,000
Sironko 2 33 19subcounties
65,989
Pallisa 14 50 28subcounties
70,000
NtungamoFarmers AssociationsKabale District Farmers Association
13 7 1 35000
Mbale District FarmersAssociation
13 6 staff and 70 ELF
20subcounties
3,100
Pallisa District FarmersAssociation
13 7 staff and 60 ELF
15subcounties
3,300
Private Sector Balton 20 50 All over the
countrySukura FarmSuppliers(Mbale district)
20 4 13 districts 10,000
El-Shaddai Farm Supplies(Mbale district)
10 2 7 districts 8,000
El-Shaddai Farm Supplies(Kapchorwa district)
10 2 1 2,000
Mt. Elgon Seed Company 7 2 4 farm supply 1
9

companies
Others like Africare have about 40 field staff working in five districts, reaching some42,000 farmers. There is therefore a huge potential to reach big numbers of farmers and to cover wider areas in Uganda. The Local Government institutions are bydefinition based in one district where they cover a considerable number of sub-counties. Some of the target institutions, especially international NGOs operate in several countries in Africa, and therefore have the potential to promote the products beyond national boundaries to their other country offices. In Kenya, COSOFAP target about 50,000 to 60,000 households in western Kenya
10

3.3.
Use
and
Use
fuln
ess
of c
omm
unic
atio
n pr
oduc
ts
Tabl
e 4
depi
cts
how
the
inst
itut
ions
have
mad
e us
e of
the
pro
duct
s an
dne
ed f
or m
odif
icat
ions
in t
hem
.
Tabl
e 4:
Num
ber
of in
stit
utio
ns t
hat
have
rea
d us
ed a
nd f
ound
pro
duct
use
ful
Keny
aU
gand
a
Prod
uct
Read
the
prod
uct
Foun
dth
epr
oduc
tus
eful
Use
dpr
oduc
tRe
adth
epr
oduc
t
Use
dpr
oduc
tFo
und
the
prod
uct
usef
ul01
. Yo
u ar
e lo
osin
g yo
ur s
oil
448
4424
524
02.
Brid
ging
res
earc
h an
d de
velo
pmen
t in
soi
l fer
tilit
y m
anag
emen
t30
530
142
1403
. Th
e po
wer
of
visi
onin
g 30
230
144
1404
. A
guid
eto
Sco
bics
30
030
50
505
. D
SS f
or b
ette
r la
nd m
anag
emen
t44
2044
203
1406
. D
SS f
or s
trig
a m
anag
emen
t an
d co
ntro
l 44
2544
192
1407
. In
tegr
ated
str
iga
cont
rol
stra
tegi
es f
or i
ncre
ased
cro
p yi
eld
and
soil
fert
ility
4425
4419
214
08.I
mpr
ove
soil
fert
ility
/foo
d se
curi
ty/i
ncom
e ge
nera
tion
:Pl
ant
dual
purp
ose
soyb
ean
4425
4420
314
09.
DSS
for
nut
rien
ts d
efic
ienc
y di
agno
sis
and
corr
ecti
ve m
easu
res
4430
4420
318
010.
Ty
pe
for
impr
oved
fa
llow
sp
ecie
s su
itab
le
for
soil
fert
ility
im
prov
emen
t44
1044
222
17
011.
Im
prov
e so
il fe
rtili
ty a
nd i
ncre
ase
crop
yie
lds
usin
g fe
rtili
zer
tree
s44
2044
222
17
11

From table 4 it can be noted that almost all the institutions have read the posters.Posters are indeed easy to read as they are meant to provide simple and shortmessages with pictorial that attract attention, and can be read in a short time.However, only 15% of the institutions have used some of the posters, particularly theprivate input dealers. With only few weeks after delivery towards the end of the year and the cropping season, we could not expect institutions to use these posters.
Many of the TI had partially read the two handbooks (The power of visioning andBridging research and development in soil fertility management), and many of themuse the interview time to peruse its content and to make some comments. It was observed that many TIs in Uganda did not read the “Guide to SCOBICS”, mainly because of its title “SCOBCS” which does not have recognized meanings in Uganda.
3.4. Stakeholders’ assessment of the Usefulness of the communication products
Results of Stage A recommended that to be effective, an uptake promotion project should use a combination of alternative communication methods, strategies andchannels. It was considered that various target institutions are heterogeneous and do not necessarily use the same approach to disseminate their products. It was therefore expected that the project would develop more proactive and efficient communication strategies to reach the needs and circumstances of various stakeholders. It wasanticipated that the communication strategy would include more proactive andinteractive communication materials with local and national target institutions(training workshops, policy learning events, seminars, radio shows and TV programmes) as well as electronic prints (manuals, guides, decision support tools,methodology guides, policy briefs, extension materials, posters, interactive CDs), andother mass media channels.
However, considering the budget allocated to the project, and the work and timeinvolved in developing alternative communication materials, the project was only ableto produce electronic prints in forms of posters (8) and handbooks (3). These providebasic materials that can be used for training, seminars, extension, radio shows, dramaand other interactive communication channels. As discussed in the sections above,most target institutions found these materials as very useful as training, learning andreference materials that extension personnel can use to promote the adoption of natural resources management and develop community action plans. Tracking howthese products are being used, and to what extent they have been translated intomore interactive communication materials, is an issue that requires follow up.
Due to limited time for reading and using the products, the comments on usefulness of the products are from a perception point of view rather than physical usage. For each product, we asked two follow up questions on what aspects of the products that aremore useful and what aspects could be modified before the products are widelydisseminated and used. The comments are presented for each of the products
12

1. Bridging research and development in soil fertility management”
Contains useful material/information on soil problems and how to overcome them. Heis also convinced that it is a good reference material for the extension workers.
Indicators of soil fertility decline/degradation and mapping of soil fertility levels It is asimplified handbook on soil fertility and degradation. Thus it is easy to use. Section 1 on diagnosis of soil management problems is very clear and easy to interpret.However, section 2 deliberating on cost benefit analysis is not clear and user friendlyparticularly to those who are certificate holders.This is a good training handbook on soil fertility and management. It is also good forreference.
2. “The power of visioning”
At a glance it is good for institutional development such as forming farmers groups.The book also has relevant PRA tools and aids one to analyse issues. It is also good foraction planning particularly in the rural areas.
The perception of promoting development from a solution/opportunity point of viewrather than problem. It is good for action planning in rural areas. It aids groups tograsp planning skills. It is also good for graduate studies in the area of ruraldevelopment
The book is a very good guide for those guiding institutional development. It allowsquestioning thus enabling participants to bring forth their problems and vital information. It also enables participants to vision solutions and opportunities to their problems. Community action planning and PRA tools
This book offers a change of perception from the problem to solution/opportunitypoint of view. Thus people should not labour much on problems but on solutions andopportunities. The book also gives realistic practical experiences. Thus it enhances learning.
It is good for involvement of the local communities, particularly in developingcountries faced with development problems. It can be used to explore potentials andopportunities for sustaining the environment for better livelihoods within thecommunities.
The visioning depicted in this book makes the community development worker to have the urge to empower the community to devise solutions to their problemsVisioning, stimulating collective analysis of community livelihood assets and the sustainable livelihood framework
It is good teaching guide, particularly on areas of participatory planning, goalformulation. Hence, the field officers and Extension Link Farmers involved inpromoting farmer group development will use it. We have used a similar approachduring the COB’s project activities but we did not have a systematic guide. This
13

Handbook gives step by step process on how to enter the community, initiate community projects, and guides extension people how to monitor and developcommunity action plans.
The Boxes are good summaries and identify solutions. You can finish the book byreading the boxes if you don’t have enough time. The pictures tell you what is goingon. For example on page 36, you can see that they are discussing and sharing.
However, it is bulky and may need to be repackaged. A simpler version of the power of visioning could be made to enhance reading it. Nevertheless, the simplification shouldnot compromise the content. It may need a collective effort involving the authors andinterested partners, NGOs and Ministry of Agriculture Animal Industry and Fisheries.
3. A Guide to SCOBICS
Can be useful in sensitizing the group on income generating activities
It is very useful as it tries to assist us compare what is happening in Kenya and whatwe do here. It is a short cut to exchange visit.
It is useful in mobilizing loans, credits and savings. Loan is in form of inputs ratherthan cash. People will not end up “eating” the money, which is good for them to be able to pay back.
However, reading this book one gets the picture of a research report rather than aguide. Secondly the title is not clear. It would be better if SCOBICS is written in full.Page 23 and 25 are the same, thus content on page 24 is not complete. Figure 2 is missing. The message (given by the woman) on top of page 19 would come before thaton page 18.
This guide could be rewritten using a guide format. This will make the book easy to understand and used to implement the credit scheme. The titleSCOBICS should be written in full to attract users. The mistakes raised in the comments should be corrected.
3. “You are losing your soil”
It has straightforward messages and easy to interpret, hence, they save officers time from searching for material from resource centres. The messages contained in the poster act as a decision guide. The poster clearly illustrates the soil problems.
This is a very good poster on soil erosion and possible mitigations. The poster depictshow soil is being lost all over the country. It also gives a range of possible measures,which are within the reach of the resource poor. However the arrows could be madebold to enhance tracing of the different mitigations.
14

The poster clearly brings out the soil problems and their possible solutions. Thepicture of yellowish and stunted maize resulting from soil nutrient loss and themeasure to apply fertilizer promotes Balton to sell fertilizers
The picture of yellowish and stunted maize resulting from soil nutrient loss and themeasure to apply fertilizer promotes Balton to sell fertilizers
Depict all types of soil erosion and substitute arrows with something more clear
It is quite good but for farmers the arrows may be difficult to follow and it is worse for one who is colour blind! Solutions could be tagged to the soil problem to ease farmer understanding. Furthermore, there is no picture of sheet and rill erosion that are normally the first sign of erosion and which farmers often don’t observe.The types of soil erosion could be depicted in a sequential and logical manner.
This poster is very clear and tells exactly what farmers are experiencing.This poster is good since it depicts the soil problems experienced in the district. However, the arrows are cumbersome and not easily distinguishable particularly topeople who are colour blind. The recommendation of the use of tithonia hedgerows is questionable with regards to nutrient drawing
It is a good poster because it gives a picture of what farmers see in their gardens. Thusit helps them to stop loss of soil. The poster is easy to read and understand. Thearrows clearly point at the mitigation measures.
It is a field tool for reference with farmers; it has colored photographs attracting attention of readers.
5. “Improve soil fertility…yields using fertilizer trees”
This poster gives a range of improved fallow from which farmers can select.This is an informative poster, informing farmers how to improve soil fertility by use oftrees, which at the same time are used as firewood and fodder. Nevertheless one needs to know the names of the fertilizer trees and more so in the local language
The poster is very educative. The Sales Manager was surprised to learn that trees can be used to increase soil fertility. However, the names of trees are not given in local languages thus it is difficult to identify or trace them. It is also not indicated whether the trees do not share nutrients with the plants.The picture of the average yields shows bigger cobs than that of the of the good yield
The poster is not new but its messages are very clear on what to do and the types offallow trees to use. One wonders what the diagnosis in picture 6 and 7 is. I assumethese are treatments rather than diagnosis. The poster should also include incrementgained by using fertilizer trees
6 and 7. “DSS for striga management and control” and “Integrated striga controlstrategies for increased crop yield and food security”
15

The posters are very applicable in striga prone areas such as Pallisa and Tororodistricts. They give information on how to control striga. However, the “Integratedstriga control strategies for increased crop yield and food security” poster is more of abrochure (contains informative information) rather than a poster. Hence, if it is to beput up as a poster it needs to be simplified and text reduced.
This poster emphasizes the need to manage land and increase crop yields by adoptingsimple practices such as crop rotation and fallowing.
The title of the poster is good but the measures given to control the striga are not conclusive. Application of fertilizers and use of hybrid maize will never control striga! For sure no farmer is going to believe that. It is like telling a worm infested child to take nutritious food and expect that the worms will be controlled!
The two posters could be diffused into one
The treatment, “top dress at knee height “is not clear. It leaves one asking with what? The fertilizer application rates per unit area or plant are not given. Yet farmers mustknow the costs
The yields of the following different treatments are the same: (a) apply good qualitymanure and P fertilizer, plant hybrid maize and top dress at knee height, b) apply P fertilizer, plant hybrid maize and top dress at knee height, and c) Chop the fallowthen mix with soil, apply P fertilizer and plant hybrid maize. This leaves the farmer toguess the best option.
The pictures of the maize garden beside the poor yield and average yield are almostthe same.
This poster has good strategies and practices to control striga infestation, however itis congested. The information it contains would be better presented in a brochure or ifthe poster is to be maintained reduce the text on the problem and why striga is such a problem.
These posters are good for striga management however they have the following gaps:
It is not clear who is the user of these products. Is for farmers or serviceproviders
The expected yields due to the different treatments are not given
The rates of application of the fertilizers are not indicated. Farmers need to know the application rates so that they can calculate the costs verses the benefits
The narrative description (Poor, good or average) of the yields is notconclusive. Farmers need to know the increment due to the treatments so thatthey can calculate the profits resulting from these treatments. Thus, quantify the yields per unit area. This could be in terms of bags of maize or kilogrammes
In these posters one may hardly notice the difference because the background of the posters is almost the same and the picture of the woman and man are
16

the same! Please use different backgrounds and people.
Picture numbered 7 on the poster of “DSS for striga management and control”is not clear. One cannot tell what is being depicted in the foreground of this picture. Is it bare ground or cultivated land?
The maize cobs illustrating poor yields seem as if there are illustrating cobs infested by pests
These posters are not relevant in the highlands of southwestern Uganda where striga isnot a problem.
8 and 9 “DSS for nutrients deficiency diagnosis and corrective measures” and DSSfor better land management
These posters are overcrowded and one hardly notices the difference between them. (The woman and man applying fertilizer and planting maize hybrid respectively are the same in all the 3 posters.) Thus when put in the same place someone may read onlyone. Please use different illustrations to clarify the messages.
The poster of “DSS for nutrient deficiency diagnosis and corrective measures makesfarmers to realize the need to apply fertilizer, hence promoting Balton’s fertilizersproducts are good for the small scale farmers, however they would be more informative and encouraging to adopt if the increment accrued from them are given.Informing farmers to use fertilizers are good but for the poor resource farmers it maynot be sustainable, thus the posters could also emphasise the use of compost manure.
Pictures 5 and 6 in this poster are the same. One would suffice. In these pictures thecaption indicating improved fallows are misleading. (The captions are placed in theforegrounds which seems to be bare!) How can one tell the causes of the nutrientdeficiencies? Can this be included in the poster?
This poster has made the sales manager and farmers to realize the need to usefertilizers, fallows and hybrid seeds for one to get high yields. The message willencourage farmers to change their farming practices is very useful for empowering the local communities. It is good for guiding communities in participatory planning.
10. “Improve soil fertility /food security and income generation through dual purposesoybean”
17
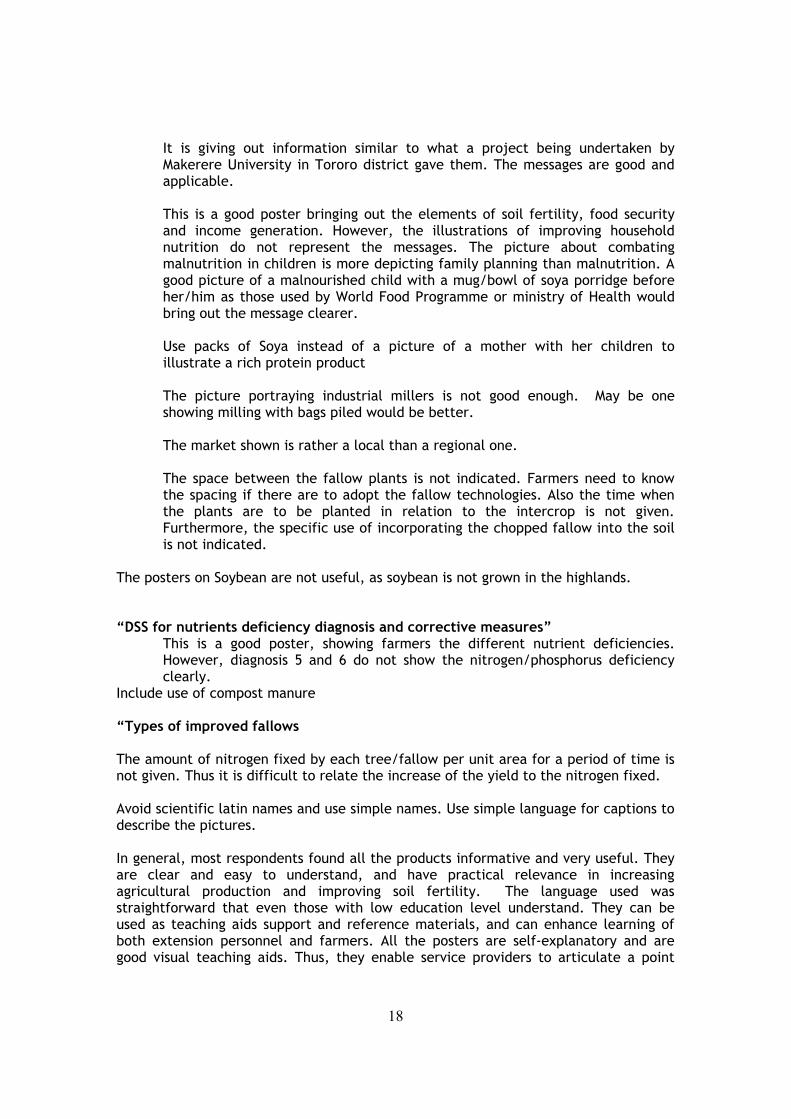
It is giving out information similar to what a project being undertaken byMakerere University in Tororo district gave them. The messages are good andapplicable.
This is a good poster bringing out the elements of soil fertility, food securityand income generation. However, the illustrations of improving householdnutrition do not represent the messages. The picture about combatingmalnutrition in children is more depicting family planning than malnutrition. Agood picture of a malnourished child with a mug/bowl of soya porridge beforeher/him as those used by World Food Programme or ministry of Health would bring out the message clearer.
Use packs of Soya instead of a picture of a mother with her children to illustrate a rich protein product
The picture portraying industrial millers is not good enough. May be one showing milling with bags piled would be better.
The market shown is rather a local than a regional one.
The space between the fallow plants is not indicated. Farmers need to know the spacing if there are to adopt the fallow technologies. Also the time when the plants are to be planted in relation to the intercrop is not given. Furthermore, the specific use of incorporating the chopped fallow into the soil is not indicated.
The posters on Soybean are not useful, as soybean is not grown in the highlands.
“DSS for nutrients deficiency diagnosis and corrective measures”
Include use of compost manure
This is a good poster, showing farmers the different nutrient deficiencies.However, diagnosis 5 and 6 do not show the nitrogen/phosphorus deficiencyclearly.
“Types of improved fallows
The amount of nitrogen fixed by each tree/fallow per unit area for a period of time is not given. Thus it is difficult to relate the increase of the yield to the nitrogen fixed.
Avoid scientific latin names and use simple names. Use simple language for captions to describe the pictures.
In general, most respondents found all the products informative and very useful. They are clear and easy to understand, and have practical relevance in increasingagricultural production and improving soil fertility. The language used wasstraightforward that even those with low education level understand. They can be used as teaching aids support and reference materials, and can enhance learning ofboth extension personnel and farmers. All the posters are self-explanatory and aregood visual teaching aids. Thus, they enable service providers to articulate a point
18

easily and also ease farmers’ learning. All products convey messages that farmers havebeen asking and are good reference material for service providers. The posters containillustrations and messages that will be used as teaching and learning aids for bothfarmers and extension workers, thus aiding the communities to identify solutions to their farming problems. In addition, they will be used as reference materials andguides to decision-making The posters are particularly good for teaching farmers onagronomic practices which if carried out will enhance productivity, and provideincentives for purchasing and using recommended inputs such as hybrid seeds, fertilizers and pesticides which will consequently increase the business turnover.
Although many of the posters are useful they need to be modified in order to makethem easy to use and well understood. About 85% of the institutions found that mostposters are congested and some of them contain texts, which better suits brochures. In addition, the rate of application of the fertilizers, hybrid seeds and expected maize yield as a result of the treatments are not give in quantities, making it difficult for thefarmers to judge the benefits versus the costs. Thus, the posters should be madesimple, enlarged and the rates of application of fertilizers as well as the expected yields given so that farmers can calculate the costs and benefits. Some of the posters need proper targeting to make the posters more relevant.
However some respondents reported that some posters are crowded and some look similar. They lack the step-to-step methods of applying the measures, leaving the userguessing what to do next. The smaller posters have small font size and are congested.The use of abbreviations such as DSS and COBICS in the title does not help people who are not familiar to understand the products. The posters intended for farmers need to be translated into local languages to ease their understanding. Some posters could be made simpler and designed in a logical manner to ease understanding of the messagethey contain. It was recommended that the posters could be packaged in A-4 paper so that it is easy to photocopy them, and give as handouts to customers and visitors.Similar products have been got from IDEA project, which has been promotingsustainable agriculture.
The handbooks are good reference materials. They are easy to read and understand. There are applicable as teaching and learning aids for service providers and farmers respectively. There are also applicable as reference material. The informationcontained in them is concise for both the farmer and service providers. Somestakeholders recommended that they should be simplified and made smaller, pocket size, with large letters and coulored photographs for easy reference, without loosingthe information contained. It is also important to have enough copies for field staff.The institutions that had read the two handbooks (“Bridging research and developmentin soil fertility management” and “The power of visioning”) feel there may be no needto make modifications. However, taking into consideration the low reading culturesimpler versions would be developed. Nevertheless, the handbook of “A guide to SCOBICS” needs to be rewritten in a guide format because it is in a report form. Inaddition, the abbreviation SCOBICS should be written in full so that the title is capturing.
3.5. Uptake promotion of the products
19
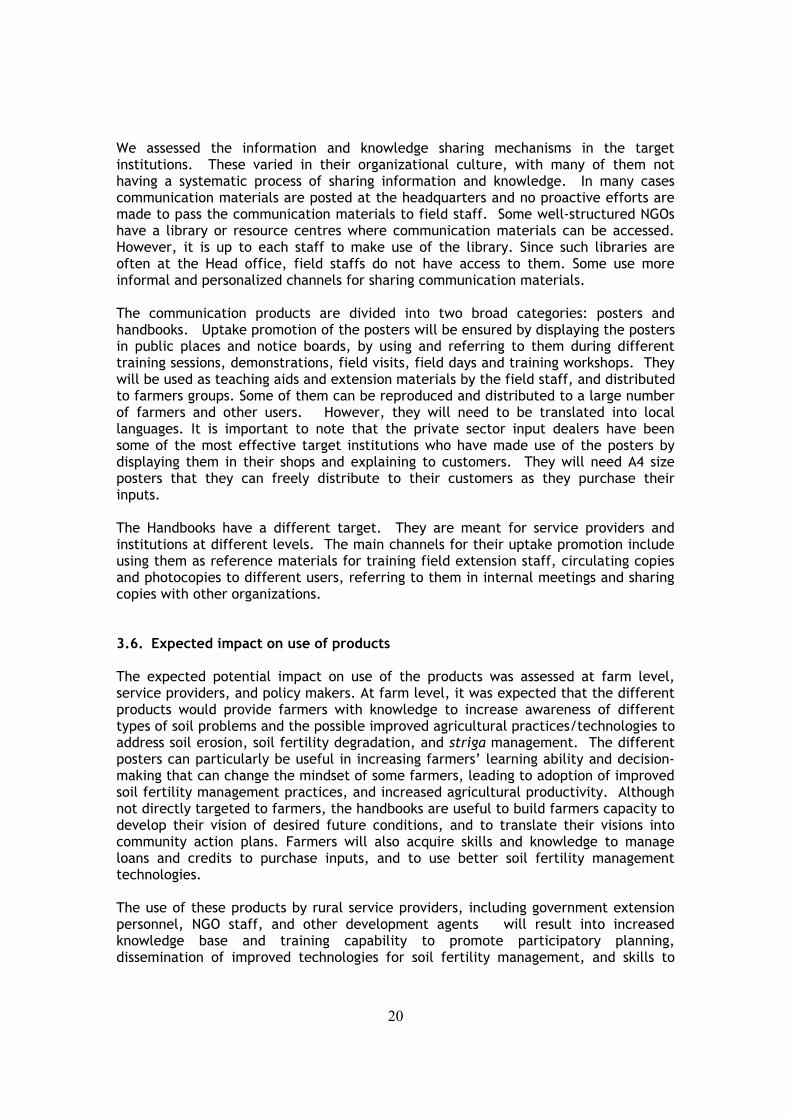
We assessed the information and knowledge sharing mechanisms in the targetinstitutions. These varied in their organizational culture, with many of them nothaving a systematic process of sharing information and knowledge. In many casescommunication materials are posted at the headquarters and no proactive efforts aremade to pass the communication materials to field staff. Some well-structured NGOshave a library or resource centres where communication materials can be accessed. However, it is up to each staff to make use of the library. Since such libraries areoften at the Head office, field staffs do not have access to them. Some use more informal and personalized channels for sharing communication materials.
The communication products are divided into two broad categories: posters and handbooks. Uptake promotion of the posters will be ensured by displaying the postersin public places and notice boards, by using and referring to them during differenttraining sessions, demonstrations, field visits, field days and training workshops. They will be used as teaching aids and extension materials by the field staff, and distributedto farmers groups. Some of them can be reproduced and distributed to a large numberof farmers and other users. However, they will need to be translated into local languages. It is important to note that the private sector input dealers have been some of the most effective target institutions who have made use of the posters by displaying them in their shops and explaining to customers. They will need A4 sizeposters that they can freely distribute to their customers as they purchase their inputs.
The Handbooks have a different target. They are meant for service providers andinstitutions at different levels. The main channels for their uptake promotion includeusing them as reference materials for training field extension staff, circulating copies and photocopies to different users, referring to them in internal meetings and sharingcopies with other organizations.
3.6. Expected impact on use of products
The expected potential impact on use of the products was assessed at farm level,service providers, and policy makers. At farm level, it was expected that the different products would provide farmers with knowledge to increase awareness of different types of soil problems and the possible improved agricultural practices/technologies toaddress soil erosion, soil fertility degradation, and striga management. The differentposters can particularly be useful in increasing farmers’ learning ability and decision-making that can change the mindset of some farmers, leading to adoption of improved soil fertility management practices, and increased agricultural productivity. Althoughnot directly targeted to farmers, the handbooks are useful to build farmers capacity to develop their vision of desired future conditions, and to translate their visions into community action plans. Farmers will also acquire skills and knowledge to manageloans and credits to purchase inputs, and to use better soil fertility management technologies.
The use of these products by rural service providers, including government extensionpersonnel, NGO staff, and other development agents will result into increasedknowledge base and training capability to promote participatory planning, dissemination of improved technologies for soil fertility management, and skills to
20

manage inputs loans and credits. They will have access to training and referencematerials, which are often lacking. Input dealers expect that there would be increase in their business as farmers learn how to use inputs, and can have access to loans andcredits for purchasing inputs. The institutions that have read and partially used the products revealed that they staff increased knowledge, as the content is pertinent toagricultural development issues. Hence, there are now in a better position to deliverthe agricultural advisory services or demonstrate the recommended practices/methods more effectively and with confidence. Policy-makers will also increase awareness of soil fertility problems and improved agricultural practices to address them. This will increase the need to advocate and lobby for bye-laws on farming practices, andformulate and enact bye-laws on soil degradation and fertility. The Visioning Guide isparticularly useful for participatory planning and development of community actionplans.
3.7. Conditions for Sustainability of products
There is no doubt that the different products are good training and learning materials that can be used by a variety of stakeholders. However the number of copies producedis much less compared to the demand and needs of different stakeholders. It was evident that many institutions need more copies for their field staff as well as forcommunities where they are working. Therefore, these products need to bereproduced continuously and distributed to the users.
One strategy to ensure uptake promotion of these products is to make them publicgoods with no restrictive copyrights for reproduction. There are partners who will bewilling to share costs of reproduction of selected materials, or to cover costs of reproduction for distribution and use by their field staff and target groups. Some havealready made a formal request. It was also suggested that partners could jointly mobilize resources to repackage the products and distribute them to a wider targetgroup. The partners could be those involved in agriculture development such as National Agricultural Advisory Services (NAADS-Uganda), Agricultural InformationCentre (AIC-Kenya), Farmer Associations, input dealers, and international and nationalNGOs.
There is need to develop promotion strategies that can ensure that the useful productsare sold at affordable prices. Finally, it was suggested that the products should be posted on websites where they can be accessed, downloaded and photocopied for useby interested institutions. However, this will require creating awareness andstrategies for promoting the use of the different products. More proactive and interactive promotion strategies such as training workshops and stakeholder meetingswill be more effective in ensuring uptake, use and sustainability of these products.
4. Lessons learnt and Recommendations
Despite the fact that this tracking survey was conducted at a time when moststakeholders had no opportunities to use the different products in field situation, a
21

number of useful lessons can be drawn for uptake promotion of communicationproducts.
First, the timing of this tracking survey was far from ideal situation to generate more informed feedback on the use of products in real field situation. The surveyintervened only a few weeks after distribution. As a consequence, many products had not reached intended beneficiaries at the time of the survey, and most institutionshave not had opportunities to use them in the field to provide constructive feedback.A monitoring and evaluation of the effectiveness of communication materials needs to be conducted at least six months after delivery of the products. However, a systematic tool for tracking use of products needs to be developed and shared withintended users.
Second, it was clear that the active involvement of different stakeholder categories in making the products makes it easy to identify how they should be packaged, thus making them user friendly. It is also very important to have a peer-review process andpre-test the different products with the intended users, revise them before mass production. This has however cost and time implications, resulting in a limitednumber of copes that can be produced. Pre-testing would avoid some of thecomments and needs for modification made by the users. For example, it would helpto make the title clear and attractive, and avoid congestion of text into a singleposter.
Thirdly, the distribution of the products needs more systematic targeting and proactive communication strategies. To ensure that the product users receive themand use them effectively there may be need for follow up on the distribution and a stakeholder workshop to explain how the products could be used. This could also serve as training of trainers that will use the products in the field.
Fourth, the distribution process of the products was not uniform. There are differences in institutional set up and arrangements for communication. In some cases,communication is centralized, whereby the Head Office or Project Manager would be the central place to deposit information which is then shared to field offices and staff according to their responsibilities and workplans. It is argued that this will ensure that the products are considered as organization property, and the line managers willensure their proper distribution to and use by a higher number of field staff, and ensure feedback. However, we also found that in a number of cases, there was noevidence that products delivered to the Head office will eventually reach the endusers or field staff. In many cases they ended up in the office shelves, some times still in the form of their delivery. The challenge is to assess organizational culture andinformation sharing mechanisms of different target institutions and before distributionto determine the most effective ways of distributing products. Assessing the mosteffective way of distributing communication products, comparing the two approaches,remains a research challenge.
Fifth, results of Stage A recommended that to be effective, an uptake promotionproject should use a combination of alternative communication methods, strategies and channels. It was considered that various TIs are heterogeneous and do notnecessarily use the same approach to disseminate their products. It was therefore
22

expected that the project will aim at developing more proactive and efficient communication strategies to reach the needs and circumstances of various stakeholders. It was anticipated that the communication strategy will include moreproactive and interactive communication materials with local and national target institutions (training workshops, policy learning events, seminars, radio shows and TVprogrammes) as well as electronic prints (manuals, guides, decision support tools,methodology guides, policy briefs, extension materials, posters, interactive CDs), andother mass media channels. However, considering the budget allocated to the project, and the work and time involved in developing alternative communication materials, the project was only able to produce electronic prints in forms of posters (8) andhandbooks (3). These provide basic materials that can be used for training, seminars,extension, radio shows, drama and other interactive communication channels. It is interesting to note that most target institutions found these materials as very useful as training, learning and reference materials that extension personnel can use to promote the adoption of natural resources management and develop communityaction plans. Tracking how these products are being used, and to what extent they have been translated into more interactive communication materials, is an issue thatrequires follow up.
Sixth, most target institutions found all the products informative and very useful. They are clear and easy to understand, and have practical relevance in increasingagricultural production and improving soil fertility. All products convey messages thatfarmers have been asking and are good reference material for service providers.However, there seems to be a difference between posters and handbooks. Posterswere seen as straightforward and self-explanatory that even those with low educationlevel understand. However, they should be made simple, enlarged and subsequentlypackaged in A-4 paper so that it is easy to photocopy them, and give as handouts to customers and visitors. The handbooks are good reference materials. There are veryuseful as teaching and learning aids, and reference materials for service providers andfarmers respectively. There are also applicable as reference material. However, theyneed to be simplified and packaged into pocket size, without loosing the informationcontained. More importantly the handbook of “A guide to SCOBICS” may need to berepackaged in a handbook format instead of its current report format.
Seventh, a number of institutions are willing to reproduce the products as along as there are no restricted copyrights. Finding more appropriate strategies for linking upwith other institutions, and creating partnerships for reproduction and distribution ofthe different products will remain a challenge for the institutions involved. This mightinvolve repackaging of the products, translating them into local languages, andallowing different partners to modify some aspects as necessary. In the meantime,posting these materials to websites to allow easy access needs to be accompanied withstrategies to create awareness of these products.
Eight, other issues that are worthy to note includes:
Uptake promotion requires more than one year especially for cross border projectsScaling up to districts outside target areas enables you get diverse and relevant information
23

Modifications of products will always happen even after pre-testinghence need to make a decision how far to go in modificationsBuy in of politicians takes time and need more than a month prior noticeand have a plan B in place as they always are prone to changing programmesIt is better to have fewer documents and give more/many copies to institutionsNeed earlier arrangements with target groups if you are to meet poor farmers on their own DSS posters need to be accompanied by Guides- stakeholders find it difficult to interpret the posters alone Visual presentations/media is still the best mode to target poor farmers and women groupsMultiplicity of channels/pathways is preferred Need to use other forms of media apart from print alone---video, audio cassettesBranding issues/copy right issues to be addressed effectively and a written agreement put in place. NGOs and Private sector willing to invest money to reproduce products
5. Conclusions
Empowering various stakeholders on the use of research product throughtraining seems to be the key prerequisite for scaling-up and catalyzing the use of products. COSOFAP has continuously been able to build the capacity offarmers and its partners who in turn help train other farmers and scale-up the adoption of the research products as compared to Ugandan stakeholders who were seeing the products for the first time. COSOFAP has also helped to strengthen regional and sub-regional networks that help promote institutionaland policy environment conducive for the scaling-up and dissemination of agricultural technologies. These have been possible through development ofstrong links with high-level decision makers in the government and advocatingfor improved natural resource and agricultural policies.
24

Appendix 1: Tracking the use of communication products
A. Profile of the organization:
Name _______________________________________________________________
Type: 1= Research; 2=NGO 3=Local Government 4=National Programme 5=Farmers Organization 6= CBO 7=Private sector 8= Other
Activities-----------------------------------------------------------------------------------
Coverage/areas of operation -----------------------------------------------------------
Staffing: ----------------------------------------------------------------------------------
Number of years of operation: --------------------------------------------------------
Target groups-----------------------------------------------------------------------------
Number of Beneficiaries: --------------------------------------------------------------
Respondent’s position: _______________________________________________
B. ASSESSMENT OF COMMUNICATION PRODUCTS
1.Which of these products did you receive?List of products How many
copies did youreceive?
Ever read? Ever used? When did youstart using it?
1
2
3
4
5
6
7
2. If you have used or/and read these products, in which way did you find them useful? Products How useful
25

3. What aspects of these products do you find more useful?
Products Useful aspects
4. How would you assess these products in terms of clarity and applicability?Products Clarity Applicability
26

4. Do you see any need to modify the products before they are disseminated and used?Give reasons for your answer
Products What can be modified1
2
3
4
5
5. How do you intend to use these different products?
27
Products How do you intend to use these products1
2
3
4
5
6
6. How do you intend to share the products with other people within and outside yourorganizations?
Ever shared?Yes No
If yes,With who
How Many of them
How?
1
2
3
4
5
6
7. How do you share information/ Communication materials?
_________________________________________________________________________
_________________________________________________________________________
_________________________________________________________________________
28
______________________________________
8. Which products would your promote use?
Products How would you promote them?1
2
3
4
5
9. Do you see any need to modify the products before they are disseminated and used?Give reasons for your answer
Products What can be modified1
2
3
4
5
10. What potential impacts do you foresee the use of these products can create at farm level?With policy makers? And service providers?
Products
29

1
2
3
4
5
11. Which is the best way to create awareness of the products amongst the users and targetgroup?
_________________________________________________________________________
_________________________________________________________________________
_________________________________________________________________________
_______________________________________
12. How do you intend to sustain the use of these products?
Products1
2
3
4
5
30

31