tracking the evolution of magmatic volatiles from …11.pdf · 2011-05-11 · ii approval name:...
TRANSCRIPT

TRACKING THE EVOLUTION OF MAGMATIC VOLATILES
FROM THE MANTLE TO THE ATMOSPHERE USING INTEGRATIVE GEOCHEMICAL AND GEOPHYSICAL
METHODS
by
Nathalie Vigouroux-Caillibot M.Sc., University of Oregon, 2006
B.Sc., McGill University, 2003
THESIS SUBMITTED IN PARTIAL FULFILLMENT OF THE REQUIREMENTS FOR THE DEGREE OF
DOCTOR OF PHILOSOPHY
In the Department of Earth Sciences
© Nathalie Vigouroux-Caillibot 2011 SIMON FRASER UNIVERSITY
Spring 2011
All rights reserved. However, in accordance with the Copyright Act of Canada, this work may be reproduced, without authorization, under the conditions for Fair Dealing. Therefore, limited reproduction of this work for the purposes of private
study, research, criticism, review and news reporting is likely to be in accordance with the law, particularly if cited appropriately.
ii
APPROVAL
Name: Nathalie Vigouroux-Caillibot
Degree: Doctor of Philosophy
Title of Thesis: Tracking The Evolution Of Magmatic Volatiles From The Mantle To The Atmosphere Using Integrative Geochemical And Geophysical Methods
Examining Committee:
Chair: Shahin Dashtgard [Correct title – Consult your Grad Secretary/Assistant
__________________________________________
Dr. Glyn Williams-Jones Senior Supervisor Correct title – Consult your Grad Secretary/Assistant
__________________________________________
Dr. Kirstie Simpson Supervisor Correct title – Consult your Grad Secretary/Assistant
__________________________________________
Dr. Kelly Russell Supervisor Correct title – Consult your Grad Secretary/Assistant
__________________________________________
Dr. Dan Marshall Internal Examiner Correct title – Consult your Grad Secretary/Assistant
__________________________________________
Dr. Laurence Coogan External Examiner Correct title – Consult your Grad Secretary/Assistant University of Victoria
Date Defended/Approved: __________________________________________

iii
ABSTRACT
This thesis characterizes the transfer of magmatic volatiles through the mantle
and the crust to the atmosphere through the integration of melt inclusion data for pre-
eruptive volatile contents with surface measurements of volcanic degassing (recorded in
micro-gravity changes and volcanic fumarole and plume gas compositions) at two
contrasting volcanoes: Sierra Negra, Galápagos Islands and Kawah Ijen, Indonesia. In
particular, it explores the process of fluid transfer in the mantle, the partitioning of volatile
elements during mantle melting and degassing of the magma through the crust, and the
effect of near-surface (e.g., interactions with groundwater and hydrothermal fluids), and
surface processes (e.g., cooling and mixing with air) on the gas species. The effects of
differences in initial volatile content and internal volcano structure on the types of
eruptions and emissions recorded at each volcano are also discussed.
The comparison of Sierra Negra and Kawah Ijen volcanoes reveals that
differences in style of volcanic activity are primarily a function of magmatic plumbing
system as opposed to differences in initial volatile content. In both cases, permeability of
the crust and degassing style have exerted a dominant control over the recent style of
activity (last century). Recent eruptions at Sierra Negra are not necessarily associated
with magma recharge into shallow reservoirs but can be caused by subtle changes in
the pressure regime of a magma chamber, a process which is closely associated with
degassing and system permeability. Large explosive eruptions at Kawah Ijen are
currently impeded by the open system (permeable) flow of magma and gas through the
plumbing system. Hydrothermal systems play an important role in controlling the
permeability of a system and the composition of the gases measured at the surface. The
comparison of theoretically modeled gas compositions with actual measured
compositions is an effective approach to studying the influence of hydrothermal systems
at open vent volcanoes.
Keywords: Magmatic degassing; volcanic plume; melt inclusion; hydrothermal system; fumarole; micro-gravity; Sierra Negra; Kawah Ijen.

iv
ACKNOWLEDGEMENTS
First and foremost I’d like to acknowledge my senior supervisor Glyn
Williams-Jones for offering me the opportunity to research and travel to active
volcanoes around the world. His guidance and support were invaluable. A big
thank you to my supervisory committee: Kelly Russell and Kirstie Simpson for
their support during my Ph.D and their review of this thesis. I’d also like to
acknowledge Dan Marshall and Laurence Coogan for acting on the examining
committee and reviewing this thesis.
Numerous other people have proved invaluable in enabling and assisting
with the field work: Dennis Geist, Andres Gorki Ruiz, Bill Chadwick, Kim Berlo
and members of the Galápagos National Park and the Charles Darwin Research
Station for work in the Galápagos; Willy Williams-Jones, Vincent van Hinsberg,
Guillaume Mauri, Samantha Scher, Stephanie Palmer, Kim Berlo as well as
numerous volunteer field assistants and local miners Pa Im and Jumanto for
work in Indonesia. Thank you to Paul Wallace for his continued support and
assistance with some of the geochemical modeling. To my friends and
colleagues at Simon Fraser University, you have made these last few years very
memorable, in particular, Jolane Sorge, Shannon Frey, Nicholas Roberts and
Dan Shugar. Finally, a special thank you to Matt for encouraging me to pursue
my career goals and to my parents for their continued support over the years.

v
TABLE OF CONTENTS
Approval........................................................................................................................... ii
Abstract........................................................................................................................... iii
Acknowledgements ....................................................................................................... iv
Table of Contents............................................................................................................ v
List of Figures .............................................................................................................. viii
List of Tables.................................................................................................................. xi
1: Introduction................................................................................................................. 1 1.1 Motivation ................................................................................................................. 1 1.2 Methods .................................................................................................................... 4
1.2.1 Melt inclusions............................................................................................... 4 1.2.2 UV correlation spectrometry.......................................................................... 7 1.2.3 MultiGAS plume sensors............................................................................... 8 1.2.4 “Giggenbach” fumarole sampling .................................................................. 9 1.2.5 Dynamic micro-gravity surveys ..................................................................... 9
1.3 Approach ................................................................................................................ 10 1.4 References ............................................................................................................. 15
2: 4D Gravity Changes Associated with the 2005 Eruption of Sierra Negra Volcano, Galápagos...................................................................................................... 23 2.1 Abstract................................................................................................................... 23 2.2 Introduction ............................................................................................................. 24 2.3 Geologic Setting and the 2005 Eruption ................................................................. 25 2.4 Methods .................................................................................................................. 27 2.5 Gravity and Deformation Results ............................................................................ 29 2.6 Discussion .............................................................................................................. 32 2.7 Conclusions ............................................................................................................ 40 2.8 Acknowledgments................................................................................................... 42 2.9 Figures.................................................................................................................... 43 2.10 Tables ..................................................................................................................... 49 2.11 References ............................................................................................................. 50
3: The Source Components of Volatile and Fluid-Mobile Elements in Subduction Zones: a Melt Inclusion Study from Kawah Ijen Volcano, Indonesia ....................................................................................................................... 54 3.1 Abstract................................................................................................................... 54 3.2 Introduction ............................................................................................................. 55 3.3 Geologic Setting ..................................................................................................... 57

vi
3.4 Methodology ........................................................................................................... 60 3.4.1 Post-entrapment modification correction..................................................... 62
3.5 Results.................................................................................................................... 63 3.6 Discussion .............................................................................................................. 67
3.6.1 Mantle source composition ......................................................................... 68 3.6.2 Sediment, crust and serpentinite contributions to arc magmas .................. 72
3.7 Conclusions ............................................................................................................ 95 3.8 Acknowledgement .................................................................................................. 97 3.9 Figures.................................................................................................................... 98 3.10 Tables ................................................................................................................... 107 3.11 References ........................................................................................................... 112
4: Integrated Geochemical Modeling of Magmatic Degassing and Hydrothermal Interaction: a Case Study from Kawah Ijen Volcano, Indonesia ..................................................................................................................... 124 4.1 Abstract................................................................................................................. 124 4.2 Introduction ........................................................................................................... 126 4.3 Geologic Setting ................................................................................................... 128
4.3.1 Kawah Ijen volcano................................................................................... 128 4.3.2 Crater lake and Banyu Pahit river ............................................................. 130
4.4 Methodology ......................................................................................................... 131 4.4.1 Petrological sampling and analysis ........................................................... 131 4.4.2 Fumarole gas sampling and analysis........................................................ 134
4.5 Results.................................................................................................................. 135 4.5.1 Melt inclusion and matrix glass major and volatile element
composition............................................................................................... 135 4.5.2 Sulphur speciation and oxygen fugacity.................................................... 140 4.5.3 Fumarole gas chemistry............................................................................ 140
4.6 Discussion ............................................................................................................ 141 4.6.1 Magma evolution....................................................................................... 141 4.6.2 Volatile evolution....................................................................................... 142 4.6.3 Degassing modeling.................................................................................. 148 4.6.4 Model magmatic fluid composition and comparison with measured
fumarole compositions .............................................................................. 154 4.7 Summary and Conclusions................................................................................... 161 4.8 Acknowledgments................................................................................................. 164 4.9 Figures.................................................................................................................. 165 4.10 Tables ................................................................................................................... 180 4.11 References ........................................................................................................... 186
5: Underestimating Volcanic Degassing: the case of Kawah Ijen Volcano, Indonesia ..................................................................................................................... 193 5.1 Abstract................................................................................................................. 193 5.2 Introduction ........................................................................................................... 194 5.3 Geologic Setting and Magmatic History................................................................ 195 5.4 Sample Description and Methods......................................................................... 197

vii
5.5 Effects of Dilution, Reaction with Air and Precipitation of Native S on Plume Compositions ........................................................................................................ 199
5.6 Discussion ............................................................................................................ 201 5.7 Acknowledgments................................................................................................. 205 5.8 Figures.................................................................................................................. 206 5.9 Tables ................................................................................................................... 210 5.10 References ........................................................................................................... 213
6: Conclusions ............................................................................................................ 216 6.1 Volatile Transfer During Slab Subduction............................................................. 216 6.2 Volatile Transfer During Magma Ascent Through the Crust and Degassing ........ 218 6.3 Volatile Ratios in Volcanic Plumes and Effects of Cooling and Mixing with
Air ......................................................................................................................... 223 6.4 Concluding Remarks............................................................................................. 224
Appendices.................................................................................................................. 226 Appendix A.................................................................................................................... 227 Appendix B.................................................................................................................... 228
Sample preparation............................................................................................... 228 Infrared spectroscopy ........................................................................................... 229 Electron microprobe.............................................................................................. 231 References ........................................................................................................... 232
Appendix C.................................................................................................................... 244 Modeling procedure for Dvap-melt values ................................................................. 244 References ........................................................................................................... 250
Appendix D.................................................................................................................... 252

viii
LIST OF FIGURES
Figure 2-1 Digital Elevation Map of the Galápagos archipelago showing the location of Sierra Negra and Fernandina calderas. ........................................ 43
Figure 2-2 Digital Elevation Map of the summit area of Sierra Negra showing the location of the gravity and continuous GPS stations referred to in this study.. ............................................................................................................. 44
Figure 2-3 Residual gravity change (BCFAG corrected) recorded at all stations referenced to June 2001................................................................................. 44
Figure 2-4 Maximum ∆g/∆h gradient for the time period 2002-2005 and 2006-2007 and theoretical FAG and calculated BCFAG ......................................... 45
Figure 2-5 Simplified cross-section through the caldera showing the location and geometry of the magma body in 2D (A), and in 3D (B)................................... 46
Figure 2-6 Modeled gravity change between June 2002 and 2005 caused by a 800-m thick homogeneous sill with 10% vesiculation..................................... 47
Figure 2-7 Modeled gravity change between June 2002 and 2005 caused by a 700-m thick sill with 10% vesiculation and a 50 m thick foam layer with 50% vesicularity at the top.............................................................................. 48
Figure 3-1 Map showing the locations of the volcanic arcs discussed in this study. .............................................................................................................. 98
Figure 3-2 Major element composition, K2O versus SiO2, of the Sunda arc magmas compared to other arcs discussed in this study.. ............................. 99
Figure 3-3 Multi-element spider diagram normalized to depleted MORB mantle. ........ 100 Figure 3-4 CO2 versus H2O contents of melt inclusions from Kawah Ijen..................... 101 Figure 3-5 Dy/Yb versus Nb/Y of average melt inclusion compositions from each
arc volcano. .................................................................................................. 102 Figure 3-6 Th-La-Sm ternary showing the composition of arc magmas ....................... 103 Figure 3-7 a) Th/La, b) Sr/Nd and c) Cl/Nd versus H2O/Ce of arc magmas. ................ 104 Figure 3-8 Ternary diagram Sr-Nd-Ba illustrating the role of the three subduction
component reservoirs ................................................................................... 105 Figure 3-9 Variations in volatile content (a) H2O; b) Cl; c) S and d) F) of parental
subduction zone magmas with respect to Sr................................................ 106 Figure 4-1 a) The location of the Ijen Caldera Complex on the island of Java,
Indonesia, b) The location of Kawah Ijen volcano within the Ijen Caldera Complex.......................................................................................... 165

ix
Figure 4-2 Compositional profiles (length and width) through an olivine phenocryst. ................................................................................................... 166
Figure 4-3 K2O variation diagrams versus: a) SiO2 and b) MgO................................... 167 Figure 4-4 MgO variation diagrams versus: a) CaO/Al2O3 ratio, b) FeOtotal (all iron
is reported as FeO) and c) TiO2.................................................................... 168 Figure 4-5 Variation in P2O5 content versus a) SiO2 and b) MgO. ................................ 169 Figure 4-6 H2O versus CO2 content of: a) the mafic melt inclusions (basaltic and
basaltic-andesite) and b) the dacitic melt inclusions and matrix glasses. ........................................................................................................ 170
Figure 4-7 Variation of H2O content with a) S, b) Cl, and c) F contents in the melt inclusions and matrix glasses....................................................................... 171
Figure 4-8 a) Sulphur contents in the basaltic and dacitic melt inclusions versus oxygen fugacity, b) calculated oxygen fugacity versus melt inclusion H2O content and volatile saturation pressure ............................................... 172
Figure 4-9 H2O-CO2-Stotal ternary diagram comparing the Kawah Ijen fumarole gases with high temperature (> 350 °C) fumarole gases from other arc volcanoes ..................................................................................................... 173
Figure 4-10 He-N2-Ar ternary diagram for the Kawah Ijen fumarole gases................... 174 Figure 4-11 HF-HCl-Stotal ternary diagram comparing the Kawah Ijen fumarole
gases with high temperature (> 350 °C) fumarole gases from other arc volcanoes ..................................................................................................... 175
Figure 4-12 Variation in the ratio of a) H2O, b) S, c) Cl and d) F over K2O contents as a function of melt inclusion trapping pressure and depth. ......... 176
Figure 4-13 Variation of the K2O/P2O5 ratio with a) K2O content (wt%), b) K2O/Cl ratio and c) K2O/F ratio. ................................................................................ 177
Figure 4-14 Pressure (and depth) versus modeled Dvap-melt values for S within the Kawah Ijen basaltic magma and for the evolution of basaltic to dacitic compositions................................................................................................. 178
Figure 4-15 Pressure (and depth) versus modeled Dvap-melt values for Cl within the dacitic magma and for a system where basaltic magma is evolving to dacitic compositions. .................................................................................... 179
Figure 5-1 a) The location of the Ijen Caldera Complex on the island of Java, Indonesia, b) the location of Kawah Ijen volcano within the Ijen Caldera Complex ....................................................................................................... 206
Figure 5-2 H2O-CO2-SO2 ternary diagram comparing the fumarole and plume compositions................................................................................................. 207
Figure 5-3 Volatile ratios a) H2O/CO2, b) H2O/SO2 and c) CO2/SO2 versus the % dilution by air calculated for each plume sample. ......................................... 208
Figure 5-4 Saturation of Kawah Ijen fumarole gases with respect to native S.............. 209 Figure 6-1 Microphotographs of a) tephra, b-c) olivine crystals and d-f) melt
inclusions from sample layers OT and TO at Kawah Ijen............................. 242 Figure 6-2 Ba contents versus volatile elements (both ratioed to La). .......................... 243

x
Figure 6-3 Concentration pathlength of SO2 through the plume versus time (minutes) taken to traverse........................................................................... 254

xi
LIST OF TABLES
Table 2-1 Summary of gravity and deformation data at Sierra Negra............................. 49 Table 3-1 Kawah Ijen melt inclusions (corrected for post-entrapment
modifications). .............................................................................................. 107 Table 4-1 Kawah Ijen melt inclusion and matrix glass compositions ............................ 180 Table 4-2 Fumarole gas compositions and sampling temperatures (2007 &
2008) ............................................................................................................ 184 Table 4-3 Model magmatic fluid compositions .............................................................. 185 Table 5-1 MultiGAS plume measurements ................................................................... 210 Table 5-2 Flyspec SO2 flux measurements................................................................... 211 Table 5-3 Partial fumarole compositions....................................................................... 212 Table 6-1 Major and volatile element concentrations in basaltic glasses and melt
inclusions from Sierra Negra ........................................................................ 227 Table 6-2 Analyzed olivine-hosted melt inclusion compositions from Kawah Ijen
(uncorrected for post-entrapment modification)............................................ 234 Table 6-3 Description of melt inclusions analysed ........................................................ 240 Table 6-4 Additional analysed olivine-hosted melt inclusion compositions from
Kawah Ijen (uncorrected for post-entrapment modification) ......................... 251
1
1: INTRODUCTION
1.1 Motivation
The study of magmatic volatiles (e.g., H2O, CO2, S, Cl and F) is
fundamental to our understanding of a variety of volcanic and geologic processes
such as magma generation, ascent, eruptability and eruption style (explosivity).
Most research on magmatic volatiles focuses on one of following aspects: 1) the
geochemistry and flux of these species into the atmosphere or the hydrosphere,
with the aim of understanding changes in volcanic activity or modeling the effects
on climate and water resources; 2) the abundance and geochemistry of
magmatic volatiles in various reservoirs (e.g., mantle, oceanic and continental
crust) and their transfer (flux) between these reservoirs (e.g., via mantle melting,
devolatilization of the oceanic lithosphere during subduction); 3) the behaviour of
these volatile species in near-surface magmas when they become saturated and
exsolve into a supercritical fluid or vapour phase, with the aim of better
understanding the effects of degassing on eruption dynamics and measured
volatile contents at the surface; and 4) the nature of exsolved volatile phases in
the upper crust in relation to the formation of hydrothermal fluids and mineral
deposits.
Our understanding of magmatic volatiles through these different research
themes has expanded greatly in the last 40 years due to improved analytical
techniques for measuring volatile concentrations in both silicate glasses and

2
minerals as well as in volcanic gases emitted at the surface. Different
methodologies target different problems. For example, the analysis of mineral-
hosted melt inclusions reveals the pre-eruptive volatile content of a magma as it
ascends, crystallizes and degasses, whereas the collection of surface
fumarole/plume samples reveals the composition of the exsolved fraction. With
our current “tool box” of field- and laboratory-based analytical techniques for
measuring volatile concentrations, a logical step is to integrate these
methodologies and merge our understanding of the different stages of volatile
evolution. Numerous recent studies have adopted this philosophy and approach;
some have combined melt inclusion data with plume gas compositions at active
volcanoes to gain insight into magma degassing depths and magma recharge
processes (e.g., Roberge et al., 2009; Edmonds et al., 2009), others have
combined fumarole gas compositions with SO2 flux determinations to constrain
the total volatile budget of an actively degassing volcano (e.g., Goff et al., 1998;
Aiuppa et al., 2005a,b). These studies have demonstrated the potential of
integrative geochemical studies but have also raised numerous new
questions/issues that need to be addressed with more complete, thorough
integrative studies (e.g. total S flux underestimates due to the lack of H2S
determinations in the plume; Aiuppa et al., 2005b).
This thesis integrates geochemical and geophysical methods with
modeling in order to characterize the transfer of volatiles through the mantle and
the crust to the atmosphere. The two questions/themes guiding this research are:
1) How do volatile ratios change as magma ascends from the mantle, through

3
the crust and out to the atmosphere? What does this reveal about the process of
fluid transfer in the mantle, the partitioning of volatile elements during mantle
melting and degassing of the magma through the crust, and finally the effect of
near-surface (e.g., interactions with groundwater and hydrothermal fluids), and
surface processes (e.g., cooling and mixing with air) on the gas species? 2) How
do differences in initial volatile contents and internal volcano structure influence
the types of eruptions and the emissions recorded at a volcano?
More specifically, this thesis offers insight into the following problems
previously recognized by other workers:
• In subduction zones, how are volatile elements transferred from the
subducting slab to the overlying mantle wedge? What is the
reservoir for these elements in the oceanic slab? Do the volatile
elements fractionate from each other during transfer from the slab
to the mantle wedge? (Chapter 3).
• How do volatile elements exsolve from a silicate melt upon ascent
through the crust? Is this process occurring in a closed or open
fashion (with respect to the transfer of mass into and out of the
magma)? How are the volatile elements fractionated from each
other during this process? (Chapters 2 and 4).
• How do the volatile species fractionate from each other in the
vapour phase upon shallow ascent and degassing at the surface?
(Chapter 4).

4
• How are the volatile species fractionated from each other at the
surface, when the magmatic vapours cool and interact with ambient
air? What affect does this have on the measured SO2 flux and the
calculated total volatile flux? How does this affect estimates of
magma mass and volume flux rates in the subsurface? (Chapter 5).
1.2 Methods
The following sections introduce the different methodologies employed in
this research. A more detailed account of the methods used can be found in each
chapter (2-5).
1.2.1 Melt inclusions
Almost 40 years ago, E. Roedder and V.S. Sobolev simultaneously
pioneered the use of melt inclusions from different ends of the globe. Roedder
explored silicate melt inclusions in the lunar basalts brought back from the Apollo
11 and 12 missions (e.g., Roedder and Weiblen, 1970), while Sobolev was
working with other former USSR scientists to develop the heating stage for the
determination of crystallization temperatures of minerals with trapped melt
inclusions and attempted to make the first determinations of volatile contents in
these melt inclusions (e.g., Sobolev et al., 1971). Results of these early works
are summarized in Sobolev and Kostyuk (1975) and Roedder (1979; 1984).
These early efforts where not widely adopted for lack of reliable analytical
techniques and uncertainty over the nature of melt inclusions. 1) They were
suspected of representing boundary layer (diffusion limited) melts at the edge of

5
crystals (e.g., Watson et al., 1982) or melts that had been trapped but later
experienced post-entrapment diffusion and crystallization (e.g., Gaetani and
Watson, 2000), 2) melt inclusion compositions were suggesting highly
heterogeneous melts (e.g., Nielsen et al., 1995), and 3) homogenization
temperatures were exceeding those determined by other methods (see review by
Lowenstern, 2003). In the last 15-20 years, with the development of more
advanced micro-analytical techniques (electron microprobe, ion microprobe, IR
microspectroscopy) along with more in-depth studies, melt inclusions have
become one of the most widely used petrographic tools for geochemists and
igneous petrologists. It is important to note that melt inclusions are still not
without their limitations. Workers have long recognized the effects of post-
entrapment cooling, crystallization and diffusion in high temperature melt
inclusions (e.g., olivine-hosted melt inclusions; Nielsen et al., 1998; Gaetani and
Watson, 2000) and numerous studies have been aimed at quantifying this effect
and correcting for it (e.g., Danyushevsky et al., 2000; 2002). Boundary layer
diffusion-limited effects may be important in some systems (e.g., Baker, 2008)
although many melt inclusion studies have concluded that in most cases,
boundary layer effects are limited or can be avoided by analyzing the largest melt
inclusions present (e.g., Anderson, 1974; Wallace, 2005; Métrich and Wallace,
2008). Other processes such as dissolution-reaction-mixing effects are still a
factor of concern for some melt inclusion datasets (e.g., Danyushevsky et al.,
2004), but if care is taken when interpreting the melt inclusion record, these
effects can be identified.
6
Early workers studied the degassing pattern of S and Cl in magmas using
electron microprobe analyses (e.g., Métrich and Clocchiatti, 1989). Workers now
analyse for S and Cl using both the electron and the ion microprobe (e.g., Hauri,
2002). The analysis of F with the microprobe is complicated by the position of its
primary X-ray energy on the shoulder of a more dominant energy peak of Fe in
Fe-bearing glasses and matrix effects affect F determination using the ion probe.
However, recent advances in data manipulation have improved our ability to
analyse F with both of these analytical techniques (e.g., Hauri, 2002; Witter and
Kuehner, 2004).
For H and C contents, different analytical techniques are required for
these atomically light elements (although ion microprobe analysis is now
calibrated to analyse for these). Vibrational microspectroscopy in the infrared and
near-infrared range has provided researchers with the means to obtain H2O and
CO2 contents in silicate melts as well as information on the speciation of these
volatiles (e.g., OH- versus molecular H2O; Stolper, 1982). The advent of
microspectroscopic techniques (micro Fourier Transform Infrared – FTIR
spectroscopy, micro Raman spectroscopy and the ion microprobe) has allowed
for H2O and CO2 contents to be determined in melt inclusions (see Devine et al.,
1995 for review).
Melt inclusions are now routinely analysed in a variety of different igneous
minerals across all types of igneous rocks in an effort to characterize a range of
processes including: 1) mantle melting mechanisms (e.g., Gurenko and
Chaussidon, 1995; Vigouroux et al., 2008a), 2) mantle enrichment processes
7
(e.g., Schiano et al., 1994; Vigouroux et al., 2008a), 3) fluid and volatile transport
in the mantle from a variety of tectonic settings (e.g., Sobolev and Chaussidon,
1996; Saal et al., 2002; Portnyagin et al., 2007), 4) magma ascent, storage and
mixing processes in the middle to upper crust (e.g., Hervig and Dunbar, 1992;
Blundy and Cashman, 2005; Reubi and Blundy, 2008; Vigouroux et al., 2009)
and 5) exsolution of magmatic volatiles, degassing mechanisms and link to
eruption dynamics (e.g., Barclay et al., 1996; Roggensack et al., 1997; Spilliaert
et al., 2006; Johnson et al., 2008).
1.2.2 UV correlation spectrometry
When the UV correlation spectrometer (COSPEC) emerged as a tool for
estimating the SO2 flux from a polluting source (e.g., Sperling, 1975), the
volcanological community could now measure degassing in a passive, remote
manner, which limited risky exposure to active volcanoes (e.g., Crafford, 1975).
Differential optical absorption spectroscopy (DOAS) was also being used for
tracking atmospheric trace pollutants (Global Ozone Monitoring Experiment)
aboard the satellite ERS-2 (e.g., Eisinger and Burrows, 1998) as well as for
estimating SO2 fluxes at active volcanoes via land-based remote measurement
(e.g., Edner et al., 1994). The COSPEC was the preferred monitoring tool over
the next 25-30 years until smaller, portable versions of the DOAS and the
COSPEC emerged (mini-DOAS; Galle et al., 2003, FLYSPEC; Horton et al.,
2006). Although the COSPEC is still used by some researchers, the portable
nature of the mini-DOAS and the FLYSPEC, as well as their more cost-effective
nature, allow them to be deployed more frequently and at more volcanoes,
8
including those where access by road or plane is not feasible (see review by
Nadeau and Williams-Jones, 2008). Recent studies have advanced our
understanding of the sources of uncertainty, namely wind speed determination at
plume height (e.g., Williams-Jones et al., 2006; Nadeau and Williams-Jones,
2009), and have reduced the errors associated with each measurement.
1.2.3 MultiGAS plume sensors
With the advent of portable gas sensors for environmental monitoring in the
industrial work place, volcanologists have been able to custom build a portable
Multi-component Gas Analyser System (MultiGAS) for the determination of gas
species in an accessible volcanic plume (Shinohara, 2005; Aiuppa et al., 2005a).
This instrument has three main advantages over other multi-component gas
detectors (e.g., Open-Path FTIR; Francis et al., 1996; McGee and Gerlach, 1998)
in that it is portable, does not require an external source of radiation (UV or IR)
and is more cost-effective. Due to advances in miniature electrochemical cells
and IR sensors (e.g., Alphasense Ltd.), the MultiGAS is able to analyse for the
major volcanic gas species: H2O (using pressure, temperature and relative
humidity sensors), CO2, CO, SO2, H2S, HCl with the potential to add more
species in the near future. There is also the potential to incorporate portable
stable isotope sensors (e.g., the Picarro 13C isotope analyser) with the MultiGAS,
making it a more complete geochemical tool and more comparable to the
traditional evacuated-flask sampling technique for fumarole gases (e.g.,
Giggenbach, 1975).

9
1.2.4 “Giggenbach” fumarole sampling
Volcanologists commonly use the evacuated-flask method to sample
fumarole gases. The method was initially developed by researchers at the
Hawaiian Volcano Observatory in the 1940s (e.g., Jaggar, 1940). This technique
was improved over the years to minimize contamination of the gas samples by
the sampling material (e.g., Giggenbach, 1975) and improve the capture and
subsequent analysis of the gas species (e.g., Giggenbach and Matsuo, 1991;
Giggenbach et al., 2001; Montegrossi et al., 2001; Sortino et al., 2006). The main
advantage of this sampling technique, commonly termed “Giggenbach” sampling
(after the Pyrex bottle that Werner Giggenbach developed), is the full range of
gas species that can be analysed (uncontaminated or diluted with air), the
potential to analyse minor species including trace metals (e.g., Fischer et al.,
1998) and the possibility of analyzing the isotopic composition of the gas species.
The main disadvantages are the nature of the sampling (the need to access the
high temperature gases in-situ) and the laboratory processing times required.
1.2.5 Dynamic micro-gravity surveys
A long-standing geophysical tool, used for a range of applications from
mineral exploration to volcanic monitoring, is the spring gravimeter (e.g., Lacoste
and Romberg - Scintrex Inc.). Repeat, relative microgravity measurements can
record changes in mass and/or density that take place in volcanic areas (e.g.,
Yokoyama and Tajima, 1957) with corrections made for earth and oceanic tidal
loading, instrument calibration issues and drift, and changes in elevation of the
survey area over time (see review in Williams-Jones et al., 2008). When

10
combined with seismic and deformation surveys (e.g., Global Positioning
System, Interferometric Synthetic Aperture Radar), microgravity surveys (in both
continuous and dynamic/survey mode) can detect and provide an understanding
of changes in subsurface mass and or density associated with magmatic activity
(e.g., Vigouroux et al., 2008b; see review in Williams-Jones et al., 2008). When
combined with estimates of volcanic gas fluxes, microgravity data can provide
insight into magma degassing rates and mechanisms as well as changes in
conduit permeability (e.g., Williams-Jones et al., 2003).
1.3 Approach
The aim of this study is to track the evolution of volatile species (H2O, CO2,
S, Cl and F) from the mantle, through the evolution of a magma in the crust, to
the eruption or passive degassing of the magma at the surface and release of the
volatiles to the atmosphere, by integrating the numerous geochemical and
geophysical methods described above.
This thesis is written in manuscript format with each of the central chapters
corresponding to a manuscript that has either been published or is to be
submitted. My two field sites are actively degassing volcanoes from two
contrasting tectonic settings: 1) the oceanic intra-plate hot spot volcano, Sierra
Negra, in the Galápagos archipelago (Chapter 2), and 2) the subduction-related
arc volcano, Kawah Ijen, on the island of Java, Indonesia (Chapters 3-5). A
discussion of the regional tectonic setting for both localities is given in Chapters 2
and 3 for Sierra Negra and Kawah Ijen, respectively. Both locations offer
relatively easy access to the volcano itself and to the fumaroles and volcanic

11
plume emanating from them. Additionally, both volcanoes have been studied
prior to this work, offering a background of knowledge on the petrography,
geochemistry and geophysical aspects of each.
The recent activity at Sierra Negra (eruption of 2005 and pre-eruptive
activity since 1991) has been described by numerous authors (Chadwick et al.,
2006; Yun et al., 2006; Geist et al., 2006; 2008) and the physical volcanology,
structural development and petrology of the lavas at Sierra Negra have been
described by Reynolds et al. (1995) and Reynolds and Geist (1995). Additionally,
two published studies of the fumaroles at Sierra Negra are available (Colony and
Nordlie, 1973; Goff et al., 2001); At Kawah Ijen, studies (some dating back to the
1920s when the Dutch still occupied Indonesia) describe the structural and
magmatic evolution of Kawah Ijen and the Ijen caldera complex (Sitorus, 1990;
Berlo, 2001; van Hinsberg, 2001 and references therein; Handley et al., 2007).
The crater lake structure, as well as the geochemistry of the lake waters, acid
springs and fumarole gases were studied in the 1990s and 2000s (Delmelle and
Bernard, 1994, 2000; Delmelle et al., 2000; van Hinsberg, 2001; Takano et al.,
2004; Palmer, 2009; van Hinsberg et al., 2010a,b).
At Sierra Negra, the project focuses on integrating geophysical and
geochemical methods to understand the physical process of shallow magma
storage, degassing and eruption. My research consisted of 5 field surveys of
microgravity (over 2 years). Field work was performed with the collaboration of
Andres Gorki Ruiz (University of Idaho), Glyn Williams-Jones (senior supervisor),
Bill Chadwick (NOAA-Oregon State University) and Kim Berlo (McGill University).

12
Samples of basaltic glass from the submarine flanks of Sierra Negra were
obtained from Dennis Geist (University of Idaho) and analysed for volatile and
major element composition (Appendix A). The microgravity measurements were
collected following the 2005 eruption of Sierra Negra and are compared to
measurements collected prior to the eruption (Geist et al., 2006; D. Johnson –
previously unpublished). Combined with deformation data (continuous and
survey GPS data collected and processed by Bill Chadwick, Dennis Geist and
Andres Ruiz) and estimates of pre-eruptive and erupted volatile concentrations
(Koleszar et al., 2007; Appendix A), these data sets reveal the mechanism by
which the latest eruption of Sierra Negra proceeded. The study is published as:
Vigouroux, N., Williams-Jones, G., Chadwick, W., Geist, D., Ruiz, A.G. &
Johnson, D. (2008). 4D gravity changes associated with the 2005 eruption of
Sierra Negra, Galapagos. Geophysics, 73 (6), WA29-35. The exact nature of the
collaboration is summarized at the beginning of Chapter 2.
At Kawah Ijen, the project focuses on an integrative geochemical study of
the transport of volatiles from the mantle, through shallow crustal reservoirs and
overlying hydrothermal systems, to the surface. My research was conducted over
3 field seasons and consisted of yearly fumarole gas sampling, MultiGAS plume
analysis, SO2 flux determinations and tephra (pyroclastic rock) sampling for melt
inclusion and matrix glass analysis. This field work was done in collaboration with
the Kawah Ijen research team composed of scientists from both Simon Fraser
University and McGill University, as well as numerous volunteers. Results of the
study are presented in collaboration with Glyn Williams-Jones, Paul Wallace
13
(University of Oregon), Adam Kent (Oregon State University), Katherine Kelly
(University of Rhode Island), Vincent van Hinsberg (McGill University), Kim Berlo
(McGill University) and A.E. (Willy) Williams-Jones (McGill University) and are
reported in Chapters 3-5 with additional material presented in Appendices B-D.
The exact nature of the collaborations are summarized at the beginning of each
chapter. Chapter 3 uses olivine-hosted melt inclusion major, trace and volatile
element compositions to identify the nature of the mantle source for the parental
magmas of Kawah Ijen, the nature of the subduction-derived fluid introduced into
this mantle and the origin of this fluid within the oceanic lithosphere. Results for
Kawah Ijen are compared to another arc-front volcano in Indonesia, Galunggung
(unpublished data from Katherine Kelly) and to published data for other arcs
worldwide (Kamchatka: Portnyagin et al., 2007; Central America: Sadofsky et al.,
2008; Mexico: Johnson et al., 2009). This comparison allows for global trends in
subduction zone volatile recycling to be identified and quantification of the
mobility of volatile elements during slab subduction. These results will be
submitted for publication to the journal Geochemistry, Geophysics, Geosystems.
Chapter 4 combines the olivine-hosted melt inclusion record with
additional olivine-hosted and orthopyroxene- and plagioclase-hosted melt
inclusion data from Kim Berlo to define the magmatic and volatile evolution of the
erupted products of Kawah Ijen. Matrix glass compositions from the basaltic
tephra, the dacite pumice (from Kim Berlo) and the dome lava (van Hinsberg et
al., 2010b) are also combined to obtain a complete magma differentiation and
degassing trend. The data suggests that CO2-rich vapour fluxing through the
14
plumbing system has been a dominant process at Kawah Ijen in the past. The
melt inclusion and glass data are modeled using simple mass balance
constraints to generate vapour-melt partition coefficients for the volatile elements
S and Cl upon ascent, degassing and crystallization of the magma under
different degassing style scenarios and magma compositions. These results are
combined with fumarole gas H2O and CO2 contents to estimate the magmatic
fluid composition currently degassing at Kawah Ijen. This model S-Cl fluid
composition is then compared to the composition of fumarole gases, and crater
lake and acid spring waters in order to model the effects of ascent and cooling of
the magmatic fluid as well as possible interaction with the hydrothermal system.
These results will be submitted for publication to the Journal of Volcanology and
Geothermal Research.
Chapter 5 explores the recent activity at Kawah Ijen and estimates the rate
of magma influx into the system required to sustain over 100 years of degassing
unaccompanied by a magmatic eruption. The study combines the fumarole gas
compositions with those determined in the plume, at various levels of dilution and
reaction with air, concluding that there is a very significant depletion of magmatic
SO2 concentrations from the pure magmatic gas phase to the plume (up to 98%
loss). This results in large underestimates in volcanic degassing rate (reflected in
the low SO2 flux measured: ~25 tonnes day-1) in large part from S saturation of
the magmatic gases and subsequent precipitation of S-bearing compounds in the
vent and near-vent area. These results will be submitted for publication to the
journal Geology.
15
Finally, the conclusions in Chapter 6 summarize the results of the
research presented in this thesis and re-address the two guiding questions,
emphasizing the need for integrative research and a multi-disciplinary approach
to the understanding of magmatic and volcanic processes.
1.4 References
Aiuppa, A., Federico, C., Giudice, G., Gurrieri, S., 2005a. Chemical mapping of a fumarolic field: La Fossa Crater, Vulcano Island (Aeolian Islands, Italy). Geophys. Res. Lett. 32 (13), L13309.
Aiuppa, A., Inguaggiato, S., McGonigle, A.J.S., O'Dwyer, M., Oppenheimer, C., Padgett, M.J., Rouwet, D., Valenza, M., 2005b. H2S fluxes from Mt. Etna, Stromboli, and Vulcano (Italy) and implications for the sulphur budget at volcanoes. Geochim. Cosmochim. Acta 69 (7), 1861-1871.
Anderson, A.T. 1974. Evidence for a picritic, volatile-rich magma beneath Mt. Shasta, California. J. Petrol. 15 (2), 243-267.
Baker, D.R. 2008. The fidelity of melt inclusions as records of melt composition. Contrib. Mineral. Petrol. 156 (3), 377-395.
Barclay, J., Carroll, M.R., Houghton, B.F., Wilson, C.J.N., 1996. Pre-eruptive volatile content and degassing history of an evolving peralkaline volcano. J. Volcanol. Geotherm. Res. 74 (1-2), 75-87.
Berlo, K., 2001. The magmatic evolution of the Ijen caldera, East Java, Indonesia. M.Sc. thesis, University of Utrecht, Netherlands.
Blundy, J., Cashman, K., 2005. Rapid decompression-driven crystallization recorded by melt inclusions from Mount St. Helens volcano. Geology 33 (10), 793-796.
Chadwick, W.W., Geist, D.J., Jónsson, S., Poland, M., Johnson, D.J., Meertens, C.M., 2006. A volcano bursting at the seams: Inflation, faulting, and eruption at Sierra Negra volcano, Galápagos. Geology 34 (12), 1025-1028.
Colony, W.E., Nordlie, B.E., 1973. Liquid sulphur at Volcan Azufre, Galápagos Islands. Econ. Geol. 68 (3), 371-380.
Crafford, T.C. 1975. SO2 emission of the 1974 eruption of Volcán Fuego, Guatemala. Bull. Volcanol. 39 (4), 536-556.

16
Danyushevsky, L.V., Della-Pasqua, F.N., Sokolov, S., 2000. Re-equilibration of melt inclusions trapped by magnesian olivine phenocrysts from subduction-related magmas: petrological implications. Contrib. Mineral. Petrol. 138 (1), 68-83.
Danyushevky, L.V., Leslie, R.A.J., Crawford, A.J., Durance, P., 2004. Melt inclusions in primitive olivine phenocrysts: the role of localized reaction processes in the origin of anomalous compositions. J.Petrol. 45 (12), 2531-2553.
Danyushevk, L.V., Sokolov, S., Falloon, T.J., 2002. Melt inclusions in olivine phenocrysts: using diffusive re-equilibration to determine the cooling history of a crystal, with implications for the origin of olivine-phyric volcanic rocks. J.Petrol. 43 (9), 1651-1671.
Delmelle, P., Bernard, A., 2000. Downstream composition changes of acidic volcanic waters discharged into the Banyupahit stream, Ijen caldera, Indonesia. J.Volcanol.Geotherm.Res. 97 (1-4), 55-75.
Delmelle, P., Bernard, A., 1994. Geochemistry, mineralogy, and chemical modeling of the acid crater lake of Kawah Ijen volcano, Indonesia. Geochim. Cosmochim. Acta 58 (11), 2445-2460.
Delmelle, P., Bernard, A., Kusakabe, M., Fischer, T.P., Takano, B., 2000. Geochemistry of the magmatic-hydrothermal system of Kawah Ijen volcano, East Java, Indonesia. J. Volcanol. Geotherm. Res. 97 (1-4), 31-53.
Devine, J.D., Gardner, J.E., Brack, H.P., Layne, G.D., Rutherford, M.J., 1995. Comparison of microanalytical methods for estimating H2O contents of silicic volcanic glasses. Am. Mineral. 80 (3-4), 319-328.
Edmonds, M., Gerlach, T.M., Herd, R.A., 2009. Halogen degassing during ascent and eruption of water-poor basaltic magma. Chem. Geol. 263 (1-4), 122-130.
Edner, H., Ragnarson, P., Svanberg, S., Wallinder, E., Ferrara, R., Cioni, R., Raco, B., Taddeucci, G., 1994. Total fluxes of sulphur dioxide from the italian volcanoes Etna, Stromboli, and Vulcano measured by differential absorption lidar and passive differential optical absorption spectroscopy. J. Geophys. Res. 99 (D9), 18827.
Eisinger, M., Burrows, J.P., 1998. Tropospheric sulphur dioxide observed by the ERS-2 GOME instrument. Geophys. Res. Lett. 25 (22), 4177-4180.
Fischer, T.P., Giggenbach, W.F., Sano, Y., Williams, S.N., 1998. Fluxes and sources of volatiles discharged from Kudryavy, a subduction zone volcano, Kurile Islands. Earth Planet. Sci. Lett. 160 (1-2), 81-96.
17
Francis, P., Chaffin, C., Maciejewski, A., Oppenheimer, C., 1996. Remote determination of SiF4 in volcanic plumes: A new tool for volcano monitoring. Geophys. Res. Lett. 23 (3), 249-252.
Gaetani, G.A., Watson, E.B., 2000. Open system behavior of olivine-hosted melt inclusions. Earth Planet. Sci. Lett. 183 (1-2), 27-41.
Galle, B., Oppenheimer, C., Geyer, A., McGonigle, A.J.S., Edmonds, M., Horrocks, L., 2003. A miniaturised ultraviolet spectrometer for remote sensing of SO2 fluxes: A new tool for volcano surveillance. J. Volcanol. Geotherm. Res. 119 (1-4), 241-254.
Geist, D., Chadwick, W., Johnson, D., 2006. Results from new GPS and gravity monitoring networks at Fernandina and Sierra Negra volcanoes, Galápagos, 2000-2002. J. Volcanol. Geotherm. Res. 150 (1-3), 79-97.
Geist, D.J., Harpp, K.S., Naumann, T.R., Poland, M., Chadwick, W.W., Hall, M., Rader, E., 2008. The 2005 eruption of Sierra Negra volcano, Galápagos, Ecuador. Bull. Volcanol. 70 (6), 655-673.
Giggenbach, W.F. 1975. A simple method for the collection and analysis of volcanic gas samples. Bull. Volcanol. 39 (1), 132-145.
Giggenbach, W.F., Matsuo, S., 1991. Evaluation of results from second and third IAVCEI field workshops on volcanic gases, Mt Usu, Japan, and White Island, New Zealand. Appl. Geochem. 6 (2), 125-141.
Giggenbach, W.F., Tedesco, D., Sulistiyo, Y., Caprai, A., Cioni, R., Favara, R., Fischer, T.P., Hirabayashi, J.I., Korzhinsky, M., Martini, M., 2001. Evaluation of results from the fourth and fifth IAVCEI field workshops on volcanic gases, Vulcano Island, Italy and Java, Indonesia. J. Volcanol. Geotherm. Res. 108 (1-4), 157-172.
Goff, F., Janik, C.J., Delgado, H., Werner, C., Counce, D., Stimac, J.A., Siebe, C., Love, S.P., Williams, S.N., Fischer, T., 1998. Geochemical surveillance of magmatic volatiles at Popocatépetl volcano, Mexico. Bull. Geol. Soc. Am. 110 (6), 695-710.
Goff, F., McMurtry, G.M., Counce, D., Simac, J.A., Roldán-Manzo, A.R., Hilton, D.R., 2000. Contrasting hydrothermal activity at Sierra Negra and Alcedo volcanoes, Galápagos archipelago, Ecuador. Bull. Volcanol. 62 (1), 34-52.
Gurenko, A.A., Chaussidon, M., 1995. Enriched and depleted primitive melts included in olivine from icelandic tholeiites: origin by continuous melting of a single mantle column. Geochim. Cosmochim. Acta 59 (14), 2905-2917.
Handley, H.K., Macpherson, C.G., Davidson, J.P., Berlo, K., Lowry, D., 2007. Constraining fluid and sediment contributions to subduction-related magmatism in Indonesia: Ijen Volcanic Complex. J. Petrol. 48 (6), 1155.

18
Hauri, E. 2002. SIMS analysis of volatiles in silicate glasses, 2: Isotopes and abundances in Hawaiian melt inclusions. Chem. Geol. 183 (1-4), 115-141.
Hervig, R.L., Dunbar, N.W., 1992. Cause of chemical zoning in the Bishop (California) and Bandelier (New Mexico) magma chambers. Earth Planet. Sci. Lett. 111 (1), 97-108.
Horton, K.A., Williams-Jones, G., Garbeil, H., Elias, T., Sutton, A.J., Mouginis-Mark, P., Porter, J.N., Clegg, S., 2006. Real-time measurement of volcanic SO2 emissions: Validation of a new UV correlation spectrometer (FLYSPEC). Bull. Volcanol. 68 (4), 323-327.
Jaggar, T.A. 1940. Magmatic gases. Am. J. Science 238 (5), 313-353.
Johnson, E.R., Wallace, P.J., Cashman, K.V., Granados, H.D., Kent, A.J.R., 2008. Magmatic volatile contents and degassing-induced crystallization at Volcán Jorullo, Mexico: Implications for melt evolution and the plumbing systems of monogenetic volcanoes. Earth Planet. Sci. Lett. 269 (3-4), 478-487.
Johnson, E.R., Wallace, P.J., Delgado Granados, H., Manea, V.C., Kent, A.J.R., Bindeman, I., Donegan, C.S., 2009. Subduction-related volatile recycling and magma generation beneath central Mexico: Insights from melt inclusions, oxygen isotopes and geodynamic models. J. Petrol. 50 (9), 1729-1764.
Koleszar, A.M., Saal, A.E., Hauri, E.H., Nagle, A.N., Liang, Y., Kurz, M.D., 2009. The volatile contents of the Galápagos plume; evidence for H2O and F open system behavior in melt inclusions. Earth Planet. Sci. Lett. 287 (3-4), 442-452.
Lowenstern, J.B. 2003. Melt inclusions come of age: Volatiles, volcanoes, and Sorby's legacy. Develop. Volcano. 5, 1-21.
McGee, K.A., Gerlach, T.M., 1998. Airborne volcanic plume measurements using a FTIR spectrometer, Kilauea volcano, Hawaii. Geophys. Res. Lett. 25 (5), 615-618.
Métrich, N., Clocchiatti, R., 1989. Melt inclusion investigation of the volatile behaviour in historic alkali basaltic magmas of Etna. Bull. Volcanol. 51 (3), 185-198.
Métrich, N., Wallace, P.J., 2008. Volatile abundances in basaltic magmas and their degassing paths tracked by melt inclusions. Rev. Mineral. Geochem. 69 (1), 363.
Montegrossi, G., Tassi, F., Vaselli, O., Buccianti, A., Garofalo, K., 2001. Sulphur species in volcanic gases. Anal. Chem. 73 (15), 3709-3715.
19
Nadeau, P.A., Williams-Jones, G., 2008. Beyond COSPEC – Recent advances in SO2 monitoring technology. In: Williams-Jones, G., Stix, J., Hickson, C. (eds.). The COSPEC Cookbook: Making SO2 measurements at active volcanoes. IAVCEI Methods in Volcanology 1, 219-233.
Nadeau, P.A., Williams-Jones, G., 2009. Apparent downwind depletion of volcanic SO2 flux—lessons from Masaya volcano, Nicaragua. Bull. Volcanol. 71 (4), 389-400.
Nielsen, R.L., Crum, J., Bourgeois, R., Hascall, K., Forsythe, L.M., Fisk, M.R., Christie, D.M., 1995. Melt inclusions in high-An plagioclase from the Gorda Ridge: An example of the local diversity of MORB parent magmas. Contrib. Mineral. Petrol. 122 (1), 34-50.
Nielsen, R.L., Michael, P.J., Sours-Page, R., 1998. Chemical and physical indicators of compromised melt inclusions. Geochim. Cosmochim. Acta 62 (5), 831-839.
Palmer, S., 2009. Hydrogeochemistry of the upper Banyu Pahit River valley, Kawah Ijen volcano, Indonesia. M.Sc. Thesis. McGill University, Montréal, Canada, 144 pp.
Portnyagin, M., Hoernle, K., Plechov, P., Mironov, N., Khubunaya, S., 2007. Constraints on mantle melting and composition and nature of slab components in volcanic arcs from volatiles (H2O, S, Cl, F) and trace elements in melt inclusions from the Kamchatka arc. Earth Planet. Sci. Lett. 255 (1-2), 53-69.
Reynolds, R.W., Geist, D.J., 1995. Petrology of lavas from sierra negra volcano, isabela island, galápagos archipelago. J. Geophys. Res. 100 (B12), 24537.
Reynolds, R.W., Geist, D., Kurz, M.D., 1995. Physical volcanology and structural development of Sierra Negra volcano, Isabela Island, Galápagos archipelago. Geol. Soc. Am. Bul. 107 (12), 1398-1410.
Roberge, J., Delgado-Granados, H., Wallace, P.J., 2009. Mafic magma recharge supplies high CO2 and SO2 gas fluxes from Popocatépetl volcano, Mexico. Geology 37 (2), 107.
Roedder, E., 1979. Silicate liquid immiscibility in magmas. In: Yoder H.S. (ed.). The evolution of the igneous rocks, fiftieth anniversary perspectives. Princeton Univ. Press, 15-57.
Roedder, E., 1984. Fluid Inclusions. Reviews in Mineralogy. Mineral. Soc. Amer. 12, 644.
Roedder, E., Weiblen, P.W., 1970. Silicate liquid immiscibility in lunar magmas, evidenced by melt inclusions in lunar rocks. Science 167 (3918), 641-644.

20
Roggensack, K., Hervig, R.L., McKnight, S.B., Williams, S.N., 1997. Explosive basaltic volcanism from Cerro Negro volcano: Influence of volatiles on eruptive style. Science 277 (5332), 1639-1642.
Saal, A.E., Hauri, E.H., Langmuir, C.H., Perfit, M.R., 2002. Vapour undersaturation in primitive mid-ocean-ridge basalt and the volatile content of earth's upper mantle. Nature 419 (6906), 451-455.
Sadofsky, S.J., Portnyagin, M., Hoernle, K., van den Bogaard, P., 2008. Subduction cycling of volatiles and trace elements through the Central American volcanic arc: Evidence from melt inclusions. Contrib. Mineral. Petrol. 155 (4), 433-456.
Schiano, P., Clocchiatti, R., Shimizu, N., Weis, D., Mattielli, N., 1994. Cogenetic silica-rich and carbonate-rich melts trapped in mantle minerals in Kerguelen ultramafic xenoliths: Implications for metasomatism in the oceanic upper mantle. Earth Planet. Sci. Lett. 123 (1-3), 167-178.
Shinohara, H. 2005. A new technique to estimate volcanic gas composition: Plume measurements with a portable multi-sensor system. J. Volcanol. Geotherm. Res. 143 (4), 319-333.
Sitorus, K., 1990. Volcanic stratigraphy and geochemistry of the Idjen Caldera Complex, East Java, Indonesia. M.Sc. thesis, University of Wellington, New Zealand.
Sobolev, A.V., Chaussidon, M., 1996. H2O concentrations in primary melts from supra-subduction zones and mid-ocean ridges: Implications for H2O storage and recycling in the mantle. Earth Planet. Sci. Lett. 137 (1-4), 45-55.
Sobolev V. S., Kostyuk V. P., 1975. Magmatic crystallization based on a study of melt inclusions. In: Roedder E., Kozlowski A. (eds.). Fluid Inclusion Research 9, 182-253.
Sobolev, V.S., Bazarova, T.Y., Bakumenko, I.T., 1971. Crystallization temperature and gas phase composition of alkaline effusives as indicated by primary melt inclusions in the phenocrysts. Bull. Volcanol. 35 (2), 479-496.
Sortino, F., Nonell, A., Toutain, J.P., Munoz, M., Valladon, M., Volpicelli, G., 2006. A new method for sampling fumarolic gases: Analysis of major, minor and metallic trace elements with ammonia solutions. J. Volcanol. Geotherm. Res. 158 (3-4), 244-256.
Sperling, R. B. 1975. Evaluation of the correlation spectrometer as an area SO2 monitor. Environmental Measurements, Inc., PB-249113, 115.

21
Spilliaert, N., Allard, P., Métrich, N., Sobolev, A.V., 2006. Melt inclusion record of the conditions of ascent, degassing, and extrusion of volatile-rich alkali basalt during the powerful 2002 flank eruption of Mount Etna (Italy). J. Geophys. Res. 111 (B4), B04203.
Stolper, E. 1982. Water in silicate glasses: An infrared spectroscopic study. Contrib. Mineral. Petrol. 81 (1), 1-17.
Takano, B., Suzuki, K., Sugimori, K., Ohba, T., Fazlullin, S.M., Bernard, A., Sumarti, S., Sukhyar, R., Hirabayashi, M., 2004. Bathymetric and geochemical investigation of Kawah Ijen crater lake, East Java, Indonesia. J. Volcanol. Geotherm. Res. 135 (4), 299-329.
van Hinsberg, V.J., 2001. Water-rock interaction and element fluxes in the Kawah Ijen hyperacid crater lake and the Banyu Pahit river, East Java, Indonesia. M.Sc. thesis, University of Utrecht, Netherlands.
van Hinsberg, V., Berlo, K., van Bergen, M., Williams-Jones, A.E., 2010a. Extreme alteration by hyperacidic brines at Kawah Ijen volcano, East Java, Indonesia: I. textural and mineralogical imprint. J. Volcanol. Geotherm. Res. 198 (1-2), 253-263.
van Hinsberg, V., Berlo, K., Sumarti, S., van Bergen, M., Williams-Jones, A.E., 2010b. Extreme alteration by hyperacidic brines at Kawah Ijen volcano, East Java, Indonesia: II. metasomatic imprint and element fluxes. J. Volcanol. Geotherm. Res. 196 (3-4), 169-184.
Vigouroux, N., Wallace, P.J., Kent, A.J.R., 2008a. Volatiles in high-K magmas from the western Trans-Mexican volcanic belt: Evidence for fluid fluxing and extreme enrichment of the mantle wedge by subduction processes. J. Petrol. 49 (9), 1589-1618.
Vigouroux, N., Williams-Jones, G., Chadwick, W., Geist, D., Ruiz, A., Johnson, D., 2008b. 4D gravity changes associated with the 2005 eruption of Sierra Negra volcano, galápagos. 73 (6), WA29.
Vigouroux, N., Williams-Jones, A.E., Wallace, P., Staudacher, T., 2009. The November 2002 eruption of Piton de la Fournaise, Réunion: Tracking the pre-eruptive thermal evolution of magma using melt inclusions. Bull. Volcanol. 71 (9), 1077-1089.
Wallace, P.J. 2005. Volatiles in subduction zone magmas: Concentrations and fluxes based on melt inclusion and volcanic gas data. J. Volcanol. Geotherm. Res. 140 (1-3), 217-240.
Watson, E.B., Sneeringer, M.A., Ross, A., 1982. Diffusion of dissolved carbonate in magmas: Experimental results and applications. Earth Planet. Sci. Lett. 61 (2), 346-358.

22
Williams-Jones, G., Horton, K.A., Elias, T., Garbeil, H., Mouginis-Mark, P.J., Sutton, A.J., Harris, A.J.L., 2006. Accurately measuring volcanic plume velocity with multiple UV spectrometers. Bull. Volcanol. 68 (4), 328-332.
Williams-Jones, G., Rymer, H., Mauri, G., Gottsmann, J., Poland, M., Carbone, D., 2008. Toward continuous 4D microgravity monitoring of volcanoes. Geophys. 73 (6), WA19-WA28.
Williams-Jones, G., Rymer, H., Rothery, D.A., 2003. Gravity changes and passive SO2 degassing at the Masaya caldera complex, Nicaragua. J. Volcanol. Geotherm. Res. 123 (1-2), 137-160.
Witter, J.B., Kuehner, S.M., 2004. A simple empirical method for high-quality electron microprobe analysis of fluorine at trace levels in Fe-bearing minerals and glasses. Am. Mineral. 89 (1), 57-63.
Yokoyama, I., Tajima, H., 1957. A gravity survey on volcano Mihar, Ooshima Island by means of a worden gravimeter. Bull. Earthq. Res. Inst. 35 23-33.
Yun, S., Segall, P., Zebker, H., 2006. Constraints on magma chamber geometry at Sierra Negra Volcano, Galápagos Islands, based on InSAR observations. J. Volcanol. Geotherm. Res. 150 (1-3), 232-243.

23
2: 4D GRAVITY CHANGES ASSOCIATED WITH THE 2005 ERUPTION OF SIERRA NEGRA VOLCANO, GALÁPAGOS1
2.1 Abstract
Sierra Negra volcano, the most voluminous shield volcano in the Galápagos
archipelago and one of the largest basaltic calderas in the world, erupted on
October 22, 2005 after more than 25 years of quiescence. GPS and InSAR
monitoring of the deformation of the caldera floor in the months prior to the
eruption documented extraordinary inflation rates (1 cm day-1). The total amount
of uplift recorded since monitoring began in 1992 approached 5 m at the centre
of the caldera. To gain insight into the nature of the subsurface mass/density
changes associated with the inflation leading up to the eruption, gravity
measurements performed in 2005, 2006 and 2007 are compared to previous
measurements from 2001 and 2002 when the volcano underwent a period of
minor deflation and magma withdrawal. The residual gravity decrease between
2001/2002 and 2005 is amongst the largest ever recorded at an active volcano (-
950 μGal) and suggests that inflation was accompanied by a relative density
decrease in the magmatic system. Forward modeling of the residual gravity data
1 A version of the following chapter has been published as: Vigouroux, N., Williams-Jones, G.,
Chadwick, W., Geist, D., Ruiz, A.G. & Johnson, D. (2008). 4D gravity changes associated with the 2005 eruption of Sierra Negra, Galapagos. Geophysics, 73 (6), WA29-35. The collaboration involved field assistance, discussion of the modeling and manuscript reviews from G. Williams-Jones, W. Chadwick and D. Geist, field assistance and deformation modeling from A. Ruiz and gravity data for 2005 from D. Johnson as well as cross-calibration data for the two gravimeters used in this study.

24
in 4D (from 2002 to 2005) gives an estimate of the amount of vesiculation in the
shallow sill required to explain the observed gravity variations. Geochemical
constraints from melt inclusion and satellite remote-sensing data allow us to
estimate the pre-eruptive gas content of the magma and place constraints on the
thickness of the gas-rich sill necessary to produce the gravity anomalies
observed. Results suggest that reasonable sill thicknesses (700-800 m) and gas
contents (10-50%) can explain the large decrease in residual gravity prior to
eruption. Following the eruption (2006 and 2007), the deformation and gravity
patterns suggest re-equilibration of the pressure regime in the shallow magma
system perhaps via renewed influx of relatively gas-poor magma into the shallow
parts of the system.
2.2 Introduction
Information on mass changes in the subsurface over time can be obtained
from microgravity surveys. In volcanic systems, changes in magma supply rate
(influx or withdrawal), changes in the vesicularity of magma, and changes in the
size or depth of a hydrothermal system can affect the gravity field measured at
the surface (e.g. Tiede; Gottsmann et al., 2006). Typically, gravity variations on
the order of 100s of μGals are recorded over years to decades and are
associated with vertical deformation on the order of a few centimetres to a few
meters (e.g., Rymer, 1996; Battaglia et al., 1999). When combined with
simultaneous data on elevation change (using GPS or InSAR), microgravity
surveys allow us to investigate the causes of ground deformation in active
volcanic areas and evaluate the likelihood of an impeding eruption (e.g.,

25
Yokoyama and Tajima, 1957) at a variety of volcanoes, from large silicic calderas
(e.g., Campi Flegrei; Berrino et al., 1984) to composite stratovolcanoes (e.g.,
Merapi; Jousset et al. 2000) to basaltic calderas (e.g., Kilauea; Johnson, 1992).
Logistical constraints usually limit the spatial and temporal coverage of the
gravity network in remote volcanic areas. However, combined with high
precision, continuously recorded ground deformation data, even sparse
microgravity data can provide important information on the source of physical
unrest at a volcano (e.g. Kauahikaua and Miklius, 2003).
In this contribution, we present gravity data collected prior to and following
the October 2005 eruption. In combination with previously published microgravity
data on Sierra Negra (Geist et al., 2006), time series analysis of both
microgravity and continuous deformation data offers insight into the subsurface
processes associated with the 2005 eruption. We use previously published
models of the magma reservoir obtained from inversion of deformation data
(Amelung et al., 2000; Chadwick et al., 2006; Geist et al., 2006; Yun et al., 2006)
to model the changes in subsurface conditions that can reasonably explain the
gravity data.
2.3 Geologic Setting and the 2005 Eruption
The Galápagos archipelago is a group of volcanic ocean islands built on
the Nazca plate above the Galápagos hot spot, about 200 km south of the
Galápagos spreading ridge and 1000 km west of continental Ecuador (Fig. 2-1).
The archipelago consists of ~ 15 islands and 20 shield volcanoes along with
numerous islets and seamounts, all of which are constructed on a broad and
26
shallow submarine platform (the Galápagos swell) rising ~ 2000 m above the
surrounding ocean floor (Villagómez et al., 2007). Nearly all of the shield
volcanoes have been active in the Holocene (Simkin and Siebert, 1994).
Although the Nazca plate is moving east relative to the hot spot, volcanism does
not clearly evolve from east to west perhaps as a result of spreading of the plume
at the base of the lithosphere with little drag effect from the overriding plate
(Villagómez et al., 2007).
Sierra Negra volcano is a large shield volcano on Isabela Island (Fig. 2-1).
It is the second most active volcano in the Galápagos archipelago (after
Fernandina with 12 eruptions since historical recordings began approximately
200 years ago; Smithsonian Institute database) and is by far the most
voluminous. Sierra Negra has one of the largest calderas of any basaltic volcano
on the planet (10 x 9 km; Wood, 1984). The caldera floor has been uplifted by up
to 100 m in the SW corner as a result of repeated slip along a sinuous fault
system (Fig. 2-2; Reynolds et al., 1995; Chadwick et al., 2006). The northeast
side of the fault block forms a dip slope, resulting in a trapdoor/asymmetric
geometry (Lipman, 1997). Located at the base of the western end of the fault
scarp is Volcan Azufre, the current center of fumarolic activity. The small
fumarole field consists of a main fumarole vent ~ 12 m in diameter, from which
the highest gas flux emanates, as well as numerous smaller vents and fissures.
The basaltic lavas of Sierra Negra are phenocryst poor (< 5%) Fe-rich
tholeiites composed of plagioclase (An61-82) + olivine (Fo62-88), clinopyroxene
(En41-47, Wo35-44, Fs9-22) and Fe-Ti oxides (Reynolds and Geist, 1995). The lavas
27
have a very restricted compositional range (4.4 to 6.9 wt% MgO) over an eruptive
period of at least 5000 years which suggests a stable plumbing system, high
magma supply rates, homogeneous source melting and steady thermal
conditions in the crust and lithosphere (Reynolds and Geist, 1995). This is
consistent with the large volumes of erupted material (1 km3 in 1979; Reynolds et
al., 1995) and the frequency of eruption at Sierra Negra (an eruption every 10-30
years on average In the last 200 years; Smithsonian Institute).
On October 22, 2005, after a 26 year hiatus, Sierra Negra erupted more
than 150 x 106 m3 of aphyric (crystal-free) basaltic lava (Geist et al., 2008) from a
series of arcuate vents along the northern caldera rim (Fig. 2-2), a common
feature of the Galápagos volcanoes (Chadwick and Howard, 1991). Uplift of
more than 2 m in the center of the caldera was recorded by continuous GPS over
the 3 years preceding the October 2005 eruption (Chadwick et al., 2006). The
total inflation (estimated to be 5 m since 1992) prior to eruption is the largest ever
recorded at a basaltic caldera (Chadwick et al., 2006).
2.4 Methods
The theory and field practice for microgravity monitoring in volcanic areas
has been well described in the literature (e.g., Rymer and Brown, 1989; Rymer,
1996) and therefore will only be summarized briefly here. The gravity network at
Sierra Negra is sparse owing to the extremely difficult access to the caldera and
rough terrain (at least 10 hours hiking is required to visit 3 gravity stations in the
center of the caldera). Our efforts were thus focused on measurements at the
center of deformation in the middle of the caldera (Fig. 2-2). Stations were visited
28
in June 2005, four months prior to the eruption, and in June 2006 and 2007.
These data are used in conjunction with earlier gravity surveys in 2001 and 2002
(Geist et al., 2006). All surveys were conducted during the dry season in June.
This strategy is designed to limit the effect of water-table fluctuations on the
gravity measurements. Although precise water-table effects were not quantified,
given the large gravity variations observed, any water-related effects on the order
observed at other calderas (e.g., up to 60 μGal at Yellowstone; Battaglia et al.,
2003) would fall within the error of our measurements.
Two LaCoste and Romberg model G gravity meters (instrument G-127
and G-209) were used over the course of the surveys at Sierra Negra. The G-
209 meter was used for the 2001-2002 (Geist et al., 2006) and June 2005
surveys while the G-127 meter was used during the more recent surveys in 2006
and 2007. The G-209 meter is equipped with a galvonometer and thus the
reported microgravity measurements for a given station are taken from at least 2
individual readings. In contrast, the G-127 meter is equipped with an Aliod
electrostatic feedback nulling system allowing for repeated in-situ measurements
(at 2 Hz) without the need for user input. Both instruments were calibrated on a
Palm Desert (California) gravity line and the data presented here are corrected to
the G-127 meter.
When time permitted, each station was visited twice during a survey loop
and some stations were measured on two different days of the campaign. Our
raw gravity measurements are corrected for earth tide, ocean loading and
elevation effects: the Bouguer Corrected Free Air Gradient (BCFAG) = a Free Air

29
Gradient (FAG) of -308.6 µGal m-1 plus an infinite slab Bouguer correction of
117.3 µGal m-1, assuming a surrounding rock density of 2.8 g cm-3, were used for
these corrections. The resulting, corrected gravity measurement is referred to as
the residual gravity. Instrumental drift was negligible over the survey periods.
Error in the residual gravity measurements is as follows: The standard deviation
(1σ) in the residual gravity averaged over 1 minute and measured over 6-10
minutes at a given station is less than 5 μGal for the G-127 meter. The standard
deviation at a given station over the course of one campaign is on the order of
100 μGal, due to the difficult conditions experienced by the instruments during
transport over rugged terrain. The closure error (difference in the residual gravity
measurements made at the base station, SN12, in one day) was also taken into
account. Sources of error that factor into the residual gravity measurements
include uncertainty in the vertical component of deformation as measured by
continuous GPS at most of the gravity benchmarks and uncertainty in the
extrapolation of deformation rates to benchmarks where no GPS data are
available. We also take into account possible variation in the FAG gradient of up
to + 10% (Tsuboi, 1983).
2.5 Gravity and Deformation Results
Deformation data for Sierra Negra extends back to 1992 with satellite
radar interferometry (InSAR) studies indicating inflation of 2.5 m from 1992 to
1999, with maximum uplift rates of 60 cm yr-1 (Amelung et al., 2000). The InSAR
data were inverted to model the magma body and indicated that a 2.1-2.3 km
deep sill is located beneath the center of the caldera (Amelung et al., 2000).

30
In June 2001 and June 2002, GPS campaigns covered a network of 14 to
26 stations at Sierra Negra (Geist et al., 2006). They reported a greatly
decreased rate of inflation during the first year, with a maximum uplift rate of 7
cm yr-1, followed by 9 cm of deflation over the next 1.5 years. This period of
deflation was accompanied by a 50 μGal decrease (Table 2-1) in the residual
gravity observed in the northern part of the caldera (station SN21, relative to
SN12 on the caldera rim; Fig. 2-2). Geist et al. (2006) suggested that the
combined deflation and decrease in gravity was linked to an episode of magma
withdrawal from the shallow magma reservoir, probably into the deeper parts of
the plumbing system. From the GPS data, the best-fit geometry for the deflating
magma body was found to be a sill with horizontal dimensions of 5.3 x 3.0 km
and a depth comparable to that modeled by the InSAR data (2.1-2.3 km). Based
on this geometry, the magma body would have contracted in volume by 4.1 x 10⁶
m3 (Geist et al., 2006).
In June 2002, a network of continuous GPS stations was installed on the
caldera floor of Sierra Negra, with one station located on its NE rim (Fig. 2-2).
The GPS network continued to record the deflation which commenced in 2000-
2001 at a rate of -9.1 cm/yr, and then in April 2003 the system switched back to
inflation (Chadwick et al., 2006). Between April 2003 and the October 2005
eruption, station GV02, located near the center of the caldera, recorded 2.2 m of
uplift. Horizontal N-S extension (GV03-GV06) amounted to 1.4 m over the same
time period. A mb 4.6 earthquake occurred on April 16, 2005 along with 84 cm of
vertical slip on the south end of the intra-caldera fault system but this event did
31
not interrupt the pattern of inflation (Chadwick et al., 2006). This suggests that
despite faulting in the roof of the magma reservoir, the internal pressure in the
subsurface reservoir was apparently unaffected. Unfortunately, no gravity data
was collected between June 2002 and June 2005, but such high inflation rates
prior to an eruption are generally associated with continuous magma influx into
the shallow reservoir (Johnson, 1992).
Gravity measurements 4 months prior to the October 2005 eruption at the
center of the caldera (SN09) show a decrease in residual gravity (relative to the
reference station SN12) of up to 950 μGal compared to measurements from
2001 and 2002 (Fig. 2-3). The residual gravity decrease becomes less
pronounced towards the caldera rim, with station SN21 recording a 450 μGal
decrease relative to 2001/2002. The change in residual gravity on the flank of the
caldera (station SN15) is negligible between 2001/2002 and 2005 (Table 2-1;
Fig. 2-3). This suggests that the residual gravity anomaly, and hence the area of
mass change/density decrease, prior to the eruption, was restricted to the interior
of the caldera.
Gravity measurements made 8 and 20 months after the 2005 eruption
reveal an increase in residual gravity relative to June 2005 of up to 1000 μGal,
again centered on SN09 (Fig. 2-3). For SN09, this represents a slightly higher
residual gravity value than the one recorded in 2001and 2002. For all other
stations, the residual gravity measured in June 2007 is lower than the 2001-2002
levels by up to 350 μGal (SN15). Given the error in the measurements, stations
SN24 and SN21 show no definite pattern of residual gravity change from
32
immediately preceding, to after the eruption (June 2005-June 2007). Station
SN15, however, shows a clear residual gravity decrease following the 2005
eruption. The change in the relative difference in residual gravity between
stations (e.g., SN09-SN24) prior to and following the eruption suggests a shift in
the mass distribution at depth as a result of the eruption. Finally, the relative
changes in residual gravity measured at SN21 (north edge of the caldera floor)
over the entire period, are greater (although within error) than the changes
measured at SN24 (station located between SN09 and SN21) indicating that the
residual gravity change was radially asymmetric.
2.6 Discussion
The large decrease in residual gravity observed at SN09 and to a lesser
extent at SN21 and SN24 preceding the 2005 eruption can be best explained in
terms of either a mass or a density decrease in the subsurface. A ∆g/∆h diagram
(coupled gravity-elevation variation diagram) allows for better visualization of the
processes responsible for the residual gravity changes (Fig. 2-4; Rymer and
Williams-Jones, 2000). The maximum ∆g/∆h gradient for the time periods 2002-
2005 and 2006-2007 (at station SN09) are plotted along with the theoretical FAG
and the calculated BCFAG. The maximum gradient prior to the eruption (2002-
2005) plots below both the FAG and BCFAG gradients indicating a decrease in
mass and/or a decrease in density. The maximum gradient following the eruption
(2006-2007) plots above both the FAG and the BCFAG indicating a mass
increase and/or density increase. At the time of the June 2005 gravity survey, the
caldera floor was in a period of accelerating inflation (Chadwick et al., 2006). This

33
rapid increase in elevation of the caldera floor has been interpreted as being
caused by an increase in the volume of the subsurface magma chamber due to
influx of magma preceding the eruption (Chadwick et al., 2006). Given that
magma withdrawal (mass decrease) was not occurring during the time period
2002-2005, the ∆g/∆h gradient observed from 2001 to 2005 is best explained by
a density decrease, most likely caused by magma vesiculation.
In order to investigate the role of magma vesiculation in generating the
large residual gravity decrease prior to the eruption, we model the shallow
magma body using the program Grav3D (Grav3D, 2007) and solve for the
density and thickness of the magma body needed to generate the maximum
residual gravity change recorded from 2002 to 2005 at SN09. Inverse modeling
of the gravity data to solve for the exact density of the causative body was not
performed due to the limited spatial coverage of the gravity network.
This approach is made possible because of the good control we have on
the geometry of the chamber and its location. Inverse modeling of the
deformation data collected at Sierra Negra by both InSAR and GPS since 1992
suggest the deformation is mainly controlled by inflation and deflation of a
shallow, sill-like magma body located at 2.1-2.3 km depth (top of the chamber)
and having horizontal dimensions of 5.3 x 3.0 km (Fig. 2-5) (Amelung et al.,
2000; Chadwick et al., 2006; Geist et al., 2006). However, there is no constraint
on the thickness of the body, which could range from 100s of meters to > 1 km
(Yun et al., 2006). The chamber geometry is assumed to remain constant
between 2002 and 2005. The change in the volume of the chamber of 3.6 x 10⁷

34
m3 between June 2002 and 2005 (Chadwick et al., 2006) will have an effect on
the gravity field but since this volume increase represents << 1% of the total
volume of the sill (for any sill thickness from 200 m to > 1 km), the effect is
minimal and is therefore ignored.
In order to better constrain the thickness of the sill, we calculate the
density of the magma body in the months prior to eruption using estimates of the
concentration of volatiles (H2O, CO2, S) supplied to the system and using
solubility constraints to estimate the amount of exsolved gas in the magma at the
pressure and temperature conditions expected in the shallow sill. The lavas
erupted in 2005 were essentially aphyric (crystal-free) and as such, preclude melt
inclusion studies of the initial melt volatile content. However, melt inclusion data
from older eruptions of Sierra Negra and from the neighbouring basaltic shield
volcano, Fernandina (Fig. 2-1), can be used to estimate the undegassed
concentrations of volatiles feeding the shallow Sierra Negra system. Fernandina
erupts lavas of very similar chemical composition to Sierra Negra (c.f. Reynolds
et al., 1995; Allan and Simkin, 2000; Geist et al., 2008). Melt inclusions with the
highest CO2 content (up to ~ 7000 ppm) represent the least degassed samples
(trapped at ~ 900 MPa, > 30 km depth assuming an average crust density of
2800 kg m-3) and have corresponding H2O contents of 0.8-1 wt% and maximum
S contents of ~ 1600 ppm (Koleszar et al., 2007; Table 6-1). The lithostatic
pressure at the top of the magma chamber is ~ 58 MPa (2.2 km depth), a
minimum for the system in part because we do not take into account the amount
of magmatic overpressure (estimated at < 15 MPa in 2005 from the amount of

35
inflation; Yun et al., 2006). We estimate a magma temperature of 1150 ºC based
on the geothermometer developed by Montierth et al. (1995) for Mauna Loa
basalts and using the composition of the tephra glass from the 2005 eruption
(Geist et al., 2008).
The solubility of CO2 at these conditions is lower than the amount of CO2
dissolved in the melt phase entering the shallow chamber. Based on the solubility
model of Newman and Lowenstern (2002), an input of 7000 ppm CO2 into the
system will degas to 265 ppm, releasing 6735 ppm of CO2 into the gas phase. In
contrast, the concentration of H2O in the melt is lower than its predicted solubility
of 2.4 wt% (Newman and Lowenstern, 2002), and therefore H2O would mostly
remain in solution in a 2.2 km deep sill. Determining the solubility of S in a
basaltic magma is more complex, as it involves more parameters, such as the
composition of the melt and the oxygen fugacity. Based on the composition of the
lava erupted during the 2005 eruption, the average oxygen fugacity of an ocean-
island basalt (Fayalite-Magnetite-Quartz buffer, Gerlach, 1993; Ballhaus, 1993),
the pressure and temperature estimates mentioned earlier, and the models of
Kilinc et al. (1983) and Wallace and Carmichael (1992), we obtain a S solubility
of ~ 1600 ppm suggesting that S degassing would have been negligible at Sierra
Negra prior to eruption. Based solely on the amount of CO2 exsolved, the total
weight % of exsolved gas in the magma prior to the 2005 eruption is 0.7.
We do not take into account any compositional or temperature changes of
the magma during storage in the magma chamber, which could cause H2O and S
to saturate. We also do not take into account the possibility that H2O partially
36
degasses with CO2 in closed-system degassing (Dixon and Stolper, 1995), or
that CO2 is degassing from magma deeper within the system and that this gas is
accumulating in the shallow magma chamber (system open to mass flux from
below). Consequently, our estimate of the amount of gas exsolved in the sill is a
minimum and the resulting estimate of the thickness of the sill is a maximum.
The estimate of the mass fraction of exsolved gas above yields a bulk
magma density of 2500 kg m-3 calculated using a density of the molten silicate
liquid of 2700 kg m-3 and a gas density of 200 kg m-3 (from the ideal gas law at
the P, T of interest). Also note that this calculation is an average density, and the
amount of gas could be distributed heterogeneously in the magma reservoir (a
possibility which is examined below).
The density of the magma body in 2002 is assumed to be that of the liquid
with no exsolved gas or crystals (2700 kg m-3), based on evidence that the
magma chamber was in a period of deflation and that magma withdrawal was
occurring (Geist et al., 2006). The density contrast between June 2002 and 2005
is 200 kg m-3. Assuming no change in the planar geometry of the sill, we model
the thickness of the sill required to produce the gravity anomaly recorded at
SN09 during that time (950 + 115 μGal). The best fit to the data is a 800-m thick
sill, illustrated in Figure 2-6.
We also explore the possibility that the magmatic gases were
concentrated in a highly vesicular foam layer progressively accumulated at the
top of the magma chamber between 2002 and 2005 (instead of being mixed
uniformly in the sill). To get an independent estimate of the volume of this foam

37
layer, we combine estimates of the total amount of SO2 gas erupted during
October 2005 with estimates of the ratio of H2O/CO2/SO2 in the melt feeding the
system, to determine the volume of erupted gas, which we convert to its
corresponding volume at depth. Given that a stable foam layer is < 80% bubbles
(Wilson et al., 1980), we use a conservative estimate of 50% porosity to calculate
a total volume for the foam layer.
The total amount of SO2 erupted over the 8 days of the eruption is
obtained from Ozone Monitoring Instrument (OMI) satellite images and
corresponds to ~ 1.9 x 10⁹ kg (Simon Carn, pers. com.). The H2O/CO2/S ratios in
the undegassed magma are estimated from the melt inclusion data and
correspond to an H2O/S ratio of 5.5 and a maximum CO2/S ratio of 4.75. If we
assume that the ratios of the volatiles at depth prior to degassing are equivalent
to the ratios in the eruptive plume, then 45 wt% of the plume gas composition
was H2O, 40 wt% was CO2, and 15 wt% was SO2. The total amount of gas
erupted equals 11.6 x 10⁹ kg, which translates to a volume of 8.3 x 10⁹ m3 of gas
at atmospheric pressure and temperature (calculated from the ideal gas law).
Converted to a pressure of 58 MPa (corresponding to 2.2 km depth) at 1150 °C,
the pre-eruptive volume of gas in the magma chamber is estimated at 6.8 x 10⁷
m3. Part of this volume will represent volatiles still dissolved in the melt prior to
eruption, or exsolved but not accumulated in the foam layer. Therefore the
volume of the foam layer is considered a maximum value. Factoring in 50%
porosity in the foam layer, the total volume of the layer is 13.6 x 10⁷ m3. This
value serves as a rough estimate of the maximum volume of explosively erupted
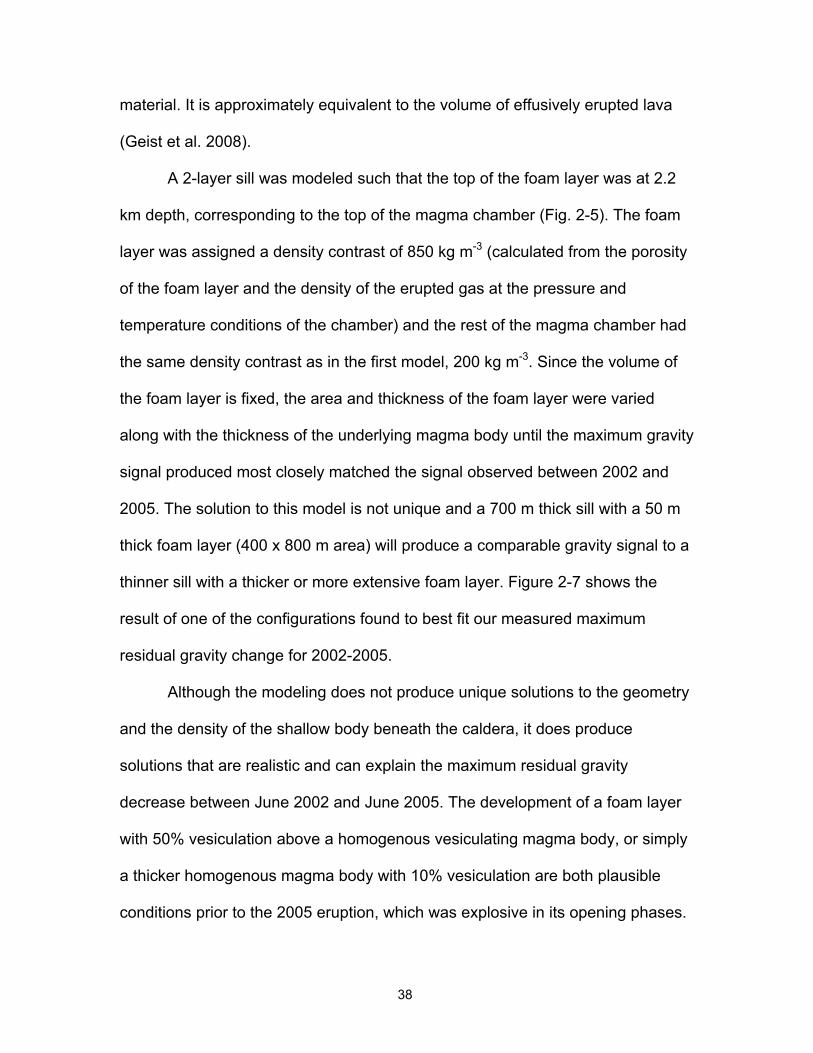
38
material. It is approximately equivalent to the volume of effusively erupted lava
(Geist et al. 2008).
A 2-layer sill was modeled such that the top of the foam layer was at 2.2
km depth, corresponding to the top of the magma chamber (Fig. 2-5). The foam
layer was assigned a density contrast of 850 kg m-3 (calculated from the porosity
of the foam layer and the density of the erupted gas at the pressure and
temperature conditions of the chamber) and the rest of the magma chamber had
the same density contrast as in the first model, 200 kg m-3. Since the volume of
the foam layer is fixed, the area and thickness of the foam layer were varied
along with the thickness of the underlying magma body until the maximum gravity
signal produced most closely matched the signal observed between 2002 and
2005. The solution to this model is not unique and a 700 m thick sill with a 50 m
thick foam layer (400 x 800 m area) will produce a comparable gravity signal to a
thinner sill with a thicker or more extensive foam layer. Figure 2-7 shows the
result of one of the configurations found to best fit our measured maximum
residual gravity change for 2002-2005.
Although the modeling does not produce unique solutions to the geometry
and the density of the shallow body beneath the caldera, it does produce
solutions that are realistic and can explain the maximum residual gravity
decrease between June 2002 and June 2005. The development of a foam layer
with 50% vesiculation above a homogenous vesiculating magma body, or simply
a thicker homogenous magma body with 10% vesiculation are both plausible
conditions prior to the 2005 eruption, which was explosive in its opening phases.

39
The development of a foam layer was also put forward by Carbone et al. (2006,
2007) to explain the joint gravity decrease/tremor increase/pause in explosive
activity at Mt. Etna during the 2002/2003 eruption, which resulted in a maximum
residual gravity decrease of 30 μGal, but no model was developed to quantify the
effect. Studies at Masaya volcano have also shown a relationship between an
increase in volatile supply and a decrease in residual gravity (Williams-Jones et
al., 2003).
The pattern of modeled residual gravity change with distance away from
the center of deformation is gradual (Figs. 2-6, 2-7). This pattern suggests that
station SN21, 1 km further from the center of the caldera compared to SN24,
should have experienced a smaller decrease in residual gravity than was
observed. The actual variation in gravity change between 2002 and 2005 at
these two stations is similar within error, suggesting that other factors not
modeled may be affecting the gravity field on a smaller scale. The location of the
2005 eruptive vents on the NE rim of the caldera (Geist et al., 2008), within ~ 2
km of SN21 (Fig. 2-2), and possible dike propagation from the sill to the surface
may have caused localized gravity anomalies. Localized changes in the shallow
hydrothermal system also cannot be ruled out. Given these potential
complications, only the maximum change in residual gravity (station SN09) was
used to fit the models.
Eight and twenty months after the eruption, the gravity signal at SN09 had
returned to, and exceeded, the 2001/2002 levels (Fig. 2-3) and was
accompanied by a renewal of inflation but at a decelerating rate (Ruiz, 2008).

40
The maximum ∆g/∆h gradient during this time period plots above both the FAG
and BCGAF gradients (Fig. 2-4) suggesting that the change in residual gravity
after the eruption is caused by a mass and/or a density increase, both consistent
with the loss of the gas-rich, crystal-poor magma during the eruption, leaving
behind a denser, perhaps crystal-rich mush and renewed influx of relatively
degassed magma from deeper in the system.
2.7 Conclusions
4D microgravity and deformation data at Sierra Negra volcano can be interpreted
in terms of the subsurface processes responsible for the largest pre-eruptive
inflation ever recorded at a basaltic caldera. The magnitude of maximum residual
gravity change prior to the 2005 eruption (- 950 μGal) is also amongst the largest
ever recorded. A gravity decrease of similar magnitude (- 400 μGal) was
recorded by a permanent gravity station at the summit of Mt. Etna volcano at the
onset of the October 2002 eruption (Carbone et al., 2007). The duration of the
anomaly was less than 6 hours and was interpreted as reflecting the opening of a
dry fracture (not filled with magma) ~ 1 km from the gravity measurement site.
The duration of the gravity anomaly at Sierra Negra volcano is unknown because
measurements were only performed on 2 consecutive days over periods of 15-20
minutes each time. This problem illustrates the need for continuous 4D gravity
monitoring at active volcanoes (Williams-Jones et al., this volume) but the
logistical limitations, combined with the current technology available for
continuous microgravity recordings, make this unfeasible at Sierra Negra
volcano. However, based on the time gap between the gravity measurement in

41
June 2005 and the onset of the eruption in October 2005, we do not attribute the
gravity decrease to the opening of a fracture.
Vesiculation of the magma as the volatiles reached their saturation point
can explain the simultaneous uplift of the caldera floor and the decrease in
gravity observed between 2001/2002 and June 2005. Although the proposed
models do not offer unique solutions, geochemical constraints on the amount of
gas present in the magma chamber prior to eruption allow us to model the
thickness of the magma body required to produce the observed residual gravity
variations. While the error associated with these estimates is large, the models
provide a first-order constraint on the third dimension of the shallow magma
reservoir at Sierra Negra.
Modeling of the time-series data also offers insight into the time-scales of
vesiculation at Sierra Negra and can be used to estimate the volume of gas in
the magma chamber prior to eruption. Faulting events at Sierra Negra in the
years and months leading up to the 2005 eruption potentially allowed for partial
release of pressure in the subsurface magma body and accommodation of
subsurface volume expansion. The onset of vesiculation sometime between June
2002 and June 2005 is associated with the accelerating rate of inflation and
magma influx recorded from April 2003 to October 2005 (Chadwick et al., 2006),
and may have ultimately triggered the eruption. The cause for the onset of
vesiculation may have been the influx of volatile-rich magma from depth,
combined with chemical evolution of the melt in the chamber (volatile phases

42
reaching saturation) and perhaps a sudden, partial release of pressure during the
16 April 2005 faulting event.
2.8 Acknowledgments
The authors would like to thank the Galápagos National Park for their
permission and assistance in the field as well as the Charles Darwin Research
Station for their logistical help. We also thank Ayline Llona for her assistance in
providing Dan Johnson’s gravity data. Discussions with Paul Wallace helped
clarify issues on S solubility. Support was provided by NSF grant EAR0538205 to
the University of Idaho and an NSERC Discovery Grant to Glyn Williams-Jones.
PMEL contribution number 3193.

43
2.9 Figures
Figure 2-1 Digital Elevation Map of the Galápagos archipelago showing the location of Sierra Negra and Fernandina calderas (modified after Yun et al., 2006).

44
Figure 2-2 Digital Elevation Map of the summit area of Sierra Negra showing the location of the gravity and continuous GPS stations referred to in this study. The eruptive vents from 2005 are also shown.
Figure 2-3 Residual gravity change (BCFAG corrected) recorded at all stations referenced to June 2001. The time of the October 2005 eruption is indicated. Error bars represent compounded errors from the sources discussed in the text.

45
Figure 2-4 Maximum ∆g/∆h gradient for the time period 2002-2005 and 2006-2007 (station SN09) and theoretical FAG (-308.6 µGal/m) and calculated BCFAG (-191.3 µGal/m). Scenario boxes 1 and 2 are for gradients that plot above the BCFAG and below the FAG lines respectively.

46
Figure 2-5 Simplified cross-section through the caldera showing the location and geometry of the magma body in 2D (a), and in 3D (b). Part (b) illustrates the geometry of the sill and the foam layer used to generate a maximum gravity anomaly of -874 µGal (image from Grav3D). The sill is 5000 x 3000 x 700 m and the foam layer is 400 x 800 x 50 m.
47
Figure 2-6 Modeled gravity change between June 2002 and 2005 caused by a 800-m thick homogeneous sill with 10% vesiculation.

48
Figure 2-7 Modeled gravity change between June 2002 and 2005 caused by a 700-m thick sill with 10% vesiculation and a 50 m thick foam layer with 50% vesicularity at the top.

49
2.10 Tables
Table 2-1a Summary of gravity and deformation data at Sierra Negra
Year 2001b 2002b 2005 2006 2007 Instrument usedc G-209 G-209 G-209 G-127 G-127 Station Raw gravity (mGal) Error Error Error Error Error SN09 32.89 0.01 32.91 0.01 31.62 0.11 32.90 0.05 32.84 0.06 SN21 34.36 0.01 34.35 0.01 33.78 0.13 33.99 0.05 34.01 0.06 SN24 34.91 0.01 34.90 0.01 34.35 0.11 34.79 0.05 34.74 0.04 SN15 34.03 0.01 33.98 0.01 33.96 0.04 - - 33.56 0.06 Elevation (m) SN09 952.395 0.013 952.262 0.009 953.407 0.064 952.163 0.016 952.756 0.010 SN21 927.914 0.018 927.860 0.007 928.309 0.039 927.501 0.012 927.808 0.007 SN24 938.492 0.016 938.404 0.009 939.201 0.053 937.675 0.020 938.147 0.010 SN15 797.155 0.013 797.051 0.008 797.075 0.025 797.241 0.017 797.259 0.020 Time period Δgmax
d Error Δhmax Error (Δg/Δh)max (μGal) (m) (μGal/m) 2002-2005 (SN09) -1067 113 1.15 0.06 -931 2006-2007 (SN09) 71 79 0.59 0.02 119
a Raw gravity values are referenced to the base station SN12. b Data from Geist et al. (2006). c Instruments have been cross-calibrated (referenced to G-127). d Corrected for elevation effects (BCFAG= -191.3 μGal/m).

50
2.11 References
Allan, J. F., and T. Simkin, 2000, Fernandina volcano’s evolved, well-mixed basalts: Mineralogical and petrological constraints on the nature of the Galápagos plume: Journal of Geophysical Research – Solid Earth, 105, 6017-6041.
Amelung, F., S. Jónsson, H. Zebker, and P. Segall, 2000, Widespread uplift and ‘trapdoor’ faulting on Galápagos volcanoes observed with radar interferometry: Nature, 407, 993–996.
Ballhaus, C., 1993, Redox states of lithospheric and asthenospheric upper-mantle: Contributions to Mineralogy and Petrology, 114, 331-348.
Battaglia, M., C. Roberts, and P. Segall, 1999, Magma intrusion beneath Long Valley caldera confirmed by temporal changes in gravity: Science, 285, 2119-2122.
Battaglia, M., P. Segall, and C. Roberts, 2003, The mechanics of unrest at Long Valley caldera, California. 2. Constraining the nature of the source using geodetic and micro-gravity data: Journal of Volcanology and Geothermal Research, 127, 219-245.
Berrino, G., G. Corrado, G. Luongo, and B. Toro, 1984, Ground deformation and gravity changes accompanying the 1982 Pozzuoli uplift: Bulletin of Volcanology, 47, 187-200.
Carbone, D., G. Budetta, and F. Greco, 2003, Bulk processes prior to the 2001 Mount Etna eruption, highlighted through microgravity studies: Journal of Geophysical Research - Solid Earth, 108, 2556.
Carbone, D., L. Zuccarllo, G. Saccorotti, and F. Greco, 2006, Analysis of simultaneous gravity and tremor anomalies observed during the 2002-2003 Etna eruption: Earth and Planetary Science Letters, 245, 616-629.
Carbone, D., G. Budetta, F. Greco, and L. Zuccarello, 2007, A data sequence acquired at Mt. Etna during the 2002-2003 eruption highlights the potential of continuous gravity observations as a tool to monitor and study active volcanoes: Journal of Geodynamics, 43, 320-329.
Chadwick, W.W. and K.A. Howard, 1991, The pattern of circumferential and radial eruptive fissures on the volcanoes of Fernandina and Isabela islands. Bulletin of Volcanoly, 53, 259-275.
Chadwick, W.W, D. J. Geist, S. Jónsson, M. Poland, D. J. Johnson, and C. M. Meertens, 2006, A volcano bursting at the seams: Inflation, faulting, and eruption at Sierra Negra volcano, Galápagos: Geology, 34, 1025-1028.
51
Dixon, J. E., and E. M. Stolper, 1995, An experimental study of water and carbon dioxide solubilities in mid-ocean ridge basaltic liquids. 2. Applications to degassing: Journal of Petrology, 36, 1633-1646.
Geist, D., W. Chadwick, and D. Johnson, 2006, Results from new GPS and gravity monitoring networks at Fernandina and Sierra Negra Volcanoes, Galápagos, 2000-2002: Journal of Volcanology and Geothermal Research, 150, 79-97.
Geist, D. J., K. S. Harpp, T. R. Naumann, M. Poland, W. W. Chadwick, M. Hall, and E. Rader, 2008, The 2005 eruption of Sierra Negra volcano, Galápagos, Ecuador: Bulletin of Volcanology, 70, 655-673.
Gerlach, T. M., 1993, Oxygen buffering of Kilauea volcanic gases and the oxygen fugacity of Kilauea basalt: Geochimica et Cosmochimica Acta, 57, 795-814.
Gottsmann, J., L. Wooller, J. Martí, J. Fernández, A.G. Camacho, P.J. Gonzalez, A. Garcia, and H. Rymer, 2006, New evidence for the reawakening of Teide volcano: Geophysical Research Letters, 33, L20311.
GRAV3D; A Program Library for Forward Modeling and Inversion of Gravity Data over 3D Structures, version 20070309, 2007, Developed under the consortium research project Joint/Cooperative Inversion of Geophysical and Geological Data, UBC-Geophysical Inversion Facility, Department of Earth and Ocean Sciences, University of British Columbia, Vancouver, British Columbia.
Johnson, D. J., 1992, Dynamics of magma storage in the summit reservoir of Kilauea volcano, Hawaii: Journal of Geophysical Research – Solid Earth, 97, 1807-1820.
Jousset, P., S. Dwipa, F. Beauducel, T. Duquesnoy, and M. Diament, 2000, Temporal gravity at Merapi during the 1993-1995 crisis: an insight into the dynamical behavior of volcanoes: Journal of Volcanology and Geothermal Research, 100, 289-320.
Kauahikaua, J., and A. Miklius, 2003, Long-term trends in microgravity at Kilauea’s summit during the Pu'u'ō'Ō-Kũpaianaha eruption: US Geological Survey Professional Paper, 165-171.
Kilinc, A., I.S.E. Carmichael, M. L. Rivers, and R.O. Sack, 1983, The ferric-ferrous ratio of natural silicate liquids equilibrated in air: Contributions to Mineralogy and Petrology, 83, 136-140.
Koleszar, A.M., A. E. Saal, E. H. Hauri, and M. D. Kurz, 2007, Melt inclusions from the Galápagos plume: Mirrors and mirages of the deep: Geochimica et Cosmochimica Acta, 71, A508-A508.

52
Lipman, P.W., 1997, Subsidence of ash-flow calderas: relation to caldera size and magma-chamber geometry: Bulletin of Volcanology, 59, 198-218.
Montierth, C., A. D. Johnston, K. V. Cashman, 1995, An empirical glass-composition-based geothermometer for Mauna Loa lavas, in Mauna Loa revealed: Structure, Composition, History, and Hazards: Geophysical Monograph, 92, 207-217
Newman, S., and J.B. Lowenstern, 2002, VOLATILECALC: a silicate melt-H2O-CO2 solution model written in Visual Basic for excel: Computers & Geosciences, 28, 597-604.
Reynolds, R. and D. Geist, 1995, Petrology of lavas from Sierra Negra volcano, Isabela Island, Galápagos archipelago. Journal of Geophysical Research 100, 24,537-24,553.
Reynolds, R., D. Geist, and M. Kurz, 1995, Physical volcanology and structural development of Sierra Negra volcano, Galápagos Archipelago: Geological Society of America Bulletin, 107, 1398-1410.
Ruiz, A., 2008, Inflation and Deflation Modeling at Sierra Negra and Fernandina Volcanoes Based on GPS Measurements, Galapagos Islands, Ecuador. M.Sc. thesis, University of Idaho.
Rymer, H., 1996, Microgravity monitoring, in R. Scarpa, and R. I. Tilling, eds., Monitoring and Mitigation of Volcano Hazards: Springer-Verlag, 169-198.
Rymer, H., and G. Brown, 1989, Gravity changes as a precursor to volcanic-eruption at Poas volcano, Costa-Rica: Nature, 342, 902-905.
Rymer, H., and G. Williams-Jones, 2000, Volcanic eruption prediction: Magma chamber physics from gravity and deformation measurements: Geophysical Research Letters, 27, 2389-2392.
Tsuboi, C., 1983, Gravity: G. Allen and Unwin.
Wallace, P., and I. S. E. Carmichael, 1992, Sulphur in basaltic magmas: Geochimica et Cosmochimica Acta, 56, 1863-1874.
Williams-Jones, G., H. Rymer, and D. A. Rothery, 2003, Gravity changes and passive SO2 degassing at the Masaya caldera complex, Nicaragua: Journal of Volcanology and Geothermal Research, 123, 137-160.
Wilson, L., R. S. J. Sparks, and G. P. L. Walker, 1980, Explosive volcanic eruptions—IV. The control of magma chamber and conduit geometry on eruption column behavior: Geophysical Journal of the Royal Astronomical Society, 63, 117–148.
Wood, C., 1984, Calderas: a planetary perspective: Journal of Geophysical Research, 89, 8391-8406.

53
Yokoyama I., and H. Tajima, 1957, A gravity survey on Volcano Mihara, Ooshima Island by means of a Worden gravimeter: Bulletin of the Earthquake Research Institute, 35, 23–33.
Yun, S.-H., P. Segall, and H. A. Zebker, 2006, Constraints on magma chamber geometry at Sierra Negra Volcano, Galápagos Islands, based on InSAR observations: Journal of Volcanology and Geothermal Research, 150, 232–243.

54
3: THE SOURCE COMPONENTS OF VOLATILE AND FLUID-MOBILE ELEMENTS IN SUBDUCTION ZONES: A MELT INCLUSION STUDY FROM KAWAH IJEN VOLCANO, INDONESIA1
3.1 Abstract
Subduction zone recycling of H2O and other volatiles (S, Cl, F) is primarily
controlled by the nature of subducted materials (sediment, altered oceanic crust
and serpentinized mantle) and the temperature-pressure profile along the top of
the slab. These factors vary from one arc to another and even within arc
segments. Herein we investigate the variability of volatile and fluid-mobile trace
element enrichment in subduction zones using new data for primitive, olivine-
hosted melt inclusions from Kawah Ijen volcano, Indonesia, together with similar
published data from other arcs worldwide (Central America, Mexico and
Kamchatka). Intra-arc variability in Indonesia is assessed by comparing Kawah
Ijen to melt inclusion data from Galunggung volcano, located along the same
volcanic front, ~ 700 km to the west. Galunggung erupts magmas with distinctly
lower H2O contents (up to ~2 wt%) compared to those of Kawah Ijen (up to 7
wt%).
We observe a global, positive correlation between slab surface
temperatures, Sr, H2O and Cl contents, indicating that these elements are
1 The following chapter will be submitted to the journal Geochemistry, Geophysics, Geosystems
under the co-authorship of P. Wallace, G. Williams-Jones, A. Kent and K. Kelley. Extent of the collaboration thus far includes assistance with trace element analysis by A. Kent, reviews by P. Wallace, G. Williams-Jones and A. Kent, and access to data from Galunggung by K. Kelley.
55
coupled during subduction zone recycling. Arc magma S contents are more
variable and F contents generally remain at background mantle values
suggesting partial to complete decoupling of these volatile elements from H2O
and Cl during subduction zone recycling. Simple partial melting and dehydration
models constrain the source of volatiles and suggest that beneath most arc
volcanoes, the altered oceanic crust (AOC) is the main reservoir for the flux of
H2O-rich fluid, in agreement with experimental and thermo-mechanical models.
Sediment melt is also an important component in all arcs, but only for the less
fluid-mobile elements (e.g., LREE). Our results synthesize the geochemical
evidence for the decoupling of volatile and highly fluid-mobile trace elements
from the less mobile elements during subduction zone recycling.
Kawah Ijen and Galunggung display different degrees of enrichment in
volatile (H2O, Cl, S) and fluid-mobile elements (Sr), with Kawah Ijen magmas
recording higher AOC-derived fluid fluxes (4-5 wt%) compared to Galunggung
magmas (~ 1 wt%). The elevated H2O and Sr contents of the Kawah Ijen
magmas are comparable to some of the most fluid-rich arc front magmas in hot
slab subduction zones (e.g., Mexico, Central America) and suggest that the
eastern Java arc may be one of the wettest cold slab subduction zones in the
world.
3.2 Introduction
Recent studies have focussed on obtaining a comprehensive data set of
whole rock, glass and/or melt inclusion compositions in order to investigate the
nature of the mantle wedge and the added subduction component involved in arc

56
magma genesis (e.g., Sisson & Bronto, 1998; Wysoczanski et al., 2006;
Churikova et al., 2007; Portnyagin et al., 2007; Sadofsky et al., 2008; Johnson et
al., 2009; Rowe et al., 2009; Auer et al., 2009; Tollstrup et al., 2010). This study
contributes to this growing data set of geochemical data for arc magmas with
melt inclusion compositional data from Kawah Ijen volcano in eastern Java. The
main aim of this study is to integrate our data with similar data sets from arcs
worldwide in order to gain insight into global arc processes that control the
recycling of volatile and fluid-mobile elements from the slab to the overriding
crust. The data is compared with experimentally determined trace element
behaviour in subducting slabs (e.g., Kessel et al., 2005; Klimm et al., 2008,
Hermann & Rubatto, 2009) and thermo-mechanical models of slab dehydration
(e.g., Rüpke et al., 2002; 2004; Hacker, 2008).
The range of magma compositions erupted in Java and the Sunda arc
mirrors the global variability in subduction zone magmas. The presence of coeval
tholeiitic, calc-alkaline, shoshonitic and leucitic lavas on Java suggests that a
range of magma compositions can be produced via the interplay between
different mantle source compositions and the addition of fluids/melts from the
slab (Whitford et al., 1979; Nicholls & Whitford, 1983; Wheller et al., 1987; Turner
& Foden, 2001). Both decompression melting and fluid-flux melting of the mantle
beneath Java have been proposed (Nicholls & Whitford, 1983; Edwards et al.,
1991), and the presence of low-H2O magma at Galunggung on the volcanic front
has contributed to the debate on the interplay between melting mechanism and
fluxing of subduction-derive fluids in the production of arc magmas (e.g., Sisson

57
and Bronto, 1998; Kelley et al., 2006; Kohut et al., 2006; Vigouroux et al., 2008;
Reagan et al., 2010). These observations highlight the importance of
characterizing the exact nature of the mantle wedge, the melting mechanism and
the added subduction component in the study of subduction zone element
recycling.
The geographic density of volcanoes and the frequency of eruptive activity
on Java make it an ideal locality to sample fresh volcanic material for the study of
subduction zone processes. Located in eastern Java, Kawah Ijen has erupted
H2O-rich calc-alkaline magmas (this study), whereas in central Java, Galunggung
has erupted relatively H2O-poor calc-alkaline magmas (Sisson & Bronto, 1998;
Kelley et al., 2006). The volcanoes are located on the volcanic front but in
different arc segments. Galunggung lies much closer to the trench and the top of
the slab (Hamilton, 1979; Syracuse & Abers, 2006) compared to Kawah Ijen. In
this contribution, we compare Kawah Ijen and Galunggung melt inclusion
compositions with dehydration and melting models for the subducting slab
beneath Java in order to gain insight into the nature of the subduction component
involved at each volcano. The same approach is used to compare the Indonesian
volcanoes to other arc volcanoes worldwide (Mexico, Central America,
Kamchatka) in an attempt to gain insight into the global variability in volatile and
trace element patterns at subduction zones.
3.3 Geologic Setting
Kawah Ijen and the Ijen Caldera Complex are located in eastern Java,
Indonesia, along the volcanic front of the Sunda arc. Galunggung volcano is

58
located ~ 700 km to the west. The mixed continental/oceanic Sunda arc is related
to the subduction of the Indo-Australian plate beneath the Eurasian plate along
the 1200 km long Java trench (Fig. 3-1).
In Sumatra and the western part of Java, the overriding plate is composed
of continental crust with continental lithospheric basement, part of the “Sunda
Land” terrane (Hamilton, 1979). Beneath Kawah Ijen, the crust is ~ 20 km thick
and is composed of mostly accreted Cretaceous oceanic and Archean
continental terranes (Smyth et al., 2007; Clements et al., 2009). Galunggung is
located east of the inferred boundary of the continental basement and sits on
Cretaceous ophiolites (Clements et al., 2009).
The top of the subducting plate lies 180 km below Kawah Ijen, has an
approximate age of 130 Ma at the trench and dips at an angle of 42° (Syracuse &
Abers, 2006). Further west on Java, the top of the slab lies 120 km beneath
Galunggung, has an age of ~96 Ma at the trench, and dips at an angle of 48°
(Syracuse & Abers, 2006).
Within the island of Java, the volcanic front as a whole moved ~50 km
north away from the trench, sometime after the Paleogene, which resulted in a
pronounced increase in the arc front distance to the trench and depth to the top
of the slab near Kawah Ijen in eastern Java (Hamilton, 1979; Syracuse & Abers,
2006), and resulted in a broader distribution of the volcanic arc near Galunggung
(Clements et al., 2009).
Convergence of the Australian plate at 7 cm yr-1 is nearly orthogonal near
Kawah Ijen (e.g., Tregoning et al., 1994; Syracuse & Abers, 2006) and becomes
59
more oblique and transpressive further to the west in Sumatra (e.g., Hamilton,
1979). North of Galunggung, major E-W trending regional transcurrent faults are
present, whereas to the south a major thrust fault system is present (Harmon &
Gerbe, 1992; Clements et al., 2009). Around Kawah Ijen, the crustal tectonics
are less well defined, but N-S trending normal faults and E-W trending terrane
sutures have been identified (Carn, 2000; Clements et al., 2009).
The sediment package being subducted along the Java trench has been
characterized in detail by Plank and Langmuir (1998). An uppermost layer of
siliceous ooze (125 m thick) overlies 45 m of sand/clay/silt turbidites, followed by
130 m of pelagic clay. This sediment column is an average for the Java trench
determined from two DSDP drill sites located at the eastern and western ends of
Java (Fig.3-1). The western end is characterized by the presence of turbidites
originating from large off-shore fans transporting sediment from the Himalayan
collision zone. The eastern sedimentary sequence contains carbonate-rich
turbidites originating from the Australian continent. The thickness of the
sedimentary package offshore of the Java trench is relatively uniform (200-400
m) but the amount of sediment in-fill at the trench varies laterally. Offshore of
Galunggung, the accretionary margin contains up to 1 km of sediment in-fill,
whereas offshore of Kawaj Ijen, the margin is erosional and sedimentary in-fill is
nearly absent (Kopp et al., 2006). Seamounts from the Roo Rise are currently
being subducted at the Java trench (Clements et al., 2009), and numerous
normal and thrust faults are mapped in the oceanic crust at the trench (Masson
et al., 1990).

60
Kawah Ijen is a small, active stratovolcano that sits at the intersection of
the Ijen Caldera Complex rim and an intra-caldera lineament of small cinder
cones and shields (Fig. 3-1). Kawah Ijen’s edifice has been repeatedly built and
subsequently destroyed over the last 24,000 years (Sitorus, 1990; Van Hinsberg,
2001), starting with a cone building stage that consists of interbedded layers of
basaltic scoria and lava flows. These are overlain (2,500 years B.P.; Sitorus,
1990) by interbedded pyroclastic flow and fall deposits, phreatic deposits, and
more felsic and mafic lava flows outcropping on the outer S-SW flank of the
edifice and exposed along the inner crater walls and in the river bed of the
Banyupahit river (Fig. 3-1). The western flank of the volcano has been
progressively destroyed by a series of crater explosions and subsequent
collapses. The current configuration is a large (1 km wide) crater, 300 m deep,
partly filled with a hyper-acidic lake that drains out via the Banyupahit river. An
actively degassing dome, covered in native S precipitates, is located on the SE
shore of the lake. Samples of scoria from the lowermost exposed layers of the
edifice were collected in order to sample the earliest and most primitive magmas
erupted at Kawah Ijen.
3.4 Methodology
The basaltic tephra sampled, the olivine crystals it contains and the
olivine-hosted melt inclusions are described in detail in Appendix B, Figure 6-1
and Table 6-3. Olivine-hosted melt inclusions were doubly intersected and
polished for H2O and CO2 analysis by Fourier Transform Infrared Spectroscopy
(FTIR) using a Nicolet Magna 560 FTIR with a Continuum IR microscope and

61
OMNIC software at the University of Oregon. Absorbance was converted to
concentration using the Beer-Lambert law, calculated glass densities using the
method of Luhr (2001) and absorbance coefficients from Yamashita et al. (1997),
Dixon et al. (1995) and Dixon and Pan (1995). Further details of the methodology
can be found in Appendix B. Melt inclusion and olivine host major element
compositions (and S, Cl and F contents) as well as sulphur Kα wavelength shifts
were obtained from electron microprobe analysis using a Cameca SX-100 at the
University of Oregon. Details of the analytical conditions and standards used are
given in Appendix B. Additional details of the method used for measuring the
sulphur Kα wavelength shifts have been given by Wallace and Carmichael
(1994). Trace element compositions were obtained using Laser Ablation ICP-MS
in the W.M. Keck Collaboratory for Plasma Spectrometry at Oregon State
University. Details of the technique are summarized in Rowe et al. (2006) and
Kent et al. (2004). A 50 μm laser diameter was used with a 4 Hz pulse rate. 43Ca
was used as the internal standard and analyses were calibrated using repeat
analysis of BCR-2G glass throughout the analytical session. BVHO-2G glass was
analysed as a secondary standard to monitor accuracy and precision, and
uncertainties for all elements are generally less than 10%. Due to the average
small size of the melt inclusions, only one melt inclusion was sampled twice and
results of the reproducibility as well as analysed standards are given in Table 6-
2.

62
3.4.1 Post-entrapment modification correction
Melt inclusion compositions were corrected for post-entrapment
crystallization of olivine along the walls of the inclusion (e.g., Sobolev and
Danyushevsky, 1994). The correction process involves adding 0.1% increments
of equilibrium olivine back into each melt inclusion until the inclusion composition
is in equilibrium with the olivine host. The exchange coefficient (KD =
(Mg/Fe2+)melt/(Mg/Fe2+)olivine) was calculated for each melt inclusion using the
equation of Toplis (2005) that relates KD to temperature, pressure, melt
composition (including H2O) and olivine composition. The average pressure (0.3
GPa) and temperature (1100°C) recorded by the melt inclusions were used.
Pressures were calculated from Papale et al. (2006), and temperatures are from
equation 6a in Sugawara (2000). KD values ranged from 0.3 to 0.35. We
assumed a wt% FeO/FeOtotal ratio of 0.79, calculated from the fO2 of the melt
inclusions, converted to melt Fe2+/Fe3+ mole fraction ratio using the method of
Kilinc et al. (1983). Oxygen fugacity values were calculated from the S Kα
measurements on four melt inclusions using a temperature of 1100°C and
following the method of Wallace and Carmichael (1994). Extents of post-
entrapment crystallization range from 0-8%. Uncertainties in the re-calculated
melt inclusion compositions based on uncertainties in FeO/FeOtotal determination
(+ 5 %), KD (+ 0.01) and coexisting olivine host composition (+ 0.5 Fo) are < 0.5
% for the non-participating oxides and < 5 % for the major participating oxides
(FeO, MgO and SiO2).

63
Total iron contents in the melt inclusions are comparable to those
measured in the bulk rock (Handley et al., 2007) at a given MgO content
suggesting that post-entrapment iron loss by diffusion was negligible. The
CaO/Al2O3 ratios of the melt inclusions lie along the liquid line of descent defined
by the whole rock data (Handley et al., 2007). This suggests that the melt
inclusion compositions are representative of the bulk melt from which the olivine
crystallized and that the melt inclusions were not affected by disequilibrium
processes (boundary layer concentration build-up) during entrapment (Faure &
Schiano, 2005; Métrich & Wallace, 2008; Kent, 2008).
3.5 Results
Corrected melt inclusion compositions and calculated oxygen fugacities
are reported in Table 3-1. Only values corrected for post-entrapment
crystallization are described in the text and shown in figures. Uncorrected melt
inclusion compositions can be found in Table 6-2. Major, trace and volatile
element data for Galunggung are taken from Sisson and Bronto (1998), Kelley et
al. (2006), and Kelley and Cottrell (2009) and represent olivine hosted melt
inclusions erupted during the latter portion of the 1982-1983 eruption in high-
MgO magmas (10-12 wt% MgO; Sisson and Bronto, 1998). The melt inclusion
major element compositions are corrected for post-entrapment crystallization of
olivine following the method described in Kelley and Cottrell (2009).
Olivine host compositions range from Fo78-81 for Kawah Ijen whereas they
are more primitive for Galunggung, most ranging from Fo88-90 (Sisson and Bronto,
1998; Kelley and Cottrell, 2009). The Kawah Ijen basaltic melt inclusions (with
64
the exception of the melt embayment, sample TO-IX) have anhydrous
normalized SiO2 values of 47-49 wt%, Al2O3 contents of 19-20 wt%, CaO
contents of 11-12 wt% and MgO contents of 5-7 wt%, and can be classified as
high-alumina basalt (Kuno, 1960). In comparison, Galunggung magmas have
higher and more variable MgO (6-11 wt%) and CaO (11-17 wt%) contents as well
as variable SiO2 contents (44-51 wt%). As discussed in Sisson and Bronto (1998)
and Kelley et al. (2006), the Galunggung melt inclusions span a range of
compositions between two end-member primitive melts: a high-Mg basalt and a
high Ca, silica-undersaturated melt similar in composition to an ankaramite.
Both Kawah Ijen and Galunggung melt inclusions compositions straddle
the classification boundary between low-K tholeiitic and medium-K calc-alkaline
magmas (Fig. 3-2). For comparison, whole rock data for other volcanoes within
Java and the neighbouring island of Bali are shown. They illustrate the range of
magma compositions that can erupt in close spatial and temporal proximity (all of
the Indonesian volcanoes shown including Kawah Ijen and Galunggung have
had historical eruptions, except for Muriah which was active in the Holocene;
Siebert & Simkin, 2002).
For comparison to Kawah Ijen and Galunggung, melt inclusions from other
arc volcanoes are included: Mexico (Johnson et al., 2009), Central America
(Wade et al., 2006; Benjamin et al., 2007; Sadofsky et al., 2008) and Kamchatka
(Portnyagin et al., 2007). These datasets where chosen because they report
complete major, trace and volatile element compositions in olivine-hosted melt
inclusions (Portnyagin et al., 2007 and Sadofsky et al., 2008 do not report CO2
65
contents). These melt inclusions also fall within the low-K to medium-K
classification. Although this study mainly compares tholeiitic and calc-alkaline
basaltic-basaltic andesite magmas, the potassic magmas of Colima, Mexico
(Vigouroux et al., 2008) are included to represent the less dominant but
ubiquitous magma type present in many arcs (e.g., Muriah volcano, Indonesia).
The trace element pattern of Kawah Ijen magmas are compared to those
of Galunggung and volcanoes from the three other arcs in Figure 3-3. On
average, the volcanoes display the typical enrichment-depletion pattern of
subduction zone magmas with a variable but distinct depletion in the high field-
strength elements (HFSE; e.g., Nb, Zr) and a relative enrichment in the large ion
lithophile elements (LILE) over the light rare earth elements (LREE) when
compared to average mid ocean ridge basalt (MORB) and ocean island basalt
(OIB) magmas. The subordinate presence of magmas with an intraplate (“OIB-
like”) trace element signature in arcs is represented by Hoya Alvarez, an alkali
basaltic maar in the Trans-Mexican Volcanic Belt (Johnson et al., 2009). Within
the field for Central America, three volcanoes lack a pronounced Nb depletion
and have trace element signatures intermediate between OIB and arc magmas:
Nejapa and the high-Nb end member of Granada in Nicaragua, and the high-K
end member of Irazú in Costa Rica (Sadofsky et al., 2008). Subsequent
discussion of Central American magmas does not include the high-K andesite
from Irazú.
Kawah Ijen and Galunggung display very similar trace element patterns
except for Sr and the least mobile elements (HFSE). Galunggung magmas have

66
a relatively flat REE pattern (La/Yb = 2.7 compared to 5.6 for Kawah Ijen), have
higher concentrations of the HFSE and lower Sr concentrations relative to the
LILE and LREE (e.g., Ba/Nb = 50 and Sr/Nd = 25, compared to 94 and 45
respectively for Kawah Ijen).
In terms of volatile content, the Kawah Ijen and Galunggung melt
inclusions are notably different (Fig. 3-4). Kawah Ijen melt inclusions display a
wide range of H2O and CO2 contents, representing degassing of the magma
during ascent and olivine crystallization. In contrast, Galunggung melt inclusions
can be sub-divided into two groups: low H2O with variable CO2 and moderate
H2O with generally lower CO2 contents (Kelley et al., 2006). The vapour
saturation isobars shown in Figure 3-4 indicate maximum melt inclusion trapping
pressures of 0.38 GPa for Kawah Ijen, corresponding to depths of >10 km in the
crust, assuming the melts were vapour-saturated. Evidence for vapour saturation
of the Kawah Ijen melts includes the presence of vapour bubbles in some melt
inclusions and the large range of H2O and CO2 contents recorded by the melt
inclusions.
For Kawah Ijen, the high CO2 contents maintained even at low H2O
contents do not correspond to predicted solubilities for degassing of basaltic
magmas. The three model curves shown on Figure 3-4 (a) open, b) closed and c)
closed system with 5 wt% exsolved vapour) are for a basaltic magma degassing
in equilibrium fashion in a system that is either closed to addition or loss of a gas
phase, or a system that is open to gas loss only (Newman & Lowenstern, 2002).
None of the degassing curves can describe the high CO2/H2O ratios of many
67
Kawah Ijen inclusions. Other volatile-rich arc magmas display a similar range of
CO2/H2O ratios as Kawah Ijen (e.g., Jorullo, Cerro Negro, Kluchevskoy; Fig. 3-4).
These variable and high CO2/H2O ratios are best explained by vapour fluxing
from deeper in the conduit followed by partial re-equilibration with the magma
upon degassing (e.g., Wallace, 2005; Spilliaert et al., 2006; Johnson et al., 2008;
Vigouroux et al., 2008; Roberge et al., 2009; Blundy et al., 2010;). Vapour
isopleths of 40-70 mol % H2O bracket most of the Kawah Ijen data (Fig. 3-4).
The low H2O melt inclusions at Galunggung have been ascribed to
decompression melting of relatively dry, yet metasomatized mantle, which would
explain the low H2O contents despite the trace element pattern typical of
subduction zones magmas (Sisson and Bronto, 1998; Schiano et al., 2000;
Kelley et al., 2006). The moderate H2O with low CO2 melt inclusions (Kelley et
al., 2006) are more typical of partially degassed melts derived from fluid flux
melting of the mantle beneath arcs. In the subsequent discussion of volatiles and
trace element mobility in subduction zones, only the moderate-H2O magma of
Galunggung will be included as it shows evidence of H2O-rich fluid addition from
the slab.
3.6 Discussion
In the following discussion, we compare between arc magmas using the
average melt inclusion compositions calculated to be in equilibrium with Fo90-91
as reported in Portnyagin et al. (2007), Sadofsky et al. (2008), Johnson et al.
(2009). For Kawah Ijen, we back calculate all melt inclusion composition to be in
equilibrium with Fo90 olivine using the same procedure as discussed above for
68
the correction of post-entrapment crystallization. For Galunggung we back
calculate the melt inclusion compositions of Sisson and Bronto (1998) and Kelley
et al. (2006) using a KD of 0.3 and a FeO/FeOtotal of 0.82 (Kelley and Cottrell,
2009). This procedure does not remove all the effects of differentiation of the
primitive melts, especially for melt inclusions hosted in Fo<85 olivine which have
likely experienced clinopyroxene, plagioclase and Fe-oxide fractionation,
therefore we compare the arc volcanoes using ratios of the trace element
composition in equilibrium with Fo90-91 olivine. Once ratioed, the trace element
signature of each volcano still displays some variability, which is likely related to
mantle source variability and/or variability in the amount of partial melting and
subduction-derived fluid addition to the mantle source. As such, our discussion of
individual arc volcanoes is limited to the average of the trace element ratios for
each melt inclusion suite. For ratios involving volatile components, we retain only
the highest H2O values, and the S, Cl and F contents associated with these
maximum H2O contents, thereby minimizing the effects of degassing and any low
pressure crystal fractionation effects (e.g., plagioclase, clinopyroxene) which are
not accounted for by back calculating to equilibrium with Fo90-91 compositions.
When ratioed to a non-volatile element (e.g., H2O/Nd) we use the average of the
non-volatile trace element in the suite of melt inclusions because not all melt
inclusions report a complete volatile and trace element analysis.
3.6.1 Mantle source composition
To quantify the subduction component added to arc mantle sources it is
necessary to identify the nature of the mantle wedge prior to the addition of the
69
subduction component. Recent studies of primitive melt inclusion compositions in
arc magmas have used HFSE and HREE, regarded as some of the most
conservative or fluid immobile trace elements in subduction zones (Pearce and
Peate, 1995), to characterize the mantle wedge (Portnyagin et al., 2007; Johnson
et al., 2009). These elements (e.g., Nb, Zr, Ti, Y, Dy, and Yb) are used because
they are the least mobile during slab dehydration and melting (e.g., Kessel et al.,
2005; Klimm et al., 2008; Hermann & Rubatto, 2009). Previous studies of the
Kamchatka and Mexican arc have used Nb/Y and Dy/Yb ratios to characterize
the nature of the mantle wedge and the degree of partial melting and previous
melt extraction experienced by the mantle (Portnyagin et al., 2007; Johnson et
al., 2009).
Figure 3-5 compares the average Nb/Y and Dy/Yb ratios of arc melt
compositions with modal batch melting models of various mantle source
compositions in both the spinel and garnet lherzolite fields. The Nb/Y ratio is a
function of source depletion and degree of partial melting, whereas the Dy/Yb
ratio is strongly controlled by the presence or absence of residual garnet in the
mantle source. Most arc magmas have Nb/Y ratios varying between N-MORB
and E-MORB values, with Irazú and the Mexican magmas trending toward OIB
values. Dy/Yb ratios are also variable and range from high values similar to OIB
magmas (>2) to values lower than average MORB (<1.5).
Mantle melting curves are modeled using the modal batch melting
equation and starting mantle compositions of depleted MORB mantle (DMM;
Salters & Stracke, 2004), enriched DMM (E-DMM; Workman & Hart, 2005) and
70
enriched OIB-like mantle (Hoya Alvarez; Johnson et al., 2009). Partition
coefficient (D) values used for modeling melting in the spinel stability field are
from Workman and Hart (2005). For melting in the garnet stability field, bulk D
values are calculated following the method of Eiler et al. (2005) using garnet D
values from Gaetani et al. (2003). The models include partial melting of a mantle
that has undergone previous melt extraction (PME) in both the spinel and garnet
stability fields following the method of Portnyagin et al. (2007).
Results of these models do not offer a unique solution to the nature of the
mantle source beneath these arc volcanoes. Variability between subduction zone
magmas in terms of the fluid-immobile HFSE and HREE is likely a combined
function of mantle wedge composition, degree of partial melting and degree and
nature of PME. The models are also highly sensitive to the D values employed.
Nevertheless, a first-order approximation of the mantle source of arc magmas
may be assessed from Figure 3-6.
Kawah Ijen magmas have a steeper REE pattern (Fig. 3-3) compared to
Galunggung which suggests either a mantle source having undergone smaller
extents of partial melting or PME in the garnet stability field. The Nb/Y and Dy/Yb
systematics illustrate the relationship between Kawah Ijen and Galunggung. Both
plot near the model curves for small degrees of PME in the garnet stability field
starting with an enriched depleted MORB mantle source (E-DMM) and the lower
Nb/Y ratio of the Galunggung magmas are consistent with larger degrees of
partial melting or PME. An MORB-like mantle source component (similar to
Indian Ocean MORB; I-MORB) has previously been proposed for some of the

71
magmas of Java (Turner & Foden, 2001; Gertisser & Keller, 2003; Sendjaja et
al., 2008) and Handley et al. (2007) identified an enriched I-MORB component in
the magmas of Ijen using Sr, Nd, Hf and O isotopes. Some isotopic studies have
found evidence for an OIB mantle components in the magmas of Java (e.g.,
Edwards et al., 1991; 1994) therefore we do not rule out the possibility of a
mantle source containing a mixture of more enriched (OIB-like) and highly
depleted mantle components (DMM).
In comparison, the Kamchatka magmas originate from 5-14 wt% partial
melting of a DMM-like mantle source having undergone <1 wt% PME in the
spinel lherzolite field (Portnyagin et al., 2007). Mexican magmas have highly
variable Nb/Y and Dy/Yb ratios, resulting from 0-10.5 wt% PME of an OIB-type
mantle source in the garnet stability field, followed by 6-15 wt% partial melting in
the spinel stability field (Johnson et al., 2009). Similarly, Central American
magmas have highly variable Nb/Y and Dy/Yb ratios, reflecting the overall
variability in the isotopic and trace element compositions (Fig. 3-3) of the
magmas erupted across the arc (e.g., Carr et al., 1990; Reagan et al., 1994;
Leeman et al., 1994; Chan et al., 1999). Partial melting of a DMM mantle source
in the spinel lherzolite field at variable temperatures and degrees of melting can
reproduce most Central American magmas (Sadofsky et al., 2008). However, the
models are non-unique, and similar results could be obtained from melting of a
more enriched mantle source or melting in the presence of residual garnet
(Sadofsky et al., 2008). The Mexican potassic magmas have similar Nb/Y values
as the most enriched Mexican magmas with elevated Dy/Yb ratios, consistent
72
with PME in the garnet stability field of an enriched mantle source, results that
qualitatively agree with the more detailed trace element modeling reported in
Vigouroux et al. (2008).
3.6.2 Sediment, crust and serpentinite contributions to arc magmas
3.6.2.1 Source of moderately mobile elements and slab surface temperatures
Although the more conservative elements such as the HFSE and HREE
are used to model the mantle source beneath volcanic arcs, the more mobile
elements such as the LREE and the actinides (U, Th) are influenced by the
addition of fluids or melts from sediment and altered ocean crust (AOC) (e.g.,
Hermann et al., 2006).
Th and La, both moderately mobile elements during subduction zone
recycling, are commonly used to track the addition of sediment melt to arc
magmas, as they are most mobile at temperature > 900 and pressures of ~ 4
GPa if allanite and monazite are residual in the slab (Plank, 2005; Kessel et al.,
2005; Klimm et al., 2008; Hermann and Rubatto, 2009). Although Th and La are
not significantly fractionated from each other during sediment melting (e.g.,
Hermann & Rubatto, 2009), subducted sediment generally has a higher Th/La
ratio compared to MORB and OIB mantle sources, and therefore sediment melt
addition leads to elevated Th/La ratios in arc magmas (Plank & Langmuir, 1998;
Plank, 2005).
The influence of sediment melt on the Th/La ratio of arc magmas can be
evaluated by comparing the Th-La-Sm contents of arc magmas with respect to

73
starting mantle and sediment melt compositions (Fig. 3-6; Plank, 2005). The
mantle source of most arc magmas prior to subduction enrichment has lower
Th/La ratios compared to MORB and OIB mantle sources as a result of repeated
PME episodes (Portnyagin et al., 2007; Johnson et al., 2009). A field for the
composition of the melts produced by melting of this mantle without the added
subduction component is plotted. These hypothetical “dry” mantle melts are
modeled using modal batch melting in the spinel stability field with D values from
Workman and Hart (2005). Fields are also shown for sediment melt at different
pressure and temperature conditions in the slab (750-1000 ºC, 2.5-4.5 GPa and
melt fractions of 20-55%). These fields are calculated using the partitioning data
from the experiments of Hermann and Rubatto (2009) and the sediment
composition subducted at each trench from Plank and Langmuir (1998).
A field for the composition of fluids derived from the AOC is computed
from the average AOC compositions reported by Kelley et al. (2003) and Bach et
al. (2003) from two very different DSDP/ODP localities (offshore of the Mariana
arc and the northern South American arc, respectively) and partition coefficient
data for subducted oceanic basalt at 700-900 ºC and 4 GPa from Kessel et al.
(2005). A line illustrating the average Th/La ratio of fluids released during the
breakdown of antigorite serpentinite during prograde metamorphism is derived
from the average composition of olivine-hosted fluid inclusions in the olivine-
enstatite rocks of the Betic Cordillera, Spain (Scambelluri et al., 2001). Limited
trace element data for these fluid inclusions does not include Sm concentrations.
This fluid release may occur in the oceanic peridotite portion of the slab, or above
74
the slab as the serpentinized forearc mantle wedge gets down-dragged (Straub &
Layne, 2003).
Both AOC- and serpentinite-derived fluids have lower Th/La ratios
compared to sediment melts. This reflects the slightly higher mobility of La over
Th in lower temperature (700-800 ˚C) AOC-derived fluids (Kessel et al., 2005)
and the low Th/La content of average AOC compared to subducted sediment
(Plank & Langmuir, 1998; Kelley et al., 2003; Bach et al., 2003). As a result, this
ternary diagram allows for some distinction between sediment melt and AOC-
derived fluids (Fig. 3-6). In general, the arc magmas plot between N-MORB (and
computed dry mantle melts), AOC fluids, and sediment melts, indicating the
importance of all three components (e.g., Kawah Ijen, Galunggung, Mexico).
Some compositions could be explained using only mantle and AOC-fluid
components, but the distinctly elevated Th/La ratios of many compositions
require a variable but significant sediment melt component. For the Central
American volcanoes, the distinction between AOC-derived fluids and sediment
melts is not possible because of the low Th/La of the subducted sediments
(Plank & Langmuir, 1998). The potassic magmas of Mexico have high La/Sm and
Th/Sm ratios and overlap with the OIB-like magma Hoya Alvarez, consistent with
the LREE (and LILE) enriched nature of the magmas (Fig. 3-3; Vigouroux et al.,
2008).
The temperature dependence of trace element mobility in subducting
slabs is explored using the method of Plank et al. (2009). This method utilizes the
temperature dependence of Ce solubility in monazite and allanite-saturated

75
fluids/melts and the H2O contents found in experiments of high-pressure
fluids/melts from sediment and oceanic basalt at various temperatures (Plank et
al., 2009 and references therein). It is important to note that there are several
assumptions and uncertainties associated with these geothermometers (see
Plank et al., 2009), and as a result we simply use these temperatures to
investigate the possible relationship between slab temperature and trace element
mobility.
Melt inclusion H2O/Ce ratios average 3400 for Kawah Ijen, ~1500 for the
moderate-H2O magma of Galunggung, and ~250 for the low-H2O magma of
Galunggung. Corresponding slab surface temperatures are ~800 °C for Kawah
Ijen and ~870 °C for the moderate-H2O magma of Galunggung (Fig. 3-7). The
low-H2O magma of Galunggung does not yield a reliable slab surface
temperature estimate because its magma genesis requires little to no
involvement of fluids derived from the subducting slab (Kelley et al., 2006). Its
H2O/Ce ratio is therefore representative of its mantle source (average value
slightly higher than average MORB; Saal et al., 2002).
In the calculation of slab surface temperatures, it is more accurate to
employ the H2O/Ce ratio of the subduction component as opposed to the final
melt composition because the mantle wedge may contribute significant amounts
of Ce, thereby imparting a lower H2O/Ce ratio to the final melt. However, there
are a number of assumptions and uncertainties involved in calculating the
subduction component of arc magmas (see Portnyagin et al., 2007). Comparison
of temperature estimates using both the calculated subduction component from

76
Portnyagin et al. (2007) and Johnson et al. (2009) and the measured H2O/Ce
ratio in the melt inclusions suggests that slab surface temperatures may be
overestimated by up to 60 °C using the latter. Using the subduction component
H2O/Ce ratios (Portnyagin et al., 2007; Johnson et al., 2009), slab surface
temperatures are estimated at 755-875 °C for Mexico and 700-860 °C for
Kamchatka. No subduction components are calculated for the Central American
magmas (Sadofsky et al., 2008) but melt inclusion H2O/Ce ratios yield slab
surface temperatures of 730-950 °C with most values around 850 °C.
Given the uncertainties in calculated slab surface temperatures using both
the melt inclusion and subduction component H2O/Ce ratios, and in order to be
consistent in our comparison of the different arc magmas, we examine the
relationship of slab surface temperatures with other trace element ratios using
only melt inclusion H2O/Ce ratios. There is a lack of correlation between slab
surface temperatures and Th/La ratios (R2 = 0.12; Fig. 3-7a). This agrees with
experimental studies that have shown that Th/La ratios in allanite- and monazite-
saturated sediment and AOC-derived fluids/melts do not vary significantly as a
function of temperature or degree of melting (Kessel et al., 2005; Klimm et al.,
2008; Hermann & Rubatto, 2009). The variability is, therefore, a result of variable
proportions of sediment melt added to the mantle source of the arc magmas.
There is a tendency for melts with lower H2O/Ce to have somewhat higher Th/La
values, which might be interpreted as evidence for increased sediment melting in
hotter slabs. However, this is likely an artifact of having few samples from arcs
77
with cooler slabs, many of which show elevated Th/La as well (e.g., see Figure 3
in Plank, 2005).
Contrary to Th/La, there is a meaningful, positive correlation between slab
temperature and Sr/Nd and Cl/Nd ratios (Fig. 3-7b, R2 = 0.49; and 3-7c, R2 =
0.58). Contrary to Th and La, Sr and Cl are both highly fluid-mobile elements,
and Nd behaves similarly to La and Ce (moderately mobile at temperatures >800
ºC and pressures >4 GPa, Kessel et al., 2005; Hermann & Rubatto, 2009). The
positive correlation of Sr/Nd with slab temperature agrees with experimental
results on sediment and AOC dehydration/melting in which Sr is highly mobile at
low temperatures and low fluid/melt fractions compared to the LREE, and Sr/Nd
ratios decrease as temperatures increase (Green & Adam, 2003; Kessel et al.,
2005; Klimm et al., 2008; Hermann & Rubatto, 2009). Chlorine is also highly
mobile as evidenced by its correlation with H2O contents in arc magmas
(Johnson et al., 2009) and from high salinities in subduction zone metamorphic
fluids (Philippot et al., 1998; Scambelluri et al., 2004). The similar behaviour of Sr
and Cl versus slab temperature suggests that like Sr, Cl mobility is highest at low
temperatures and/or low fluid/melt fractions.
3.6.2.2 Source of fluid-mobile elements and volatiles
Fluid-mobile elements
The most mobile trace elements during slab subduction are the LILE (Cs,
Rb, Ba, Sr) as well as Pb, B, Be and Li (Kessel et al., 2005; Marschall et al.,
2007; Klimm et al., 2008; Hermann & Rubatto, 2009). In melt inclusion studies,
not all these elements are routinely analysed due to low concentrations and/or

78
lack of suitable standards. Some of the most commonly analysed elements, and
also those that are measured most accurately, include Sr and Ba because they
occur in high concentrations (100s of ppm). We use Ba/Nd and Sr/Nd ratios to
constrain the subduction component of these fluid-mobile elements because
sediment melt and AOC- and serpentinite-derived fluids have very distinct
compositions in Ba-Sr-Nd space (Fig. 3-8).
Sediment melt compositions are calculated for each arc using the same
method as described above (Fig. 3-6). The sediment melts define an elongated
field with highly variable Sr/Nd ratios that correspond to temperature variations
from 750-1000 ºC; pressure has only a negligible effect on melt Sr/Nd ratios
(Hermann & Rubatto, 2009). The sediment melts also have variable Sr/Ba ratios
which are attributed to temperature, pressure and melt fraction variations
(Hermann & Rubatto, 2009).
AOC- and serpentinite-derived fluids are also calculated as described
above except that this time Nd values are reported for the serpentinite-derived
fluids. AOC-derived fluids have similar Sr/Nd ratios compared to sediment melt
but lower Ba/Nd and higher Sr/Ba ratios (Fig. 3-8). This reflects the composition
of subducted sediments and AOC despite the fact that Ba is slightly more mobile
than Sr in AOC-derived fluids, and the opposite is true for sediment melt (Kessel
et al., 2005; Hermann & Rubatto, 2009).
Magmas from Kawah Ijen, Mexico and Kamchatka have Sr/Ba ratios that
are higher than expected for simple mixing between sediment melt and MORB
mantle sources prior to subduction zone enrichment. These magmas span the
79
range of compositions between sediment melt and AOC/serpentinite fluids and in
some cases, AOC/serpentinite fluids appear to dominate the fluid-mobile element
signature. The Mexican potassic magmas have Sr/Nd and Ba/Nd ratios at the
upper end of the range for the calc-alkaline and tholeiitic arc magmas, consistent
with the extreme subduction zone enrichment signature observed from the trace
element pattern (Fig. 3-3).
Kawah Ijen and Galunggung have different Sr/Ba ratios with Kawah Ijen
magmas being richer in Sr (and H2O) compared to Galunggung magmas. This is
consistent with a greater proportion of AOC- or serpentine-derived fluid
component for Kawah Ijen. Isotopic studies have suggested an important role for
AOC-derived fluids in all the magmas of Java with a smaller proportion of a
sediment-derived component on average (Edwards et al., 1993; Alves et al.,
1999; Turner & Foden, 2001). Handley et al. (2007) conducted a detailed trace
element and isotope study of the lavas of the Ijen Caldera Complex. They
suggest that a fertile MORB-like mantle source was first fluxed with 3% AOC-
derived fluid followed by the addition of <1% of bulk sediment. Our estimates of
AOC-derived fluid addition based on H2O-Sr-Nd systematics are very similar
(4%; see Fig. 3-9 and discussion below).
In the Michoacan-Guanujato Volcanic Field (MGVF) of the Mexican arc
(Johnson et al., 2009), the volcanoes with the highest Sr/Ba ratio are La Loma,
Jorullo, Paricutin and San Miguel. These magmas also have the lowest δO18
values for the amount of H2O-rich subduction component added to their sources,
consistent with a greater role for AOC-derived fluids compared to other studied

80
volcanoes in this region (Johnson et al., 2009). For the other volcanoes (e.g.,
San Juan), the importance of sediment melt is clearly discernable from the Ba-
Sr-Nd systematics.
Kamchatkan magmas vary systematically from low to high Sr/Ba ratios
with Ksudach volcano having the highest Sr/Ba ratio. All volcanoes plot within the
AOC fluid field which agrees with isotopic studies that reveal little to no sediment
component but a distinct AOC-derived fluid signature in the mantle source of
these volcanoes (Kersting & Arculus, 1995; Kepezhinskas et al., 1997; Ishikawa
et al., 2001). This is at odds with the slightly elevated Th/La ratios of the
Kamchatka magmas compared to background mantle wedge compositions (Fig.
3-6; Plank, 2005) and the range of Ba/Sr ratios which would suggest variable
degrees of sediment melt influence. However, given the low Ba, Sr, Pb and Nd
concentrations in North Pacific sediments (Plank & Langmuir, 1998), the isotopic
signature of low degrees of sediment melt addition may be masked by the more
dominant reservoirs (depleted mantle and the AOC; Kersting & Arculus, 1995).
In Central America, the Nicaraguan volcanoes (along with Arenal in Costa
Rica) have the highest Sr/Ba ratios. However, the subducted sediment also has
high Sr/Ba, and low temperature melts derived from this sediment will be
particularly enriched in Sr over Ba. This masks the contribution from the AOC-
and serpentinite-derived fluids. Nonetheless, other studies offer insight into the
nature of the subduction component beneath Central America. Rüpke et al.
(2002) used a 2-D thermo-mechanical model to explain the variation in certain
trace element ratios (e.g., B/La and Ba/La) across the arc. On the basis of
81
modeled water retention patterns for the slab, they suggested that the fluid
signature of the Nicaraguan magmas originates mainly from the serpentinized
lithosphere of the subducting slab, whereas the fluid added to the Costa Rican
magmas originates mainly from the metamorphosed basaltic crust. They support
their results with arguments based on B and Be concentrations and isotope
ratios. For both arc segments however, they find only a small contribution from
the subducted sediment based on the high concentration of B and δB11 values.
Other researchers have suggested that sediment melt (Carr et al., 1990;
Feigenson et al., 2004), as well as AOC- and serpentinite-derived fluids, are
involved across the arc. The uniqueness of Nicaragua appears to be related to a
greater fluid flux beneath that portion of the arc (e.g., Feigenson & Carr, 1986;
Patino et al., 2000; Abers et al., 2003; Sadofsky et al., 2008), dominated by
AOC- and serpentinite-derived fluids (Rüpke et al., 2002; Eiler et al., 2005). The
steep subduction angle beneath Nicaragua (~60°, Syracuse & Abers, 2006),
resulting in extensive flexural faulting of the oceanic lithosphere at the outer rise
(Ranero et al., 2001), perhaps coupled with up-slab fluid flow, likely accentuates
the hydration of the Nicaraguan slab (Abers et al., 2003). Our analysis supports
the hypothesis that the mantle wedge beneath Nicaraguan volcanoes (with the
exception of Masaya and Nejapa) is fluxed dominantly with fluids derived from
either the AOC or the serpentinized mantle (high Sr/Ba, high H2O/Ce and low
Th/La) and that the overall subduction-derived flux is highest beneath Nicaragua
(highest Ba/Nd and Sr/Nd).

82
Volatile elements
Information on the mobility and partitioning of the volatile elements other
than H2O during slab dehydration and melting is scarce. In order to relate the
volatile elements (H2O, S, Cl and F) to their source subduction components, we
consider their relationship with Sr (Fig. 3-9). Sr contents are correlated to H2O
(R2 = 0.61 when the low H2O magma of Galunggung is left out) and Cl contents
(R2 = 0.51), whereas the trend with S is more scattered (R2 = 0.35). Fluorine
contents do not appear to correlate with Sr contents and remain mostly near
background mantle values (MORB and OIB).
The global correlation between the volatiles and other fluid-mobile
elements such as Ba and Pb is more scattered than for Sr and needs to be
examined on the scale of individual arcs. The poor correlation between Ba and
H2O (R2 = 0.06), Cl (R2 = 0.06) and S (R2 = 0) may be a result of the more
complex behaviour of Ba compared to Sr during sediment melting (Fig. 6-2). The
concentration of Ba in fluids/melts varies with temperature, pressure, and degree
of melting, and residual phengite plays a role in buffering Ba concentrations
(Kessel et al., 2005, Klimm et al., 2008, Hermann & Rubatto, 2009). Conversely,
no residual phases retain Sr in the slab at sub-arc depths and temperatures >
700°C (Feineman et al., 2007; Schmidt & Poli, 1998). Its concentration in the
fluid/melt phase is governed by the fraction of fluid/melt produced, which in turn
is a function of temperature (Hermann & Rubatto, 2009). Although Pb is highly
mobile during both dehydration and melting processes in the slab (Tenthorey &
Hermann, 2004; Kessel et al., 2005; Hermann & Rubatto, 2009), its
concentration only correlates roughly with Cl contents globally (R2 = 0.24; not

83
shown). Good correlations for H2O (R2 = 0.83), Cl (R2 = 0.72) and S (R2 = 0.56)
are only seen within the Mexican data (not shown). Only Central America shows
a clear positive correlation between Ba/La and Pb/Ce (R2 = 0.6), and data from
Mexico and Java actually have uniform Ba/La contents over variable Pb/Ce
contents.
Given that Sr, Ba and Pb are all very mobile during slab dehydration and
melting, regardless of temperature, pressure and degree of melting, their
contrasting behaviour is intriguing. The main reservoir for Ba and Pb is the
sediment (Plank & Langmuir, 1998). Therefore, the total flux of Ba and Pb from
the slab at sub-arc depths is likely to come dominantly from the sediment melt,
not the dehydrating AOC or the serpentinized mantle, which are the main
reservoirs for Sr. Given that the main dehydrating reservoirs at sub-arc depths is
the AOC (and in some arcs the serpentinized mantle; Rüpke et al., 2004;
Johnson et al., 2009; this study), and that Ba and Pb have a more complex
behaviour than Sr during sediment melting (Hermann & Rubatto, 2009), this
could explain the lack of correlation between Ba, Pb and the volatile elements in
most arcs.
Mobility of H2O
For the calc-alkaline arc basalts, H2O and Sr contents are variably
elevated above background mantle values (except for the low-H2O of
Galunggung), and their positive correlation implies that they are coupled during
slab dehydration at sub-arc depths (80-180 km for the arcs described in this
study). Kawah Ijen magmas have some of the highest H2O/Nd (5800) and Sr/Nd

84
(46) ratios of the arc magmas compared in this study, whereas the moderate-
H2O magma of Galunggung plots at the low end of the range (H2O/Nd = 2000;
Sr/Nd = 25). The low-H2O magma of Galunggung has a similar average H2O/Nd
ratio to MORB and OIB magmas (< 500) and an average Sr/Nd ratio similar to
that of the moderate-H2O magma. Low H2O/Nd ratios and Sr/Nd ratios variably
elevated above mantle values are also characteristic of the potassic magmas of
western Mexico (Vigouroux et al., 2008) and the picrites and ankaramites of the
southern Marianas arc (Kohut et al., 2006). The potassic magmas have low
H2O/Nd ratios despite having high H2O contents (up to 6 wt% H2O) as a result of
elevated concentrations of all trace elements, and are thought to originate from
fluid-fluxing of a highly metasomatized mantle source (Vigouroux et al., 2008).
The picrites and ankaramites of the southern Marianas have very low H2O
contents and have been interpreted as the result of dry, decompression melting
of a metasomatized mantle source (Kohut et al., 2006). These magmas are
similar to the low-H2O Galunggung magmas in composition and trace element
pattern and may share a common magma genesis.
Addition of fluids/melts from the slab and to the mantle wedge after PME
is modeled in Figure 3-9a. We used a starting mantle composition with Sr/Nd and
H2O/Nd ratios of 20 and 200, respectively (Portnyagin et al., 2007; Johnson et
al., 2009). Simple binary mixing of this mantle source with AOC-derived fluids
and sediment melt, both at 800°C, produces trends of constant H2O/Sr ratios
(very little fractionation of H2O-Sr-Nd occurs during mantle peridotite melting).
Sediment melts, with the exception of Central America, have a higher H2O/Sr
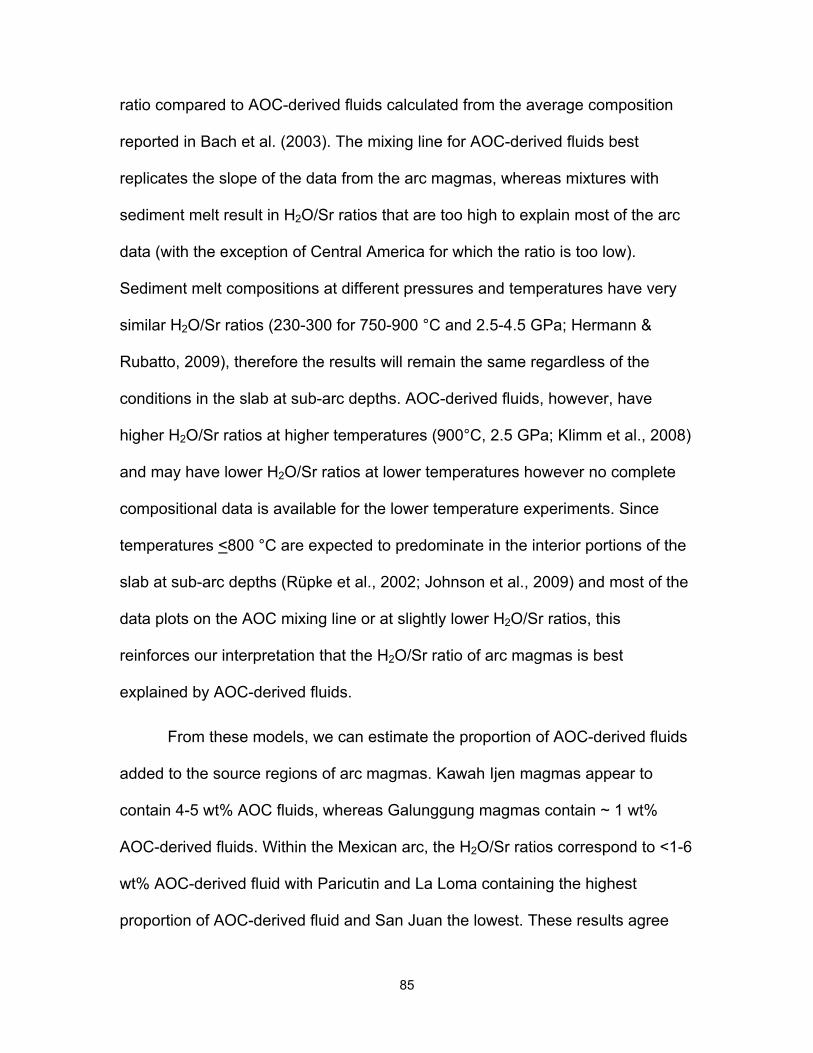
85
ratio compared to AOC-derived fluids calculated from the average composition
reported in Bach et al. (2003). The mixing line for AOC-derived fluids best
replicates the slope of the data from the arc magmas, whereas mixtures with
sediment melt result in H2O/Sr ratios that are too high to explain most of the arc
data (with the exception of Central America for which the ratio is too low).
Sediment melt compositions at different pressures and temperatures have very
similar H2O/Sr ratios (230-300 for 750-900 °C and 2.5-4.5 GPa; Hermann &
Rubatto, 2009), therefore the results will remain the same regardless of the
conditions in the slab at sub-arc depths. AOC-derived fluids, however, have
higher H2O/Sr ratios at higher temperatures (900°C, 2.5 GPa; Klimm et al., 2008)
and may have lower H2O/Sr ratios at lower temperatures however no complete
compositional data is available for the lower temperature experiments. Since
temperatures <800 °C are expected to predominate in the interior portions of the
slab at sub-arc depths (Rüpke et al., 2002; Johnson et al., 2009) and most of the
data plots on the AOC mixing line or at slightly lower H2O/Sr ratios, this
reinforces our interpretation that the H2O/Sr ratio of arc magmas is best
explained by AOC-derived fluids.
From these models, we can estimate the proportion of AOC-derived fluids
added to the source regions of arc magmas. Kawah Ijen magmas appear to
contain 4-5 wt% AOC fluids, whereas Galunggung magmas contain ~ 1 wt%
AOC-derived fluids. Within the Mexican arc, the H2O/Sr ratios correspond to <1-6
wt% AOC-derived fluid with Paricutin and La Loma containing the highest
proportion of AOC-derived fluid and San Juan the lowest. These results agree

86
quantitatively with those found by Johnson et al. (2009) although our estimates of
fluid addition range to higher values compared to their estimates (0.5 – 1.2% of
H2O-rich subduction component). For Kamchatka magmas, our model estimates
1-2 wt% AOC-derived fluid addition, which is also higher compared to the 0.2-0.4
wt% estimates for H2O-rich subduction component reported in Portnyagin et al.
(2007). Qualitatively, our results agree with those from Portnyagin et al. (2007)
whereby the mantle source of Ksudach magmas contain the highest proportion of
subduction component (highest Sr/Ba, Sr/Nd, H2O/Nd and Cl/Nd; Figs. 3-8, 3-9).
In Central America, our model suggests that Cerro Negro receives the highest
amount of AOC-derived fluid (7-8 wt%) and volcanoes such as Nejapa, Masaya
and Atitlan receive the lowest amount (< 1 wt%). This agrees quantitatively with
estimates of H2O contents in the mantle source of the Central American magmas
(Sadofsky et al., 2008). Our estimate of fluid addition for Cerro Negro (7-8 wt%)
is again higher than estimates of slab component (3.4-4 wt%) from Eiler et al.
(2005) and Sadofsky et al. (2008). At this time, our method of estimating % fluid
addition should only be used as a first order approximation because it lacks data
for Sr and Nd solubility in AOC-derived fluids at temperatures < 800 ˚C. Given
that H2O and Sr are increasingly mobile in fluids and melts as slab temperature
decreases (Kessel et al., 2005; Hermann and Spandler, 2008; Hermann and
Rubatto, 2009), the estimated percentage of AOC-derived fluids released from
the slab at temperatures < 800 ˚C should be lower than those reported in our
model for a temperature of 800 ˚C.

87
The halogen-rich andesites (HRA) of the Izu arc are compared to the
basaltic arc magmas because their high concentrations of H2O and halogens are
interpreted to reflect the dehydration of forearc serpentinized mantle (Straub &
Layne, 2003). The composition of fluids released during the dehydration of
serpentinite (Fig. 3-9a, b, path B) through antigorite-serpentinite (Fig. 3-9a, b,
path A) to harzburgite (Scambelluri et al., 2001; 2004) are also shown. The
addition of some H2O and Sr from the serpentinized oceanic lithosphere cannot
be ruled out since the arc data falls within the range of serpentinite-derived fluid
compositions, however no magmas apart from the Izu HRA plot close to path A,
the fluid composition most likely to be present at sub-arc pressures and
temperatures (Scambelluri et al., 2004).
Mobility of Cl
As with H2O, Cl contents correlate with Sr contents (R2 = 0.51 and R2 =
0.6 if the Galunggung magmas are left out). The positive correlation between Cl
and H2O (Johnson et al., 2009), Cl and slab temperature (Fig. 3-7c), and Cl and
Sr (Fig. 3-9b) suggests that these elements are not significantly fractionated from
each other at sub-arc depths. Their concentrations correlate directly with slab
temperatures and the fraction of hydrous fluid/melt produced. Kawah Ijen
magmas have moderate Cl/Sr ratios compared to other arc magmas, some of
which have similar Sr/Nd ratios but trend to higher Cl/Nd ratios (e.g., some of the
Mexican magmas). Galunggung magmas (both the high- and low-H2O magmas),
have elevated Cl/Sr ratios and trend towards the basalts and HRA of the Izu arc

88
although Cl/Nd ratios remain well below the HRA levels (~ 1000; Straub and
Layne, 2003).
Straub and Layne (2003) suggested that partial decoupling between H2O,
the halogens (Cl, F) and the LILE (Sr) may occur beneath the forearc region
where mantle wedge peridotites are serpentinized by the shallow release of
sediment pore fluids rich in halogens but poor in structurally bound H2O, LILE
and other trace elements. The resulting fluids have high Cl/Sr and Cl/H2O as
exhibited by the HRA of the Izu arc (Straub and Layne, 2003). Even fluids
produced from the dehydration of oceanic serpentinite in the deeper parts of the
slab (Scambelluri et al., 2001; 2004; Fig. 3-9b paths A and B) have lower Cl/Sr
ratios compared to the HRA of the Izu arc (Fig. 3-9b). This suggests that the
composition of the fluid phase involved in the hydration of the slab peridotites
may differ from that of the mantle wedge peridotites.
The Cl/Sr ratios of most arc magmas fall within the range of modeled
mixtures of AOC-derived fluid and depleted mantle. The AOC-derived fluids were
calculated using three different average Cl contents in the AOC: 50 ppm (Ito et
al., 1983), 200 ppm (Phillipot et al., 1998) and 500 ppm (Marschall et al., 2009).
We estimate fluid-solid bulk D values for Cl in the dehydrating meta-igneous
crust to be 5-10 based on whole rock Cl contents determined in coexisting
blueschist and eclogite rocks from Syros, Greece (Marschall et al., 2009). Peak
metamorphic conditions for these rocks are estimated at ~2 GPa and 500 ˚C.
Fluid-solid bulk D values for Nd and Sr are from the lowest temperature and

89
pressure experiments of Kessel et al. (2005) and the average Sr and Nd contents
of AOC from Bach et al. (2003).
Based on these Cl models, the Cl/Sr ratio of arc magmas appears to
correspond most closely to AOC-derived fluids with a starting bulk Cl content of
200-500 ppm. The estimated amount of AOC-derived fluid added to the mantle
source of the arc magmas varies from < 1 to 8 wt% which is in excellent
agreement with our estimates using H2O/Sr ratios (Fig. 3-9a). Galunggung
magmas can be modeled with ~ 2 wt% AOC-derived fluid addition, in agreement
with the estimates in Figure 3-9a, but Cl contents in the AOC required to fit the
data would be higher than for Kawah Ijen (500 versus 200 ppm). The picrites and
ankaramites from the Marianas mainly have low Cl/Nd ratios (< 100) but some
melt inclusions record Cl/Nd ratios > 200, similar to the melt inclusions from
ankaramites in Lombok, Indonesia (Elburg et al., 2007). These highly variable
Cl/Nd ratios may reflect the heterogeneity of the metasomatized mantle. The
potassic magmas of Mexico have more uniform Cl/Sr ratios, which are lower than
the calc-alkaline magmas due to high Sr contents and despite elevated Cl
contents (~ 2000 ppm; Vigouroux et al., 2008).
Fluids released from the dehydration of oceanic serpentinites in the slab
also bracket most of the arc magmas (Fig. 3-9b, paths A and B), however, as
argued above for the H2O/Sr data, the mixing lines for AOC-derived fluids best-
approximate the slope of the data from the arc magmas suggesting that the AOC
is the dominant source component for the solute-poor, H2O-, Sr- and Cl-rich
fluids at sub-arc depths.

90
Although there is no obvious global correlation between the moderately-
mobile elements (e.g., Th, LREE) and Cl, S and F contents (not shown), a rough
correlation is seen between Cl and the LREE in some arcs (e.g., Central
America; Sadofsky et al., 2008). This has been interpreted as a reflection of the
coupled mobility of Cl (and S, F) with the LREE in the higher temperature melt
phase coming off the slab (Sadofsky et al., 2008). As illustrated in Figure 3-7a,
H2O contents are decoupled from moderately-mobile elements such as Th. This
would suggest that in some arcs, Cl (and S, F) may be partly decoupled from
H2O and the hydrous fluid phase released from the slab.
Mobility of S and F
Sulphur contents also appear to correlate broadly with Sr contents
although there is more scatter than for Cl and H2O (R2 = 0.35; Fig. 3-9c). Global
variability in mantle S/REE ratios (Saal et al., 2002; Workman et al., 2006) and
the complexity of S solubility in melts/fluids (e.g., Mavrogenes & O’Neill, 1999;
Jugo et al., 2005) may account for some of this variability. Most of the arc
magmas have S contents in excess of the sulphide-saturation limit for basaltic
magmas, consistent with the high oxidation state of subduction zone magmas
(e.g., Carmichael et al., 2006; Vigouroux et al., 2008). Sulphide globules have
been reported in some of the melt inclusions from Central America only
(Sadofsky et al., 2008), but their presence at some stage in the evolution of
magmas from other arc volcanoes cannot be ruled out. Kawah Ijen magmas
have S/Sr ratios that fall within the average for other calc-alkaline magmas,
whereas Galunggung magmas, along with Kamchatka magmas, have variable
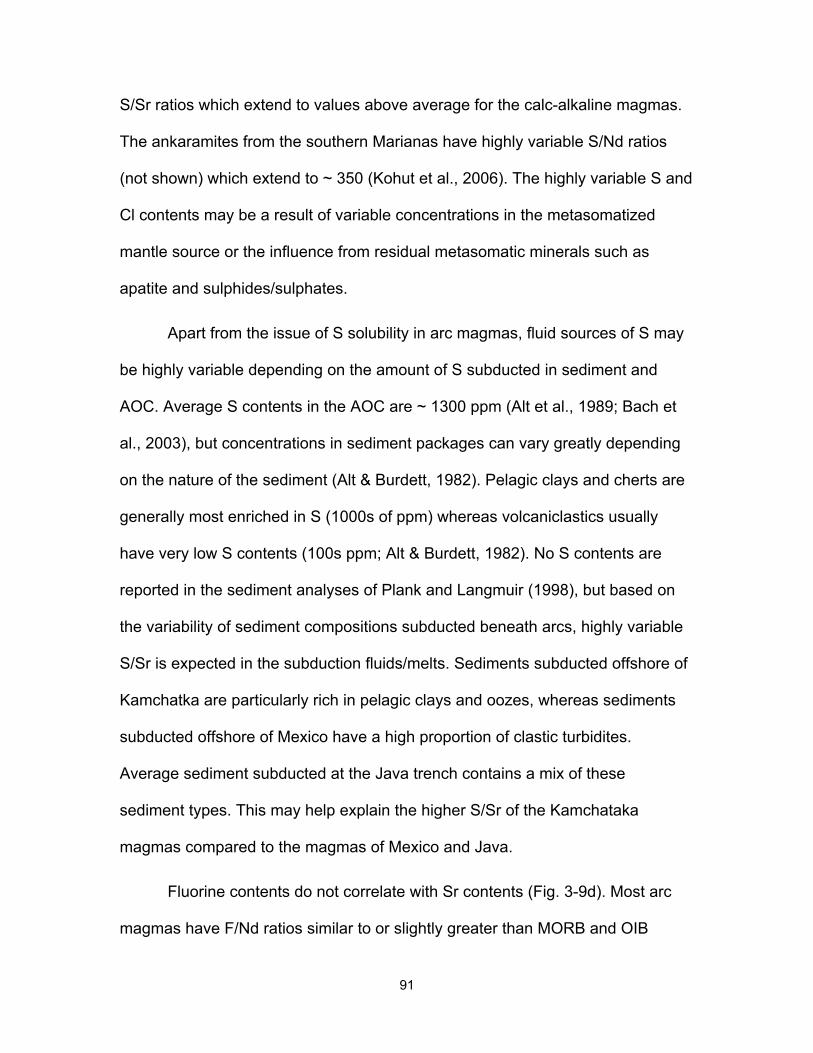
91
S/Sr ratios which extend to values above average for the calc-alkaline magmas.
The ankaramites from the southern Marianas have highly variable S/Nd ratios
(not shown) which extend to ~ 350 (Kohut et al., 2006). The highly variable S and
Cl contents may be a result of variable concentrations in the metasomatized
mantle source or the influence from residual metasomatic minerals such as
apatite and sulphides/sulphates.
Apart from the issue of S solubility in arc magmas, fluid sources of S may
be highly variable depending on the amount of S subducted in sediment and
AOC. Average S contents in the AOC are ~ 1300 ppm (Alt et al., 1989; Bach et
al., 2003), but concentrations in sediment packages can vary greatly depending
on the nature of the sediment (Alt & Burdett, 1982). Pelagic clays and cherts are
generally most enriched in S (1000s of ppm) whereas volcaniclastics usually
have very low S contents (100s ppm; Alt & Burdett, 1982). No S contents are
reported in the sediment analyses of Plank and Langmuir (1998), but based on
the variability of sediment compositions subducted beneath arcs, highly variable
S/Sr is expected in the subduction fluids/melts. Sediments subducted offshore of
Kamchatka are particularly rich in pelagic clays and oozes, whereas sediments
subducted offshore of Mexico have a high proportion of clastic turbidites.
Average sediment subducted at the Java trench contains a mix of these
sediment types. This may help explain the higher S/Sr of the Kamchataka
magmas compared to the magmas of Mexico and Java.
Fluorine contents do not correlate with Sr contents (Fig. 3-9d). Most arc
magmas have F/Nd ratios similar to or slightly greater than MORB and OIB

92
values (e.g., Galunggung). However, we cannot discount the possibility that in
some studies, analytical difficulties in analysing F contents results in their
underestimation. Some arc magmas are enriched in F above mantle values,
including Kawah Ijen and the Mexican magmas. These magmas have F/Nd ratios
similar to the HRA of the Izu arc and the potassic magmas of Mexico. High F
contents in basaltic magmas have been linked to the presence of F-rich minerals
in the melting source region of these magmas (e.g., F-phlogopite; Sigvaldason &
Oskarsson, 1986; Vigouroux et al., 2008). The F/Sr ratio of F-phlogopite and
apatite from the Colima potassic magmas (Luhr & Carmichael, 1981) are shown
on Figure 3-9d. The elevated F/Sr ratio of these minerals may contribute to the
source of high-F in some arc magmas. Phosphoritic sediments, rich in fluoro-
apatite (e.g., Burnett, 1977), and F-rich aragonite and high-Mg calcite in
calcareous sediments (e.g., Kitano & Okumura, 1973; Wei et al., 2005) can also
contribute to F-rich fluids/melts from the slab.
3.6.2.3 Link to subduction zone physical parameters
The previous section has illustrated the correlation between slab surface
temperature and the mobility of the most volatile and fluid-mobile trace elements
in subduction zones. The release from the slab of Sr, H2O, Cl and to a lesser
extent S, is coupled at sub-arc depths and appears to be controlled mainly by
fluid release from the AOC. The minor presence of magmas with highly enriched
(potassic) and depleted (ankaramite) trace element compositions, which retain
the trace element pattern typical of subduction zone magmas, attests to the
variability in subduction zone processes. These magmas do not fall along the

93
trend produced by the calc-alkaline magmas and do not share the same magma
genesis or mantle source (Kohut et al., 2006; Vigouroux et al., 2008).
Experimental studies combined with thermo-mechanical models support
the melt inclusion results and suggest that up to 85% of sediment H2O is
released by 100 km depth such that the AOC is the main dehydrating reservoir at
sub-arc depths (Schmidt & Poli, 1998; Rüpke et al., 2004; Hacker, 2008;
Johnson et al., 2009). For hot subduction zones (e.g., young plates < 40 Ma), the
amount of H2O released from the AOC and the sediment in the slab will reach a
maximum at less than 100 km depth, then the overall flux of H2O will decrease
(Schmidt & Poli, 1998; Rüpke et al., 2004; Hacker, 2008). Therefore for young
plates, such as those subducting beneath Mexico and Central America,
decreasing magmatic H2O contents with distance from the trench would be
expected. In the MGVF of Mexico, this pattern is obscured by the fact that the dip
of the slab has shifted in the last 3 Ma (Johnson et al., 2009). In Central America,
estimates of primitive, undegassed magmatic H2O contents are difficult to make
(Sadofsky et al., 2008) and any patterns with subduction zone physical
parameters are harder to constrain. Nevertheless, rear-arc volcanoes from
Guatemala have lower estimated primitive magma H2O contents compared to
arc-front volcanoes (Sadofsky et al., 2008), as would be expected for a
progressively dehydrating slab.
For colder and older slabs (> 40 Ma), like the ones subducting beneath
Java and Kamchatka (Syracuse and Abers, 2006), the amount of H2O released
from the AOC and the sediment in the slab should remain almost constant at all

94
sub-arc depths (80-180 km) and will be lower than for younger slabs (Rüpke et
al., 2004; Hacker, 2008). As such, for cold slabs, we would expect to see nearly
constant magmatic H2O contents across the arc as is seen in Kamchatka
(Portnyagin et al., 2007). In Java, Galunggung and Kawah Ijen are both located
on the volcanic front, yet Galunggung magmas have distinctly lower H2O/Nd and
Sr/Nd ratios compared to Kawah Ijen magmas. The volcanoes are located in
different arc segments, with H2O-rich Kawah Ijen being much further from the
trench (200 km versus 100 km) and the top of the slab (175 km versus 120 km)
compared to Galunggung. Kelley et al. (2006) compared Galunggung with melt
inclusions from Tambora, located on the island of Sumbawa east of Java in the
Sunda arc. Tambora is located ~ 130 km from the trench and more than 150 km
from the top of the slab (Syracuse and Abers, 2006). As with Galunggung,
Tambora melt inclusions have low H2O contents, leading Kelley et al. (2006) to
suggest that the Indonesian arc is water-poor. However the data presented here
for Kawah Ijen volcano suggests that H2O contents in the arc are highly variable.
Based on only three volcanoes (Kawah Ijen, Galunggung and Tambora), no clear
pattern of H2O content with distance from the trench or to the top of the slab
emerges. More complete melt inclusion studies from additional Indonesian
volcanoes, combined with geodynamic models of the pressure-temperature
conditions of the mantle and slab beneath each volcano, are needed to map out
and understand the along-arc and across-arc pattern of H2O release beneath the
Sunda arc.

95
Despite this current limitation, the study of melt inclusions at Kawah Ijen
volcano has allowed for preliminary assessment of slab surface temperatures
and amount of fluid release beneath eastern Java (Figs. 3-7, 3-9). Although the
Sunda arc is considered a cold subduction zone, Kawah Ijen has some of the
highest H2O, Sr and Cl contents of the arc magmas compared in this study, and
our estimate of the AOC-derived fluid flux beneath Kawah Ijen (4-5 wt%) is
comparable to estimates for volcanic fronts in hotter slabs (e.g., Mexico). This
suggests that the volcanic front in eastern Java may be unusually wet for a cold
subduction zone.
3.7 Conclusions
From the relationship between Sr, volatile elements (H2O, S, Cl, F), and
the predicted compositions of sediment melt, AOC- and serpentinite-derived
fluids at sub-arc depths, the sources of volatiles in arc front magmas can be
constrained. The positive correlations between slab surface temperature, H2O, Cl
and Sr, coupled with the high Sr/Ba ratio of most arc magmas, suggest that most
of the H2O and Cl content of arc front magmas originates from the dehydration of
the AOC. The serpentinized mantle is likely to be an important source of H2O-rich
fluids only in arc segments with hot slab geotherms and steep slab dips such as
Nicaragua. Our results suggest that the involvement of H2O and Cl derived from
sediment melt is secondary to the AOC in most arc front magmas, although
sediment melt does contribute to Ba, Pb, and LREE contents.
The source of sulphur and fluorine in arc magmas is not as easily
discerned although the moderate correlation between Sr and S contents
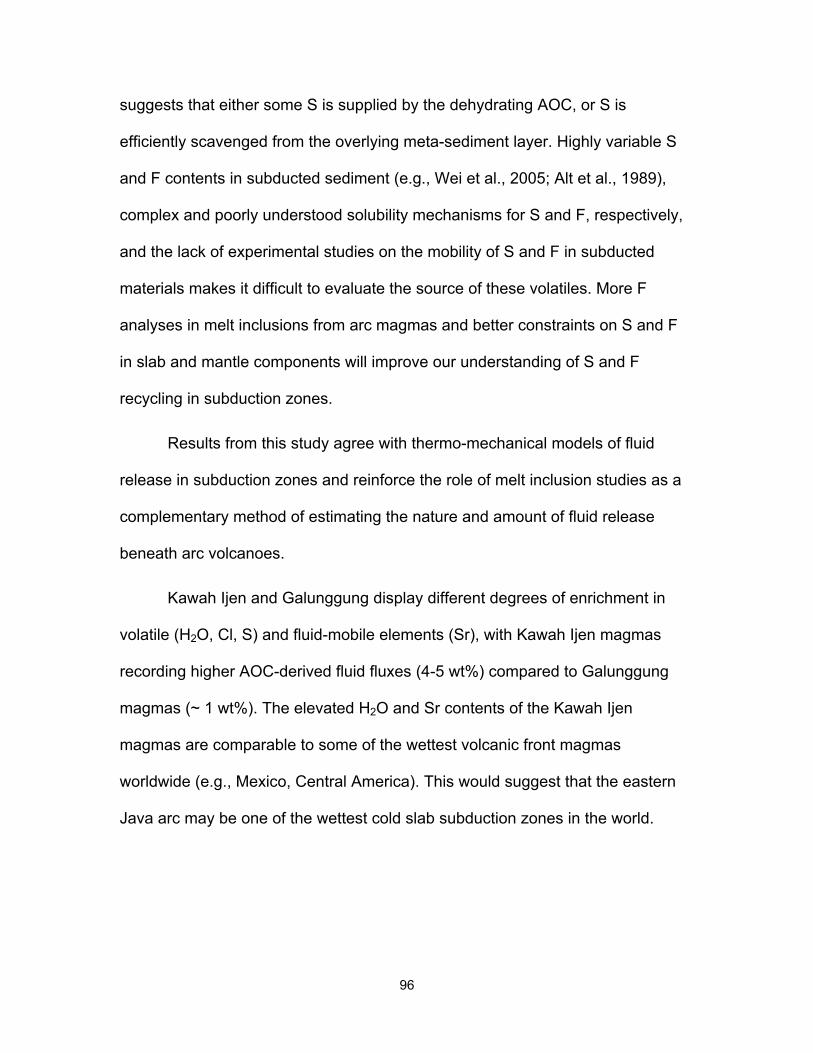
96
suggests that either some S is supplied by the dehydrating AOC, or S is
efficiently scavenged from the overlying meta-sediment layer. Highly variable S
and F contents in subducted sediment (e.g., Wei et al., 2005; Alt et al., 1989),
complex and poorly understood solubility mechanisms for S and F, respectively,
and the lack of experimental studies on the mobility of S and F in subducted
materials makes it difficult to evaluate the source of these volatiles. More F
analyses in melt inclusions from arc magmas and better constraints on S and F
in slab and mantle components will improve our understanding of S and F
recycling in subduction zones.
Results from this study agree with thermo-mechanical models of fluid
release in subduction zones and reinforce the role of melt inclusion studies as a
complementary method of estimating the nature and amount of fluid release
beneath arc volcanoes.
Kawah Ijen and Galunggung display different degrees of enrichment in
volatile (H2O, Cl, S) and fluid-mobile elements (Sr), with Kawah Ijen magmas
recording higher AOC-derived fluid fluxes (4-5 wt%) compared to Galunggung
magmas (~ 1 wt%). The elevated H2O and Sr contents of the Kawah Ijen
magmas are comparable to some of the wettest volcanic front magmas
worldwide (e.g., Mexico, Central America). This would suggest that the eastern
Java arc may be one of the wettest cold slab subduction zones in the world.

97
3.8 Acknowledgement
The authors would like to thank the Kawah Ijen Park service and
particularly Tom Mulja and Niken Widyastuti of East Asia Minerals for their help.
The Kawah Ijen research team, namely Guillaume Mauri, Stephanie Palmer,
Samantha Scher, as well numerous other volunteers, offered valuable help in the
field. We acknowledge John Donovan (University of Oregon) for assistance with
the microprobe analyses. Funding for this work was provided by an NSERC-CRD
grant to G. Williams-Jones.

98
3.9 Figures
Figure 3-1 Map showing the locations of the volcanic arcs discussed in this study. Also shown are drill core recovery sites from either the Ocean Drilling Program (ODP) or the Deep Sea Drilling Project (DSDP) as discussed in Plank and Langmuir (1998). Inset: the location of the Sunda arc and Kawah Ijen (filled diamond) and Galunggung (filled triangle) volcanoes on the island of Java, Indonesia. The thatched region labeled Sunda Land delineates the inferred extent of the continental lithosphere beneath the arc (Hamilton, 1979). Arrows indicate relative plate motions (Tregoning et al., 1994) and convergence rate (Syracuse & Abers, 2006). The location of Kawah Ijen within the Ijen Caldera Complex is shown in the zoom-in (map modified from Van Hinsberg et al., 2008).
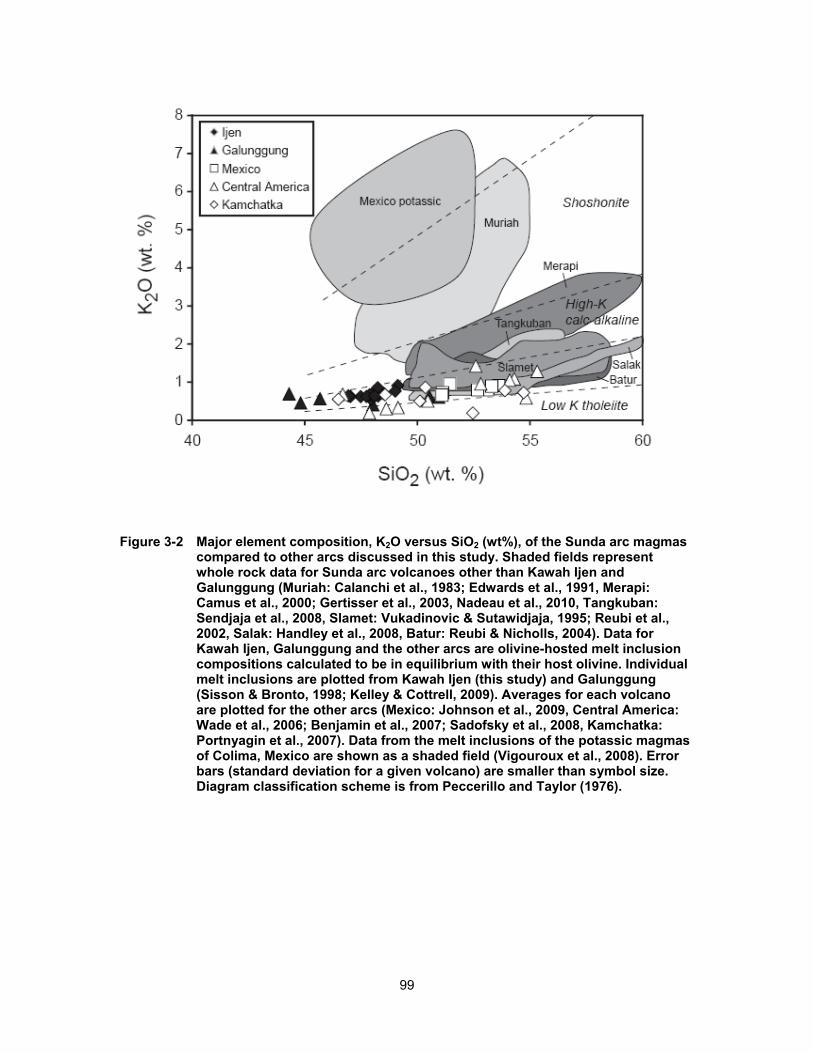
99
Figure 3-2 Major element composition, K2O versus SiO2 (wt%), of the Sunda arc magmas compared to other arcs discussed in this study. Shaded fields represent whole rock data for Sunda arc volcanoes other than Kawah Ijen and Galunggung (Muriah: Calanchi et al., 1983; Edwards et al., 1991, Merapi: Camus et al., 2000; Gertisser et al., 2003, Nadeau et al., 2010, Tangkuban: Sendjaja et al., 2008, Slamet: Vukadinovic & Sutawidjaja, 1995; Reubi et al., 2002, Salak: Handley et al., 2008, Batur: Reubi & Nicholls, 2004). Data for Kawah Ijen, Galunggung and the other arcs are olivine-hosted melt inclusion compositions calculated to be in equilibrium with their host olivine. Individual melt inclusions are plotted from Kawah Ijen (this study) and Galunggung (Sisson & Bronto, 1998; Kelley & Cottrell, 2009). Averages for each volcano are plotted for the other arcs (Mexico: Johnson et al., 2009, Central America: Wade et al., 2006; Benjamin et al., 2007; Sadofsky et al., 2008, Kamchatka: Portnyagin et al., 2007). Data from the melt inclusions of the potassic magmas of Colima, Mexico are shown as a shaded field (Vigouroux et al., 2008). Error bars (standard deviation for a given volcano) are smaller than symbol size. Diagram classification scheme is from Peccerillo and Taylor (1976).

100
Figure 3-3 Multi-element spider diagram normalized to depleted MORB mantle (DMM; Salters & Stracke, 2004). Shaded fields are shown for the melt inclusion data of Mexico, Central America and Kamchatka (including data from Churikova et al., 2007) and average values for Kawah Ijen, Galunggung and Hoya Alvarez (Mexico; Johnson et al., 2009) are shown. The maximum standard deviation for a given volcano is shown. Also shown for comparison are data from the potassic melt inclusions of Colima, Mexico (Vigouroux et al., 2008) and average ocean island basalt (OIB) and normal MORB (N-MORB), both from Sun and McDonough (1989).

101
Figure 3-4 CO2 versus H2O contents of melt inclusions from Kawah Ijen (filled diamonds). Compositions are in equilibrium with their host olivine. Error bars are standard deviation for a given melt inclusion. Also shown are shaded fields for melt inclusions from Galunggung, which separates into two groups, high and low H2O contents (Sisson & Bronto, 1998; Kelley et al., 2006); Jorullo from the Mexican arc (Johnson et al., 2009); Cerro Negro from Central America (Roggensack et al., 1997); and Kluchevskoy in Kamchatka (Auer et al., 2009). Widely dashed curves are isobars from Papale et al. (2006). Solid curves are calculated degassing paths (a = open system, b = closed and c = closed with 5 wt% exsolved vapour). Closely dashed curves are isopleths of constant vapour composition. Both are calculated using VolatileCalc (Newman & Lowenstern, 2002). The starting melt composition was chosen to have the highest H2O found in the melt inclusions with a total of 6000 ppm CO2 based on the assumption that there has been > 50 % CO2 degassed by 0.3 GPa (Wallace, 2005; Blundy et al., 2010).

102
Figure 3-5 Dy/Yb versus Nb/Y of average melt inclusion compositions from each arc volcano along with a field for the potassic magmas of Colima, Mexico (Vigouroux et al., 2008) and average MORB and OIB-type magmas. N-MORB and E-MORB are from Sun and McDonough (1989) and the Loihi sample is a tholeiitic basalt (KK16-1) from Dixon and Clague (2001). The average standard deviation for each volcano is shown. The curves represent modal batch melting of a depleted MORB mantle (DMM from Salters & Stracke, 2004; solid lines), an enriched DMM (E-DMM from Workman & Hart, 2005; thin dashed lines) and an enriched OIB-like mantle (Hoya Alvarez mantle source from Johnson et al., 2009; thick dashed lines) in the spinel stability field (percent partial melting indicated). The mantle source has either undergone no episode of previous melt extraction (PME) or 1% PME in the garnet and spinel lherzolite stability fields. See text for details of the modeling.

103
Figure 3-6 Th-La-Sm ternary showing the composition of arc magmas compared to Hoya Alvarez, the potassic magmas of Mexico, average N-MORB and E-MORB (data sources same as in previous figures) and “Dry mantle melts” (5-10 % partial melts in the spinel stability field of the mantle sources of Java, Mexico and Kamchatka after PME and without the addition of a subduction component). Fields labeled “Sediment melt” represent the range of sediment melt produced at each arc and the field labeled “AOC fluids” represents the range of fluids derived from the AOC (see text for details). No Sm values are reported for serpentinite-derived fluid (Scambelluri et al., 2001) therefore a dashed line shows the Th/La ratio of the fluids (~23).

104
Figure 3-7 a) Th/La, b) Sr/Nd and c) Cl/Nd versus H2O/Ce of arc magmas. Thick dashed lines in a) represent the minimum Th/La in a sediment melt (bulk global subducted sediment: GLOSS; Plank & Langmuir, 1998) at temperatures > 800 °C and the maximum Th/La in an AOC-derived fluid at 700-800 °C (using bulk AOC from Bach et al., 2003). Modeling procedures are the same as for Figure 3-6. Shaded field labeled “Mantle after PME” is derived as in Figure 3-6. Slab surface temperatures are calculated from the H2O/Ce ratio of the melt inclusions using the method of Plank et al. (2009). Average error is calculated from the average reported standard deviation for H2O and Cl contents in a given melt inclusion (Johnson et al., 2009; this study) and from the average standard deviation of primitive Th, La, Ce, Nd and Sr contents at a given volcano (Portnyagin et al., 2007; Sadofsky et al., 2008; Johnson et al., 2009; this study). Linear regression lines (thin dashed lines) and correlation coefficients are given in panels b) and c). In panel c), the correlation coefficient increases to 0.57 if the low H2O magma of Galunggung is excluded.

105
Figure 3-8 Ternary diagram Sr-Nd-Ba illustrating the role of the three subduction component reservoirs: sediment melt, AOC-derived fluid and serpentinite-derived fluid. Details of the fluid/melt composition modeling are described in the text. Data sources are the same as in Figure 3-7.
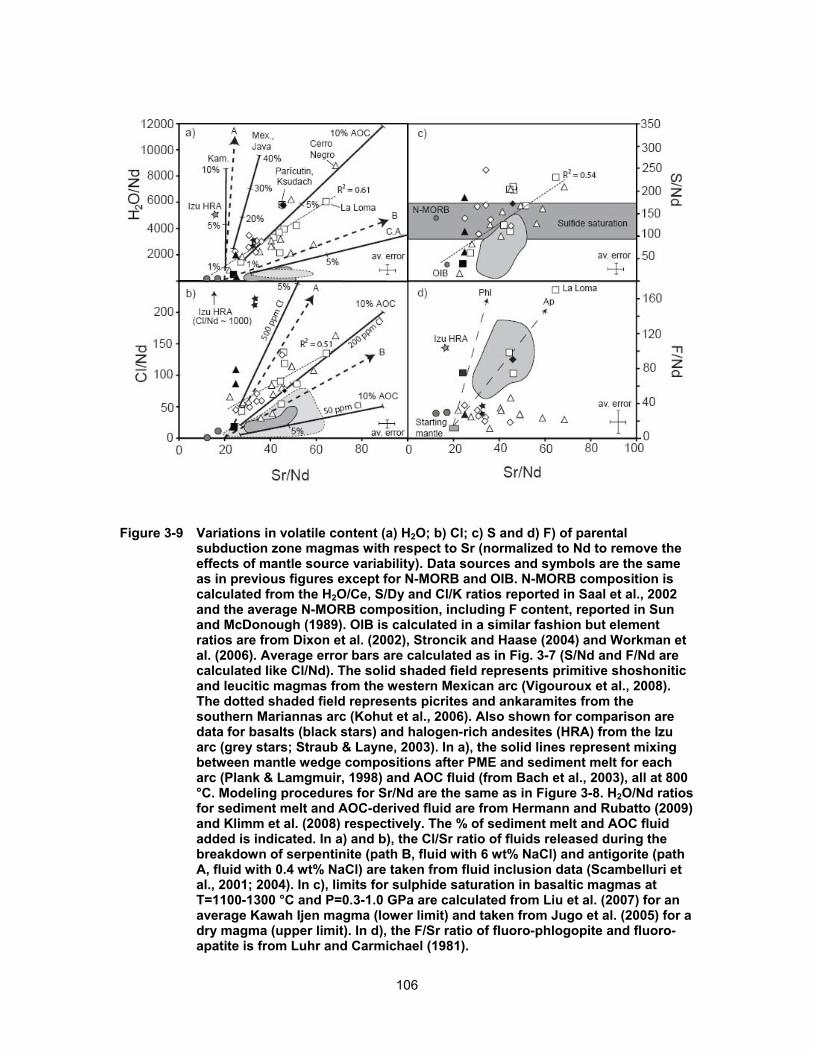
106
Figure 3-9 Variations in volatile content (a) H2O; b) Cl; c) S and d) F) of parental subduction zone magmas with respect to Sr (normalized to Nd to remove the effects of mantle source variability). Data sources and symbols are the same as in previous figures except for N-MORB and OIB. N-MORB composition is calculated from the H2O/Ce, S/Dy and Cl/K ratios reported in Saal et al., 2002 and the average N-MORB composition, including F content, reported in Sun and McDonough (1989). OIB is calculated in a similar fashion but element ratios are from Dixon et al. (2002), Stroncik and Haase (2004) and Workman et al. (2006). Average error bars are calculated as in Fig. 3-7 (S/Nd and F/Nd are calculated like Cl/Nd). The solid shaded field represents primitive shoshonitic and leucitic magmas from the western Mexican arc (Vigouroux et al., 2008). The dotted shaded field represents picrites and ankaramites from the southern Mariannas arc (Kohut et al., 2006). Also shown for comparison are data for basalts (black stars) and halogen-rich andesites (HRA) from the Izu arc (grey stars; Straub & Layne, 2003). In a), the solid lines represent mixing between mantle wedge compositions after PME and sediment melt for each arc (Plank & Lamgmuir, 1998) and AOC fluid (from Bach et al., 2003), all at 800 °C. Modeling procedures for Sr/Nd are the same as in Figure 3-8. H2O/Nd ratios for sediment melt and AOC-derived fluid are from Hermann and Rubatto (2009) and Klimm et al. (2008) respectively. The % of sediment melt and AOC fluid added is indicated. In a) and b), the Cl/Sr ratio of fluids released during the breakdown of serpentinite (path B, fluid with 6 wt% NaCl) and antigorite (path A, fluid with 0.4 wt% NaCl) are taken from fluid inclusion data (Scambelluri et al., 2001; 2004). In c), limits for sulphide saturation in basaltic magmas at T=1100-1300 °C and P=0.3-1.0 GPa are calculated from Liu et al. (2007) for an average Kawah Ijen magma (lower limit) and taken from Jugo et al. (2005) for a dry magma (upper limit). In d), the F/Sr ratio of fluoro-phlogopite and fluoro-apatite is from Luhr and Carmichael (1981).

107
3.10 Tables
Table 3-1 Kawah Ijen melt inclusions (corrected for post-entrapment modifications). Major and volatile elements in wt%, trace elements in ppm.
OT-1-1 OT-1-2 OT-1-3 OT-1-4 OT-1-6 OT-1-8 TO-I TO-VIII TO-IX . TO-XI TO-XIV TO-XV TO-XVI TO-XVII SiO2 46.4 44.9 45.1 45.4 45.6 46.1 45.7 45.5 47.7 45.4 45.3 46.5 44.6 45.5 TiO2 1.33 0.75 1.09 1.04 1.00 0.97 1.06 1.03 1.17 1.03 1.04 0.97 1.00 0.99 Al2O3 17.8 18.8 17.5 18.4 18.1 18.1 18.3 18.4 15.7 17.6 17.7 18.8 18.3 18.8
FeOT 9.4 10.0 9.8 9.8 10.1 10.0 10.1 10.0 11.9 10.2 10.5 9.7 10.1 9.8 MnO 0.18 0.20 0.18 0.16 0.15 0.18 0.17 0.18 0.19 0.16 0.17 0.16 0.19 0.17 MgO 5.1 5.9 5.3 5.6 5.8 6.3 5.4 5.8 6.9 5.6 5.9 5.8 6.6 5.8 CaO 10.5 10.4 11.0 11.0 10.7 10.4 10.5 10.7 9.5 10.3 10.2 10.4 10.7 10.6 Na2O 1.98 1.83 1.82 1.89 2.52 2.64 1.93 2.08 2.86 1.64 1.59 1.43 1.69 1.46 K2O 0.62 0.49 0.61 0.63 0.60 0.58 0.64 0.63 0.86 0.61 0.60 0.70 0.56 0.64 P2O5 0.44 0.35 0.32 0.34 0.32 0.30 0.33 0.34 0.34 0.32 0.30 0.26 0.24 0.28
S 0.185 0.111 0.204 0.203 0.190 0.159 0.221 0.198 0.135 0.219 0.212 0.196 0.200 0.200 Cl 0.081 0.069 0.094 0.099 0.088 0.087 0.097 0.091 0.095 0.100 0.092 0.101 0.099 0.103 F 0.080 0.125 0.101 0.105 0.102 0.146 0.131 0.100 0.111 0.116 0.111 0.082 0.100 0.099
H2O 3.58 5.09 4.12 6.02 3.94 3.56 4.21 5.29 1.52 6.38 7.09 4.44 4.62 3.81 CO2 0.112 0.029 0.100 0.119 0.133 0.135 0.100 0.070 0.040 0.129 0.166 0.087 0.074 0.130
Host Foa 78.7 78.2 78.3 78.5 78.7 79.6 78.4 78.3 79.8 78.0 78.1 79.2 79.7 79.5 Fo equil.b 77.7 79.8 78.3 74.7 80.1 81.6 77.7 79.8 72.5 77.0 76.3 76.2 81.4 77.2
a Forsterite content of the olivine host located ~ 100 μm from melt inclusion. b Forsterite content calculated to be in equilibrium with the uncorrected melt inclusion composition assuming a FeO/FeOtotal ratio of 0.79 and a
calculated KD (see text for details).

108
P (Gpa)c 0.20 0.17 0.20 0.30 0.23 0.22 0.21 0.22 0.11 0.33 0.39 0.20 0.19 0.21 T (˚C)d 1096 1089 1090 1073 1106 1122 1093 1086 1163 1072 1071 1096 1108 1106
X olivine add.e 1.00 0.00 0.10 4.00 0.00 0.00 0.70 0.00 8.40 1.10 2.20 3.40 0.00 2.70 KDf 0.33 0.34 0.33 0.34 0.32 0.32 0.33 0.33 0.32 0.35 0.35 0.35 0.33 0.34
fO2 (ΔNNO)g 0.97 0.7 0.5 1.31
c Pressure of melt inclusion entrapment based on the partial pressures of H2O and CO2, calculated using the program of Papale et al. (2006). d Temperature of melt inclusion entrapment calculated using eq. 6a from Sugawara (2000). e Weight % olivine added back into the composition of the melt inclusions to attain equilibrium between the two phases. f KD values are calculated using the method of Toplis (2005) and the pressure and temperature calculated for each melt inclusion. g Oxygen fugacity values are calculated from the S Kα peak position data and are given as log units relative to the nickel-nickel oxide (NNO) buffer
at a temperature of 1100 °C.
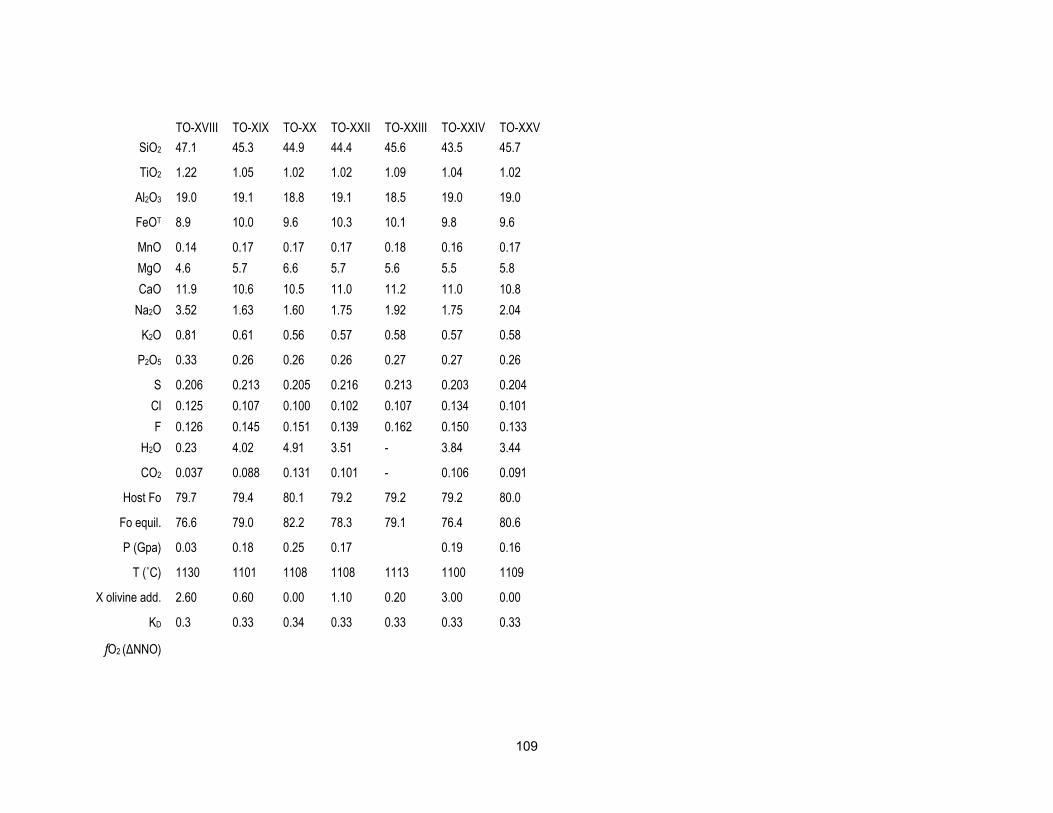
109
TO-XVIII TO-XIX TO-XX TO-XXII TO-XXIII TO-XXIV TO-XXV SiO2 47.1 45.3 44.9 44.4 45.6 43.5 45.7
TiO2 1.22 1.05 1.02 1.02 1.09 1.04 1.02
Al2O3 19.0 19.1 18.8 19.1 18.5 19.0 19.0
FeOT 8.9 10.0 9.6 10.3 10.1 9.8 9.6
MnO 0.14 0.17 0.17 0.17 0.18 0.16 0.17 MgO 4.6 5.7 6.6 5.7 5.6 5.5 5.8 CaO 11.9 10.6 10.5 11.0 11.2 11.0 10.8 Na2O 3.52 1.63 1.60 1.75 1.92 1.75 2.04
K2O 0.81 0.61 0.56 0.57 0.58 0.57 0.58
P2O5 0.33 0.26 0.26 0.26 0.27 0.27 0.26
S 0.206 0.213 0.205 0.216 0.213 0.203 0.204 Cl 0.125 0.107 0.100 0.102 0.107 0.134 0.101 F 0.126 0.145 0.151 0.139 0.162 0.150 0.133
H2O 0.23 4.02 4.91 3.51 - 3.84 3.44
CO2 0.037 0.088 0.131 0.101 - 0.106 0.091
Host Fo 79.7 79.4 80.1 79.2 79.2 79.2 80.0
Fo equil. 76.6 79.0 82.2 78.3 79.1 76.4 80.6
P (Gpa) 0.03 0.18 0.25 0.17 0.19 0.16
T (˚C) 1130 1101 1108 1108 1113 1100 1109
X olivine add. 2.60 0.60 0.00 1.10 0.20 3.00 0.00
KD 0.3 0.33 0.34 0.33 0.33 0.33 0.33
fO2 (ΔNNO)

110
OT-1-1 OT-1-2 OT-1-3 OT-1-4 OT-1-6 OT-1-8 TO-I TO-VIII TO-IX . TO-XI TO-XIV TO-XV TO-XVI TO-XVII Rb 9.15 7.60 10.47 11.94 9.98 8.05 11.34 12.08 17.17 9.60 9.95 12.24 8.60 11.79 Ba 212 146 215 201 198 200 191 216 259 193 188 202 172 187 Th 0.85 0.87 0.87 1.04 1.09 0.72 1.06 1.10 1.82 0.90 0.93 1.38 0.90 1.24 U 0.22 0.14 0.23 0.18 0.28 0.21 0.31 0.36 0.52 0.27 0.24 0.47 0.18 0.33 Nb 2.00 1.36 2.58 1.97 2.19 1.95 2.44 2.45 2.91 2.05 1.88 2.49 1.79 2.19 Ta 0.07 0.04 0.14 0.07 0.13 0.11 0.10 0.04 0.20 0.07 0.06 0.11 bdl 0.07 La 8.56 6.15 8.19 7.42 7.21 6.19 7.94 8.21 10.84 8.21 8.46 8.96 6.55 8.17 Pb 4.34 2.81 3.87 3.96 3.43 3.50 3.75 4.76 6.22 3.99 4.40 4.29 4.06 3.92 Ce 20.45 14.20 19.26 21.80 19.15 18.02 20.76 23.11 26.62 20.54 19.54 20.25 16.21 19.50 Sr 570 573 530 546 527 532 507 549 477 538 525 501 466 508 Pr 2.84 1.97 2.54 2.53 2.62 2.14 2.74 2.74 3.36 2.65 2.42 2.51 1.94 2.32 Nd 13.25 8.31 11.53 11.90 10.23 9.08 11.82 10.62 15.73 12.76 12.83 11.74 9.45 11.77 Zr 37 28 40 35 35 30 45 35 54 36 36 44 31 39 Hf 0.67 0.92 0.97 1.07 1.23 0.90 1.12 1.26 1.51 1.19 1.04 0.95 1.12 0.99 Sm 3.06 2.20 2.87 2.91 2.98 2.74 3.16 2.53 3.50 2.67 3.07 3.08 1.79 3.14 Eu 1.32 0.77 1.05 1.16 1.04 0.91 1.19 1.23 1.26 1.06 0.99 1.05 0.88 0.91 Gd 2.66 1.97 3.57 3.26 3.01 2.34 3.42 1.88 3.33 2.74 2.18 2.61 1.38 1.93 Ti 8489 4735 7178 6310 5972 6146 6092 6487 7418 6282 6477 5863 6016 6042 Dy 2.92 1.87 2.62 2.60 2.75 2.34 3.10 2.42 3.29 2.92 2.86 2.30 2.22 2.17 Li 7.45 7.76 6.83 7.78 6.34 6.68 7.72 6.68 12.00 6.81 7.76 6.45 7.21 7.65 Y 14.90 11.39 15.06 12.75 14.01 12.59 17.35 12.34 16.84 13.35 14.40 14.66 13.29 13.35 Yb 1.01 1.17 1.47 1.19 1.36 1.32 1.68 1.62 2.33 1.46 1.05 1.40 1.32 1.45

111
TO-XVIII TO-XIX TO-XX TO-XXII TO-XXIII TO-XXIV TO-XXV Rb 10.48 9.20 8.25 8.41 9.83 7.82 9.78 Ba 198 175 171 160 185 164 171 Th 1.04 1.06 0.99 1.04 0.89 0.73 0.92 U 0.30 0.23 0.17 0.25 0.27 0.18 0.23 Nb 1.96 1.84 1.66 1.71 1.91 1.72 1.73 Ta bdl 0.09 bdl 0.08 0.13 0.07 bdl La 8.88 8.06 7.69 7.90 7.60 6.96 7.36 Pb 4.14 3.54 3.51 3.52 4.19 4.30 3.84 Ce 20.00 16.85 16.79 17.16 19.82 18.35 18.78 Sr 576 500 488 482 509 488 488 Pr 2.69 2.48 2.07 2.11 2.50 2.31 2.63 Nd 13.75 10.01 11.73 11.00 12.13 10.85 8.57 Zr 48 40 39 36 37 32 34 Hf 1.19 1.03 1.08 1.19 0.97 1.06 0.99 Sm 2.62 2.94 2.54 3.48 3.26 2.70 2.62 Eu 1.26 0.95 1.03 0.94 1.20 0.89 1.06 Gd 3.33 2.97 2.38 2.39 2.47 2.52 1.67 Ti 6519 6001 5959 5831 6213 5981 5964 Dy 2.64 3.15 2.39 2.46 2.40 2.54 2.64 Li 6.54 4.87 6.02 5.63 7.98 6.84 7.78 Y 17.34 14.71 14.93 15.53 13.44 13.14 13.45 Yb 1.98 1.23 1.34 1.35 1.11 1.30 1.41
112
3.11 References
Abers, G.A., Plank, T., Hacker, B.R., 2003. The wet Nicaraguan slab. Geophys. Res. Lett. 30 (2), 1098.
Alt, J.C., Anderson, T.F., Bonnell, L., 1989. The geochemistry of sulfur in a 1.3 km section of hydrothermally altered oceanic crust, DSDP hole 504B. Geochim. Cosmochim. Acta 53 (5), 1011-1023.
Alt, J.C., Burdett, J.W., 1982. Sulfur in pacific deep-sea sediments (leg 129) and implications for cycling of sediment in subduction zones. Proc. Ocean Drill. Prog. 129 283-294.
Alves, S., Schiano, P., Allègre, C.J., 1999. Rhenium-osmium isotopic investigation of Java subduction zone lavas. Earth Planet. Sci. Lett. 168 (1-2), 65-77.
Auer, S., Bindeman, I., Wallace, P.J., Ponomareva, V., Portnyagin, M., 2009. The origin of hydrous, high-δ18O voluminous volcanism: Diverse oxygen isotope values and high magmatic water contents within the volcanic record of Klyuchevskoy volcano,Kamchatka, Russia. Contrib. Mineral. Petrol. 157 (2), 209-230.
Bach, W., Peucker-Ehrenbrink, B., Hart, S. R., Blusztajn, J. S., 2003. Geochemistry of hydrothermally altered oceanic crust: DSDP/ODP Hole 504B–Implications for seawater-crust exchange budgets and Sr-and Pb-isotopic evolution of the mantle. Geochem. Geophys. Geosyst. 4 (3), 8904. doi:10.1029/2002GC000419.
Benjamin, E.R., Plank, T., Wade, J.A., Kelley, K.A., Hauri, E.H., Alvarado, G.E., 2007. High water contents in basaltic magmas from Irazú volcano, Costa Rica. J. Volcanol. Geotherm. Res. 168 (1-4), 68-92.
Blundy, J., Cashman, K.V., Rust, A., Witham, F., 2010. A case for CO2-rich arc magmas. Earth Planet. Sci. Lett. 290 (3-4), 289-301.
Bureau, H., Métrich, N., Semet, M.P., Staudacher, T., 1999. Fluid-magma decoupling in a hot-spot volcano. Geophys. Res. Lett. 26 (23), 3501-3504.
Burnett, W.C. 1977. Geochemistry and origin of phosphorite deposits from off Peru and Chile. Geol. Soc. Am. Bul. 88 (6), 813-823.
Calanchi, N., Lucchini, F., Rossi, P.L., 1983. Considerations on the high-K volcanic rocks of the volcanoes Muriah and Lasem (Java). Mineral. Petrog. Acta 27 15-34.

113
Camus, G., Gourgaud, A., Mossand-Berthommier, P.C., Vincent, P.M., 2000. Merapi (Central Java, Indonesia): An outline of the structural and magmatological evolution, with a special emphasis to the major pyroclastic events. J. Volcanol. Geotherm. Res. 100 (1-4), 139-163.
Carmichael, I.S.E., Frey, H.M., Lange, R.A., Hall, C.M., 2006. The Pleistocene cinder cones surrounding Volcán Colima, Mexico re-visited: Eruption ages and volumes, oxidation states, and sulfur content. Bull. Volcanol. 68 (5), 407-419.
Carn, S.A. 2000. The Lamongan volcanic field, East Java, Indonesia: physical volcanology, historic activity and hazards. J. Volcanol. Geotherm. Res. 95 (1-4), 81-108.
Carr, M.J., Feigenson, M.D., Bennett, E.A., 1990. Incompatible element and isotopic evidence for tectonic control of source mixing and melt extraction along the Central American arc. Contrib. Mineral. Petrol. 105 (4), 369-380.
Colabella, A., Kelley, K., 2006. The effects of slab composition and mantle processes in magma generation at the Indonesian subduction zone. GSO technical report, 2006-02, 5-10.
Chan, L.H., Leeman, W.P., You, C.F., 1999. Lithium isotopic composition of Central American Volcanic Arc lavas: implications for modification of subarc mantle by slab-derived fluids. Chem. Geol. 160 (4), 255-280.
Churikova, T., Worner, G., Mironov, N., Kronz, A., Volatile (S, Cl and F) and fluid mobile trace element compositions in melt inclusions: Implications for variable fluid sources across the Kamchatka arc. Contrib. Mineral. Petrol. 154 (2), 217-239.
Clements, B., Hall, R., Smyth, H.R., Cottam, M.A., 2009. Thrusting of a volcanic arc: A new structural model for Java. Pet. Geosci. 15 (2), 159-174.
Danyushevsky, L.V., Della-Pasqua, F.N., Sokolov, S., 2000. Re-equilibration of melt inclusions trapped by magnesian olivine phenocrysts from subduction-related magmas: petrological implications. Contrib. Mineral. Petrol. 138 (1), 68-83.
Davis, E.E., Chapman, D.S., Forster, C.B., Villinger, H., 1989. Heat-flow variations correlated with buried basement topography on the Juan de Fuca ridge flank. Nature 342, 533-537.
Dixon, J.E., Clague, D.A., 2001. Volatiles in basaltic glasses from Loihi seamount, Hawaii: Evidence for a relatively dry plume component. J. Petrol. 42 (3), 627-654.
Dixon, J.E., Leist, L., Langmuir, C., Schilling, J.G., 2002. Recycled dehydrated lithosphere observed in plume-influenced mid-ocean-ridge basalt. Nature 420 (6914), 385-389.
114
Edwards, C., Menzies, M., Thirlwall, M., 1991. Evidence from Muriah, Indonesia, for the interplay of supra-subduction zone and intraplate processes in the genesis of potassic alkaline magmas. J. Petrol. 32 (3), 555-592.
Edwards, C.M.H., Menzies, M.A., Thirlwall, M.F., Morris, J.D., Leeman, W.P., Harmon, R.S., 1994. The transition to potassic alkaline volcanism in island arcs: The Ringgit-Beser Complex, East Java, Indonesia. J. Petrol. 35 (6), 1557-1595.
Edwards, C.M.H., Morris, J.D., Thirlwall, M.F., 1993. Separating mantle from slab signatures in arc lavas using B/Be and radiogenic isotope systematics. Nature 362 530-533.
Edwards, C., Menzies, M., Thirlwall, M., 1991. Evidence from Muriah, Indonesia, for the interplay of supra-subduction zone and intraplate processes in the genesis of potassic alkaline magmas. J. Petrol. 32 (3), 555-592.
Eiler, J. M., Carr, M. J., Reagan, M., Stolper, E., 2005. Oxygen isotope constraints on the sources of Central American arc lavas. Geochem. Geophys. Geosyst. 6 (7), Q07007, doi:10.1029/2004GC000804.
Faure, F., Schiano, P., 2005. Experimental investigation of equilibration conditions during forsterite growth and melt inclusion formation. Earth Planet. Sci. Lett. 236 (3-4), 882-898.
Feigenson, M.D., Carr, M.J., 1986. Positively correlated Nd and Sr isotope ratios of lavas from the Central American volcanic front. Geology 14 (1), 79-82.
Feigenson, M. D., Carr, M. J., Maharaj, S. V., Juliano, S., Bolge, L. L., 2004. Lead isotope composition of Central American volcanoes: Influence of the Galápagos plume. Geochem. Geophys. Geosyst. 5 (6), Q06001, doi:10.1029/2003GC000621.
Feineman, M.D., Ryerson, F.J., DePaolo, D.J., Plank, T., 2007. Zoisite-aqueous fluid trace element partitioning with implications for subduction zone fluid composition. Chem. Geol. 239 (3-4), 250-265.
Gaetani, G.A., Kent, A.J.R., Grove, T.L., Hutcheon, I.D., Stolper, E.M., 2003. Mineral/melt partitioning of trace elements during hydrous peridotite partial melting. Contrib. Mineral. Petrol. 145 (4), 391-405.
Gertisser, R., Keller, J., 2003. Trace element and Sr, Nd, Pb and O isotope variations in medium-K and high-K volcanic rocks from Merapi Volcano, Central Java, Indonesia: evidence for the involvement of subducted sediments in Sunda arc magma genesis. J. Petrol. 44 (3), 457-489.
Green, T.H., Adam, J., 2003. Experimentally-determined trace element characteristics of aqueous fluid from partially dehydrated mafic oceanic crust at 3.0 GPa, 650–700 C. Eur. J. Mineral. 15 815-830.
115
Hamilton, W., 1974. Sedimentary basins of the Indonesia region. U.S. Geol. Survey, Map 1-875-B.
Hamilton, W. 1979. Tectonics of the Indonesian region. USGS Prof. Paper 1078 345.
Handley, H.K., Davidson, J.P., Macpherson, C.G., Stimac, J.A., 2008. Untangling differentiation in arc lavas: Constraints from unusual minor and trace element variations at Salak Volcano, Indonesia. Chem. Geol. 255 (3-4), 360-376.
Handley, H.K., Macpherson, C.G., Davidson, J.P., Berlo, K., Lowry, D., 2007. Constraining fluid and sediment contributions to subduction-related magmatism in Indonesia: Ijen Volcanic Complex. J. Petrol. 48 (6), 1155.
Harmon, R.S., Gerbe, M., 1992. The 1982–83 eruption at Galunggung volcano, Java (Indonesia): Oxygen isotope geochemistry of a chemically zoned magma chamber. J. Petrol. 33 (3), 585-609.
Hauri, E. 2002. SIMS analysis of volatiles in silicate glasses, 2: isotopes and abundances in Hawaiian melt inclusions. Chem. Geol. 183 (1-4), 115-141.
Hermann, J., Spandler, C.J., 2008. Sediment melts at sub-arc depths: an experimental study. J. Petrol. 49 (4), 717-740.
Hermann, J., Rubatto, D., 2009. Accessory phase control on the trace element signature of sediment melts in subduction zones. Chem. Geol. 265 (3-4), 512-526.
Hermann, J., Spandler, C., Hack, A., Korsakov, A.V., 2006. Aqueous fluids and hydrous melts in high-pressure and ultra-high pressure rocks: Implications for element transfer in subduction zones. Lithos 92 (3-4), 399-417.
Ishikawa, T., Tera, F., Nakazawa, T., 2001. Boron isotope and trace element systematics of the three volcanic zones in the Kamchatka arc. Geochim. Cosmochim. Acta 65 (24), 4523-4537.
Ito, E., Harris, D.M., Anderson, A.T., 1983. Alteration of oceanic crust and geologic cycling of chlorine and water. Geochim. Cosmochim. Acta 47 (9), 1613-1624.
Johnson, E.R., Wallace, P.J., Cashman, K.V., Granados, H.D., Kent, A.J.R., 2008. Magmatic volatile contents and degassing-induced crystallization at Volcán Jorullo, Mexico: Implications for melt evolution and the plumbing systems of monogenetic volcanoes. Earth Planet. Sci. Lett. 269 (3-4), 478-487.

116
Johnson, E.R., Wallace, P.J., Delgado Granados, H., Manea, V.C., Kent, A.J.R., Bindeman, I., Donegan, C.S., 2009. Subduction-related volatile recycling and magma generation beneath central Mexico: Insights from melt inclusions, oxygen isotopes and geodynamic models. J. Petrol. 50 (9), 1729-1764.
Jugo, P.J., Luth, R.W., Richards, J.P., 2005. An experimental study of the sulfur content in basaltic melts saturated with immiscible sulfide or sulfate liquids at 1300 °C and 1.0 GPa. J. Petrol. 46 (4), 783-798.
Kelley, K.A., Cottrell, E., 2009. Water and the oxidation state of subduction zone magmas. Science 325 (5940), 605-607.
Kelley, K. A., Plank, T., Ludden, J., Staudigel, H., 2003. Composition of altered oceanic crust at ODP Sites 801 and 1149. Geochem. Geophys. Geosyst. 4 (6), 8910, doi:10.1029/2002GC000435.
Kelley, K. A., Colabella, A., Sisson, T. W., Hauri, E. H., Sigurdsson, H., 2006. Decompression melting beneath the Indonesian volcanic front. Eos Trans. AGU 87 (52) Fall Meet. Suppl. Abstract V54A-03.
Kent, A.J.R. 2008. Melt inclusions in basaltic and related volcanic rocks. Rev. Mineral. Geochem. 69 (1), 273-331.
Kent, A. J. R., Stopler, E. M., Francis, D., Woodhead, J., Frei, R., Eiler, J., 2004. Mantle heterogeneity during the formation of the North Atlantic Igneous Province: Constraints from trace element and Sr-Nd-Os-O isotope systematics of Baffin Island picrites. Geochem. Geophys. Geosyst. 5 (11), Q11004, doi:10.1029/2004GC000743.
Kepezhinskas, P., McDermott, F., Defant, M.J., Hochstaedter, A., Drummond, M.S., Hawkesworth, C.J., Koloskov, A., Maury, R.C., Bellon, H., 1997. Trace element and Sr-Nd-Pb isotopic constraints on a three-component model of Kamchatka arc petrogenesis. Geochim. Cosmochim. Acta 61 (3), 577-600.
Kersting, A.B., Arculus, R.J., 1995. Pb isotope composition of Klyuchevskoy volcano, Kamchatka and North Pacific sediments: implications for magma genesis and crustal recycling in the Kamchatkan arc. Earth Planet. Sci. Lett. 136 (3-4), 133-148.
Kessel, R., Schmidt, M.W., Ulmer, P., Pettke, T., 2005. Trace element signature of subduction-zone fluids, melts and supercritical liquids at 120–180 km depth. Nature 437 724-727.
Kilinc, A., Carmichael, I.S.E., Rivers, M.L., Sack, R.O., 1983. The ferric-ferrous ratio of natural silicate liquids equilibrated in air. Contrib. Mineral. Petrol. 83 (1), 136-140.
117
Kitano, Y., Okumura, M., 1973. Coprecipitation of fluoride with calcium carbonate. Geochem. J. 7 37-49.
Klimm, K., Blundy, J.D., Green, T.H., 2008. Trace element partitioning and accessory phase saturation during H2O-saturated melting of basalt with implications for subduction zone chemical fluxes. J. Petrol. 49 (3), 523-553.
Kohut, E.J., Stern, R.J., Kent, A.J.R., Nielsen, R.L., Bloomer, S.H., Leybourne, M., 2006. Evidence for adiabatic decompression melting in the southern Mariana arc from high-Mg lavas and melt inclusions. Contrib. Mineral. Petrol. 152 (2), 201-221.
Kopp, H., Flueh, E.R., Petersen, C.J., Weinrebe, W., Wittwer, A., Meramex Scientists, 2006. The Java margin revisited: Evidence for subduction erosion off Java. Earth Planet. Sci. Lett. 242 (1-2), 130-142.
Kuno, H. 1960. High-alumina basalt. J. Petrol. 1 (2), 121-145.
Leeman, W.P., Carr, M.J., Morris, J.D., 1994. Boron geochemistry of the Central American volcanic arc: constraints on the genesis of subduction-related magmas. Geochim. Cosmochim. Acta 58 (1), 149-168.
Liu, Y., Samaha, N.T., Baker, D.R., 2007. Sulfur concentration at sulfide saturation (SCSS) in magmatic silicate melts. Geochim. Cosmochim. Acta 71 (7), 1783-1799.
Luhr, J.F. 1997. Extensional tectonics and the diverse primitive volcanic rocks in the western Mexican Volcanic Belt. Can. Mineral. 35 (2), 473-500.
Luhr, J.F., Carmichael, I.S.E., 1981. The Colima volcanic complex, Mexico: Part II. Late-quaternary cinder cones. Contrib. Mineral. Petrol. 76 (2), 127-147.
Macpherson, C.G., Chiang, K.K., Hall, R., Nowell, G.M., Castillo, P.R., Thirlwall, M.F., 2009. Plio-pleistocene intra-plate magmatism from the southern Sulu arc, Semporna peninsula, Sabah, Borneo: Implications for high-Nb basalt in subduction zones. J. Volcanol. Geotherm. Res. 190 (1-2), 25-38.
Manea, V.C., Manea, M., Kostoglodov, V., Sewell, G., Thermo-mechanical model of the mantle wedge in Central Mexican subduction zone and a blob tracing approach for the magma transport. Phys. Earth Planet. Inter. 149 (1-2), 165-186.
Marschall, H.R., Altherr, R., Rüpke, L., 2007. Squeezing out the slab-modeling the release of Li, Be and B during progressive high-pressure metamorphism. Chem. Geol. 239 (3-4), 323-335.
Marschall, H.R., Altherr, R., Gméling, K., Kasztovszky, Z., 2009. Lithium, boron and chlorine as tracers for metasomatism in high-pressure metamorphic rocks: A case study from Syros (Greece). Mineral. Petrol. 95 (3), 291-302.

118
Masson, D.G., Parson, L.M., Milsom, J., Nichols, G., Sikumbang, N., Dwiyanto, B., Kallagher, H., 1990. Subduction of seamounts at the Java trench: A view with long-range sidescan sonar. Tectonophysics 185 (1-2), 51-65.
Mavrogenes, J.A., O'Neill, H.S.C., 1999. The relative effects of pressure, temperature and oxygen fugacity on the solubility of sulphide in mafic magmas. Geochim. Cosmochim. Acta 63 (7-8), 1173-1180.
Métrich, N., Wallace, P.J., 2008. Volatile abundances in basaltic magmas and their degassing paths tracked by melt inclusions. Rev. Mineral. Geochem. 69 (1), 363.
Nadeau, O., Williams-Jones, A.E., Stix, J., 2010. Sulphide magma as a source of metals in arc-related magmatic hydrothermal ore fluids. Nature Geosci. 3, 501-505.
Newman, S., Lowenstern, J.B., 2002. VolatileCalc: A silicate melt-H2O-CO2 solution model written in Visual Basic for excel. Comput. Geosci. 28, 597-604.
Nicholls, I.A., Whitford, D.J., 1983. Potassium-rich volcanic rocks of the Muriah complex, Java, Indonesia: Products of multiple magma sources? J. Volcanol. Geotherm. Res. 18 (1-4), 337-359.
Papale, P., David, M., 2006. The compositional dependence of the saturation surface of H2O+CO2 fluids in silicate melts. Chem. Geol. 229 (1-3), 78-95.
Patino, L.C., Carr, M.J., Feigenson, M.D., 2000. Local and regional variations in Central American arc lavas controlled by variations in subducted sediment input. Contrib. Mineral. Petrol. 138 (3), 265-283.
Peccerillo, A., Taylor, S.R., 1976. Geochemistry of Eocene calc-alkaline volcanic rocks from the Kastamonu area, northern Turkey. Contrib. Mineral. Petrol. 58 (1), 63-81.
Philippot, P., Agrinier, P., Scambelluri, M., 1998. Chlorine cycling during subduction of altered oceanic crust. Earth Planet. Sci. Lett. 161 (1-4), 33-44.
Plank, T. 2005. Constraints from thorium/lanthanum on sediment recycling at subduction zones and the evolution of the continents. J. Petrol. 46 (5), 921-944.
Plank, T., Cooper, L.B., Manning, C.E., 2009. Emerging geothermometers for estimating slab surface temperatures. Nature Geosci. 2 (9), 611-615.
Plank, T., Langmuir, C.H., 1998. The chemical composition of subducting sediment and its consequences for the crust and mantle. Chem. Geol. 145 (3-4), 325-394.
119
Portnyagin, M., Almeev, R., Matveev, S., Holtz, F., 2008. Experimental evidence for rapid water exchange between melt inclusions in olivine and host magma. Earth Planet. Sci. Lett. 272 (3-4), 541-552.
Portnyagin, M., Hoernle, K., Plechov, P., Mironov, N., Khubunaya, S., 2007. Constraints on mantle melting and composition and nature of slab components in volcanic arcs from volatiles (H2O, S, Cl, F) and trace elements in melt inclusions from the Kamchatka Arc. Earth Planet. Sci. Lett. 255 (1-2), 53-69.
Ranero, C. R., Morgan, J. P., McIntosh, K. D., Reichert, C., 2001. Flexural faulting and mantle serpentinization at the Middle America Trench. Eos Trans. AGU 82 (47) Fall Meet. Suppl. Abstract T22D-04.
Reagan, M.K., Morris, D., Herrstrom, E.A., Murrell, M.T., 1994. Uranium series and beryllium isotope evidence for an extended history of subduction modification of the mantle below Nicaragua. Geochim. Cosmochim. Acta 58 (19), 4199-4212.
Reagan, M.K., Ishizuka, O., Stern, R.J., Kelley, K.A., Ohara, Y., Blichert-Toft, J., Bloomer, S.H., Cash, J., Fryer, P., Hanan, B.B., 2010. Fore-arc basalts and subduction initiation in the Izu-Bonin-Mariana system. Geochem. Geophys. Geosyst. 11 (3), Q03X12, doi:10.1029/2009GC002871.
Reubi, O., Nicholls, I.A., 2004. Magmatic evolution at Batur volcanic field, Bali, indonesia: petrological evidence for polybaric fractional crystallization and implications for caldera-forming eruptions. J. Volcanol. Geotherm. Res. 138 (3-4), 345-369.
Reubi, O., Nicholls, I.A., Kamenetsky, V.S., 2003. Early mixing and mingling in the evolution of basaltic magmas: evidence from phenocryst assemblages, Slamet Volcano, Java, Indonesia. J. Volcanol. Geotherm. Res. 119 (1-4), 255-274.
Roberge, J., Delgado-Granados, H., Wallace, P.J., 2009. Mafic magma recharge supplies high CO2 and SO2 gas fluxes from Popocatépetl volcano, Mexico. Geology 37 (2), 107.
Roggensack, K., Hervig, R.L., McKnight, S.B., Williams, S.N., 1997. Explosive basaltic volcanism from Cerro Negro volcano: Influence of volatiles on eruptive style. Science 277 (5332), 1639.
Rowe, M.C., Nielsen, R.L., Kent, A.J.R., 2006. Anomalously high Fe contents in rehomogenized olivine-hosted melt inclusions from oxidized magmas. Am. Mineral. 91 (1), 82.
Rowe, M.C., Kent, A.J.R., Nielsen, R.L., 2009. Subduction influence on oxygen fugacity and trace and volatile elements in basalts across the Cascade volcanic arc. J. Petrol. 50 (1), 61-91.

120
Rüpke, L.H., Morgan, J.P., Hort, M., Connolly, J.A.D., 2004. Serpentine and the subduction zone water cycle. Earth Planet. Sci. Lett. 223 (1-2), 17-34.
Rüpke, L.H., Morgan, J.P., Hort, M., Connolly, J.A.D., 2002. Are the regional variations in Central American arc lavas due to differing basaltic versus peridotitic slab sources of fluids? Geology 30 (11), 1035-1038.
Saal, A.E., Hauri, E.H., Langmuir, C.H., Perfit, M.R., 2002. Vapour undersaturation in primitive mid-ocean-ridge basalt and the volatile content of earth's upper mantle. Nature 419 (6906), 451-455.
Sadofsky, S.J., Portnyagin, M., Hoernle, K., van den Bogaard, P., 2008. Subduction cycling of volatiles and trace elements through the Central American volcanic arc: evidence from melt inclusions. Contrib. Mineral. Petrol. 155 (4), 433-456.
Salters, V. J. M.,Stracke, A., 2004. Composition of the depleted mantle. Geochem. Geophys. Geosyst. 5 (5), Q05B07, doi:10.1029/2003GC000597.
Scambelluri, M., Bottazzi, P., Trommsdorff, V., Vannucci, R., Hermann, J., Gōmez-Pugnaire, M.T., Lōpez-Sānchez VizcaÌno, V., 2001. Incompatible element-rich fluids released by antigorite breakdown in deeply subducted mantle. Earth Planet. Sci. Lett. 192 (3), 457-470.
Scambelluri, M., Müntener, O., Ottolini, L., Pettke, T.T., Vannucci, R., 2004. The fate of B, Cl and Li in the subducted oceanic mantle and in the antigorite breakdown fluids. Earth Planet. Sci. Lett. 222 (1), 217-234.
Schiano, P., Eiler, J.M., Hutcheon, I.D., Stolper, E.M., 2000. Primitive CaO-rich, silica-undersaturated melts in island arcs: Evidence for the involvement of clinopyroxene-rich lithologies in the petrogenesis of arc magmas. Geochem. Geophys. Geosyst. 1 (5), 1018, doi:10.1029/1999GC000032.
Schmidt, M.W., Poli, S., 1998. Experimentally based water budgets for dehydrating slabs and consequences for arc magma generation. Earth Planet. Sci. Lett. 163 (1-4), 361-379.
Sendjaja, Y.A., Kimura, J.I., Sunardi, E., 2008. Across-arc geochemical variation of Quaternary lavas in West Java, Indonesia: Mass-balance elucidation using arc basalt simulator model. Island Arc 18 (1), 201-224.
Siebert L, Simkin T (2002-). Volcanoes of the World: an Illustrated Catalog of Holocene Volcanoes and their Eruptions. Smithsonian Institution, Global Volcanism Program Digital Information Series, GVP-3, (http://www.volcano.si.edu/world/).
Sigvaldason, G.E., Óskarsson, N., 1986. Fluorine in basalts from Iceland. Contrib. Mineral. Petrol. 94 (3), 263-271.

121
Sisson, T.W., Bronto, S., 1998. Evidence for pressure-release melting beneath arcs from basalt at Galunggung, Indonesia. Nature 391 883-886.
Sitorus, K., 1990. Volcanic stratigraphy and geochemistry of the Idjen Caldera Complex, East Java, Indonesia. M.Sc. thesis, University of Wellington, New Zealand.
Smyth, H.R., Hamilton, P.J., Hall, R., Kinny, P.D., 2007. The deep crust beneath island arcs: Inherited zircons reveal a Gondwana continental fragment beneath east Java, Indonesia . Earth Planet. Sci. Lett. 258 (1-2), 269-282.
Sobolev, A.V., Danyushevsky, L.V., 1994. Petrology and geochemistry of boninites from the north termination of the Tonga Trench: Constraints on the generation conditions of primary high-Ca boninite magmas. J. Petrol. 35 (5), 1183-1211.
Spilliaert, N., Métrich, N., Allard, P., 2006. S-Cl-F degassing pattern of water-rich alkali basalt: Modeling and relationship with eruption styles on Mount Etna volcano. Earth Planet. Sci. Lett. 248 (3-4), 772-786.
Straub, S. M.,Layne, G. D., 2003. Decoupling of fluids and fluid-mobile elements during shallow subduction: Evidence from halogen-rich andesite melt inclusions from the Izu arc volcanic front. Geochem. Geophys. Geosyst. 4 (7), 9004. doi:10.1029/2002GC000349.
Stroncik, N.A., Haase, K.M., 2004. Chlorine in oceanic intraplate basalts: Constraints on mantle sources and recycling processes. Geology 32 (11), 945-948.
Sugawara, T. 2000. Empirical relationships between temperature, pressure, and MgO content in olivine and pyroxene saturated liquid. J. Geophys. Res. 105 (B4), 8457-8472.
Sun, S.S., McDonough, W.F., 1989. Chemical and isotopic systematics of oceanic basalts: Implications for mantle composition and processes. Geol. Soc. Lond. Spec. Pub. 42 (1), 313-345.
Syracuse, E. M.,Abers, G. A., 2006. Global compilation of variations in slab depth beneath arc volcanoes and implications. Geochem. Geophys. Geosyst. 7 (5), Q05017. doi:10.1029/2005GC001045.
Tenthorey, E., Hermann, J., 2004. Composition of fluids during serpentinite breakdown in subduction zones: Evidence for limited boron mobility. Geology 32 (10), 865-868.
Tollstrup, D., Gill, J., Kent, A. J. R., Prinkey, D., Williams, R., Tamura, Y., Ishizuka, O., 2010. Across-arc geochemical trends in the Izu-Bonin arc: Contributions from the subducting slab, revisited. Geochem. Geophys. Geosyst. 11 (1), Q01X10. doi:10.1029/2009GC002847.

122
Toplis, M.J. 2005. The thermodynamics of iron and magnesium partitioning between olivine and liquid: Criteria for assessing and predicting equilibrium in natural and experimental systems. Contrib. Mineral. Petrol. 149 (1), 22-39.
Tregoning, P., Brunner, F.K., Bock, Y., Puntodewo, S.S.O., McCaffrey, R., Genrich, J.F., Calais, E., Rais, J., Subarya, C., 1994. First geodetic measurement of convergence across the Java trench. Geophys. Res. Lett. 21 (19), 2135-2138.
Turner, S., Foden, J.D., 2001. U, Th and Ra disequilibria, Sr, Nd and Pb isotope and trace element variations in Sunda arc lavas: Predominance of a subducted sediment component. Contrib. Mineral. Petrol. 142 (1), 43-57.
van Hinsberg, V.J., 2001. Water-rock interaction and element fluxes in the Kawah Ijen hyperacid crater lake and the Banyu Pahit river, East Java, Indonesia. M.Sc. thesis, University of Utrecht, Netherlands.
van Hinsberg,V.J., Williams-Jones, A.E., Mauri, G., Vigouroux, N., Williams-Jones, G., McKenzie, J., Palmer, S., Nasution A., 2008. Studying the Kawah Ijen volcano-hydrothermal system - merits of an interdisciplinary approach. IAVCEI, Reykjavik, Iceland, Abstract 2-b P29.
Vigouroux, N., Wallace, P.J., Kent, A.J.R., 2008. Volatiles in high-K magmas from the Western trans-Mexican volcanic belt: Evidence for fluid fluxing and extreme enrichment of the mantle wedge by subduction processes. J. Petrol. 49 (9), 1589-1618.
Vukadinovic, D., Sutawidjaja, I., 1995. Geology, mineralogy and magma evolution of Gunung Slamet volcano, Java, Indonesia. J. Southeast Asian Earth Sci. 11 (2), 135-164.
Wade, J.A., Plank, T., Melson, W.G., Soto, G.J., Hauri, E.H., 2006. The volatile content of magmas from Arenal volcano, Costa Rica. J. Volcanol. Geotherm. Res. 157 (1-3), 94-120.
Wallace, P.J. 2005. Volatiles in subduction zone magmas: Concentrations and fluxes based on melt inclusion and volcanic gas data. J. Volcanol. Geotherm. Res. 140 (1-3), 217-240.
Wallace, P.J., Carmichael, I.S.E., 1994. S speciation in submarine basaltic glasses as determined by measurements of SKα X-ray wavelength shifts. Am. Mineral. 79 (1-2), 161-167.
Wei, W., Kastner, M., Deyhle, A., Spivack, A.J., 2005. Geochemical cycling of fluorine, chlorine, bromine, and boron and implications for fluid-rock reactions in Mariana forearc, South Chamorro seamount, ODP leg 195. Proc. Ocean Drill. Prog. 195 1-23.

123
Wheller, G.E., Varne, R., Foden, J.D., Abbott, M.J., 1987. Geochemistry of Quaternary volcanism in the Sunda-Banda arc, Indonesia, and three-component genesis of island-arc basaltic magmas. J. Volcanol. Geotherm. Res. 32 (1-3), 137-160.
Whitford, D.J., Nicholls, I.A., Taylor, R.S., 1979. Spatial variations in the geochemistry of quaternary lavas across the Sunda arc in Java and Bali. Contrib. Mineral. Petrol. 70 (3), 341-356.
Workman, R.K., Hart, S.R., 2005. Major and trace element composition of the depleted MORB mantle (DMM). Earth Planet. Sci. Lett. 231 (1-2), 53-72.
Workman, R.K., Hauri, E., Hart, S.R., Wang, J., Blusztajn, J., 2006. Volatile and trace elements in basaltic glasses from Samoa: Implications for water distribution in the mantle. Earth Planet. Sci. Lett. 241 (3-4), 932-951.
Wysoczanski, R.J., Wright, I.C., Gamble, J.A., Hauri, E.H., Luhr, J.F., Eggins, S.M., Handler, M.R., 2006. Volatile contents of Kermadec Arc-Havre Trough pillow glasses: Fingerprinting slab-derived aqueous fluids in the mantle sources of arc and back-arc lavas. J. Volcanol. Geotherm. Res. 152 (1-2), 51-73.

124
4: INTEGRATED GEOCHEMICAL MODELING OF MAGMATIC DEGASSING AND HYDROTHERMAL INTERACTION: A CASE STUDY FROM KAWAH IJEN VOLCANO, INDONESIA1
4.1 Abstract
Monitoring active volcanoes requires an understanding of magmatic
degassing in relation to magma depth, temperature, composition, style of
degassing (open vs. closed) and interactions with hydrothermal systems. This
study combines results of subsurface degassing interpreted from melt inclusions
with measurements of fumarole gases and acid spring waters from Kawah Ijen
volcano, Indonesia. Kawah Ijen is a stratovolcano with a growing rhyolite dome
on the shore of a hyperacidic crater lake. The dome is emitting sulphur-rich
gases from high temperature fumaroles (350-450˚C).
Matrix glass and melt inclusion compositions (including H2O, CO2, S, Cl
and F) were measured for basaltic, dacitic and rhyolitic magmas. The behaviour
of the volatile species (Dvap-melt) during ascent, degassing and crystallization were
modeled for an open system (including vapour fluxing) assuming Rayleigh
fractionation, and for closed system processes assuming batch degassing and
crystallization. The variable H2O-CO2 contents of the melt inclusions suggest that
1 The following chapter will be submitted to the Journal of Volcanology and Geothermal Research under the co-authorship of G. Williams-Jones, K. Berlo, V. van Hinsberg, A.E. Williams-Jones and P. Wallace. The extent of the collaboration thus far includes assistance with field sampling from V. van Hinsberg, G. Williams-Jones and A.E. Williams-Jones, some sample analysis by K. Berlo and V. van Hinsberg, modeling assistance by P. Wallace and manuscript review by G. Williams-Jones.
125
open system vapour fluxing (XH2Ovapour = 0.25-0.95 for basalt; 0.9-0.95 for
dacite) is the dominant degassing style. The modeled S Dvap-melt values for basalt
remain low (2-10) as the melt ascends (P= 400 to 100 MPa), then increase
sharply to 200 at pressures <100 MPa. As the melt evolves from basalt to dacite,
S Dvap-melt values are high (100-300) and independent of pressure. Evolution from
dacite to rhyolite is characterized by a constant Dvap-melt value of 35. Chlorine
behavior is strongly affected by crystallization of Cl-rich apatite in the basaltic
magma. In dacite and rhyolite, Cl is mostly dissolved in the melt. The Dvap-melt
values range from 7-9 as basalt evolves to dacite and reach 5 for dacite to
rhyolite at low pressures. Fluorine contents are highly variable due to
crystallization of F-rich apatite, especially in the more evolved rocks. This
precludes meaningful modeling of F release to the vapour.
The best-fit modeled gas compositions (mass ratio) are: CO2/H2O = 0.13-
0.27, CO2/S(total) = 2.9-5.7, H2O/S(total) = 21-22 and CO2/HCl = 8-16; fumarole gas
compositions are: CO2/H2O = 0.25-0.3, CO2/S(total) = 4-5, H2O/S(total) = 12-20 and
CO2/HCl = 230-420. The latter represent some of the most S- and CO2-rich and
Cl-poor compositions recorded for arc volcanoes. Partly, the vapour data are
interpreted to reflect the important drop in S solubility between the basaltic and
more evolved magmas, and the low Cl content a result of apatite crystallization.
In part, they are interpreted to reflect condensation of the magmatic vapour upon
ascent. S and C are concentrated in the residual vapour and Cl and F are lost to
the liquid. As a result, fumarole gases precipitate large quantities of native S at
the surface and acid spring waters are enriched in Cl and F (SO42-/Cl ≈ 3; SO4
2-/F

126
< 70). The lack of S scrubbing by the hydrothermal system beneath the dome
implies that the gas C/S ratio at Kawah Ijen is an important parameter for the
monitoring of magmatic activity. This study illustrates the importance of
integrating melt inclusion data with surface gas compositions in evaluating the
effects of magmatic and hydrothermal processes on surface degassing patterns
at active volcanoes.
4.2 Introduction
Recent integrative studies of magmatic degassing have broadened our
understanding of the link between subsurface exsolution of volatiles and surface
gas emissions at active, open vent volcanoes (Aiuppa et al., 2004; 2007; 2010;
Wallace, 2005; Spilliaert et al., 2006; Roberge et al., 2009; Edmonds et al., 2009;
2010). Melt inclusions provide quantitative characterization of the melt volatile
content during ascent, degassing and crystallization of magma (e.g., Métrich and
Clocchiatti, 1989; Johnson et al., 2008; Vigouroux et al., 2008). In counterpart,
the composition of gases at the surface can be measured either directly, using an
evacuated flask (e.g., Giggenbach, 1975; Giggenbach and Goguel, 1989) or
indirectly in the plume using remote sensing methods such as Open-Path FTIR
(e.g., Oppenheimer et al., 1998; Oppenheimer and Kyle, 2008) and in-situ
measurements using the MultiGAS sensor (e.g., Shinohara, 2005; Chapter 5).
Combining melt inclusion volatile data with mass balance constraints and
solubility models (e.g., H2O-CO2: Newman and Lowenstern, 2002; Papale et al.,
2006, S: Scaillet and Pichavant, 2005) allows for the characterization of the
magmatic fluid, which can be directly compared with measured surface
127
emissions (e.g., Spilliaert et al., 2006; Roberge et al., 2009; Johnson et al., 2010;
Edmonds et al., 2010; Aiuppa et al., 2010).
Models that link subsurface degassing to measured surface gas
compositions need to include the evaluation of the effects of cooling,
decompression and interaction with hydrothermal fluids on the gas composition.
Thermodynamic modeling is used to offer insight into the chemical reactions
taking place at equilibrium between a cooling magmatic gas, groundwater and
host rock (e.g., Symonds et al., 2001; Marini and Gambardella, 2005). However,
use of these models in a quantitative fashion is often limited by incomplete
information regarding the water/gas and water/rock ratios as well as the input
magmatic fluid composition at a given volcano. Other studies have focussed on
the changes recorded in the measured surface gas and water compositions to
infer changes in the magmatic-hydrothermal system (e.g., Giggenbach, 1987;
Giggenbach et al., 1990; Christenson, 2000; Edmonds et al., 2003; Caracausi et
al., 2005) but again, estimates of the initial, unaffected magmatic fluid component
are rarely available.
This study combines estimates of the magmatic fluid composition derived
from melt inclusion data with measured surface fumarole and acid sulphate-
chloride waters at Kawah Ijen volcano in order to gain insight into possible
scrubbing of magmatic gases by the hydrothermal system. A large hyper-acidic
crater lake and acid stream runoff attests to the presence of this hydrothermal
system. Any effects of the hydrothermal system on degassing are quantified by

128
comparing the gas specie ratios in the modeled magmatic fluid with those
measured in both the fumarole gases and the acidic waters.
4.3 Geologic Setting
4.3.1 Kawah Ijen volcano
Kawah Ijen and the Ijen Caldera Complex are located in eastern Java,
Indonesia, along the volcanic front of the Sunda arc (Fig. 4-1). Beneath Kawah
Ijen, subduction of the 130 Ma Indo-Australian plate occurs at ~ 7 cm yr-1, making
it one of the fastest and oldest subducting plates (Syracuse and Abers, 2006).
Water-rich fluid release from the subducting plate to the volcanic front is amongst
the highest documented at arcs worldwide (Chapter 3) and results in volatile-rich
magmas such as those found at Kawah Ijen.
Kawah Ijen is a small, active stratovolcano that sits on the eroded flank of
the inactive Merapi volcano, at the intersection of the Ijen Caldera Complex rim
and an intra-caldera lineament of small cinder cones and shields (Fig. 4-1).
Kawah Ijen’s edifice has been repeatedly built and subsequently destroyed over
the last 24,000 years (Sitorus, 1990; van Hinsberg, 2001), starting with a cone
building stage that consists of interbedded layers of basaltic to dacitic lava and
pyroclasts (ash to bomb size) exposed within the crater walls and on the outer
flanks of the volcano. Large lava flows can be seen extending from the crater to
the distal flanks of the volcano, exposed mainly on the south-western flank of the
volcano and delimiting active drainages. The most prominent of these lava flows
is a thick dacitic flow outcropping on the outer S-SW flank of the edifice and
129
exposed along the inner crater walls and in the river bed of the Banyu Pahit river.
These early deposits are discordantly overlain by interbedded dacitic pyroclastic
flow and fall deposits, ballistics, phreato-magmatic, phreatic and hydrothermal
deposits. The Banyu Pahit river valley exposes most of the pyroclastic flow and
fall deposits. The western flank of the volcano has been progressively destroyed
by a series of crater explosions and subsequent collapses (van Hinsberg, 2001).
The current configuration is a large (1 km wide) crater, ~ 300 m deep, partly filled
with a hyper-acidic lake that drains into the Banyu Pahit river. The presence of
both effusive and explosive eruptive material within the exposed stratigraphy of
Kawah Ijen suggests alternating periods of edifice building and periods of
explosive, destructive activity.
On the SE shore of the lake is a vigorously degassing magmatic dome
whose surface is covered in native sulphur deposits. Pipes have been installed to
divert the flow of gas from most of the fumaroles to the base of the dome,
allowing the vapours to cool from > 350 ˚C to < 200 ˚C and native S to condense
into the liquid phase, pooling and crystallizing at the base for local miners to
extract. From 2006 to 2010, the size and morphology of the dome appears to
have varied (Smithsonian Institute, 2007, 2009) but due to the presence of the
miners and the pipes, we are unable to confirm whether the dome has indeed
been growing. Gravity and self-potential surveys around the S flank of Kawah
Ijen have imaged remnants of a shallow hydrothermal system in the S-SE part of
the edifice, likely located within the top 1 km (Mauri, 2009). Shallow hydrothermal
activity within the crater is evidenced by the crater lake, degassing dome and
130
hydrothermally altered sections through older dome rocks (van Hinsberg et al.,
2010a).
4.3.2 Crater lake and Banyu Pahit river
A recent bathymetric survey of the lake reveals that the crater extends 180
m below the surface of the water although competing sediment deposition,
alteration and hydrothermal explosions are constantly altering the lake profile
(Takano et al., 2004). The lake is filled with an oxidized hyperacidic brine with >
100 g kg-1 of dissolved solids (Delmelle et al., 2000; van Hinsberg et al., 2010a).
Acidity levels measured sporadically in the last 50 years have been consistently
high (pH=0-0.4; as reported in Delmelle and Bernard, 1994; Delmelle et al., 2000;
Palmer, 2009; van Hinsberg et al., 2010a). The lake waters seep out through the
Banyu Pahit river and become progressively diluted and neutralized downstream.
Rock alteration by these hyperacidic waters is evident in the lake shore sediment
and the altered bedrock of the Banyu Pahit river. Near-complete leaching of all
elements results in a silica-rich matrix typical of silicic alteration in high-
sulphidation mineralization environments (van Hinsberg et al., 2010a). Near the
currently active dome, exposure through a section of the crater floor has revealed
the presence of an extinct hydrothermal zone believed to be the remnants of the
magmatic dome at an early time (van Hinsberg et al., 2010a) The pervasively
altered rock material consists of alunite, vuggy silica, pyrite and native sulphur, a
mineral assemblage typical of low pH, near surface, intense advanced argillic
alteration in high-sulphidation hydrothermal zones (e.g., Chouinard et al., 2005).

131
4.4 Methodology
4.4.1 Petrological sampling and analysis
Samples of scoria from the lowermost exposed layers of the edifice were
collected in order to sample the earliest and most primitive magmas erupted at
Kawah Ijen (Chapter 3 and additional samples reported in Table 4-1). These data
are compared to younger samples of more felsic pyroclastic bombs sampled
from the western crater rim (Table 4-1; Berlo et al., in prep.). One sample of
dome material containing a glassy interstitial melt globule (sample KV08-702;
van Hinsberg et al., 2010b) is also compared.
The basaltic scoria deposits (layers TO and OT; Chapter 3) are well sorted
and overall clast size grades from ash to lapilli. They contain abundant, loose
crystals of olivine up to 2 mm in length, along with trace amounts of plagioclase
(< 0.5 mm in length) both as loose crystals and within the scoria clasts. Rare
clinopyroxene is also present. The olivine lack any mineral inclusions (e.g.,
spinel) but contain abundant glassy melt inclusions suitable for analysis. Most of
the glassy melt inclusions contain a small shrinkage bubble formed upon cooling
and contraction of the melt. A few melt inclusions contain larger (> 20 vol %)
vapour bubbles (not analysed), suggesting that the magma was vapour saturated
during melt inclusion entrapment. Details of the morphologies, dimensions and
other characteristics of the olivine-hosted melt inclusions as well as details of the
sample preparation for Fourier Transform Infrared Spectroscopy (FTIR) and
electron microprobe analysis can be found in Chapter 3 (Appendix B).

132
Descriptions of the melt inclusions presented in Table 4-1 are given in Berlo et al.
(in prep.).
FTIR analyses were performed using a Nicolet Magna 560 FTIR with a
Continuum IR microscope and OMNIC software at the University of Oregon.
Absorbance was converted to concentration using the Beer-Lambert law,
calculated glass densities using the method of Luhr (2001) and absorbance
coefficients from Yamashita et al. (1997), Dixon et al. (1995) and Dixon and Pan
(1995) for the olivine- and clinopyroxene-hosted melt inclusions and from
Okumura (2003) and Behrens (2004) for the orthopyroxene- and plagioclase-
hosted melt inclusions and felsic matrix glass. Further details of the methodology
can be found in Chapter 3 (Appendix B).
Melt inclusion, mineral host and matrix glass major element compositions
(and S, Cl and F contents) as well as sulphur Kα wavelength shifts were obtained
from electron microprobe analysis using a Cameca SX-100 at the University of
Oregon and a JEOL 8900 at McGill University. Details of the analytical conditions
and standards used at the University of Oregon are reported in Appendix B.
Details of the analyses performed at McGill, are given in Berlo et al. (in prep).
Measurements of sulphur Kα wavelengths were obtained following the method
described in Wallace and Carmichael (1994). Additional details on the method
and the analytical conditions are given in Chapter 3. Peak positions were
converted to sulphur speciation using the linear relationship S6+/Stotal = (∆SKα
unknown/ ∆SKα anhydrite) x 100 defined by Carroll & Rutherford (1988).

133
Olivine-hosted melt inclusion compositions were corrected for post-
entrapment crystallization of olivine along the walls of the inclusion (e.g., Sobolev
and Danyushevsky, 1994). The correction process involves adding 0.1%
increments of equilibrium olivine back into each melt inclusion until the inclusion
composition is in equilibrium with the olivine host. The exchange coefficient (KD =
(Mg/Fe2+)melt / (Mg/Fe2+)olivine) was calculated for each melt inclusion using the
equation of Toplis (2005) that relates KD to temperature, pressure, melt
composition (including H2O) and olivine composition. The average pressure (0.3
GPa) and temperature (1100°C) recorded by the melt inclusions were used.
Saturation pressures based on partial pressures of the H2O and CO2 in the
basaltic melt inclusions were calculated from the model of Papale et al. (2006)
using a melt temperature calculated from equation 6a of Sugawara (2000). This
process was performed iteratively due to the co-dependence of volatile saturation
pressure on melt temperature. KD values ranged from 0.3 to 0.35. We assumed a
FeO/FeOtotal weight ratio of 0.77, calculated from the fO2 of the melt inclusions,
converted to melt Fe2+/Fe3+ mole fraction ratio using the method of Kilinc et al.
(1983). Oxygen fugacity values were calculated from the S Kα measurements on
seven melt inclusions using a temperature of 1100°C and following the method of
Wallace and Carmichael (1994) (Table 4-1). Extents of post-entrapment
crystallization range from 0-8%. Uncertainties in the re-calculated melt inclusion
compositions based on uncertainties in FeO/FeOtotal determination (+ 5 %), KD (+
0.01) and coexisting olivine host composition (+ Fo 0.5) are < 0.5 % for the non-
134
participating oxides and < 5 % for the major participating oxides (FeO, MgO and
SiO2).
Saturation pressures and melt inclusion trapping temperatures for the
clinopyroxene-, plagioclase- and orthopyroxene-hosted melt inclusions were
calculated as for the olivine-hosted melt inclusions, using the models of Papale et
al. (2006) and Sugawara (2000), respectively.
Total iron contents in the melt inclusions (Table 4-1) are comparable to
those measured in the bulk rock (Handley et al., 2007) at a given MgO content
suggesting that post-entrapment iron loss by diffusion was negligible. The
CaO/Al2O3 ratios of the melt inclusions lie along the liquid line of descent defined
by the whole rock data (Handley et al., 2007). This suggests that the melt
inclusion compositions are representative of the bulk melt from which the olivine
crystallized and that the melt inclusions were not affected by disequilibrium
processes (boundary layer concentration build-up) during entrapment (Faure &
Schiano, 2005; Métrich & Wallace, 2008; Kent, 2008).
4.4.2 Fumarole gas sampling and analysis
Fumaroles on the active dome were sampled in 2007 and 2008 following
the method of Giggenbach (1975), using an evacuated glass flask filled with 80
ml of 3.5 M NaOH solution. The NaOH is trace metal grade and diluted with
nano-pure water. Exit temperatures of the fumaroles were > 350 ˚C and the
hottest fumaroles were selected for sampling. The sampling points were located
on the top of the dome directly into the natural fumaroles and not from the exit of

135
the pipes at the base of the dome. A thin (0.8 cm) quartz tube (< 1 m in length)
was inserted into the fumarole and linked to the sampling flask via high
temperature Teflon tubing whose length was kept as short as possible to avoid
large temperature drops and vapour condensation. The tubing was purged with
gas prior to sampling. Samples were collected for 5-15 minutes ensuring that the
flow rate did not exceed ~ 1 bubble s-1 to avoid air contamination. Samples were
analysed at the Analytical Chemistry Lab at the University of New Mexico.
Insoluble gas species (e.g., CO2, CO) were measured using gas chromatography
and the soluble gas species (e.g., SO2, H2S, HCl, HF) were analysed using wet
chemistry following the method of Giggenbach and Goguel (1989). H2O contents
were determined using the weight difference of the flask prior to and following
sampling (weighted to 0.1g).
4.5 Results
4.5.1 Melt inclusion and matrix glass major and volatile element composition
Table 4-1 reports the major element composition of the melt inclusions
and the matrix glasses including H2O, CO2, S, Cl and F contents, host
compositions (olivine only), oxygen fugacities from S peak shift measurements
(select melt inclusions only) and volatile saturation pressures and melt
temperatures (for previously reported basaltic melt inclusion compositions refer
to Chapter 3). Olivine-hosted compositions have been corrected for post-
entrapment crystallization (Table 4-1). Analysed values can be found in Appendix

136
C. Melt inclusions hosted in other phases: clinopyroxene, orthopyroxene and
plagioclase are reported as analysed.
Olivine hosts have compositions of Fo78-81 (Fo = forsterite %) and a more
faylite-rich rim of Fo76-77, up to 20 μm wide, visible in back-scattered electron
imaging. Some olivine crystals have Cr-rich oxides present as inclusions in the
rim only. Two profiles, one length-wise and one width-wise were performed on a
euhedral olivine phenocryst (Fig. 4-2). The profiles (2.3 and 1.3 mm long) display
a normal zoning pattern overprinted by a small-scale reverse zoning trend from
the rim inward from Fo79 to Fo79.5.
Olivine-hosted melt inclusions are basaltic in composition (Fig. 4-3) with
(normalized on an anhydrous basis) 47-50 wt% SiO2, 5-7 wt% MgO, FeOtotal
contents of 10-12 wt% (excluding the embayment glass sample TO-XVIII;
Chapter 3), a CaO/Al2O3 ratio of 0.55-0.63 and a total alkali content of 2.2-4.1
wt% (NaO + K2O). The basaltic melt inclusions classify as medium-K calc-
alkaline magmas as is typical of arc magmas in eastern Java and Bali (Chapter
3). The matrix glass of the basaltic tephra has 53-54 wt% SiO2, 3.5-4 wt% MgO
and elevated FeO contents of 13-15 wt% (anhydrous normalized values). The
CaO/Al2O3 ratio is 0.58-0.70, extending to higher values than the melt inclusions.
Total alkali content of the matrix glass overlaps with that of the melt inclusions
(3.3-4 wt% NaO + K2O).
One clinopyroxene- and one plagioclase-hosted melt inclusion have been
analysed for major element and S, Cl and F content (Table 4-1; mountpx1 and
plmi1, respectively). H2O and CO2 contents are available for a second
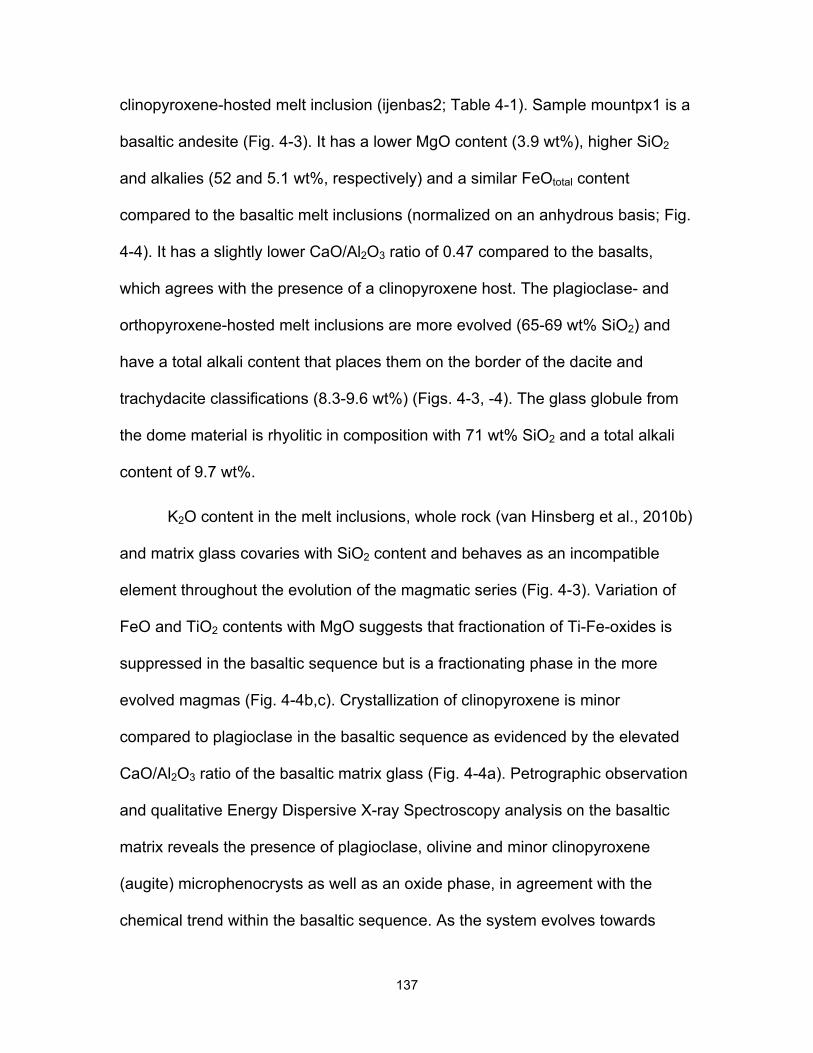
137
clinopyroxene-hosted melt inclusion (ijenbas2; Table 4-1). Sample mountpx1 is a
basaltic andesite (Fig. 4-3). It has a lower MgO content (3.9 wt%), higher SiO2
and alkalies (52 and 5.1 wt%, respectively) and a similar FeOtotal content
compared to the basaltic melt inclusions (normalized on an anhydrous basis; Fig.
4-4). It has a slightly lower CaO/Al2O3 ratio of 0.47 compared to the basalts,
which agrees with the presence of a clinopyroxene host. The plagioclase- and
orthopyroxene-hosted melt inclusions are more evolved (65-69 wt% SiO2) and
have a total alkali content that places them on the border of the dacite and
trachydacite classifications (8.3-9.6 wt%) (Figs. 4-3, -4). The glass globule from
the dome material is rhyolitic in composition with 71 wt% SiO2 and a total alkali
content of 9.7 wt%.
K2O content in the melt inclusions, whole rock (van Hinsberg et al., 2010b)
and matrix glass covaries with SiO2 content and behaves as an incompatible
element throughout the evolution of the magmatic series (Fig. 4-3). Variation of
FeO and TiO2 contents with MgO suggests that fractionation of Ti-Fe-oxides is
suppressed in the basaltic sequence but is a fractionating phase in the more
evolved magmas (Fig. 4-4b,c). Crystallization of clinopyroxene is minor
compared to plagioclase in the basaltic sequence as evidenced by the elevated
CaO/Al2O3 ratio of the basaltic matrix glass (Fig. 4-4a). Petrographic observation
and qualitative Energy Dispersive X-ray Spectroscopy analysis on the basaltic
matrix reveals the presence of plagioclase, olivine and minor clinopyroxene
(augite) microphenocrysts as well as an oxide phase, in agreement with the
chemical trend within the basaltic sequence. As the system evolves towards
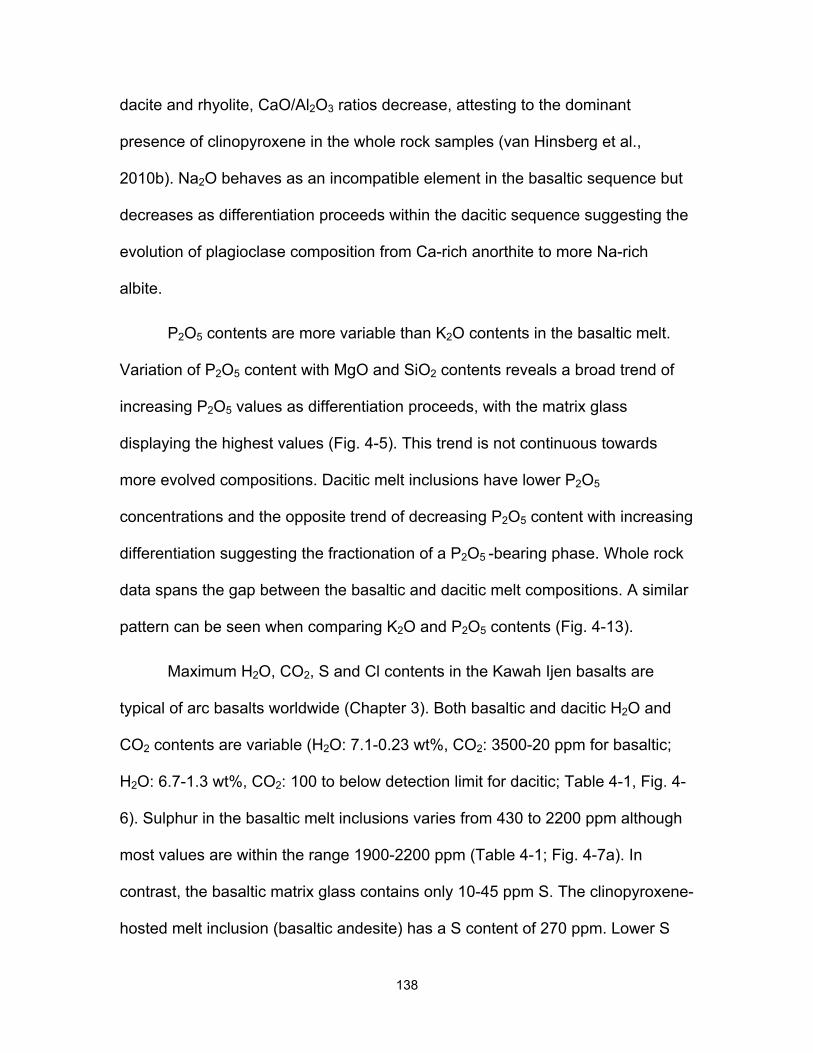
138
dacite and rhyolite, CaO/Al2O3 ratios decrease, attesting to the dominant
presence of clinopyroxene in the whole rock samples (van Hinsberg et al.,
2010b). Na2O behaves as an incompatible element in the basaltic sequence but
decreases as differentiation proceeds within the dacitic sequence suggesting the
evolution of plagioclase composition from Ca-rich anorthite to more Na-rich
albite.
P2O5 contents are more variable than K2O contents in the basaltic melt.
Variation of P2O5 content with MgO and SiO2 contents reveals a broad trend of
increasing P2O5 values as differentiation proceeds, with the matrix glass
displaying the highest values (Fig. 4-5). This trend is not continuous towards
more evolved compositions. Dacitic melt inclusions have lower P2O5
concentrations and the opposite trend of decreasing P2O5 content with increasing
differentiation suggesting the fractionation of a P2O5 -bearing phase. Whole rock
data spans the gap between the basaltic and dacitic melt compositions. A similar
pattern can be seen when comparing K2O and P2O5 contents (Fig. 4-13).
Maximum H2O, CO2, S and Cl contents in the Kawah Ijen basalts are
typical of arc basalts worldwide (Chapter 3). Both basaltic and dacitic H2O and
CO2 contents are variable (H2O: 7.1-0.23 wt%, CO2: 3500-20 ppm for basaltic;
H2O: 6.7-1.3 wt%, CO2: 100 to below detection limit for dacitic; Table 4-1, Fig. 4-
6). Sulphur in the basaltic melt inclusions varies from 430 to 2200 ppm although
most values are within the range 1900-2200 ppm (Table 4-1; Fig. 4-7a). In
contrast, the basaltic matrix glass contains only 10-45 ppm S. The clinopyroxene-
hosted melt inclusion (basaltic andesite) has a S content of 270 ppm. Lower S

139
contents are also found in the dacitic melt inclusions, ranging from 90 to 300
ppm. Dacitic matrix glass S contents overlap at 80-170 ppm (Fig. 4-7a). The
interstitial glass globule from the dome rock (rhyolitic glass) contains 130 ppm S.
The basaltic melt inclusions display nearly constant S content with decreasing
H2O content until 1.5 wt% H2O, then decrease to < 50 ppm in the matrix glass
(Fig. 4-7a). The variability in S content at H2O contents > 3 wt% may be
attributed to the presence of S-saturated globules in some of the melt inclusions,
mainly from tephra layer OT (Fig. 4-7a). In the more evolved samples, S contents
remain nearly constant throughout the range of H2O contents (6.7-0 wt%). No
primary magmatic S-saturated globules have been found in the evolved samples.
Chlorine contents in the basaltic melt inclusions vary between 700-1300
ppm and are higher in the matrix glass (1500-1800 ppm; Table 4-1; Fig. 4-7b).
Chlorine contents of 760 ppm are found in the basaltic andesite melt inclusion.
The dacitic melt inclusions have 1800-2300 ppm Cl whereas the dacitic matrix
glass has slightly lower concentrations (1500-1600 ppm) and the rhyolitic glass
even lower Cl contents (1385 ppm). Within the basaltic sequence, Cl contents
remain approximately constant as H2O contents decrease with more elevated
values in the matrix glasses (Fig. 4-7b). In the dacitic-rhyolitic sequence the
opposite trend is seen with decreasing Cl contents as H2O decreases.
Fluorine contents range from 780-1600 ppm in the basaltic melt inclusions
(Table 4-1, Fig. 4-7c) and are some of the highest concentrations reported for arc
basalts (Chapter 3). F contents are only slightly lower on average in the basaltic
matrix glass (600-1070 ppm). As H2O contents decrease, F contents remain
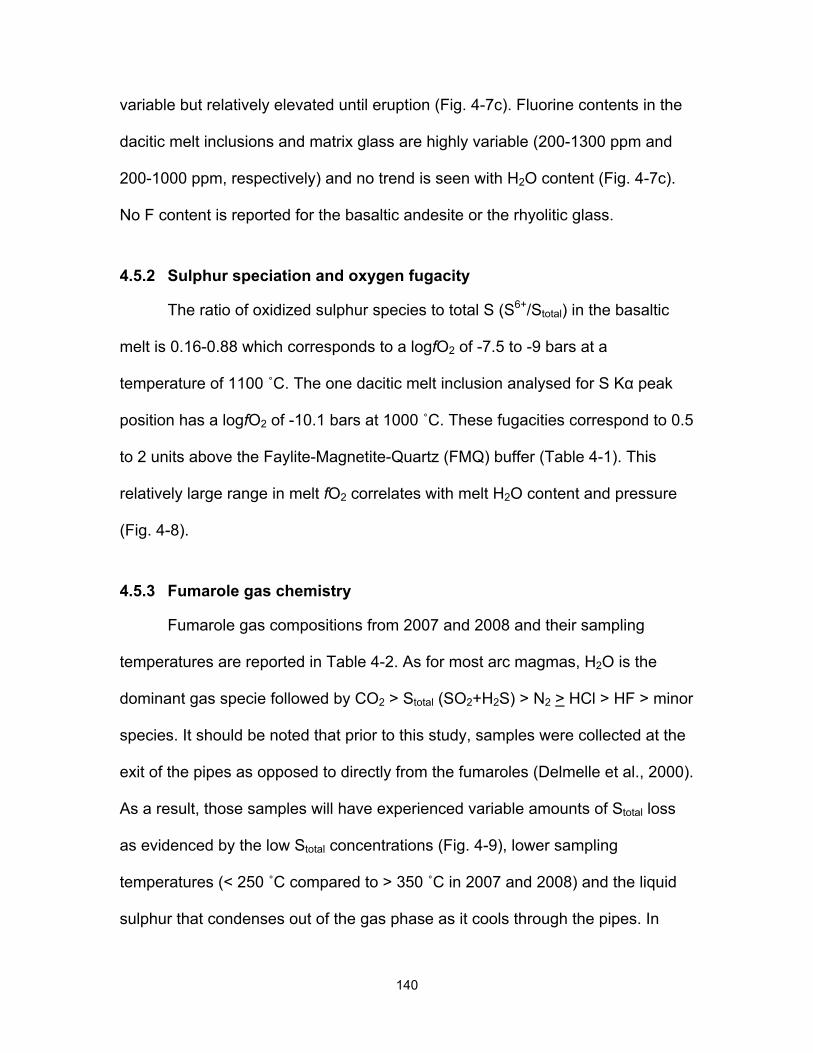
140
variable but relatively elevated until eruption (Fig. 4-7c). Fluorine contents in the
dacitic melt inclusions and matrix glass are highly variable (200-1300 ppm and
200-1000 ppm, respectively) and no trend is seen with H2O content (Fig. 4-7c).
No F content is reported for the basaltic andesite or the rhyolitic glass.
4.5.2 Sulphur speciation and oxygen fugacity
The ratio of oxidized sulphur species to total S (S6+/Stotal) in the basaltic
melt is 0.16-0.88 which corresponds to a logfO2 of -7.5 to -9 bars at a
temperature of 1100 ˚C. The one dacitic melt inclusion analysed for S Kα peak
position has a logfO2 of -10.1 bars at 1000 ˚C. These fugacities correspond to 0.5
to 2 units above the Faylite-Magnetite-Quartz (FMQ) buffer (Table 4-1). This
relatively large range in melt fO2 correlates with melt H2O content and pressure
(Fig. 4-8).
4.5.3 Fumarole gas chemistry
Fumarole gas compositions from 2007 and 2008 and their sampling
temperatures are reported in Table 4-2. As for most arc magmas, H2O is the
dominant gas specie followed by CO2 > Stotal (SO2+H2S) > N2 > HCl > HF > minor
species. It should be noted that prior to this study, samples were collected at the
exit of the pipes as opposed to directly from the fumaroles (Delmelle et al., 2000).
As a result, those samples will have experienced variable amounts of Stotal loss
as evidenced by the low Stotal concentrations (Fig. 4-9), lower sampling
temperatures (< 250 ˚C compared to > 350 ˚C in 2007 and 2008) and the liquid
sulphur that condenses out of the gas phase as it cools through the pipes. In
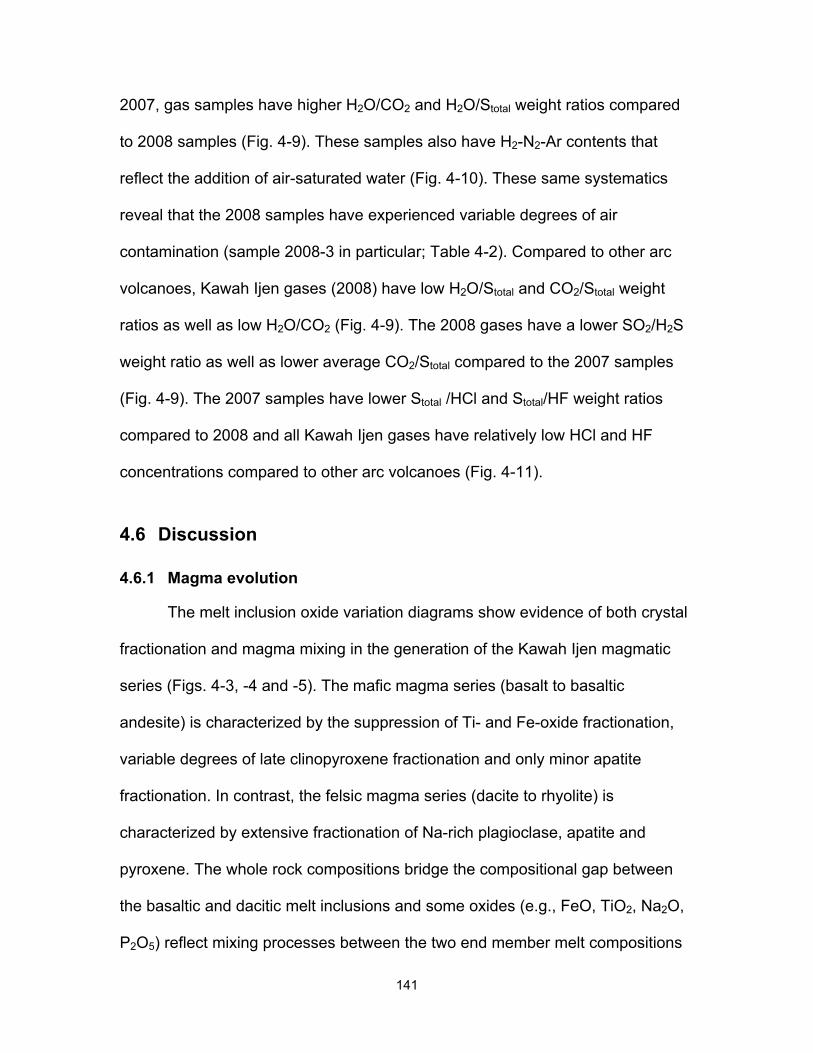
141
2007, gas samples have higher H2O/CO2 and H2O/Stotal weight ratios compared
to 2008 samples (Fig. 4-9). These samples also have H2-N2-Ar contents that
reflect the addition of air-saturated water (Fig. 4-10). These same systematics
reveal that the 2008 samples have experienced variable degrees of air
contamination (sample 2008-3 in particular; Table 4-2). Compared to other arc
volcanoes, Kawah Ijen gases (2008) have low H2O/Stotal and CO2/Stotal weight
ratios as well as low H2O/CO2 (Fig. 4-9). The 2008 gases have a lower SO2/H2S
weight ratio as well as lower average CO2/Stotal compared to the 2007 samples
(Fig. 4-9). The 2007 samples have lower Stotal /HCl and Stotal/HF weight ratios
compared to 2008 and all Kawah Ijen gases have relatively low HCl and HF
concentrations compared to other arc volcanoes (Fig. 4-11).
4.6 Discussion
4.6.1 Magma evolution
The melt inclusion oxide variation diagrams show evidence of both crystal
fractionation and magma mixing in the generation of the Kawah Ijen magmatic
series (Figs. 4-3, -4 and -5). The mafic magma series (basalt to basaltic
andesite) is characterized by the suppression of Ti- and Fe-oxide fractionation,
variable degrees of late clinopyroxene fractionation and only minor apatite
fractionation. In contrast, the felsic magma series (dacite to rhyolite) is
characterized by extensive fractionation of Na-rich plagioclase, apatite and
pyroxene. The whole rock compositions bridge the compositional gap between
the basaltic and dacitic melt inclusions and some oxides (e.g., FeO, TiO2, Na2O,
P2O5) reflect mixing processes between the two end member melt compositions

142
(Figs. 4-4 and 4-5). In contrast, K2O, which remains incompatible throughout the
differentiation sequence, does not reflect this mixing process as well. Handley et
al. (2007) noted similar trends within the whole rock data from Kawah Ijen and
other volcanoes within the Ijen Caldera Complex. Low-Ca and Al magmas,
having experienced significant plagioclase fractionation, appear to originate from
the shallower, central parts of the caldera, and also feed the intra-caldera
lineament volcanoes (Fig. 4-1b). High-Ca and Al magmas characterize the
caldera rim volcanoes and represent deeper level fractionation of mostly olivine
and clinopyroxene. Handley et al. (2007) noted that Kawah Ijen lavas
represented mixing of these two end-member magma series, a conclusion that is
supported by our melt inclusion data. These plagioclase-dominated intra-caldera
magmas are also more enriched in P2O5 and K2O, on average, compared to the
caldera rim magmas (Handley et al., 2007). This would explain the saturation of
apatite in the more evolved samples at Kawah Ijen and the presence of
phlogopite in some of the lavas from the intra-caldera vents (Berlo, 2001).
4.6.2 Volatile evolution
4.6.2.1 H2O and CO2 systematics
H2O and CO2 solubility, which is strongly pressure dependent (e.g., Dixon
et al., 1995), results in fluid saturation early on during magma ascent from the
mantle to the upper crust, especially in hydrous mafic magma (e.g., Métrich and
Wallace, 2008). At Kawah Ijen, the range of H2O and CO2 contents in the basaltic
magma reflects in part variable degrees of degassing as the magma ascends
from > 14 km depth to the surface (Fig. 4-6a). However, the variation in H2O and

143
CO2 contents cannot be explained by a single degassing model regardless of the
degassing mechanism invoked (open vs. closed system). In particular, the
variable CO2/H2O ratios at a given pressure and the retention of high CO2
concentrations even at low H2O contents, suggests melt/fluid equilibrium under
variable fluid compositions. The concept of gas fluxing of magma by a vapour
phase and partial to complete re-equilibration of the melt with this vapour has
previously been proposed for volatile-saturated magmas in an “open system”
where gas is allowed to flux through a magma from deeper depths (e.g., Rust et
al., 2004). This process has been invoked to explain the H2O-CO2 patterns
observed in other melt inclusions from hydrous arc magmas (e.g., Johnson et al.,
2008; Vigouroux et al., 2008; Wallace and Métrich, 2008; Roberge et al., 2009;
Blundy et al., 2010). For the Kawah Ijen basaltic magma, H2O and CO2 contents
can be explained by open system gas fluxing of the melt with vapours ranging in
composition from XH2O = 0.95 to 0.25 (mole fraction H2O). This process may be
combined with open or closed system degassing of the magma body itself
resulting in H2O-CO2 contents intermediate between the vapour isopleths and the
open/closed system degassing curves (Fig. 4-6a). Similar vapour compositions
have been invoked to explain the H2O-CO2 contents of melt inclusions from arc
volcanoes (XH2O = 0.25-0.6; Spilliaert et al., 2006; Johnson et al., 2008;
Vigouroux et al., 2008; Roberge et al., 2009; Johnson et al., 2010).
The dacitic melt inclusions and matrix glass have highly variable H2O
contents but a more restricted range of CO2 contents which, as with the basalt,
cannot be related via a single degassing model (Fig. 4-6b). The H2O-CO2

144
contents of the dacitic melt inclusions can also be best explained by a
combination of gas fluxing with a vapour phase of XH2O = 0.9-0.95 and
open/closed system degassing.
4.6.2.2 S systematics
Melt volatile content will evolve during ascent and cooling of magma as a
result of degassing and differentiation. Using K2O as an index of differentiation
and the partial pressures of H2O and CO2 as an index of pressure/depth, the
relative effects of decompression and cooling on melt S, Cl and F content can be
evaluated (Fig. 4-12). Sulphur contents in the basaltic magma remain nearly
constant at 2000-2200 ppm and a S/K2O ratio of 0.35 as the magma ascends
from 14 to 8 km depth (Fig. 4-12b). Below 200 MPa (< 8 km) the melt is variably
depleted in S with the matrix glass exhibiting the greatest amount of S loss. In
the dacitic and rhyolitic samples, S contents are variable in the melt inclusions
but overlap with concentrations in the matrix glasses. Similarly S/K2O ratios
remain nearly constant (0.002-0.004) as the felsic magma ascends to the
surface. As the melt evolves from basalt to rhyolite, the solubility of S decreases
(Fig. 4-12b), independently of pressure and most likely associated with a drop in
magma temperature, fractionation of Fe2+-bearing phases (Fe-oxides) from the
melt phase and a drop in oxygen fugacity (Fig. 4-8).
Saturation of the melt with respect to S implies that S partitions either into
the fluid phase or into a sulphate- or sulphide-saturated phase (anhydrite and
pyrrhotite crystalline phases or sulphide and sulphate immiscible melts).
Sulphate saturation of a basaltic melt requires elevated oxygen fugacities (>

145
ΔFMQ +2.32) and very high S contents (> 1 wt%; Jugo et al., 2005b; Jugo, 2009)
which are not found at Kawah Ijen (maximum fO2 is ΔFMQ +2; S contents are <
2200 ppm; Table 4-1, Fig. 4-8). At oxygen fugacities < ΔFMQ +2.32, basaltic
melt may saturate with a sulphide-phase if its S content reaches the solubility
limit. This limit has been shown to vary with melt composition, H2O content,
pressure and temperature (Liu et al., 2007). Figure 8a shows the results of
calculated S solubility limits at sulphide saturation (SCSS) using the equation of
Liu et al. (2007) for an average Kawah Ijen basalt composition at variable
pressures (and consequently H2O contents). As the magma ascends from 400
MPa to 10 MPa and H2O degasses from 7 wt% to < 1 wt% (calculated from the
model of Papale et al., 2006 assuming a constant vapour composition of XH2O =
0.75), the SCSS increases from 300 ppm to 1500 ppm at fO2 conditions < ΔFMQ
= 0 and from 3300 to 8700 ppm at the ‘critical fO2’ of ΔFMQ = +2.32, which
corresponds to the maximum S solubility of the system when both sulphide- and
sulphate-saturation coexists (Jugo, 2009) . At intermediate fO2 conditions (ΔFMQ
= 0-2) which correspond to those determined for the Kawah Ijen basalt, the
SCSS limit increases exponentially and is therefore very sensitive to oxygen
fugacity variations. At Kawah Ijen, oxygen fugacity co-varies with the H2O
content/pressure of the basaltic melt (Fig. 4-8b). As H2O degasses, the
speciation of S in the melt shifts to lower S6+/S2- ratios reflecting a decrease in
oxygen fugacity. If the melt phase were initially sulphide-undersaturated, a
decrease in fO2 would result in sulphide-saturation. However, decreasing H2O
content in the melt phase shifts the SCSS limit to higher values thereby creating

146
an interplay between the shifting SCSS limit and the fO2. S contents in Kawah
Ijen basaltic melt remain elevated over a range of fO2 conditions (ΔFMQ = 1.5-2).
However, determining whether or not the Kawah Ijen basalt is sulphide-saturated
as it ascends from 400 MPa to 200 MPa is currently limited by the uncertainties
in both the SCSS determination (Liu et al., 2007) and the uncertainty associated
with the fO2 determination from the S Kα peak shift. At pressures lower than 200
MPa, S contents are decreasing and significantly lower than the associated
SCSS implying that the melt is sulphide-undersaturated and that degassing of S
into the fluid phase is the dominant process. The dacitic melt inclusion falls along
the trend of pressure versus fO2 defined by the basalt (Fig. 4-8b). At an oxygen
fugacity of ΔFMQ = + 0.9, the dacite has a S content (300 ppm) lower than its
SCSS implying that it is sulphide undersaturated.
4.6.2.3 Cl and F systematics and apatite fractionation
Chlorine and fluorine contents are variable in the basaltic samples and F
is also highly variable in the dacitic melt inclusions and matrix glasses (Fig. 4-
12c,d). In the basaltic samples, Cl/K2O ratios are highly variable but do not
appear to decrease as pressure decreases suggesting that although Cl contents
in the melt are variable, they remain dissolved to shallow depths. In the dacitic
samples, Cl/K2O ratios are less variable and remain constant until pressures < 50
MPa at which point Cl exsolves from the melt phase. As the melt evolves from
basalt to rhyolite, the solubility of Cl in the melt phase decreases, independent of
pressure but likely associated with a drop in magma temperature (1150-1000 ˚C)
and change in melt and fluid phase composition (XH2O = 0.25-0.95 to XH2O =

147
0.9-0.95). Similarly to Cl, the F/K2O ratios are highly variable in the basaltic and
dacitic melt inclusions and matrix glass samples (Fig. 4-12d). Unlike Cl however,
F/K2O ratios appear to decrease slightly at pressures < 50 MPa in the basaltic
samples and conversely do not decrease in the low pressure dacitic samples. As
the melt evolves from basalt to dacite, the solubility of F in the melt phase
decreases, again independently of pressure.
The presence of apatite as mineral inclusions and in the matrix of the
more evolved samples, combined with the co-variation of melt P2O5, Cl and F
contents (Fig. 4-13) suggests that apatite controls the Cl and F content of the
melt phase. The P2O5/Cl ratio of the basaltic samples are compatible with
fractionation of apatite containing 2000 ppm to 1.5 wt% Cl; common
concentrations of Cl in apatite from subduction-zone basalts (e.g., Luhr and
Carmichael, 1981; Boyce and Hervig, 2009; Fig. 4-13b). Conversely, the P2O5/F
ratio of the basaltic samples is lower than would be expected from the
crystallization of either Cl-apatite or F-apatite due to overprinting by F degassing
(decreasing K2O/F ratio at nearly constant K2O/ P2O5; Fig. 13c). In the more
evolved samples, the fractionation of Cl-apatite is replaced by F-apatite and
K2O/Cl ratios become nearly constant as neither Cl degasses or is taken up by
apatite. Only the dacitic matrix glass shows evidence of degassing. The K2O/F
ratio of the evolved melt is more variable and indicates a combination of uptake
by F-apatite and degassing of F (Fig. 4-13c).
148
4.6.3 Degassing modeling
Following the method described in Johnson et al. (2010), we model the
evolution of the gas phase as magma ascends, cools and evolves chemically by
combining information on the variation of S, Cl and F contents with H2O and K2O
contents (Figs. 4-7 and 4-12) with equations of mass balance. After establishing
the initial (undegassed) magmatic compositions, the volatile element partition
coefficients between the melt and vapour fraction (Dvap-melt) are calculated for
each melt inclusion (see Appendix C for details of the modeling procedure). Mass
balance constraints are used to model: 1) open system degassing where the gas
is continuously removed from the magma as it is produced. For this scenario we
use the equation for Rayleigh fractionation; 2) closed system degassing where
the gas remains in equilibrium with the melt phase during its production. In this
scenario we employ equations for batch processes; and 3) open system vapour
fluxing where the melt is re-equilibrated with a fluid phase introduced into the
system from depth.
When modeling the melt inclusion and matrix glass data, not all degassing
scenarios are realistic or appropriate. For the basaltic and dacitic melt inclusions,
which have trapped variably degassed melt at various levels within the magmatic
plumbing system, H2O and CO2 contents suggest the degassing style is
dominantly vapour fluxing and that simple open or closed system degassing
cannot account for the elevated melt CO2 contents. As such, we evaluate the
Dvap-melt values for the vapour fluxing scenario with 1 wt% and 5 wt% initial
vapour present (range of values proposed at other arc volcanoes; Johnson et al.,

149
2010). Given that a combination of vapour fluxing and open or closed system
degassing may have occurred (Rust et al., 2004), we also modeled the melt
inclusions for open and closed system degassing only and found that resulting
Dvap-melt values are within error of the uncertainties associated with calculating the
Dvap-melt values in any given model (Johnson et al., 2010; Appendix C). The
basaltic and dacitic matrix glasses are evaluated assuming open system
degassing (most likely scenario given rapid vesiculation upon eruption). Finally,
the intermediate case of a basaltic magma evolving to a dacitic magma is the
least constrained, given the limited H2O and CO2 contents for this compositional
range. Given that vapour fluxing is the dominant degassing style for the basaltic
and dacitic melt inclusions, we assume that the same process also dominates
during the evolution of basalt to dacite. In fact, one clinopyroxene-hosted melt
inclusion does show evidence of vapour fluxing, with elevated CO2 contents at
relatively low H2O contents (0.16 wt% CO2 at 4.6 wt% H2O; Fig. 4-6a).
H2O can be used as a tracer of degassing and K2O as an index of magma
differentiation (e.g., Blundy and Cashman, 2005; Johnson et al., 2010). The two
are inter-related as the degassing of H2O-saturated magmas promotes melt
crystallization and melt crystallization of anhydrous minerals promotes H2O
saturation. As a result, a rough correlation between H2O contents and degree of
crystallization is often observed at arc volcanoes (e.g., Blundy and Cashman,
2005). At Kawah Ijen, the correlation between H2O and K2O content in the
basalts is markedly scattered around 200 MPa (Fig. 4-12a), corresponding to the
depth range where melt inclusion formation, CO2 –rich vapour fluxing and

150
variability in melt composition and Cl and F content is the most pronounced
(Figs. 4-6a and 4-12c,d). Olivine crystallization under H2O-undersaturated
conditions may occur if the melt is fluxed with a CO2-rich vapour such as at
Kawah Ijen (e.g., Johnson et al., 2008). Re-equilibration of the melt with the CO2-
rich vapour will draw H2O out of the melt phase causing the melt to crystallize
even though the melt remains H2O undersaturated. Consequently, the
relationship between crystallization and melt H2O content is likely to be more
complex under gas fluxing conditions.
Establishing the initial H2O-K2O content of the basaltic magma giving rise
to each melt inclusion is non-trivial, therefore, we simplify the problem by
assuming that the variations in the H2O/K2O ratio of the melt inclusions (Fig. 4-
12a) are inherited during degassing, crystallization and interaction with CO2-rich
fluids, and are not inherent to the parental mantle melt. As such, we define the
initial K2O content of the system from the basaltic melt inclusion with the lowest
K2O concentration (OT-1-2; 0.52 wt% K2O on an anhydrous basis; see Chapter 3
and Fig. 4-3). Increasing the parental magma K2O content up to 0.60 wt% on an
anhydrous basis (corresponding to sample TO-XXIV; see Chapter 3 and Fig. 4-3)
does not change the conclusions of this study, it simply decreases the amount of
crystallization estimated for each melt inclusion, thereby decreasing the
calculated Dvap-melt values by up to 10 units (therefore making some Dvap-melt
values negative and inducing large errors in samples with melt fractions
approaching a value of 1; Johnson et al., 2010). Melt inclusion OT-1-2 has H2O
and CO2 contents typical of melts that have partially degassed but are unaffected
151
by CO2-rich vapour fluxing (Fig. 4-6a; H2O = 5.1 wt%, CO2 = 286 ppm). Its low
CO2 content places it along the closed system degassing path for a melt starting
with 7.1 wt% H2O and 2000 ppm CO2, values corresponding to the high pressure
(390 MPa), melt inclusion (TO-XIV; Fig. 4-6a) with the highest H2O content.
As such we define the initial H2O content of the system to be 7.1 wt%.
Subsequent loss of H2O from the melt phase is, therefore, a combination of H2O
saturation of the melt phase and H2O degassing due to CO2-fluxing. Within the
dacitic system, the initial H2O and K2O contents are taken as the highest and
lowest value recorded by the melt inclusions, respectively (6.7 wt% H2O, 3.4 wt%
K2O). We also model the evolution of basalt to dacite using the same starting
conditions as in the basalt-only system but final melt compositions as determined
by the dacitic melt inclusions. As discussed earlier, K2O behaves incompatibly in
the crystallizing assemblage from basalt to rhyolite. As a result, variations in K2O
alone cannot differentiate between evolution of the magma via crystal
fractionation or via magma mixing. However, the effect both these processes
have on the resulting melt volatile content is the same; S, Cl and F will degas or
be removed via the crystallization of apatite or the precipitation of a sulphide
phase in response to changes in external parameters such as melt composition
and temperature and not specifically to the mechanism that brings about these
changes.
Initial (undegassed) S contents are estimated from the highest S/K2O
ratios of the basaltic and dacitic melt inclusions (sample TO-XXII at 0.38 and
sample rhyo2y at 0.008, respectively; Table 4-1, Fig. 4-12b) combined with the

152
least evolved K2O contents of 0.49 and 3.4 wt%, respectively. This yields an intial
S content of ~1860 ppm for the basaltic magma and ~270 ppm for the dacitic
magma. Chlorine Dvap-melt values are not modeled for the basaltic system due to
evidence of Cl-apatite fractionation (Fig. 4-13). However, for the modeling of
basaltic to dacitic magma, we assume that Cl-apatite fractionation does not
persist across the compositional gap and establish the initial basaltic Cl content
to be ~1180 ppm (using a maximum Cl/K2O ratio of 0.24; Fig. 4-12c). For the
dacitic melt inclusions, given that Cl does not appear to partition into apatite (Fig.
4-13), we establish initial Cl contents from the highest Cl/K2O ratio (0.05; Fig. 4-
12c) with an initial K2O content of 3.4 wt% to yield a value of 1700 ppm. Fluorine
Dvap-melt values are obscured by the fractionation of apatite in the dacitic samples
(Fig. 4-13). In the basaltic samples, a combination of degassing and apatite
fractionation is likely occurring. Modeling of the F Dvap-melt values in the basalt is
further complicated by the the highly variable F/K2O contents that do not
correlate with either the index of degassing (H2O or pressure, Fig. 4-12d) or
differentiation (K2O). As such, we exclude F from our modeling.
Results of the modeled Dvap-melt values are presented in Table 4-3.
Average S Dvap-melt values remain low (2-9) as the basaltic magma ascends,
degasses and crystallizes under vapour fluxing conditions (Fig. 4-14). Only at
pressures < 100 MPa is there a sharp increase in the partitioning of S into the
vapour phase (Dvap-melt > 40). These results are consistent with modeled S Dvap-
melt values at other arc basaltic systems (e.g., Jorullo, Mexico, Johnson et al.,
2010; Stromboli, Italy, Scaillet and Pichavant, 2005; Etna, Italy, Spilliaert et al.,

153
2006). The evolution of basalt to dacite is associated with a marked decrease in
magma temperature (Table 4-1) and the fractionation of Fe-Ti oxides (Fig. 4-4),
both contributing to a decrease in the solubility of S (e.g., Scaillet & Pichavant,
2005). Given that there is no evidence of sulphide saturation in the erupted
dacites, the large S Dvap-melt values modeled for the transition from basalt to
dacite (average of 70-225; Fig. 4-14) likely reflects large degrees of S degassing,
independent of changes in pressure. Calculated S Dvap-melt values for ascent and
evolution of dacitic melt are scattered around an average of 20 and show no
clear trend with decreasing pressure (not shown). These Dvap-melt values are
similar to those obtained experimentally on a sulphide-saturated rhyodacite at
200 MPa and 850 ˚C under similar fluid compositions (~20; Botcharnikov et al.,
2004). The saturation of pyrrhotite does not preclude the fractionation of S into
the vapour phase and in fact, there is a positive correlation between mole fraction
of pyrrhotite and S Dvap-melt values, likely related to the concomitant decrease in
melt FeO content and S solubility (Botcharnikov et al., 2004).
As mentioned above, Cl Dvap-melt values cannot be modeled in the same
fashion for the basaltic system due to evidence of Cl-apatite fractionation.
However, they can be estimated based on the composition of the apatites
themselves. Mathez and Webster (2005) showed that for fluid- and apatite-
saturated basalts at 200 MPa and temperatures between 1066-1150 ˚C (with a
composition similar to Kawah Ijen basalts), Cl Dvap-melt values vary with apatite Cl
content but will remain low (~1) for apatite Cl contents typical of subduction zone
basalts (< 2 wt%; Luhr and Carmichael, 1981; Boyce and Hervig, 2008). This

154
suggests that minimal Cl degassing is expected from the apatite-saturated
basalts, which agrees with the K2O-Cl-P2O5 systematics of the basalts (Fig. 4-
13). For the dacitic melt inclusions, we obtain Dvap-melt values of 0-2 at pressures
> 100 MPa and slightly higher values of 4 at low pressures (< 50 MPa)
suggesting shallow degassing of Cl (Fig. 4-15). Cl Dvap-melt values associated with
the evolution of basalt to dacite are slightly higher (4-6) than for the dacite-only
case and do not vary significantly with pressure (Fig. 4-15).
4.6.4 Model magmatic fluid composition and comparison with measured fumarole compositions
We derive a model magmatic fluid composition by combining the S and Cl
Dvap-melt values calculated as a function of pressure and melt composition with
H2O and CO2 fluid compositions derived from the melt inclusion data (see
Appendix C for more details). H2O-CO2 fluid compositions are constrained by the
vapour isopleths that bracket the melt inclusion data (Figs. 4-6 and 4-7). The
composition of these fluids range from mole fraction H2O values of 0.25-0.95 for
the basaltic system and 0.9-0.99 for the dacitic system. For the intermediate case
of a basalt evolving to a dacite, given the limited number of melt inclusion data in
this compositional range, we model the H2O-CO2 fluid for a relatively wide range
of fluid compositions(XH2O = 0.5-0.95). As discussed earlier, open (no vapour
fluxing) and closed system degassing are not likely to dominate at Kawah Ijen (in
the past and currently), therefore, model fluid compositions are not presented for
these scenarios.
155
Results of the modeled magmatic fluid compositions are summarized in
Table 4-3. The fluid compositions either have H2O as the most abundant
component or CO2 depending on the nature of the fluid fluxing the system,
followed by SO2 (total) (all S expressed as SO2) then HCl, in agreement with the
order of abundance commonly found in magmatic gas samples from arc
volcanoes worldwide (e.g., Symonds et al., 1994 for review). In all model
compositions, HCl contents in the fluid are very low (XHCl = 0.001-0.005) and
are highest during the evolution of basalt to dacite. SO2 (total) contents are also
highest in the basalt-dacite scenario (XSO2 (total) = 0.017). Fluid S contents in the
basaltic scenario increase as pressure decreases (XSO2 (total) = 0.003 at P = 400
MPa to XSO2 = 0.007 at P < 10 MPa). They are lowest in the dacite scenario with
XSO2 (total) = 0.002 at all pressures.
In order to determine the model composition that best represents the
current Kawah Ijen system, we compare the H2O and CO2 model fluid
compositions with the analysed fumarole compositions. As mentioned earlier, the
chemistry of the 2007 fumarole samples shows evidence for the incorporation of
external water and as a consequence, its H2O/CO2 weight ratio is much higher
than the modeled fluid compositions (Fig. 4-9). The 2008 fumarole samples are
more representative of the magmatic component currently degassing at Kawah
Ijen, with H2O, CO2 and Stotal ratios that fall within the range reported for high
temperature fumaroles (showing no signs of water contamination) at other arc
volcanoes (Fig. 4-9). As a first order approximation, we assume that the H2O/CO2
ratio of the 2008 gas samples has not been affected by shallow hydrothermal
156
processes. This ratio corresponds to a XH2O of 0.9, which is within the range of
fluxing vapour compositions determined from the dacitic melt inclusion data
(XH2O = 0.9-0.99). The presence of mafic, CO2-rich magma degassing at depth
is required to explain the high CO2 contents measured at the surface of the
rhyolitic dome and recorded in the melt inclusions. This mafic magma may be a
ponded body at > 10 km, degassing in an open conduit (gas is free to escape
through the shallower plumbing system). This minimum depth estimate arises
from the intersection of the most H2O-rich open system degassing curve in the
basaltic system with the vapour isopleth corresponding to a XH2O of 0.9 (Fig. 4-
6a). Alternatively, basaltic magma may be present at a variety of depths and the
combined fluid composition approximates a XH2O of 0.9. In either case, a
plumbing system open to gas (and magma) flux from a variety of levels is
required.
It is not trivial to distinguish between a single degassing mafic magma
body at > 10 km depth and mafic magma present at a variety of depths.
Potential-field surveys (e.g., Bouguer gravity) and geodetic models based on
deformation (e.g., continuous GPS) can offer insight into the presence of a deep
magma chamber beneath Kawah Ijen. Unfortunately, access to the area
surrounding the crater is limited by steep terrain and thick vegetation and the
presence of a large crater lake obscures gravity signals originating from the
deeper parts of the system (Mauri, 2009).
By setting the magmatic fluid composition to a constant XH2O = 0.9,
regardless of pressure, the S and Cl contents can now be constrained. In reality,

157
these S and Cl concentrations do not change if the XH2O content of the gas is
set to 0.95 or 0.50 because the concentration of these two species relative to
H2O and CO2 is low. The main factor affecting S and Cl contents in the gas
phase is not the nature of the fluid phase, the style of degassing (i.e., the H2O
and CO2 proportions) or the depth of degassing, but rather the composition of the
magma that is degassing. The largest difference in S and Cl solubility is seen
between the basaltic and dacitic melt inclusions (Fig. 4-12b,c) and the highest D
values are modeled for a magma evolving from a basalt to a dacite (Figs. 4-13
and 4-14). Consequently, maximum fluid XSO2 (total) values of 0.023 and XHCl
values of 0.006-0.008 correspond to a differentiating magma body (basalt-
dacite).
Comparing the modeled XSO2 (total) and XHCl values with the 2008
fumarole gas samples is the next step in evaluating the modeled fluid
composition. Model SO2 fluid concentrations are significantly lower than those
actually measured for all models except the basalt-dacite scenario (Table 4-3).
Combining this SO2 (total) content with a mole fraction of water of 0.90 generates a
model fluid composition that corresponds closely to the 2008 fumarole gas
samples (Fig. 4-9) with slightly higher proportions of CO2 and SO2 (total) in the
measured gas samples compared to the model. The good agreement between
the model and measured gas composition adds validation to our model and
implies that magma evolution, whether it occurs via crystal fractionation, magma
mixing or crustal assimilation is required to explain the high S contents of the gas
measured at the surface.

158
Figure 4-11 compares the SO2 (total), HCl and HF contents of the measured
gases with the model fluid and the crater lake and acid spring fluids (Delmelle et
al., 2000; Palmer, 2009). No HF values are calculated for the model fluid
composition which thus plots on the SO2 (total)-HCl line. The crater lake and acid
spring waters are highly acidic (pH = -0.01-0.4 crater lake; 0.11-0.5 acid springs)
and have SO42-/Cl ratios of 2.6-3.3, typical of acid sulphate-chloride waters at
other Indonesia volcanoes (e.g., Keli Mutu, Flores, Varekamp and Kreulen, 2000;
Papandayan, Java, Mazot et al., 2008). These acid sulphate-chloride waters are
likely the result of condensation of volcanic gases into groundwaters (e.g., Kiyosu
and Kurahashi, 1983; Rowe et al., 1992; Delmelle and Bernard, 1994). Palmer
(2009) estimated that magmatic/hydrothermal fluids contribute up to 50% of the
acid sulphate-chloride waters discharged at Kawah Ijen. Compared to the
measured 2008 gas composition, this magmatic/hydrothermal component (as
recorded by the springs and crater lake waters) is enriched in Cl and F and
heavily depleted in S (Fig. 4-11). Similarly, when compared to the model
magmatic fluid composition (S/Cl ratio only), the acid spring component is also
enriched in Cl relative to S although to a much lesser extent. The 2007 gases
form a linear series between the Cl- and F-rich acid waters and the S-enriched
2008 vapours (Fig. 4-11). This suggests that mixing of the two fluid compositions
may have occurred in 2007, supported by the H2O and He-Ar-N systematics
which indicate addition of air-saturated waters (Figs. 4-9, -10). This mixing series
suggests that the acid waters and the gas samples are related to each other via
the addition or removal of a Cl- and F-enriched (and S-depleted) component.

159
Given that the fumarole gases represent the uncondensed portion of the
magmatic fluid and that the acid waters likely represent the condensed portion,
this suggests that fractionation of S from Cl and F is occurring in the subsurface
and that S is preferentially retained in the vapour phase while Cl and F are
enriched in the liquid phase. Consequently, a line linking the acid waters and the
2008 gases can be interpreted as both a mixing line (when boiling of acid waters
is mixed with magmatic vapours as in 2007) and an unmixing line (when
condensation of the magmatic fluid results in a Cl- and F-enriched liquid and a S-
enriched vapour). The extension of a line from the S/Cl ratio of the model
magmatic fluid to the F apex will intersect the mixing/unmixing line at a point
which represents the original magmatic fluid S-Cl-F composition (Fig. 4-11).
With the original magmatic fluid composition established in terms of all
major components (H2O, CO2, Stotal, HCl, HF), the 2008 fumarole gas data can
be summarized as follows: 1) H2O-CO2-Stotal systematics suggest that the vapour
phase is slightly enriched in Stotal assuming the H2O/CO2 ratio remains constant
as the magmatic fluid evolves to the surface (therefore setting the magmatic fluid
composition at XH2O = 0.9; Fig. 4-9). This assumption is based on the low
solubility of CO2 in meteoric and hydrothermal waters and the buffering capacity
of these waters for H2O (Symonds et al., 2001). This buffering results in constant
H2O contents in the gas phase (and nearly constant H2O/CO2 with CO2 being
affected only by dilution) for gas/water ratios > 1 and temperatures > 250˚C
(Symonds et al., 2001). 2) Stotal-Cl-F systematics suggest that the vapour phase

160
is relatively enriched in Stotal and a residual liquid phase is enriched in Cl and F
(Fig. 4-11).
Delmelle et al. (2000) measured the S isotopic composition of the crater
lake and acid spring waters, native S globules in lake sediment and pyroclastic
material, as well as fumarole gases. They noted that the enriched δ34S
composition of the acid waters is best explained by the disproportionation of
magmatic SO2 to SO42- during interaction of the magmatic gases with
groundwater. This observation agrees with the higher solubility of SO2 over H2S
in groundwaters across a range of magmatic gas compositions, temperatures,
gas-water and water-rock ratios (Symonds et al., 2001). This would lead to a
relative enrichment in H2S over SO2 in the uncondensed magmatic vapour but
also to a decrease in Stotal concentration. Molar H2S/SO2 ratios in the 2008
fumaroles vary from 1.9-3, values that are higher than many high temperature
fumarole gases from other arc volcanoes (Symonds et al., 1994 compilation).
This lends support to the conclusion of Delmelle et al. (2000) that Kawah Ijen
fumarole gases have experienced SO2 disproportionation in the subsurface
hydrothermal system. However, the Kawah Ijen fumarole gases have Stotal
contents typical of arc volcanoes (unaffected by H2O contamination) and even
slightly higher than the model fluid composition (Fig. 4-9), which is contrary to
what would be expected if significant SO2 was being dissolved in groundwater.
Furthermore, thermodynamic models of magmatic gas-water interaction suggest
that HCl and HF tend to be less soluble in air-saturated water compared to SO2,
especially in low pH waters (Symonds et al., 2001), which would result in

161
relatively S-rich but Cl- and F-poor waters (acid spring waters at Kawah Ijen are
relatively Cl- and F-rich). Finally, at temperatures > 250˚C, gas/water ratios are
likely to be greater than 1 which would limit the loss of SO2 (and HCl and HF) to
the groundwater (Symonds et al., 2001).
An alternate explanation for the high-S vapour phase and the high-Cl and
F acid spring waters is that unmixing of the magmatic fluid upon ascent and
cooling in the shallow plumbing system results in the formation of a Cl- and F-
enriched liquid and a S-enriched vapour. Equilibrium cooling of the gas phase
from 800-900 ˚C to 400 ˚C leads to a 3-fold increase in the H2S/SO2 molar ratio
due to conversion of SO2 to H2S (Symonds et al., 2001) and could explain the
high H2S/SO2 ratio of the fumarole gases. Subsequent flow and dilution of the Cl-
F-rich liquid with meteoric water may lead to the formation of acidic chloride-rich
waters. Diffuse magmatic degassing, away from the dome, may introduce lower
temperature gases into the groundwater mixing at gas/water ratios <1 and
temperatures < 250˚C. These would be ideal conditions for the disproportionation
of SO2 into the acidic waters and perhaps further scrubbing of HCl and HF,
creating highly acidic sulphate-chloride waters equivalent to the acid spring
waters seeping out of the flanks of Kawah Ijen (Delmelle et al., 2000; Palmer,
2009).
4.7 Summary and Conclusions
Kawah Ijen is an actively degassing volcano emitting CO2- and S-rich
vapours as well as Cl- and F-enriched acid waters. Melt inclusion H2O, CO2, S,
Cl and F contents for melts spanning the range basalt to rhyolite indicate that the

162
magmatic system at Kawah Ijen is fluxed by CO2-rich fluids originating from mafic
magma at depth and that open system gas fluxing is the dominant degassing
style. Evolution of mafic magma to dacite and rhyolite is accompanied by a large
drop in the solubility of S and Cl in the melt phase and exsolution of these
volatiles. There is no evidence for sulphide-saturation in the more evolved
magmas at Kawah Ijen (dacite and rhyolite) suggesting that the net transfer of S
from the basaltic magma occurs in the fluid phase. Apatite fractionation over the
entire range of magma compositions affects the Cl and F content of the melt and
fluid phase. Cl-rich apatite fractionation occurs in the basalts whereas F-rich
apatite fractionation dominates in the more evolved magmas. As such, little to no
F is degassed from the magma at Kawah Ijen. However, the remaining Cl in the
melt may exsolve into the fluid phase as the magma composition evolves from
basalt to dacite.
Magmatic fluid compositions are modeled for various initial and final melt
compositions and H2O-CO2 fluids fluxing the system using mass balance
equations. Model outputs are partition coefficients for S and Cl between the melt
and vapour phase at various pressures and for various melt compositions. The
model that generates the highest Dvap-melt values for S and Cl and the most
realistic magmatic fluid composition is a basaltic magma evolving to a
dacitic/rhyolitic magma with the system being fluxed with a fluid of composition
XH2O = 0.9 originating (at least in part) from deeper mafic magma. Comparison
of this model fluid with measured fumarole gas compositions suggests that the
surface vapours are relatively enriched in S compared to the model fluid.

163
Additionally, acid sulphate-chloride waters at Kawah Ijen are relatively depleted
in S and enriched in Cl- and F- compared to the model fluid composition. This
suggests that upon ascent and cooling of the magmatic fluid, unmixing into a S-
rich vapour and Cl- and F-rich acidic liquid occurs. Further cooling of the liquid
phase and mixing with air-saturated groundwater and diffuse magmatic gases
leads to the formation of highly acidic sulphate-chloride waters. High degassing
fluxes recorded at the surface of the dome (2-14 kg s-1 of SO2; see Chapter 5)
suggest rapid fluid rise rates within the shallow plumbing system beneath the
dome, limiting cooling and interaction with groundwater. As a result, the elevated
S contents of the magmatic fluid are mostly conserved until they are degassed at
the surface (and through the crater lake bottom). The presence of high
concentrations of both H2S and SO2 in these gases leads to extensive native S
precipitation at the surface upon cooling with ambient air (Giggenbach, 1987).
The combination of initially elevated magmatic S contents (> 2000 ppm),
highly efficient exsolution of S during the evolution of basaltic to dacitic/rhyolitic
magma and the limited scrubbing of fluid phase S by the hydrothermal system
beneath the dome contribute to making Kawah Ijen one of the most productive
active volcanic sulphur mines in the world. The high CO2 content of the fumarole
gases suggests that mafic material is present beneath the rhyolitic dome and
actively degassing. The open system degassing style at Kawah Ijen currently
precludes the build-up of fluid overpressures within the conduits. Studies such as
this one, which offer insight into magmatic fluid-groundwater-rock interactions,
are crucial for understanding the formation of hydrothermal fluids, their evolution,

164
and their effects on important physical parameters such as conduit permeability
and rock strength.
4.8 Acknowledgments
The authors would like to thank the Kawah Ijen Park service and
particularly Tom Mulja and Niken Widyastuti of East Asia Minerals for their help.
The Kawah Ijen research team, namely Guillaume Mauri, Stephanie Palmer,
Samantha Scher, as well numerous other volunteers, offered valuable help in the
field. Local miners Pa Im and Jumanto were invaluable for their assistance in the
field, especially with dome fumarole sampling. We acknowledge Tobias Fischer
(University of New Mexico) for analysis of the fumarole gas samples, as well as
John Donovan (University of Oregon) and Lang Shi (McGill University) for
assistance with the microprobe analyses. Funding for this work was provided by
an NSERC-CRD grant to A.E. Williams-Jones and G. Williams-Jones.
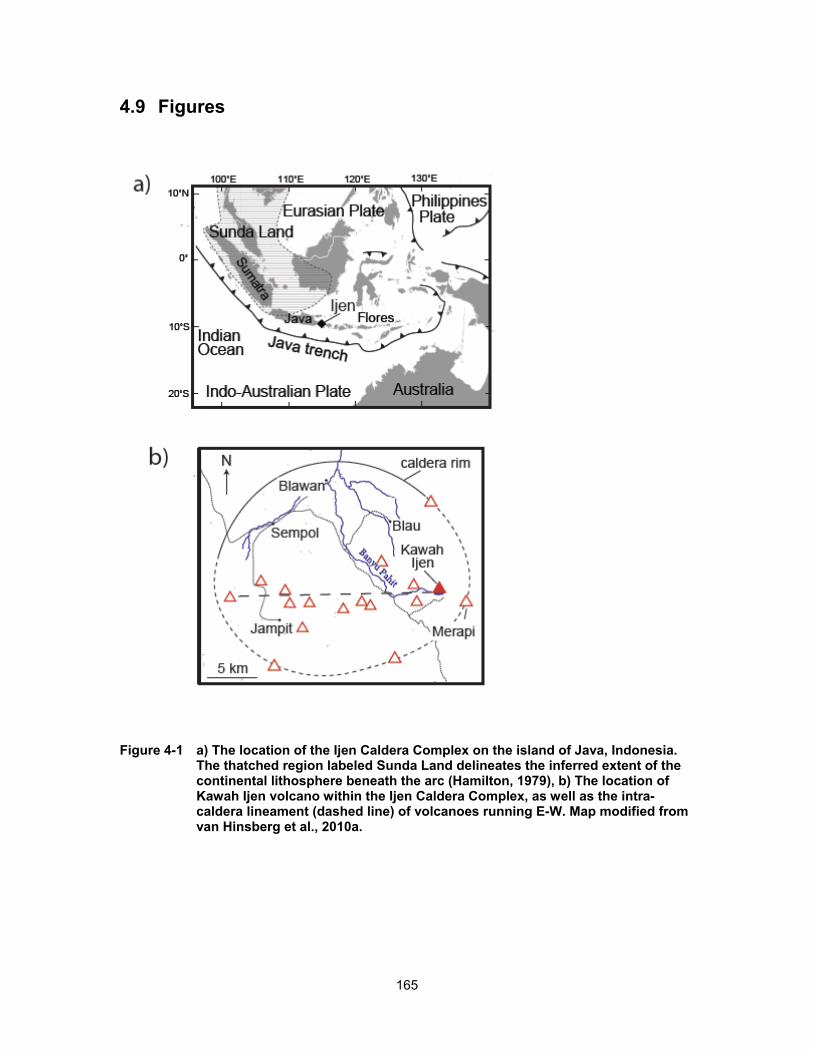
165
4.9 Figures
Figure 4-1 a) The location of the Ijen Caldera Complex on the island of Java, Indonesia. The thatched region labeled Sunda Land delineates the inferred extent of the continental lithosphere beneath the arc (Hamilton, 1979), b) The location of Kawah Ijen volcano within the Ijen Caldera Complex, as well as the intra-caldera lineament (dashed line) of volcanoes running E-W. Map modified from van Hinsberg et al., 2010a.

166
Figure 4-2 Compositional (forsterite mole fraction; Fo = 100*(moles Mg)/(moles Mg)+(moles Fe)) profiles (length and width) through an olivine phenocryst showing a overall normal zoning pattern with a small reverse zoning pattern outwards of the core.

167
Figure 4-3 K2O variation diagrams versus: a) SiO2 and b) MgO (all in weight % normalized on an anhydrous basis). Dome rhyolite glass corresponds to sample KV08-702 (Table 4-1) and represents interstitial melt within the dome rock. The basaltic melt inclusions are olivine-hosted from tephra layers TO and OT (Chapter 3; Table 4-1). The basaltic-andesite corresponds to sample mountpx1 (Table 4-1) from layer TO and is clinopyroxene-hosted. Basaltic matrix glasses are from tephra layer TO (Chapter 3). Dacitic melt inclusions are orthopyroxene-hosted and the corresponding matrix glasses are from pumice bombs (Table 4-1). Samples OT-1-2 and TO-XXIV are labeled with reference to the discussion on degassing modeling (see text). Whole rock data is from van Hinsberg et al. (2010b).

168
Figure 4-4 MgO variation diagrams versus: a) CaO/Al2O3 ratio, b) FeOtotal (all iron is reported as FeO) and c) TiO2 (all in weight % normalized on an anhydrous basis). Data sources as in Figure 4-3.

169
Figure 4-5 Variation in P2O5 content versus a) SiO2 and b) MgO (all in weight % normalized on an anhydrous basis). Data sources as in Figure 4-3.

170
Figure 4-6 H2O (weight %) versus CO2 (ppm) content of: a) the mafic melt inclusions (basaltic and basaltic-andesite) and b) the dacitic melt inclusions and matrix glasses. Error bars are standard deviation for a given melt inclusion. Solid curves are isobars from Papale et al. (2006). Dashed curves in a) are calculated degassing paths (a = open system, b = closed and c = closed with 1 wt% exsolved vapour and d = closed with 5 wt% exsolved vapour) for an average Kawah Ijen basaltic melt at 1100 ˚C with two different starting volatile contents: a high H2O, low CO2 melt with 7.1 wt% H2O and 2000 ppm CO2, and a low H2O, high CO2 melt with 3.45 wt% H2O and 4000 ppm CO2. These starting compositions were chosen from the highest and lowest H2O contents found in the high pressure mafic melt inclusions (P > 300 MPa) with CO2 contents slightly in excess of those measured, based on the assumption that there has been > 50 % CO2 degassed by 300 MPa (Wallace, 2005; Blundy et al., 2010). Dashed curves in b) are calculated degassing paths for an average Kawah Ijen dacitic melt at 1000 ˚C with the same starting volatile content as the high H2O mafic melt inclusions. Closely dashed curves are isopleths of constant vapour composition (XH2O) calculated for a) an average Kawah Ijen basalt at 1100 ˚C and b) an average Kawah Ijen dacite at 1000 ˚C. Both degassing paths and isopleths are calculated using VolatileCalc (Newman & Lowenstern, 2002). Data sources as in Figure 4-3.
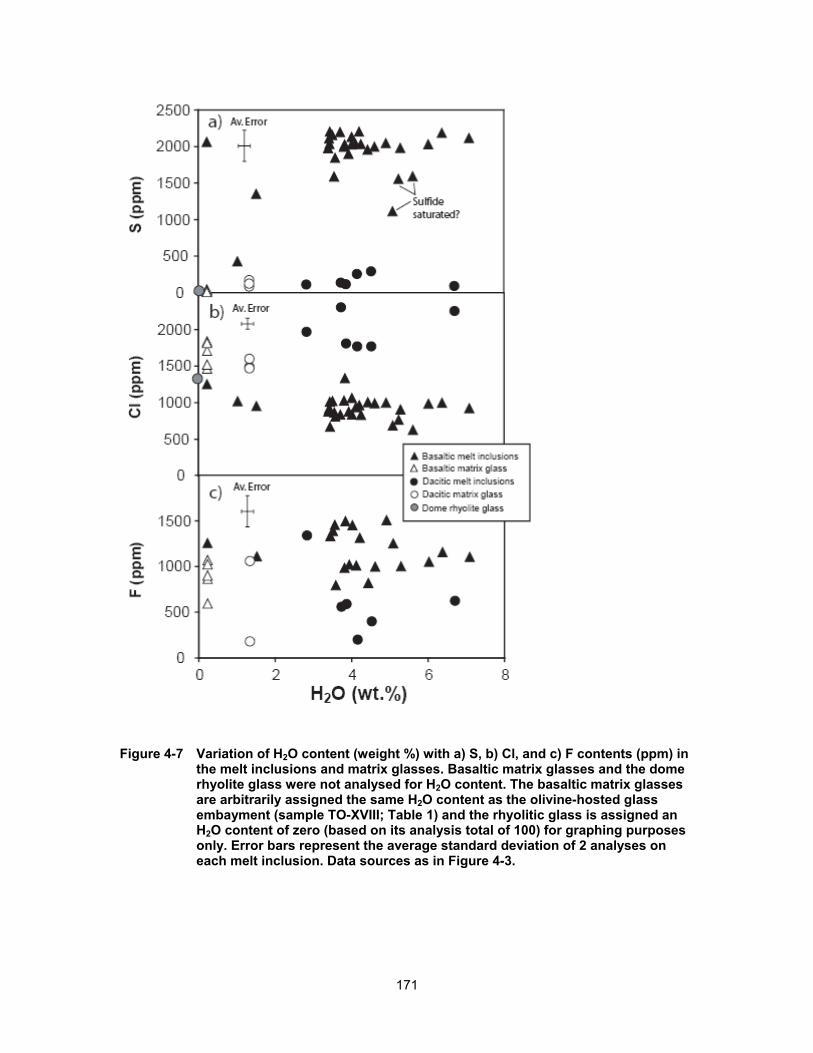
171
Figure 4-7 Variation of H2O content (weight %) with a) S, b) Cl, and c) F contents (ppm) in the melt inclusions and matrix glasses. Basaltic matrix glasses and the dome rhyolite glass were not analysed for H2O content. The basaltic matrix glasses are arbitrarily assigned the same H2O content as the olivine-hosted glass embayment (sample TO-XVIII; Table 1) and the rhyolitic glass is assigned an H2O content of zero (based on its analysis total of 100) for graphing purposes only. Error bars represent the average standard deviation of 2 analyses on each melt inclusion. Data sources as in Figure 4-3.
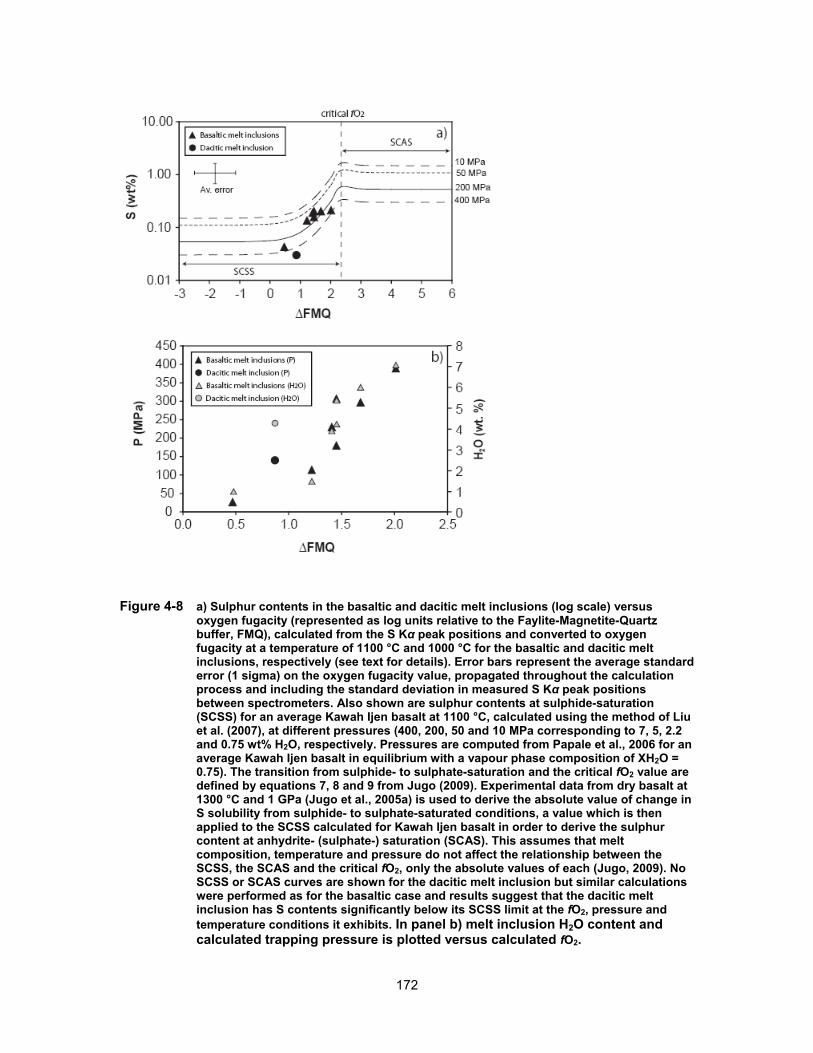
172
Figure 4-8 a) Sulphur contents in the basaltic and dacitic melt inclusions (log scale) versus oxygen fugacity (represented as log units relative to the Faylite-Magnetite-Quartz buffer, FMQ), calculated from the S Kα peak positions and converted to oxygen fugacity at a temperature of 1100 °C and 1000 °C for the basaltic and dacitic melt inclusions, respectively (see text for details). Error bars represent the average standard error (1 sigma) on the oxygen fugacity value, propagated throughout the calculation process and including the standard deviation in measured S Kα peak positions between spectrometers. Also shown are sulphur contents at sulphide-saturation (SCSS) for an average Kawah Ijen basalt at 1100 °C, calculated using the method of Liu et al. (2007), at different pressures (400, 200, 50 and 10 MPa corresponding to 7, 5, 2.2 and 0.75 wt% H2O, respectively. Pressures are computed from Papale et al., 2006 for an average Kawah Ijen basalt in equilibrium with a vapour phase composition of XH2O = 0.75). The transition from sulphide- to sulphate-saturation and the critical fO2 value are defined by equations 7, 8 and 9 from Jugo (2009). Experimental data from dry basalt at 1300 °C and 1 GPa (Jugo et al., 2005a) is used to derive the absolute value of change in S solubility from sulphide- to sulphate-saturated conditions, a value which is then applied to the SCSS calculated for Kawah Ijen basalt in order to derive the sulphur content at anhydrite- (sulphate-) saturation (SCAS). This assumes that melt composition, temperature and pressure do not affect the relationship between the SCSS, the SCAS and the critical fO2, only the absolute values of each (Jugo, 2009). No SCSS or SCAS curves are shown for the dacitic melt inclusion but similar calculations were performed as for the basaltic case and results suggest that the dacitic melt inclusion has S contents significantly below its SCSS limit at the fO2, pressure and temperature conditions it exhibits. In panel b) melt inclusion H2O content and calculated trapping pressure is plotted versus calculated fO2.

173
Figure 4-9 H2O-CO2-Stotal ternary diagram (on a weight basis) comparing the Kawah Ijen fumarole gases (compilation from Delmelle et al., 2000 plus data from this study: Table 4-2) with high temperature (> 350 °C) fumarole gases from other arc volcanoes: Unzen volcano (Ohba et al., 2008) Usu volcano (compiled in Symonds et al., 1994) and Showa-Shinzan dome on the flank of Usu (Symonds et al., 1996) in Japan; Colima volcano (Taran et al., 2002) in Mexico; Poás (compiled in Symonds et al., 1994), Mombacho (Garofalo et al., 2007) and Momotombo (Menyailov et al., 1986) volcanoes in Central America; Kudryavy (Fischer et al., 1998) and Klyuchevskoy (Taran et al., 1991) volcanoes in Kamchatka; Augustine volcano (compiled in Symonds et al., 1994) in the Aleutians and Papandayan volcano (compiled in Mazot et al., 2008) in Indonesia. The dashed line, at a CO2/H2O weight ratio of 0.02, represents a lower limit of realistic magmatic vapour compositions at arc volcanoes (equivalent to a vapour XH2O of 0.99). Vapour compositions that lie above this line are at risk of containing a meteoric water component (e.g., 2007 gas samples from Kawah Ijen and Usu and Showa-Shinzan, Symonds et al., 1996; see also Figure 4-10). Also shown is the best-fit model magmatic fluid composition derived from the melt inclusion data (see text for details; Table 4-3).

174
Figure 4-10 He-N2-Ar ternary diagram (on a molar basis) comparing the Kawah Ijen fumarole gases with air and air-saturated water (e.g., Giggenbach, 1987). “Arc-type” gases are enriched in N2 and “Mantle-type” gases are enriched in He (Giggenbach and Matsuo, 1991). Data sources are the same as in Figure 4-9.
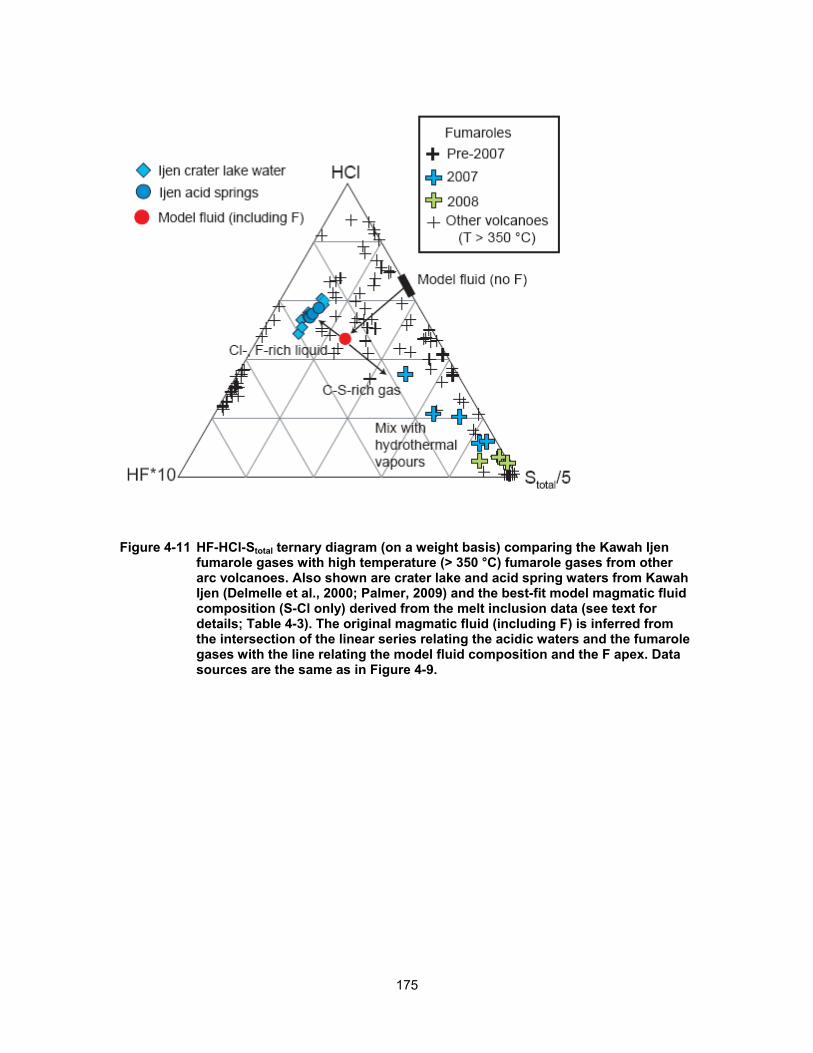
175
Figure 4-11 HF-HCl-Stotal ternary diagram (on a weight basis) comparing the Kawah Ijen fumarole gases with high temperature (> 350 °C) fumarole gases from other arc volcanoes. Also shown are crater lake and acid spring waters from Kawah Ijen (Delmelle et al., 2000; Palmer, 2009) and the best-fit model magmatic fluid composition (S-Cl only) derived from the melt inclusion data (see text for details; Table 4-3). The original magmatic fluid (including F) is inferred from the intersection of the linear series relating the acidic waters and the fumarole gases with the line relating the model fluid composition and the F apex. Data sources are the same as in Figure 4-9.

176
Figure 4-12 Variation in the ratio of a) H2O, b) S, c) Cl and d) F over K2O contents as a function of melt inclusion trapping pressure and depth. Basaltic matrix glass and dome rhyolite glass samples have not been analysed for H2O and CO2, therefore, an arbitrary pressure of 0.1 MPa has been assigned to them for graphing purposes only. Insets in b) and d) show a zoom-in of the dacitic and rhyolitic samples. Data sources are the same as in Figure 4-3.

177
Figure 4-13 Variation of the K2O/P2O5 ratio with a) K2O content (wt%), b) K2O/Cl ratio and c) K2O/F ratio. Data sources are the same as in Figure 4-3 with the addition of melt inclusions from Irazú volcano, Costa Rica (Benjamin et al., 2007; Sadofsky et al., 2008) shown for comparison. Irazú has erupted lavas and pyroclastic material containing apatite phenocrysts. Combined with apatite compositions from mafic magmas near Colima volcano, Mexico (0.18 wt% Cl, 2.86-3.02 wt% F; Luhr and Carmichael, 1981), the Irazú apatite compositions (0.54-1.5 wt% Cl, 2.5-4 wt% F; Boyce and Hervig, 2009) define the P2O5/Cl and P2O5/F ratios of a liquid fractionating apatite.

178
Figure 4-14 Pressure (and depth) versus modeled Dvap-melt values for S within the Kawah Ijen basaltic magma and for the evolution of basaltic to dacitic compositions (see text for details of the modeling procedure; Table 4-3). Model values are for vapour fluxing conditions (average between 1 and 5 wt% vapour) and open system degassing for the melt inclusions and basaltic matrix glasses, respectively. Melt inclusion error bars represent the standard deviation between the model results for 1 and 5 wt% vapour fluxing. Shown for comparison are S Dvap-melt values for the basaltic melt inclusions of Jorullo volcano, Mexico, under closed system degassing constraints (Johnson et al., 2010) and Stromboli volcano, Italy, under open system degassing constraints (Scaillet and Pichavant, 2005). The dashed curve represents the best-fit through Dvap-melt values obtained for Etna volcano, Italy (Spilliaert et al., 2006), under closed system degassing constraints.

179
Figure 4-15 Pressure (and depth) versus modeled Dvap-melt values for Cl within the dacitic magma and for a system where basaltic magma is evolving to dacitic compositions (see text for details of the modeling procedure; Table 4-3). Model values are for vapour fluxing conditions (average between 1 and 5 wt% vapour) and open system degassing for the melt inclusions and dacitic matrix glasses, respectively. Melt inclusion error bars represent the standard deviation between the model results for 1 and 5 wt% vapour fluxing. Solid curves highlight the trend within the data.

180
4.10 Tables
Table 4-1 Kawah Ijen melt inclusion and matrix glass compositions (wt%)a
ijenbas9 ijenbas3 ijenbas11 ijenbas5 ijenbas12x ijenbas12ya ijenbas1 ijenbas8 ijenbas7 Host phaseb olivine olivine olivine olivine olivine olivine olivine olivine olivine SiO2 45.4 45.5 45.3 48.2 45.0 45.6 45.7 45.4 46.1 TiO2 1.02 1.02 0.97 1.21 1.00 0.92 1.04 1.08 0.99 Al2O3 18.4 18.3 17.6 15.5 16.8 16.8 18.4 18.5 18.5 FeOT 9.8 10.1 10.0 11.1 10.3 10.4 9.4 10.3 9.1 MnO 0.19 0.19 0.16 0.15 0.18 0.24 0.16 0.16 0.17 MgO 5.6 5.7 5.7 6.1 6.4 6.6 5.4 5.5 5.2 CaO 10.9 10.9 11.1 9.2 10.1 10.0 10.4 11.0 11.2 Na2O 2.59 2.45 2.57 3.00 2.33 2.31 2.64 2.43 2.59 K2O 0.61 0.60 0.59 0.93 0.57 0.57 0.73 0.63 0.61 P2O5 0.19 0.24 0.20 0.28 0.17 0.17 0.23 0.20 0.25 S 0.203 0.198 0.211 0.043 0.156 0.159 0.203 0.220 0.220 Cl 0.083 0.088 0.092 0.102 0.077 0.063 0.084 0.067 0.084 F b.d.l. b.d.l. b.d.l. b.d.l. b.d.l. b.d.l. b.d.l. 0.056 0.050 H2O 4.26 3.40 3.43 1.03 5.24 5.62 4.02 3.45 3.72 CO2 (ppm) 2184 3478 3509 19 151 189 1204 1552 1030 Host Foc 79.9 79.9 80.1 80.1 80.9 80.9 80.0 78.6 79.6 P (MPa)d 307 378 385 27 173 192 221 234 180
a Details of the electron microprobe analytical conditions can be found in van Hinsberg et al. (2010a) and Berlo et al. (in prep.) b Only olivine-hosted melt inclusions have been corrected for post-entrapment modifications. c Forsterite content of the olivine host located ~ 50 μm from melt inclusion.

181
T (˚C)e 1093 1108 1107 1160 1097 1095 1094 1103 1092 X olivine add.f 0.80 2.20 3.10 5.90 2.40 3.60 0.10 3.00 5.10 KDg 0.32 0.32 0.32 0.3 0.33 0.33 0.32 0.32 0.32 fO2 (ΔFMQ)h 1.45 - - 0.47 1.45 1.45 - - -
d Minimum pressure of melt inclusion entrapment based on the partial pressures of H2O and CO2, calculated from Papale et al. (2006). e Temperature of melt inclusion entrapment calculated using eq. 6a from Sugawara (2000). f Weight % olivine added back into the composition of the melt inclusions to attain equilibrium between the two phases. g KD values are calculated using the method of Toplis (2005) and the pressure and temperature calculated for each melt inclusion. h Oxygen fugacity values are calculated from the S Kα peak position data and are given as log units relative to the faylite-magnetite-quartz (FMQ)
buffer at a temperature of 1100 °C for the basalt and 1000˚C for the dacite. Variations in temperature of + 75 °C have no effect on the calculated fO2.

182
gg1 gg2 gg3 gg4 gg5 mountpx1 ijenbas2 plmi1 rhyo4 rhyo4b rhyo4 rhyo3
Host phase glass glass glass glass glass cpx cpx plag opx opx opx opx SiO2 51.6 52.9 52.5 52.8 52.4 51.2 - 66.0 66.2 65.4 65.8 66.4 TiO2 2.23 2.34 2.24 1.97 2.03 1.53 - 0.62 0.52 0.47 0.49 0.60 Al2O3 12.2 12.3 12.8 13.1 13.0 17.7 - 14.3 14.7 15.0 14.8 15.8
FeOT 14.5 13.6 13.1 13.9 12.8 10.2 - 3.2 3.2 3.1 3.1 3.7 MnO 0.38 0.34 0.34 0.32 0.28 0.17 - 0.13 0.08 0.06 0.07 0.09 MgO 3.9 3.7 3.8 3.5 3.5 3.8 - 0.5 0.6 0.6 0.6 0.8 CaO 8.4 8.6 8.3 7.7 8.3 8.4 - 1.7 1.9 1.9 1.9 2.4 Na2O 1.83 1.78 1.84 2.15 2.19 3.84 - 3.84 3.66 3.73 3.70 3.88 K2O 1.42 1.78 1.47 1.75 1.54 1.13 - 5.30 5.11 5.14 5.13 4.88 P2O5 0.52 0.53 0.51 0.48 0.46 0.25 - 0.10 0.17 0.14 0.15 0.10
S 0.004 0.003 0.004 0.002 0.001 0.027 - 0.010 0.014 0.014 0.014 0.012 Cl 0.171 0.184 0.182 0.147 0.152 0.076 - 0.213 0.217 0.244 0.231 0.219 F 0.087 0.090 0.107 0.060 0.103 b.d.l. - b.d.l. 0.017 0.095 0.056 0.057
H2O - - - - - - 4.63 - - - 3.73 - CO2 (ppm) - - - - - - 1612 - - - b.d.l. -
Host Fo - - - - - - - - - - - - P (MPa) - - - - - - 329* - - - 96 -
T (˚C) - - - - - - - - - - 1020 - X olivine add. - - - - - - - - - - - -
KD - - - - - - - - - - - - fO2 (ΔFMQ) - - - - - - - - - - - -
* Saturation pressure is calculated using the composition and temperature of sample mountpx1.

183
rhyo3b rhyo3 rhyo3crim rhyo2a rhyo2ab rhyo2y rhyo2b rhyo2c rhyo1 rhyo5 rhyo100 gm1 gm2 gm3 KV08-702 Host phase opx opx opx opx opx opx opx opx opx opx opx glass glass glass glass
SiO2 65.1 65.8 65.8 62.8 63.5 63.2 63.6 64.6 63.1 63.3 65.6 64.9 63.7 64.4 71.2
TiO2 0.60 0.60 0.58 0.66 0.67 0.66 0.69 0.59 0.80 0.62 0.63 0.69 0.77 0.79 0.58
Al2O3 15.8 15.8 14.3 16.9 17.1 17.0 16.4 16.2 15.9 15.7 15.7 15.3 15.1 14.9 14.4
FeOT 3.8 3.7 3.4 3.9 4.0 3.9 3.8 3.9 3.6 4.2 4.2 5.2 5.1 5.1 2.8
MnO 0.08 0.08 0.09 0.09 0.11 0.10 0.13 0.15 0.13 0.13 0.05 0.11 0.13 0.10 0.06 MgO 0.7 0.7 0.6 1.1 1.1 1.1 1.0 0.9 0.9 0.9 0.9 1.0 1.0 1.1 0.4 CaO 2.4 2.4 1.8 3.4 3.5 3.4 3.0 2.5 2.8 2.9 2.5 3.1 3.2 3.1 1.3 Na2O 4.06 3.97 3.69 4.60 4.74 4.67 4.48 4.45 4.65 3.99 4.03 3.89 3.65 3.67 3.80
K2O 4.93 4.91 5.18 3.47 3.47 3.47 4.07 4.73 3.95 4.05 4.43 4.52 4.46 4.56 6.00
P2O5 0.16 0.13 0.08 0.24 0.25 0.25 0.21 0.20 0.23 0.15 0.21 0.17 0.25 0.27 0.09
S 0.006 0.009 0.009 0.033 0.025 0.029 0.026 0.025 0.011 0.012 0.014 0.017 0.008 0.012 0.013 Cl 0.232 0.226 0.191 0.189 0.165 0.177 0.177 0.192 0.197 0.181 0.182 0.149 0.147 0.160 0.139 F 0.068 0.063 0.130 0.012 0.068 0.040 0.020 0.072 0.134 0.059 0.099 0.106 0.018 b.d.l. - H2O - 6.71 - - - 4.53 4.16 - 2.83 3.87 - 1.34 1.34 1.34 -
CO2 - 17 - - - 110 69 - 35 25 - b.d.l. b.d.l. b.d.l. -
Host Fo - - - - - - - - - - - - - - -
P (MPa) - 270 - - - 153 128 - 67 104 - 19 19 19 -
T (˚C) - 989 - - - 1019 1022 - 1037 1022 - - - - -
X olivine add. - - - - - - - - - - - - - - -
KD - - - - - - - - - - - - - - -
fO2 (ΔFMQ) - - - - - 0.87 - - - - - - - - -

184
Table 4-2 Fumarole gas compositions and sampling temperatures (2007 & 2008) in molar and mass units
Sample Date Temp. H2O CO2 SO2 H2S HCl HF H2 Ar O2 N2 CH4 CO (˚C) mmol/mol 401 2007 >452 997 1.8 0.38 b.d.l. 0.022 0.003 0.0002 0.032 <0.001 0.81 < 0.00001 < 0.00001 404 2007 >370 994 5.0 1.02 0.15 0.145 0.012 0.0008 0.006 <0.001 0.12 < 0.00001 < 0.00001 412 2007 371 986 10.5 3.13 b.d.l. 0.077 0.007 0.0016 0.003 0.002 0.10 < 0.00001 < 0.00001 423 2007 461 993 5.5 0.84 0.11 0.047 0.003 0.0009 0.004 <0.001 0.12 < 0.00001 < 0.00001 424 2007 461 990 7.9 1.86 b.d.l. 0.047 0.002 0.0012 0.002 <0.001 0.08 < 0.00001 < 0.00001 3 2008 489 881 87.7 8.37 15.89 0.272 0.075 0.0118 0.038 0.001 6.43 0.00009 0.00001 10 2008 450 852 105.0 12.15 28.70 0.539 0.024 0.0111 0.007 <0.001 1.15 0.00001 0.00001 14 2008 450 866 100.7 8.09 23.92 0.288 0.004 0.0137 0.005 0.001 0.88 0.00014 0.00016 wt% 401 " " 99 0.4 0.12 0.00 0.004 0.000 <0.00001 0.006 <0.0001 0.108 <0.00001 <0.00001 404 " " 98 1.1 0.31 0.02 0.025 0.001 <0.00001 0.001 <0.0001 0.016 <0.00001 <0.00001 412 " " 96 2.2 0.95 0.00 0.013 0.001 <0.00001 0.001 0.00034 0.014 <0.00001 <0.00001 423 " " 98 1.2 0.26 0.02 0.008 0.000 <0.00001 0.001 <0.0001 0.016 <0.00001 <0.00001 424 " " 97 1.7 0.57 0.00 0.008 0.000 <0.00001 0.000 <0.0001 0.011 <0.00001 <0.00001 3 " " 76 18.4 2.55 2.57 0.047 0.007 <0.00001 0.007 0.00015 0.858 <0.00001 <0.00001 10 " " 70 21.2 3.57 4.48 0.090 0.002 <0.00001 0.001 <0.0001 0.147 <0.00001 <0.00001 14 " " 73 20.7 2.42 3.80 0.049 0.000 <0.00001 0.001 0.00018 0.115 <0.00001 <0.00001
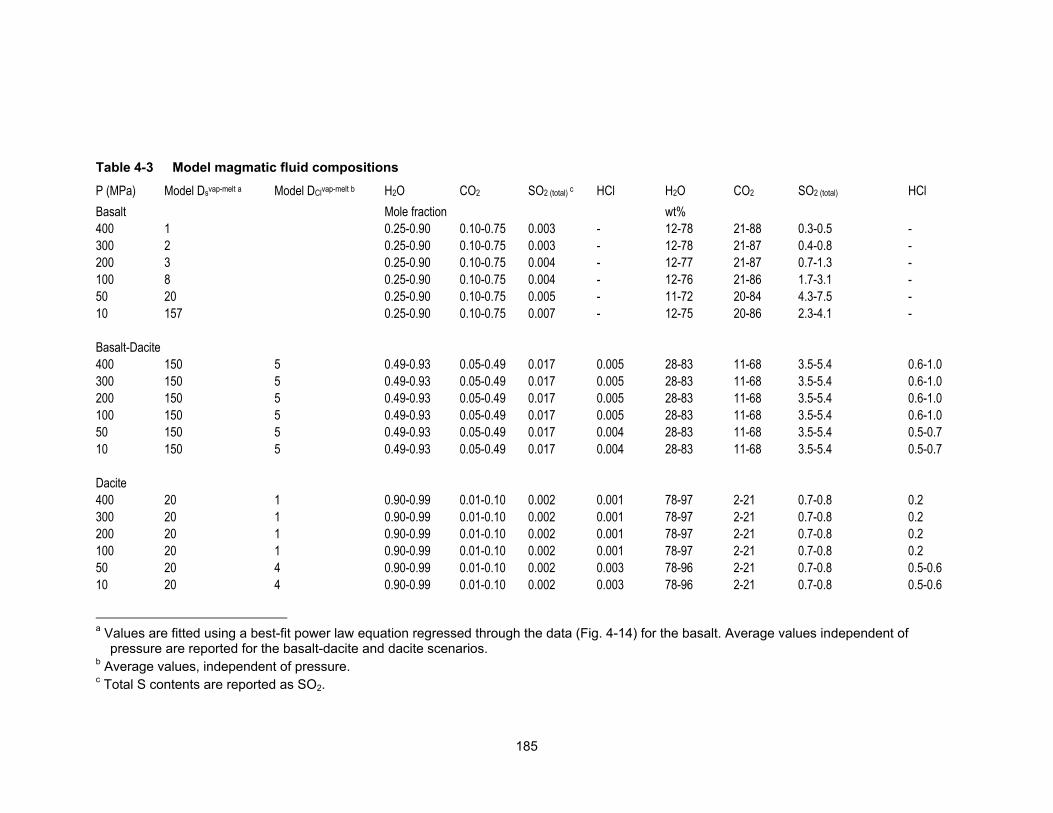
185
Table 4-3 Model magmatic fluid compositions
P (MPa) Model Dsvap-melt a Model DClvap-melt b H2O CO2 SO2 (total) c HCl H2O CO2 SO2 (total) HCl Basalt Mole fraction wt% 400 1 0.25-0.90 0.10-0.75 0.003 - 12-78 21-88 0.3-0.5 - 300 2 0.25-0.90 0.10-0.75 0.003 - 12-78 21-87 0.4-0.8 - 200 3 0.25-0.90 0.10-0.75 0.004 - 12-77 21-87 0.7-1.3 - 100 8 0.25-0.90 0.10-0.75 0.004 - 12-76 21-86 1.7-3.1 - 50 20 0.25-0.90 0.10-0.75 0.005 - 11-72 20-84 4.3-7.5 - 10 157 0.25-0.90 0.10-0.75 0.007 - 12-75 20-86 2.3-4.1 - Basalt-Dacite 400 150 5 0.49-0.93 0.05-0.49 0.017 0.005 28-83 11-68 3.5-5.4 0.6-1.0 300 150 5 0.49-0.93 0.05-0.49 0.017 0.005 28-83 11-68 3.5-5.4 0.6-1.0 200 150 5 0.49-0.93 0.05-0.49 0.017 0.005 28-83 11-68 3.5-5.4 0.6-1.0 100 150 5 0.49-0.93 0.05-0.49 0.017 0.005 28-83 11-68 3.5-5.4 0.6-1.0 50 150 5 0.49-0.93 0.05-0.49 0.017 0.004 28-83 11-68 3.5-5.4 0.5-0.7 10 150 5 0.49-0.93 0.05-0.49 0.017 0.004 28-83 11-68 3.5-5.4 0.5-0.7 Dacite 400 20 1 0.90-0.99 0.01-0.10 0.002 0.001 78-97 2-21 0.7-0.8 0.2 300 20 1 0.90-0.99 0.01-0.10 0.002 0.001 78-97 2-21 0.7-0.8 0.2 200 20 1 0.90-0.99 0.01-0.10 0.002 0.001 78-97 2-21 0.7-0.8 0.2 100 20 1 0.90-0.99 0.01-0.10 0.002 0.001 78-97 2-21 0.7-0.8 0.2 50 20 4 0.90-0.99 0.01-0.10 0.002 0.003 78-96 2-21 0.7-0.8 0.5-0.6 10 20 4 0.90-0.99 0.01-0.10 0.002 0.003 78-96 2-21 0.7-0.8 0.5-0.6
a Values are fitted using a best-fit power law equation regressed through the data (Fig. 4-14) for the basalt. Average values independent of
pressure are reported for the basalt-dacite and dacite scenarios. b Average values, independent of pressure. c Total S contents are reported as SO2.

186
4.11 References
Aiuppa, A., Federico, C., Giudice, G., Gurrieri, S., Paonita, A., Valenza, M., 2004. Plume chemistry provides insights into mechanisms of sulphur and halogen degassing in basaltic volcanoes. Earth Planet. Sci. Lett. 222 (2), 469-483.
Aiuppa, A., Moretti, R., Federico, C., Giudice, G., Gurrieri, S., Liuzzo, M., Papale, P., Shinohara, H., Valenza, M., 2007. Forecasting Etna eruptions by real-time observation of volcanic gas composition. Geology 35 (12), 1115-1118.
Aiuppa, A., Bertagnini, A., Métrich, N., Moretti, R., Di Muro, A., Liuzzo, M., Tamburello, G., 2010. A model of degassing for Stromboli volcano. Earth Planet. Sci. Lett. 295 (1-2), 195-204.
Behrens, H., Tamic, N., Holtz, F., 2004. Determination of the molar absorption coefficient for the infrared absorption band of CO2 in rhyolitic glasses. Am. Mineral. 89 (2-3), 301-306.
Benjamin, E. R., Plank, T., Wade, J. A., Kelley, K. A., Hauri, E. H., Alvarado, G. E., 2007. High water contents in basaltic magmas from Irazú Volcano, Costa Rica. J. Volcanol. Geotherm. Res. 168 (1-4), 68-92.
Blundy, J., Cashman, K., 2005. Rapid decompression-driven crystallization recorded by melt inclusions from Mount St. Helens volcano. Geology 33 (10), 793-796.
Blundy, J., Cashman, K. V., Rust, A., Witham, F., 2010. A case for CO2-rich arc magmas. Earth Planet. Sci. Lett. 290 (3-4), 289-301.
Botcharnikov, R. E., Behrens, H., Holtz, F., Koepke, J., Sato, H., 2004. Sulfur and chlorine solubility in Mt. Unzen rhyodacitic melt at 850 ˚C and 200 MPa. Chem. Geol. 213 (1-3), 207-225.
Boyce, J. W., Hervig, R. L., 2009. Apatite as a monitor of late-stage magmatic processes at Volcán Irazú, Costa Rica. Contrib. Mineral. Petrol. 157 (2), 135-145.
Caracausi, A., Ditta, M., Italiano, F., Longo, M., Nuccio, P. M., Paonita, A., Rizzo, A., 2005. Changes in fluid geochemistry and physico-chemical conditions of geothermal systems caused by magmatic input: The recent abrupt outgassing off the island of Panarea (Aeolian Islands, Italy). Geochim. Cosmochim. Acta 69 (12), 3045-3059.
Carroll, M. K., Rutherford, M. J., 1988. Sulfur speciation in hydrous experimental glasses of varying oxidation state--results from measured wavelength shifts of sulphur X-rays. Am. Mineral. 73 (7), 845-849.

187
Chouinard, A., Williams-Jones, A. E., Leonardson, R. W., Hodgson, C. J., Silva, P., Tellez, C., Vega, J., Rojas, F., 2005. Geology and genesis of the multistage high-sulfidation epithermal Pascua Au-Ag-Cu deposit, Chile and Argentina. Econ. Geol. 100 (3), 463-490.
Christenson, B. W., 2000. Geochemistry of fluids associated with the 1995-1996 eruption of Mt. Ruapehu, New Zealand: signatures and processes in the magmatic-hydrothermal system. J. Volcanol. Geotherm. Res. 97 (1-4), 1-30.
Delmelle, P., Bernard, A., 1994. Geochemistry, mineralogy, and chemical modeling of the acid crater lake of Kawah Ijen Volcano, Indonesia. Geochim. Cosmochim. Acta 58 (11), 2445-2460.
Delmelle, P., Bernard, A., Kusakabe, M., Fischer, T. P., Takano, B., 2000. Geochemistry of the magmatic-hydrothermal system of Kawah Ijen volcano, East Java, Indonesia. J. Volcanol. Geotherm. Res. 97 (1-4), 31-53.
Dixon, J. E., Pan, V., 1995. Determination of the molar absorptivity of dissolved carbonate in basanitic glass. Am. Mineral. 80 (11-12), 1339-1342.
Dixon, J. E., Stolper, E. M., Holloway, J. R., 1995. An experimental study of water and carbon dioxide solubilities in mid-ocean ridge basaltic liquids. Part I: Calibration and solubility models. J. Petrol. 36 (6), 1607-1631.
Edmonds, M., Oppenheimer, C., Pyle, D. M., Herd, R. A., Thompson, G., 2003. SO2 emissions from Soufriere Hills Volcano and their relationship to conduit permeability, hydrothermal interaction and degassing regime. J. Volcanol. Geotherm. Res. 124 (1-2), 23-43.
Edmonds, M., Gerlach, T. M., Herd, R. A., 2009. Halogen degassing during ascent and eruption of water-poor basaltic magma. Chem. Geol. 263 (1-4), 122-130.
Edmonds, M., Aiuppa, A., Humphreys, M., Moretti, R., Giudice, G., Martin, R. S., Herd, R. A., Christopher, T., 2010. Excess volatiles supplied by mingling of mafic magma at an andesite arc volcano. Geochem. Geophys. Geosyst. 11 (4), Q04005.
Faure, F., Schiano, P., 2005. Experimental investigation of equilibration conditions during forsterite growth and melt inclusion formation. Earth Planet. Sci. Lett. 236 (3-4), 882-898.
Fischer, T. P., Giggenbach, W. F., Sano, Y., Williams, S. N., 1998. Fluxes and sources of volatiles discharged from Kudryavy, a subduction zone volcano, Kurile Islands. Earth Planet. Sci. Lett. 160 (1-2), 81-96.
188
Garofalo, K., Tassi, F., Vaselli, O., Delgado-Huertas, A., Tedesco, D., Frische, M., Hansteen, T. H., Poreda, R. J., Strauch, W., 2007. Fumarolic gases at Mombacho volcano (Nicaragua): presence of magmatic gas species and implications for volcanic surveillance. Bull. Volcanol. 69 (7), 785-795.
Giggenbach, W. F., 1975. A simple method for the collection and analysis of volcanic gas samples. Bull. Volcanol. 39 (1), 132-145.
Giggenbach, W. F., 1987. Redox processes governing the chemistry of fumarolic gas discharges from White Island, New Zealand. Appl. Geochem. 2 (2), 143-161.
Giggenbach, W. F., Goguel, R. L., 1989. Collection and analysis of geothermal and volcanic water and gas discharges. New Zealand DSIR Chemistry Division Report 2401, 81.
Giggenbach, W. F., Matsuo, S., 1991. Evaluation of results from Second and Third IAVCEI field workshops on volcanic gases, Mt Usu, Japan, and White Island, New Zealand. Appl. Geochem. 6 (2), 125-141.
Giggenbach, W. F., Garcia, P., Londoño C., A., Rodriguez V., L., Rojas G., N., Calvache V., M. L., 1990. The chemistry of fumarolic vapour and thermal-spring discharges from the Nevado del Ruiz volcanic-magmatic-hydrothermal system, Colombia. J. Volcanol. Geotherm. Res. 42 (1-2), 13-39.
Handley, H. K., Macpherson, C. G., Davidson, J. P., Berlo, K., Lowry, D., 2007. Constraining fluid and sediment contributions to subduction-related magmatism in Indonesia: Ijen Volcanic Complex. J. Petrol. 48 (6), 1155.
Hamilton, W. 1979. Tectonics of the Indonesian region. USGS Prof. Paper 1078 345.
Johnson, E. R., Wallace, P. J., Cashman, K. V., Granados, H. D., Kent, A. J. R., 2008. Magmatic volatile contents and degassing-induced crystallization at Volcán Jorullo, Mexico: implications for melt evolution and the plumbing systems of monogenetic volcanoes. Earth Planet. Sci. Lett. 269 (3-4), 478-487.
Johnson, E. R., Wallace, P. J., Cashman, K. V., Granados, H. D., 2010. Degassing of volatiles (H2O, CO2, S, Cl) during ascent, crystallization, and eruption at mafic monogenetic volcanoes in central Mexico. J. Volcanol. Geotherm. Res. 197 (1-4), 225-238.
Jugo, P. J., 2009. Sulfur content at sulfide saturation in oxidized magmas. Geology 37 (5), 415-418.
Jugo, P. J., Luth, R. W., Richards, J. P., 2005a. An experimental study of the sulfur content in basaltic melts saturated with immiscible sulfide or sulfate liquids at 1300 °C and 1.0 GPa. J. Petrol. 46 (4), 783-798.
189
Jugo, P. J., Luth, R. W., Richards, J. P., 2005b. Experimental data on the speciation of sulfur as a function of oxygen fugacity in basaltic melts. Geochim. Cosmochim. Acta 69 (2), 497-503.
Kent, A. J. R., 2008. Melt inclusions in basaltic and related volcanic rocks. Rev. Mineral. Geochem. 69 (1), 273-331.
Kilinc, A., Carmichael, I. S. E., Rivers, M. L., Sack, R. O., 1983. The ferric-ferrous ratio of natural silicate liquids equilibrated in air. Contrib. Mineral. Petrol. 83 (1), 136-140.
Kiyosu, Y., Kurahashi, M., 1983. Origin of sulphur species in acid sulfate-chloride thermal waters, northeastern Japan. Geochim. Cosmochim. Acta 47 (7), 1237-1245.
Liu, Y., Samaha, N. T., Baker, D. R., 2007. Sulfur concentration at sulfide saturation (SCSS) in magmatic silicate melts. Geochim. Cosmochim. Acta 71 (7), 1783-1799.
Luhr, J. F., 2001. Glass inclusions and melt volatile contents at Parícutin Volcano, Mexico. Contrib. Mineral. Petrol. 142 (3), 261-283.
Luhr, J. F., Carmichael, I. S. E., 1981. The Colima volcanic complex, Mexico: Part II. Late-quaternary cinder cones. Contrib. Mineral. Petrol. 76 (2), 127-147.
Marini, L., Gambardella, B., 2005. Geochemical modeling of magmatic gas scrubbing. Annal. Geophys. 48 (4-5), 739-753.
Mathez, E. A., Webster, J. D., 2005. Partitioning behaviour of chlorine and fluorine in the system apatite-silicate melt-fluid. Geochim. Cosmochim. Acta 69 (5), 1275-1286.
Mauri, G., 2009. Multi-scale analysis of multiparameter geophysical and geochemical data from active volcanic systems. Ph. D. Thesis, Simon Fraser Univ. Burnaby, Canada, 436 pp.
Mazot, A., Bernard, A., Fischer, T., Inguaggiato, S., Sutawidjaja, I. S., 2008. Chemical evolution of thermal waters and changes in the hydrothermal system of Papandayan volcano (West Java, Indonesia) after the November 2002 eruption. J. Volcanol. Geotherm. Res. 178 (2), 276-286.
Menyailov, I. A., Nikitina, L. P., Shapar, V. N., Pilipenko, V. P., 1986. Temperature increase and chemical change of fumarolic gases at Momotombo volcano, Nicaragua, in 1982-1985: are these indicators of a possible eruption? J. Geophys. Res. 91 (B12), 12199-12214.
Métrich, N., Clocchiatti, R., 1989. Melt inclusion investigation of the volatile behaviour in historic alkali basaltic magmas of Etna. Bull. Volcanol. 51 (3), 185-198.

190
Métrich, N., Wallace, P. J., 2008. Volatile abundances in basaltic magmas and their degassing paths tracked by melt inclusions. Rev. Mineral. Geochem. 69 (1), 363-402.
Newman, S., Lowenstern, J. B., 2002. VolatileCalc: a silicate melt-H2O-CO2 solution model written in Visual Basic for Excel. Comput. Geosci. 28, 597-604.
Ohba, T., Hirabayashi, J., Nogami, K., Kusakabe, M., Yoshida, M., 2008. Magma degassing process during the eruption of Mt. Unzen, Japan in 1991 to 1995: Modeling with the chemical composition of volcanic gas. J. Volcanol. Geotherm. Res. 175 (1-2), 120-132.
Okumura, S., Nakamura, M., Nakashima, S., 2003. Determination of molar absorptivity of IR fundamental OH-stretching vibration in rhyolitic glasses. Am. Mineral. 88 (11-12), 1657-1662.
Oppenheimer, C., Francis, P., Burton, M., Maciejewski, A. J. H., Boardman, L., 1998. Remote measurement of volcanic gases by Fourier transform infrared spectroscopy. Appl. Phy. B 67 (4), 505-515.
Oppenheimer, C., Kyle, P. R., 2008. Probing the magma plumbing of Erebus volcano, Antarctica, by open-path FTIR spectroscopy of gas emissions. J. Volcanol. Geotherm. Res. 177 (3), 743-754.
Palmer, S., 2009. Hydrogeochemistry of the upper Banyu Pahit River valley, Kawah Ijen volcano, Indonesia. M.Sc. Thesis. McGill University, Montréal, Canada, 144 pp.
Papale, P., Moretti, R., Barbato, D., 2006. The compositional dependence of the saturation surface of H2O+CO2 fluids in silicate melts. Chem. Geol. 229 (1-3), 78-95.
Roberge, J., Delgado-Granados, H., Wallace, P. J., 2009. Mafic magma recharge supplies high CO2 and SO2 gas fluxes from Popocatépetl volcano, Mexico. Geology 37 (2), 107.
Rowe Jr, G. L., Brantley, S. L., Fernandez, M., Fernandez, J. F., Borgia, A., Barquero, J., 1992. Fluid-volcano interaction in an active stratovolcano: the crater lake system of Poas volcano, Costa Rica. J. Volcanol. Geotherm. Res. 49 (1-2), 23-51.
Rust, A. C., Cashman, K. V., Wallace, P. J., 2004. Magma degassing buffered by vapor flow through brecciated conduit margins. Geology 32 (4), 349-352.
Sadofsky, S. J., Portnyagin, M., Hoernle, K., van den Bogaard, P., 2008. Subduction cycling of volatiles and trace elements through the Central American volcanic arc: evidence from melt inclusions. Contrib. Mineral. Petrol. 155 (4), 433-456.

191
Scaillet, B., Pichavant, M., 2005. A model of sulphur solubility for hydrous mafic melts: application to the determination of magmatic fluid compositions of Italian volcanoes. Annal. Geophys. 48 (4-5), 671-698.
Shinohara, H., 2005. A new technique to estimate volcanic gas composition: plume measurements with a portable multi-sensor system. J. Volcanol. Geotherm. Res. 143 (4), 319-333.
Sitorus, K., 1990. Volcanic stratigraphy and geochemistry of the Idjen Caldera Complex, East Java, Indonesia. M. Sc. Thesis. University of Wellington, Wellington, New Zealand.
Smithsonian Institute, 2007. Ijen. Bull. Glob. Volcan. Network 32 (02-09).
Smithsonian Institute, 2009. Ijen. Bull. Glob. Volcan. Network 34 (02).
Sobolev, A. V., Danyushevsky, L. V., 1994. Petrology and geochemistry of boninites from the north termination of the Tonga Trench: constraints on the generation conditions of primary high-Ca boninite magmas. J. Petrol. 35 (5), 1183.
Spilliaert, N., Métrich, N., Allard, P., 2006. S-Cl-F degassing pattern of water-rich alkali basalt: modeling and relationship with eruption styles on Mount Etna volcano. Earth Planet. Sci. Lett. 248 (3-4), 772-786.
Sugawara, T., 2000. Empirical relationships between temperature, pressure, and MgO content in olivine and pyroxene saturated liquid. J. Geophys. Res. 105 (B4), 8457-8472.
Symonds, R. B., Gerlach, T. M., Reed, M. H., 2001. Magmatic gas scrubbing: implications for volcano monitoring. J. Volcanol. Geotherm. Res. 108 (1-4), 303-341.
Symonds, R. B., Rose, W. I., Bluth, G. J. S., Gerlach, T. M., 1994. Volcanic-gas studies; methods, results, and applications. Rev. Mineral. Geochem. 30 (1), 65-66.
Syracuse, E. M., Abers, G. A., 2006. Global compilation of variations in slab depth beneath arc volcanoes and implications. Geochem. Geophys. Geosyst. 7 (5), Q05017.
Takano, B., Suzuki, K., Sugimori, K., Ohba, T., Fazlullin, S. M., Bernard, A., Sumarti, S., Sukhyar, R., Hirabayashi, M., 2004. Bathymetric and geochemical investigation of Kawah Ijen Crater Lake, East Java, Indonesia. J. Volcanol. Geotherm. Res. 135 (4), 299-329.
Taran, Y. A., Rozhkov, A. M., Serafimova, E. K., Esikov, A. D., 1991. Chemical and isotopic composition of magmatic gases from the 1988 eruption of Klyuchevskoy volcano, Kamchatka. J. Volcanol. Geotherm. Res. 46 (3-4), 255-263.

192
Taran, Y., Gavilanes, J. C., Cortés, A., 2002. Chemical and isotopic composition of fumarolic gases and the SO2 flux from Volcan de Colima, Mexico, between the 1994 and 1998 eruptions. J. Volcanol. Geotherm. Res. 117 (1-2), 105-119.
van Hinsberg, V. 2001. Water-rock interaction and element fluxes in the Kawah Ijen Hyperacidic Crater Lake and the Banyu Pait river, east Java, Indonesia. M. Sc. Thesis. University of Utrecht, Netherlands, 299 pp.
van Hinsberg, V., Berlo, K., van Bergen, M., Williams-Jones, A. E., 2010a. Extreme alteration by hyperacidic brines at Kawah Ijen volcano, East Java, Indonesia: I. Textural and mineralogical imprint. J. Volcanol. Geotherm. Res. 198, 253-263.
van Hinsberg, V., Berlo, K., Sumarti, S., van Bergen, M., Williams-Jones, A.E., 2010b. Extreme alteration by hyperacidic brines at Kawah Ijen volcano, East Java, Indonesia: II. Metasomatic imprint and element fluxes. J. Volcanol. Geotherm. Res. 196, 169-184.
Varekamp, J. C., Kreulen, R., 2000. The stable isotope geochemistry of volcanic lakes, with examples from Indonesia. J. Volcanol. Geotherm. Res. 97 (1-4), 309-327.
Vigouroux, N., Wallace, P. J., Kent, A. J. R., 2008. Volatiles in high-K magmas from the Western trans-Mexican volcanic belt: Evidence for fluid fluxing and extreme enrichment of the mantle wedge by subduction processes. J. Petrol. 49 (9), 1589-1618.
Wallace, P. J., 2005. Volatiles in subduction zone magmas: concentrations and fluxes based on melt inclusion and volcanic gas data. J. Volcanol. Geotherm. Res. 140 (1-3), 217-240.
Wallace, P. J., Carmichael, I. S. E., 1994. S speciation in submarine basaltic glasses as determined by measurements of SKα X-ray wavelength shifts. Am. Mineral. 79 (1-2), 161-167.
Yamashita, S., Kitamura, T., Kusakabe, M., 1997. Infrared spectroscopy of hydrous glasses of arc magma compositions. Geochem. J. 31 (3), 169–174.

193
5: UNDERESTIMATING VOLCANIC DEGASSING: THE CASE OF KAWAH IJEN VOLCANO, INDONESIA1
5.1 Abstract
FLYSPEC measurements of SO2 gas emissions from the rhyolite dome at
Kawah Ijen volcano over 5 years reveal a constant flux of ~0.3 + 0.1 kg s-1. This
relatively low SO2 flux is accompanied by visible deposition of native S on the
surface. MultiGAS plume composition measurements (2008, 2009) as well as
direct fumarole samples (2007, 2008) constrain the total volatile budget of the
plume. Plume compositions have H2O/SO2 ratios of 400-1000 and CO2/SO2
ratios of 100-200 (by weight) and are highly depleted in SO2 compared to
fumarole compositions (H2O/SO2 ratios of 20-30, CO2/SO2 ratios of 6-9 and
H2S/SO2 ratios of 1-1.5 (by weight)). This extensive loss of SO2 (~ 82-98%) is
associated with the deposition of S-bearing sublimates and oxidation of S to SO3
and SO42- as the volcanic gases cool and mix with ambient air. An unquantified
amount of S is also lost to the crater lake, via precipitation of native S and
disproportionation to form dissolved sulphates. Minimum restored SO2(total) fluxes
are 2-14 (+ 30 %) kg s-1 (SO2(total) = SO2 + H2S reported as SO2) and total volatile
fluxes from the dome are 15-200 kg s-1. Melt inclusion data suggests that S
degasses efficiently (up to 2000 ppm) as mafic and felsic magmas mix and
1 The following chapter will be submitted to the journal Geology under the co-authorship of G.
Williams-Jones, V. van Hinsberg and A.E. Williams-Jones. The collaboration so far includes assistance in field sample collection from all co-authors as well as discussion and review by G. Williams-Jones.

194
differentiate at depth. Total magma mass flux is therefore estimated at 260-2400
kg s-1 (equivalent to a total volume flux of ~0.1-0.9 m3 s-1). Over the 5 year
sampling period, the total volume of degassed magma is estimated to be at least
0.02-0.14 km3. Given that no significant magmatic eruption has occurred in the
last 100 years (only minor phreatic eruptions have been recorded), the total
volume of unerupted, degassing magma is ~ 0.3-2.9 km3. This implies large
volumes of stored magma, and without evidence for significant deformation in the
area, sub-surface accommodation/drainback of degassed magma must be
occurring beneath the Ijen caldera. Compared to other open vent arc volcanoes,
Kawah Ijen is a small yet important S emitter not previously recognized due to
massive S deposition and fluxing through the crater lake, leading to a
disproportionately low SO2 flux at the surface.
5.2 Introduction
Open vent degassing at arc volcanoes is typically characterized by
continuous release of large volumes of gas, often without eruption of magmatic
material, which has led authors to suggest several mechanisms by which large
volumes of magma can efficiently degas at depth without extrusion. Release of
gas during magma overturn in the conduit and return flow of dense degassed
magma to depth has been proposed for various volcanoes (e.g., Izu-Oshima:
Kazahaya et al., 1994; Satsuma-Iwojima: Kazahaya et al., 2002; Stromboli:
Stevenson and Blake, 1998; Villarica: Witter et al., 2004; Masaya: Stix, 2007).
For arc volcanoes with deep seated, CO2-rich mafic magma degassing beneath
open vents, large volumes of SO2 may also be released without requiring shallow

195
conduit convection (e.g., Popocatépetl, Roberge et al., 2009). In both cases,
large volumes of magma are required to supply the gas flux measured at the
surface and effective monitoring of these volcanoes requires knowledge of both
the degassing mechanism and the volumes of magma involved. Oxidation of SO2
to form SO3 and sulphate species in tropospheric volcanic plumes may also
contribute to large underestimates of the SO2 flux (e.g., Oppenheimer et al.,
1998; Porter et al., 2002). The presence of large amounts of native S deposition
at volcanic vents can have a significant effect on the estimated total volatile
fluxes at open vent volcanoes and, therefore, on the estimated magma fluxes.
Using the example of Kawah Ijen, this study illustrates the importance of
characterizing plume versus fumarole compositions when estimating total volatile
and magmatic fluxes at open vent volcanoes. Similarly, other open vent
volcanoes with visible S precipitation at the surface may have significantly
underestimated magmatic fluxes.
5.3 Geologic Setting and Magmatic History
Kawah Ijen and the Ijen Caldera Complex are located in eastern Java,
Indonesia, along the volcanic front of the Sunda arc (Fig. 5-1). Beneath Kawah
Ijen, subduction of the 130 Ma Indo-Australian plate occurs at ~ 7 cm yr-1
(Syracuse and Abers, 2006) and water-rich fluid release from the subducting
plate to the volcanic front is amongst the highest documented at arcs worldwide
(Chapter 3). Kawah Ijen is a small, active stratovolcano that sits at the
intersection of the Ijen Caldera Complex rim and an intra-caldera lineament of
small cinder cones and shields (Fig. 5-1). Kawah Ijen has erupted a range of

196
magma compositions during its history, starting with a cone building stage
consisting of alternating basaltic to andesitic lava flows and pyroclasts (ash to
scoria; van Hinsberg et al., 2010b). These are discordantly overlain by
interbedded pyroclastic flow and fall deposits of dominantly dacitic composition,
dacitic lava flows, balistics, phreato-magmatic, phreatic and hydrothermal
deposits associated with the partial destruction of the volcanic edifice and
formation of a crater lake (van Hinsberg, 2001). The current configuration is a
large (1 km wide), ~300 m deep crater, partly filled with a hyper-acidic lake that
drains into the Banyu Pahit river. An active rhyolitic dome extrudes on the SE
shore of the crater lake. The dome is currently 10 x 10 x 100 m in size and is
actively degassing, with the dome surface and nearby crater walls covered in
native S precipitates. Pipes have been installed by local miners to divert the flow
of gas from most of the fumaroles to the base of the dome, allowing the vapours
to cool from > 350 ˚C to < 200 ˚C and native S to condense into the liquid phase,
pooling and crystallizing at the base for subsequent extraction.
The oldest recorded eruption of Kawah Ijen is in 1796 during which the
crater lake boiled off and its morphology changed (see van Hinsberg, 2001 for
references). In 1817, large earthquakes were felt in eastern Java and nearby Bali
followed by a large phreato-magmatic eruption that ejected ash, bombs and
sulphur and was accompanied by lahars on the outer flanks. The presence of a
crater lake is reported again in 1820 (van Hinsberg, 2001). During the 20th
century, one minor ash eruption as well as fluctuating lake levels, boiling of the
lake waters and numerous phreatic explosions have occurred, the latest one as

197
recently as 2002 (van Hinsberg, 2001; Smithsonian Institute, 2002). During a 5
year campaign at Kawah Ijen (2006-2010), activity was restricted to degassing
from the dome and acid spring runoff in the Banyu Pahit river (Smithsonian
Institute, 2007, 2009). Maximum recorded fumarole temperatures are 600 ˚C on
the top of the dome and up to 270 ˚C at the exit of the pipes. Crater lake
temperatures have remained in the range 30-45 ˚C, and lake levels varied by no
more than 1 m (Smithsonian Institute, 2007; 2009).
5.4 Sample Description and Methods
This study combines plume gas chemistry with fumarole gas compositions
(Chapter 4) and plume SO2 flux measurements in order to fully characterize the
flux of volatiles at Kawah Ijen. Fumarole gas samples were collected in 2007 and
2008 from the top of the dome following the method of Giggenbach (1975) and
Giggenbach and Goguel (1989). Details of the sampling technique and analysis
of the fumarole gas samples can be found in Chapter 4. Fumarole temperatures
at the time of sampling were 350-490 ˚C. The gases in 2008 are rich in CO2 and
Stotal but have compositions comparable to other high temperature fumaroles
from arc volcanoes (Table 5-3, Fig. 5-2; Chapter 4). Gases sampled in 2007 are
contaminated by air-saturated waters as evidenced by their elevated H2O, N2 and
Ar contents (Fig. 5-2; Chapter 4).
Near-simultaneous plume compositions were obtained using a portable
multi-gas sensor unit (MultiGAS; Shinohara, 2005) in 2008 and 2009 (Table 5-1).
The MultiGAS sensor consists of temperature, pressure and relative humidity
sensors (to calculate H2O contents), a LICOR IR CO2 detector (20,000 ppm CO2
198
saturation limit) and Interscan Corp. and Alphasense Ltd. SO2 electrochemical
cells (100 and 500 ppm saturation limits, respectively). Particle and desiccant
filters (at the front of the line) and in-line gas scrubbers (to remove H2S) are used
to eliminate contamination or interferences. Plume gases were sampled at
ambient temperature (20-30˚C) and at varying distances from the dome (< 1m to
> 100 m on the crater rim) in order to detect variations in plume composition as
dilution progresses. Maximum/peak volcanic gas concentrations in the plume are
recorded over a sampling period of 20-30 minutes and ratioed (e.g., H2O/CO2,
CO2/SO2). This technique was favoured because obtaining ratios of the species
by linear regression through all of the data was hampered by the variable
sampling rates of the sensors.
SO2 flux measurements were obtained in 2006-2010 with a FLYSPEC UV
spectrometer (Horton et al., 2006) and walking traverses under the plume along
the S-SE crater rim (Table 5-2). Relatively strong winds generally blew the plume
directly over the edge of the crater, allowing us to obtain flux measurements and
wind speeds (using a hand held anemometer) at close proximity to the plume
height (< 10 m overhead); this significantly reduced the uncertainties (< 10 %;
Mori et al., 2006; Williams-Jones et al., 2006; Nadeau and Williams-Jones,
2009). Wind direction is obtained from the line of sight relating the dome and the
point on the rim at which maximum plume concentrations are recorded. Due to
the lateral motion of the plume over the rim, spectra for each traverse represent
different “puffs” of plume as the FLYSPEC line of site intersected the plume at
various points along the crater rim (see Appendix D for additional details). As
199
such, each spectra was carefully evaluated and flux values were determined for
each individual “puff”, representing the plume at a given moment in time. Overall
variability in SO2 flux over the 5 years is within range of the daily variability
recorded.
5.5 Effects of Dilution, Reaction with Air and Precipitation of Native S on Plume Compositions
MultiGAS plume measurements represent mixtures of volcanic gas and
ambient air, and as such, cooling, dilution and high temperature reactions need
to be considered (e.g., Symonds and Reed, 1993; Gerlach, 2004; Martin et al.,
2006; 2009). The plume compositions are highly variable when compared to the
2008 fumarole gases (with negligible air or air-saturated water contamination;
Fig. 5-2). A tie-line linking the composition of ambient air (measured prior to and
following each plume sample) to the plume compositions can be extended until it
intersects the field of fumarole gas samples collected by earlier workers at the
exit of the pipes at a temperature of < 250 ˚C (Delmelle et al., 2000). These pipe
gases are variably depleted in SO2 (confirmed by the liquid sulphur draining from
the pipes; Fig. 5-4) compared to the 2008 samples collected directly from
fumaroles on the top of the dome. The plume samples represent mixtures of
ambient air and volcanic gases that are variably depleted in SO2 as a result of
native S deposition. High temperature, near-vent oxidation of SO2 and H2S to
form SO3 and H2SO4 (Allen et al., 2002; Gerlach, 2004; Mather et al., 2006;
Martin et al., 2006), combined with ambient temperature conversion of plume
200
SO2 to aerosol downwind, will also lead to a depletion in SO2 as recorded in the
plume measurements (e.g., Oppenheimer et al., 1998).
In order to quantify the effects of dilution only, the plume H2O and CO2
contents are compared to the 2008 gas compositions assuming both species
remain nonreactive (e.g., Martin et al., 2006), and simple mass balance
constraints are used to estimate the % dilution for each sample (calculated range
is 20-98%; Table 5-1). H2O/CO2 ratios in the plume track the effects of dilution
back to the 2008 fumarole compositions (Fig. 5-3a), a trend which is an artefact
of the procedure used to calculate the % dilution. Comparing the H2O/SO2 and
CO2/SO2 dilution trends with measured fumarole compositions suggests that
simple dilution of inert gas species is not occurring (Fig. 5-3b,c). Plume H2O/SO2
ratios are highly variable but remain constant, on average, as dilution progresses
from 20 to 98%. Given simple dilution, which assumes all species behave
conservatively, H2O/SO2 ratios should increase as dilution progresses, however
they remain constant. This implies that SO2 concentrations, between 20 and 98%
dilution and at ambient temperatures, are being buffered by the reaction and
oxidation of reduced S species to produce more SO2 as the plume mixes with air.
This also implies that no further oxidation of SO2 to form SO3 or sulphates is
occurring in the short time scales of plume-air interaction prior to sampling (e.g.,
Oppenheimer et al., 1998). A calculated dilution trend, starting with the 2008
fumarole gas composition and assuming a constant SO2 concentration
regardless of the fraction of air in the mixture, reproduces the plume trend but at
lower H2O/SO2 ratios (Fig. 5-3b). The plume H2O/SO2 ratios track back to a
201
restored near-vent composition (hereafter defined as << 20% dilution, when the
volcanic gas first encounters air and temperatures drop very rapidly from > 350
˚C to ambient values) that approximates (although still overestimates) the gas
samples collected at the exit of the pipes (Delmelle et al., 2000). We can quantify
the loss of SO2 from the volcanic gas fraction in the near-vent area by comparing
the restored near-vent H2O/SO2 ratio of the plume with the 2008 fumarole ratios.
The result is an 88 to 98 % loss of SO2 from the volcanic gas fraction. An
equivalent estimate is obtained from the CO2/SO2 systematics (82-97%; Fig. 5-
3c). Similarly, comparison of the gas samples collected at the exit of the pipes
with those collected in 2008 from the fumaroles at the top of the dome yields SO2
loss estimates that range from 12-88% (from H2O/SO2 ratios) and 23-90% (from
CO2/SO2 ratios).
5.6 Discussion
S deposition, visible on the surface of the dome and at the exit of the
pipes (Fig. 5-4) and oxidation of gaseous SO2 at relatively high temperatures (>
350˚C) (e.g., Mather et al., 2006; Martin et al., 2006) are both likely causes for
loss of SO2 from the plume in the near-vent area and underestimation of total
SO2 flux at Kawah Ijen. Underestimation of the SO2 flux will be even higher if S
disproportionation in the crater lake and pyritization of the dome rock can be
quantified. SO2 flux underestimates due to S deposition (e.g., Aiuppa et al.,
2005a) and conversion of H2S and SO2 to sulphate aerosols (e.g., Oppenheimer
et al., 1998) have been recognized previously but the degree of flux
underestimation has not been fully quantified (Williams-Jones et al., 2006). Near-

202
vent deposition of native S is typically observed in low temperature fumaroles (<
200 ˚C; Giggenbach, 1987) and most open-vent volcanoes degas dominantly at
higher temperatures, thereby quenching the gas phase before S saturation can
be reached (e.g., Aiuppa et al., 2005a,b). Kawah Ijen gases have elevated SO2
and H2S contents that promote native S saturation at elevated temperatures (Fig.
5-4). Furthermore, enhanced oxidation of H2S and SO2 by heterogeneous
reaction in the presence of particulate S in the plume (e.g., Oppenheimer et al.,
1998), especially at high temperatures in the near-vent area (e.g., Mather et al.,
2006), may also contribute to the underestimate in SO2 flux as measured
downwind.
Given the range of SO2 loss estimated from the comparison of fumarole
gases and near-vent plume data (82-98%), the SO2 flux measured with the
FLYSPEC on the crater rim (~150 m above the dome) will also be
underestimated. Without quantitative constraint of the conversion of H2S to SO2
in the plume as it mixes with air, we can only assume that such a process is
occurring because absolute SO2 concentrations in the plume are not affected by
dilution (Fig. 5-3b,c). Given our assumption that the SO2 concentration in the
plume as it crosses over the crater rim (at > 98% dilution with air) corresponds to
near-vent SO2 concentrations plus oxidized H2S, the measured flux of 0.3 (+ 0.1)
kg s-1 therefore represents the flux of SO2(total) (where SO2(total) = SO2 + H2S).
Taking into account 82 to 98% loss of SO2 in the near-vent area, this translates
to an actual SO2(total) flux (at the exit of the dome fumaroles) of 2-14 kg s-1, values
which approach daily SO2 flux estimates (during quiescent degassing) from some

203
of the world’s largest volcanic S emitters (e.g., ~23 kg s-1 at Popocatepetl,
Mexico: Goff et al., 1998; ~12-58 kg s-1 at Etna, Italy: Caltabiano et al., 1994;
Bruno et al., 1999).
The total volatile flux at Kawah Ijen can be estimated from the fumarole
H2O/SO2(total) and CO2/SO2(total) ratios (by weight; Table 5-3) and the restored
SO2(total) flux. The range in fumarole H2O/SO2(total) and CO2/SO2(total) ratios,
combined with the range in SO2(total) flux yields a total volatile flux of ~ 15-200 kg
s-1 (10-145 kg s-1 H2O, 3-36 kg s-1 CO2). This very large range reflects the
variability in the fumarole and plume compositions, a common feature of
fumarole fields (e.g., Giggenbach,1987; Fischer et al., 1996; Aiuppa et al.,
2005b). Additional uncertainties in quantifying the total SO2 flux at the rim (values
have an average standard deviation of 30%) leads us to place less emphasis on
the restored volatile flux values and more on the observation that these restored
fluxes are up to 98% higher than the directly measured fluxes.
Maximum S loss of 2000 ppm from the melt due to degassing of a magma
body at depth (Chapter 4) yields a calculated magma mass flux rate of 260-2400
kg s-1, which corresponds to a volume flux of ~0.1-0.9 m3 s-1 of degassing
magma (using an average magma density of 2600 kg m-3). These values are at
the low end of the range reported for other open-vent degassing arc volcanoes
(~2.2 m3 s-1 at Villarica, Witter et al., 2004; ~4 m3 s-1 at Izu-Oshima, Kazahaya et
al., 1994; 10 m3 s-1 at Satsuma-Iwojima, Kazahaya et al., 2002). In the five years
of survey at Kawah Ijen, SO2 flux measurements have remained virtually
constant suggesting that 0.02-0.14 km3 of magma must have degassed without

204
eruption. Given that no significant magmatic eruption has occurred in over 100
years, ~0.3-2.9 km3 of magma must have degassed before being recycled to or
stored in the deeper parts of the plumbing system. Without evidence for
significant deformation in the area (Mauri, 2009), sub-surface accommodation
and/or drainback of degassed magma must be occurring beneath the Ijen
caldera.
This study reveals the potential for large underestimates in total SO2 flux
emitted from open-vent degassing arc volcanoes when S deposition and near-
vent oxidation of S species are important factors. High total S concentrations in
the fumarole gases at Kawah Ijen lead to high temperature precipitation of native
S in the plume, which may enhance heterogeneous oxidation of SO2 and H2S by
atmosphere-derived OH radicals (Oppenheimer et al., 1998). Evidence of near-
vent, high temperature conversion of S species to aerosol compounds (e.g.,
Mather et al., 2006) and high temperature S deposition from S-rich magmas at
arc volcanoes (e.g., Satsuma-Iwojima, Japan, Kazahaya et al., 2002) can lead to
very large underestimates of total gas and unerupted magma fluxes. This has
important implications for modeling of convective overturn of degassed magma
and storage/accommodation of unerupted magma in the mid- to upper-crust.
Furthermore, compared to other open vent arc volcanoes, Kawah Ijen ranks as a
small edifice yet a very important S emitter not previously recognized due to
significant S deposition and degassing through its crater lake.

205
5.7 Acknowledgments
The authors would like to thank the Kawah Ijen Park service and
particularly T. Mulja and N. Widyastuti of East Asia Minerals for their assistance.
The Kawah Ijen research team, namely G. Mauri, S. Palmer, S. Scher, as well
numerous other volunteers, offered valuable help in the field. Local miners Pa Im
and Jumanto were invaluable in their assistance in the field, especially with dome
fumarole sampling. We acknowledge T. Fischer (University of New Mexico) for
analysis of the fumarole gas samples. Funding for this work was provided by an
NSERC-CRD grant to A.E. Williams-Jones and G. Williams-Jones.

206
5.8 Figures
Figure 5-1 a) The location of the Ijen Caldera Complex on the island of Java, Indonesia. The thatched region, labeled Sunda Land, delineates the inferred extent of the continental lithosphere beneath the arc (Hamilton, 1979), b) The location of Kawah Ijen volcano within the Ijen Caldera Complex, as well as the intra-caldera lineament (dashed line) of volcanoes running E-W. Map modified from van Hinsberg et al., 2010a.

207
Figure 5-2 H2O-CO2-SO2 ternary diagram comparing the fumarole and plume compositions. Fumarole samples collected prior to this study (Pre-2007) were collected at the exit of the pipes and have experienced variable loss of SO2 from the condensation of liquid S (Delmelle et al., 2000). Fumarole samples in 2007 have experienced contamination from meteoric H2O. The 2008 fumarole samples are the most representative of the uncontaminated magmatic gas phase at Kawah Ijen (Chapter 4). The plume samples have variable compositions representing both a) dilution of the magmatic gas with air and b) loss of SO2 due to oxidation and S precipitation (in the pipes, on the surface of the dome and as particulate S in the plume, deposited downwind).

208
Figure 5-3 Volatile ratios a) H2O/CO2, b) H2O/SO2 and c) CO2/SO2 versus the % dilution by air calculated for each plume sample. Fumarole gas volatile ratios are also plotted at 0% dilution by air. The dilution trend in a) is calculated assuming H2O and CO2 are unreactive species in the plume and relates the average of the 2008 fumarole samples to the average composition of air. The dilution trend in b) is calculated in the same manner as in a), assuming H2O and SO2 are unreactive species and their concentrations are effected only by dilution. The plume data does not follow this simple dilution trend and H2O/SO2 ratios appear to remain approximately constant as dilution progresses. This trend (labeled as Constant SO2) can be reproduced if H2O remains unreactive but SO2 contents are buffered by the continuous oxidation of more reduced S species (H2S, S0). This trend runs through the average of the plume compositions and the two dotted trends bracket the variability in plume compositions. The constant SO2 trend tracking back to the average 2008 fumarole compositions represents the plume trend expected if no near-vent SO2 was occurring. The same pattern is seen with the CO2/SO2 ratios of the plume samples in c). Pre-2007 data is from Delmelle et al. (2000).

209
Figure 5-4 Saturation of Kawah Ijen fumarole gases with respect to native S. Phase relationships are from Giggenbach (1987). Pre-2007 samples taken at the exit of the pipes are clearly saturated in liquid S (Delmelle et al., 2000). The 2008 fumarole gas samples are also at or near saturation as they exit the dome, leading to S precipitation in the solid field as temperatures drop rapidly to ambient values. The 2007 fumarole samples are highly depleted in H2S and SO2 and only one sample has reliable H2S, SO2 and H2O values as well as an accurately determined exit temperature. This sample plots in the S undersaturated field at its exit temperature, reflecting the high H2O, low Stotal content of the gas.
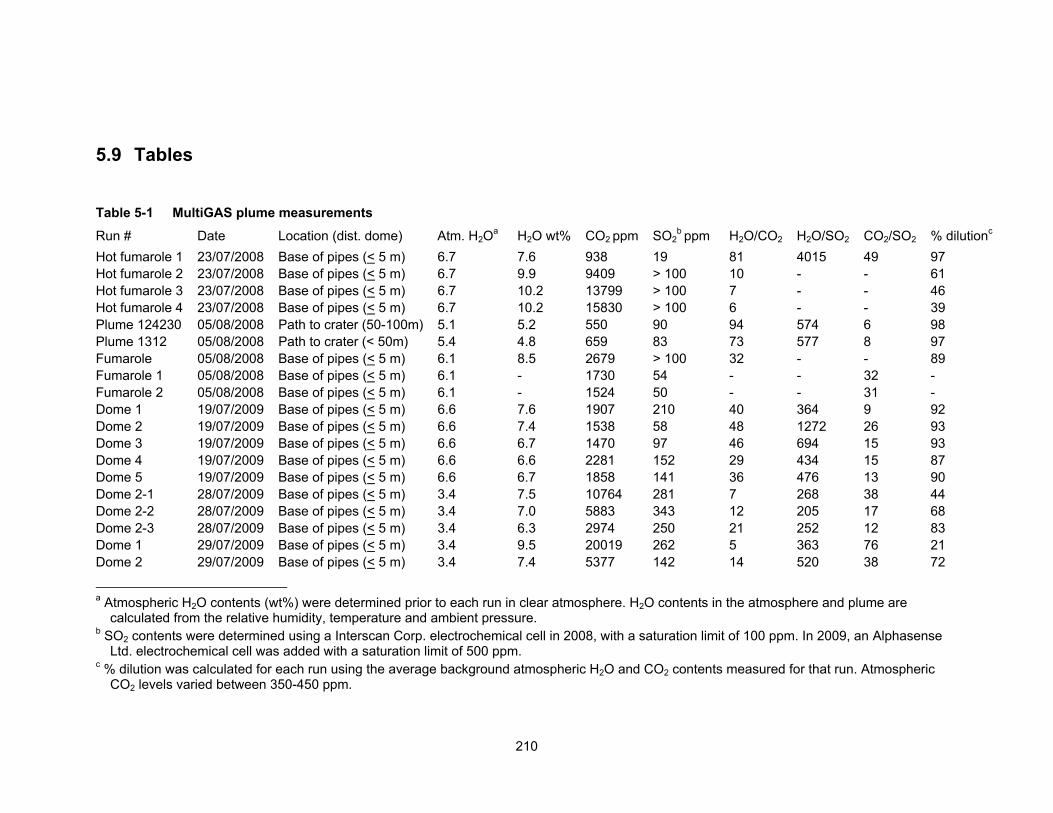
210
5.9 Tables
Table 5-1 MultiGAS plume measurements
Run # Date Location (dist. dome) Atm. H2Oa H2O wt% CO2 ppm SO2b ppm H2O/CO2 H2O/SO2 CO2/SO2 % dilutionc
Hot fumarole 1 23/07/2008 Base of pipes (< 5 m) 6.7 7.6 938 19 81 4015 49 97 Hot fumarole 2 23/07/2008 Base of pipes (< 5 m) 6.7 9.9 9409 > 100 10 - - 61 Hot fumarole 3 23/07/2008 Base of pipes (< 5 m) 6.7 10.2 13799 > 100 7 - - 46 Hot fumarole 4 23/07/2008 Base of pipes (< 5 m) 6.7 10.2 15830 > 100 6 - - 39 Plume 124230 05/08/2008 Path to crater (50-100m) 5.1 5.2 550 90 94 574 6 98 Plume 1312 05/08/2008 Path to crater (< 50m) 5.4 4.8 659 83 73 577 8 97 Fumarole 05/08/2008 Base of pipes (< 5 m) 6.1 8.5 2679 > 100 32 - - 89 Fumarole 1 05/08/2008 Base of pipes (< 5 m) 6.1 - 1730 54 - - 32 - Fumarole 2 05/08/2008 Base of pipes (< 5 m) 6.1 - 1524 50 - - 31 - Dome 1 19/07/2009 Base of pipes (< 5 m) 6.6 7.6 1907 210 40 364 9 92 Dome 2 19/07/2009 Base of pipes (< 5 m) 6.6 7.4 1538 58 48 1272 26 93 Dome 3 19/07/2009 Base of pipes (< 5 m) 6.6 6.7 1470 97 46 694 15 93 Dome 4 19/07/2009 Base of pipes (< 5 m) 6.6 6.6 2281 152 29 434 15 87 Dome 5 19/07/2009 Base of pipes (< 5 m) 6.6 6.7 1858 141 36 476 13 90 Dome 2-1 28/07/2009 Base of pipes (< 5 m) 3.4 7.5 10764 281 7 268 38 44 Dome 2-2 28/07/2009 Base of pipes (< 5 m) 3.4 7.0 5883 343 12 205 17 68 Dome 2-3 28/07/2009 Base of pipes (< 5 m) 3.4 6.3 2974 250 21 252 12 83 Dome 1 29/07/2009 Base of pipes (< 5 m) 3.4 9.5 20019 262 5 363 76 21 Dome 2 29/07/2009 Base of pipes (< 5 m) 3.4 7.4 5377 142 14 520 38 72
a Atmospheric H2O contents (wt%) were determined prior to each run in clear atmosphere. H2O contents in the atmosphere and plume are
calculated from the relative humidity, temperature and ambient pressure. b SO2 contents were determined using a Interscan Corp. electrochemical cell in 2008, with a saturation limit of 100 ppm. In 2009, an Alphasense
Ltd. electrochemical cell was added with a saturation limit of 500 ppm. c % dilution was calculated for each run using the average background atmospheric H2O and CO2 contents measured for that run. Atmospheric
CO2 levels varied between 350-450 ppm.
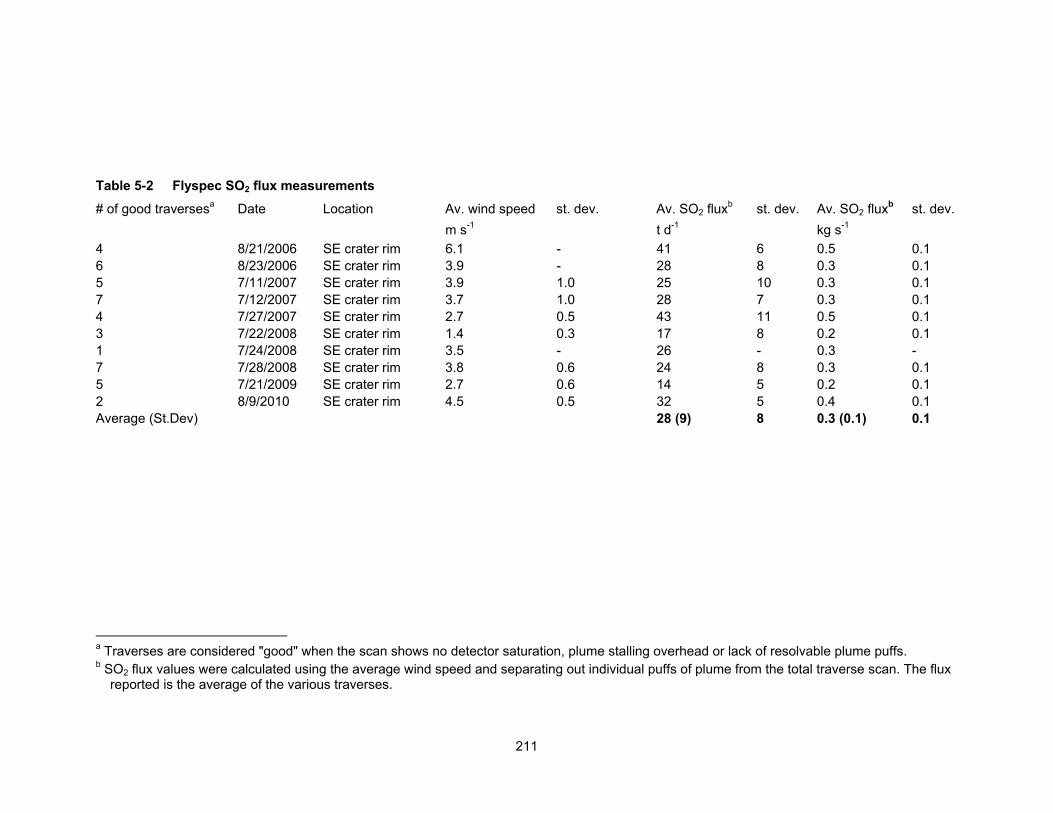
211
Table 5-2 Flyspec SO2 flux measurements
# of good traversesa Date Location Av. wind speed st. dev. Av. SO2 fluxb st. dev. Av. SO2 fluxb st. dev. m s-1 t d-1 kg s-1 4 8/21/2006 SE crater rim 6.1 - 41 6 0.5 0.1 6 8/23/2006 SE crater rim 3.9 - 28 8 0.3 0.1 5 7/11/2007 SE crater rim 3.9 1.0 25 10 0.3 0.1 7 7/12/2007 SE crater rim 3.7 1.0 28 7 0.3 0.1 4 7/27/2007 SE crater rim 2.7 0.5 43 11 0.5 0.1 3 7/22/2008 SE crater rim 1.4 0.3 17 8 0.2 0.1 1 7/24/2008 SE crater rim 3.5 - 26 - 0.3 - 7 7/28/2008 SE crater rim 3.8 0.6 24 8 0.3 0.1 5 7/21/2009 SE crater rim 2.7 0.6 14 5 0.2 0.1 2 8/9/2010 SE crater rim 4.5 0.5 32 5 0.4 0.1 Average (St.Dev) 28 (9) 8 0.3 (0.1) 0.1
a Traverses are considered "good" when the scan shows no detector saturation, plume stalling overhead or lack of resolvable plume puffs. b SO2 flux values were calculated using the average wind speed and separating out individual puffs of plume from the total traverse scan. The flux
reported is the average of the various traverses.

212
Table 5-3 Partial fumarole compositions (wt%)a
Sample Date Temp. (˚C) H2O CO2 SO2 H2S 401 2007 >452 99 0.4 0.12 0.00 404 2007 >370 98 1.1 0.31 0.02 412 2007 371 96 2.2 0.95 0.00 423 2007 461 98 1.2 0.26 0.02 424 2007 461 97 1.7 0.57 0.00 3 2008 489 76 18.4 2.55 2.57 10 2008 450 70 21.2 3.57 4.48 14 2008 450 73 20.7 2.42 3.80
a Complete fumarole gas compositions can be obtained from Chapter 4.
213
5.10 References
Aiuppa, A., Inguaggiato, S., McGonigle, A. J. S., O'Dwyer, M., Oppenheimer, C., Padgett, M. J., Rouwet, D., and Valenza, M., 2005a, H2S fluxes from Mt. Etna, Stromboli, and Vulcano (Italy) and implications for the sulfur budget at volcanoes: Geochimica et Cosmochimica Acta, v. 69, p. 1861-1871.
Aiuppa, A., Federico, C., Giudice, G., and Gurrieri, S., 2005b, Chemical mapping of a fumarolic field: la Fossa crater, Vulcano Island (Aeolian Islands, Italy): Geophysical Research Letters, v. 32, p. L13309.
Allen, A. G., Oppenheimer, C., Ferm, M., Baxter, P. J., Horrocks, L. A., Galle, B., McGonigle, A. J. S., and Duffell, H. J., 2002, Primary sulfate aerosol and associated emissions from Masaya Volcano, Nicaragua: Journal of Geophysical Research, v. 107, p. 4682.
Bruno, N., Caltabiano, T., and Romano, R., 1999, SO2 emissions at Mt. Etna with particular reference to the period 1993–1995: Bulletin of Volcanology, v. 60, p. 405-411.
Caltabiano, T., Romano, R., and Budetta, G., 1994, SO2 flux measurements at Mount Etna (Sicily): Journal of Geophysical Research, v. 99, p. 12809.
Delmelle, P., Bernard, A., Kusakabe, M., Fischer, T. P., and Takano, B., 2000, Geochemistry of the magmatic-hydrothermal system of Kawah Ijen volcano, East Java, Indonesia: Journal of Volcanology and Geothermal Research, v. 97, p. 31-53.
Fischer, T. P., Arehart, G. B., Sturchio, N. C., and Williams, S. N., 1996, The relationship between fumarole gas composition and eruptive activity at Galeras Volcano, Colombia: Geology, v. 24, p. 531-534.
Gerlach, T. M., 2004, Volcanic sources of tropospheric ozone-depleting trace gases: Geochemistry, Geophysics, Geosystems, v. 5, p. Q09007.
Giggenbach, W. F., 1987, Redox processes governing the chemistry of fumarolic gas discharges from White Island, New Zealand: Applied Geochemistry, v. 2, p. 143-161.
Giggenbach, W. F., 1975, A simple method for the collection and analysis of volcanic gas samples: Bulletin of Volcanology, v. 39, p. 132-145.
Giggenbach, W. F., Goguel, R. L., 1989, Collection and analysis of geothermal and volcanic water and gas discharges: Chemical Division of Department of Scientific and Industrial Research, Petone, New Zealand Report CD, v. 2401, p. 81.
214
Goff, F., Janik, C. J., Delgado, H., Werner, C., Counce, D., Stimac, J. A., Siebe, C., Love, S. P., Williams, S. N., and Fischer, T., 1998, Geochemical surveillance of magmatic volatiles at Popocatépetl volcano, Mexico: Bulletin of the Geological Society of America, v. 110, p. 695-710.
Hamilton, W. 1979. Tectonics of the Indonesian region. USGS Prof. Paper 1078 345.
Horton, K. A., Williams-Jones, G., Garbeil, H., Elias, T., Sutton, A. J., Mouginis-Mark, P., Porter, J. N., and Clegg, S., 2006, Real-time measurement of volcanic SO2 emissions: validation of a new UV correlation spectrometer (FLYSPEC): Bulletin of Volcanology, v. 68, p. 323-327.
Kazahaya, K., Shinohara, H., and Saito, G., 2002, Degassing process of Satsuma-Iwojima volcano, Japan: Supply of volatile components from a deep magma chamber: Earth Planets and Space, v. 54, p. 327-336.
Kazahaya, K., Shinohara, H., and Saito, G., 1994, Excessive degassing of Izu-Oshima volcano: magma convection in a conduit: Bulletin of Volcanology, v. 56, p. 207-216.
Martin, R. S., Mather, T. A., and Pyle, D. M., 2006, High-temperature mixtures of magmatic and atmospheric gases: Geochemistry Geophysics Geosystems, v. 7, p. Q04006.
Martin, R. S., Roberts, T. J., Mather, T. A., and Pyle, D. M., 2009, The implications of H2S and H2 kinetic stability in high-T mixtures of magmatic and atmospheric gases for the production of oxidized trace species (eg, BrO and NOx): Chemical Geology, v. 263, p. 143-150.
Mather, T. A., McCabe, J. R., Rai, V. K., Thiemens, M. H., and Pyle, D. M., 2006, Oxygen and sulfur isotopic composition of volcanic sulfate aerosol at the point of emission: Journal of Geophysical Research, v. 111, p. D18205.
Mauri, G., 2009, Multi-scale analysis of multiparameter geophysical and geochemical data from active volcanic systems. Ph. D. Thesis, Simon Fraser University, Burnaby, Canada, 436 pp.
Oppenheimer, C., Francis, P., and Stix, J., 1998, Depletion rates of sulfur dioxide in tropospheric volcanic plumes: Geophysical Research Letters, v. 25, p. 2671-2674.
Porter, J. N., Horton, K. A., Mouginis-Mark, P. J., Lienert, B., Sharma, S. K., Lau, E., Sutton, A. J., Elias, T., and Oppenheimer, C., 2002, Sun photometer and lidar measurements of the plume from the Hawaii Kilauea Volcano Pu’u O’o vent: Aerosol flux and SO2 lifetime: Geophysical Research Letters, v. 29, p. 1783.
215
Roberge, J., Delgado-Granados, H., and Wallace, P. J., 2009, Mafic magma recharge supplies high CO2 and SO2 gas fluxes from Popocatépetl volcano, Mexico: Geology, v. 37, p. 107.
Shinohara, H., 2005, A new technique to estimate volcanic gas composition: plume measurements with a portable multi-sensor system: Journal of Volcanology and Geothermal Research, v. 143, p. 319-333.
Smithsonian Institute, 2002, Ijen. Bulletin of the Global Volcanism Network 27 (08).
Smithsonian Institute, 2007, Ijen. Bulletin of the Global Volcanism Network 32 (02-09).
Smithsonian Institute, 2009, Ijen. Bulletin of the Global Volcanism Network 34 (02).
Stevenson, D. S., Blake, S., 1998, Modeling the dynamics and thermodynamics of volcanic degassing: Bulletin of Volcanology, v. 60, p. 307-317.
Stix, J., 2007, Stability and instability of quiescently active volcanoes: The case of Masaya, Nicaragua: Geology, v. 35, p. 535-538.
Symonds, R. B., Reed, M. H., 1993, Calculation of multicomponent chemical equilibria in gas-solid-liquid systems: Calculation methods, thermochemical data, and applications to studies of high-temperature volcanic gases with examples from Mt. St. Helens: American Journal of Science, v. 293, p. 758-864.
Syracuse, E. M., Abers, G. A., 2006, Global compilation of variations in slab depth beneath arc volcanoes and implications: Geochemistry, Geophysics, Geosystems, v. 7, p. Q05017.
van Hinsberg, V. 2001, Water-rock interaction and element fluxes in the Kawah Ijen Hyperacidic Crater Lake and the Banyu Pait river, east Java, Indonesia. M. Sc. Thesis, University of Utrecht, Netherlands, 299 pp.
van Hinsberg, V., Berlo, K., van Bergen, M., Williams-Jones, A. E., 2010a, Extreme alteration by hyperacidic brines at Kawah Ijen volcano, East Java, Indonesia: I. Textural and mineralogical imprint: Journal of Volcanology and Geothermal Research, v. 198, p. 253-263.
van Hinsberg, V., Berlo, K., Sumarti, S., van Bergen, M., and Williams-Jones, A. E., 2010b, Extreme alteration by hyperacidic brines at Kawah Ijen volcano, East Java, Indonesia: II. Metasomatic imprint and element fluxes: Journal of Volcanology and Geothermal Research, v. 196, p. 169-184.
Witter, J. B., Kress, V. C., Delmelle, P., and Stix, J., 2004, Volatile degassing, petrology, and magma dynamics of the Villarrica Lava Lake, Southern Chile: Journal of Volcanology and Geothermal Research, v. 134, p. 303-337.

216
6: CONCLUSIONS
6.1 Volatile Transfer During Slab Subduction
Melt inclusion volatile and trace element ratios from mafic arc magmas in
Indonesia (Kawah Ijen and Galunggung volcanoes) are compared to ratios in
other mafic arc magmas from Mexico, Central America and Kamchatka. These
volatile and trace elements are incompatible during the evolution of primary
mantle melts to form the basalts and basaltic andesites erupted in arcs. As such,
the use of incompatible element ratios allows for the comparison between
magmas of variable source characteristics and degrees of differentiation. In order
to constrain the nature of the subduction-derived enrichment at each arc volcano,
these element ratios are compared to modeled mantle melt compositions after
the addition of fluids/melts derived from the subducted slab. These fluids/melts
are modeled as: 1) sediment-derived melts which can mobilize the moderately
fluid-mobile elements such as La and Th, and which contain high concentrations
of Ba and Pb, 2) H2O-rich fluids derived from the dehydration of the altered
oceanic crust (AOC), which are enriched in the most fluid-mobile elements,
particularly Sr, and 3) H2O-rich fluids, similar to those from the AOC, derived from
the dehydration of the serpentinized oceanic lithosphere. These melts and fluids
are modeled using published reservoir compositions (oceanic sediment, AOC
and serpentinized mantle) and experimentally-derived solid-fluid and solid-melt
partition coefficients at the pressures, temperatures and compositions of interest.

217
Positive correlations between slab surface temperature (H2O/Ce), Cl and
Sr are observed. Coupled with the high Sr/Ba ratio of most arc magmas, this
suggests that most of the H2O and Cl content of arc front magmas originates
from the dehydration of the AOC. The involvement of H2O and Cl derived from
sediment melt is secondary to the AOC in most arc front magmas, although
sediment melt does contribute to Ba, Pb, and LREE contents. The serpentinized
mantle is likely to be an important source of H2O-rich fluids only in arc segments
with hot slab geotherms and steep slab dips such as Nicaragua, Central
America. These results agree with thermo-mechanical models of fluid release in
subduction zones and reinforce the role of melt inclusion studies as a
complementary method of estimating the nature and amount of fluid release
beneath arc volcanoes.
The source of sulphur and fluorine in arc magmas is not as easily
discerned although a moderate correlation between Sr and S contents suggests
that either some S is supplied by the dehydrating AOC, or S can be efficiently
scavenged from the overlying meta-sediment layer by fluids rising up from the
AOC. Highly variable S and F contents in subducted sediment (e.g., Wei et al.,
2005; Alt et al., 1989), complex and poorly understood solubility mechanisms for
S and F, respectively, and the lack of experimental studies on the mobility of S
and F in subducted materials make it difficult to evaluate the source of these
volatiles. More F analyses in melt inclusions from arc magmas and better
constraints on S and F in slab and mantle components will improve our
understanding of S and F recycling in subduction zones.

218
The different behaviours of H2O, Cl, S and F in these arc magmas
suggests that there is a preferred coupling of H2O and Cl during slab
dehydration/melting at sub-arc front depths, whereas S and F are partially to
completely decoupled, respectively. As a result, enrichment of certain arc
magmas in S or F is not primarily a function of fluid addition from the slab but is
more likely to reflect anomalously S- or F-rich sediment sources or the
involvement of metasomatized mantle. Kawah Ijen magmas are highly enriched
in F compared to other arc magmas and have S and H2O contents at the upper
end of the range of magmas sampled. This mantle-derived enrichment is
reflected in the composition of the volcanic gases emitted at Kawah Ijen (S-rich)
and the nature of the mineral assemblage present in the magmas (F-rich apatite).
Compared to Galunggung volcano, located above a different segment of the
subducting Indian ocean plate, Kawah Ijen displays a higher degree of
enrichment in volatile (H2O, Cl, S) and fluid-mobile elements (Sr), reflecting
higher AOC-derived fluid fluxes (4-5 wt% compared to ~ 1 wt% for Galunggung).
The elevated H2O and Sr contents of the Kawah Ijen magmas are comparable to
some of the wettest volcanic front magmas worldwide (e.g., Mexico, Central
America), which would suggest that the eastern Java arc may be one of the
wettest cold slab subduction zones in the world.
6.2 Volatile Transfer During Magma Ascent Through the Crust and Degassing
The partitioning of the volatile elements between the melt and fluid phase
upon ascent, degassing and crystallization of a magma is explored at both Sierra
219
Negra and Kawah Ijen. Contrasting tectonic settings impart different primary
volatile ratios to the magmas. At Sierra Negra volcano, relatively dry mantle
melts contain undegassed H2O/CO2 ratios that likely approach unity whereas at
Kawah Ijen, fluid addition from the subducting slab imparts a higher H2O/CO2
ratio ( up to 40) to the primary melts. In both systems, due to the relatively low
solubility of CO2 in calc-alkaline and alkaline basalts, fluid saturation occurs at
depths of > 15 km and > 30 km at Kawah Ijen and Sierra Negra, respectively.
The major difference between the two systems is that elevated H2O contents at
Kawah Ijen, which will result in H2O-saturation of the magma at high pressures (>
200 MPa, corresponding to mid-upper crustal depths: > 7 km), whereas low H2O
contents at Sierra Negra (< 1 wt%) result in H2O undersaturated conditions upon
ascent of the magma until very shallow levels (< 1 km).
The suppression of H2O degassing until very shallow levels and the
overall lower fluid content of the hot-spot magmas facilitates their ascent through
the crust and their emplacement into shallow sills/chambers without generating
significant overpressures. Combined with elevated heat flow in hot-spot areas,
which allows for more efficient accommodation of space in the crust, the
conditions are favourable for the emplacement of large volumes of magma at
shallow levels. At Sierra Negra, emplacement of originally deep-seated magma
into shallow levels will lead to the exsolution and accumulation of large volumes
of CO2-rich gas at the top of the magma chamber creating a foam-like layer. Not
modeled but also likely to contribute, is the effect of prolonged storage, cooling
and crystallization of this magma during repose periods, eventually leading to
220
H2O-saturation of the magma and exsolution of an additional H2O-rich vapour.
Modeling of the microgravity and elevation data in the years preceding the 2005
eruption of Sierra Negra suggests that this foam-like layer of highly vesicular
magma was able to expand in response to elastic deformation of the magma
chamber roof until overpressures exceeded the elastic strength of the
surrounding rocks and a highly explosive initial eruptive phase began. The
eruption lasted for 8 days and erupted aphyric basaltic lavas and tephra,
representing the evacuation of 0.15 km3 of magma and a minimum of 0.07 km3 of
gas from the uppermost level of the chamber. Witness accounts of the eruption
do not report any visible change in the flux of gas emitted from the fumaroles
prior to or during the 2005 eruption. This suggests that the hydrothermal system
in the SE corner of the caldera is not directly connected to the active magma
plumbing system.
At Kawah Ijen, melt inclusion H2O and CO2 contents record the ascent,
degassing and crystallization of the basaltic magma from > 15 km depth to the
surface. H2O-saturation would normally be attained at mid-upper crustal levels (>
7 km depth), however, CO2-rich vapour fluxing of the magma (system open to
mass flux into the magma) causes the melt to lose H2O and gain CO2 (driving it
away from H2O-saturation) in an attempt to equilibrate with the vapour phase.
This results in melt inclusions with highly variable H2O/CO2 ratios, most of them
recorded at crystallization pressures of 200 MPa (~7 km depth). Vapour-fluxing of
a magmatic system to the degree recorded at Kawah Ijen requires open system
degassing conditions. The persistent flux of gas being emitted from the surface of
221
the volcano and through the crater lake attests to the open system nature of
degassing at Kawah Ijen. No magmatic eruption has been recorded at Ijen for
over 100 years yet degassing of the volcano has been persistent throughout this
time. Such large volumes of degassed magma (up to 2.9 kg s-1), unaccompanied
by eruption, require a magmatic plumbing system which is highly permeable,
open to the flux of both melt and gas from depths of at least 15 km. This
contrasts greatly with Sierra Negra, where negligible permeability (but significant
elastic accommodation) of the shallow crust during repose periods allows for
significant gas and overpressures to develop, leading to periodic eruptions of
gas-rich magma (~ every 10-30 years on average in the last 200 years). At
Kawah Ijen, explosive magmatic eruptions will only occur if the permeability of
the plumbing system is reduced enough to prevent the escape of magmatic
vapours to the crater lake and the atmosphere, as well as drain back of
degassed magma to deeper levels, or if magma intrusion rates increase
significantly. This has not occurred for over 100 years and given the potential for
highly explosive eruptions at Kawah Ijen, continued monitoring of the activity is
imperative.
The volatile elements S, Cl and F play a minor role in the degassing
budget of these two volcanoes due to substantially lower concentrations in the
magmas. However, the exsolution of these volatile species from the melt upon
ascent, degassing and evolution of magma has important consequences for both
the composition of the gas phase at the surface and any hydrothermal fluids at
depth. The relative concentration of these minor species as measured in the

222
surface gases can be used to track shallow magmatic processes and S is
especially important because its flux at the surface can measured, allowing
estimates of the total volatile flux to be made if combined with gas phase volatile
element ratios such as H2O/SO2 and CO2/SO2. Obtaining these volatile ratios in
the gas phase is not a trivial matter. Direct sampling of the gases emitted at the
surface is only possible at some volcanoes and under certain levels of volcanic
activity. Even then, there are issues which may lead to underestimates of the
total volatile flux (see below). Another approach, used in this study, is to combine
the melt inclusion data with theoretically- and experimentally-based models of
degassing (vapour-melt partitioning of volatiles), which can allow for the
magmatic gas phase to be estimated for different system conditions (e.g., style of
degassing, depth of degassing, magma composition).
At Kawah Ijen, magmatic fluid compositions are modeled for various initial
and final melt compositions and H2O-CO2 fluids fluxing the system using mass
balance equations. Model outputs are partition coefficients for S and Cl between
the melt and vapour phase at various pressures and for various melt
compositions. The model that generates the highest Dvap-melt values for S and Cl
and the most realistic magmatic fluid composition is a basaltic magma evolving to
a dacitic/rhyolitic magma with the system being fluxed with a fluid of composition
XH2O = 0.9 originating (at least in part) from deeper mafic magma. Comparison
of this model fluid with measured fumarole gas compositions suggests that the
surface vapours are relatively enriched in S compared to the model fluid.
Additionally, acid sulphate-chloride waters at Kawah Ijen are relatively depleted
223
in S and enriched in Cl and F compared to the model fluid composition. This
suggests that upon ascent and cooling of the magmatic fluid, unmixing into a S-
rich vapour and Cl- and F-rich acidic liquid occurs. Further cooling of the liquid
phase and mixing with air-saturated groundwater and diffuse magmatic gases
leads to the formation of highly acidic sulphate-chloride waters. The degassing
flux recorded at the surface of the dome (25 tonnes day-1 of SO2) suggests rapid
fluid rise rates within the shallow plumbing system beneath the dome, limiting
cooling and interaction with groundwater. As a result, the elevated S contents of
the magmatic fluid are mostly conserved until they are degassed at the surface
(and through the crater lake bottom).
The combination of initially elevated magmatic S contents (> 2000
ppm), highly efficient exsolution of S during the evolution of basaltic to
dacitic/rhyolitic magma and the limited scrubbing of fluid phase S by the
hydrothermal system beneath the dome contribute to making Kawah Ijen one of
the most productive active volcanic sulphur mines in the world.
6.3 Volatile Ratios in Volcanic Plumes and Effects of Cooling and Mixing with Air
The integration of various geochemical tools to sample and measure
volcanic gases (direct fumarole “Giggenbach” sampling, plume MultiGAS
sampling and FLYSPEC SO2 flux determinations) allows for a more complete
understanding of volcanic degassing at the surface and interactions with the
atmosphere. Through this approach, this study reveals the potential for large
underestimates in total SO2 flux emitted from open-vent degassing arc volcanoes

224
when S deposition and near-vent oxidation of S species are important factors.
High total S concentrations in the fumarole gases at Kawah Ijen lead to high
temperature precipitation of native S in the plume, which may enhance
heterogeneous oxidation of SO2 and H2S by atmosphere. This loss of SO2 in the
near-vent area results in disproportionately high H2O/SO2 and CO2/SO2 ratios
measured in the plume. This can have important consequences for our
understanding of the degassing process at depth. Furthermore, compared to
other open vent arc volcanoes, Kawah Ijen ranks as a small edifice yet a very
important S emitter not previously recognized due to significant S deposition and
degassing through its crater lake.
Evidence for either near-vent, high temperature conversion of S species
to aerosol compounds or high temperature S deposition at volcanoes needs to
be taken into account. These processes can lead to very large underestimates of
total gas and unerupted magma fluxes, which has important implications for
modeling of magmatic plumbing systems such as convective overturn of
degassed magma and storage / accommodation of unerupted magma in the mid-
to upper-crust.
6.4 Concluding Remarks
The comparison of Sierra Negra and Kawah Ijen volcanoes reveals that
differences in style of volcanic activity are primarily a function of magmatic
plumbing system as opposed to differences in initial volatile content. In both
cases, permeability of the crust and degassing style has exerted a dominant
control over the style of activity. Eruptions at Sierra Negra, as well as at other
225
large basaltic volcanoes, are not necessarily associated with magma recharge
into shallow reservoirs but can be caused by subtle changes in the pressure
regime of a magma chamber, a process which is closely associated with
degassing and crustal structure. Large explosive eruptions at Kawah Ijen are
impeded by the open system (permeable) flow of magma and gas through the
plumbing system. These results encourage more research into the link between
degassing and crustal structure.
Possible factors leading to a change in the permeability of a magmatic
system might include hydrothermal fluid interactions, emphasizing the need to
devote more attention to the study of hydrothermal – magmatic gas interactions.
Hydrothermal systems, when present, also play an important role in
controlling/buffering the composition of the gases measured at the surface. This
implies that measured gas compositions, routinely used as a monitoring tool,
need to be carefully analysed for the influence of the hydrothermal system. The
comparison of theoretically modeled gas compositions with actual measured
compositions at open vent volcanoes is an effective approach to this problem.
With continued study at a variety of volcanoes worldwide, we may find that
hydrothermal systems are nearly ubiquitous, with very few volcanoes emitting
gases that remain unaffected on-route to the surface. If surface gas compositions
are to be effectively used as a monitoring tool for volcanic activity, these
hydrothermal effects need to be better quantified.

226
APPENDICES
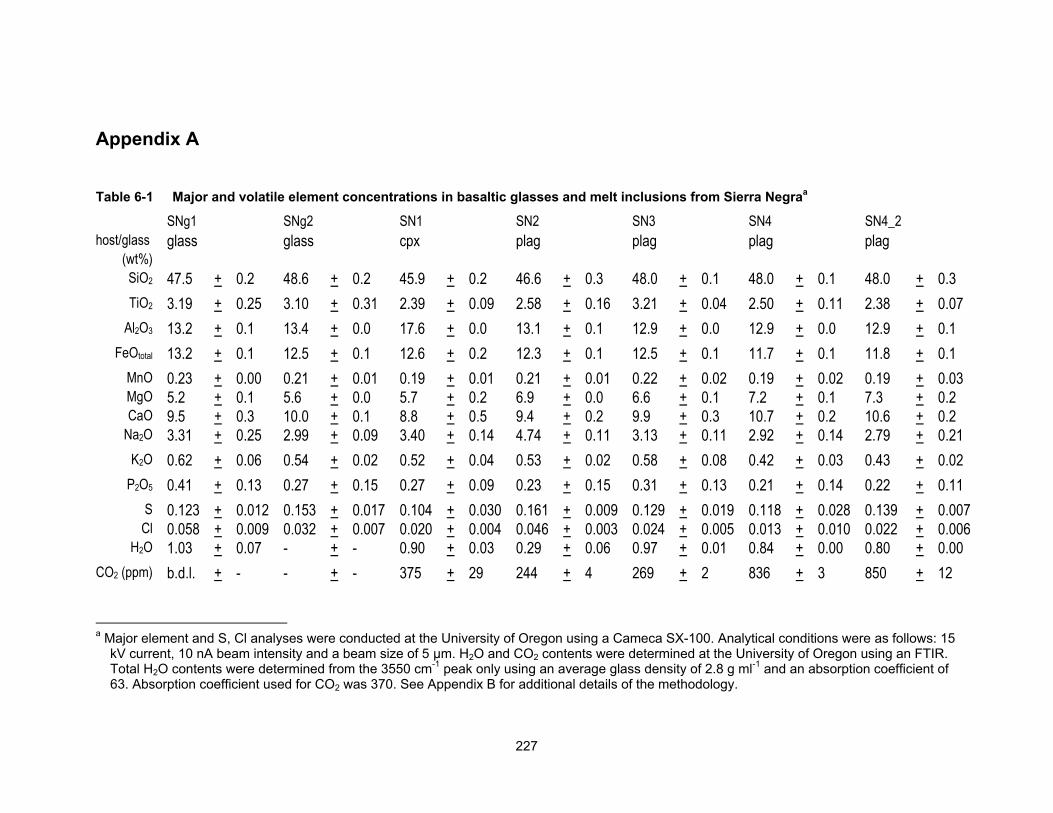
227
Appendix A
Table 6-1 Major and volatile element concentrations in basaltic glasses and melt inclusions from Sierra Negraa
SNg1 SNg2 SN1 SN2 SN3 SN4 SN4_2 host/glass glass glass cpx plag plag plag plag
(wt%) SiO2 47.5 + 0.2 48.6 + 0.2 45.9 + 0.2 46.6 + 0.3 48.0 + 0.1 48.0 + 0.1 48.0 + 0.3 TiO2 3.19 + 0.25 3.10 + 0.31 2.39 + 0.09 2.58 + 0.16 3.21 + 0.04 2.50 + 0.11 2.38 + 0.07 Al2O3 13.2 + 0.1 13.4 + 0.0 17.6 + 0.0 13.1 + 0.1 12.9 + 0.0 12.9 + 0.0 12.9 + 0.1 FeOtotal 13.2 + 0.1 12.5 + 0.1 12.6 + 0.2 12.3 + 0.1 12.5 + 0.1 11.7 + 0.1 11.8 + 0.1
MnO 0.23 + 0.00 0.21 + 0.01 0.19 + 0.01 0.21 + 0.01 0.22 + 0.02 0.19 + 0.02 0.19 + 0.03 MgO 5.2 + 0.1 5.6 + 0.0 5.7 + 0.2 6.9 + 0.0 6.6 + 0.1 7.2 + 0.1 7.3 + 0.2 CaO 9.5 + 0.3 10.0 + 0.1 8.8 + 0.5 9.4 + 0.2 9.9 + 0.3 10.7 + 0.2 10.6 + 0.2 Na2O 3.31 + 0.25 2.99 + 0.09 3.40 + 0.14 4.74 + 0.11 3.13 + 0.11 2.92 + 0.14 2.79 + 0.21 K2O 0.62 + 0.06 0.54 + 0.02 0.52 + 0.04 0.53 + 0.02 0.58 + 0.08 0.42 + 0.03 0.43 + 0.02 P2O5 0.41 + 0.13 0.27 + 0.15 0.27 + 0.09 0.23 + 0.15 0.31 + 0.13 0.21 + 0.14 0.22 + 0.11
S 0.123 + 0.012 0.153 + 0.017 0.104 + 0.030 0.161 + 0.009 0.129 + 0.019 0.118 + 0.028 0.139 + 0.007 Cl 0.058 + 0.009 0.032 + 0.007 0.020 + 0.004 0.046 + 0.003 0.024 + 0.005 0.013 + 0.010 0.022 + 0.006
H2O 1.03 + 0.07 - + - 0.90 + 0.03 0.29 + 0.06 0.97 + 0.01 0.84 + 0.00 0.80 + 0.00 CO2 (ppm) b.d.l. + - - + - 375 + 29 244 + 4 269 + 2 836 + 3 850 + 12
a Major element and S, Cl analyses were conducted at the University of Oregon using a Cameca SX-100. Analytical conditions were as follows: 15
kV current, 10 nA beam intensity and a beam size of 5 μm. H2O and CO2 contents were determined at the University of Oregon using an FTIR. Total H2O contents were determined from the 3550 cm-1 peak only using an average glass density of 2.8 g ml-1 and an absorption coefficient of 63. Absorption coefficient used for CO2 was 370. See Appendix B for additional details of the methodology.
228
Appendix B
Sample preparation
The scoria deposits from tephra layers TO and OT are well sorted and
overall clast size grades from ash to lapilli (Fig. 6-1). Texturally, the tephra
consists of dense to moderately versicular clasts, which are generally
subrounded to angular. The tephra contains abundant, loose crystals of olivine
up to 2 mm in length (Fig. 6-1), along with trace amounts of plagioclase (< 0.5
mm in length) both as loose crystals and within the scoria clasts. Rare
clinopyroxene is also present. Olivine crystals are fragmented with numerous
healed fractures and planes of secondary inclusions1. The olivine lack any
mineral inclusions (e.g., spinel) but contain abundant glassy primary melt
inclusions suitable for analysis. Some opaque (devitrified) and party crystallized
melt inclusions1 are also present (not analysed) and generally associated with
cracks running through the olivine. Most of the glassy melt inclusions contain a
small shrinkage bubble formed upon cooling and contraction of the melt (Fig. 6-
1). A few melt inclusions contain larger (> 20 vol%) vapour bubbles (not
analysed), suggesting that the magma was vapour saturated during melt
inclusion entrapment. These two-phase inclusions are best described as “mixed”
inclusions (Lowenstern, 1995). Details of the morphologies, dimensions and
1 Secondary inclusions are defined as occurring along a healed fracture plane once the crystal
has stopped growing from a silicate melt (Roedder, 1984; Lowenstern, 1995). They may consist of fluid, melt, or a mixture of two or more phases. These were too small to characterize. Primary inclusions are defined as occurring during crystal growth (Lowenstern, 1995) and generally occur in “random” distribution within a crystal (Roedder, 1984).
229
other characteristics of the melt inclusions analysed in this study are given in
Figure 6-1 and Table 6-2.
Olivine crystals were hand-picked from tephra samples (~ 250 crystals)
and viewed under the microscope in immersion oil with an index of refraction of
1.675 in order to select melt inclusions for analysis. Crystals with suitable melt
inclusions (< 10% of olivine crystals observed) were ground and polished into
wafers with the melt inclusion doubly intersected. Final wafer thickness varied
from 15 to 90 µm.
Infrared spectroscopy
Transmission spectra were collected in the range 650 to 6000 cm-1, and
for most melt inclusions, absorbance at ~3550 cm-1, corresponding to the
fundamental O-H stretching vibration, was used to obtain total water content. For
inclusions which saturated at the 3550 cm-1 band, the combination of the
molecular H2O and hydroxyl (OH-T; T=Si, Al, etc.;) stretching and bending
modes at ~5200 cm-1 and ~4500 cm-1 respectively, was used. Absorbance peak
heights were measured after fitting a straight line background for the 3500 cm-1
peak and a curved background for the 4500 and 5200 cm-1 peaks. The curved
background in the region of 3700-6000 cm-1 is a result of a broad peak centered
around 5500-5700 cm-1 corresponding to crystal-field transitions of Fe2+, as well
as influence from a small water-related band at ~4000 cm-1 (Stolper, 1982). To fit
this curved background, two Gaussian curves, one centered around 5600 cm-1
and the other around 4000 cm-1, were fit following the method of Ohlhorst et al.
(2001).
230
Dissolved carbonate (CO32-) was measured from the absorbance value of
the bands at 1430 and 1515 cm-1, which correspond to antisymmetric stretching
of distorted carbonate groups (Dixon et al., 1995). Due to the complex shape of
the background in the region of the carbonate doublet, it is necessary to subtract
a carbonate-free reference spectrum to obtain a flat background. A peak-fitting
program that fits the sample spectrum with a straight line, a devolatilized
spectrum, a pure 1630 cm-1 band for molecular H2O, and a pure carbonate
doublet was used (unpublished program by S. Newman).
Absorbances were converted to concentrations using the Beer-Lambert
law. Glass densities were calculated at room temperature using the method
described by Luhr (2001) and range from 2.60 to 2.75 g ml-1. For the ~3550 cm-1
band, an absorption coefficient (ε) value of 63 L mol-1 cm -1 (standard for basalts)
was used (Dixon et al., 1995). Absorption coefficients for the 4500 and 5200 cm-1
peaks are from Yamashita et al. (1997) for a high-Al basalt similar in composition
to the Ijen basalts. Total H2O values obtained from the 3550 cm-1 band and the
4500 and 5200 cm-1 bands are within 0.4 wt% of each other on average.
Absorption coefficients for the carbonate doublet were calculated for each melt
inclusion using the equation of Dixon & Pan (1995) and the uncorrected melt
inclusion Na and Ca molar concentrations. Values range from 331 to 383 L mol-1
cm -1.
The thickness of each inclusion was obtained via two methods. The first
was to collect a reflectance spectrum of the olivine crystal next to the inclusion
and following the method described by Nichols & Wysoczanski (2007), convert
231
the spacing of the interference fringes to wafer thickness. The refractive index of
each crystal was obtained from the composition (forsterite content) of the olivine.
The second method involved mounting the edge of the crystal on the tip of
a needle using crystal bond. The crystal was then immersed into a glass holder
filled with refractive index oil (n =1.67). The wafer could then be rotated so that its
width was perpendicular to the field of view of the microscope. Using the
calibrated microscope ocular, the thickness of the inclusion was measured with
an average accuracy of +5 μm. The two techniques agree within 30 % of each
other on average. We found a much lower standard deviation using the
reflectance method (multiple olivine reflectance spectrum collected around the
melt inclusion) and used those preferred measurements when possible.
Electron microprobe
Olivine major element composition was analysed using a focused beam,
15 kV and a 30 nA current. On-peak counting times were > 60 s for all elements
analysed. Beam conditions for melt inclusion major element and volatile (S, Cl, F)
analysis were: 15 kV, 10 nA current for all elements except for Ti, P, S, Cl and F,
for which a 50 nA current and a 10 µm diameter beam were used. On-peak
counting times for the melt inclusions were as follows: 60 s for Fe; 40 s for Na, K
and Al; 30 s for Si and Mg; 20 s for Ti, Ca, P, S, Cl and F. Sulphur peak position
was set to a wavenumber corresponding to 2/3 of the wavelength distance
between pyrite and anhydrite based on detailed determination of the S peak
position of the glasses (see below). The glass standards BIR-16 and NBS K-412
232
were run as unknown samples, and analysed versus published compositions
(Appendix B Table 6-2).
S Kα peak positions were determined by performing detailed wavescans
on all five spectrometers with a beam voltage of 15 kV, current of 50 nA and a 5
µm beam diameter. Anhydrite, pyrite and pyrrhotite standards were analysed at
the beginning and end of each melt inclusion wavescan. The standard
wavescans were performed by counting 10 s per step for 100 steps, each step
representing a shift of 5 wavenumbers. The melt inclusions were analysed for 60
s per step for 100 steps. The beam was moved 1 µm every minute to minimize
the effects of auto-oxidation or reduction (Rowe et al., 2007; Jugo et al., 2007). A
Gaussian curve was fitted to each spectra to obtain the peak position.
References
Dixon, J.E., Pan, V., 1995. Determination of the molar absorptivity of dissolved carbonate in basanitic glass. Am. Mineral. 80 (11-12), 1339-1342.
Dixon, J.E., Stolper, E.M., Holloway, J.R., 1995. An experimental study of water and carbon dioxide solubilities in mid-ocean ridge basaltic liquids. Part I: Calibration and solubility models. J. Petrol. 36 (6), 1607-1631.
Jugo, P. J., Wilke, M., Susini, J., 2007. Disequilibrium experiments and micro-XANES analysis: Novel tools to unravel the speciation of sulfur in silicate melts. Eos Trans. AGU 88 (52) Fall Meet. Suppl. Abstract V22B-04.
Luhr, J.F. 2001. Glass inclusions and melt volatile contents at Parícutin Volcano, Mexico. Contrib. Mineral. Petrol. 142 (3), 261-283.
Lowenstern, J.B., 1995. Applications of silicate melt inclusions to the study of magmatic volatiles. In: J.F.H. Thompson (ed). Magmas, Fluids and Ore Deposits. Mineralogical Association of Canada Short Course 23, 71-99.
Nichols, A.R.L., Wysoczanski, R.J., 2007. Using micro-FTIR spectroscopy to measure volatile contents in small and unexposed inclusions hosted in olivine crystals. Chem. Geol. 242 (3), 371-384.

233
Ohlhorst, S., Behrens, H., Holtz, F., 2001. Compositional dependence of molar absorptivities of near-infrared OH-and H2O bands in rhyolitic to basaltic glasses. Chem. Geol. 174 (1-3), 5-20.
Roedder, E., 1984. Fluid inclusions: Reviews in Mineralogy vol. 12, Mineral Society of America.
Rowe, M.C., Kent, A.J.R., Nielsen, R.L., 2007. Determination of sulfur speciation and oxidation state of olivine hosted melt inclusions. Chem. Geol. 236 (3-4), 303-322.
Stolper, E. 1982. Water in silicate glasses: An infrared spectroscopic study. Contrib. Mineral. Petrol. 81 (1), 1-17.
Yamashita, S., Kitamura, T., Kusakabe, M., 1997. Infrared spectroscopy of hydrous glasses of arc magma compositions. Geochem. J. 31 (3), 169–174.
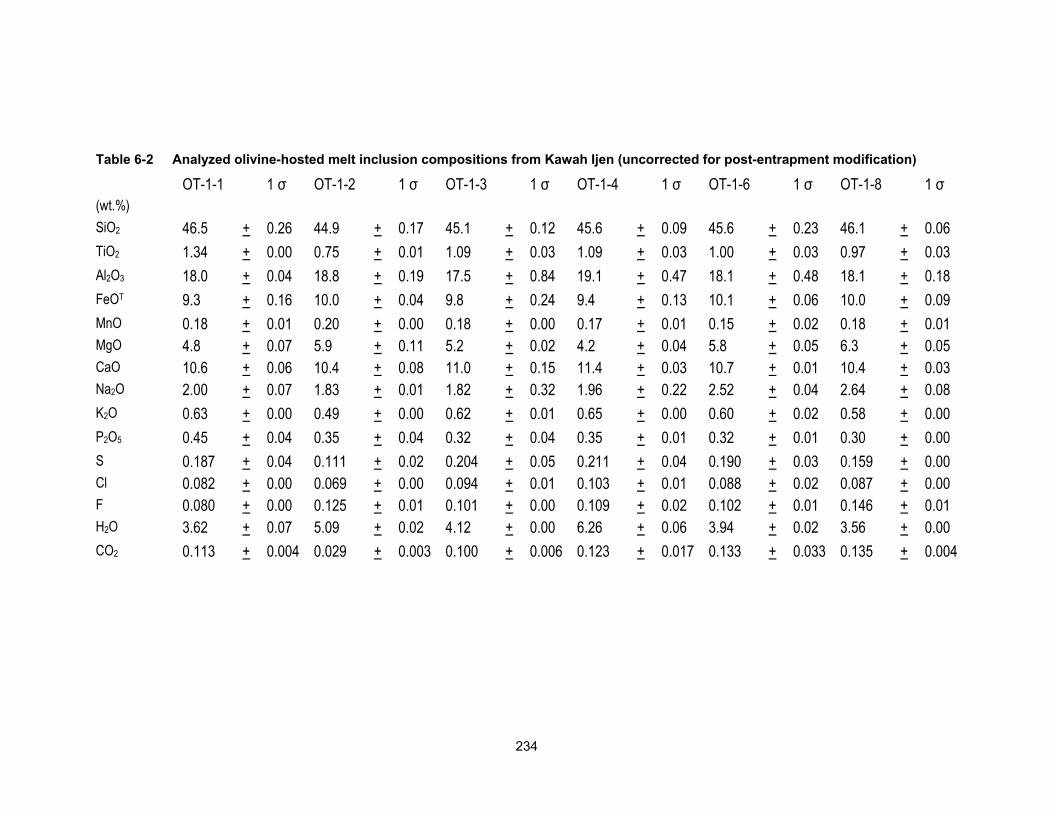
234
Table 6-2 Analyzed olivine-hosted melt inclusion compositions from Kawah Ijen (uncorrected for post-entrapment modification)
OT-1-1 1 σ OT-1-2 1 σ OT-1-3 1 σ OT-1-4 1 σ OT-1-6 1 σ OT-1-8 1 σ (wt.%) SiO2 46.5 + 0.26 44.9 + 0.17 45.1 + 0.12 45.6 + 0.09 45.6 + 0.23 46.1 + 0.06 TiO2 1.34 + 0.00 0.75 + 0.01 1.09 + 0.03 1.09 + 0.03 1.00 + 0.03 0.97 + 0.03 Al2O3 18.0 + 0.04 18.8 + 0.19 17.5 + 0.84 19.1 + 0.47 18.1 + 0.48 18.1 + 0.18 FeOT 9.3 + 0.16 10.0 + 0.04 9.8 + 0.24 9.4 + 0.13 10.1 + 0.06 10.0 + 0.09 MnO 0.18 + 0.01 0.20 + 0.00 0.18 + 0.00 0.17 + 0.01 0.15 + 0.02 0.18 + 0.01 MgO 4.8 + 0.07 5.9 + 0.11 5.2 + 0.02 4.2 + 0.04 5.8 + 0.05 6.3 + 0.05 CaO 10.6 + 0.06 10.4 + 0.08 11.0 + 0.15 11.4 + 0.03 10.7 + 0.01 10.4 + 0.03 Na2O 2.00 + 0.07 1.83 + 0.01 1.82 + 0.32 1.96 + 0.22 2.52 + 0.04 2.64 + 0.08 K2O 0.63 + 0.00 0.49 + 0.00 0.62 + 0.01 0.65 + 0.00 0.60 + 0.02 0.58 + 0.00 P2O5 0.45 + 0.04 0.35 + 0.04 0.32 + 0.04 0.35 + 0.01 0.32 + 0.01 0.30 + 0.00 S 0.187 + 0.04 0.111 + 0.02 0.204 + 0.05 0.211 + 0.04 0.190 + 0.03 0.159 + 0.00 Cl 0.082 + 0.00 0.069 + 0.00 0.094 + 0.01 0.103 + 0.01 0.088 + 0.02 0.087 + 0.00 F 0.080 + 0.00 0.125 + 0.01 0.101 + 0.00 0.109 + 0.02 0.102 + 0.01 0.146 + 0.01 H2O 3.62 + 0.07 5.09 + 0.02 4.12 + 0.00 6.26 + 0.06 3.94 + 0.02 3.56 + 0.00 CO2 0.113 + 0.004 0.029 + 0.003 0.100 + 0.006 0.123 + 0.017 0.133 + 0.033 0.135 + 0.004
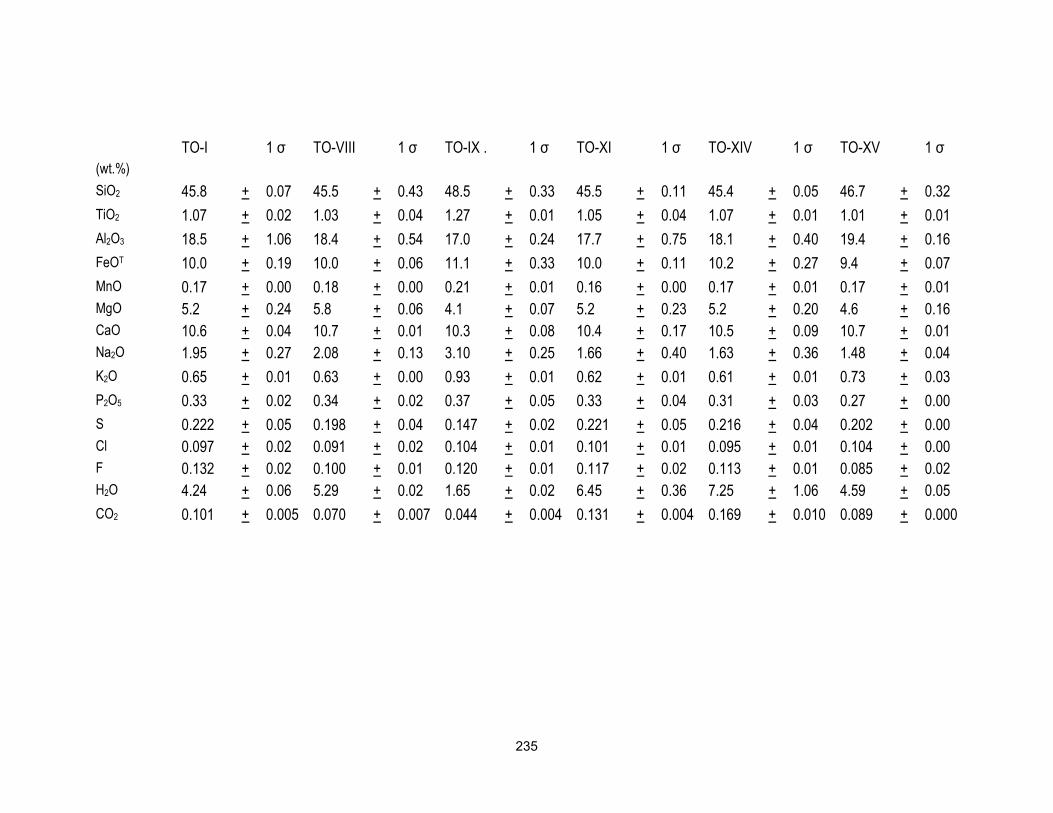
235
TO-I 1 σ TO-VIII 1 σ TO-IX . 1 σ TO-XI 1 σ TO-XIV 1 σ TO-XV 1 σ (wt.%) SiO2 45.8 + 0.07 45.5 + 0.43 48.5 + 0.33 45.5 + 0.11 45.4 + 0.05 46.7 + 0.32 TiO2 1.07 + 0.02 1.03 + 0.04 1.27 + 0.01 1.05 + 0.04 1.07 + 0.01 1.01 + 0.01 Al2O3 18.5 + 1.06 18.4 + 0.54 17.0 + 0.24 17.7 + 0.75 18.1 + 0.40 19.4 + 0.16 FeOT 10.0 + 0.19 10.0 + 0.06 11.1 + 0.33 10.0 + 0.11 10.2 + 0.27 9.4 + 0.07 MnO 0.17 + 0.00 0.18 + 0.00 0.21 + 0.01 0.16 + 0.00 0.17 + 0.01 0.17 + 0.01 MgO 5.2 + 0.24 5.8 + 0.06 4.1 + 0.07 5.2 + 0.23 5.2 + 0.20 4.6 + 0.16 CaO 10.6 + 0.04 10.7 + 0.01 10.3 + 0.08 10.4 + 0.17 10.5 + 0.09 10.7 + 0.01 Na2O 1.95 + 0.27 2.08 + 0.13 3.10 + 0.25 1.66 + 0.40 1.63 + 0.36 1.48 + 0.04 K2O 0.65 + 0.01 0.63 + 0.00 0.93 + 0.01 0.62 + 0.01 0.61 + 0.01 0.73 + 0.03 P2O5 0.33 + 0.02 0.34 + 0.02 0.37 + 0.05 0.33 + 0.04 0.31 + 0.03 0.27 + 0.00 S 0.222 + 0.05 0.198 + 0.04 0.147 + 0.02 0.221 + 0.05 0.216 + 0.04 0.202 + 0.00 Cl 0.097 + 0.02 0.091 + 0.02 0.104 + 0.01 0.101 + 0.01 0.095 + 0.01 0.104 + 0.00 F 0.132 + 0.02 0.100 + 0.01 0.120 + 0.01 0.117 + 0.02 0.113 + 0.01 0.085 + 0.02 H2O 4.24 + 0.06 5.29 + 0.02 1.65 + 0.02 6.45 + 0.36 7.25 + 1.06 4.59 + 0.05 CO2 0.101 + 0.005 0.070 + 0.007 0.044 + 0.004 0.131 + 0.004 0.169 + 0.010 0.089 + 0.000

236
TO-XVI 1 σ TO-XVII 1 σ TO-XVIII 1 σ TO-XIX 1 σ TO-XX 1 σ TO-XXII 1 σ (wt.%) SiO2 44.6 + 0.32 45.7 + 0.14 47.3 + 0.06 45.3 + 0.11 44.9 + 0.04 44.5 + 0.23 TiO2 1.00 + 0.04 1.01 + 0.01 1.25 + 0.05 1.06 + 0.02 1.02 + 0.07 1.03 + 0.00 Al2O3 18.3 + 0.00 19.4 + 0.07 19.5 + 0.07 19.2 + 0.21 18.8 + 0.01 19.3 + 0.18 FeOT 10.1 + 0.42 9.5 + 0.39 8.6 + 0.07 9.9 + 0.24 9.6 + 0.13 10.2 + 0.06 MnO 0.19 + 0.00 0.17 + 0.01 0.15 + 0.02 0.18 + 0.00 0.17 + 0.00 0.17 + 0.01 MgO 6.6 + 0.02 4.8 + 0.19 3.7 + 0.03 5.5 + 0.03 6.6 + 0.06 5.4 + 0.15 CaO 10.7 + 0.00 10.8 + 0.03 12.2 + 1.24 10.7 + 0.01 10.5 + 0.05 11.2 + 1.16 Na2O 1.69 + 0.04 1.50 + 0.17 3.61 + 0.01 1.64 + 0.06 1.60 + 0.07 1.77 + 0.66 K2O 0.56 + 0.03 0.66 + 0.01 0.83 + 0.00 0.62 + 0.01 0.56 + 0.01 0.57 + 0.00 P2O5 0.24 + 0.01 0.28 + 0.00 0.34 + 0.00 0.26 + 0.00 0.26 + 0.00 0.26 + 0.00 S 0.200 + 0.00 0.205 + 0.00 0.212 + 0.00 0.215 + 0.00 0.205 + 0.00 0.218 + 0.01 Cl 0.099 + 0.00 0.106 + 0.01 0.129 + 0.00 0.107 + 0.00 0.100 + 0.00 0.103 + 0.00 F 0.100 + 0.01 0.101 + 0.03 0.129 + 0.04 0.146 + 0.03 0.151 + 0.01 0.140 + 0.03 H2O 4.62 + 0.03 3.92 + 0.00 0.23 + 0.00 4.04 + 0.00 4.91 + 0.02 3.55 + 0.11 CO2 0.074 + 0.001 0.133 + 0.003 0.038 + 0.016 0.089 + 0.002 0.131 + 0.006 0.102 + 0.003
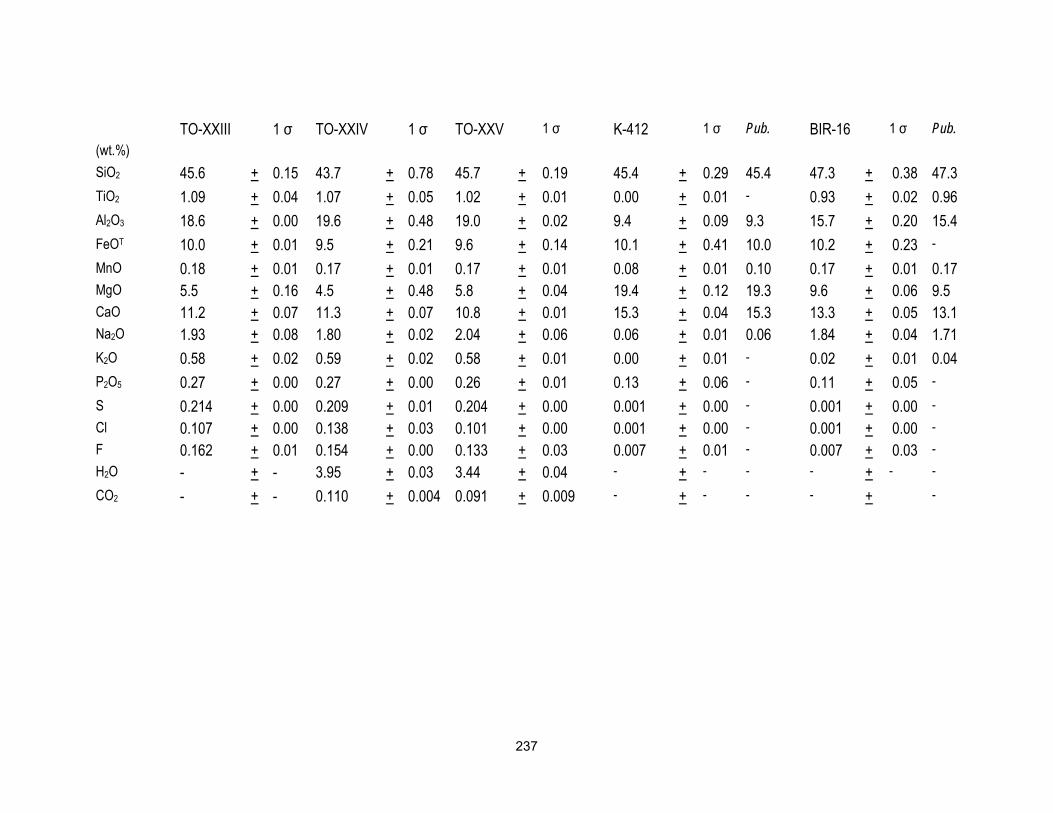
237
TO-XXIII 1 σ TO-XXIV 1 σ TO-XXV 1 σ K-412 1 σ Pub. BIR-16 1 σ Pub. (wt.%) SiO2 45.6 + 0.15 43.7 + 0.78 45.7 + 0.19 45.4 + 0.29 45.4 47.3 + 0.38 47.3 TiO2 1.09 + 0.04 1.07 + 0.05 1.02 + 0.01 0.00 + 0.01 - 0.93 + 0.02 0.96 Al2O3 18.6 + 0.00 19.6 + 0.48 19.0 + 0.02 9.4 + 0.09 9.3 15.7 + 0.20 15.4 FeOT 10.0 + 0.01 9.5 + 0.21 9.6 + 0.14 10.1 + 0.41 10.0 10.2 + 0.23 -
MnO 0.18 + 0.01 0.17 + 0.01 0.17 + 0.01 0.08 + 0.01 0.10 0.17 + 0.01 0.17 MgO 5.5 + 0.16 4.5 + 0.48 5.8 + 0.04 19.4 + 0.12 19.3 9.6 + 0.06 9.5 CaO 11.2 + 0.07 11.3 + 0.07 10.8 + 0.01 15.3 + 0.04 15.3 13.3 + 0.05 13.1 Na2O 1.93 + 0.08 1.80 + 0.02 2.04 + 0.06 0.06 + 0.01 0.06 1.84 + 0.04 1.71 K2O 0.58 + 0.02 0.59 + 0.02 0.58 + 0.01 0.00 + 0.01 - 0.02 + 0.01 0.04 P2O5 0.27 + 0.00 0.27 + 0.00 0.26 + 0.01 0.13 + 0.06 - 0.11 + 0.05 -
S 0.214 + 0.00 0.209 + 0.01 0.204 + 0.00 0.001 + 0.00 - 0.001 + 0.00 - Cl 0.107 + 0.00 0.138 + 0.03 0.101 + 0.00 0.001 + 0.00 - 0.001 + 0.00 - F 0.162 + 0.01 0.154 + 0.00 0.133 + 0.03 0.007 + 0.01 - 0.007 + 0.03 - H2O - + - 3.95 + 0.03 3.44 + 0.04 - + - - - + - -
CO2 - + - 0.110 + 0.004 0.091 + 0.009 - + - - - + -

238
OT-1-1 OT-1-2 OT-1-3 OT-1-4 OT-1-6 OT-1-8 TO-I TO-VIII TO-IX . TO-XI TO-XIV TO-XV TO-XVI (ppm) Rb 9.24 7.60 10.48 12.42 9.98 8.05 11.42 12.08 18.61 9.71 10.17 12.66 8.60 Ba 214 146 215 209 198 200 192 216 281 195 192 209 172 Th 0.86 0.87 0.87 1.09 1.09 0.72 1.07 1.10 1.97 0.91 0.95 1.43 0.90 U 0.22 0.14 0.23 0.19 0.28 0.21 0.32 0.36 0.56 0.27 0.25 0.48 0.18 Nb 2.02 1.36 2.58 2.05 2.19 1.95 2.45 2.45 3.15 2.07 1.92 2.57 1.79 Ta 0.07 0.04 0.14 0.07 0.13 0.11 0.10 0.04 0.22 0.07 0.06 0.12 bdl La 8.64 6.15 8.20 7.72 7.21 6.19 7.99 8.21 11.75 8.30 8.65 9.27 6.55 Pb 4.39 2.81 3.87 4.12 3.43 3.50 3.78 4.76 6.74 4.04 4.50 4.43 4.06 Ce 20.66 14.20 19.28 22.67 19.15 18.02 20.90 23.11 28.85 20.76 19.97 20.94 16.21 Sr 576 573 531 568 527 532 510 549 517 544 536 518 466 Pr 2.86 1.97 2.54 2.63 2.62 2.14 2.76 2.74 3.64 2.68 2.48 2.60 1.94 Nd 13.38 8.31 11.54 12.38 10.23 9.08 11.91 10.62 17.05 12.90 13.12 12.14 9.45 Zr 38 28 40 36 35 30 45 35 59 37 37 46 31 Hf 0.67 0.92 0.97 1.11 1.23 0.90 1.12 1.26 1.63 1.20 1.06 0.98 1.12 Sm 3.09 2.20 2.87 3.02 2.98 2.74 3.18 2.53 3.80 2.70 3.14 3.18 1.79 Eu 1.34 0.77 1.05 1.21 1.04 0.91 1.20 1.23 1.36 1.07 1.01 1.09 0.88 Gd 2.69 1.97 3.57 3.39 3.01 2.34 3.44 1.88 3.61 2.77 2.23 2.70 1.38 Ti 8574 4735 7185 6563 5972 6146 6135 6487 8041 6351 6619 6063 6016 Dy 2.95 1.87 2.62 2.71 2.75 2.34 3.12 2.42 3.56 2.96 2.92 2.38 2.22 Li 7.53 7.76 6.83 8.09 6.34 6.68 7.78 6.68 13.00 6.88 7.93 6.67 7.21 Y 15.05 11.39 15.08 13.26 14.01 12.59 17.48 12.34 18.25 13.49 14.72 15.16 13.29 Yb 1.02 1.17 1.48 1.23 1.36 1.32 1.69 1.62 2.53 1.47 1.08 1.45 1.32

239
TO-XVII TO-XVIII 1 σ TO-XIX TO-XX TO-XXII TO-XXIII TO-XXIV TO-XXV BHVO-2G Pub. (ppm) Rb 12.11 10.75 + 0.00 9.26 8.25 8.51 9.85 8.05 9.78 8.93 + 0.55 9.20 + 0.04 Ba 192 203 + 3 176 171 161 185 169 171 124 + 1 131 + 2 Th 1.28 1.07 + 0.33 1.06 0.99 1.05 0.89 0.76 0.92 1.22 + 0.04 1.22 + 0.05 U 0.34 0.31 + 0.00 0.24 0.17 0.25 0.27 0.18 0.23 0.45 + 0.06 0.40 + 0.00 Nb 2.25 2.01 + 0.11 1.85 1.66 1.73 1.91 1.77 1.73 15.84 + 0.32 18.30 + 0.80 Ta 0.07 bdl + - 0.09 bdl 0.08 0.13 0.07 bdl 0.97 + 0.01 1.15 + 0.10 La 8.39 9.11 + 0.08 8.11 7.69 7.98 7.61 7.16 7.36 14.12 + 0.17 15.20 + 0.20 Pb 4.02 4.25 + 0.29 3.56 3.51 3.56 4.20 4.42 3.84 1.78 + 0.38 1.70 + 0.20 Ce 20.03 20.52 + 1.34 16.95 16.79 17.35 19.86 18.90 18.78 35.71 + 0.54 37.60 + 0.20 Sr 522 591 + 15 503 488 487 510 503 488 375 + 5 396 + 1 Pr 2.38 2.76 + 0.21 2.49 2.07 2.13 2.51 2.38 2.63 4.95 + 0.20 5.35 + 0.22 Nd 12.09 14.11 + 1.37 10.07 11.73 11.13 12.15 11.17 8.57 24.11 + 0.64 24.50 + 0.20 Zr 40 49 + 1 40 39 36 37 32 34 151 + 4 170 + 7 Hf 1.02 1.22 + 0.28 1.04 1.08 1.21 0.97 1.09 0.99 3.65 + 0.20 4.32 + 0.18 Sm 3.22 2.68 + 0.16 2.95 2.54 3.51 3.27 2.78 2.62 5.16 + 0.02 6.10 + 0.03 Eu 0.93 1.29 + 0.38 0.96 1.03 0.95 1.20 0.92 1.06 1.85 + 0.13 2.07 + 0.01 Gd 1.99 3.41 + 0.42 2.99 2.38 2.42 2.48 2.59 1.67 5.33 + 0.47 6.16 + 0.05 Ti 6205 6688 + 197 6037 5959 5895 6226 6160 5964 15971 + 135 16300 + 900 Dy 2.23 2.71 + 0.11 3.17 2.39 2.49 2.40 2.61 2.64 4.47 + 0.29 5.28 + 0.05 Li 7.85 6.71 + 3.03 4.90 6.02 5.69 7.99 7.05 7.78 4.62 + 0.47 4.40 + 0.80 Y 13.71 17.79 + 1.67 14.80 14.93 15.70 13.47 13.54 13.45 21.41 + 0.71 26.00 + 2.00 Yb 1.49 2.03 + 0.48 1.24 1.34 1.36 1.11 1.34 1.41 1.63 + 0.22 2.01 + 0.02

240
Table 6-3 Description of melt inclusions analysed from Kawah Ijen
Sample Shape Type Texture Crystalsa Length (μm) Width (μm) Thick. min. (μm)b Errorc Thick. max. (μm)d OT-1-1 Sphere primary glassy none 94 92 90 0.7 92 OT-1-2 Negative primary glassy opaque 135 115 30 5 115 OT-1-3 Ellipsoid - Negative primary glassy opaque 125 85 39 9 85 OT-1-4 Ellipsoid - Negative primary glassy opaque 135 123 30 5 123 OT-1-6 Sphere-Negative primary glassy none 192 185 15 0.7 185 OT-1-8 Irregular primary glassy opaque 230 230 40 0.7 230 TO-I Sphere primary glassy none 80 60 60 0.7 60 TO-VIII Sphere primary glassy none 100 90 40 28 90 TO-IX . Irregular embayment glassy none - - 80 28 - TO-XI Sphere primary glassy daughter 125 110 65 5 110 TO-XIV Ellipsoid primary glassy none 160 100 77 2.8 100 TO-XV Negative primary glassy none 200 140 50 0.7 140 TO-XVI Ellipsoid primary glassy none 280 220 31 0.7 220 TO-XVII Negative primary glassy none 140 120 49 0.7 120 TO-XVIII Ellipsoid - Negative primary glassy none 110 90 46 1.4 90 TO-XIX Ellipsoid - Negative primary glassy none 120 100 58 0 100 TO-XX Ellipsoid primary glassy quench 200 160 44 0 160 TO-XXII Ellipsoid primary glassy none 130 90 36 0.7 90 TO-XXIII Negative primary glassy opaque 200 180 - - 180 TO-XXIV Negative primary glassy opaque 140 90 40 0 90 TO-XXV Ellipsoid primary glassy daughter 105 70 42 0 70 a Visible daughter or quench crystals b Thickness of inclusion ground down for FTIR. Thickness determined either via the olivine reflectance method and/or the optical needle technique. c Either the standard deviation between the needle and spectra techniques, between two repeat spectra or the standard error for the needle technique. d Thickness of inclusion assuming equal length b and c axes of ellipsoid/negative crystal shape.
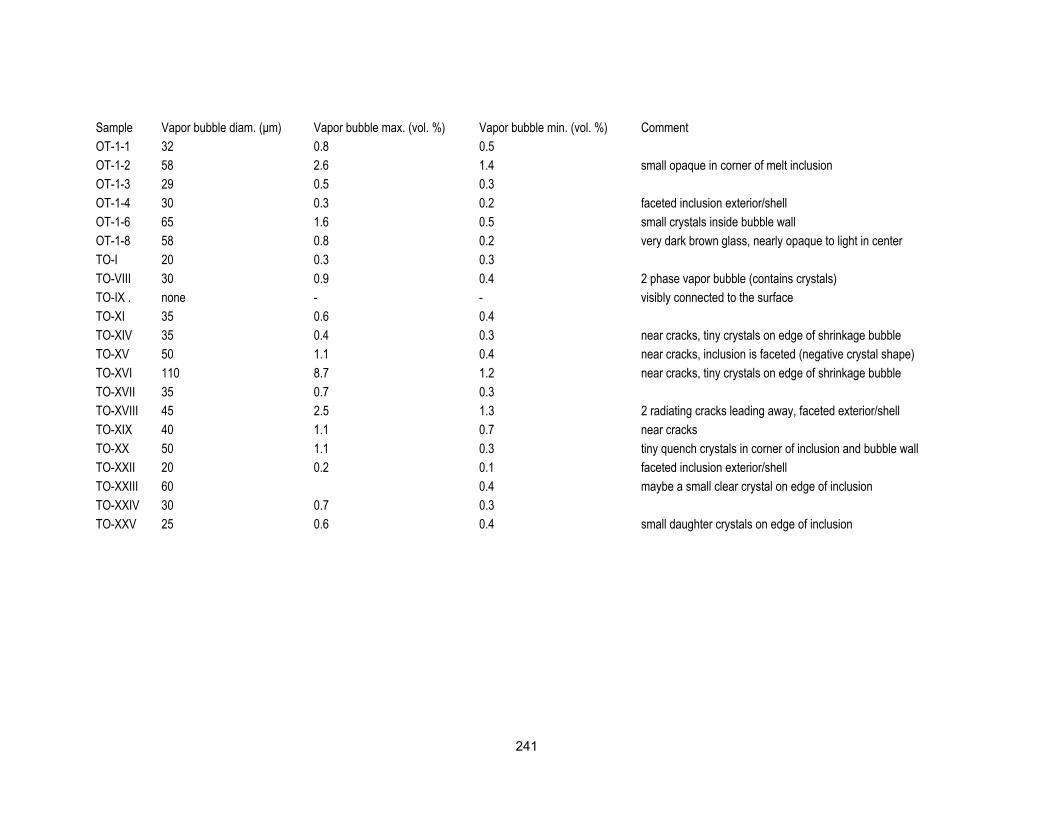
241
Sample Vapor bubble diam. (μm) Vapor bubble max. (vol. %) Vapor bubble min. (vol. %) Comment OT-1-1 32 0.8 0.5 OT-1-2 58 2.6 1.4 small opaque in corner of melt inclusion OT-1-3 29 0.5 0.3 OT-1-4 30 0.3 0.2 faceted inclusion exterior/shell OT-1-6 65 1.6 0.5 small crystals inside bubble wall OT-1-8 58 0.8 0.2 very dark brown glass, nearly opaque to light in center TO-I 20 0.3 0.3 TO-VIII 30 0.9 0.4 2 phase vapor bubble (contains crystals) TO-IX . none - - visibly connected to the surface TO-XI 35 0.6 0.4 TO-XIV 35 0.4 0.3 near cracks, tiny crystals on edge of shrinkage bubble TO-XV 50 1.1 0.4 near cracks, inclusion is faceted (negative crystal shape) TO-XVI 110 8.7 1.2 near cracks, tiny crystals on edge of shrinkage bubble TO-XVII 35 0.7 0.3 TO-XVIII 45 2.5 1.3 2 radiating cracks leading away, faceted exterior/shell TO-XIX 40 1.1 0.7 near cracks TO-XX 50 1.1 0.3 tiny quench crystals in corner of inclusion and bubble wall TO-XXII 20 0.2 0.1 faceted inclusion exterior/shell TO-XXIII 60 0.4 maybe a small clear crystal on edge of inclusion TO-XXIV 30 0.7 0.3 TO-XXV 25 0.6 0.4 small daughter crystals on edge of inclusion

242
Figure 6-1 Microphotographs of a) tephra, b-c) olivine crystals and d-f) melt inclusions from sample layers OT and TO at Kawah Ijen. Crack running through melt inclusion in e) was produced during the grinding process to expose the melt inclusion. Melt inclusion f) is an embayed melt inclusion, connected to the surrounding groundmass.
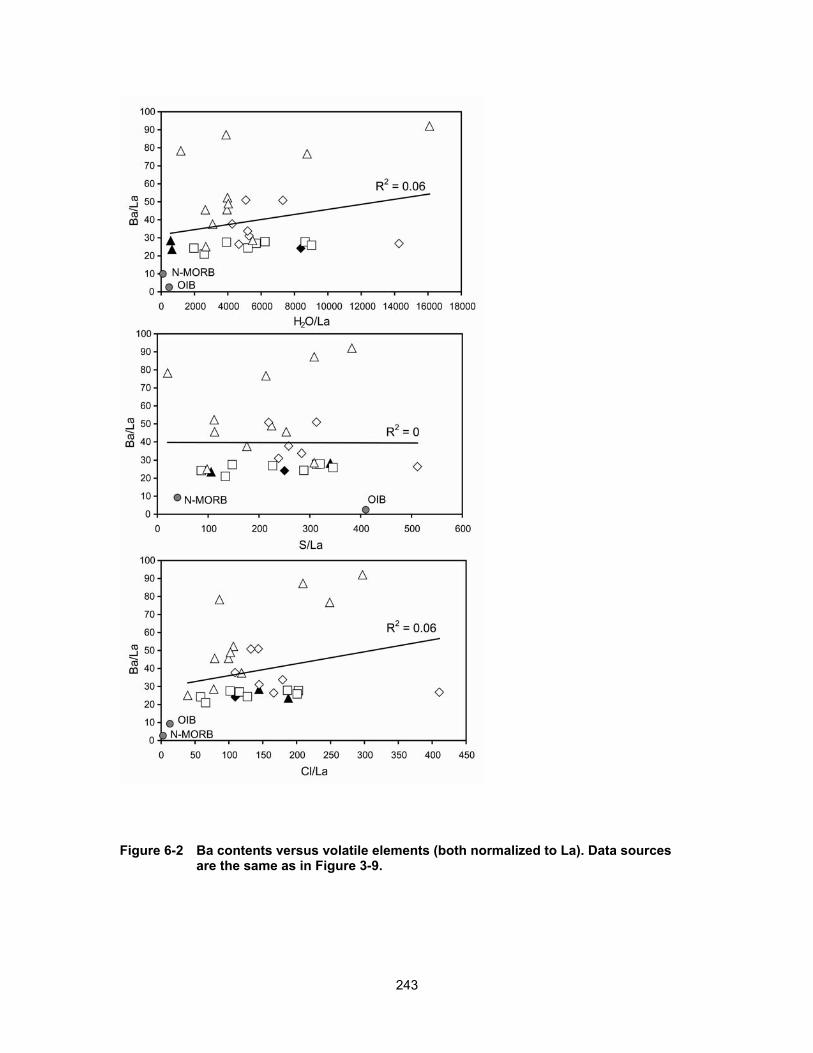
243
Figure 6-2 Ba contents versus volatile elements (both normalized to La). Data sources are the same as in Figure 3-9.

244
Appendix C
Modeling procedure for Dvap-melt values
The following details of the degassing modeling are modified slightly from
Johnson et al. (2010). The modeling procedure is described for S, Cl or F
degassing although F was not modeled due to the presence of F-rich apatite in
the Kawah Ijen magmas (Chapter 4).
The melt inclusion data is used to calculate apparent vapour-melt
distribution coefficients during degassing according to both open- and closed-
system degassing models, as described below. The approach is generally
similar to that of Spilliaert et al. (2006). In all calculations, the bulk distribution
coefficient, Di (where i = S, Cl or F) is defined as:
Di = ∑ WADiA = WxtlDi
xtl−melt + WvapDivap−melt
(1)
where WA is the weight fraction of phase A (where A = crystals or vapour) in the
assemblage of crystals and vapour that form by crystallization and degassing,
and Dixtl−melt
and Divap−melt
are the distribution coefficients of element i in the
crystals and vapour, respectively. We further assume that no S, Cl or F goes into
any crystallizing phases, and therefore equation 1 simplifies to:
Di = WvapDivap−melt
(2)
Open-system degassing
We use the Rayleigh fractionation equation:
Cif
Cii = F (D i −1) (3)
where Cii and Ci
f are the initial and final concentrations of element i,
245
F = Xmelt = 1 – Xxtl – Xvap = CiK2O/Cf
K2O (4)
(X represents the mass fractions of crystals and vapour at the end of
crystallization relative to an initial condition of 100% melt), and
Wxtl =Xxtl
Xxtl + Xvap (5a)
Wvap =Xvap
Xxtl + Xvap (5b)
Note that use of the Rayleigh fractionation equation requires the bulk distribution
coefficient to be constant during the crystallization and vapour exsolution interval
considered. According to equations 5a and 5b, this condition will be met if the
relative proportions of vapour and crystals formed remain constant and the
values of Dixtl−melt
and Divap−melt
remain constant over a given interval of
crystallization and vapour exsolution.
To calculate the mass fraction of crystallization that relates two melt
inclusion compositions, we use a separate statement of the Rayleigh
fractionation equation for K2O and assume that K2O is perfectly incompatible.
This yields:
Xxtl =1−CK2O
i
CK2Of − Xvap (6)
where CK2Oi and CK2O
f are the initial and final concentrations of K2O. To calculate
Xvap, we assume, for simplicity, that only H2O exsolution is important, i.e., that
exsolution of S, Cl, F and CO2 is small compared to the mass of H2O that is
exsolved, and thus may be ignored. As a starting point, we use:
246
CK2Of
CK2Oi =
CH2O*
CH2Oi (7)
where CH2O* is the final dissolved H2O concentration that the melt would have
after crystallization and in the absence of any H2O exsolution. Therefore:
CH2Of +
Xvap
Xmelt
= CH2O* (8)
where CH2Of is the concentration of dissolved H2O in the melt after degassing and
crystallization (i.e. the H2O content measured for each melt inclusion). This
allows us to calculate Xvapor as:
Xvapor = Xmelt CH2Oi CK2O
f
CK2Oi
⎛
⎝ ⎜ ⎜
⎞
⎠ ⎟ ⎟ − CH2O
f⎡
⎣ ⎢ ⎢
⎤
⎦ ⎥ ⎥ (9)
The combination of equation 4 and equation 3 can be used to solve for Di .
Equations 4, 6 and 9 can be combined to solve for Xvapour and Xxtl, allowing
for the apparent distribution coefficients DSvap−melt
and DClvap−melt
for any melt
inclusion to be calculated using the H2O, S, Cl, F and K2O contents of the least
evolved and least degassed melt inclusion as the initial condition and the melt
inclusion of interest as the final condition. We do this by using:
Di =1+log Ci
f
Cii
⎛
⎝ ⎜
⎞
⎠ ⎟
log F
⎡
⎣
⎢ ⎢ ⎢ ⎢
⎤
⎦
⎥ ⎥ ⎥ ⎥
(10)

247
together with equation 2. Cii is the initial dissolved concentration of either S, Cl or
F, and Cif is the final dissolved concentration.
Closed-system degassing
For the closed-system degassing case (with no initial exsolved gas present) we
assume a batch crystallization and degassing process described by:
Cif
Cii =
1F + Di(1− F)
(11)
where F and Di are defined as for the open-system case described above. We
calculate Xxtl using K2O in a separate statement of equation 11 and assuming
K2O is perfectly incompatible. This yields the same result as equation 6.
Therefore equation 9 holds for the closed-system case as well.
As with the open-system case, we can then solve for the apparent
distribution coefficients DSvap−melt
and DClvap−melt
for any melt inclusion using the H2O,
S, Cl, F and K2O contents of the least evolved and least degassed melt inclusion
as the initial condition and the melt inclusion of interest as the final condition. We
do so by using a rearranged version of equation 11:
Di =
Cif
Cii − F
⎛
⎝ ⎜
⎞
⎠ ⎟
1− F (12)
from which we then calculate DSvap-melt, DCl
vap-melt and DFvap-melt using equation 2.
Closed-system degassing with initial exsolved gas present or open-system degassing with gas fluxing
In this case we assume an initial condition of melt plus some amount of
exsolved H2O-CO2 vapour. The initial vapour is assumed to contain no S, Cl or
F. This might be the case where magma and entrained vapour ascended rapidly
248
from great depth because at the higher pressure condition, the high solubilities
and low vapour-melt partition coefficients of F, Cl and S (Scaillet and Pichavant,
2005; Alletti et al., 2009; Aiuppa et al., 2009) keep them dissolved in melt, with
little partitioning into the vapour phase. The equations for this case can also be
used to model the situation where magma residing in the crust is fluxed with
vapour from higher pressure (so the vapour initially has no F, Cl or S) because
the equations describe mass balance for a system that contains more gas than it
can internally generate. In both of these physical scenarios, the effect of the
initial exsolved vapour during subsequent cooling, crystallization and
decompression is to draw more of the dissolved S, Cl and F out of the melt and
into the vapour phase. The net result is that for a given initial and final dissolved
S, Cl and F content, the presence of the initial gas results in lower apparent
DSvap-melt, DCl
vap-melt and DFvap-melt values than in either the open-system or closed-
system (no initial exsolved gas) cases because there is more gas into which S,
Cl and F are partitioning.
For the initial condition (assuming no S, Cl or F in the initial exsolved
vapour), the mass of S, Cl of F in the system is Xii (1– Xvap
i ), where Xii is the
initial weight fraction of S, Cl of F dissolved in the melt and Xvapi is the weight
fraction of initial exsolved vapour. For the final condition of the system, we define
F as the weight fraction of melt, Xxtl as the weight fraction of crystals, and Xvap as
the weight fraction of vapour. Therefore:
Xvap = Xvapi + Xvap new (13)
where Xvap new is the newly exsolved vapour. By mass balance, the initial and final
concentrations of dissolved S, Cl or F can be described by:
Xii (1−αO ) = Xi
f F + Xif Di
xtl−melt + Xif XvapDi
vap−melt (14)
249
Where α0 is the same as Xivap and Xi
f is the final weight fraction of S, Cl or F
dissolved in the melt. If we again assume that no S, Cl or F goes into any
crystallizing phases ( Dixtl−melt = 0) , then this mass balance relationship can be
simplified and rearranged to yield:
Divap−melt =
Xii(1− Xvap
i )Xi
f
⎡
⎣ ⎢
⎤
⎦ ⎥ − F
Xvapi + Xvap new
(15)
Note that the mass fraction of initial exsolved vapour ( Xvapi ) must be
independently specified. Xvap new is calculated using equation 9, and F is
calculated again using F = 1 – Xxtl – Xvap.
Sources of uncertainty
The results of the modeled Dvap-melt values for the different degassing
scenarios are generally within error of each other. This means that the standard
deviation between model Dvap-melt values is smaller than the uncertainty
associated with each determination. The one exception is at very low Xvap and
Xxtl conditions (i.e. high F values) when the model values for different degassing
scenarios diverge significantly due to the form of equations 10 and 12.
The uncertainty associated with each model Dvap-melt value is mainly a
function of the uncertainty in the initial magma H2O, K2O, S, Cl and F contents.
As discussed in Chapter 4, choosing the lowest K2O and highest H2O contents
represented in the melt inclusion suite is the most logical choice, assuming the
melt inclusions are related to each other via simple degassing and crystallization.
In the case of Kawah Ijen there is evidence for CO2 vapour fluxing (Fig. 4-6,
Chapter 4). The model does not take into account this complication and relies on
the following assumption: the variability in melt inclusion H2O and K2O content is
inherited during crustal processes such as CO2 fluxing (which produces the same
effect on H2O contents as H2O-saturated degassing; see Chapter 4) and

250
crystallization, and are not inherent to system initially (i.e. the parental magma
has a fixed starting H2O and K2O content). The maximum extent of Xvap
overestimation for the most CO2 rich melt inclusions is 0.04 (4 wt% vapour).
However, changing the initial H2O content to the low-H2O, high-CO2 composition
(Fig. 4-6a, Chapter 4) results in unrealistically elevated Dvap-melt values of > 10 for
the CO2-rich melt inclusions (see text for discussion of average Dvap-melt values in
basaltic arc magmas) and fails to explain the higher-H2O melt inclusions. The
maximum standard deviation on S analyses yields an uncertainty in DSvap-melt
values of 5. For Cl, the maximum uncertainty is 2.
References
Aiuppa, A., Baker, D.R., Webster, J.D., 2009. Halogens in volcanic systems. Chem. Geol. 263 (1-4), 1-18.
Alletti, M., Baker, D.R., Scaillet, B., Aiuppa, A., Moretti, R., Ottolini, L., 2009. Chlorine partitioning between a basaltic melt and H2O-CO2 fluids at Mount Etna. Chem. Geol. 263 (1-4), 37-50.
Johnson, E. R., Wallace, P. J., Cashman, K. V., Granados, H. D., 2010. Degassing of volatiles (H2O, CO2, S, Cl) during ascent, crystallization, and eruption at mafic monogenetic volcanoes in central Mexico. J. Volcanol. Geotherm. Res. 197 (1-4), 225-238.
Scaillet, B., Pichavant, M., 2005. A model of sulphur solubility for hydrous mafic melts: application to the determination of magmatic fluid compositions of Italian volcanoes. Annal. Geophys. 48 (4-5), 671-698.
Spilliaert, N., Métrich, N., Allard, P., 2006. S-Cl-F degassing pattern of water-rich alkali basalt: modeling and relationship with eruption styles on Mount Etna volcano. Earth Planet. Sci. Lett. 248 (3-4), 772-786.

251
Table 6-4 Additional analysed olivine-hosted melt inclusion compositions from Kawah Ijen (uncorrected for post-entrapment modification)
ijenbas9 ijenbas3 ijenbas11 ijenbas5 ijenbas12x ijenbas12ya ijenbas1 ijenbas8 ijenbas7 (wt%)
SiO2 45.4 45.5 45.3 48.2 45.0 45.6 45.7 45.4 46.1 TiO2 1.02 1.02 0.97 1.21 1.00 0.92 1.04 1.08 0.99 Al2O3 18.4 18.3 17.6 15.5 16.8 16.8 18.4 18.5 18.5
FeOT 9.8 10.1 10.0 11.1 10.3 10.4 9.4 10.3 9.1 MnO 0.19 0.19 0.16 0.15 0.18 0.24 0.16 0.16 0.17 MgO 5.6 5.7 5.7 6.1 6.4 6.6 5.4 5.5 5.2 CaO 10.9 10.9 11.1 9.2 10.1 10.0 10.4 11.0 11.2 Na2O 2.59 2.45 2.57 3.00 2.33 2.31 2.64 2.43 2.59 K2O 0.61 0.60 0.59 0.93 0.57 0.57 0.73 0.63 0.61 P2O5 0.19 0.24 0.20 0.28 0.17 0.17 0.23 0.20 0.25
S 0.203 0.198 0.211 0.043 0.156 0.159 0.203 0.220 0.220 Cl 0.083 0.088 0.092 0.102 0.077 0.063 0.084 0.067 0.084 F b.d.l. b.d.l. b.d.l. b.d.l. b.d.l. b.d.l. b.d.l. 0.056 0.050
H2O 4.26 3.40 3.43 1.03 5.24 5.62 4.02 3.45 3.72 CO2 (ppm) 2184 3478 3509 19 151 189 1204 1552 1030
Host Fo 79.9 79.9 80.1 80.1 80.9 80.9 80.0 78.6 79.6

252
Appendix D
FLYSPEC scans were conducted on the SE rim of the Kawah Ijen crater
which allowed for traverses to be made, on foot, through the plume as it passed
overhead. Wind speeds could be quite variable from day to day and even within
a sampling period. As a result, average wind speeds were obtained for every 15
minute traverse period. Dominant wind directions were relatively steady at 97-98°
(+ 0.7°) during the acquisition of the scans, however the path of the plume did
wander laterally (NE-SW) along the rim of the crater during traverses. As such,
the plume was often encountered more than once during a traverse. This lead to
the “puffing” pattern of the concentration pathlength of SO2 recorded during a
single scan. Each “puff” corresponds to the intersection of the plume path with
the FLYSPEC location on the rim. These “puffs” may represent partial plume
sampling when the FLYSPEC crosses beneath the plume momentarily before the
plume shifts away from the instrument (generally occurred at the edges of the
traverse, which also correspond to the edges of the plume’s lateral wandering
path). These “puffs” are labeled as “edge of plume” and are underestimates of
the total flux of SO2 in the plume (Fig. 6-3). Additionally, wandering of the plume
through the central portion of the traverse leads to sampling of “puffs” without
returning to background (zero) concentration pathlength values in between. This
leads to “incomplete” plume sampling and underestimates the total SO2 flux (Fig.
6-3). To best determine the flux of SO2 from the dome at Kawah Ijen, individual
“puffs” were identified, taking care to avoid “puffs” from the edges of the plume. It
was harder to avoid “puffs” with incomplete profiles (non-zero background

253
values). As such, the total SO2 flux values measured at Kawah Ijen are
underestimated but this underestimate will be minimal compared to the standard
deviation of the measurements made over a single day (Chapter 5).
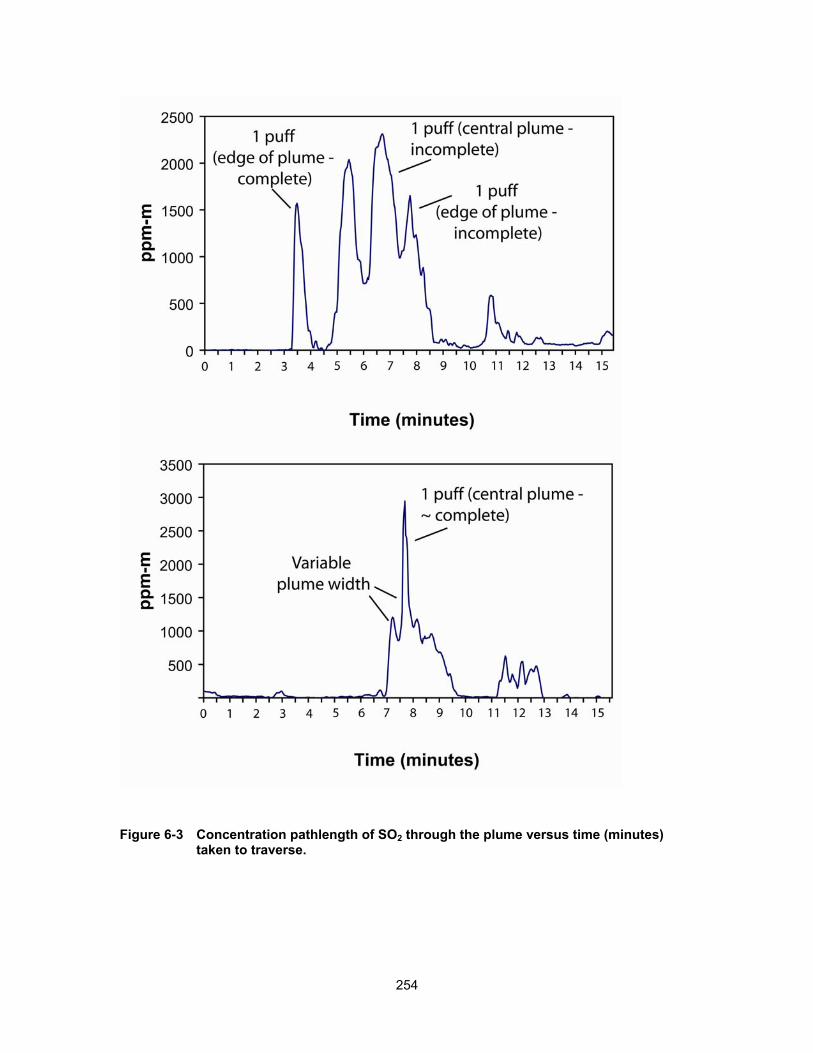
254
Figure 6-3 Concentration pathlength of SO2 through the plume versus time (minutes) taken to traverse.