tracking sars-cov-2 in sewage: evidence of changes in
TRANSCRIPT

viruses
Article
Tracking SARS-CoV-2 in Sewage: Evidence ofChanges in Virus Variant Predominance duringCOVID-19 Pandemic
Javier Martin 1,*, Dimitra Klapsa 1 , Thomas Wilton 1, Maria Zambon 2, Emma Bentley 1 ,Erika Bujaki 1, Martin Fritzsche 3 , Ryan Mate 3 and Manasi Majumdar 1
1 Division of Virology, National Institute for Biological Standards and Control (NIBSC), Potters Bar,Hertfordshire EN6 3QG, UK; [email protected] (D.K.); [email protected] (T.W.);[email protected] (E.B.); [email protected] (E.B.); [email protected] (M.M.)
2 Respiratory Virology & Polio Reference Service, Public Health England, London NW9 5EQ, UK;[email protected]
3 Division of Analytical and Biological Sciences, NIBSC, Potters Bar, Hertfordshire EN6 3QG, UK;[email protected] (M.F.); [email protected] (R.M.)
* Correspondence: [email protected]
Received: 25 September 2020; Accepted: 4 October 2020; Published: 9 October 2020�����������������
Abstract: Severe Acute Respiratory Syndrome Coronavirus 2 (SARS-CoV-2), responsible for theongoing coronavirus disease (COVID-19) pandemic, is frequently shed in faeces during infection,and viral RNA has recently been detected in sewage in some countries. We have investigated thepresence of SARS-CoV-2 RNA in wastewater samples from South-East England between 14th Januaryand 12th May 2020. A novel nested RT-PCR approach targeting five different regions of the viralgenome improved the sensitivity of RT-qPCR assays and generated nucleotide sequences at sites withknown sequence polymorphisms among SARS-CoV-2 isolates. We were able to detect co-circulatingvirus variants, some specifically prevalent in England, and to identify changes in viral RNA sequenceswith time consistent with the recently reported increasing global dominance of Spike protein G614pandemic variant. Low levels of viral RNA were detected in a sample from 11th February, 3 daysbefore the first case was reported in the sewage plant catchment area. SARS-CoV-2 RNA concentrationincreased in March and April, and a sharp reduction was observed in May, showing the effectsof lockdown measures. We conclude that viral RNA sequences found in sewage closely resemblethose from clinical samples and that environmental surveillance can be used to monitor SARS-CoV-2transmission, tracing virus variants and detecting virus importations.
Keywords: COVID-19; wastewater; SARS-CoV-2 RNA; next-generation sequencing; variant G614;virus evolution; alter surveillance system
1. Introduction
A global pandemic of coronavirus disease (COVID-19) caused by a new betacoronavirus namedSevere Acute Respiratory Syndrome Coronavirus 2 (SARS-CoV-2) is currently ongoing [1]. The outbreakwas first detected in Wuhan (China) in December 2019 and spread rapidly to 213 countries/territorieswith 33.50 million confirmed cases and 1,004,421 deaths as of 30th September 2020 [2]. While the majorityof infections result in no apparent symptoms or mild ones, some progress to acute respiratory disease,multi-organ failure, and death [3]. Respiratory transmission is the primary route for SARS-CoV-2infection although faecal–oral transmission is possible as high levels of viral RNA have been detectedin stool samples of a proportion of infected individuals [4]. Studies have shown that viral RNA oftitres up to 8.0 Log10 genome copies (gc)/gram of faeces can be detected in stools of infected people
Viruses 2020, 12, 1144; doi:10.3390/v12101144 www.mdpi.com/journal/viruses

Viruses 2020, 12, 1144 2 of 17
for prolonged periods of time, long after the virus is no longer detected in respiratory samples [5–8].Correspondingly, SARS-CoV-2 RNA has been found in wastewater samples in some countries withviral RNA loads ranging between 2.0 and 6.0 Log10 gc/L of sewage and generally a good correlationbetween RNA levels and numbers of COVID-19 confirmed cases [9–18].
SARS-CoV-2 has spread very rapidly in the population resulting in a high number of peoplerequiring hospitalization. Consequently, many countries have been forced to implement severelockdown measures to ensure physical distance between people and interrupt virus transmission [19–22].These measures have largely reduced the number of confirmed cases in several countries, but outbreaksare emerging in some areas following the ease of lockdown measures [23]. As a large proportion of thepopulation appears to remain susceptible for SARS-CoV-2 infection [24–27], the risk of new waves ofinfection is high. Four successive waves were observed during the global 1918 influenza pandemic,which lasted from February 1918 to April 1920 infecting an estimated 500 million people and causingbetween 17 and 50 million deaths [28]. As with the influenza pandemic, the quality and length oflockdown measures will determine its effectiveness in reducing deaths and future peaks of COVID-19disease [29]. In this context, monitoring virus spread and understanding virus transmission patternsbecomes critical. In a situation in which a high proportion of asymptomatic infected individuals occurs,with potential to silently spread the disease, environmental surveillance (ES) could prove to be a veryuseful tool to track virus circulation. A good example is poliovirus as ES has been shown to be a verysensitive method to detect poliovirus circulation [30], even in the absence of reported paralytic poliocases [31], and has helped tracing the elimination of wild and vaccine poliovirus in some areas largelycontributing to global polio eradication efforts. Although there is some evidence of the early detectionof viral RNA in sewage even before COVID-19 cases had been reported [10,11,32], it still remains to bedetermined how well virus found in sewage represents virus circulating in humans and whether EScan help in the early detection of peaks in virus transmission for a public response to be timely effective.
Apart from establishing an alert system for virus detection by ES, phylogenetic analysis of viralRNA found in sewage [14,16] can also help in understanding virus transmission patterns, tracing virusvariants, and detecting virus importations. Analysis of SARS-CoV-2 RNA nucleotide sequences fromclinical samples reveals some level of genetic variation including non-synonymous changes observedduring the COVID-19 pandemic [33–41]. This includes a relevant virus variant containing an aminoacid change from aspartate (D) to glycine (G) at residue 614 in the SARS-CoV-2 spike (S) protein,responsible for virus attachment to the Angiotensin-converting enzyme 2 (ACE2) receptor on host cellsand subsequent cell entry. This virus, named the G614 variant, has become the dominant pandemicform globally although its biological significance is still not clear [42].
With the above scientific information in mind, we aimed at investigating whether we could detectthe presence of SARS-CoV-2 in wastewater samples from England (United Kingdom) using standardreal-time quantitative reverse transcription-polymerase chain reaction (RTqPCR) assays as reportedin different countries. Raw inlet sewage samples collected between 14th January and 12th May 2020were analysed. In addition, nested reverse transcription-polymerase chain reaction (nPCR) assaysspecifically targeting SARS-CoV-2 sequences were designed to complement the RTqPCR assays andprovide nucleotide sequence information to confirm the association between viral sequences foundin clinical samples and those found in sewage. This could eventually help to improve the predictingvalue of ES for SARS-CoV-2 detection. We have also used next-generation sequencing analysis toinvestigate whether sequencing data from viral RNA found in sewage can help identify changes inthe predominance of different genetic variants that have been reported to occur during the currentCOVID-19 pandemic. Given the global relevance of the G614 pandemic variant described above,we have targeted genomic regions containing nucleotide variations found in this variant. In addition,nucleotide variants specifically prevalent in England during the period of study were also the target ofour sequence analyses.

Viruses 2020, 12, 1144 3 of 17
2. Materials and Methods
2.1. Wastewater Sample Collection and Processing
One litre of inlet wastewater composite samples was collected during a 24 h period at a sewageplant in South East England with a catchment area of approximately 4.0 × 10⁶ people. The sampleswere transported to the laboratory in chilled packages on the day of sampling and were stored at−80 ◦C until use. Each sample was processed using a filtration–centrifugation method describedbefore and previously validated for the detection of polio and non-polio enteroviruses during routineES for poliovirus as part of our role as a WHO Global Specialized polio network laboratory [43,44].Briefly, following the removal of solids by centrifugation at 3000× g, wastewater was filtered througha 500 mL Nalgene Rapid-flow™ 0.45 µM filter (Thermo Fisher Scientific, Waltham, MA, USA) andconcentrated using Centriprep centrifugal filter units with a 10 kDa molecular weight cutoff (Merck LifeScience UK Limited, Gillingham, UK) following manufacturer’s instructions. Starting volumes of rawsewage between 120 and 240 mL yielded 4–6 mL of concentrate. These were further concentrated in asecond step, when necessary, with final volumes of concentrates reaching between 150 and 350 µL.A total of five sewage samples was processed, one from each month. At least two aliquots fromeach raw sewage sample were processed and analysed independently. As shown in the literature,and from our own experience, we know that human viruses in sewage often show a non-homogeneousdistribution, particularly when virus concentrations are low [42,45]. Aliquot samples from the samewastewater concentrate preparation almost always yield a different spectrum of polio and non-polioenterovirus serotypes when analysed by infection in cell cultures or direct molecular assays [42,45].For this reason, following concentration of raw sewage, we tested a minimum of five replicate RNAsamples from at least two independent wastewater concentration processes for each sample.
2.2. Quantification of SARS-CoV-2 RNA in Wastewater Concentrates by RT-qPCR
The SARS-CoV-2 RNA content in wastewater concentrates was estimated by real-time RT-qPCRusing a qScript XLT qPCR Toughmix system (Quantabio, Beverly, MA, USA) in a Rotor-GeneQ instrument (Qiagen) and following a one- RT-PCR protocol. Viral RNA was purified fromwastewater concentrates using the High Pure viral RNA kit (Roche Life Science, Mannheim, Germany).Previously reported primer reactions RdRP and E-Sarbeco [46] were used with the following amplificationconditions: RT reaction was conducted at 50 ◦C for 30 min followed by 40 PCR amplification cyclesof 95 ◦C for 15 s, 50 ◦C for 45 s, 61 ◦C for 20 s, and 72 ◦C for 5 s. A standard curve for SARS-CoV-2RNA quantification was generated using serial dilutions of RNA extracted from the NationalInstitute for Biological Standards and Control (NIBSC) virus reagent 19/304 containing noninfectioussynthetic SARS-CoV-2 RNA packaged within a lentiviral vector that had been calibrated withplasmid DNA constructs to contain a concentration of 7.0 Log10 SARS-CoV-2 genome copies (gc)/mL(https://www.nibsc.org/products/brm_product_catalogue/detail_page.aspx?catid=19/304, accessed on4 July 2020). The results were expressed in Log10 SARS-CoV-2 gc/L of sewage. Replicate assayswere performed for each sample to improve quantification estimates. Good laboratory practiceswere observed in all assays to reduce the possibility of cross-contamination: i.e., using differentlaboratory locations for sample processing, preparation of reaction mixtures, template addition,and post-processing analysis. Two different operators tested each sample at least once. RNA extractionand no template controls were included in every assay and were always found to be negative.An additional RT-PCR reaction using enterovirus primers was used as process control to rule out thepresence of PCR inhibitors. The presence of live human enteroviruses in wastewater concentrateswas also assessed using standard cell culture procedures as part of our routine process for poliovirussurveillance [47].

Viruses 2020, 12, 1144 4 of 17
2.3. SARS-CoV-2 Whole-Genome Sequences Used for Nucleotide Sequence Analyses
Whole-genome SARS-CoV-2 sequences collected up to 31st May 2020 were downloaded from theGlobal Initiative on Sharing All Influenza Data (GISAID) database [48] on 4th July 2020. Only sequences>29,000 nt in length were used in our analysis. Remarkably, 33.04% of the whole-genome SARS-CoV-2sequences analysed from the GISAID database (18,082 of 56,899) were from England. Tables S3–S9show acknowledgments for authors who submitted the sequences analysed.
2.4. Nested RT-PCR (nPCR) Amplification
Whole-genome SARS-CoV-2 viral RNA sequences were downloaded from the GISAIDdatabase [48] to identify suitable genetic markers to be used in our sequence analyses, specificallywe looked at sequence variations observed between viral RNA sequences from England. GeneiousR10 software (Biomatters, Auckland, New Zealand) was used for all nucleotide sequence analyses.Whole-genome sequences were aligned to a reference sequence (Wuhan-Hu-1 strain) with NationalCenter for Biotechnology Information (NCBI) accession no. MN908947 and the frequency of sequencevariation at each nucleotide position was determined by standard single nucleotide polymorphism(SNP) analysis using Geneious R10 software default settings. RT-PCR fragments corresponding todifferent regions across the SARS-CoV-2 genome were amplified from purified viral RNAs by one-stepRT-PCR using a Invitrogen SuperScript III One-Step RT-PCR System with Platinum Taq High-FidelityDNA Polymerase. Genome location and nucleotide sequences of primer sets used for the PCR reactionsare shown in Figure S1, nPCR reactions were named nPCR1 to nPCR5. Amplification conditions were:50 ◦C for 30 min followed by 94 ◦C for 2 min plus 40 cycles of 94 ◦C for 15 s, 55 ◦C for 30 s and 68 ◦C for8 min with a final extension step of 68 ◦C for 5 min. Following the first PCR reaction, 1 µL of amplifiedproduct was used for the second PCR reaction using the DreamTaq™ Hot Start PCR Master Mix withthe same amplification conditions used for the first PCR step. Final amplified products were purifiedusing QIAquick® PCR Purification kit (Qiagen, Manchester, UK) ready for Sanger and next-generationsequencing (NGS) analysis. Primers were tested using serial dilutions of purified RNA from NIBSC’svirus reagent 19/304 referred above. RNA extraction and no template controls were included in everyassay and were always found to be negative. Primers used in this study did not closely match viralRNA sequences from seasonal coronavirus that had been circulating worldwide the last several years.Besides this, published nucleotide sequences of seasonal coronavirus serotypes in the PCR regionsamplified, are at least 30% different to those from SARS-CoV-2 isolates, which means that full-sequenceanalysis can unequivocally demonstrate that the sequenced nPCR products from this study werefrom SARS-CoV-2 and not seasonal coronavirus. All nucleotide sequences of nPCR products in thisstudy were identical or nearly identical to sequences from COVID-19 isolates from England and noneresembled those from seasonal coronaviruses.
2.5. Sanger Sequencing Analysis of RT-PCR Products
Purified DNA products were sequenced using an Applied Biosystems Prism 3130 genetic analyser.SARS-CoV-2 sequences obtained in this study were compared to those available in the GISAIDdatabase [48]. Geneious R10 software was used for these analyses. Sanger nucleotide sequencesgenerated for this paper are available from the GISAID database [49] with Accession IDs EPI_ISL_499042and EPI_ISL_500801-EPI_ISL_500830.
2.6. NGS Analysis of RT-PCR Products
NGS libraries were constructed using the DNA Prep kit (formerly known as Nextera DNAFlex) and dual-indexed using Nextera DNA CD Indexes (both Illumina, San Diego, CA, USA).These libraries were pooled in equimolar concentrations and sequenced with 250 bp paired-end readson MiSeq v2 (500 cycles) kits (Illumina). Initial demultiplexing was performed on-board by the MiSeqReporter software. FASTQ sequencing data was adapter and quality trimmed by Cutadapt v2.10 [50]

Viruses 2020, 12, 1144 5 of 17
for a minimum Phred score of Q30, minimal read length of 75 bp, and 0 ambiguous nucleotides.Relevant FASTQ files used in this study are available from the NCBI Short Read Archive underBioProject ID: PRJNA666219.
2.7. Generation of SARS-CoV-2 Sequence Contigs and Identification of SNPs
Further processing and analysis of NGS data was performed with Geneious R10 software usingmethods described before [44,51]. Filtered reads were imported into Geneious R10, paired-end readscombined and sequence contigs built by reference-guided assembly. Reads were mapped to referenceswith a minimum 50 base overlap, minimum overlap identity of 90%, maximum 10% mismatches perread, allowing up to 15% gaps, and index word length of 12. SNPs were identified using Geneious R10default settings. Variants with strand bias >90%, coverage <100, average quality <30, variant frequency<5%, and the number of total variant reads <10 were excluded. RNA extracted from NIBSC’s virusreagent 19/304 was used as control to measure background sequencing error.
3. Results
3.1. Detection of SARS-CoV-2 RNA in Wastewater Samples
Following concentration of raw sewage as described in Section 2.1, we tested a minimum of fivereplicate RNA samples from at least two independent wastewater concentration processes for eachsample. Further replicate RNAs were tested for positive samples to obtain more accurate viral RNAquantification. SARS-CoV-2 RNA in wastewater samples was quantified using a real-time quantitativepolymerase chain reaction (RTqPCR) assay targeting the RNA-dependent RNA Polymerase (RdRP)gene. A second RTqPCR assay targeting the envelope protein (E) gene was used for confirmation.The E-gene RTqPCR assay was less sensitive and accurate as the limit of quantitation (LOQ) washigher. The LOQ was 32 genome copies of SARS-CoV-2 RNA per reaction for the RdRP-gene assayand 160 genome copies per reaction for the E-gene assay as found using RNA extracted from theNIBSC virus reagent 19/304. These LOQ values correspond to 3.50 and 4.20 Log10 gc/L of sewage,respectively, when maximum concentration is achieved. As shown in Table 1, positive RTqPCR signalswere obtained for the samples from March, April, and May.
The sample from May was only positive in 3 out of 11 replicate assays with the RdRP-gene reactionand in none of the reactions with E-gene primers, so accurate quantification of viral RNA in thissample was not possible. However, it was clear that there was a large reduction of SARS-CoV-2RNA concentration in sewage between 14th April and 12th May. Positive and negative results wereindependently confirmed using a second real-time PCR platform (Stratagene 3000P) in a differentNIBSC laboratory. Integrity of process was confirmed through use of previous experience withenteroviruses. This was demonstrated both by detection of enteroviral RNA and recovery of infectiousvirus in cell cultures from all wastewater concentrates following WHO-recommended protocols asdescribed in Section 2.

Viruses 2020, 12, 1144 6 of 17
Table 1. Detection of Severe Acute Respiratory Syndrome Coronavirus 2 (SARS-CoV-2) viral RNA in wastewater concentrates by RTqPCR and nPCR.
SARS-CoV-2 RTqPCR(No. of Replicates) 1
Nested RT-PCR Gene Target(PCR Product Size) 2
Genome Sequenced(No. of Nucleotides)Sampling
DateRdRP Gene
(log10 gc/L Sewage)E Gene
(log10 gc/L Sewage)
nsp2-PLProGene
nPCR1 (714 nt)
RdRPGene
nPCR2 (523 nt)
RdRPGene
nPCR3 (527 nt)
RdRPGene
nPCR4 (235 nt)
ORF8b-NGene
nPCR5 (612 nt)
14-Jan-20 - - - - - - - -11-Feb-20 - - - - - + + 847
11-Mar-204.84 ± 0.45[4.18–5.52]
(n = 10)
4.98 ± 0.40[4.63–5.41]
(n = 3)+ + + + + 2376
14-Apr-205.27 ± 0.30[4.77–5.91]
(n = 11)
5.78 ± 0.07[5.71–5.84]
(n = 3)+ + + + + 2376
12-May-20 <3.5(n = 11) 3 - + + + + + 2376
Wastewater samples were concentrated using a standard filtration–centrifugation method (concentration factor: 20–60×).1 Mean values of log10 SARS-CoV-2 genome copy (SC2 gc)/Lwastewater with standard deviations are shown. 2 Dark grey indicates positive in at least 1/5 replicate nPCR reactions. Light grey indicates positive only after additional concentration (upto 500×). Positive PCR results were obtained for Feb–May samples in at least two independent concentration processes for at least two different gene targets. The January sample remainednegative even after a second concentration step.3 Only 3/11 replicates gave positive RTqPCR signals with RdRP target, so viral RNA quantification was not possible.

Viruses 2020, 12, 1144 7 of 17
3.2. Analysis of Nucleotide Sequence Variation among SARS-CoV-2 RNA Sequences from Clinical Samples
Details of the number of sequences analysed by date and country are given in Table S1.The frequency of sequence variation at each genomic nucleotide position was determined withrespect to the reference Wuhan-Hu-1 strain (NCBI accession no. MN908947) for each dataset. Figure 1shows nucleotide positions at which sequence variation in >1% of viral RNA sequences from Englandand the rest of the world were observed.
Viruses 2020, 12, x FOR PEER REVIEW 6 of 15
Wastewater samples were concentrated using a standard filtration–centrifugation method (concentration factor: 20–60×).1 Mean values of log10 SARS-CoV-2 genome copy (SC2 gc)/L wastewater with standard deviations are shown. 2 Dark grey indicates positive in at least 1/5 replicate nPCR reactions. Light grey indicates positive only after additional concentration (up to 500×). Positive PCR results were obtained for Feb–May samples in at least two independent concentration processes for at least two different gene targets. The January sample remained negative even after a second concentration step.3 Only 3/11 replicates gave positive RTqPCR signals with RdRP target, so viral RNA quantification was not possible.
The sample from May was only positive in 3 out of 11 replicate assays with the RdRP-gene reaction and in none of the reactions with E-gene primers, so accurate quantification of viral RNA in this sample was not possible. However, it was clear that there was a large reduction of SARS-CoV-2 RNA concentration in sewage between 14th April and 12th May. Positive and negative results were independently confirmed using a second real-time PCR platform (Stratagene 3000P) in a different NIBSC laboratory (data not shown). Integrity of process was confirmed through use of previous experience with enteroviruses. This was demonstrated both by detection of enteroviral RNA and recovery of infectious virus in cell cultures from all wastewater concentrates following WHO-recommended protocols as described in Materials and Methods.
3.2. Analysis of Nucleotide Sequence Variation among SARS-CoV-2 RNA Sequences from Clinical Samples
Details of the number of sequences analysed by date and country are given in Table S1. The frequency of sequence variation at each genomic nucleotide position was determined with respect to the reference Wuhan-Hu-1 strain (NCBI accession no. MN908947) for each dataset. Figure 1 shows nucleotide positions at which sequence variation in >1% of viral RNA sequences from England and the rest of the world were observed.
Figure 1. Analysis of nucleotide sequence variation among SARS-CoV-2 RNA sequences from clinical samples. Nucleotide positions at which sequence variation in >1% of viral RNA sequences from England (orange circles) or the rest of the world (blue circles) was observed are shown. Relevant nucleotide positions contained in nPCR1 (light grey shaded box) and nPCR2 (dark grey box) products are shown together with associated nucleotide variations (white boxes) observing very similar frequencies as expected. The genome locations of nPCR1 and nPCR2 products are shown in green and red boxes. The Wuhan-Hu-1 strain (NCBI accession no. MN908947) was used as reference. Whole-genome SARS-CoV-2 sequences used in this analysis were downloaded from the GISAID database [48].
Figure 1. Analysis of nucleotide sequence variation among SARS-CoV-2 RNA sequences from clinicalsamples. Nucleotide positions at which sequence variation in >1% of viral RNA sequences from England(orange circles) or the rest of the world (blue circles) was observed are shown. Relevant nucleotidepositions contained in nPCR1 (light grey shaded box) and nPCR2 (dark grey box) products are showntogether with associated nucleotide variations (white boxes) observing very similar frequencies asexpected. The genome locations of nPCR1 and nPCR2 products are shown in green and red boxes.The Wuhan-Hu-1 strain (NCBI accession no. MN908947) was used as reference. Whole-genomeSARS-CoV-2 sequences used in this analysis were downloaded from the GISAID database [48].
Differences in nucleotide sequence frequencies at some of these common positions were noticeableindicating a different prevalence of some sequence variants between viral sequences in England andthe rest of the world. We used this information to select genomic regions for our sequence analysis.Key nucleotide positions 2480, 2558, 3037, 14,408, and 14,805 were targeted in two nPCR products,nPCR1 and nPCR2. nPCR1 spans nucleotides 2344–3118 and nPCR2 covers nucleotides 14,342–14,913(Figure S1). The nPCR1 product includes nucleotide variants A2480G and C2558T, which result inamino acid changes I559V and P585S in nsp2 protein and which are often associated between them.The nPCR1 product also includes nucleotide C3037T, which is almost always associated with nucleotidesequence variations C241T, C14408T, and A23403G; mapping in the leader sequence; RNA polymerase(P323L amino acid change); and Spike protein (D614G amino acid change), respectively. This virusvariant containing these four nucleotide variations, named G614, has become the dominant pandemicvirus around the world [42]. The nPCR2 product includes nucleotide variant C14408T, also part of thedominant G614 pandemic strain, and synonymous change T14805C often associated with variationG26144T, which results in amino acid change G251V in Orf3a protein. The frequency of T14805C is15.8% in England versus 6.1 % in the rest of the world. Table S2 shows how nucleotide sequences atthese selected five nucleotide positions most commonly combine in SARS-CoV-2 isolates. We alsoshow in Figure 2 how the frequency of sequence variants at these five positions has changed duringthe pandemic in different countries/regions of the world.

Viruses 2020, 12, 1144 8 of 17
Viruses 2020, 12, x FOR PEER REVIEW 7 of 15
Differences in nucleotide sequence frequencies at some of these common positions were noticeable indicating a different prevalence of some sequence variants between viral sequences in England and the rest of the world. We used this information to select genomic regions for our sequence analysis. Key nucleotide positions 2480, 2558, 3037, 14,408, and 14,805 were targeted in two nPCR products, nPCR1 and nPCR2. nPCR1 spans nucleotides 2344–3118 and nPCR2 covers nucleotides 14,342–14,913 (Figure S1). The nPCR1 product includes nucleotide variants A2480G and C2558T, which result in amino acid changes I559V and P585S in nsp2 protein and which are often associated between them. The nPCR1 product also includes nucleotide C3037T, which is almost always associated with nucleotide sequence variations C241T, C14408T, and A23403G; mapping in the leader sequence; RNA polymerase (P323L amino acid change); and Spike protein (D614G amino acid change), respectively. This virus variant containing these four nucleotide variations, named G614, has become the dominant pandemic virus around the world [42]. The nPCR2 product includes nucleotide variant C14408T, also part of the dominant G614 pandemic strain, and synonymous change T14805C often associated with variation G26144T, which results in amino acid change G251V in Orf3a protein. The frequency of T14805C is 15.8% in England versus 6.1 % in the rest of the world. Table S2 shows how nucleotide sequences at these selected five nucleotide positions most commonly combine in SARS-CoV-2 isolates. We also show in Figure 2 how the frequency of sequence variants at these five positions has changed during the pandemic in different countries/regions of the world.
Figure 2. Changes in nucleotide sequence frequency at five selected SARS-CoV-2 genomic positions during the coronavirus disease (COVID-19) pandemic. The frequencies of 2480A (blue), 2558C (orange), 3037T (grey), 14408T (yellow), and 14805C (green) in England (A), Spain (B), Asia (C), and USA (D) are shown. Lines for nucleotides 2480 and 2554 and those for nucleotides 3037 and 14,408 mostly overlap as they correspond to associated sequence variations. Whole-genome SARS-CoV-2 sequences used in this analysis were downloaded from the GISAID database [48].
Figure 2. Changes in nucleotide sequence frequency at five selected SARS-CoV-2 genomic positionsduring the coronavirus disease (COVID-19) pandemic. The frequencies of 2480A (blue), 2558C (orange),3037T (grey), 14408T (yellow), and 14805C (green) in England (A), Spain (B), Asia (C), and USA (D) areshown. Lines for nucleotides 2480 and 2554 and those for nucleotides 3037 and 14,408 mostly overlapas they correspond to associated sequence variations. Whole-genome SARS-CoV-2 sequences used inthis analysis were downloaded from the GISAID database [48].
As can be noted, differences in sequence composition at these positions were notable betweenclinical samples from different countries/regions, likely reflecting differences in the circulation ofdifferent virus variants. Variants A2480G and C2558T were present in very low proportion in Spain,Asia, and USA as compared to the proportion in England. Variant C14480T was particularly prevalentin Spain and increase in the proportion of nucleotide variations characteristic of G614 pandemic variantwas delayed in Asia with respect to the other regions analysed. Three additional nPCR assays weredesigned as described in Sections 2 and 3.3 below.
3.3. Generation of nPCR Products for Nucleotide Sequence Analyses
Five different RNA replicates from each wastewater concentrate were initially used to generatenPCR products with the different primer combinations shown in Figure S1. As shown in Table 1,positive RT-PCR products were obtained for all five nPCR reactions using RNA extracted from March,April, and May wastewater concentrates. The February wastewater concentrate only produced positiveresults with nPCR4 and nPCR5 reactions, and only after an additional concentration step to the standard20–60× concentration procedure was performed (Table 1). The results obtained with nPCR reactionswere in good agreement with those from RTqPCR assays as the proportion of positive nPCR reactionsclosely matched that of the viral RNA concentration values. nPCR assays allowed confirmation bySanger sequencing and NGS analysis. For all positive samples, positive nPCR results were obtainedfor at least two different gene targets and from RNA extracted from at least two different independentwastewater concentration processes. nPCR positive reactions produced clean and clear bands followingelectrophoresis on agarose gels. None of the nPCR reactions with RNA from the wastewater sample

Viruses 2020, 12, 1144 9 of 17
collected on 14th January 2020 and none of the multiple RNA extraction and PCR reaction negativecontrols produced SARS-CoV-2 nPCR products. The RTqPCR and nPCR results are summarized inFigure 3 in the context of epidemiological data.
Viruses 2020, 12, x FOR PEER REVIEW 8 of 15
As can be noted, differences in sequence composition at these positions were notable between clinical samples from different countries/regions, likely reflecting differences in the circulation of different virus variants. Variants A2480G and C2558T were present in very low proportion in Spain, Asia, and USA as compared to the proportion in England. Variant C14480T was particularly prevalent in Spain and increase in the proportion of nucleotide variations characteristic of G614 pandemic variant was delayed in Asia with respect to the other regions analysed. Three additional nPCR assays were designed as described in Materials and Methods and section 3.3 below.
3.3. Generation of nPCR Products for Nucleotide Sequence Analyses
Five different RNA replicates from each wastewater concentrate were initially used to generate nPCR products with the different primer combinations shown in Figure S1. As shown in Table 1, positive RT-PCR products were obtained for all five nPCR reactions using RNA extracted from March, April, and May wastewater concentrates. The February wastewater concentrate only produced positive results with nPCR4 and nPCR5 reactions, and only after an additional concentration step to the standard 20–60× concentration procedure was performed (Table 1). The results obtained with nPCR reactions were in good agreement with those from RTqPCR assays as the proportion of positive nPCR reactions closely matched that of the viral RNA concentration values. nPCR assays allowed confirmation by Sanger sequencing and NGS analysis. For all positive samples, positive nPCR results were obtained for at least two different gene targets and from RNA extracted from at least two different independent wastewater concentration processes. nPCR positive reactions produced clean and clear bands following electrophoresis on agarose gels. None of the nPCR reactions with RNA from the wastewater sample collected on 14th January 2020 and none of the multiple RNA extraction and PCR reaction negative controls produced SARS-CoV-2 nPCR products. The RTqPCR and nPCR results are summarized in Figure 3 in the context of epidemiological data.
Figure 3. Detection of SARS-CoV-2 RNA in relation to COVID-19 confirmed cases. The number of daily reported new COVID-19 cases in the catchment area covered by the sewage plant is shown as grey columns. The time points at which 1, 10, 100, 1000, and 10,000 confirmed cases where reached in the area are indicated with green vertical lines. The blue vertical line indicates the time point of the first U.K. confirmed case, outside the sampling area. Environmental surveillance (ES) sampling time
Figure 3. Detection of SARS-CoV-2 RNA in relation to COVID-19 confirmed cases. The number ofdaily reported new COVID-19 cases in the catchment area covered by the sewage plant is shown asgrey columns. The time points at which 1, 10, 100, 1000, and 10,000 confirmed cases where reachedin the area are indicated with green vertical lines. The blue vertical line indicates the time point ofthe first U.K. confirmed case, outside the sampling area. Environmental surveillance (ES) samplingtime points are shown with red arrows. Data on SARS-CoV-2 viral RNA detection is shown in boxes.The number of daily new cases (with total accumulated cases in brackets) at each sampling date isshown. RTqPCR quantification results obtained with the RdRP reaction are shown. The time pointat which lockdown measures were introduced is indicated in red. Source for COVID-19 cases data:https://coronavirus.data.gov.uk/, accessed on 4 July 2020.
3.4. Nucleotide Sequence Analysis of nPCR Products from Wastewater Concentrates
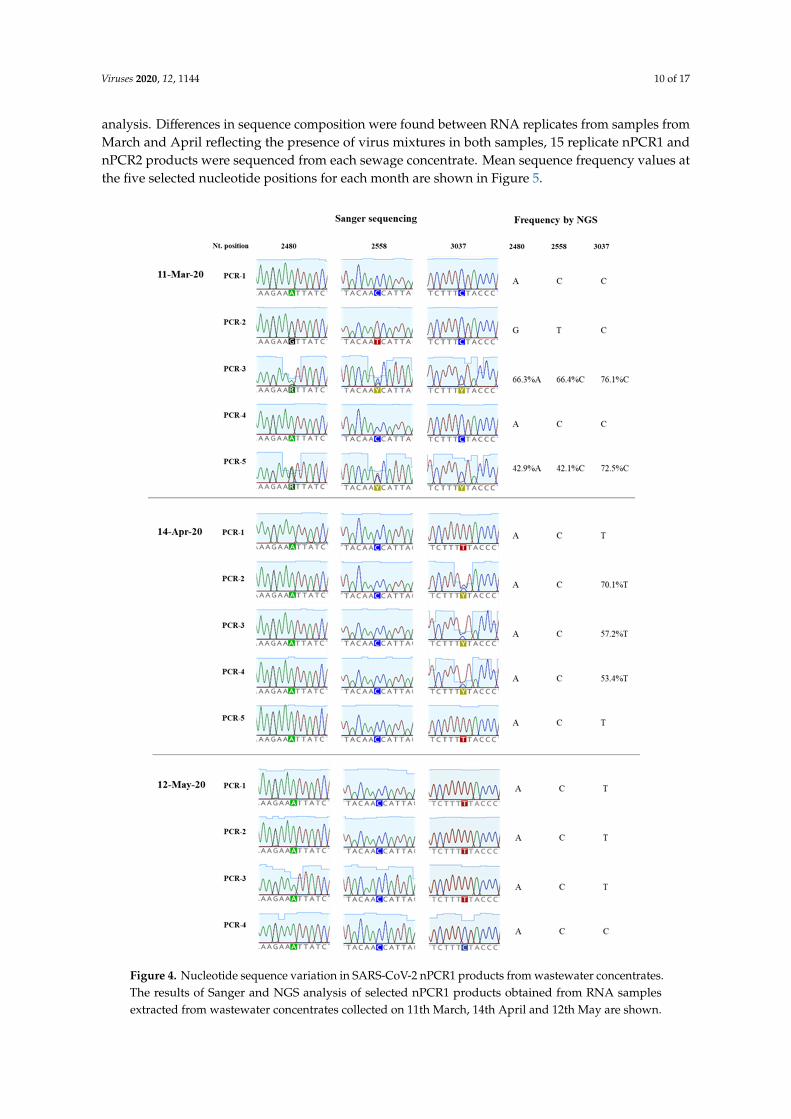
The amount of SARS-CoV-2 nucleotide sequences obtained by Sanger analysis for each sample isshown in Table 1 and ranged between 847 and 2376 nucleotides per wastewater concentrate. Sequencesfrom several nPCR replicates were generated from each concentrate. Nucleotide sequences for nPCR3,nPCR4, and nPCR5 products for all samples were identical to those of the consensus sequence fromclinical samples from England except for few nucleotide changes found in a few nPCR replicates.Nucleotide differences and mixed bases in sequence electropherograms were observed for nPCR1 andnPCR2 products from March and April at nucleotide positions where sequence variations had beenobserved between clinical samples in England as discussed above. The nPCR products were analysedby NGS with an aim to quantify the proportion of different nucleotides at mixed base positions.Between 82,000 and 200,000 filtered reads were sequenced per nPCR product with >99% of readstypically mapping to SARS-CoV-2 reference sequences. An example of the results for both Sanger andNGS analyses of nPCR1 products obtained with different RNA replicates from each sample are shownin Figure 4. NGS quantification results were in excellent agreement with those observed in Sangersequence electropherograms although no mixed peaks were detected in Sanger sequences when theminor nucleotide component was below 20%, showing the inferior sensitivity of the Sanger sequence
Viruses 2020, 12, 1144 10 of 17
analysis. Differences in sequence composition were found between RNA replicates from samples fromMarch and April reflecting the presence of virus mixtures in both samples, 15 replicate nPCR1 andnPCR2 products were sequenced from each sewage concentrate. Mean sequence frequency values atthe five selected nucleotide positions for each month are shown in Figure 5.Viruses 2020, 12, x FOR PEER REVIEW 11 of 17
Figure 4. Nucleotide sequence variation in SARS-CoV-2 nPCR1 products from wastewater concentrates. The results of Sanger and NGS analysis of selected nPCR1 products obtained from RNA samples extracted from wastewater concentrates collected on 11th March, 14th April and 12th May are shown.
Figure 4. Nucleotide sequence variation in SARS-CoV-2 nPCR1 products from wastewater concentrates.The results of Sanger and NGS analysis of selected nPCR1 products obtained from RNA samplesextracted from wastewater concentrates collected on 11th March, 14th April and 12th May are shown.

Viruses 2020, 12, 1144 11 of 17
Viruses 2020, 12, x FOR PEER REVIEW 9 of 15
points are shown with red arrows. Data on SARS-CoV-2 viral RNA detection is shown in boxes. The number of daily new cases (with total accumulated cases in brackets) at each sampling date is shown. RTqPCR quantification results obtained with the RdRP reaction are shown. The time point at which lockdown measures were introduced is indicated in red. Source for COVID-19 cases data: https://coronavirus.data.gov.uk/.
3.4. Nucleotide Sequence Analysis of nPCR Products from Wastewater Concentrates
The amount of SARS-CoV-2 nucleotide sequences obtained by Sanger analysis for each sample is shown in Table 1 and ranged between 847 and 2376 nucleotides per wastewater concentrate. Sequences from several nPCR replicates were generated from each concentrate. Nucleotide sequences for nPCR3, nPCR4, and nPCR5 products for all samples were identical to those of the consensus sequence from clinical samples from England except for few nucleotide changes found in a few nPCR replicates. Nucleotide differences and mixed bases in sequence electropherograms were observed for nPCR1 and nPCR2 products from March and April at nucleotide positions where sequence variations had been observed between clinical samples in England as discussed above. The nPCR products were analysed by NGS with an aim to quantify the proportion of different nucleotides at mixed base positions. Between 82,000 and 200,000 filtered reads were sequenced per nPCR product with >99% of reads typically mapping to SARS-CoV-2 reference sequences. An example of the results for both Sanger and NGS analyses of nPCR1 products obtained with different RNA replicates from each sample are shown in Figure S2. NGS quantification results were in excellent agreement with those observed in Sanger sequence electropherograms although no mixed peaks were detected in Sanger sequences when the minor nucleotide component was below 20%, showing the inferior sensitivity of the Sanger sequence analysis. Differences in sequence composition were found between RNA replicates from samples from March and April reflecting the presence of virus mixtures in both samples, 15 replicate nPCR1 and nPCR2 products were sequenced from each sewage concentrate. Mean sequence frequency values at the five selected nucleotide positions for each month are shown in Figure 4.
Figure 4. Nucleotide sequence variation at five selected genomic positions in SARS-CoV-2 RNA from wastewater concentrates. Comparison of mean sequence frequency values of nucleotides 2480A, 2558C, 3037T, 14408T, and 14805C found in nPCR1 and nPCR2 products (A) are shown and compared with mean sequence frequency values in clinical samples from England for the corresponding months
Figure 5. Nucleotide sequence variation at five selected genomic positions in SARS-CoV-2 RNA fromwastewater concentrates. Comparison of mean sequence frequency values of nucleotides 2480A, 2558C,3037T, 14408T, and 14805C found in nPCR1 and nPCR2 products (A) are shown and compared withmean sequence frequency values in clinical samples from England for the corresponding months (B).Error bars indicate standard error of the mean. Whole-genome SARS-CoV-2 sequences used in thisanalysis were downloaded from the GISAID database [48].
Overall, the nucleotide sequence composition at all five selected nucleotide positions changedbetween March and April. Viral RNA samples containing A2480G and C2558T nucleotide variationsdecreased between March and April. The proportion of T at positions 3037 and 14,408, genetic markersof the G614 dominant strain, increased between March and April. Finally, the predominant sequence atposition 14,805 also switched from T in March to C in April. The same trend in sequence compositioncontinued in May although a similar in-depth analysis was not possible since fewer replicate nPCRswere sequenced successfully. No mixed bases were identified by Sanger or NGS analysis in any ofthe nPCR products from the RNA samples from May. Sequence results from four nPCR1 replicatesfrom the May sewage found an A at nucleotide 2480 and a C at residue 2558 in all four replicatesand a T at position 3037 in 3/4 of the replicates in agreement with their predominance observed inApril. A single nPCR2 product sequenced from May also contained the nucleotide sequences of G614dominant strain at positions 14,408 and 14,805. Few additional sequence variations were identified infew PCR products, but none were present in more than one replicate.
4. Discussion
We detected SARS-CoV-2 RNA in wastewater samples collected between February and May 2020.A sample from 14th January was negative and only low levels of viral RNA were detected in thesample from 11th February, 11 days after the first two COVID-19 cases had been confirmed in York,northern England, and 3 days before the first case was reported in the population sampled in ourstudy. The SARS-CoV-2 RNA concentration estimated in wastewater samples was consistent withthe number of cases reported at the time of sample collection. Limitations in testing capacity earlyduring the pandemic meant that there was an underestimation of cases in the community, and theextent of community transmission. It is therefore likely that the number of cases in early Marchwas higher, which agrees with the viral RNA levels we found in sewage. Our results showed a
Viruses 2020, 12, 1144 12 of 17
large reduction of viral RNA concentration in sewage between April and May, most likely due tothe lockdown measures introduced in the country from 23rd March (Figure 3). This is in very goodagreement with the observed reduction in COVID-19 confirmed cases and infection estimates [26,45].However, more frequent sampling would be required to estimate the rate of virus decay and establishfirm conclusions about the relationship between cases and what is detected by ES.
Previous studies have detected SARS-CoV-2 RNA in wastewater samples worldwide [9–18]highlighting ES as a potential tool to help establish early warning systems for the detection of peaks invirus circulation to be able to direct timely public health interventions. The turnaround of laboratoryresults could take as little as 48 h using our current workflow. However, efforts to improve laboratorymethods for sample processing, virus concentration, and viral RNA quantification might be needed toincrease the sensitivity for SARS-CoV-2 detection to ensure our ability to detect asymptomatic virustransmission, particularly in areas with low background transmission rates. The type of samplesanalysed, e.g., raw sewage versus primary sludge or different sample processing e.g., analysing aqueousversus solid phases may have an impact on viral RNA recovery from sewage [12,49,52]. The use ofreference standards and collaborative studies between different laboratories using common sampleswould help in this process, allowing comparability between laboratories and methods. In addition,more detailed mathematical modelling studies similar to those conducted for poliovirus ES [53] willbe required to understand the representativeness of replicate sampling, develop sampling strategiesaround high-risk communities, and establish how ES can best complement clinical diagnosis tohopefully help prevent future lockdowns. Early efforts conducted in Australia [9] to estimate theproportion of individuals infected with SARS-CoV-2 in a catchment area using ES data should beexpanded. Although some relevant data are available, more detailed data on the dynamics ofSARS-CoV-2 virus excretion in stools are necessary to conduct these analyses, such us knowing theproportion of infected individuals excreting virus in stools, the duration of virus shedding and thevirus titres excreted during that period. Estimating the total amount of stool shed per person per dayduring SARS-CoV-2 infection as well as the virus recovery rate from sewage in the laboratory wouldbe additional factors to increase the accuracy of the modelling.
A novel nested RT-PCR approach targeting five different regions of the viral genome improvedthe sensitivity of RT-qPCR results. Next generation sequencing analysis of RT-PCR products revealedsingle nucleotide polymorphisms at five selected nucleotide positions, where sequence variationbetween viral RNA in clinical samples from England had been observed confirming the co-circulationof virus variants and changes in virus variant predominance with time. The target nucleotide sites forour study were selected following analysis of whole-genome SARS-CoV-2 sequences from the GISAIDsequence database [48]. Differences in sequence composition at these positions were notable betweendifferent countries/regions during the first few months of the pandemic, but in all cases, SARS-CoV-2strains containing common nucleotide sequences at these five positions survived, largely reflecting theglobal dominance of SARS-CoV-2 variant G614 (Figure 2). The G614 variant, containing a glycine (G)at residue 614 in the SARS-CoV-2 spike protein, has become the dominant pandemic form globallyshowing a consistent increase at all national, regional, and local levels, which suggests a possiblefitness advantage [42]. However, no evidence exists yet that any observed changes among SARS-CoV-2isolates, including G614, have resulted in adaptation to the human host, increased transmissibility,or worsening disease severity [33–41]. Other possible explanations for G614 dominance exist such asbeing caused by purely neutral sampling processes as described for other viruses during previouspandemics [54]. Nucleotide sequences characteristic of variant G614 were present in 36% of the viralRNA sequences reported from England in February but increased to around 60% in March, 86% inApril, and 95% in May. Variants A2480G and C2558T were specifically prevalent in clinical samplesfrom England. A combination GT or AT at these two nucleotide positions was present in 8.5% of clinicalsamples from England but only in 1.1% of clinical samples from the rest of the world, which means that78.4% of clinical samples showing that combination globally have been reported in England, with thatnumber rising to 92.1% if all U.K. clinical samples are included. The proportion of clinical samples

Viruses 2020, 12, 1144 13 of 17
containing variants A2480G and C2558T decreased in England from around 25% in February to 16%in March, 5% in April, and 0.8% in May. Similarly, clinical samples containing variation T14805Cdropped from 28.1% in March to 10.4% in April and 2.9% in May (Figure 2). Our sequencing results ofSARS-CoV-2 RNA from wastewater samples are consistent with these nucleotide sequence evolutionpatterns (Figure 5). The nucleotide sequence composition changed at all five selected positions betweenthe samples collected on 11th March and 14th April. Variants A2480G and C2558T were only detectedin low proportion in April and 3037T, 14408T, and 14805C became the dominant sequences at thesesites consistent with G614 global dominance [42]. In line with our sequence variation results, a studythat analysed sequence variation among U.K. SARS-CoV-2 isolates, found that the epidemic comprisesa very large number of importations due to inbound international travel [55]. The rate and sourceof introduction of SARS-CoV-2 lineages into the U.K. changed rapidly through time, peaking inmid-March, with most introductions occurring during March 2020. Many U.K. transmission lineagesappeared to be very rare or extinct at the time of reporting (8th June). This would be consistentwith notable changes expected in virus population dynamics with a likely decrease in sequenceheterogeneity from mid-March onwards as seen in our results from sewage.
Overall, our study shows that ES can be used to detect SARS-CoV-2 transmission with virusesidentified in sewage resembling those found in clinical samples. We were able to detect virus variantsspecifically circulating in England and also to identify changes in viral RNA sequences consistentwith the increasing global dominance of G614 pandemic variant [42]. Our results are encouragingand suggest a potentially wider applicability of ES to monitor SARS-CoV-2 transmission, tracing virusvariants and detecting virus importations.
5. Conclusions
We have shown that environmental surveillance can be used to monitor SARS-CoV-2 transmissiondetecting virus variants specifically circulating in England and identifying changes in virus variantpredominance known to have occurred during the COVID-19 pandemic. Environmental surveillancecould be used for the early detection of peaks in virus transmission for public health interventions tobe timely implemented.
Supplementary Materials: The following are available online at http://www.mdpi.com/1999-4915/12/10/1144/s1,Figure S1: Nested-PCR strategy. Table S1: Number of whole-genome SARS-CoV-2 sequences by region/countryand date of collection analysed in this study. Table S2: Most common nucleotide sequence combinations at fiveselected nucleotide sites in SARS-CoV-2 clinical samples. Tables S3–S9 include acknowledgments for authors whosubmitted the sequences analysed.
Author Contributions: Conceptualization, J.M.; methodology, J.M., M.M. and M.F.; software, J.M., M.F., R.M.,and T.W.; validation, D.K., T.W., and E.B. (Emma Bentley); formal analysis, J.M., M.M.; investigation, T.W.,D.K., E.B. (Erika Bujaki), E.B. (Emma Bentley), and R.M.; resources, J.M. and M.F.; data curation, J.M. and M.Z.;writing—original draft preparation, J.M.; writing—review and editing, M.F., E.B. (Emma Bentley), T.W., D.K.,and M.Z.; visualization, J.M.; supervision, J.M.; project administration, J.M.; funding acquisition, J.M. All authorshave read and agreed to the published version of the manuscript.
Funding: This paper is based on independent research commissioned and funded by the National Institute forHealth Research (NIHR) Policy Research Programme (NIBSC Regulatory Science Research Unit). The viewsexpressed in the publication are those of the author(s) and not necessarily those of the NHS, the NIHR,the Department of Health, arm’s length bodies, or other government departments.
Acknowledgments: We are kindly grateful to all authors submitting sequencing data to the GISAID database thatwere used for analyses shown in this manuscript.
Conflicts of Interest: The authors declare no conflict of interest. The funders had no role in the design of thestudy; in the collection, analyses, or interpretation of data; in the writing of the manuscript; or in the decision topublish the results.

Viruses 2020, 12, 1144 14 of 17
References
1. Zhou, P.; Yang, X.L.; Wang, X.G.; Hu, B.; Zhang, L.; Zhang, W.; Si, H.R.; Zhu, Y.; Li, B.; Huang, C.L.; et al.A pneumonia outbreak associated with a new coronavirus of probable bat origin. Nature 2020, 579, 270–273.[CrossRef]
2. World Health Organization. Coronavirus Disease (COVID-19) Pandemic. Available online: https://www.who.int/emergencies/diseases/novel-coronavirus-2019 (accessed on 10 July 2020).
3. Huang, C.; Wang, Y.; Li, X.; Ren, L.; Zhao, J.; Hu, Y.; Zhang, L.; Fan, G.; Xu, J.; Gu, X.; et al. Clinical featuresof patients infected with 2019 novel coronavirus in Wuhan, China. Lancet 2020, 395, 497–506. [CrossRef]
4. Xu, Y.; Li, X.; Zhu, B.; Liang, H.; Fang, C.; Gong, Y.; Guo, Q.; Sun, X.; Zhao, D.; Shen, J.; et al. Characteristicsof pediatric SARS-CoV-2 infection and potential evidence for persistent fecal viral shedding. Nat. Med. 2020,26, 502–505. [CrossRef] [PubMed]
5. Wu, Y.; Guo, C.; Tang, L.; Hong, Z.; Zhou, J.; Dong, X.; Yin, H.; Xiao, Q.; Tang, Y.; Qu, X.; et al. Prolongedpresence of SARS-CoV-2 viral RNA in faecal samples. Lancet Gastroenterol. Hepatol. 2020, 5, 434–435.[CrossRef]
6. Zhang, N.; Gong, Y.; Meng, F.; Bi, Y.; Yang, P.; Wang, F. Virus shedding patterns in nasopharyngeal and fecalspecimens of COVID-19 patients. medRxiv 2020. [CrossRef]
7. Wolfel, R.; Corman, V.M.; Guggemos, W.; Seilmaier, M.; Zange, S.; Muller, M.A.; Niemeyer, D.; Jones, T.C.;Vollmar, P.; Rothe, C.; et al. Virological assessment of hospitalized patients with COVID-2019. Nature 2020,581, 465–469. [CrossRef]
8. Lescure, F.X.; Bouadma, L.; Nguyen, D.; Parisey, M.; Wicky, P.H.; Behillil, S.; Gaymard, A.;Bouscambert-Duchamp, M.; Donati, F.; Le Hingrat, Q.; et al. Clinical and virological data of the firstcases of COVID-19 in Europe: A case series. Lancet Infect. Dis. 2020, 20, 697–706. [CrossRef]
9. Ahmed, W.; Angel, N.; Edson, J.; Bibby, K.; Bivins, A.; O’Brien, J.W.; Choi, P.M.; Kitajima, M.; Simpson, S.L.;Li, J.; et al. First confirmed detection of SARS-CoV-2 in untreated wastewater in Australia: A proof ofconcept for the wastewater surveillance of COVID-19 in the community. Sci. Total Environ. 2020, 728, 138764.[CrossRef]
10. Wu, F.; Zhang, J.; Xiao, A.; Gu, X.; Lee, W.L.; Armas, F.; Kauffman, K.; Hanage, W.; Matus, M.; Ghaeli, N.; et al.SARS-CoV-2 Titers in Wastewater Are Higher than Expected from Clinically Confirmed Cases. mSystems2020, 5. [CrossRef]
11. Randazzo, W.; Truchado, P.; Cuevas-Ferrando, E.; Simon, P.; Allende, A.; Sanchez, G. SARS-CoV-2 RNAin wastewater anticipated COVID-19 occurrence in a low prevalence area. Water Res. 2020, 181, 115942.[CrossRef]
12. Wurtzer, S.; Marechal, V.; Mouchel, J.-M.; Maday, Y.; Teyssou, R.; Richard, E.; Almayrac, J.L.; Moulin, L.Evaluation of lockdown impact on SARS-CoV-2 dynamics through viral genome quantification in Pariswastewaters. medRxiv 2020. [CrossRef]
13. Medema, G.; Heijnen, L.; Elsinga, G.; Italiaander, R.; Brouwer, A. Presence of SARS-Coronavirus-2 in sewage.medRxiv 2020. [CrossRef]
14. La Rosa, G.; Iaconelli, M.; Mancini, P.; Bonanno Ferraro, G.; Veneri, C.; Bonadonna, L.; Lucentini, L.;Suffredini, E. First detection of SARS-CoV-2 in untreated wastewaters in Italy. Water Res. 2020, 736.[CrossRef] [PubMed]
15. Lodder, W.; de Roda Husman, A.M. SARS-CoV-2 in wastewater: Potential health risk, but also data source.Lancet Gastroenterol. Hepatol. 2020, 5, 533–534. [CrossRef]
16. Nemudryi, A.; Nemudraia, A.; Wiegand, T.; Surya, K.; Buyukyoruk, M.; Cicha, C.; Vanderwood, K.K.;Wilkinson, R.; Wiedenheft, B. Temporal Detection and Phylogenetic Assessment of SARS-CoV-2 in MunicipalWastewater. Cell Rep. Med. 2020, 1, 100098. [CrossRef]
17. Kitajima, M.; Ahmed, W.; Bibby, K.; Carducci, A.; Gerba, C.P.; Hamilton, K.A.; Haramoto, E.; Rose, J.B.SARS-CoV-2 in wastewater: State of the knowledge and research needs. Sci. Total Environ. 2020, 739, 139076.[CrossRef]

Viruses 2020, 12, 1144 15 of 17
18. Foladori, P.; Cutrupi, F.; Segata, N.; Manara, S.; Pinto, F.; Malpei, F.; Bruni, L.; La Rosa, G. SARS-CoV-2from faeces to wastewater treatment: What do we know? A review. Sci. Total Environ. 2020, 743, 140444.[CrossRef]
19. Flaxman, S.; Mishra, S.; Gandy, A.; Unwin, H.J.T.; Mellan, T.A.; Coupland, H.; Whittaker, C.; Zhu, H.;Berah, T.; Eaton, J.W.; et al. Estimating the effects of non-pharmaceutical interventions on COVID-19 inEurope. Nature 2020, 584, 257–261. [CrossRef]
20. Walker, P.G.T.; Whittaker, C.; Watson, O.J.; Baguelin, M.; Winskill, P.; Hamlet, A.; Djafaara, B.A.; Cucunuba, Z.;Olivera Mesa, D.; Green, W.; et al. The impact of COVID-19 and strategies for mitigation and suppression inlow- and middle-income countries. Science 2020, 369, 413–422. [CrossRef]
21. Davies, N.G.; Kucharski, A.J.; Eggo, R.M.; Gimma, A.; Edmunds, W.J.; Centre for the Mathematical Modellingof Infectious Diseases COVID-19 Working Group. Effects of non-pharmaceutical interventions on COVID-19cases, deaths, and demand for hospital services in the UK: A modelling study. Lancet Public Health 2020,5, e375–e385. [CrossRef]
22. Kucharski, A.J.; Klepac, P.; Conlan, A.J.K.; Kissler, S.M.; Tang, M.L.; Fry, H.; Gog, J.R.; Edmunds, W.J.;CMMID COVID-19 Working Group. Effectiveness of isolation, testing, contact tracing, and physicaldistancing on reducing transmission of SARS-CoV-2 in different settings: A mathematical modelling study.Lancet Infect. Dis. 2020, 20, 1151–1160. [CrossRef]
23. European Centre for Disease Prevention and Control (ECDC). COVID-19 Pandemic. Available online:https://www.ecdc.europa.eu/en/covid-19-pandemic (accessed on 20 September 2020).
24. Pollan, M.; Perez-Gomez, B.; Pastor-Barriuso, R.; Oteo, J.; Hernan, M.A.; Perez-Olmeda, M.; Sanmartin, J.L.;Fernandez-Garcia, A.; Cruz, I.; Fernandez de Larrea, N.; et al. Prevalence of SARS-CoV-2 in Spain(ENE-COVID): A nationwide, population-based seroepidemiological study. Lancet 2020, 396, 535–544.[CrossRef]
25. Xu, X.; Sun, J.; Nie, S.; Li, H.; Kong, Y.; Liang, M.; Hou, J.; Huang, X.; Li, D.; Ma, T.; et al. Seroprevalenceof immunoglobulin M and G antibodies against SARS-CoV-2 in China. Nat. Med. 2020, 26, 1193–1195.[CrossRef] [PubMed]
26. Stringhini, S.; Wisniak, A.; Piumatti, G.; Azman, A.S.; Lauer, S.A.; Baysson, H.; De Ridder, D.; Petrovic, D.;Schrempft, S.; Marcus, K.; et al. Seroprevalence of anti-SARS-CoV-2 IgG antibodies in Geneva, Switzerland(SEROCoV-POP): A population-based study. Lancet 2020, 396, 313–319. [CrossRef]
27. Public Health England. Weekly Coronavirus Disease 2019 (COVID-19) Surveillance Report. Week: 22; 2020.Available online: https://assets.publishing.service.gov.uk/government/uploads/system/uploads/attachment_data/file/888254/COVID19_Epidemiological_Summary_w22_Final.pdf (accessed on 4 July 2020).
28. Johnson, N.P.; Mueller, J. Updating the accounts: Global mortality of the 1918-1920 “Spanish” influenzapandemic. Bull. Hist Med. 2002, 76, 105–115. [CrossRef] [PubMed]
29. Bootsma, M.C.; Ferguson, N.M. The effect of public health measures on the 1918 influenza pandemic in U.S.cities. Proc. Natl. Acad. Sci. USA 2007, 104, 7588–7593. [CrossRef]
30. Asghar, H.; Diop, O.M.; Weldegebriel, G.; Malik, F.; Shetty, S.; El Bassioni, L.; Akande, A.O.; Al Maamoun, E.;Zaidi, S.; Adeniji, A.J.; et al. Environmental surveillance for polioviruses in the Global Polio EradicationInitiative. J. Infect. Dis. 2014, 210, S294–S303. [CrossRef] [PubMed]
31. Shulman, L.M.; Gavrilin, E.; Jorba, J.; Martin, J.; Burns, C.C.; Manor, Y.; Moran-Gilad, J.; Sofer, D.;Hindiyeh, M.Y.; Gamzu, R.; et al. Molecular epidemiology of silent introduction and sustained transmissionof wild poliovirus type 1, Israel, 2013. Eurosurveillance 2014, 19, 20709. [CrossRef]
32. La Rosa, G.; Mancini, P.; Bonanno Ferraro, G.; Veneri, C.; Iaconelli, M.; Bonadonna, L.; Lucentini, L.;Suffredini, E. SARS-CoV-2 has been circulating in northern Italy since December 2019: Evidence fromenvironmental monitoring. Sci. Total Environ. 2020, 750, 141711. [CrossRef]
33. MacLean, O.A.; Orton, R.J.; Singer, J.B.; Robertson, D.L. No evidence for distinct types in the evolution ofSARS-CoV-2. Virus Evol. 2020, 6. [CrossRef]
34. Tang, X.; Wu, C.; Li, X.; Song, Y.; Yao, X.; Wu, X.; Duan, Y.; Zhang, H.; Wang, Y.; Qian, Z.; et al. On the originand continuing evolution of SARS-CoV-2. Natl. Sci. Rev. 2020, 7, 1012–1023. [CrossRef]

Viruses 2020, 12, 1144 16 of 17
35. van Dorp, L.; Acman, M.; Richard, D.; Shaw, L.P.; Ford, C.E.; Ormond, L.; Owen, C.J.; Pang, J.; Tan, C.C.S.;Boshier, F.A.T.; et al. Emergence of genomic diversity and recurrent mutations in SARS-CoV-2. Infect. Genet.Evol. 2020, 83, 104351. [CrossRef] [PubMed]
36. Yin, C. Genotyping coronavirus SARS-CoV-2: Methods and implications. Genomics 2020, 112, 3588–3596.[CrossRef] [PubMed]
37. Pachetti, M.; Marini, B.; Benedetti, F.; Giudici, F.; Mauro, E.; Storici, P.; Masciovecchio, C.; Angeletti, S.;Ciccozzi, M.; Gallo, R.C.; et al. Emerging SARS-CoV-2 mutation hot spots include a novelRNA-dependent-RNA polymerase variant. J. Transl. Med. 2020, 18, 179. [CrossRef]
38. Wang, M.; Li, M.; Ren, R.; Li, L.; Chen, E.Q.; Li, W.; Ying, B. International Expansion of a Novel SARS-CoV-2Mutant. J. Virol. 2020, 94. [CrossRef]
39. Su, Y.C.; Anderson, D.E.; Young, B.E.; Zhu, F.; Linster, M.; Kalimuddin, S.; Low, J.G.; Yan, Z.; Jayakumar, J.;Sun, L.; et al. Discovery of a 382-nt deletion during the early evolution of SARS-CoV-2. bioRxiv 2020.[CrossRef]
40. Van Dorp, L.; Richard, D.; Tan, C.C.; Shaw, L.P.; Acman, M.; Balloux, F. No evidence for increasedtransmissibility from recurrent mutations in SARS-CoV-2. bioRxiv 2020. [CrossRef]
41. Volz, E.M.; Hill, V.; McCrone, J.T.; Price, A.; Jorgensen, D.; O’Toole, A.; Southgate, J.A.; Johnson, R.; Jackson, B.;Nascimento, F.F.; et al. Evaluating the effects of SARS-CoV-2 Spike mutation D614G on transmissibility andpathogenicity. medRxiv 2020. [CrossRef]
42. Korber, B.; Fischer, W.M.; Gnanakaran, S.; Yoon, H.; Theiler, J.; Abfalterer, W.; Hengartner, N.; Giorgi, E.E.;Bhattacharya, T.; Foley, B.; et al. Tracking Changes in SARS-CoV-2 Spike: Evidence that D614G IncreasesInfectivity of the COVID-19 Virus. Cell 2020, 182, 812–827 e819. [CrossRef]
43. Majumdar, M.; Klapsa, D.; Wilton, T.; Akello, J.; Anscombe, C.; Allen, D.; Mee, E.T.; Minor, P.D.; Martin, J.Isolation of vaccine-like poliovirus strains in sewage samples from the UK. J. Infect. Dis. 2017. [CrossRef]
44. Majumdar, M.; Martin, J. Detection by Direct Next Generation Sequencing Analysis of Emerging EnterovirusD68 and C109 Strains in an Environmental Sample from Scotland. Front. Microbiol. 2018, 9, 1956. [CrossRef][PubMed]
45. Edelstein, M.; Obi, C.; Chand, M.; Hopkins, S.; Brown, K.; Ramsay, M. SARS-CoV-2 infection in London,England: Impact of lockdown on community point-prevalence, March-May 2020. medRxiv 2020. [CrossRef]
46. Corman, V.M.; Landt, O.; Kaiser, M.; Molenkamp, R.; Meijer, A.; Chu, D.K.; Bleicker, T.; Brunink, S.;Schneider, J.; Schmidt, M.L.; et al. Detection of 2019 novel coronavirus (2019-nCoV) by real-time RT-PCR.Eurosurveillance 2020, 25. [CrossRef] [PubMed]
47. World Health Organization. Guidelines for Environmental Surveillance of Poliovirus Circulation; World HealthOrganization: Geneva, Switzerland, 2003.
48. Elbe, S.; Buckland-Merrett, G. Data, disease and diplomacy: GISAID’s innovative contribution to globalhealth. Glob. Chall 2017, 1, 33–46. [CrossRef]
49. Westhaus, S.; Weber, F.A.; Schiwy, S.; Linnemann, V.; Brinkmann, M.; Widera, M.; Greve, C.;Janke, A.; Hollert, H.; Wintgens, T.; et al. Detection of SARS-CoV-2 in raw and treated wastewaterin Germany—Suitability for COVID-19 surveillance and potential transmission risks. Sci. Total Environ. 2020,751, 141750. [CrossRef]
50. Didion, J.P.; Martin, M.; Collins, F.S. Atropos: Specific, sensitive, and speedy trimming of sequencing reads.PeerJ 2017, 5, e3720. [CrossRef]
51. Mee, E.T.; Minor, P.D.; Martin, J. High resolution identity testing of inactivated poliovirus vaccines. Vaccine2015, 33, 3533–3541. [CrossRef]
52. Zhang, D.; Ling, H.; Huang, X.; Li, J.; Li, W.; Yi, C.; Zhang, T.; Jiang, Y.; He, Y.; Deng, S.; et al. Potentialspreading risks and disinfection challenges of medical wastewater by the presence of Severe Acute RespiratorySyndrome Coronavirus 2 (SARS-CoV-2) viral RNA in septic tanks of Fangcang Hospital. Sci. Total Environ.2020, 741, 140445. [CrossRef]
53. O’Reilly, K.M.; Grassly, N.C.; Allen, D.J.; Bannister-Tyrrell, M.; Cameron, A.; Carrion Martin, A.I.; Ramsay, M.;Pebody, R.; Zambon, M. Surveillance optimisation to detect poliovirus in the pre-eradication era: A modellingstudy of England and Wales. Epidemiol. Infect. 2020, 148, e157.

Viruses 2020, 12, 1144 17 of 17
54. Foley, B.; Pan, H.; Buchbinder, S.; Delwart, E.L. Apparent founder effect during the early years of the SanFrancisco HIV type 1 epidemic (1978–1979). AIDS Res. Hum. Retroviruses 2000, 16, 1463–1469. [CrossRef]
55. Pybus, O.G.; Rambaut, A.; du Plessis, L.; Zarebski, A.E.; Moritz, U.; Kraemer, G.; Raghwani, J.; Gutiérrez, B.;Hill, V.; McCrone, J.; et al. Preliminary Analysis of SARS-CoV-2 Importation & Establishment of UKTransmission Lineages. Available online: https://virological.org/t/preliminary-analysis-of-sars-cov-2-importation-establishment-of-uk-transmission-lineages/507 (accessed on 20 September 2020).
© 2020 by the authors. Licensee MDPI, Basel, Switzerland. This article is an open accessarticle distributed under the terms and conditions of the Creative Commons Attribution(CC BY) license (http://creativecommons.org/licenses/by/4.0/).