tracing the austronesian footprint in mainland southeast asia
TRANSCRIPT

Tracing the Austronesian Footprint in Mainland SoutheastAsia: A Perspective from Mitochondrial DNA
Min-Sheng Peng,�,1,2,6 Huy Ho Quang,�,4 Khoa Pham Dang,4 An Vu Trieu,4 Hua-Wei Wang,3
Yong-Gang Yao,5 Qing-Peng Kong,*,1,2 and Ya-Ping Zhang*,1,2,3
1State Key Laboratory of Genetic Resources and Evolution, Kunming Institute of Zoology, Chinese Academy of Sciences, Kunming,P.R. China2KIZ/CUHK Joint Laboratory of Bioresources and Molecular Research in Common Diseases, Kunming, P.R. China3Laboratory for Conservation and Utilization of Bio-resource, Yunnan University, Kunming, P.R. China4Department of Immunology, Ha Noi Medical University, Ha Noi, Vietnam5Key Laboratory of Animal Models and Human Disease Mechanisms of the Chinese Academy of Sciences and Yunnan Province,Kunming Institute of Zoology, Kunming, P.R. China6Graduate School of the Chinese Academy of Sciences, Beijing, P.R. China
�These authors contributed equally to this work.
*Corresponding author: E-mail: [email protected]; [email protected].
Associate editor: Lisa Matisoo-Smith
The sequence data for this paper appear in GenBank under accession numbers GQ301556–GQ301862 for HVS sequences andGQ301863–GQ301886 and GU592216–GU592219 for complete mtDNA genomes.
Abstract
As the relic of the ancient Champa Kingdom, the Cham people represent the major Austronesian speakers in MainlandSoutheast Asia (MSEA) and their origin is evidently associated with the Austronesian diffusion in MSEA. Hitherto,hypotheses stemming mainly from linguistic and cultural viewpoints on the origin of the Cham people remain a welter ofcontroversies. Among the points of dissension is the muddled issue of whether the Cham people arose from demic orcultural diffusion from the Austronesians. Addressing this issue also helps elucidate the dispersal mode of the Austronesianlanguage. In the present study, we have analyzed mitochondrial DNA (mtDNA) control-region and coding-region sequencevariations in 168 Cham and 139 Kinh individuals from Vietnam. Around 77% and 95% matrilineal components in theChams and the Kinhs, respectively, could be assigned into the defined mtDNA haplogroups. Additionally, three commonEast Eurasian haplogroups B, R9, and M7 account for the majority (.60%) of maternal components in both populations.Entire sequencing of 20 representative mtDNAs selected from the thus far unclassified lineages, together with four newmtDNA genome sequences from Thailand, led to the identification of one new haplogroup M77 and helped to re-evaluateseveral haplogroups determined previously. Comparing the Chams with other Southeast Asian populations reveals thatthe Chams had a closer affinity with the Mon–Khmer populations in MSEA than with the Austronesian populations fromIsland Southeast Asia (ISEA). Further analyses failed to detect the potential homelands of the Chams in ISEA. Therefore,our results suggested that the origin of the Cham was likely a process of assimilation of massive local Mon–Khmerpopulations accompanied with language shift, thus indicating that the Austronesian diffusion in MSEA was mainlymediated by cultural diffusion, at least from the matrilineal genetic perspective, an observation in agreement with thehypothesis of the Nusantao Maritime Trading and Communication Networks.
Key words: mtDNA, Cham, Vietnam, Austronesian, NMTCN.
IntroductionThe vast majority of Austronesian languages are distributedon islands from Madagascar to Easter Island; the exceptionsare Moken and Chamic, which are spoken in MainlandSoutheast Asia (MSEA) by two minority groups, Mokenand Cham, respectively (Bellwood et al. 2006). In contrastto the Moken people living as ‘‘Sea Gypsies’’ with a relativelysmall population size, the Cham people established thethriving Kingdom of Champa, which lasted as a major earlySoutheast Asian historic civilization for more than 1 millen-nium. Champa reached its zenith from the sixth to thetenth century AD and once ruled over the coastal plains
and the interior highlands in South-Central Vietnam.Thereafter, Champa began a gradual decline because ofthe growing invasions of the Kinh people from northernVietnam as well as the long-drawn-out wars with KhmerEmpire, finally being forced to merge with the Kinhs in1832 AD (Southworth 2004; Thurgood 2005; He 2006).Thus, a deeper insight into the origin of the Cham people,who harbor this Austronesian linguistic relic in MSEA, canhelp to clarify the question of how the Austronesian lan-guage had dispersed into MSEA. In this context, two prev-alent hypotheses have been proposed to explain the originof the Cham people as well as the dispersal mode of theAustronesian language. Under the ‘‘Out-of-Taiwan’’
© The Author 2010. Published by Oxford University Press on behalf of the Society for Molecular Biology and Evolution. All rights reserved. For permissions, pleasee-mail: [email protected]
Mol. Biol. Evol. 27(10):2417–2430. 2010 doi:10.1093/molbev/msq131 Advance Access publication May 31, 2010 2417
Research
article

hypothesis, the Cham ancestors were regarded as the Aus-tronesian immigrants from Island Southeast Asia(ISEA)—especially from southwest Borneo (cf. Blust1994) around 500 BC (Thurgood 1999; Higham 2002;Southworth 2004; Bellwood 2007). An alternative hypoth-esis known as ‘‘Nusantao Maritime Trading and Commu-nication Networks (NMTCN)’’ proposes that the origin ofthe Chams was primarily mediated by cultural diffusionthrough the agency of the NMTCN in which case the di-rection of diffusion and its explicit source could not be de-termined (Solheim et al. 2007). For instance, the coastalstrip of the middle and southern part of Vietnam hadserved as an especially important hub in the extensive mar-itime commerce networks around South China Sea since500 BC or even earlier (Higham 1989, 2002; Southworth2004; Bellwood 2007; Hung et al. 2007; Lam 2009).
In contrast with linguistic and archaeological works, ge-netic study allows an attempt to distinguish the influenceof demic and cultural diffusion for (pre-) historic events(Cavalli-Sforza et al. 1994; Chikhi et al. 2002; Wen, Li,et al. 2004). However, in a recent Y-chromosome study,11 Cham individuals were assigned into haplogroups O*(1/11) and O1a* (10/11) (Li et al. 2008). Because of thesmall sample size and the relatively low resolution ofY-chromosome phylogeny, the genetic structure of theCham population remains poorly understood. Hitherto,no research on the mitochondrial DNA (mtDNA) variationin the Cham population has been reported elsewhere. Bycontrast, mtDNA data from Southeast Asia, especially fromISEA, are accumulating quickly (Fucharoen et al. 2001;Prasad et al. 2001; Tajima et al. 2004; Black et al. 2006; Hillet al. 2006, 2007; Trivedi et al. 2006; Li et al. 2007; Wonget al. 2007; Irwin et al. 2008; Lertrit et al. 2008; Dancauseet al. 2009; Mona et al. 2009; Zimmermann et al. 2009;Maruyama et al. 2010; Tabbada et al. 2010). Furthermore,the appearance of complete mtDNA genomes has im-proved the resolution of mtDNA phylogeny of this region(Kong et al. 2003, 2006; Macaulay et al. 2005; Tabbada et al.2010). Therefore, to shed more light on the origin of theCham people, we first analyzed the whole control-regionand partial coding-region sequence variations of mtDNAin 168 Cham individuals collected from southern Vietnam.One hundred and thirty-nine Kinh individuals from north-ern Vietnam were also sampled for comparison as they rep-resent the majority ethnic group in Vietnam. Our resultsnot only help further understand the mtDNA phylogenyin Southeast Asia but also provide deeper insights intothe origin of the Chams—the major Austronesian relicin MSEA.
Material and Methods
Sampling and Data CollectingWe have collected 168 unrelated Cham samples (62 malesand 106 females) from Binh Thuan Province that wasa ‘‘sanctuary’’ for Chams at the point of mergence bythe expanding Kinhs and is the only part of the coastal stripretaining significant numbers of Chamic speakers in south-
ern Vietnam (Higham 2002). Additionally, 139 unrelatedKinh samples (79 males and 60 females) were collectedfrom Hanoi, northern Vietnam (fig. 1). All subjects wereinterviewed to ascertain their ethnic affiliations and toobtain informed consent before blood collection.
Comparative mtDNA data from Southeast Asia (fig. 1and table 1) and southern China were taken from previ-ously published literature (Sykes et al. 1995; Meltonet al. 1998; Prasad et al. 2001; Qian et al. 2001; Kivisildet al. 2002; Oota et al. 2002; Yao, Kong, et al. 2002; Yao,Nie, et al. 2002; Yao and Zhang 2002; Kong et al. 2003;Wen, Li, et al. 2004; Wen, Xie, et al. 2004; Macaulayet al. 2005; Trejaut et al. 2005; Wen et al. 2005; Blacket al. 2006; Hill et al. 2006, 2007; Kong et al. 2006; Trivediet al. 2006; Li et al. 2007; Wong et al. 2007; Gan et al. 2008;Irwin et al. 2008; Lertrit et al. 2008; Soares et al. 2008;Dancause et al. 2009; Jin et al. 2009; Mona et al. 2009;Zimmermann et al. 2009; Maruyama et al. 2010; Tabbadaet al. 2010; Wang et al. 2010). Additional comparative datawere taken from Laos and China (authors’ unpublisheddata).
mtDNA Sequence Variation ScreeningGenomic DNA was extracted from whole blood samples bythe standard phenol/chloroform methods. The mtDNAcontrol-region sequences were amplified by the polymer-ase chain reaction (PCR) method reported previously (Yaoet al. 2003). Then, an 832-bp segment within the controlregion, including the hypervariable segment I (HVS-I)(16038–16569) and partial HVS-II (1–300), was sequencedin all samples as described elsewhere (Yao et al. 2003). Bya first round of haplogroup-specific control-region motif
FIG. 1. Map of Southeast Asia and southern part of East Asiashowing the locations of the samples considered in this study. TheCham and the Kinh are indicated by the star symbol. The otherreported populations are indicated by bold circles (table 1). MSEA,Mainland Southeast Asia (not including Malay Peninsula); ISEA,Island Southeast Asia (including Malay Peninsula).
Peng et al. · doi:10.1093/molbev/msq131 MBE
2418

Table 1. General Information about the Populations in Southeast Asia, Hainan, and Taiwan.
Group No. Population Size Language Location Reference
MSEA 1 Cham 168 Austronesian Binh Thuan, Vietnam This study2 Kinh 139 Austro-Asiatic Hanoi, Vietnam This study3 Viet_Jina 42 Austro-Asiatic Vietnam Jin et al. (2009)4 Viet_Na 187 Austro-Asiatic Hanoi area, Vietnam Irwin et al. (2008)5 Viet_Mb 63 Austro-Asiatic Middle Vietnam Li et al. (2007)
6 Viet_Sa 35 Austro-Asiatic
First-generation SouthVietnamese immigrants,
USA Oota et al. (2002)7 Cambodia 31 Austro-Asiatic Siem Reap, Cambodia Black et al. (2006)8 Khmer 22 Austro-Asiatic Chanthaburi, Thailand Lertrit et al. (2008)
9 Chao-Bon 20 Austro-AsiaticNakhon Ratchasima,
Thailand Lertrit et al. (2008)
10 Thai_Korat 32 Tai-KadaiNakhon Ratchasima,
Thailand Lertrit et al. (2008)11 Thai_Yao 34 Tai-Kadai Northern Thailand Yao, Nie, et al. (2002)12 Mussur 21 Tibeto-Burman Chiang Mai, Thailand Fucharoen et al. (2001)13 Lisu 25 Tibeto-Burman Chiang Mai, Thailand Fucharoen et al. (2001)
14 Thai_CM 220 Tai-Kadai Chiang Mai, ThailandFucharoen et al. (2001);Zimmermann et al. (2009)
15 Thai_KK 44 Tai-Kadai Khon Kaen,Thailand Fucharoen et al. (2001)16 Thai_Jin 40 Tai-Kadai Thailand Jin et al. (2009)17 Chong 25 Austro-Asiatic Chanthaburi, Thailand Fucharoen et al. (2001)18 Phu-Thai 25 Tai-Kadai Mukdahan, Thailand Fucharoen et al. (2001)19 Lao-Song 25 Tai-Kadai Suphanburi, Thailand Fucharoen et al. (2001)20 Mokenc 12 Austronesian Surin Islands, Thailand Dancause et al. (2009)
Hainan 21 Hainan 159 Tai-Kadai Hainan Li et al. (2007)
ISEA 22 Malay_KL 183 Austronesian Kuala Lumpur, Malaysia
Tajima et al. (2004);Hill et al. (2006);
Maruyama et al. (2010)23 Malay_SG 205 Austronesian Singapore Wong et al. (2007)24 Indonesia 54 Austronesian Indonesia Tajima et al. (2004)25 Medan 42 Austronesian Medan, Sumatra Hill et al. (2006)26 Padang 24 Austronesian Padang, Sumatra Hill et al. (2006)27 Pekanbaru 52 Austronesian Pekanbaru, Sumatra Hill et al. (2006)28 Palembang 28 Austronesian Palembang, Sumatra Hill et al. (2006)29 Bangka 34 Austronesian Bangka-Belitung Islands Hill et al. (2006)30 Javanese 46 Austronesian Java Hill et al. (2007)31 Kota Kinabalu 68 Austronesian Kota Kinabulu, Borneo Hill et al. (2007)32 Banjarmasin 89 Austronesian Banjarmasin. Borneo Hill et al. (2007)33 Ujung Padang 46 Austronesian Ujung Padang, Sulawesi Hill et al. (2007)34 Palu 38 Austronesian Palu, Sulawesi Hill et al. (2007)35 Manado 89 Austronesian Manado, Sulawesi Hill et al. (2007)36 Toraja 64 Austronesian Toraja, Sulawesi Hill et al. (2007)37 Bali 82 Austronesian Bali Hill et al. (2007)38 Lombok 44 Austronesian Lombok Hill et al. (2007)39 Sumba 50 Austronesian Sumba Hill et al. (2007)40 Alor-1 45 Austronesian Alor Hill et al. (2007)41 Ambon 43 Austronesian Ambon Hill et al. (2007)
42 Flores 77 Austronesian FloresHill et al. (2007);Mona et al. (2009)
43 Adonara 77 Austronesian Adonara Mona et al. (2009)44 Solor 41 Austronesian Solor Mona et al. (2009)45 Lembata 34 Austronesian Lembata Mona et al. (2009)46 Pantar 38 Papuand Pantar Mona et al. (2009)47 Alor-2 27 Papuane Alor Mona et al. (2009)48 E-Timor 38 Austronesianf East Timor Mona et al. (2009)
49 Philippine 543 AustronesianPhilippine; Immigrants
in Taiwan
Tajima et al. (2004);Hill et al. (2007);
Tabbada et al. (2010)50 Aboriginal Malayg 96 Austronesian West Malaysia Hill et al. (2006)51 Semangg 112 Austro-Asiatic West Malaysia Hill et al. (2006)52 Senoig 52 Austro-Asiatic West Malaysia Hill et al. (2006)53 Sakaig 20 Austro-Asiatic Trang, Thailand Fucharoen et al. (2001)
mtDNA Variation in Cham Population · doi:10.1093/molbev/msq131 MBE
2419

recognition and (near-) matching search with the pub-lished mtDNA data (Yao et al. 2004), we were able to ten-tatively assign each mtDNA under study into specificallynamed haplogroups. Certain coding-region fragments con-taining diagnostic sites were further amplified and se-quenced to confirm the predicted haplogroup status ofeach mtDNA (supplementary tables S1 and S2, Supplemen-tary Material online). For the remaining samples that couldnot be classified into the available mtDNA phylogeny at thetime, their phylogenetic status was fully recognized byadopting a strategy that has been used to pinpoint EastAsian basal lineages (Kong et al. 2006; authors’ unpublisheddata). Specifically, all unclassified mtDNAs were tenta-tively assigned into different groups based on their controlregion–specific variations, then at least one representativewas selected from each group for completely mtDNA se-quencing. In this way, a total of 24 representatives wereselected for complete mitochondrial genome sequencing:16 from the Chams, 4 from the Kinhs, and 4 from the Thaiswhose HVS-I sequences had been reported in our previouswork (Yao, Nie, et al. 2002). Then, based on this newlyobtained mtDNA genomic information, at least onecoding-region specific mutation was selected for typingamong the remaining unclassified mtDNAs to further as-certain its haplogroup affiliation (supplementary table S1and S2, Supplementary Material online). Moreover, to fur-ther understand the phylogeny of haplogroup B4c2, whichpresented significant distribution differences from theother haplogroups, four additional sequences belongingto this haplogroup, as judged from their control-regionmotif (16147-16184A-16189-16217-16235), were selectedfor complete sequencing as well.
During the process of mtDNA genome sequencing, weadopted sequencing protocols reported elsewhere (Wanget al. 2008; Fendt et al. 2009; Zhao et al. 2009) and followedcaveats for quality control in mtDNA genome study (Konget al. 2008; Yao et al. 2008, 2009). To avoid any nomencla-ture conflicts, we followed the criterion of PhyloTree (http://www.phylotree.org, mtDNA tree Build 7 [10 November2009]; van Oven and Kayser 2009) as well as the newly pro-posed haplogroup naming scheme (Kong et al. 2010).Sequences were edited and aligned by DNASTAR software(DNAStar Inc., Madison, WI), and mutations were scoredrelative to the revised Cambridge reference sequence(rCRS) (Andrews et al. 1999). For the length variants in
the control region, we followed the rules proposed byBandelt and Parson (2008). The transition at 16519 andthe C-length polymorphisms in regions 16180–16193and 303–315 were disregarded in the analyses.
Phylogenetic Tree Construction and Data AnalysisIn total, 48 complete mtDNA genome sequences (including28 new mtDNAs obtained in this study as well as 20 easternEurasian complete mtDNA genomes retrieved from the lit-erature; Ingman et al. 2000; Macaulay et al. 2005; Reddy et al.2007; Dancause et al. 2009; Hartmann et al. 2009; Tabbadaet al. 2010) were employed for the phylogenetic treereconstruction. Median-joining network was reconstructedmanually and checked by the program NETWORK 4.510(www.fluxus-engineering.com/sharenet.htm) (Bandelt et al.1999). We also constructed the reduced median network(Bandelt et al. 1995) of HVS sequences in the Chams usingthe NETWORK 4.510.
The coalescent age of a haplogroup of interest wasestimated by statistics q ± r (Forster et al. 1996; Saillardet al. 2000), and recently corrected calibrated mutationrates were adopted: 7,884 years per synonymous mutationand 18,845 years per transition in HVS-I (16090–16365)(Soares et al. 2009). Principal components analysis (PCA)followed the method developed by Richards et al. (2002)with SPSS13.0 software (SPSS). Analysis of molecular vari-ance (AMOVA) was computed with the package Arlequin3.11 (Excoffier et al. 2005). To detect the potential Austro-nesian source of the Chams, haplotype-sharing analysesbetween the Cham and other Austronesian populationswere carried out based on phylogeny (Achilli et al.2007), and the DHS distances were calculated as describedby Tofanelli et al. (2009).
Results
Classification of mtDNA Sequences in the Chamsand the KinhsIn terms of the combined information from HVS and par-tial coding-region segments (supplementary tables S1 andS2, Supplementary Material online), 130 of 168 (;77.4%) ofthe Cham and 132 of 139 (;95.0%) of the Kinh sampleswere unambiguously assigned into the previously definedhaplogroups in East and Southeast Asian (Macaulay et al.2005; Kong et al. 2006; Hill et al. 2007), among which the
Table 1. Continued.
Group No. Population Size Language Location Reference
Taiwan 54 Formosa 718 Austronesian Taiwan
Sykes et al. (1995);Melton et al. (1998);Trejaut et al. (2005)
NOTE.—a Because there is no ethnolinguistic information, we referred that this population might be mainly composed of Kinh, belonging to the Austro-Asiatic population.b Although three individuals were Tai-Kadai, we considered the population as Austro-Asiatic.c The Moken were removed in PCA and frequency estimates due to small sample size and severe genetic drift (Dancause et al. 2009).d Although ten individuals were Austronesian, we considered the population as Papuan.e Although three individuals were Austronesian, we considered the population as Papuan.f Although five individuals were Papuan, we considered the population as Austronesian.g As outliers in previous PCA caused by severe genetic drift (Hill et al. 2006), these Orang Asli populations were removed in PCA.
Peng et al. · doi:10.1093/molbev/msq131 MBE
2420

most common haplogroups are B, R9, and M7, which alltogether account for 60.1% and 75.5% of the maternal genepools of the Chams and the Kinhs, respectively.
As displayed in figure 2, the mtDNA phylogeny in South-east Asia is largely improved by incorporating our 24 newmtDNA genomes, which in return helps recognize the re-maining unclassified mtDNAs pinpointed in our study.Now it becomes evident that most of these unclassifiedmtDNAs observed in the Chams and the Kinhs cluster withcertain previously reported mtDNA genomes and can beallocated into haplogroups M17, M21, M22, M50, M51,M71, M72, M73, and N21 (PhyloTree: http://www.phylotree.org). Meanwhile, haplogroups R22 and R23,which were previously defined based merely on HVS-I var-iation (Hill et al. 2007), are now substantiated by the com-plete mtDNA genomes (R22: Cham13 and Thai28; R23:Cham57). One sequence (Cham60) with specific HVS-I mo-tif 16129-16189-16213-16218-16223 was found to sharetransitions 12618 and 1393 with haplogroups M23 (consist-ing of sequences GQ389777 and FJ543102) and M46
(FJ442939), respectively, and was tentatively assigned toa newly defined basal haplogroup—M77.
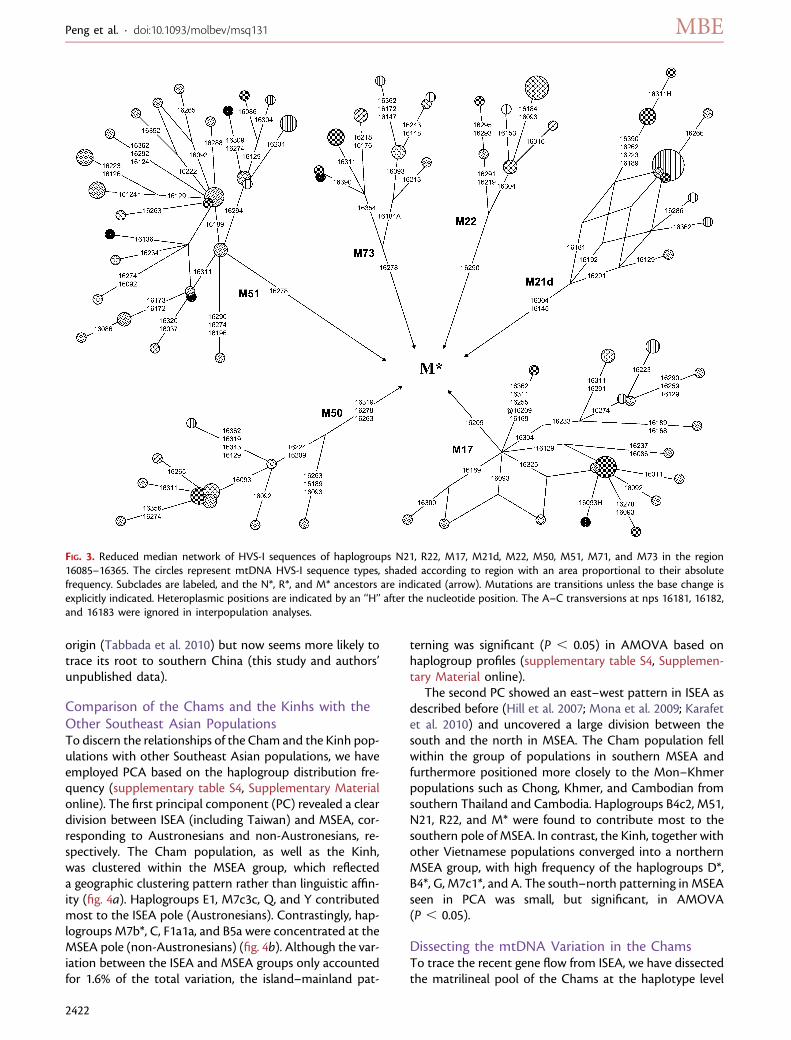
Haplogroups M17, M21, M22, M51, M71, M72, M73,N21, R22, and R23 were initially observed in Southeast Asiaand might represent the ancient maternal components inthis region (Macaulay et al. 2005; Hill et al. 2006, 2007;Tabbada et al. 2010). In light of the updated mtDNA phy-logeny of Southeast Asian (fig. 2), we performed (near-)match searches with HVS-I motifs among the publishedeastern Eurasian mtDNA data sets to evaluate the distribu-tions of these haplogroups (supplementary table S3, Sup-plementary Material online). Subsequently, the reducedmedian networks were reconstructed to display the inter-nal phylogeny within each haplogroup (fig. 3). Our resultssupport the previous observations that haplogroups M17,M21d, M22, M50, M51, M72, M73, M77, N21, R22, and R23were distributed almost exclusively in Southeast Asia andcould trace their origins back to this region (Macaulay et al.2005; Hill et al. 2006, 2007). The exception is haplogroupM71, which was recently suggested to have a Philippine
FIG. 2. Reconstructed phylogenetic tree of 48 complete mtDNA genome sequences from haplogroups M17, M21, M22, M50, M51, M71, M72,M73, M77, N21, R22, R23, and B4c2. The 20 reported sequences were taken from the literature and were further labeled by the symbols MI(Ingman et al. 2000), VM (Macaulay et al. 2005), BR (Reddy et al. 2007), KD (Dancause et al. 2009), AH (Hartmann et al. 2009), and KT (Tabbadaet al. 2010), followed by ‘‘#,’’ the geographic locations, and the sample code or the accession numbers in GenBank. Haplogroup age estimates (±standard errors) are indicated at the branch roots in terms of the calibrated mutation rate of 7,884 years per synonymous mutation in coding-region (ky: 1,000 years; Soares et al. 2009). Mutations are transitions at the respective nucleotide position unless otherwise specified. Lettersfollowing positions indicate transversions; others are transitions. Recurrent mutations are underlined. þ, insertion; d, deletion; @, backmutation; H, heterogeneity. Amino acid replacements are specified by single-letter code; s, synonymous replacements; t, change in transferRNA; r, change in ribosomal RNA gene.
mtDNA Variation in Cham Population · doi:10.1093/molbev/msq131 MBE
2421
origin (Tabbada et al. 2010) but now seems more likely totrace its root to southern China (this study and authors’unpublished data).
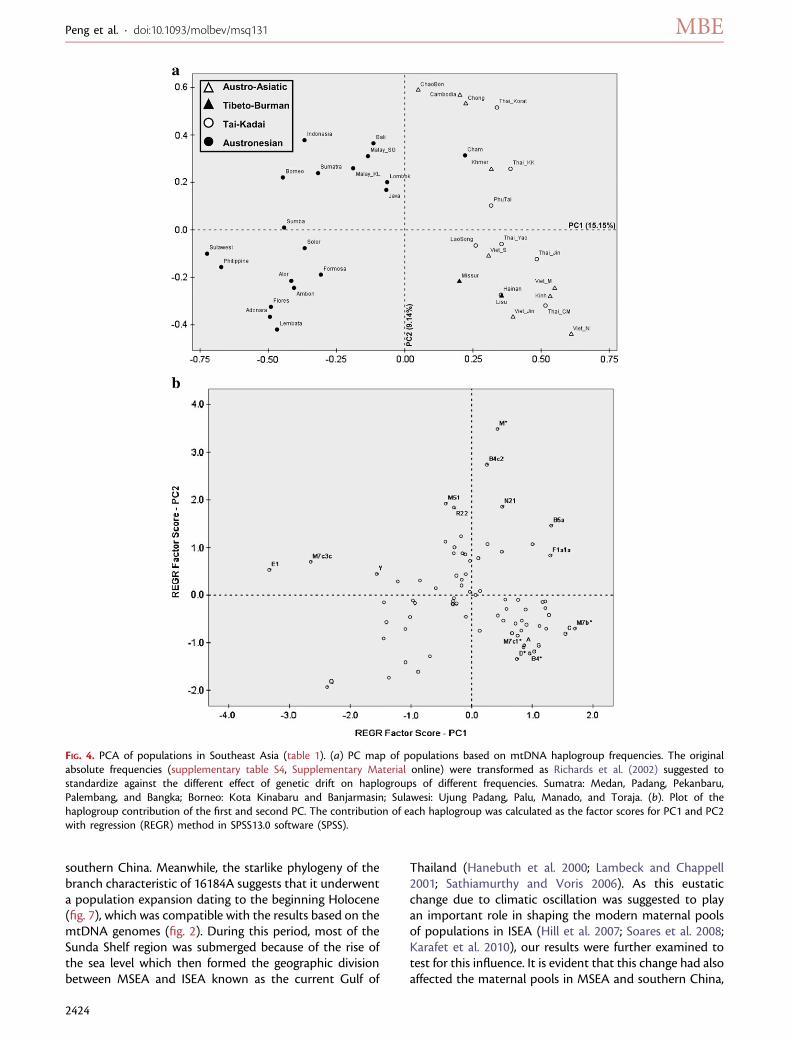
Comparison of the Chams and the Kinhs with theOther Southeast Asian PopulationsTo discern the relationships of the Cham and the Kinh pop-ulations with other Southeast Asian populations, we haveemployed PCA based on the haplogroup distribution fre-quency (supplementary table S4, Supplementary Materialonline). The first principal component (PC) revealed a cleardivision between ISEA (including Taiwan) and MSEA, cor-responding to Austronesians and non-Austronesians, re-spectively. The Cham population, as well as the Kinh,was clustered within the MSEA group, which reflecteda geographic clustering pattern rather than linguistic affin-ity (fig. 4a). Haplogroups E1, M7c3c, Q, and Y contributedmost to the ISEA pole (Austronesians). Contrastingly, hap-logroups M7b*, C, F1a1a, and B5a were concentrated at theMSEA pole (non-Austronesians) (fig. 4b). Although the var-iation between the ISEA and MSEA groups only accountedfor 1.6% of the total variation, the island–mainland pat-
terning was significant (P , 0.05) in AMOVA based onhaplogroup profiles (supplementary table S4, Supplemen-tary Material online).
The second PC showed an east–west pattern in ISEA asdescribed before (Hill et al. 2007; Mona et al. 2009; Karafetet al. 2010) and uncovered a large division between thesouth and the north in MSEA. The Cham population fellwithin the group of populations in southern MSEA andfurthermore positioned more closely to the Mon–Khmerpopulations such as Chong, Khmer, and Cambodian fromsouthern Thailand and Cambodia. Haplogroups B4c2, M51,N21, R22, and M* were found to contribute most to thesouthern pole of MSEA. In contrast, the Kinh, together withother Vietnamese populations converged into a northernMSEA group, with high frequency of the haplogroups D*,B4*, G, M7c1*, and A. The south–north patterning in MSEAseen in PCA was small, but significant, in AMOVA(P , 0.05).
Dissecting the mtDNA Variation in the ChamsTo trace the recent gene flow from ISEA, we have dissectedthe matrilineal pool of the Chams at the haplotype level
FIG. 3. Reduced median network of HVS-I sequences of haplogroups N21, R22, M17, M21d, M22, M50, M51, M71, and M73 in the region16085–16365. The circles represent mtDNA HVS-I sequence types, shaded according to region with an area proportional to their absolutefrequency. Subclades are labeled, and the N*, R*, and M* ancestors are indicated (arrow). Mutations are transitions unless the base change isexplicitly indicated. Heteroplasmic positions are indicated by an ‘‘H’’ after the nucleotide position. The A–C transversions at nps 16181, 16182,and 16183 were ignored in interpopulation analyses.
Peng et al. · doi:10.1093/molbev/msq131 MBE
2422

and compared the Cham mtDNA haplotypes to more than3,000 HVS-I sequences from ISEA (Melton et al. 1998; Tajimaet al. 2004; Trejaut et al. 2005; Hill et al. 2006, 2007; Wonget al. 2007; Soares et al. 2008; Maruyama et al. 2010; Tabbadaet al. 2010). Twenty-eight Cham haplotypes (16080-16370)belonging to different (sub-)haplogroups have identicalcounterparts in ISEA (fig. 5). Among them, eight haplotypes(consisting of 17 sequences; ;10.1%, 17/168) belonging tohaplogroups B5a, D, E, M17, M50, M51, and R23 were notobserved in a number of 10,572 samples from China (9,633)and MSEA (939) but shared exclusively between the Chamsand some ISEA populations (fig. 5), thus indicative of certaindirect and recent genetic links with ISEA. To control for thepossibility of recent back migration from MSEA to ISEA, weperformed the founder analysis with f1 criterion (Richardset al. 2000) on the 28 haplotypes. Three haplotypes withinhaplogroups D, M7b, and M8a, which failed to relateto candidate founders in ISEA, were removed in further anal-yses (fig. 5). The haplotype (with motif 16147-16184A-16189-16217-16235) within haplogroup B4c2 was not con-sidered as well because it likely represents a more ancientmigration event (see below). As a result, 24 haplotypes con-sisting of 51 sequences (;30.4%, 51/168) in the Chams
shared commonality with ISEA populations (table 2 andfig. 5), thus potentially identifying recent gene flow fromISEA. Then, the DHS distances between the Chams and otherISEA populations were calculated based on haplotype-shar-ing analyses (table 2). Samples from Lombok had the lowestDHS distance (0.850); the highest value (0.959) was observedin Formosan samples from Taiwan.
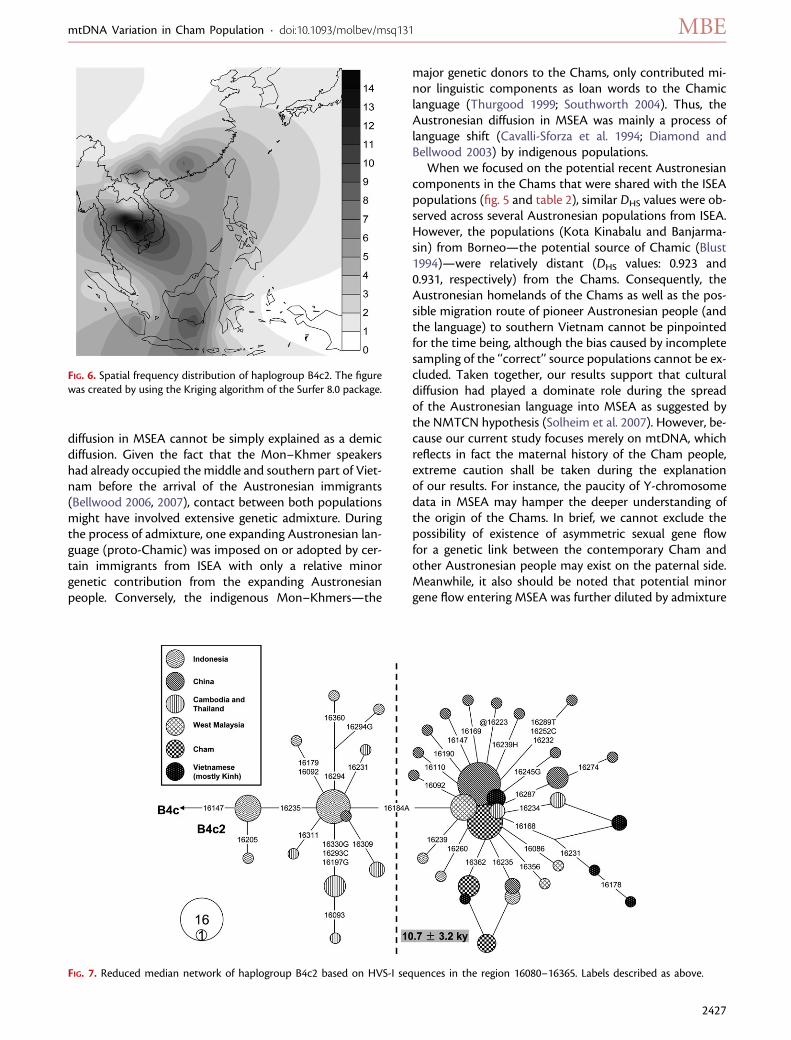
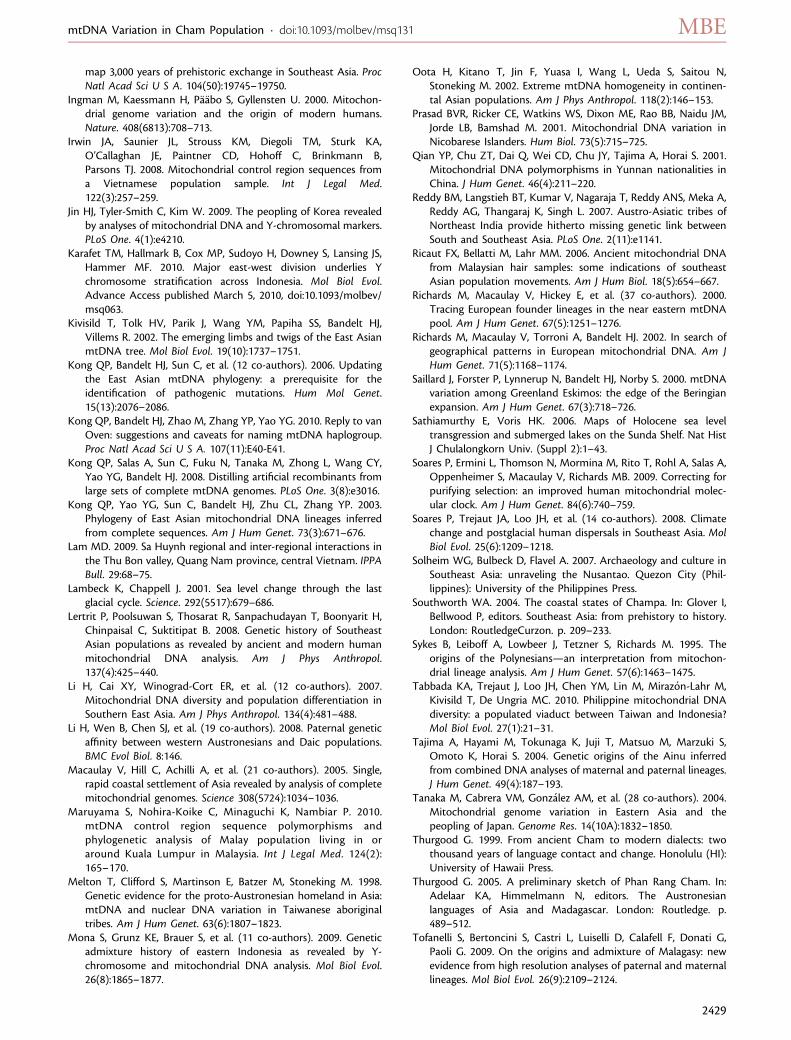
Potential Marker for a Postglacial DispersalHaplogroup B4c2, first defined by Tanaka et al. (2004), wasfound with relatively high frequency (;10.1%, 17/168) inthe Chams. This haplogroup is distributed widely in south-ern China and Southeast Asia and reaches a peak frequency(;15–16%) in Cambodia and its neighboring area inThailand (fig. 6). In spite of close geographic distance be-tween southern Vietnam and Cambodia, haplogroup B4c2in the Chams was unlikely the result of recent gene flowfrom Cambodia and Thailand because most B4c2 types(9/13) from both countries were located in differentbranches with the Cham-specific haplotypes (fig. 7). Thereduced–median network of B4c2 presented an obviousdivision (as distinguishable by transversion 16184A) be-tween the lineages from ISEA and the MSEA as well as
FIG. 3. (Continued).
mtDNA Variation in Cham Population · doi:10.1093/molbev/msq131 MBE
2423
southern China. Meanwhile, the starlike phylogeny of thebranch characteristic of 16184A suggests that it underwenta population expansion dating to the beginning Holocene(fig. 7), which was compatible with the results based on themtDNA genomes (fig. 2). During this period, most of theSunda Shelf region was submerged because of the rise ofthe sea level which then formed the geographic divisionbetween MSEA and ISEA known as the current Gulf of
Thailand (Hanebuth et al. 2000; Lambeck and Chappell2001; Sathiamurthy and Voris 2006). As this eustaticchange due to climatic oscillation was suggested to playan important role in shaping the modern maternal poolsof populations in ISEA (Hill et al. 2007; Soares et al. 2008;Karafet et al. 2010), our results were further examined totest for this influence. It is evident that this change had alsoaffected the maternal pools in MSEA and southern China,
FIG. 4. PCA of populations in Southeast Asia (table 1). (a) PC map of populations based on mtDNA haplogroup frequencies. The originalabsolute frequencies (supplementary table S4, Supplementary Material online) were transformed as Richards et al. (2002) suggested tostandardize against the different effect of genetic drift on haplogroups of different frequencies. Sumatra: Medan, Padang, Pekanbaru,Palembang, and Bangka; Borneo: Kota Kinabaru and Banjarmasin; Sulawesi: Ujung Padang, Palu, Manado, and Toraja. (b). Plot of thehaplogroup contribution of the first and second PC. The contribution of each haplogroup was calculated as the factor scores for PC1 and PC2with regression (REGR) method in SPSS13.0 software (SPSS).
Peng et al. · doi:10.1093/molbev/msq131 MBE
2424

an observation in agreement with previous suggestions(Wen et al. 2005; Ricaut et al. 2006).
DiscussionThe mtDNA phylogeny in Southeast Asia reconstructed inthe present study (fig. 2) helps identify phylogenetic sta-tus of all mtDNAs from 168 Cham and 139 Kinh individ-uals. Most previously uncharacterized mtDNA lineages inthe Chams and Kinhs could be allocated into the indig-enous haplogroups (i.e., M17, M21, M22, M50, M51,M73, M77, N21, R22, and R23) in Southeast Asia. The dis-tribution (supplementary table S3, SupplementaryMaterial online; fig. 3) and age estimates (fig. 2) of thesehaplogroups show patterns of long-term in situ evolution(Macaulay et al. 2005; Hill et al. 2006, 2007; Tabbada et al.2010). However, in the Chams, most previously uncharac-terized lineages were found to be shared with the otherpopulations in Southeast Asia or located at the tips of thenetworks with the derived states (fig. 3). These patternssuggest that these lineages in the Chams were likely to beintroduced by the other populations, especially in south-
ern MSEA (Thailand and Cambodia) and ISEA, via recentgene flow.
Although the Chams show tight links with Austronesianspeakers from ISEA in language and culture, analysis of theCham mtDNA variation revealed that the genetic links be-tween the Chams and the ISEA populations were muchweaker. To illustrate, the ISEA characteristic and prevailinghaplogroup E (Hill et al. 2007; Soares et al. 2008) was onlydetected in two Cham individuals. Likewise, except for hap-logroup M7c3c (;1.2%, 2/168 in the Chams), the other‘‘Out-of-Taiwan’’ candidate lineages (e.g., D5, M7b3, Y2,F1a3, and F1a4) (Hill et al. 2007; Tabbada et al. 2010) thatwere distributed widely in ISEA were not observed in theChams. As a result, the mtDNA profiles of the Chamsshowed significant difference with populations in ISEA,an observation in accordance with the PCA clustering re-sults: the Cham displayed a closer relationship with pop-ulations (especially the Mon–Khmers) in southern MSEArather than with the Austronesian populations from ISEA(fig. 4).
The discordance between the linguistic and the geneticevidence in the Chams indicates that the Austronesian
FIG. 5. Network profile of the 91 mtDNA haplotypes observed in the 168 Chams. This tree was constructed manually by comparison with theavailable mtDNA data sets and the basal East Asian and Southeast Asian mtDNA classification trees (Kong et al. 2006; Hill et al. 2007).Diagnostic sites genotyped in this work are indicated in bold. Mutations are transitions unless the base change is explicitly indicated. Insertionsare suffixed with a plus sign (þ) and the inserted nucleotide and deletions have a ‘‘d’’ suffix. Heteroplasmic positions are indicated by a ‘‘H’’after the nucleotide position. Back mutations are indicated by a ‘‘@’’ before the nucleotide position. The A–C transversions at nps 16181,16182, and 16183 were ignored in interpopulation analyses.
mtDNA Variation in Cham Population · doi:10.1093/molbev/msq131 MBE
2425

Table 2. The DHS distances based on haplotype sharing between the Cham and other Austronesian populations from ISEA.
Halogroup
Hap
lotypeHVS-I(16,000
1)a
Cham
Philippine
Form
osa
Java
Bali
Lombok
Sumba
Alor
Ambon
Orang-Asli
Indonesia
Malay
KL
Malay
S
Medan
Pekan
baru
Ban
gka
Pad
ang
Palem
ban
g
Ban
jarm
asin
Kota
Kinabalu
Man
ado
Palu
UjungPad
ang
Toraja
Indonesia
/EastMalaysia
B4a 189 217 261 1 43 28 1 2 2 1 3 7 2 5 3 1 4 3B5a 129 140 189 266A 2 1B5a 140 189 249 266A 1 1B5a 140 189 261 266A 4 4 3 1 2B5a 140 189 266A 6 1 1 4 3 2 3 3 4 7 2 1 3 1 2 1B5a 140 189 266A 291 3 1B5b (067) 140 189 243 1 26 1 2 2 1 1 1E1a 223 291 362 390 1 38 24 3 1 2 2 5 6 3 2 1 1 2 15 3 5 10E2 (051) 086 223 362 (390) 1 1F1a 129 172 304 2 1 1 1 2 5 4 1 1 1 2 1 1 1F1a 129 172 304 362 1 1 1F1a1 129 162 172 189 304 1 6F1a1a 108 129 162 172 189 304 1 4 1 5F1a1a 108 129 162 172 304 7 2 1 3 1 1 1 17 2 2 4 1 2 1 1 1 1 1M21d 145 181 192 223 291 304 1 1M17 129 209 223 325 5 1M51 189 223 278 1 1 1 1 1 1 1 1M50 093 209 223 224 263 278 319 3 3 2M7b 129 189 223 297 1 1 1 1M7b1 129 189 192 223 297 1 1 1 3 1 3 1M7b1 129 192 223 297 2 1M7c3c 223 295 362 2 37 20 5 3 1 3 1 1 8 3 6 9 1 3 1 6 1 3 8 6 1 4N21 193 223 1 1 1R23 256 290 (465) 2 3 1
No. different haplotypes 86 173 111 23 60 36 34 34 29 49 42 125 133 32 37 24 19 22 62 47 48 28 32 27 —
Population size 168 543 718 46 82 44 50 45 43 280 54 183 205 42 52 34 24 28 89 68 89 38 46 64 —
DHS 0.945 0.959 0.943 0.861 0.850 0.915 0.882 0.911 0.940 0.857 0.923 0.898 0.879 0.917 0.926 0.941 0.905 0.931 0.923 0.908 0.892 0.862 0.892 —
a The fragment of HVS-I (16080-16370) was considered in the haplotype-sharing analyses, so the sites out of this fragment were noted in parentheses.
Peng
etal.
·doi:10.1093/m
olbev/m
sq131MBE
2426
diffusion in MSEA cannot be simply explained as a demicdiffusion. Given the fact that the Mon–Khmer speakershad already occupied the middle and southern part of Viet-nam before the arrival of the Austronesian immigrants(Bellwood 2006, 2007), contact between both populationsmight have involved extensive genetic admixture. Duringthe process of admixture, one expanding Austronesian lan-guage (proto-Chamic) was imposed on or adopted by cer-tain immigrants from ISEA with only a relative minorgenetic contribution from the expanding Austronesianpeople. Conversely, the indigenous Mon–Khmers—the
major genetic donors to the Chams, only contributed mi-nor linguistic components as loan words to the Chamiclanguage (Thurgood 1999; Southworth 2004). Thus, theAustronesian diffusion in MSEA was mainly a process oflanguage shift (Cavalli-Sforza et al. 1994; Diamond andBellwood 2003) by indigenous populations.
When we focused on the potential recent Austronesiancomponents in the Chams that were shared with the ISEApopulations (fig. 5 and table 2), similar DHS values were ob-served across several Austronesian populations from ISEA.However, the populations (Kota Kinabalu and Banjarma-sin) from Borneo—the potential source of Chamic (Blust1994)—were relatively distant (DHS values: 0.923 and0.931, respectively) from the Chams. Consequently, theAustronesian homelands of the Chams as well as the pos-sible migration route of pioneer Austronesian people (andthe language) to southern Vietnam cannot be pinpointedfor the time being, although the bias caused by incompletesampling of the ‘‘correct’’ source populations cannot be ex-cluded. Taken together, our results support that culturaldiffusion had played a dominate role during the spreadof the Austronesian language into MSEA as suggested bythe NMTCN hypothesis (Solheim et al. 2007). However, be-cause our current study focuses merely on mtDNA, whichreflects in fact the maternal history of the Cham people,extreme caution shall be taken during the explanationof our results. For instance, the paucity of Y-chromosomedata in MSEA may hamper the deeper understanding ofthe origin of the Chams. In brief, we cannot exclude thepossibility of existence of asymmetric sexual gene flowfor a genetic link between the contemporary Cham andother Austronesian people may exist on the paternal side.Meanwhile, it also should be noted that potential minorgene flow entering MSEA was further diluted by admixture
FIG. 6. Spatial frequency distribution of haplogroup B4c2. The figurewas created by using the Kriging algorithm of the Surfer 8.0 package.
FIG. 7. Reduced median network of haplogroup B4c2 based on HVS-I sequences in the region 16080–16365. Labels described as above.
mtDNA Variation in Cham Population · doi:10.1093/molbev/msq131 MBE
2427

such as the one suggested with Mon–Khmer ancestral pop-ulation to a level that may not be appreciable. In regards tothis point, multidisciplinary data are essential to uncoverthe entire past history of the Cham population.
In addition, the comparison between the Chams and theKinhs reveal a significant difference (PCA and AMOVA) inthe maternal gene pools, which was consistent with thedifferent ethnohistories of the Chams and the Kinhs that,respectively, represent the different cultures in southernand northern Vietnam. Southern Vietnam, which was his-torically a highly Indianized kingdom known as Champa,harbored a culture similar to that of the Khmer Empire.In contrast, northern Vietnam, known as Jiaozhi or Annam,was under Chinese domination for more than 1,000 years.Besides the deeply Sinicized culture, substantial Chineseimmigration would make a hefty contribution to the mod-ern gene pool of the Kinhs in northern Vietnam (Higham2002; He 2006). Although masses of Cham people were sug-gested to have been assimilated into the Kinh group afterthe annihilation of Champa (He 2006), it seems that theremaining group of Chams has retained its own character-istics not only in culture but also in genetics, which welldistinguish this unique population from the Kinhs, not-withstanding waves of Kinhs influxing into southern Viet-nam in the past several hundred years.
Supplementary MaterialSupplementary tables S1–S4 are available at MolecularBiology and Evolution online (http://www.mbe.oxfordjournals.org/).
AcknowledgmentsWe thank Chun-Ling Zhu, Gui-Mei Li, Wen-Zhi Wang, YangYang, Shi-Fang Wu, and Shi-Kang Gou for technical assis-tance. We are grateful to all volunteers for providing DNAsamples. We thank the two anonymous referees for theirvaluable comments and Miss Diana Chen for language ed-iting. This research was supported by grants from the Nat-ural Science Foundation of Yunnan Province, NationalNatural Science Foundation of China (30900797 and30621092), and the Chinese Academy of Sciences.
ReferencesAchilli A, Olivieri A, Pala M, et al. (22 co-authors). 2007.
Mitochondrial DNA variation of modern Tuscans supports thenear eastern origin of Etruscans. Am J Hum Genet. 80(4):759–768.
Andrews RM, Kubacka I, Chinnery PF, Lightowlers RN, Turnbull DM,Howell N. 1999. Reanalysis and revision of the Cambridgereference sequence for human mitochondrial DNA. Nat Genet.23(2):147.
Bandelt HJ, Forster P, Rohl A. 1999. Median-joining networks forinferring intraspecific phylogenies. Mol Biol Evol. 16(1):37–48.
Bandelt HJ, Forster P, Sykes BC, Richards MB. 1995. Mitochondrialportraits of human populations using median networks. Genetics141(2):743–753.
Bandelt HJ, Parson W. 2008. Consistent treatment of length variantsin the human mtDNA control region: a reappraisal. Int J LegalMed. 122(1):11–21.
Bellwood P. 2006. Austronesian prehistory in southeast Asia:homeland, expansion and transformation. In: Bellwood P, Fox JJ,Tryon D, editors. The austronesians: historical and comparativeperspectives. Canberra (ACT): ANU E Press. p. 103–114.
Bellwood P. 2007. Prehistory of the Indo-Malaysian Archipelago.Canberra (ACT): ANU E Press.
Bellwood P, Fox JJ, Tryon D. 2006. The Austronesians in history:common origins and diverse transformations. In: Bellwood P, Fox JJ,Tryon D, editors. The Austronesians: historical and comparativeperspectives. Canberra (ACT): ANU E Press. p. 1–14.
Black ML, Dufall K, Wise C, Sulliva S, Bittles AH. 2006. Geneticancestries in northwest Cambodia. Ann Hum Biol. 33(5–6):620–627.
Blust RA. 1994. The Austronesian settlement of mainland SoutheastAsia. In: Adams KL, Hudak TJ, editors. Papers from the SecondAnnual Meeting of the Southeast Asian Linguistics Society, 1992.Tempe (AZ): Arizona State University. p. 25–83.
Cavalli-Sforza LL, Menozzi P, Piazza A. 1994. The history andgeography of human genes. Princeton (NJ): Princeton UniversityPress.
Chikhi L, Nichols RA, Barbujani G, Beaumont MA. 2002. Y geneticdata support the Neolithic demic diffusion model. Proc NatlAcad Sci U S A. 99(17):11008–11013.
Dancause KN, Chan CW, Arunotai NH, Lum JK. 2009. Origins of theMoken Sea Gypsies inferred from mitochondrial hypervariableregion and whole genome sequences. J Hum Genet. 54(2):86–93.
Diamond J, Bellwood P. 2003. Farmers and their languages: the firstexpansions. Science 300(5619):597–603.
Excoffier L, Laval G, Schneider S. 2005. Arlequin ver. 3.0: anintegrated software package for population genetics dataanalysis. Evol Bioinform Online. 1:47–50.
Fendt L, Zimmermann B, Daniaux M, Parson W. 2009. Sequencingstrategy for the whole mitochondrial genome resulting in highquality sequences. BMC Genomics. 10:139.
Forster P, Harding R, Torroni A, Bandelt HJ. 1996. Origin andevolution of native American mtDNA variation: a reappraisal.Am J Hum Genet. 59(4):935–945.
Fucharoen G, Fucharoen S, Horai S. 2001. Mitochondrial DNApolymorphisms in Thailand. J Hum Genet. 46(3):115–125.
Gan RJ, Pan SL, Mustavich LF, et al. (13 co-authors). 2008. Pinghuapopulation as an exception of Han Chinese’s coherent geneticstructure. J Hum Genet. 53(4):303–313.
Hanebuth T, Stattegger K, Grootes PM. 2000. Rapid flooding of theSunda Shelf: a late-glacial sea-level record. Science 288(5468):1033–1035.
Hartmann A, Thieme M, Nanduri LK, Stempfl T, Moehle C,Kivisild T, Oefner PJ. 2009. Validation of microarray-basedresequencing of 93 worldwide mitochondrial genomes. HumMutat. 30(1):115–122.
He P. 2006. The origin and evolution of nationalities in theIndochina Peninsula. Beijing (China): The Ethnic PublishingHouse.
Higham C. 1989. The archaeology of mainland Southeast Asia: from10,000 BC to the fall of Angkor. Cambridge (UK): CambridgeUniversity Press.
Higham C. 2002. Early cultures of Mainland Southeast Asia. Bangkok(Thailand): River Books.
Hill C, Soares P, Mormina M, et al. (12 co-authors). 2006.Phylogeography and ethnogenesis of aboriginal SoutheastAsians. Mol Biol Evol. 23(12):2480–2491.
Hill C, Soares P, Mormina M, et al. (11 co-authors). 2007. Amitochondrial stratigraphy for Island Southeast Asia. Am J HumGenet. 80(1):29–43.
Hung HC, Iizuka Y, Bellwood P, Nguyen KD, Bellina B, Silapanth P,Dizon E, Santiago R, Datan I, Manton JH. 2007. Ancient jades
Peng et al. · doi:10.1093/molbev/msq131 MBE
2428
map 3,000 years of prehistoric exchange in Southeast Asia. ProcNatl Acad Sci U S A. 104(50):19745–19750.
Ingman M, Kaessmann H, Paabo S, Gyllensten U. 2000. Mitochon-drial genome variation and the origin of modern humans.Nature. 408(6813):708–713.
Irwin JA, Saunier JL, Strouss KM, Diegoli TM, Sturk KA,O’Callaghan JE, Paintner CD, Hohoff C, Brinkmann B,Parsons TJ. 2008. Mitochondrial control region sequences froma Vietnamese population sample. Int J Legal Med.122(3):257–259.
Jin HJ, Tyler-Smith C, Kim W. 2009. The peopling of Korea revealedby analyses of mitochondrial DNA and Y-chromosomal markers.PLoS One. 4(1):e4210.
Karafet TM, Hallmark B, Cox MP, Sudoyo H, Downey S, Lansing JS,Hammer MF. 2010. Major east-west division underlies Ychromosome stratification across Indonesia. Mol Biol Evol.Advance Access published March 5, 2010, doi:10.1093/molbev/msq063.
Kivisild T, Tolk HV, Parik J, Wang YM, Papiha SS, Bandelt HJ,Villems R. 2002. The emerging limbs and twigs of the East AsianmtDNA tree. Mol Biol Evol. 19(10):1737–1751.
Kong QP, Bandelt HJ, Sun C, et al. (12 co-authors). 2006. Updatingthe East Asian mtDNA phylogeny: a prerequisite for theidentification of pathogenic mutations. Hum Mol Genet.15(13):2076–2086.
Kong QP, Bandelt HJ, Zhao M, Zhang YP, Yao YG. 2010. Reply to vanOven: suggestions and caveats for naming mtDNA haplogroup.Proc Natl Acad Sci U S A. 107(11):E40-E41.
Kong QP, Salas A, Sun C, Fuku N, Tanaka M, Zhong L, Wang CY,Yao YG, Bandelt HJ. 2008. Distilling artificial recombinants fromlarge sets of complete mtDNA genomes. PLoS One. 3(8):e3016.
Kong QP, Yao YG, Sun C, Bandelt HJ, Zhu CL, Zhang YP. 2003.Phylogeny of East Asian mitochondrial DNA lineages inferredfrom complete sequences. Am J Hum Genet. 73(3):671–676.
Lam MD. 2009. Sa Huynh regional and inter-regional interactions inthe Thu Bon valley, Quang Nam province, central Vietnam. IPPABull. 29:68–75.
Lambeck K, Chappell J. 2001. Sea level change through the lastglacial cycle. Science. 292(5517):679–686.
Lertrit P, Poolsuwan S, Thosarat R, Sanpachudayan T, Boonyarit H,Chinpaisal C, Suktitipat B. 2008. Genetic history of SoutheastAsian populations as revealed by ancient and modern humanmitochondrial DNA analysis. Am J Phys Anthropol.137(4):425–440.
Li H, Cai XY, Winograd-Cort ER, et al. (12 co-authors). 2007.Mitochondrial DNA diversity and population differentiation inSouthern East Asia. Am J Phys Anthropol. 134(4):481–488.
Li H, Wen B, Chen SJ, et al. (19 co-authors). 2008. Paternal geneticaffinity between western Austronesians and Daic populations.BMC Evol Biol. 8:146.
Macaulay V, Hill C, Achilli A, et al. (21 co-authors). 2005. Single,rapid coastal settlement of Asia revealed by analysis of completemitochondrial genomes. Science 308(5724):1034–1036.
Maruyama S, Nohira-Koike C, Minaguchi K, Nambiar P. 2010.mtDNA control region sequence polymorphisms andphylogenetic analysis of Malay population living in oraround Kuala Lumpur in Malaysia. Int J Legal Med. 124(2):165–170.
Melton T, Clifford S, Martinson E, Batzer M, Stoneking M. 1998.Genetic evidence for the proto-Austronesian homeland in Asia:mtDNA and nuclear DNA variation in Taiwanese aboriginaltribes. Am J Hum Genet. 63(6):1807–1823.
Mona S, Grunz KE, Brauer S, et al. (11 co-authors). 2009. Geneticadmixture history of eastern Indonesia as revealed by Y-chromosome and mitochondrial DNA analysis. Mol Biol Evol.26(8):1865–1877.
Oota H, Kitano T, Jin F, Yuasa I, Wang L, Ueda S, Saitou N,Stoneking M. 2002. Extreme mtDNA homogeneity in continen-tal Asian populations. Am J Phys Anthropol. 118(2):146–153.
Prasad BVR, Ricker CE, Watkins WS, Dixon ME, Rao BB, Naidu JM,Jorde LB, Bamshad M. 2001. Mitochondrial DNA variation inNicobarese Islanders. Hum Biol. 73(5):715–725.
Qian YP, Chu ZT, Dai Q, Wei CD, Chu JY, Tajima A, Horai S. 2001.Mitochondrial DNA polymorphisms in Yunnan nationalities inChina. J Hum Genet. 46(4):211–220.
Reddy BM, Langstieh BT, Kumar V, Nagaraja T, Reddy ANS, Meka A,Reddy AG, Thangaraj K, Singh L. 2007. Austro-Asiatic tribes ofNortheast India provide hitherto missing genetic link betweenSouth and Southeast Asia. PLoS One. 2(11):e1141.
Ricaut FX, Bellatti M, Lahr MM. 2006. Ancient mitochondrial DNAfrom Malaysian hair samples: some indications of southeastAsian population movements. Am J Hum Biol. 18(5):654–667.
Richards M, Macaulay V, Hickey E, et al. (37 co-authors). 2000.Tracing European founder lineages in the near eastern mtDNApool. Am J Hum Genet. 67(5):1251–1276.
Richards M, Macaulay V, Torroni A, Bandelt HJ. 2002. In search ofgeographical patterns in European mitochondrial DNA. Am JHum Genet. 71(5):1168–1174.
Saillard J, Forster P, Lynnerup N, Bandelt HJ, Norby S. 2000. mtDNAvariation among Greenland Eskimos: the edge of the Beringianexpansion. Am J Hum Genet. 67(3):718–726.
Sathiamurthy E, Voris HK. 2006. Maps of Holocene sea leveltransgression and submerged lakes on the Sunda Shelf. Nat HistJ Chulalongkorn Univ. (Suppl 2):1–43.
Soares P, Ermini L, Thomson N, Mormina M, Rito T, Rohl A, Salas A,Oppenheimer S, Macaulay V, Richards MB. 2009. Correcting forpurifying selection: an improved human mitochondrial molec-ular clock. Am J Hum Genet. 84(6):740–759.
Soares P, Trejaut JA, Loo JH, et al. (14 co-authors). 2008. Climatechange and postglacial human dispersals in Southeast Asia. MolBiol Evol. 25(6):1209–1218.
Solheim WG, Bulbeck D, Flavel A. 2007. Archaeology and culture inSoutheast Asia: unraveling the Nusantao. Quezon City (Phil-lippines): University of the Philippines Press.
Southworth WA. 2004. The coastal states of Champa. In: Glover I,Bellwood P, editors. Southeast Asia: from prehistory to history.London: RoutledgeCurzon. p. 209–233.
Sykes B, Leiboff A, Lowbeer J, Tetzner S, Richards M. 1995. Theorigins of the Polynesians—an interpretation from mitochon-drial lineage analysis. Am J Hum Genet. 57(6):1463–1475.
Tabbada KA, Trejaut J, Loo JH, Chen YM, Lin M, Mirazon-Lahr M,Kivisild T, De Ungria MC. 2010. Philippine mitochondrial DNAdiversity: a populated viaduct between Taiwan and Indonesia?Mol Biol Evol. 27(1):21–31.
Tajima A, Hayami M, Tokunaga K, Juji T, Matsuo M, Marzuki S,Omoto K, Horai S. 2004. Genetic origins of the Ainu inferredfrom combined DNA analyses of maternal and paternal lineages.J Hum Genet. 49(4):187–193.
Tanaka M, Cabrera VM, Gonzalez AM, et al. (28 co-authors). 2004.Mitochondrial genome variation in Eastern Asia and thepeopling of Japan. Genome Res. 14(10A):1832–1850.
Thurgood G. 1999. From ancient Cham to modern dialects: twothousand years of language contact and change. Honolulu (HI):University of Hawaii Press.
Thurgood G. 2005. A preliminary sketch of Phan Rang Cham. In:Adelaar KA, Himmelmann N, editors. The Austronesianlanguages of Asia and Madagascar. London: Routledge. p.489–512.
Tofanelli S, Bertoncini S, Castri L, Luiselli D, Calafell F, Donati G,Paoli G. 2009. On the origins and admixture of Malagasy: newevidence from high resolution analyses of paternal and maternallineages. Mol Biol Evol. 26(9):2109–2124.
mtDNA Variation in Cham Population · doi:10.1093/molbev/msq131 MBE
2429

Trejaut JA, Kivisild T, Loo JH, Lee CL, He CL, Hsu CJ, Li ZY, Lin M.2005. Traces of archaic mitochondrial lineages persist inAustronesian-speaking Formosan populations. PLoS Biol.3(8):1362–1372.
Trivedi R, Sitalaximi T, Banerjee J, Singh A, Sircar PK, Kashyap VK.2006. Molecular insights into the origins of the Shompen,a declining population of the Nicobar archipelago. J Hum Genet.51(3):217–226.
van Oven M, Kayser M. 2009. Updated comprehensive phylogenetictree of global human mitochondrial DNA variation. Hum Mutat.30(2):E386–E394.
Wang HW, Jia XY, Ji YL, Kong QP, Zhang QJ, Yao YG, Zhang YP.2008. Strikingly different penetrance of LHON in two Chinesefamilies with primary mutation G11778A is independent ofmtDNA haplogroup background and secondary mutationG13708A. Mutat Res. 643(1–2):48–53.
Wang WZ, Wang CY, Cheng YT, Xu AL, Zhu CL, Wu SF, Kong QP,Zhang YP. 2010. Tracing the origins of Hakka and Chaoshaneseby mitochondrial DNA analysis. Am J Phys Anthropol.141(1):124–130.
Wen B, Li H, Gao S, Mao XY, et al. (18 co-authors). 2005. Geneticstructure of Hmong-Mien speaking populations in East Asia asrevealed by mtDNA lineages. Mol Biol Evol. 22(3):725–734.
Wen B, Li H, Lu DR, et al. (18 co-authors). 2004. Genetic evidencesupports demic diffusion of Han culture. Nature 431(7006):302–305.
Wen B, Xie XH, Gao S, et al. (13 co-authors). 2004. Analyses ofgenetic structure of Tibeto-Burman populations reveals sex-biased admixture in southern Tibeto-Burmans. Am J Hum Genet.74(5):856–865.
Wong HY, Tang JS, Budowle B, Allard MW, Syn CK, Tan-Siew WF,Chow ST. 2007. Sequence polymorphism of the mitochondrial
DNA hypervariable regions I and II in 205 Singapore Malays. LegMed (Tokyo). 9(1):33–37.
Yao YG, Kong QP, Bandelt HJ, Kivisild T, Zhang YP. 2002.Phylogeographic differentiation of mitochondrial DNA in HanChinese. Am J Hum Genet. 70(3):635–651.
Yao YG, Kong QP, Man XY, Bandelt HJ, Zhang YP. 2003.Reconstructing the evolutionary history of China: a caveatabout inferences drawn from ancient DNA. Mol Biol Evol.20(2):214–219.
Yao YG, Kong QP, Salas A, Bandelt HJ. 2008. Pseudomitochondrialgenome haunts disease studies. J Med Genet. 45(12):769–772.
Yao YG, Kong QP, Wang CY, Zhu CL, Zhang YP. 2004. Differentmatrilineal contributions to genetic structure of ethnic groupsin the Silk Road region in China. Mol Biol Evol. 21(12):2265–2280.
Yao YG, Nie L, Harpending H, Fu YX, Yuan ZG, Zhang YP. 2002.Genetic relationship of Chinese ethnic populations revealedby mtDNA sequence diversity. Am J Phys Anthropol. 118(1):63–76.
Yao YG, Salas A, Logan I, Bandelt HJ. 2009. mtDNA data mining inGenBank needs surveying. Am J Hum Genet. 85(6):929–933.
Yao YG, Zhang YP. 2002. Phylogeographic analysis of mtDNAvariation in four ethnic populations from Yunnan Province: newdata and a reappraisal. J Hum Genet. 47(6):311–318.
Zhao M, Kong QP, Wang HW, et al. (15 co-authors). 2009.Mitochondrial genome evidence reveals successful late Paleo-lithic settlement on Tibetan Plateau. Proc Natl Acad Sci U S A.106(50):21230–21235.
Zimmermann B, Bodner M, Amory S, Fendt L, Rock A, Horst D,Horst B, Sanguansermsri T, Parson W, Brandstatter A. 2009.Forensic and phylogeographic characterization of mtDNAlineages from northern Thailand (Chiang Mai). Int J Legal Med.123(6):495–501.
Peng et al. · doi:10.1093/molbev/msq131 MBE
2430