tracing soil particle movement.towards a spectral approach to spatial monitoring … ·...
TRANSCRIPT

Tracing soil particle movement.
Towards a spectral approach to
spatial monitoring of soil erosion
Mila Ivanova Luleva

PhD dissertation committee
ChairProf. Dr. A. Veldkamp University of Twente
PromotersProf. Dr. Victor G. Jetten University of TwenteProf. Dr. Freek D. van der Meer University of Twente
Assistant promoterDr. Harald M.A. van der Werff University of Twente
MembersProf. Dr. Wout Verhoef University of TwenteProf. Dr. Andrew Skidmore University of TwenteProf. Dr. Violette Geissen University of BonnDr. Sabine Chabrilat Helmholtz Centre Potsdam GFZDr. Eduardo Garcia-Melendez Universidad de Leon
ITC dissertation number 228ITC, P.O. Box 217, 7500 AE Enschede, The Netherlands
ISBN: 978–90–6164–356–2Printed by: ITC Printing Department, Enschede, The Netherlands
© Mila Ivanova Luleva, Enschede, The Netherlands© Cover design by Ms. Mila KoevaAll rights reserved. No part of this publication may be reproduced without theprior written permission of the author.

TRACING SOIL PARTICLE MOVEMENT.
TOWARDS A SPECTRAL APPROACH TO SPATIAL
MONITORING OF SOIL EROSION
D I S S E R T A T I O N
to obtain
the degree of doctor at the University of Twente,
on the authority of the rector magnificus,
prof. dr. H. Brinksma,
on account of the decision of the graduation committee,
to be publicly defended
on Wednesday, July 3, 2013 at 12:45
by
Mila Ivanova Luleva
born on January, 18, 1984
in Sofia, Bulgaria

This dissertation is approved by:
Prof. Dr. Victor G. Jetten (promoter)Prof. Dr. Freek D. van der Meer (promoter)Dr. Harald M.A. van der Werff (assistant promoter)

Contents
Contents i
1 Introduction 1
1.1 Soil Erosion and Land Degradation . . . . . . . . . . . . . . . . 1
1.2 Soil Erosion in Europe . . . . . . . . . . . . . . . . . . . . . . . . 4
1.3 Study Sites . . . . . . . . . . . . . . . . . . . . . . . . . . . . . . . 5
1.4 Problem Statement . . . . . . . . . . . . . . . . . . . . . . . . . . 10
1.5 General Research Objectives . . . . . . . . . . . . . . . . . . . . 11
1.6 Thesis Structure . . . . . . . . . . . . . . . . . . . . . . . . . . . . 12
2 Gaps and opportunities in remote sensing for soil erosion as-sessment 15
2.1 Introduction . . . . . . . . . . . . . . . . . . . . . . . . . . . . . . 16
2.2 Satellite remote sensing as an input for soil erosion models . 16
2.3 Soil erosion parameters . . . . . . . . . . . . . . . . . . . . . . . 19
2.4 Integration of high spectral resolution remote sensing datain studies on soils . . . . . . . . . . . . . . . . . . . . . . . . . . . 23
2.5 Conclusions . . . . . . . . . . . . . . . . . . . . . . . . . . . . . . . 27
3 Spectrally active chemical elements as potential soil particletracers 31
3.1 Introduction . . . . . . . . . . . . . . . . . . . . . . . . . . . . . . 32
3.2 Methodology . . . . . . . . . . . . . . . . . . . . . . . . . . . . . . 34
3.3 Results and Discussion . . . . . . . . . . . . . . . . . . . . . . . . 36
3.4 Conclusions . . . . . . . . . . . . . . . . . . . . . . . . . . . . . . . 43
i

Contents
4 Spectral sensitivity of Potassium as a proxy for soil particlemovement 474.1 Introduction . . . . . . . . . . . . . . . . . . . . . . . . . . . . . . 484.2 Methods . . . . . . . . . . . . . . . . . . . . . . . . . . . . . . . . . 504.3 Results . . . . . . . . . . . . . . . . . . . . . . . . . . . . . . . . . . 544.4 Discussion . . . . . . . . . . . . . . . . . . . . . . . . . . . . . . . 614.5 Conclusions . . . . . . . . . . . . . . . . . . . . . . . . . . . . . . . 63
5 Tracing Potassium in a silty loam soil with field spectroscopy 655.1 Introduction . . . . . . . . . . . . . . . . . . . . . . . . . . . . . . 665.2 Methodology . . . . . . . . . . . . . . . . . . . . . . . . . . . . . . 675.3 Results and Discussion . . . . . . . . . . . . . . . . . . . . . . . . 705.4 Conclusions . . . . . . . . . . . . . . . . . . . . . . . . . . . . . . . 75
6 Tracing Potassium in a Loess soil with field spectroscopy 776.1 Introduction . . . . . . . . . . . . . . . . . . . . . . . . . . . . . . 786.2 Methodology . . . . . . . . . . . . . . . . . . . . . . . . . . . . . . 806.3 Results . . . . . . . . . . . . . . . . . . . . . . . . . . . . . . . . . . 846.4 Discussion . . . . . . . . . . . . . . . . . . . . . . . . . . . . . . . 966.5 Conclusions . . . . . . . . . . . . . . . . . . . . . . . . . . . . . . . 99
7 General Discussion and Conclusions 101
Bibliography 107
Summary 125
Samenvatting 129
Resume 133
Publications 135
ii

List of Figures
1.1 Location of the Guadalentin basin, South-East Spain [Alterra, 2007] 6
1.2 Rill and gully formation in the Guadalentin basin . . . . . . . . . 7
1.3 Soil erosion experimental farm at Wijnandsrade, South Limburg 9
2.1 Diagram of soil particle transport by creep, saltation and sus-pension . . . . . . . . . . . . . . . . . . . . . . . . . . . . . . . . . . . 28
3.1 Cross validation for Calcium . . . . . . . . . . . . . . . . . . . . . . 40
3.2 Cross validation for Iron . . . . . . . . . . . . . . . . . . . . . . . . . 41
3.3 Cross validation for Potassium . . . . . . . . . . . . . . . . . . . . . 42
3.4 Cross validation for Magnesium . . . . . . . . . . . . . . . . . . . . 43
3.5 Cross validation for Sodium . . . . . . . . . . . . . . . . . . . . . . . 44
3.6 Cross validation for pH . . . . . . . . . . . . . . . . . . . . . . . . . . 45
4.1 Absorption feature parameters: absorption band depth, absorp-tion band width, absorption band center., after van der Meer[2004] . . . . . . . . . . . . . . . . . . . . . . . . . . . . . . . . . . . . 52
4.2 Change in absorption at 2450–2470 nm in Clay Loam and Loam 55
4.3 Change in absorption at 2450–2470 nm in Heavy Clay and CoarseSand . . . . . . . . . . . . . . . . . . . . . . . . . . . . . . . . . . . . . 56
4.4 Change in absorption at 2450–2470 nm in Fine Sand and Silt loam 57
4.5 Change in absorption at 2450–2470 nm with change in K concen-tration . . . . . . . . . . . . . . . . . . . . . . . . . . . . . . . . . . . . 58
4.6 Variation in absorption feature parameters per soil textural type 59
4.7 Change in absorption feature parameters with varying concen-trations of added K fertilizer . . . . . . . . . . . . . . . . . . . . . . 60
iii

List of Figures
5.1 Advanced soil erosion in the Region of Murcia, South East Spain 685.2 Spatial representation of K and clay absorption for plot A . . . . 725.3 Spatial representation of K and clay absorption for plot B . . . . 735.4 Relationships between K and Clay absorption feature . . . . . . . 74
6.1 Setup of the experimental plot . . . . . . . . . . . . . . . . . . . . . 816.2 Decrease in K concentration in sediment per litre of discharge . 856.3 Schematic outline of water flow . . . . . . . . . . . . . . . . . . . . 866.4 Change in K absorption feature depth for each experimental stage 876.5 Relationship between K feature, Clay feature and Normalized
Soil Moisture Index (NSMI) for plots A–C . . . . . . . . . . . . . . . 886.6 Relationship between K feature, Clay feature and Normalized
Soil Moisture Index (NSMI) for plots D–F . . . . . . . . . . . . . . . 896.7 Spatial representation of K absorption, clay absorption and Nor-
malised Soil Moisture Index (NSMI) for plot A . . . . . . . . . . . . 906.8 Spatial representation of K absorption, clay absorption and Nor-
malised Soil Moisture Index (NSMI) for plot B . . . . . . . . . . . . 916.9 Spatial representation of K absorption, clay absorption and Nor-
malised Soil Moisture Index (NSMI) for plot C . . . . . . . . . . . . 926.10 Spatial representation of K absorption, clay absorption and Nor-
malised Soil Moisture Index (NSMI) for plot D . . . . . . . . . . . . 936.11 Spatial representation of K absorption, clay absorption and Nor-
malised Soil Moisture Index (NSMI) for plot E . . . . . . . . . . . . 946.12 Spatial representation of K absorption, clay absorption and Nor-
malised Soil Moisture Index (NSMI) for plot F . . . . . . . . . . . . 95
iv

List of Tables
1.1 Differences and similarities between Guadalentin basin, Spainand South East Limburg, The Netherlands . . . . . . . . . . . . . . 5
2.1 Key soil parameters studied with remote sensing . . . . . . . . . 222.2 Differences and similarities between 137Cs isotope and K . . . . 29
3.1 Soil characteristics per soil type . . . . . . . . . . . . . . . . . . . . 373.2 Soil property concentrations by ICP-OES . . . . . . . . . . . . . . . 383.3 Results of PLSR models of wavelengths associated with indivi-
dual chemical elements found in soils . . . . . . . . . . . . . . . . 39
4.1 Soil characteristics per soil type . . . . . . . . . . . . . . . . . . . . 53
6.1 Geochemical analysis of soil samples from each plot . . . . . . . 86
v


1Introduction
1.1 Soil Erosion and Land Degradation
Soil is the product of complex interactions between climate, geology, ve-getation, biological activity, time and land use. The proportions of itsdifferent components- sand, silt and clay particles, organic matter, waterand air, as well as the way in which these components form together astable structure, define soil’s characteristics [Morgan, 2005]. Soil erosionis a naturally occurring process, which plays a major role in the processof soil formation. However, climatic conditions such as droughts, aridity,irregular and intense precipitation regimes as well as human-induced acti-vities such as deforestation, overgrazing and soil structure deterioration,cause a shift from natural to accelerated soil erosion [Cerdan et al., 2010].The latter is what presents a major concern and it is referred to in studiesof land degradation caused by soil erosion.
Soil can be eroded under the influence of wind and water. Soil detach-ment is caused by raindrop impact and flow traction, while the materialis transported by saltation and overland water flow. Under the influenceof intense flow, a formation of small channels, also known as rills, occurs.In agricultural areas, rills are removed by ploughing, however, althoughthe visible signs are removed, the process of erosion has still taken place.If the storms are severe, or preventive measures do not take place, soilerosion leads to forming gullies. These can be removed only by radicalmeasures such as re-grading of entire areas. Because these methods aretime and effort consuming, the gullied areas are often simply abandoned.
One of the major controlling factors that determine the rate and severity
1

1. Introduction
of soil erosion is runoff. The amount of runoff is directly proportional tothe difference between the amount of rainfall and infiltration of the soil.The infiltration in its turn is determined by both soil texture properties,as well as soil structure. In many areas erosion is directly associatedwith the loss of structure by crusting. Furthermore the degree of erosionis determined by the velocity of the runoff, which is a function of theterrain slope, surface roughness and resistance by vegetation. Althoughconceptually this is a well known system, the interaction of the manyfactors, each with its spatial variability, makes precise prediction of erosiondifficult.
The impact of erosion is most commonly assessed using soil erosionmodels. The main limitations, however, are the variability and spatialextent of the event, which create difficulties in obtaining sufficient spatialdata to calibrate erosion models and to verify the predicted results [Jettenet al., 2003]. Remote sensing can play an important role considering thatit provides extensive coverage over various areas. Spatial data acquiredwith satellite sensors have been used as an input for estimation of erosionparameters, however the main focus is directed towards the visible andinfrared parts of the spectrum [Metternicht and Zinck, 1998]. Therefore,landuse maps, vegetation cover maps and digital elevation models are themost common products of image analysis.
One of the ways to quantify erosion spatially is with chemical andradioactive tracers. Soil particle tracing using chemical tracers have beenconducted over the past three decades. Several chemical soil particle tra-cers have been used to model spatial distribution of soil erosion [Zhanget al., 2006] and to identify suspended sediment [Onda et al., 2007]. Someof the most commonly used soil particle tracers include the Cesium 137isotope (137Cs ) [Andersen et al., 2000, Chappell, 1999, Collins et al., 2001,Guimaraes et al., 2003, Porto et al., 2001, Sanchez-Cabeza et al., 2007,Timothy et al., 1997], Lead (210Pb) and Beryllium (7Be) [Mabit et al., 2008,Wallbrink and Murray, 1993], and Rare Earth Oxides [Polyakov and Nearing,2004, Zhang et al., 2006]. The 137Cs is considered the primary chemicaltracer for detection of soil particle movement [deGraffenried Jr and She-pherd, 2009, Estrany et al., 2010, Meusburger et al., 2010, Rodway-Dyerand Walling, 2010, Xiaojun et al., 2010], however it comes with a numberof limitations and assumptions. Firstly, the homogeneous distribution of
2

1.1. Soil Erosion and Land Degradation
137Cs fall out is limited to the Northern hemisphere, because it has beenintroduced to the environment after the Chernobyl incident in the late1980s. Secondly, all particle movements are assumed to be as a resultof soil erosion [Campbell et al., 1982, Chappell, 1999, Walling and Quine,1990]. Cost of soil sampling and analysis and the limited half-life of theelement are also among the main limitations preventing extrapolation ofthese methods to cover large areas [Boardman, 2006].
Considering that sampling large areas for determination of soil proper-ties using spectral reflectance is relatively cheap and fast, compared totraditional field and laboratory techniques [Shepherd and Walsh, 2002],infrared spectroscopy has the potential to provide solutions to some ofthe problems and limitations associated with scaling of the particle tracingtechniques.
Soil properties have been studied with infrared spectroscopy since the1980’s, using visible, near-infrared and shortwave infrared wavelengthregion (400–2500 nm). Soil spectral reflectance is determined by bothphysical and chemical characteristics of soils [Baumgardner et al., 1985,Ben-Dor et al., 2003, Shepherd and Walsh, 2002]. Soil spectral featuresresult from an overtone absorption and combination of bond vibrationsin molecules of three functional groups in minerals: OH, SO4 and CO3,[Ben-Dor and Banin, 1995, Hunt and Salisbury, 1970]. In addition, organicmatter influences the spectral response because it holds most positivelycharged nutrient ions in soils.
To date, infrared spectra have not been put into soil erosion perspective.Low concentrations of the 137Cs isotope in nature makes the identifica-tion of the element through spectral means impossible, considering thecapabilities of available spectrometers.
Elements with similar chemical and biological behaviour to the isotope,such as Potassium (K), which is much more abundant in the environmentbut still evenly applied, are not fully explored. Potassium shares electrical,chemical and physical properties with Cs, both being members of the GroupI alkali metals [Andrello and Appoloni, 2004, Relman, 1956]. Both elementshave similar biological and chemical behaviour, where the difference isonly in reactivity [Relman, 1956], but it has not been tested as a particletrace.
The element K is mainly present as part of preliminary soil minerals
3

1. Introduction
(unavailable), in clay minerals and fine silt (slowly available), and in awater-soluble form (readily available) [Garrett, 1996, Peterburgsky andYanishevsky, 1961, Sharpley, 1989]. Potassium occurs naturally in theenvironment, but it is also used on agricultural lands as a fertilizer. Ingeneral it is applied in a form of K2O or K–P–N prior to harvesting.
1.2 Soil Erosion in Europe
Soil erosion by water is an extensive and increasing problem throughoutEurope. Over the last decade, a number of reports have been produced inorder to assess the affected areas and severity of degraded land. In theearly 1990s, Oldeman [1991] and Van Lynden [1995] provided an overviewfor the Council of Europe. As stated by the European Soil Bureau [2001],with a very slow rate of soil formation, any soil loss of more than 1 t/ha/yrcan be considered irreversible within a time span of 50–100 years. Lossesof 20–40 t/ ha in individual storms, are measured once every two years inEurope [Morgan, 2005].
The Mediterranean region is particularly prone to erosion. According toVan Lynden [1995], areas within this region have been affected to the extentto which erosion has stopped due to lack of soil. According to the EuropeanSoil Bureau [2001], this area is characterized by long dry periods followedby heavy bursts of erosive rainfall, falling on steep slopes with fragile soils.Severe erosion is also measured in other parts of Europe mainly withinAustria, Czech Republic and the loess belt of Northern France, Belgium andThe Netherlands. Soil erosion can therefore be considered, with differentlevels of severity, an EU-wide problem.
This study is part of the DESIRE Project, funded under the EU’s SixthFramework Programme. It has an aim to develop strategies for use andprotection of areas prone to soil erosion and desertification in Europe.The project is conducted by 28 research institutes, non-governmentalorganisations and policy makers from Europe, Australia, Africa, Southand North America. In total there are eighteen study sites located acrossthese continents, where soil is subjected to erosion due to wind or water,salinization, droughts or flash floods. More information regarding exactlocation and detailed description of the sites can be found in Alterra [2007].
4

1.3. Study Sites
Table 1.1: Differences and similarities between Guadalentin basin, Spain and SouthEast Limburg, The Netherlands
Guadalentin basin South East LimburgRelief Ranging Slopes Mainly flatGeology Wide range of
minerals- predo-minantly illites,chlorites, and illite-smectites.
Predominantly limes-tone
Soil Silt Loam (Calcisols) LoessClay content 30–36 % 12–18 %Precipitation 300–500 mm annual
(intense rainstormevents)
820–900 mm an-nual (distributedthroughout the year)
Erosion Severe- due to tillage,fallow land and land
Severe- due to floo-ding and runoff
1.3 Study Sites
Two study sites were selected in order to conduct the present research. Aspart of the DESIRE Project, one of them is the Guadalentin basin, South EastSpain, while the second one is located in South Limburg, The Netherlands.The two study sites differ in soil texture, relief, underlying geology andprecipitation rates (see Table 1.1). Both sites, however, are affected bysevere erosion.
1.3.1 Guadalentin basin
Climate, geomorphology and the impact of human activities have resultedin progressive land degradation across the Mediterranean region of Europe.In Spain, more than 22 million ha, 43.8 % of the land is affected by erosionrates higher than 12 t/ha/yr. Nearly half of this area registers soil losseshigher than 50 t/ha/yr. Because of this, within the Murcia province ofSpain (Figure 1.1), a number of test sites are developed especially for soilerosion and related studies.
This is an area where land degradation phenomenon can be readily
5

1. Introduction
Figure 1.1: Location of the Guadalentin basin, South-East Spain [Alterra, 2007]
observed (Figure 1.2). Soil erosion by rills and gullies is common, causedby tillage, fallow land and land abandonment. Rain storms are of highintensity, while rock types are susceptible to erosion. Measures to combatthese problems have been applied for over 100 years, though only in someparts they have been successful.
Guadalentin basin lies on the eastern edge of the Beltic ranges facingsouthwest-northeast direction and faults determine the main structure ofthe drainage network. The Guadalentin is an ephemeral river for the majorpart of its course. The upper section of the basin has a high drainage den-sity. The middle section is characterised by an undulating landscape withlong pediments and incised river terraces. The lower reach is characterisedby a flat valley bottom with series of developed alluvial fans.
The basin covers an area of 3300 km2 [Baartman et al., 2011]. Theclimate varies from semi-arid to sub-humid Mediterranean. Annual precipi-tation from 300 mm to 500 mm with average annual temperature between12 and 18◦ Celcius. Summer droughts, commonly last for 4–5 months.Annual potential evapotranspiration rates of 1000–2000 mm are common[Baartman et al., 2011].
The main agricultural crops include almonds and herbaceous crops.Semi-natural ecosystems include shrublands of Stipa tenacissima, Rosma-rinus officinalis and Anthyllis cytisoides. Forests are dominated by Pinushalepensis in part as a result of afforestation policies over the past 150years [Alterra, 2007].
Soils are shallow with high Calcium Carbonate content exceeding 50 %for some areas. Texture depends mainly on the hillslope position. Stoni-
6

1.3. Study Sites
ness is high, low organic matter and moisture content. Salinity and crustingare problematic for some parts of the Guadalentin Basin, where soils areneutral to slightly alkaline. These soils are higy prone to formation oferosion features sich as rills and gullies (see Figure 1.2).
Figure 1.2: Newly formed rills and deep gully formations in the Guadalentin basin,South-East Spain. A: Rills; B: Gully system
As indicated on soil maps produced by FAO [2006], the main soil types,recognized in the region of Murcia are Calcisols, Luvisols, Regosols andFluvisols.
Calcisols are soils with an argic horizon within 100 cm from the soilsurface. The have an irregular upper boundary resulting from albeluvictonguing into the argic horizon. Luvisols are characteristic soils for the fo-rested regions. They are identified by the presence of eluvial (Ae) horizonsand illuvial (Bt) horizons where silicate clay is accumulated. Regosols arewell to imperfectly drained mineral soils which lack horizon developmentor have minimal A and B horizon development. Fluvisols have a salichorizon starting within 50 cm from the soil surface.
Gully erosion in the Guadalentin is estimated to produce about 37.60 t
7
1. Introduction
ha−1 yr−1, which is equivalent to 50 % of total soil loss due to rill, interrilland gully erosion [Poesen et al., 2003].
1.3.2 South East Limburg
Southeast Limburg is part of European loess belt which covers parts ofEngland, northwest France, Belgium, The Netherlands, Germany, Polandand Russia [Kwaad et al., 2006]. They are the product of the QuaternaryGlacial period and the resulting dust accumulation ranging (in Europe)from the maritime areas of NW-Europe (France, Belgium) over CentralEurope to the Ukraine and the Russian plains [Haase et al., 2007]. The loesssoil of Limburg is rich in lime and contains up to 70 % quartz grains in thesilt fraction [Spaan et al., 2010].
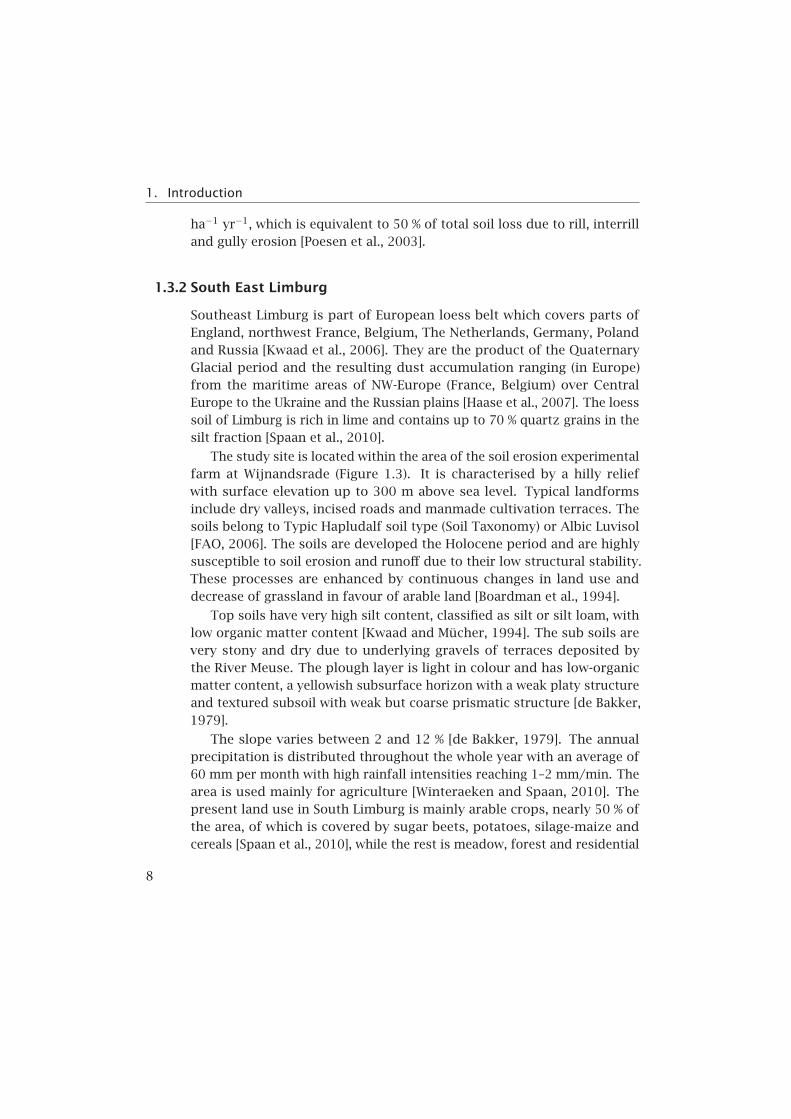
The study site is located within the area of the soil erosion experimentalfarm at Wijnandsrade (Figure 1.3). It is characterised by a hilly reliefwith surface elevation up to 300 m above sea level. Typical landformsinclude dry valleys, incised roads and manmade cultivation terraces. Thesoils belong to Typic Hapludalf soil type (Soil Taxonomy) or Albic Luvisol[FAO, 2006]. The soils are developed the Holocene period and are highlysusceptible to soil erosion and runoff due to their low structural stability.These processes are enhanced by continuous changes in land use anddecrease of grassland in favour of arable land [Boardman et al., 1994].
Top soils have very high silt content, classified as silt or silt loam, withlow organic matter content [Kwaad and Mücher, 1994]. The sub soils arevery stony and dry due to underlying gravels of terraces deposited bythe River Meuse. The plough layer is light in colour and has low-organicmatter content, a yellowish subsurface horizon with a weak platy structureand textured subsoil with weak but coarse prismatic structure [de Bakker,1979].
The slope varies between 2 and 12 % [de Bakker, 1979]. The annualprecipitation is distributed throughout the whole year with an average of60 mm per month with high rainfall intensities reaching 1–2 mm/min. Thearea is used mainly for agriculture [Winteraeken and Spaan, 2010]. Thepresent land use in South Limburg is mainly arable crops, nearly 50 % ofthe area, of which is covered by sugar beets, potatoes, silage-maize andcereals [Spaan et al., 2010], while the rest is meadow, forest and residential
8

1.3. Study Sites
Figure 1.3: Location of soil erosion experimental farm at Wijnandsrade, SouthLimbourg, The Netherlands
areas.
9

1. Introduction
1.4 Problem Statement
Soil erosion has been studied and modeled for decades. However, thelarge spatial extent of the event, as well as the insufficient data for inputand validation of the soil erosion models, still create limitations. Recently,remotely sensed data have been included in various erosion studies [Vrie-ling, 2006]. The main use of these data is to derive spatial informationfrom the visible and near- infrared wavelengths of the electromagneticspectrum, for determination of parameters associated with soil erosionsuch as vegetation, topography and rainfall.
As part of soil erosion modeling, soil particle tracing has been exploredas a technique to assess soil particle movement. The most commonly usedsoil particle tracer, the 137Cs isotope, comes with a number of limitationsand assumptions. The isotope has limited half-life, an assumed evenspatial distribution and, due to the high cost of analysis, it is impracticalfor assessment of large areas (See also Chapter 3). Furthermore, theconcentrations in which the element is found in the environment are toolow to have influence on the soil spectral response of soils.
Different types of soil, water, rocks and vegetation are known to re-flect, transmit or absorb electromagnetic energy coming from the Sun ina specific and characteristic manner. The spectral response of each ofthese targets is determined by the interaction of the incident radiationwith the surface, the orientation and position of the Sun, topography andorientation of the target, the atmospheric state as well as the location ofthe measuring sensor. Moreover, the chemical composition and molecularstructure of the object of interest, determine the wavelengths where reflec-tion, transmission or absorption takes place within particular wavelengthsof the electromagnetic spectrum. The result is a spectral response curveof for the target, also referred to as a spectral reflectance signature.
The chemical and physical properties of soil determine the amount ofsolar energy that is reflected back from the target. The main controllingfactors that influence the shape of the soil spectrum include moisturecontent, organic matter, particle size distribution, soil mineralogy and soiltexture. Each factor can be determined by studying the spectral curve eitherdirectly, by looking at spectral absorption features, or indirectly, throughestablishing statistical relationships between soil chemical composition
10

1.5. General Research Objectives
and soil spectral response (further described in Chapter 3 and 4).
A limited number of studies explore the use of spectral informationderived from longer wavelengths. Soil chemical properties have distinctspectral signatures in the shortwave infrared spectrum (between 1100and 2500 nm), however this information has not been implemented insoil erosion studies to date. This research focuses on, firstly, identifyingpotential alternative chemical soil particle tracer that has similar chemicaland physical behavior as Cesium. The element has to be more abundantand less harmful to the environment, allowing practical application of thetechnique. Secondly, the emphasis is directed towards examining whetherthe shortwave infrared electromagnetic spectrum can provide sufficientinformation to allow identification and quantification of this element inorder to establish a cost effective and rapid way for tracing of soil particlemovement.
The specific aim of the study is to identify the most suitable chemicalsoil particle tracer, and to evaluate whether change in concentration of thiselement can be measured with infrared spectroscopy by establishing directrelationships between concentrations and absorption band parametersof the soil spectral signature. The scope of the research is limited bythe concentrations in which the element is present. They should be highenough to have influence on the shape of the spectral curve, but lowenough not to cause disturbance and contamination to the environment.
1.5 General Research Objectives
1. To identify gaps in the use of remote sensing in soil erosion studiesby reviewing the latest techniques associated with modeling andassessment of the process
2. To establish direct and indirect relationships between soil chemicalcomposition and infrared spectral response
3. To identify whether changes in Potassium concentration in soils ofvarious textures can be observed using infrared spectral response
4. To examine whether Potassium can be used as a tracer for soil particlemovement under field conditions through spectral analysis
11

1. Introduction
1.6 Thesis Structure
A general introduction to the process of soil erosion, spectral characteris-tics of soils and problem definition is presented in Chapter 1 (this chapter).This is followed by Chapter 2, which provides an overview of the use ofremote sensing in monitoring soil erosion and its contribution as an inputfor soil erosion modeling. By examining the different applications of thesedata, gaps in the current knowledge are outlined and new areas wherethese data can contribute are identified. Advanced stages of soil erosionhave been extensively monitored using remote sensing data, however thereare no methods developed for detecting early signs of erosion. This chapteridentifies soil particle tracing using chemical elements as a new applicationof remote sensing in monitoring early stages of soil erosion.
Chapter 3 presents a method to establish direct and indirect relation-ships between naturally occurring soil chemical elements and infraredspectral response. Specific wavelength ranges that statistically predict andquantify soluble fractions of chemical elements, from near infrared andshortwave infrared spectroscopy are outlined.
Chapter 4 introduces the use of Potassium (K) as an alternative toCesium 137 (137Cs ) as a particle tracer. The study is conducted in alaboratory on soils of various textural classes. Ranging concentrationsof Potassium fertilizer are applied to the surface of the soil samples andmeasured for their spectral characteristics. Absorption feature parameters,including absorption band depth, center and area, are analyzed in order todetermine the influence of K on the spectral absorption curve.
Chapters 5 and 6 describe the application of the technique establishedin field conditions. The behavior of K was tested with a flow experimentconducted in an area severely affected by soil erosion Murcia, South EastSpain. Spectral field measurements are built into synthetic images to studythe spatial extent and variation of the tests. The experiment resulted inidentification of factors that have strong influence on the spectral responseand limit the applicability of the technique. An improved experimentalsetup was conducted in South Limburg, The Netherlands (chapter 6), onLoess soils with limited clay content. The range of concentrations ofapplied fertilizer was increased, and the runoff sediment was collected.The methods of image interpretation and statistical analysis remained the
12

1.6. Thesis Structure
same.Chapter 7 contains general discussion in the form of synthesis. The
research objectives are answered and main conclusions are outlined basedon evaluation of the findings. This section contains limitations of thecurrent study as well as recommendations if further work is intended.
13


2Gaps and opportunities in remote
sensing for soil erosion
assessment
Abstract
Assessing soil erosion over large areas has been a challenge fordecades. The large spatial extent of the process creates difficultiesin data acquisition for both measuring and validation. This chapterprovides an overview of the most common applications of remotelysensed data as an input for various models and techniques in soil ero-sion studies. Remotely sensed data provide spatial coverage and areused to derive information for various soil erosion parameters, suchas vegetation cover, topography, soil moisture, as well as to detectlarge erosion features. The chapter also contains a discussion on soilparticle tracing using chemical elements as a method for assessmentof soil erosion and deposition. By identifying the limitations associa-ted with this technique, the gaps in the use of remote sensing for soilerosion monitoring using particle tracers are presented. Additionally,the chapter outlines a potential use of remote sensing data in orderto expand the scope of already existing techniques. 1
1This chapter is based on: Luleva, M.I., Van Der Werff, H., Van Der Meer, F. and Jetten,V., (2012), Gaps and opportunities in the use of remote sensing for soil erosion assessment,Chemistry, 21(5),748 - 764, Luleva et al. [2012]
15

2. Gaps and opportunities in remote sensing for soil erosion assessment
2.1 Introduction
Land degradation and soil erosion have been studied since the 1940’s,when the first concepts of detachment and transport of soil material wereintroduced [Ellison, 1944]. Various soil erosion models have been deve-loped to predict, simulate and assess the severity of erosion. Jetten et al.[2003] mentioned that it is possible to predict quantitatively aggregatedsoil loss, but the exact prediction in space and time of erosion features isimpossible because of the high spatial variability of all parameters involved.Remote sensing is found to provide solutions for estimating some of therelated erosion parameters and for outlining already developed erosionfeatures [Alatorre and Begueria, 2009, Jetten et al., 2003, Vrieling, 2006,Shruthi et al., 2011]. Most research, however, focused on land cover map-ping, identification of bare soil regions, and mapping soil types [Alatorreand Begueria, 2009]. Shruthi et al. [2011] showed that very high resolutionimages are needed for erosion feature detection, while Vrieling [2006]showed that large gullies can be detected by coarser resolution images,but mainly through the presence or absence of vegetation. Various classifi-cation techniques and processing algorithms based on spectral correlationhave been implemented in order to overcome some of the limitations[Shrestha et al., 2005]. Yet, the potential of using remotely sensed imageryfor soil erosion studies is still not fully explored.
The aim of this chapter is to provide an overview of existing applicationsof remotely sensed data in soil erosion studies done in the laboratory andin the field. We provide a detailed review on the methodologies that areapplied on remotely sensed imagery to estimate the main parameters usedas input for soil erosion models. In addition we look into soil particletracing techniques to identify gaps, where remotely sensed data can beintegrated to widen the scope of currently existing methodologies.
2.2 Satellite remote sensing as an input for soil
erosion models
The concepts and principles behind observing soil erosion over large areasare very well known and they are being continuously refined. The mecha-
16
2.2. Satellite remote sensing as an input for soil erosion models
nism behind the process is also clear and well defined. However, scientistsare still not able to predict it very successfully mainly because of theresolution and spatial variability of erosion. In addition, the required highlevel of precision presents an obstacle, because erosion is an accumulativeprocess and a small error at a particular location is accumulated into alarge error on a catchment level. Therefore, the measurement techniqueshould provide high resolution spatio-temporal data to characterize theprocess [Chappell et al., 2005]. Research on soil erosion is mainly focusedon the use of soil erosion models in order to simulate and predict theevent.
Methods and models for soil erosion assessment have been reviewed byJetten et al. [2003] and later on Zhou et al. [2008]. The most widely appliedones include: Universal Soil Loss Equation (USLE) [Wischmeier and Smith,1978], its revised version (RUSLE) [Renard et al., 1991, Prasannakumaret al., 2012], the Soil Erosion Model for Mediterranean regions (SEMMED)[de Jong et al., 1999], the Water Erosion Prediction Project (WEPP) [Flanaganand Laflen, 1997], Limburg Soil Erosion Model (LISEM) [Flanagan and Laflen,1997, Jetten et al., 2003, Vrieling, 2006, Takken et al., 1999] as well asparticle tracing techniques [Campbell et al., 1982, Chappell, 1999, Lulevaet al., 2011, Sanchez-Cabeza et al., 2007, Syversen et al., 2001, Walling andQuine, 1990]. A main limitation of erosion models is the fact that theyare applied on small scale for particular study area or catchment [Nigeland Rughooputh, 2010]. Extensive reviews of satellite-based sensors thathave been used in soil studies are provided by Vrieling [2006] and later onby Mulder et al. [2011]. Another more recent review by Goldshleger et al.[2010] looks into the use of sensors with high spectral resolution for stu-dying three specific degradation processes- soil salinity, soil crusting andpost-fire mineral alterations. The authors suggest that there is potential inthe use of these data for monitoring soil erosion factors.
Efforts have been put into studying land cover and land use change[Sobrino and Raissouni, 2000] focusing mainly on vegetation. When itcomes to direct assessment of soil composition and degradation, however,the number of studies decreases. By using satellite imagery it is possibleto observe only the surface soil characteristics and only when the signal isnot masked by the vegetation cover [Vrieling, 2006]. The most commonlyused remotely sensed data in soil erosion modeling come from Landsat
17

2. Gaps and opportunities in remote sensing for soil erosion assessment
TM imagery. Availability and low cost of the scenes allow long term moni-toring of particular areas. The main benefit of Landsat TM sensor is themulti-temporal aspect [de Jong et al., 1999], although the low spatial andspectral resolution of the scenes present a limitation. Parameters asso-ciated with soil erosion, estimated from imagery, include assessments ofvegetation cover, calculation of vegetation indices, changes in topography,and outlining of bare ground Alatorre and Begueria [2009]. However, oftenbare ground is interpreted as degraded areas which is not necessarily thecase. In addition, ground survey should always be done when interpretingvegetation cover.
It is important to note that the information provided by remote sen-sing is limited to the surface characteristics, although some statisticalrelationships are established between the surface and depth properties[Vrieling, 2006]. Monitoring visible signs of degradation such as sheet, rillsor gullys as well as physical deteriorations such as crusting, hard settingand compaction, total erosion can be estimated over time [Boardman, 2006,Omuto and Shrestha, 2007].
Table 2.1 gives an overview of the various studies that used remotesensing data to estimate erosion related parameters or erosion itself.
Identification and mapping erosion features is performed by automatedor supervised extraction of digital information based on spectral and/orstructural pattern recognition [Alatorre and Begueria, 2009]. Classifiersbased on statistical probability functions are commonly used to allocateground pixels to a given surface type. Based on the composition of vegeta-tion abundance and the identification of soil degradation features, linearmixture modeling has shown useful to map land degradation [Metternichtand Fermont, 1998].
Models and techniques, used to study soil related processes, providespatial coverage but they do not show reality, only a simulation. Themeasurements are point-based, apart from a few examples of erosionfeature mapping [Takken et al., 1999] and therefore there is a clear needfor developing new methods that integrate the spatial extent of the event,the development of the process over time, and the factors affecting soilbehavior.
18

2.3. Soil erosion parameters
2.3 Soil erosion parameters
2.3.1 Vegetation related erosion parameters
Vegetation cover has been widely studied with remote sensing [Shoshany,2000], due to its distinct signature in the visible and near-infrared partof the electromagnetic spectrum. The most commonly used imagery isprovided by Landsat TM and SPOT HRV, although limited number ofstudies attempted to implement airborne hyperspectral remote sensingfrom HyMap [Asner and Heidebrecht, 2003, Shrestha et al., 2005, de Jongand Jetten, 2007]. Vrieling [2006] provides an extensive review on thedifferent satellite sensors used for detection of vegetation in soil erosion.
The bulk of research has focused on estimating Normalized DifferenceVegetation Index (NDVI), Leaf Area Index (LAI) and Land Surface Tempera-ture (LST) from satellite imagery. These are used as indicators for spatialand temporal changes in soil fertility [Julien and Sobrino, 2009, Nicholsonand Farrar, 1994, Park et al., 2004]. In their study, Troufleau and Sogaard[1998] used LST and NDVI to derive soil surface moisture status whileUnganai and Kogan [1998] used standardized difference of NDVI and LSTto estimate drought-prone areas in Southern Africa. In addition, Parket al. [2004] used vegetation indices to estimate the impacts of hydrolo-gic properties. They showed that values for NDVI and LST are relatedto soil runoff potential. Considering that soil is classified in hydrologicsoil groups, based on runoff potential and soil physical conditions, it issuggested that physical degradation can influence LST and NDVI [Omutoand Shrestha, 2007, Park et al., 2004].
2.3.2 Topography
Slope is an important controlling factor for development and formationof soil erosion. Some of the best transport equations are based on streampower, which is the product of slope and discharge [Hessel and Jetten,2007]. Since discharge itself is also determined by slope, the relationbetween erosion and slope is a power function and therefore it is verysensitive. In addition, the accuracy of a DEM is very important. Sincecourser DEMS often generate lower slopes than high resolution DEMS thiswill influence greatly the soil loss estimation.
19

2. Gaps and opportunities in remote sensing for soil erosion assessment
As stated by Smith and Clark [2005], remote sensing provides the mosteffective way of developing Digital Elevation and Terrain models (DEM,DTM). The main sources of such data have been reported to be ASTER andLandsat TM [Thurmond et al., 2006].
The resolution of the produced DEMs plays a crucial role. LiDAR cloudpoint data provide means for more accurate building of DEMs, howeverthis usually requires great amount of time, effort and resources [Liu, 2008],limiting their use.
2.3.3 Soil Moisture
Soil moisture content influences soil infiltration, which determines soilrunoff. Hence, it is also considered as an indirect indicator of erosion.Methods applied for determining soil moisture content cannot often beextrapolated spatially due to variation over time. On the soil surface,moisture content influences the process of exchange of heat between landsurface and atmosphere [Owe et al., 2001], as part of the environmentalwater cycle. Research focuses on potential use of infrared spectra for esti-mating surface soil moisture. It is known to affect spectrum shape in thevisible, near infrared (VNIR) and shortwave infrared (SWIR) spectral range(350 nm and 2500 nm) [Doerr et al., 2000, Haubrock et al., 2008], whereincreasing moisture content leads to decreasing reflectance [Baumgardneret al., 1985, Lobell and Asner, 2002, Weidong et al., 2002]. Estimationsfrom optical measurements in the VNIR and SWIR are considered increa-singly important, not only for improving existing hydrological models atdifferent scales [Doerr et al., 2000]but also for estimation of ground coverproperties.
The overtone and combination absorption bands of molecular wateraround 900 nm, 1400 nm and 1900 nm are indicative regions for soil mois-ture variability [Haubrock et al., 2008, Weidong et al., 2002]. Soil moistureinfluences background reflectance and therefore affects quantification ofsoil parameters [Haubrock et al., 2008]. For instance, Iron oxides, soilorganic matter and Phosphorus prediction from VNIR and SWIR have beentested by Bogrekci and Lee [2006] and Galvao and Vitorello [1998], whodeveloped calibration models for estimation of these parameters usingspecific bands as a function of moisture.
20

2.3. Soil erosion parameters
Problems related to estimation of surface soil moisture from spectra,are mainly related to validation of the results. A number of moistureindices have been developed, including Modified Temperature- VegetationDryness Index (MTVDI) [Kimura, 2007], Normalized Difference Water Index(NDWI) [Dasgupta et al., 2007], Normalized Soil Moisture Index (NSMI)[Haubrock et al., 2008]. The correlation coefficients between the certainbands and the actual moisture content, however, have not been shown tobe higher than 0.71 [Haubrock et al., 2008].
MTVDI [Kimura, 2007], for instance, can be calculated from satellite-derived surface temperature, and aerodynamic minimum and maximumsurface temperatures estimated from meteorological data. The main pur-pose of this index was to help identifying wet-edge index, by combiningthe MTDVI with the commonly used NDVI. The authors, however, reportedlack of sufficient data for drawing strong conclusions. NDWI takes intoaccount the bands at 860 nm and 1240 nm [Dasgupta et al., 2007], howeverthe study acknowledged uncertainties up to 66% associated with the index.The most recent one reported in the literature was introduced by Haubrocket al. [2008] (NSMI). From a systematic study over the whole spectral rangefrom 350–2500 nm, the NSMI based on the reflectance at 1800 nm and2119 nm has been determined to be suitable quantifier of water contentfor the surface. The authors claim that NSMI can be seen as a generallyapplicable parameter, which can be used without any a priori knowledgeabout the target. The index should be tested for its applicability fromremote sensing data, where resolution and atmospheric effect complicatespectral measurements.
In arid regions, surface soil moisture is a dynamic variable at a rela-tively low level, making optical remote sensing useful for assessment ofdegradation. In such regions, moisture indices have great potential forrapid and efficient surface soil moisture estimations [Famiglietti et al.,1999, Khawlie et al., 2002, Zribi et al., 2005, 2003].
21

2. Gaps and opportunities in remote sensing for soil erosion assessment
Tab
le2.1
:K
eyso
ilp
aram
eter
sst
ud
ied
wit
hre
mote
sen
sin
g
Par
amet
ers
Sen
sors
/Pla
tform
sC
ited
Lite
ratu
reV
eget
atio
nre
late
dp
aram
e-te
rs:
-ND
VI
and
LST
-Act
ive
Fire
s
-Lan
dC
ove
ran
dEc
olo
gy
Lan
dsa
tT
M,
NO
AA
AV
HR
R,
Spot
HR
V,
ERS
SAR
,RA
DA
RSA
T
Lan
dsa
tT
M,H
yMap
*R
adar
sat
SAR
AV
IRIS
*,La
nd
sat
TM
,Sp
ot
HR
V,
Hyp
er-
ion
*
Rev
iew
edin
Shosh
any
[20
00
],M
uld
eret
al.[
2011]
[Nic
hols
on
and
Farr
ar,1994,d
eJo
ng
etal
.,1
99
9,
Kh
awli
eet
al.,
20
02
,A
s-n
eran
dH
eid
ebre
cht,
20
03
,Par
ket
al.,
20
04
,Sh
rest
ha
etal
.,2
00
5,
20
04
,Sh
arm
a,2010]
[de
Jon
get
al.,
19
99
,K
haw
lie
etal
.,2002,A
sner
and
Hei
deb
rech
t,2003]
Hyd
rolo
gic
alV
aria
ble
s-S
urf
ace
Soil
Mois
ture
-Rai
nfa
llan
dcl
ou
dco
ver
SPO
T,L
and
sat
TM
,AST
ER,I
kon
os,
Qu
ick-
bir
dLa
bora
tory
spec
tra
acq
uir
edw
ith
ASD
spec
trom
eter
s,N
OA
AA
VH
RR
-th
er-
mal
ban
ds,
MO
DIS
,SA
R
Rev
iew
edin
Kin
get
al.[
2005]
[Fam
igli
etti
etal
.,1
99
9,
Zri
bi
etal
.,2
00
5,2
00
3,D
asgu
pta
etal
.,2
00
7,K
i-m
ura
,2007,H
aub
rock
etal
.,2008]
Top
ogra
ph
y:Sl
op
ean
dM
or-
ph
olo
gy
AST
ER,L
and
sat
TM
,LiD
AR
[Bet
tsan
dD
eRose
,1999,d
eJo
ng
etal
.,1999,Eva
ns,
2002,H
esse
lan
dJe
tten
,2007]
Soil
Ch
emic
alan
dPh
ysic
alPro
per
ties
-Ch
emic
alC
om
posi
tion
and
Cru
stin
g-R
ou
gh
nes
s,T
extu
re
Lab
ora
tory
spec
tra
acq
uir
edw
ith
ASD
spec
trom
eter
sLa
bora
tory
spec
tra
acq
ui-
red
wit
hA
SDsp
ectr
om
eter
sSA
R,La
bo-
rato
rysp
ectr
aac
qu
ired
wit
hA
SDsp
ec-
trom
eter
s.Su
gges
tion
s*fo
ru
sin
gC
HR
IS,
MIS
R,P
rob
a
[Bau
mgar
dn
eret
al.,
19
85
][B
en-D
or,
20
02
,B
en-D
or
etal
.,2
00
3,Sh
eph
erd
and
Wal
sh,
20
02
,U
del
hove
net
al.,
20
03
,G
old
shle
ger
etal
.,2
01
2,
Cas
aet
al.,
20
13
][A
nd
erso
nan
dK
uh
n,
20
08
,C
roft
etal
.,2
00
9,M
ora
net
al.,
2002]
Par
ticl
etr
acer
sA
SDSp
ectr
om
eter
[Lu
leva
etal
.,2
01
1,
Sch
mid
etal
.,2012]
22

2.4. Integration of high spectral resolution remote sensing data in studies on soils
2.4 Integration of high spectral resolution remote
sensing data in studies on soils
In Section 2.3, it was shown which satellite remote sensing data can beused as an input for soil erosion modeling. The spatial extent of these datahas been explored to some degree, however the spectral properties of theseimages have been somewhat neglected. Most soil erosion studies haveused only the information in the visible and near-infrared wavelengthsof the electromagnetic spectrum, although research have already establi-shed methods that can aid the determination of soil erosion parameters.This section will look into established methods for high resolution imageanalysis that can potentially be integrated in soil erosion research.
Literature covers the use of spectral data in identifying organic matter,moisture content, soil chemistry and roughness either directly [Baum-gardner et al., 1985, Ben-Dor et al., 2003, Shepherd and Walsh, 2006], orindirectly through analyzing and relating factors [King et al., 2005]. Theaim of most laboratory based studies is to establish methodologies thatcan be applied on remotely sensed imagery to extrapolate results in thespatial dimension. The focus is on detecting changes in soil structure,which determine the impact of degradation and regenerative processesof soil, indicating soil erosion [Chappell et al., 2005]. Research effortshave been put into successfully linking soil erosion to particular soil types,where studies from the 1960’s were first used [Holden, 1968]. Laboratoryanalysis of soil spectra have also been conducted, to estimate chemicalconstituents and predicting crust formation [Ben-Dor et al., 2003, Udel-hoven et al., 2003]. Not much has been done in terms of scaling these toimage data.
Silt and silt loam soils have a low to medium clay content (10-20 %),hence they are weak because the structure easily brakes down,makingthem highly susceptible to erosion and soil crusting [Le Bissonnais et al.,2005]. Soil crust decreases infiltration and causes runoff, which in turnwashes off nutrients and important chemical components of the soil at thesurface [Eghbal et al., 1996].
The challenge is to determine a method that predicts soil surface che-mical properties using remote sensing techniques and to investigate ways
23

2. Gaps and opportunities in remote sensing for soil erosion assessment
of deriving sub-surface soil spectral information. An attempt was recentlymade by Ben-Dor et al. [2008], introducing an extension to an ASD spectro-meter, specifically designed for sub-surface spectral measurements. Theauthors demonstrated the application of the technique on four differentsoil profiles. Although the method was not tested on independent loca-tions, it provides the bases for future robust soil mapping. Others refer tomore conventional methods of implementing geophysical measurementsusing gamma-ray spectrometers [Tyler, 2008].
In order to implement the use of remotely sensed data for quantifyingsoil chemical properties, a method to separate noise caused by differentatmospheric and environmental factors from actual signal, should beestablished. However, the transition from laboratory scale analysis throughfiled measurements to satellite imagery presents a challenge. As it has beenpointed out by Vrieling [2006] “due to the complexity of erosion processes,regional differences, and scale dependency, it cannot be expected that astandardized operational erosion assessment system using satellite datawill develop in the near future”.
2.4.1 Chemical Properties of Soils
It has been established that soil physical degradation is a relatively slowprocess [Morgan, 2005]. It begins with structural deterioration culminatinginto soil loss through erosion after many years [Jones et al., 2003]. Visiblesigns in the field such as rills, gullies or sediment deposits are manifesta-tions of advanced stage of degradation. To detect early warning signs, it isimportant to study soil properties sensitive to the degradation.
Spectral reflectance is a property of soil that integrates many func-tional processes influencing physical conditions [Ben-Dor et al., 2003,Shepherd and Walsh, 2006]. It is sensitive to soil constituents such as IronOxide, Carbon content and Calcium Carbonate that influence aggregation[Baumgardner et al., 1985, West et al., 2004] and soil crust formation.Furthermore, large-area sampling for spectral reflectance is more effectivecompared to conventional sampling methods for laboratory analysis [Janiket al., 1998, Shepherd and Walsh, 2006].
Some efforts have been put into studying soil properties from spectra.As stated by Udelhoven et al. [2003], soil parameters are neither static nor
24

2.4. Integration of high spectral resolution remote sensing data in studies on soils
homogeneous in space and time. Costs of analytical procedures are oftena limiting factor when spatial soil variability in large-scale is addressed.Reflectance spectra have been used extensively to determine variation inthe Earth’s surface composition [van der Meer, 2004].
Soil properties derived from spectra have been studied long beforethe 1980’s. Soil research has focused on VNIR and SWIR regions of thespectrum [Baumgardner et al., 1985] and the trend has been followed todate, with some relationships established from data in the thermal andmicrowave regions [Barnes et al., 2003, Yitagesu et al., 2011]. The basicphysical and chemical soil properties show high correlation with derivativereflectance values within the visible and short-wave infrared wavelengths[Shepherd and Walsh, 2006].
Subtle differences in the spectral shape can serve as a valuable basefor identifying soil properties mainly due to the fact that the soil spectraforms as a result of the overlap between absorption features of manyorganic and inorganic compounds [Shepherd and Walsh, 2006]. Accordingto Ben-Dor et al. [2003], changes in spectral response occur due to changesin soil albedo and soil mineralogy, where the former is strictly relatedto the physical soil properties, while the latter is strictly related to thechemical. Soil albedo is strongly influenced by soil color, organic matter,moisture content and iron content [Post et al., 2000].
Literature covers extensively in-situ laboratory procedures for esti-mating and predicting soil properties. These procedures, however, arerarely applicable to satellite imagery. As identified by Ben-Dor [2002], themain limitations are that only the top few centimeters can be studied andvegetation masks the response from the soil surface.
Recent efforts include aerial photographs and satellite images of baresoil and related soil erosion parameters [Schmid et al., 2012]. Othersestimate Organic Matter and Phosphorus levels, however, as pointed outby Lopez-Granados et al. [2005], these approaches were limited to linearregression with brightness values from the blue, green and near infraredbands. Chabrillat et al. [2002], suggests an improvement to these methodsby stating that unlike multispectral imagery, hyperspectral remote sensingwith its continuous spectrum for each pixel, enables the spectral identifica-tion of minerals, rocks, or soils at image level [Ben-Dor, 2002, Chabrillatet al., 2002].
25
2. Gaps and opportunities in remote sensing for soil erosion assessment
2.4.2 Chemical Soil Particle Tracing
As it was discussed in the previous section, data acquired with field andlaboratory spectrometers have been widely applied in studies on soilsin order to examine the soil chemical properties. These data and thecorresponding analytical techniques, however, have not been yet integratedin studies of soil erosion, most likely because of the limited reference tosoil chemical composition. One of the few lines of research that canpotentially benefit from these data is the concept of chemical soil particletracing for monitoring soil movement due to erosion.
The Cesium-137 isotope (137Cs ) is the most widely used chemicalsoil particle tracer. Soil particles move according to their size, under theinfluence of wind, water or gravity [Morgan, 2005]. Using tracers for soilerosion originated in China, shortly after the Chernobyl incident in the late1980s. The use of 137Cs in soil erosion modeling has been identified as avery effective technique in assessing both spatial patterns and rates of soilredistribution in the landscape [Li et al., 2000].
Distribution of 137Cs in soil profiles at undisturbed sites shows anexponential decrease with depth while ploughed soils show uniform mixingof 137Cs in the ploughed layer [Belivermis, 2012]. Although biological andchemical processes can move some amount of 137Cs , the dominant factorsaffecting its movement within landscapes, are the same physical processesthat affect the movement of soil particles to which it is attached [Warrenet al., 2005]. As suggested by Chappell [1999], 137Cs offers the greatestpotential for measuring net soil flux in semi-arid environments wheresoil flux monitoring is limited due to considerable spatial and temporalvariability of the controlling factors.
There is a number of assumptions behind the models that use 137Csdistribution. Chappell [1999] explains in more detail the problems relatedto them. First, it is assumed that there is a spatially uniform distribution of137Cs within a climatologically uniform area. Secondly, the fixation of 137Csto the clay size fraction of different minerals is considered immediate andpermanent, and the redistribution of soil corresponds to the movementof 137Cs . The reasoning behind this is that Cs is rapidly adsorbed by clayparticles in the surface soil and it is essentially none-exchangeable onceadsorbed to the clay surfaces. The extent of adsorption and fixation of
26

2.5. Conclusions
137Cs to clay particles depends largely on the clay type. Generally, 137Cs isadsorbed irreversibly by micas and hydrobiotite, while montmorillonite,kaolinite and vermiculite hold 137Cs much less strongly
Models developed for calculation of redistribution rates of soil havebeen derived from 137Cs measurements and summarized by Li et al. [2000].Although 137Cs isotope has been extensively used to model soil redistribu-tion, little has been reported on the integration of spectral data. Limitednumber of studies have attempted the use of remote sensing to map 137Csnet soil flux with SPOT imagery, but the results were poor [Chappell, 1998].
The limited use of spectral data in monitoring 137Cs distribution ismainly related to the small chemical difference between the isotopes of Cs,which is associated with reaction kinetics. Therefore, all isotopes behavein the exact same way and it is very difficult to determine each of themwith any techniques different from laboratory based mass spectrometry.Moreover, the relatively low concentrations of the chemical prevent theformation of a distinct absorption. Anything below 3300 Bq of activity (or1 nano gram per gram of soil) is already under the detection limit of themain analytical instruments.
Considering that Cs is an alkaline metal, its physical and chemicalbehavior is similar to those of Potassium (K) and Sodium (Na), extensivelystudied by spectral analyses. Luleva et al. [2011] suggest that K can be usedas a potential alternative tracer that could be observed using soil spectralresponse, allowing rapid spatial mapping. Table 2.2 outlines the differencesand similarities between the two elements, as well as the advantages andlimitations of each one in their use as particle tracer. Introducing K is a soilparticle tracer can introduce a number of advantages to erosion studies.The element has potential to be measured using spectral measurementswhich can increase the spatial representation. It has been shown that Kconcentrations can be quantified measured using spectral means [Lulevaet al., 2011], however there is a need to test whether tracing patterns canbe established spatially using spectral data.
2.5 Conclusions
Over the recent years, the problem of soil erosion has received muchbroader acknowledgment in literature. Time and effort associated with
27

2. Gaps and opportunities in remote sensing for soil erosion assessment
Saltation
Creep
Saltation
Suspension
Figure 2.1: Simplified diagram of soil particle transport under the influence ofwind by creep, saltation and suspension. Based on Lyles [1988]
field sampling and analytical techniques due to the large scale of the event,however, still present a major limiting factor. Remote sensing providessome solutions to spatial data acquisition; however the potential of thesedata is not yet fully explored. General conclusion is that change detectionof vegetation cover alongside with change in land use are soil erosionparameters most widely studied with remote sensing.
Landsat TM, ASTER and SPOT HRV are most frequently used, howeverit can be argued that the availability and price of the science determinetheir use, rather than sensor capabilities. There is a clear gap in theuse of remotely sensed data with high spectral resolution. Chemical soilparticle tracing of soil movement due to erosion is a line of research thatcan benefit from the development of a methodology that combines thespatial and the high spectral properties of remotely sensed data. Thetwo upcoming international missions —Enmap, scheduled to launch inyear 2013 and HyspIRI, expected to launch between year 2013 and 2016—promise to provide satellite hyperspectral data that would allow detailedand repetitive analysis of surface parameters.
28

2.5. Conclusions
Table 2.2: Differences and similarities between 137Cs isotope and K, for soil particletracing
137Cs KIntroduction to theenvironment
Introduced in the en-vironment due to theChernobyl incident inthe late 1980s
Naturally occurring,but also introduced tothe environment as anagricultural fertilizer.
Distribution The even distributionof Cs is always as-sumed and thereforeit has been a causeof debate, althoughsome studies haveprovided supportingarguments based onclimatological factorsand study area loca-tions [Chappell, 1999]
Although K fertilizershould be appliedevenly to all agricul-tural fields in orderto maintain optimalcrop production[Jalali, 2007], thedistribution of theelement should bemeasured in order toaccount for naturalvariation.
Displacement Radioactive Cs is as-sumed to move onlydue to erosion as itbinds strongly to thesoil particles.
K can be moved dueto uptake by plants orby leaching.
Cost of analyticalmeasurement
High Low
Previously used asa tracer
Yes No*
Detection usingspectral response
No Yes
29


3Spectrally active chemical elements
as potential soil particle tracers
Abstract
In chapter 2, various applications of remotely sensed data in soilerosion studies were reviewed. The use of the information derivedfrom the shortwave infrared wavelengths of the electromagnetic spec-trum was identified as a major gap in current research [Luleva et al.,2012]. A way to integrate these data in studies of soil erosion is todetect chemical composition of the soil and apply the method for che-mical soil particle tracing. To identify a potential soil particle tracerthat has similar physical and chemical properties as the commonlyused radioactive isotope Ceasium-137 (137Cs ), and at the same timehas a spectral signature, a number of abundant in the environmentchemical elements were tested. In this chapter, wavelength rangesthat statistically predict and quantify soluble fractions of chemicalelements, from near infrared and shortwave infrared spectroscopy areidentified. Partial least squares regression (PLSR) was used to developprediction models for naturally occurring Calcium (Ca), Magnesium(Mg), Potassium (K), Sodium (Na), Iron (Fe), and acidity (pH) in siltloam soil samples. Significant wavelength ranges were determined byestablishing direct and indirect relationships between soil spectra andsoluble fractions of these elements. 1
1This chapter is based on: Luleva, M, van der Werff, H, van der Meer, F., Jetten, V. ,Predicting Water Soluble Fractions of Chemical Elements in Silt Loam Soils Using ASD-derived Reflectance Spectroscopy, Pedosphere (submitted)
31

3. Spectrally active chemical elements as potential soil particle tracers
3.1 Introduction
The chemical composition of soils determines nutrient availability, plantgrowth and soil dynamics. Estimating the concentration of chemical ele-ments in soils requires extensive sampling and laboratory testing, whichis time consuming and expensive. In this chapter, infrared spectral datawere used to develop statistical models that predict and quantify amountsof soluble fractions of soil chemical composition by identifying spectralsubsets of spectral wavelength regions.
Reflectance spectra have been used for the last four decades to describethe Earth’s surface composition [van der Meer, 2006]. Studies mostlylooked at the visible, near-infrared (VNIR), and shortwave-infrared (SWIR)regions of the electro-magnetic spectrum. In the early 1980s, it wasreported that soil moisture content, organic matter, soil texture and ironcontent influence the spectral response in VNIR and SWIR [Baumgardneret al., 1985]. A decade later, multivariate statistics were introduced tostudies on chemical elements in soils [Palacios-Orueta and Ustin, 1998].As stated by Stenberg et al. [2010], the influence of chemical bonds onreflectance is explained by broad molecular overtone and combinationbands in the VNIR spectral region of three functional groups in minerals:SO3 , CO4 , and OH. The abundance of compounds is mainly determinedby soil type and parent material. The effect of major soil constituentsand chemical bonds in minerals on infrared spectra has been extensivelyreported in literature [Ben-Dor et al., 2003, Viscarra Rossel et al., 2006]. Theresulting complex spectra have been found to present a challenge whenassigning specific absorption features to individual chemical elements[Ali et al., 2010]. Soluble fractions of these elements determine chemicalprocesses and concentrations available to plants. To gain insight, influenceof inorganic chemicals on specific parts of the spectral response, attentionhas been paid on multivariate statistics [Ben-Dor and Banin, 1995, Shepherdand Walsh, 2002, Udelhoven et al., 2003].
Some efforts to relate soil spectra to chemical constituents have beendirected towards spectral math using reference [Ben-Dor and Banin, 1995,Ben-Dor et al., 2003, Farifteh et al., 2007, Stenberg et al., 2010, Viscarra Ros-sel et al., 2006]. For example, multiple linear regression analysis wasapplied for identifying the presence of Nitrogen [Dalal and Henry, 1986],
32
3.1. Introduction
Carbonates and organic matter [Ben-Dor and Banin, 1995, Gomez et al.,2008]. Multivariate adaptive regression splines were used for identificationof Calcium, Magnesium and Organic Carbon [Shepherd and Walsh, 2002].Unlike principal component analysis or multi linear regression, PartialLeast Squares Regression (PLSR) handles correlated, many and noisy data.PLSR has been used to prevent correlation from being explained as mea-ningful information [Wold et al., 2001]. Specific to soil constituents, PLSRhas been applied to Infrared spectra in the 400 to 2500 nm wavelengthrange for Nitrogen [Reeves III et al., 1999], Magnesium and Manganese[Janik et al., 1998] as well as inorganic Carbon and total Carbon [McCartyet al., 2002, Reeves III et al., 1999]. PLSR was also applied in several otherstudies [Lee and Ramsey, 2001, Udelhoven et al., 2003, Viscarra Rosselet al., 2006], showing its use for determination of soil nutrient status, soildevelopment and soil degradation. Moreover, wavelength regions, thatresult from molecular overtones, have been defined for identifying andquantifying chemical elements in soil [Farifteh et al., 2007, Gomez et al.,2008, Lee and Ramsey, 2001, Udelhoven et al., 2003, Viscarra Rossel et al.,2010, Yitagesu et al., 2009]. The applied methods were based on directand indirect relationships between compounds and soluble fractions.
However, there are two gaps in the studies listed in literature. Firstly,there is no conclusion on whether specific absorption features can beassociated with soluble fractions of chemical elements in soils, eitherdirectly or indirectly. Secondly, a specific wavelength range associatedwith each element, covering a 50–70 nm range in VNIR or SWIR, has notbeen reported to date. Such a narrow range of wavelengths would beimportant for separating and defining regions associated with respectivesoluble fractions of elements in silt loam soils. Currently, overlap betweenconstituents makes diffuse reflectance spectroscopy in VNIR and SWIRto be considered non-specific [Stenberg et al., 2010]. Direct or indirectrelationships between soluble fractions of elements and infrared spectraaid differentiating. Identification of relevant spectral features in a PLSRcalibration is important for several reasons. Firstly, it serves as a steppingstone to understanding physical basis, and secondly, the selection ofonly important features can decrease the risk of over-fitting, allowing theobtainment of more robust models with fewer parameters.
The aim of this chapter is to identify specific wavelength ranges that
33

3. Spectrally active chemical elements as potential soil particle tracers
statistically predict and quantify, Calcium (Ca), Magnesium (Mg), Potassium(K), Sodium (Na), Iron (Fe) and acidity (pH) in silt loam soils by applyingPLSR techniques on spectral features within the VNIR and SWIR wavelengthregions. The current study focuses on silt loam soils in Southeast Spain,outlining relationships of the elements with spectra acquired for this soiltextural type.
3.2 Methodology
3.2.1 Sampling and laboratory data collection
The study area is located within the Guadalentin Basin of Murcia Province,Spain. This area was selected as part of the European Union DESIREProject, on desertification and soil erosion [Alterra, 2007]. The area is partof an alluvial plain formed by the Guadalentin River. The soil materialconsists of sediments and salt-rich transported material from nearbyslopes [Hernandez Bastida et al., 2004]. A total of 60 surface soil sampleswere collected using a sampling spade, following a random samplingstrategy. The common attribute of the soils is a silt loam texture with 20–25 % clay and more than 50% silt. Although similar in texture, the samplesbelong to three different soil types as defined by the FAO [2006]. Differentsoil types were sampled to ensure variation in soil chemical composition.The sampled soils include Calcisols, soils with substantial accumulation oflime (A and D); Regosols, well drained mineral soils which lack of horizondevelopment or exhibit minimal A and B horizon development (B); andFluvisols with distinct topsoil horizon (C) [FAO, 1998].
Each soil sample was air-dried for 48 hours at room temperature. Thesoil material was sieved through a 2 mm sieve. To determine chemi-cal concentrations, we followed procedures for water extractable soils[Van Reeuwijk, 2002] in 1:20 dilutions with demineralized water. Induc-tively Coupled Plasma-Optical Emission Spectroscopy (ICP-OES) was usedwith a detection limit of 0.01 ppm to estimate the chemical concentrationsof soluble Ca, Mg, K, Na, and Fe. Acidity (pH) was determined using astandard hand held Horiba pH Probe with a glass electrode, in a pH rangeof 0–14 following Van Reeuwijk [2002]. Spectra were acquired using anAnalytical Spectral Devise (ASD) Fieldspec Pro Spectrometer with a 450–
34

3.2. Methodology
2500 nm wavelength range at 3–10 nm resolution and a contact probe asfore-optic. Averages of 25 spectral measurements per sample, collected bymoving the probe, were used in the modeling. The internal average of theinstrument was kept as default at 10 iterations.
3.2.2 Partial Least Squares Regression Models
PLSR models were built using Unscrambler X software version 10.0.1[CAMO Software AS, 2010]. The produced prediction model is a set ofequations (or PLSR factors) computed as linear combinations of spectralamplitudes, by using a regression coefficient (known as b-coefficient) foreach wavelength position [Yitagesu et al., 2009]. The larger the values ofthese coefficients, the more important the wavelength is for the model[Gomez et al., 2008]. Considering the nature of the prediction models,possible autocorrelation between sampling points is neglected since itis handled by the software. This is automatically done by transformingthe original variables into a set of orthogonal latent variables, which alsoresults in noise reduction [Seiden et al., 1996].
Spectra were normalized by dividing the reflectance values for eachsample by the maximum spectral value. This is to ensure a normal distri-bution of the data needed to avoid uncontrolled scale variation [Lai et al.,2007, Yitagesu et al., 2009]. The spectra were smoothed with a SavitzkyGolay filter [Savitzky and Golay, 1964] in Unscrambler software. The filterwas characterized by a second order polynomial fit and 7 smoothing datapoints, to remove spectral noise spikes while preserving chemical infor-mation, as suggested by Savitzky and Golay [1964] and Bogaert and D’Or[2002]. All samples were included in the prediction model development.The chemical elements Ca, Mg, K, Na, and Fe, as well as acidity, wereused as input prediction variables. For each input variable, a set of latentvariables (principal components) were selected, based on cross-validation,explained variance and correlation between attributes (loadings). The sumof the selected components explained a minimum of 85 % of the residualvariance (first local maximum), to avoid over-fitting. High number of latentvariables is known to lower the prediction error, however it introducesbias to the interpretations [Stevens et al., 2010]. The explained varianceand loadings are used to assess the relevance of an individual component
35

3. Spectrally active chemical elements as potential soil particle tracers
to the overall model [Westad et al., 2003]. Loadings explain the importanceof the variables, where the number of variables included in the models andtheir standard deviations influence the actual correlation structure [Westadet al., 2003]. PLSR regression coefficients (raw b-coefficients) were used forselecting specific wavelength ranges associated with each variable [Haalandand Thomas, 1988]. These were computed by Unscrabler software andtheir accuracy was assessed for 95 % confidence interval based on compu-tation of t-values from Student t-distribution. The significance level wasestimated and represented by comparison of t-values and their theoreticaldistribution resulting in computation of p-values. P-values lower than0.05 (95 % confidence) were associated with significant wavelengths forprediction of the elements. T-values were calculated as a ratio betweendeviation from the mean and the standard error of the mean.
To assess each prediction model, a full cross validation, applying leave-one-out method, was performed. This validation method was preferredtaking into account the limited number of samples [Stenberg et al., 2010,Viscarra Rossel et al., 2006, Yitagesu et al., 2009]. Root mean-square er-ror (RMSE) of cross validation were used together with the loadings andb-coefficients [Gomez et al., 2008, Stenberg et al., 2010, Viscarra Rossel,2008, Westad et al., 2003]. These were automatically calculated by theUnscrambler software in units same as the input data. The coefficients ofdetermination for the identified wavelengths were compared to literature[Udelhoven et al., 2003, Viscarra Rossel et al., 2006], in terms of establi-shing whether the identified absorption features corresponded to alreadyreported soil constituents or molecular overtones.
3.3 Results and Discussion
3.3.1 Sampling and laboratory data collection
The results obtained through laboratory analysis are summarized in Table 3.1and 3.2, for all samples. All data are skewed, indicating the need for nor-malization prior to modelling. Table 3.1 contains description and expectedconcentrations per soil type to emphasize variation between and withinsamples (Table 3.1), based on FAO [2006]. It can be noted that the soils arecharacterized with high Ca levels, while Na is present in low quantities. The
36

3.3. Results and Discussion
Table 3.1: Soil characteristics [FAO, 2006] and mean concentrations per soil type.Each soil type contents 15 sampling units
SoilType
SoilTex-ture
ParentMaterial
ProcessesandCharacte-ristics
Mean measured concen-trations at depth of 0–20cm (ppm)
Ca Mg Fe K NaCalcisols Sandy
LoamAlluvial,collu-vial andaeoliandepositsof wea-theringmaterial
Water ero-sion
680.4 13.9 2.9 16.7 3.1
Regosols SiltLoam
Unconsoli-dated,finelygrainedmaterial
Water ero-sion; De-position
623.1 10.8 2.5 15.2 2.4
Fluvisols SandyLoam
Alluvialandmarinedeposits
Water Ero-sion; De-position
225.4 5.3 2.6 12.7 2.0
texture of all samples comprises of more than 50 % silt. Hence, variation inchemical composition is mainly determined by the difference in soil type.High Ca concentrations were found in soil samples that belong to Calcisols,as expected. The smallest variation in elements concentration is noted forFluvisols (see Table 3.1), which is associated with formation of a salt crustat the surface (Table 3.1).
3.3.2 Partial Least Squares Regression
The results from each prediction model are summarized in Table 3.3. Rootmean square error (RMSE) values indicate the quality of performance ofthe model. The wavelength ranges associated with the each property are
37

3. Spectrally active chemical elements as potential soil particle tracers
Table 3.2: Mean, minimum, maximum and standard deviation of soil propertyconcentrations for the total of 60 samples, determined following a referencemethod for ICP-OES
Soil property Mean Min Max Std Dev.pH 6.70 5.85 7.43 0.43
Ca(ppm) 580.68 21.58 2144.84 525.10Mg(ppm) 11.60 2.07 43.85 9.33K(ppm) 15.59 6.61 35.32 6.54Na(ppm) 2.68 0.77 8.17 1.24Fe(ppm) 2.79 1.52 5.73 0.94
listed with corresponding R2 (Table 3.3). The highest correlation is notedfor K and Ca. The values for significance (p values) of b-coefficients perelement were used for selection of specific wavelength ranges and areshown in Table 3.3. RMSE values range between 0.80 ppm for Na to 3.73ppm for K. Full record of all statistical parameters estimated during thecross validation per soil property is included in Figures 3.1- 3.6.
PLSR uses correlated variables and relates them to a set of outputvariables by projecting the data into a low dimensional space, defined byorthogonal latent vectors [Dayal and MacGregor, 1997]. The presence ofexchangeable ions in soils that are high in clay content can influence theprediction of soluble fractions of elements [Gomez et al., 2008]. Moreover,as stated in Stevens et al. [2010], the use of spectral data derived fromheterogeneous areas in terms of soil type, has been reported to diminishthe predictive ability of VNIR-SWIR spectroscopy. Hence, the results of thisstudy should not be extrapolated to not sampled soil types. To establishrelationships between absorption and chemical elements for clay-rich soils,representative samples would need to be included in the PLSR analysis.
The specific wavelength ranges predicted for soluble fraction of Ca coin-cide with reports in literature on Calcium Carbonate overtone vibrationsat 2333 nm [Baumgardner et al., 1985, Gomez et al., 2008, Shepherd andWalsh, 2006, Udelhoven et al., 2003]. This is expected since the concentra-tions of Ca in these soils are determined by the presence of lime. Figure 3.1shows PLSR model performance for Ca. Three distinct clusters can beidentified associated to the differences in concentration between soil types.
38

3.3. Results and Discussion
Table 3.3: Results of PLSR models: coefficients of determination, Root Mean SquareError (RMSE) of Cross Validation (leave-one-out) and wavelengths associated withindividual chemical elements found in soils.
Soil pro-perty
RMSEof CV
Significantwavelengthrange
R-Squareper band
Mean P valuesfor B-coefficientper band range
Ca 3.270 2310–2379 0.904 0.007
Mg 3.570 1693–1722;2350–2410
0.754;0.829
0.030; 0.028
K 3.730 1628–1699;2440–2480
0.883;0.913
0.021; 0.01
Na 0.808 2025–2103 0.774 0.033
Fe 0.909 2225–2261 0.738 0.023
pH 2.360 1001–1096;2334–2379
0.731;0.885
0.021; 0.019
The b-coefficients, combined with coefficients of determination for Fe,indicate a specific wavelength range between 2225–2261 nm (Table 3.3).This wavelength range is associated with the presence of clay particlesin soils, and the high coefficient values are likely caused by Fe-OH bonds[Herrmann et al., 2001]. The expected absorption feature near 1000 nmfor Fe was not selected, which could be caused by low abundance of thiselement in the top soil at all sampling locations (Table 3.1 and 3.2). Thisis also the reason for the lowest R2 values derived from the PLS model(R2 =0.73). As shown on Figure 3.3, prediction values are underestimatedby the model for soluble K, the model outlined absorption bands centrednear 2470 nm with a R2 of 0.91 and RMSE of cross validation of 3.73(Table 3.3). Figure 3.3 shows the model performance, indicating the fitbetween regression lines for predicted and measured values. Literaturedoes not report on influence of molecular overtones or certain chemicalbonds in this region. However, investigation with different concentrations
39

3. Spectrally active chemical elements as potential soil particle tracers
Figure 3.1: Cross validation for Calcium in all 60 samples, predicted versus refe-rence values for soluble fractions of chemical elements against the full spectrum.Blue line: calibration line. Red line: validation line.
of these soluble fractions established the direct influence of the elementon absorption [Luleva et al., 2011]. The wavelength range identified forMg between 2350–2400 nm (Table 3.3) can be explained by the Mg–OHfeature reported in literature [Clark et al., 1990, Herrmann et al., 2001].The model performance, shown on Figure 3.4, indicates the suitability ofthe technique for the prediction of this element with R2 values of 0.83and RMSE of 3.57. PLSR models for Na, as seen in Table 3.3, produceR2 of 0.77 for the significant wavelength range between 2025–2103 nm.The difference between regression lines that correspond to predicted andmeasured values (Figure 3.5) can be explained by the difference in soilsalinity between the soil types. Wavelength regions associated with soilpH have been found to overlap with those corresponding to Ca, showinga R2 of 0.89 for the wavelength range between 2334–2379 nm (Table 3.3).This can be explained by soil pH that is directly influenced by calciumcarbonate contents, higher concentrations leading to a higher pH. This isalso shown on Figure 3.1 and Figure 3.6, where the similar performance of
40
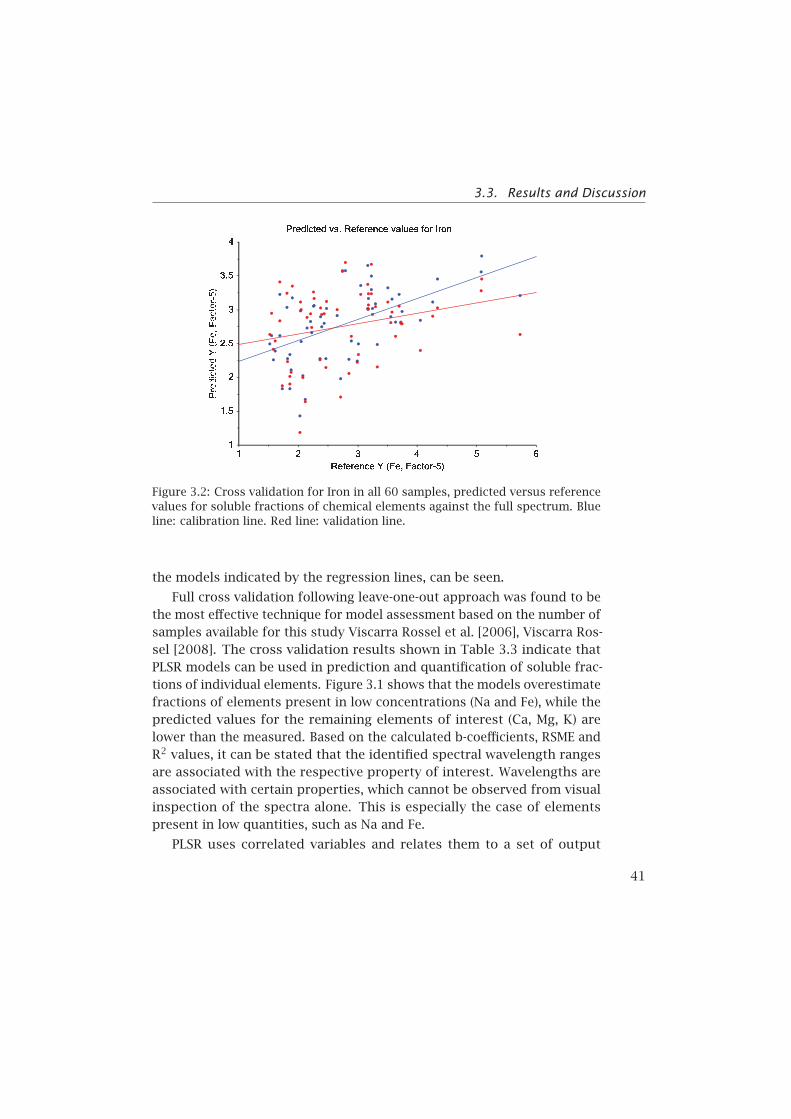
3.3. Results and Discussion
Figure 3.2: Cross validation for Iron in all 60 samples, predicted versus referencevalues for soluble fractions of chemical elements against the full spectrum. Blueline: calibration line. Red line: validation line.
the models indicated by the regression lines, can be seen.
Full cross validation following leave-one-out approach was found to bethe most effective technique for model assessment based on the number ofsamples available for this study Viscarra Rossel et al. [2006], Viscarra Ros-sel [2008]. The cross validation results shown in Table 3.3 indicate thatPLSR models can be used in prediction and quantification of soluble frac-tions of individual elements. Figure 3.1 shows that the models overestimatefractions of elements present in low concentrations (Na and Fe), while thepredicted values for the remaining elements of interest (Ca, Mg, K) arelower than the measured. Based on the calculated b-coefficients, RSME andR2 values, it can be stated that the identified spectral wavelength rangesare associated with the respective property of interest. Wavelengths areassociated with certain properties, which cannot be observed from visualinspection of the spectra alone. This is especially the case of elementspresent in low quantities, such as Na and Fe.
PLSR uses correlated variables and relates them to a set of output
41

3. Spectrally active chemical elements as potential soil particle tracers
Figure 3.3: Cross validation for Potassium in all 60 samples, predicted versusreference values for soluble fractions of chemical elements against the full spec-trum.Blue line: calibration line. Red line: validation line.
variables by projecting the data into a low dimensional space, defined byorthogonal latent vectors [Dayal and MacGregor, 1997]. The presence ofexchangeable ions in soils that are high in clay content can influence theprediction of soluble fractions of elements [Gomez et al., 2008]. Moreover,as stated in Stevens et al. [2010], the use of spectral data derived fromheterogeneous areas in terms of soil type, has been reported to diminishthe predictive ability of VNIR-SWIR spectroscopy. Hence, the results of thisstudy should not be extrapolated to not sampled soil types. To establishrelationships between absorption and chemical elements for clay-rich soils,representative samples would need to be included in the PLSR analysis.
These results show the feasibility of the proposed methodology foridentifying soluble fractions of soil chemical elements in silt loam soilsusing infrared spectroscopy. The influence of each element on specificwavelength ranges can be explained by the molecular overtones of thecompounds present in the soil samples. The prediction models associatedwith soluble fractions of various concentrations (Ca, Mg and K) gave overall
42

3.4. Conclusions
Figure 3.4: Cross validation for Magnesium in all 60 samples, predicted versusreference values for soluble fractions of chemical elements against the full spec-trum.Blue line: calibration line. Red line: validation line.
higher R2 and lower RMSE values. This suggests that the methodologycan potentially be applied to other soil types in order to develop a moregeneralized soil model for prediction of soluble fractions of individualchemical elements.
3.4 Conclusions
This chapter reports on an approach for identification of soluble fractionsof Calcium, Magnesium, Potassium, Sodium, and Iron as well as acidity (pH)through laboratory spectral response. The highest coefficients of determi-nation were reported for Calcium, Magnesium and Potassium. Elementssuch as iron and sodium were strongly correlated only to specific wave-length ranges with limited influence over the full wavelength range. Thechapter presents an attempt to identify the influence of individual solublefractions of chemical elements in silt loam soils on infrared spectra.
43
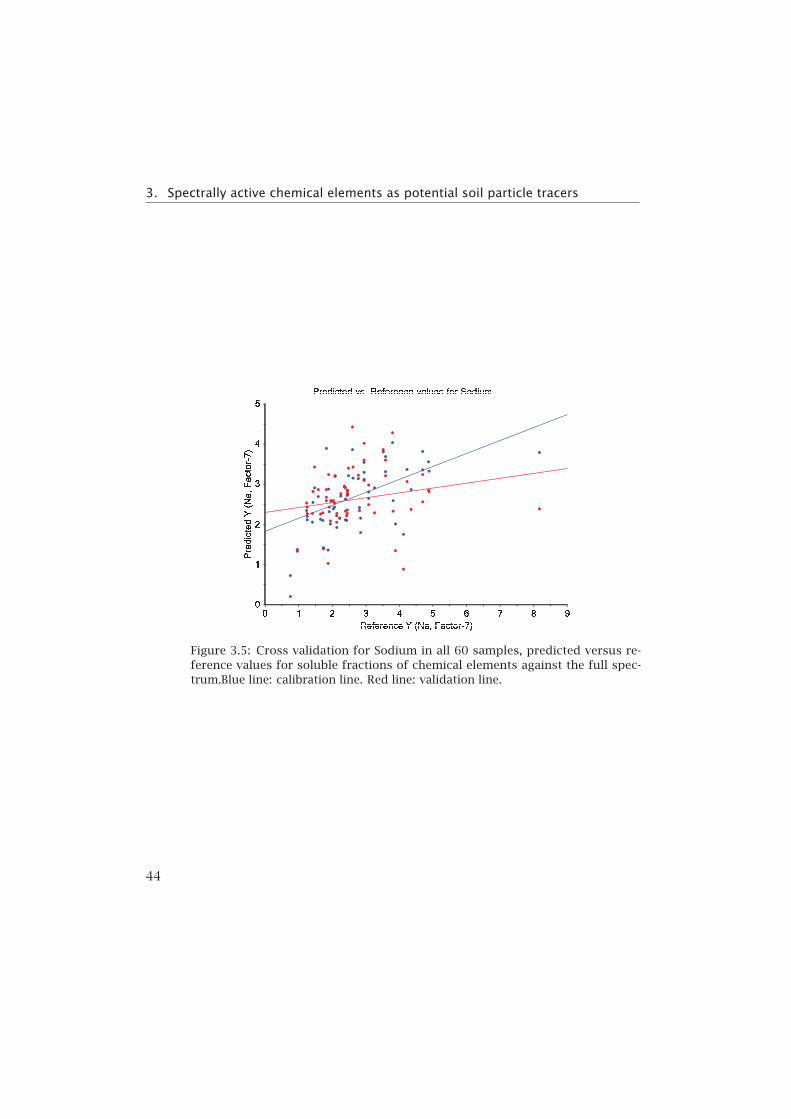
3. Spectrally active chemical elements as potential soil particle tracers
Figure 3.5: Cross validation for Sodium in all 60 samples, predicted versus re-ference values for soluble fractions of chemical elements against the full spec-trum.Blue line: calibration line. Red line: validation line.
44

3.4. Conclusions
Figure 3.6: Cross validation for pH in all 60 samples, predicted versus referencevalues for soluble fractions of chemical elements against the full spectrum.Blueline: calibration line. Red line: validation line.
45


4Spectral sensitivity of Potassium
as a proxy for soil particle
movement
Abstract
In Chapter 3, the feasibility of using Partial Least Squares Regres-sion for identifying soluble fractions of soil chemical elements insilt loam soils using infrared spectroscopy was tested. By outliningwavelength ranges where the change in reflectance is associated withchange in the concentration of the element, Potassium was identifiedas having the closest to 137Cs properties that can be predicted frominfrared spectra.
This chapter presents a laboratory based study on the use of Po-tassium (K) as a potential replacement of Cesium (Cs) in soil particletracing. The element has similar electrical, chemical and physicalproperties. In order to test this, heavy clay, clay loam, loam, silty loamand sandy loam and fine sand soils were sampled for the study. Sensi-tivity analyses were performed on soil chemical properties and spectrato identify the wavelength range related to K concentration. Differentconcentrations of K fertilizer were added to soils with varying texturein order to establish spectral characteristics of the absorption featureassociated with K. 1
1This chapter is based on: Luleva, M.I., van der Werff, H., Jetten, V., van der Meer,F., (2011). Can Infrared Spectroscopy Be Used to Measure Change in Potassium NitrateConcentration as a Proxy for Soil Particle Movement?, Sensors (11), 4188–4206.
47

4. Spectral sensitivity of Potassium as a proxy for soil particle movement
4.1 Introduction
Land degradation is a relatively slow process [Omuto and Shrestha, 2007].Physical and chemical degradation, under the influence of wind and wa-ter, leads to loss of nutrients, soil instability, subsoil exposure and de-sertification. Well-known erosion features such as rills and gullies aremanifestations of an already advanced degradation [Boardman et al., 2009,Boardman and Evans, 2006]. To detect early warning signs, however, itis important to monitor soil properties sensitive to degradation, such aschemical composition, runoff and sediment yield. Natural variation in soilchemical composition is associated with bedrock geology and soil type,although agricultural practices and overgrazing also influence surface soilchemistry and quality [Lemenih et al., 2005, Nael et al., 2004, Zhang et al.,2006]. Hence, studies on soil erosion have focused on using soil chemicalcomposition mainly for particle tracing.
Various chemical soil particle tracers have been used to obtain spatiallydistributed data for soil erosion [Zhang et al., 2006] and used to identifysuspended sediment [Onda et al., 2007]. Commonly used soil particletracers are the Cesium 137 isotope (137Cs ) [Andersen et al., 2000, Chappell,1999, Collins et al., 2001, Guimaraes et al., 2003, Porto et al., 2001, Sanchez-Cabeza et al., 2007, Timothy et al., 1997], Lead (210Pb) and Beryllium(7Be) [Mabit et al., 2008, Wallbrink and Murray, 1993], and Rare EarthOxides [Polyakov and Nearing, 2004, Zhang et al., 2006]. Although 137Csis considered the primary chemical tracer for detection of soil particlemovement [deGraffenried Jr and Shepherd, 2009, Estrany et al., 2010,Meusburger et al., 2010, Rodway-Dyer and Walling, 2010, Xiaojun et al.,2010], one has to assume a homogeneous distribution of 137Cs fall outlimited to the Northern hemisphere, and that all particle movements are aresult of soil erosion [Campbell et al., 1982, Chappell, 1999, Walling andQuine, 1990]. Cost of soil sampling and analysis and the limited half-lifeof the element are the main limitations to extrapolate these methods tocover large areas [Boardman, 2006].
Soil properties have been studied with infrared spectroscopy since the1980’s, using visible, near-infrared and shortwave infrared wavelengthregion (400–2500 nm). Spectral reflectance is determined by both physicaland chemical characteristics of soils [Baumgardner et al., 1985, Ben-Dor
48

4.1. Introduction
et al., 2003, Shepherd and Walsh, 2002]. Soil spectral features are mainly aresult of overtone absorption and combination of bond vibrations in mole-cules of three functional groups in minerals: OH, SO4 and CO3, [Ben-Dorand Banin, 1995, Hunt and Salisbury, 1970]. Organic matter is also found tohave influence on spectral response since it holds most positively chargednutrients in soils. However, due to the relatively weak attraction between Kand this soil constituent, K absorption is not found to be affected [Schulteand Kelling, 1998]. Results obtained using regression models for detectionof soluble fractions of Potassium, only have moderate accuracy and varyaccording to study sites [Stenberg et al., 2010]. Sampling large areas fordetermination of soil properties using spectral reflectance is relativelycheap and fast, compared to traditional field and laboratory techniques[Shepherd and Walsh, 2002]. To date, infrared spectra have not been putin use when studying soil erosion with 137Cs . Low concentrations of theisotope in nature makes the identification of the element through spectralmeans impossible, considering the capabilities of available spectrometers[Stevens et al., 2010].
The element Potassium (K) shares electrical, chemical and physicalproperties with Cs, both being members of the Group I alkali metals[Andrello and Appoloni, 2004, Relman, 1956]. Both elements have similarbiological and chemical behaviour, where the difference is only in reactivity[Relman, 1956], but it has not been tested as a particle tracer. Potassiumoccurs naturally in the environment, but it is also used on agriculturallands as a fertilizer. The amount of K fertilizer (in a form of K2O orK–P–N) typically applied by farmers, according to EU Directives: NitratesDirective (91/676/EC) and Water Framework Directive (2000/60/EC), aswell as EU commission recommendations, is 183 kg of solid fertilizer perhectare or in dissolved solution 1.83 g of solid fertilizer per 10 ml of waterfor sandy silt soils, although there is no specific policy adopted for theEU region. In practice, the range of totals of applied amount may reach5–8 g/10ml according to soil type and water conditions. In soils, K ismainly present as part of preliminary soil minerals (unavailable), in clayminerals and fine silt (slowly available), and in a water-soluble form (readilyavailable) [Garrett, 1996, Peterburgsky and Yanishevsky, 1961, Sharpley,1989]. When K fertilizers are applied, they dissolve and K becomes partof the soil-water solution [Garrett, 1996]. Fertilizers are applied prior to
49

4. Spectral sensitivity of Potassium as a proxy for soil particle movement
harvesting. To maintain optimal crop production, uniform application ofthe fertilizer is the most desired practice [Jalali, 2007]. Potassium remainsimmobile as long as soils are not chopped or plowed. The mobility anddistribution of this element has also been discussed by Askegaard andEriksen [2000], Jalali and Rowell [2009, 2003]. These authors explain thebehaviour of the element determined by soil physical properties suchas texture, porosity, organic matter and water holding capacity. Theyalso state that due to low cation exchange capacity and organic mattercontent, sandy soils are more likely to experience K leaching than clays.Furthermore, soil texture combined with chemical composition (presenceof Calcium, Sodium or Gypsum, of both soil and water used for irrigation)determine the rates of leaching of K [Jalali and Rowell, 2003, Kolahchi andJalali, 2007]. Establishing the behaviour of K in soils can prevent underor overestimating of predicted sediment deposits in studies where theelement is used as a tracer.
The aim of this chapter is to determine spectral characteristics ofK in soils and its capability to replace 137Cs in large scale soil erosionmonitoring. This is examined by measuring infrared spectral responseof soils of different texture. The laboratory analysis comprises of twoexperimental stages, with varying concentrations of added K fertilizer.Fertilizer concentrations, in range of three times higher than typicallyapplied by farmers, are used to quantify K through spectral analysis andestablish wavelength ranges sensitive to change in concentration of theelement. The findings are subsequently compared to literature based onPartial Least Squares Regression modelling and derivative manipulations.The second stage of the experiment includes application of typically usedin agricultural field concentrations, to determine the lowest detectableconcentrations.
4.2 Methods
4.2.1 Laboratory Experiment
Eight locations in central, east and southeast Netherlands were chosen forsoil sample collection, according to soil type and soil texture. The collectedmaterial varied from heavy clay (Fluvisol- Eutric), clay loam (Fluvaquent-
50

4.2. Methods
Typic), loam (Fluvisol- Calcaric), silty loam (Luvisol- Orthic) and sandy loam(coarse sand) (Podzol- Humic), to fine sand (Arenosols- Albic). Descriptionof each soil type can be found in Table 4.1.
At each location, 1–2 kg of material was collected using a clean spadeto form a composite sample of the surface soil (0–5 cm). Each compositesample comprised of ten combined discrete samples collected around asingle location, in order to represent all components of the sampled bodymaterial. Duplicates were acquired for silty and sandy loam soils. Thesamples were air dried for two days and subsequently sieved to removeparticles larger than 5 mm. First, each sample was divided and placedin four identical metal dishes (30 g of soil each). The soil material inthree of the dishes was fertilized with respectively 8, 16 and 32 g/10mlsolution of Potassium Nitrate Fertilizer (46 % K2O 13 % N, Organic mat-ter). The use of fertilizer in the experiment allowed strict control overthe added concentrations. To the fourth, demineralised water was addedfor use as a reference. Prior to acquiring spectra, samples were driedovernight at 30 degrees Celsius, to remove the effect of moisture on thespectral reflectance. The percentage Sand-Silt-Clay content was determinedthrough bulk density and soil texture analysis, following standard labo-ratory procedures [Van Reeuwijk, 2002]. An Analytical Spectral Devices(ASD) Fieldspec Pro Spectrometer with a 450–2500 nm wavelength rangecoverage at 3–10 nm spectral resolution was used to acquire reflectancespectra. A high-intensity contact probe with internal light source wasused as fore-optic with a spot size of 10mm. An average spectrum wascreated per soil textural type and amount of K, based on 10 measurementsrepeated for 20 iterations.
In the second stage of the experiment, three soil textural types (heavyclay, fine sand and silt loam) were selected, as these clearly show theeffect of each textural component (sand, silt, clay) on spectra. The sameprocedure as above was followed, but now nine dilutions of fertilizer inthe range of 1.13 g/10ml to 1.93 g/10ml were applied to each soil class,and one set was used as a reference. Spectra were collected in the samesetup as described above.
51

4. Spectral sensitivity of Potassium as a proxy for soil particle movement
Figure 4.1: Absorption feature parameters: absorption band depth, absorptionband width, absorption band center., after van der Meer [2004]
4.2.2 Absorption Feature Parameters
To determine the wavelength range influenced by change in K concen-trations, and to compare the parameters from a common base line, anabsorption feature analysis using continuum removal was performed follo-wing Richter et al. [2009]. This method is found to enhance differences inshape between individual features [Noomen et al., 2006]. Mathematically,it is calculated by dividing each individual spectrum by the correspondingcontinuum line [Kokaly and Clark, 1999]. Absorption features were asso-ciated with K through sensitivity analysis to assess the impact of addedfertilizer on specific absorption features. After identifying the wavelengthrange related to K, absorption feature characteristics including absorptiondepth, absorption center, absorption area and absorption width of theindividual feature were calculated using IDL-ENVI software [ITT VisualInformation Solutions, 2009]. Figure 4.1 is an example to illustrate eachabsorption feature parameter. Equations implemented in IDL scripts arereported in van der Meer [2004].
52

4.2. Methods
Table 4.1: Soil types [FAO, 2006, de Bakker, 1979] and typical texture characteris-tics per soil type. Each soil type contents 15 sampling units
MapUnit
Soil Type Description and Properties[FAO, 2006]
Texture
Rn95C Fluvaquent-Typic
Originate from Clayey ma-rine and fluvial sediments.Typically sandy loam or finesand texture.
Clayloam
Rd10A Fluvisol-Calcaric
Originate from predomi-nantly recent fluvial and ma-rine deposits. Calcaric mate-rial between 20 and 50 cmfrom the surface
Loam
Rn44C Fluvisol-Eutric
Originate from predomi-nantly recent fluvial and ma-rine deposits. Having a basesaturation of 50 % or morein the major pat between 20and 100cm from the soil sur-face.
HeavyClay
Zd21 Arenosols-Albic
Originate from unconsoli-dated, finely grained mate-rial. Relatively young, sandysoils with no profile develop-ment
FineSand
Hd30 Podzol-Humic
Originate from weatheringmaterials of siliceous rock.Spodic illuviation horizonunder a subsurface horizonthat has the appearance ofash and is covered by an or-ganic layer
CoarseSand
Bld6 Luvisol-Orthic
Originate from unconsolida-ted material. Pedogeneticclay differentiation betweentopsoil and subsoil. Proneto erosion due to high siltcontent.
SiltyLoam
53

4. Spectral sensitivity of Potassium as a proxy for soil particle movement
4.3 Results
4.3.1 Laboratory Testing of Potassium Influence on Spectra
Based on results from continuum removal and sensitivity analyses, thewavelength range that relates to Potassium concentration was found to be2450–2470 nm. For this wavelength range, coefficients of determinationvalues vary between 0.918 for clay loam samples to 0.984 for silty loamsamples. Figure 4.2 shows changes in absorption at 2450–2470 nm causedby changes in K concentration, based on the first stage of laboratory expe-riments. The deepest point of absorption was observed between 2450 nmand 2470 nm. With addition of fertilizer, the depth of absorption increasesaccordingly. This is also observed when small quantities of fertilizer wereapplied (Figure 4.3). This figure shows changes in absorption after applica-tion of fertilizer in quantities between 1.13 g/10ml and 1.93 g/10ml, forthe heavy clays, fine sand and silt loam soil samples. Changes are notedfor fine sand and silt loam samples, the absorption in the heavy clay soilsamples is not clear.
4.3.2 Absorption Feature Analysis
Figure 4.4 shows variation per soil textural type in absorption depth, widthand center of absorption in the 2450–2470 nm wavelength range. Figure 4.5shows changes in absorption feature characteristics due to increase in Kconcentrations. Both figures show that the spectral response of soilswith higher clay content is characterised by noisier spectrum. A shift of5–10 nm in center of absorption is most profound in the clay samples,although all samples show a shift to lower wavelengths with increase of Kconcentration. An increase in band depth is noted for soil samples thatbelong to the silty loam textural class. This cannot be observed for theheavy clay and fine sand samples.
54

4.3. Results
[a]
[b]
Figure 4.2: Change in absorption at 2450–2470 nm with change in K concentration.Each spectrum is shown in continuum removed reflectance and it is an average of10 measurements. The blue lines belong to soils with no added fertilizer and usedas a reference. The deeper absorption features belong to samples with addition ofK fertilizer in concentrations 8, 16 and 32 g/10ml, indicated with black, green andred line respectively. The sub-figures show (a) Clay Loam, and (b) Loam.
55

4. Spectral sensitivity of Potassium as a proxy for soil particle movement
[a]
[b]
Figure 4.3: Change in absorption at 2450–2470 nm with change in K concentration.Each spectrum is shown in continuum removed reflectance and it is an average of10 measurements. The blue lines belong to soils with no added fertilizer and usedas a reference. The deeper absorption features belong to samples with addition ofK fertilizer in concentrations 8, 16 and 32 g/10ml, indicated with black, green andred line respectively. The sub-figures show (a) Heavy clay, and (b) Coarse Sand.
56

4.3. Results
[a]
[b]
Figure 4.4: Change in absorption at 2450–2470 nm with change in K concentration.Each spectrum is shown in continuum removed reflectance and it is an average of10 measurements. The blue lines belong to soils with no added fertilizer and usedas a reference. The deeper absorption features belong to samples with addition ofK fertilizer in concentrations 8, 16 and 32 g/10ml, indicated with black, green andred line respectively. The sub-figures show (a) Fine Sand, and (b) Silt loam.
57

4. Spectral sensitivity of Potassium as a proxy for soil particle movement
[a]
[b]
[c]
Figure 4.5: Change in absorption at 2450–2470 nm with change in K concentration.Each spectrum is an average of 10 measurements. The blue lines belong to soilswith no added fertilizer and used as a reference. The deeper absorption featuresbelong to samples with addition of K fertilizer in concentrations 1.13 g/10ml(black), 1.33 g/10ml (green), 1.73 g/10ml (orange) and 1.93 g/10ml (red); (a) Heavyclay, (b) Fine Sand, (c) Silt Loam.
58

4.3. Results
[a]
2440
2450
2460
2470
2480
2490
2500
Clay Loam Loam Heavy Clay Fine Sand Coarse sand Silty Loam Silty Loam-Ahorizon
Wav
elen
gth
(nm
)
Absorption Center (nm)
[b]
0
2
4
6
8
10
12
14
Clay Loam Loam Heavy Clay Fine Sand Coarse sand Silty Loam Silty Loam-Ahorizon
Dept
h (%
)
Absorption Depth (%)
[c]
0
20
40
60
80
100
120
Clay Loam Loam Heavy Clay Fine Sand Coarse sand Silty Loam Silty Loam-Ahorizon
Wid
th (n
m)
Absorption Width (nm)
Figure 4.6: Variation in absorption feature parameters per soil textural type. (a)Absorption center, (b) Absorption depth, (c) Absorption width.
59

4. Spectral sensitivity of Potassium as a proxy for soil particle movement
[a]
0
2
4
6
8
10
12
14
0 1.13 1.23 1.33 1.43 1.53 1.63 1.73 1.83 1.93
Dept
h (%
)
Concentration (g/10ml)
Absorption Depth (%)
[b]
R² = 0.9901
0
2
4
6
8
10
12
14
0 8 16 32
Dept
h (%
)
Concentration (g/10ml)
Absorption Depth (%)
[c]
0
20
40
60
80
100
120
0 1.13 1.23 1.33 1.43 1.53 1.63 1.73 1.83 1.93
Wid
th (n
m)
Concentration (g/10ml)
Absorption Width (nm)
[d]
R² = 0.9333
20
30
40
50
60
70
0 8 16 32
Wid
th (n
m)
Concentration (g/10ml)
Absorption Width (nm)
[e]
2440
2450
2460
2470
2480
0 1.13 1.23 1.33 1.43 1.53 1.63 1.73 1.83 1.93
Wav
elen
gth
(nm
)
Concentration (g/10ml)
Absorption Center (nm)
[f]
2440
2450
2460
2470
2480
2490
0 8 16 32
Wav
elen
gth
(nm
)
Concentration (g/10ml)
Absorption Center (nm)
Figure 4.7: Change in absorption feature parameters- depth of the absorption,width and center, classes based on varying concentrations of added K fertilizer 0to 32 g/10ml for all samples and soil textural types: (a) Absorption band depthfor 0 to 1.93 g/10ml, (b) Absorption band depth for 0 to 32 g/10ml, (c) Absorptionwidth for 0 to 1.93 g/10ml, (d) Absorption width for 0 to 32 g/10ml, (e) Absorptioncenter for 0 to 1.93 g/10ml, (f) Absorption center for 0 to 32 g/10ml.
60

4.4. Discussion
4.4 Discussion
4.4.1 Potassium Influence on Spectra
From continuum removal and sensitivity analysis performed on laboratoryderived spectra, the wavelength range where the center of K absorptioncan be found is 2450 to 2470 nm. This falls within the range reported inliterature using second derivative calculations [Ben-Dor and Banin, 1995]and Partial Least Squares Regression models [Udelhoven et al., 2003]. Thesestudies reported optimal calibration equations for K that produce R2 of0.89 for wavelengths between 2396 and 2462 nm. The characteristicfeature can be accounted to possible absorptions of combination modesbetween the free K ions and OH functional group.
Minor change in depth of absorption with addition of K fertilizer, isobserved in samples with high clay content, that belong to soil texturalclasses clay loam and heavy clay (Figures 4.2 and 4.3). This is explained bythe fact that clay content in samples prevents significant spectral changescaused by non-clay minerals [Ben-Dor et al., 2003]. Potassium is held at theedges of the clay particles, causing easy replacement by other positive ions[Johnston, 2010]. The soil textural types that show consistency betweenchange in K concentration and depth of absorption are also the ones mostprone to soil erosion: silty loam and fine sand (Figures 4.3(a), 4.3(b) &4.4(a)), and Figures 4.5(b) & 4.5(c)).
4.4.2 Absorption Feature Analysis
The center wavelength and depth of the K absorption feature becomesbetter defined with an increase in concentration of added fertilizer. Thisis observed in the findings that emerge from both stages of laboratoryanalysis for all soil textural types (Figure 4.2 and 4.5). Changes in absorp-tion feature parameters appear when 8, 16 and 32 g/10ml of fertilizerare applied. Figure 4.4(a) shows that soil texture defines the position of Kabsorption center. High clay content in soils causes greater fluctuationsin absorption center values. The increase in concentration, as seen inFigure 4.7(e) and 4.7(f)), has strong influence on the peak position onlyabove 8 g/10ml of fertilizer. The effect K concentration has on spectra is
61

4. Spectral sensitivity of Potassium as a proxy for soil particle movement
highlighted in the case of absorption band depth for concentrations higherthan 8 g/10ml (Figure 4.7(b).
Samples with high clay content experience smaller changes in absorp-tion compared to those belonging to highly erosive soil textural types -sand and silt loam. This is explained by the abundance of free K ions inclays and the formation of illite-like [Barre et al., 2008] groups, where Kreplaces water and fills the interlayer clay sites. The presence of clay par-ticles in soils causes shifts in clay absorption from 2200nm towards longerwavelengths, and therefore influencing the features at 2400–2500 nm [Ha-segawa, 1963]. On the other hand, as stated in Kolahchi and Jalali [2007],when K fertilizer is applied to soils with low clay content, K ions do notinteract strongly with the soil matrix. As a result, a localized increase in Kconcentration in the soil solution can be observed. The influence of textureon spectral absorption of K can be seen in Figure 4.6(a–c). Values forabsorption feature parameters: center of absorption, depth and width, aredependent on soil textural type. The figure shows how higher percentageof each textural component- clay (Clay loam, Loam, Heavy clay), sand (Finesand, Coarse sand) or silt (Silty loam), influences the results. Therefore, theinfluence of soil texture prevents the computation of a universal statisticalmodel for all textural classes.
Reflecting back on erosion, it is the silty soils that are most proneto erosion. Heavy Clays are rarely found in landscape positions proneto erosion since they are associated with floodplain soils. All the othertexture types can occur on hill slopes, but of those, the higher the sandcontent, the higher the infiltration rate, meaning less runoff. This leavesthe silty soils and loamy sands to be the most interesting in this context.
Both experiments indicate that quantification of K depends on theamount of fertilizer added to the soil samples, as well as the soil sand-silt-clay content. In order to serve as particle tracer, the initial amount of Kpresent in the soil should be established by collection of spectra prior tofertilizer application. This serves as a baseline and it should be accountedfor when change in concentration occurs due to removal of fertilizer byerosion agents. Furthermore, particle tracing using K fertilizer is limitedby K uptake by plants, and therefore cannot be performed after vegetationcover has emerged. Nevertheless, K can be quantified, through spectralresponse when more than 1.73 g/10ml of K fertilizer is present in the soil.
62

4.5. Conclusions
As shown in Figures 4.6(a–c) and 4.7, the degree of change above thisvalue becomes more constant for all textural types, while the fluctuation inparameter values for lower concentrations can be explained by noise in thespectra. In relation to common agricultural practices, this amount is theminimum quantity of needed fertilizer recommended for crop production.Higher amounts of available K in soils have not been found to causecontamination or have a negative effect on agricultural practices. Thislaboratory experiment to detect and quantify K concentration in soils usingspectral response, suggests that the technique can be applied in field andpossibly on airborne hyperspectral imagery in order to achieve rapid andextensive spatial coverage over large areas affected by soil erosion.
4.5 Conclusions
This chapter presents a new approach to soil particle tracing using infra-red spectroscopy, allowing a rapid monitoring of soil particle movement,towards monitoring soil erosion. The aim was to find a chemical elementthat can replace radioactive 137Cs , while allowing fast and relatively in-expensive way of obtaining spatial data. Potassium is known to have thesame physical and chemical behaviour in soils differing only in reactivity.Similarly to studies on 137Cs , near-even distribution of the element canbe assumed based on the annual application of fertilizer over soil erosionaffected fields. Limitations in K quantification are an unknown initialconcentration of available and unavailable K, as well as the effect of uptakeby plants. If fertilizer is present in concentrations higher than 1.73 g/10ml,our technique can be applied. Best results are achieved when the methodis used on soils high in sand and silt content.
The defined absorption feature with a peak center positioned between2450 and 2470 nm, in the infrared spectrum associated with Potassium,makes it possible to detect and quantify using spectroscopy. Spectrashould be acquired before and after the application of the fertilizer, toestablish reference concentration.
63


5Tracing Potassium in a silty loam
soil with field spectroscopy
Abstract
In Chapter 4, tracing soil particles using K fertilizer and infraredspectral response was identified as suitable technique for quantifica-tion of K in soils with sandy and sandy silt texture. It was suggestedas a new approach that can potentially grow to a technique for rapidmonitoring of soil particle movement.
The aim of this chapter is to identify soil particle movement usingPotassium fertilizer and infrared spectral response. Flow experimentwas conducted in the area of the Guadalentin basin in Murcia, SouthEast Spain. The severe soil erosion that takes place in the region, aswell as the silty loam texture of the soil, determined the selection ofthe field area. The study was used as a pilot experiment to identifypossible limitations of an experiment of this type.
65

5. Tracing Potassium in a silty loam soil with field spectroscopy
5.1 Introduction
Soil properties sensitive to soil erosion, such as chemical composition,moisture content, runoff and sediment yield, can serve as an indicator formonitoring and detecting early signs of degradation. Agricultural practicesand changes in landuse influence the quality and chemical compositionof the surface soil material, although natural variation associated withbedrock geology determines the soil type and composition [Lemenih et al.,2005, Nael et al., 2004, Zhang et al., 2006].
As already discussed previously in Chapter 2, an approach to predictsoil erosion is to use chemical tracers [Onda et al., 2007] as a proxy fortracking of soil particles movement [Zhang et al., 2006]. Soil particletracing is an approach to detect early signs of hazard in arid and semi-arid environments [Chappell, 1996]. The Cesium 137 isotope (137Cs ) isconsidered to be the primary chemical tracer for detection of soil particlemovement and has been used in soil erosion studies for over 40 years. The137Cs was introduced to the environment between the 1950s and 1970sthrough nuclear fallout of atomic bomb tests, and in 1986 through theChernobyl power plant accident (see Chapter 3). The applicability of thetechnique is limited by the half-life of the isotope and the cost of soilchemical analysis, preventing its use over large areas [Boardman, 2006].
Remote sensing allows the acquisition of continuous spatial informa-tion over larger areas [Alatorre and Begueria, 2009, Jetten et al., 2003,Vrieling, 2006], which, combined with the information about soil chemi-cal composition, provided by the shortwave infrared wavelengths in theelectromagnetic spectrum, could allow extensive soil particle tracing. Aspresented in Chapter 3, the spectrally active element Potassium (K) canbe used as a proxy to 137Cs in soil particle tracing [Luleva et al., 2011]. Aspectral absorption feature near 2465 nm is indicative for the abundanceof K in soils, and absorption band depth is linearly related to concentration[Luleva et al., 2011]. Potassium (K) can be introduced as a fertilizer in theform of Potassium Oxide (K2O ) and Potassium-Phosphorus-Nitrogen (KPN).The recommended amount of fertilizer for EU countries is 0.6–2 mg/g ofsoil, although quantities may be higher. When applied as a fertilizer, themajority of available K ions adsorb onto the surface of soil particles in thefirst 30 seconds to 2 minutes after application When soils are not plowed,
66

5.2. Methodology
1.003 mg of K per gram of soil is adsorbed, while if disturbed, this amountreduces depending on quantity of removed organic matter in soil [Wangand Huang, 2001]. The mobility of K is determined by various factors, themost important of which include physical and chemical properties such assoil texture [Luleva et al., 2011], organic matter [Askegaard and Eriksen,2000], cation exchange capacity and presence of Calcium, Sodium andGypsum [Jalali, 2007, Jalali and Rowell, 2009].
The aim of this chapter is to examine the possibility to use Potassium(K), in the form of an agricultural fertilizer, as a soil particle tracer infield conditions. Moreover, the chapter aims to outline key limitations andprovide suggestions for improving the used methodology.
5.2 Methodology
5.2.1 Study site
The study site is located in the Guadalentin basin, within the province ofMurcia, Southeast Spain. This is an area severely affected by soil erosion(Figure 5.1). Rills and gullies are the most common soil erosion feature,caused by tillage, fallow land and land abandonment. Rain storms are ofhigh intensity, while rock types are susceptible to erosion.
Guadalentin basin lies on the eastern edge of the Betic ranges facingsouthwest-northeast direction and faults determine the main structure ofthe drainage network. The basin covers an area of 3300 km2. Soils areshallow with high Calcium Carbonate content exceeding 50 % for someareas. Texture depends mainly on the hillslope position. Stoniness ishigh, low organic matter and moisture content. Salinity and crustingare problematic for some parts of the Guadalentin Basin, where soilsare neutral to slightly alkaline. According to FAO [2006] the main soiltypes, recognized in the region of Murcia are Calcisols, Luvisols, Regosolsand Fluvisols. The area has a typical semi-arid climate Mediterranean.Annual precipitation ranges from 300 mm to 500 mm with average annualtemperature between 12 and 18◦ C [Alterra, 2007].
67

5. Tracing Potassium in a silty loam soil with field spectroscopy
Figure 5.1: Advanced soil erosion in the Region of Murcia, South East Spain
5.2.2 Experimental setup and data collection
In this chapter, the field-based experiment was based on two experimentalplots placed in bare agricultural field with silty loam Calcisols with rangingclay content between 30 and 36%. One of the plots (Plot A) was sprayedwith K–P–N fertilizer (24%, 12%, 16%), diluted with 20% water by volume(1:1.5 ratio) recommended by the manufacturer to avoid crystalization,while the second plot (Plot B) was used as a reference with no addedfertilizer.
The plots were 2.5 m in length and 0.6 m in width, following the set upin Morgan (2005).
Each plot was evened out and cleared from larger soil aggregates orloose vegetation residuals to achieve optimal flow conditions. The degreeof slope of the plots was 12 %. Controlled water flow was generated totrigger particle movement. A water tank with volume of 10 l with dispenserwas used to generate water flow for a total of 15 min per plot.
Infrared spectral measurements were acquired with an Analytical Spec-tral Devices (ASD) Fieldspec Pro instrument with a 450–2500 nm wave-
68

5.2. Methodology
length range coverage at a 3–10 nm spectral resolution, following a gridsampling strategy. The fore-optic was a high-intensity contact probe withinternal light source and a spot size of 10 mm in diameter. The measure-ments were collected in three stages: prior to application of fertilizer todetermine background values of K, after application of fertilizer to esta-blish the distribution of fertilizer, and after water flow to observe particledisplacement. Data were obtained in a grid with 10 measurements acrossflow direction and 11 measurements along flow direction, to a total of 110measurements per plot per stage. The same locations were measured ateach stage of the experiment.
A spectral library was built from spectra collected during the expe-riment. These were mosaicked to produce artificial images, each repre-sentative for a plot in one of the three stages of the experiment. Eachpixel within an image contains the spectral information collected fromthe corresponding sampling point in a plot. A spectral subset of bandswas created for the 1800–2500 nm wavelength range to include the waterabsorption band around 1900 nm, the clay feature near 2200 nm and theK absorption feature near 2465 nm [Luleva et al., 2011]. A continuumremoval conversion was applied to all spectra to eliminate brightnessdifferences and thus enhance colour difference while standardizing theshape of absorption features [Noomen et al., 2006]. The absorption featureparameters- depth, position and area were computed for each pixel in IDLENVI software, following van der Meer [2004].
The images were spatially interpolated using ordinary kriging witha spherical semivariogram model in ArcGIS 10 software. Validation ofthe spectrally obtained images was done by comparison with laboratorydetermined K concentrations in the collected soil samples, as well asdigitized images of the flow patterns.
5.2.3 Sensitivity analysis on spectral data
The collected ASD infrared spectra were built into artificial images thatrepresent each of the three stages of the experiment. A pixel within animage contains the spectral information collected from the correspondingsampling point in a plot. A spectral subset of bands was created for the2000–2500 nm wavelength range to include the clay feature near 2200 nm
69

5. Tracing Potassium in a silty loam soil with field spectroscopy
and the K absorption feature near 2465 nm [Luleva et al., 2011]. A conti-nuum removal conversion was applied to all spectra to eliminate brightnessdifferences and thus enhance colour difference while standardizing theshape of absorption features [Noomen et al., 2006]. The absorption featureparameters- depth, position and area (described in Chapter 4) were com-puted for each pixel in IDL-ENVI software, following van der Meer [2004].Each image pixel was then assigned the corresponding absorption para-meter values for clay and K absorption feature. The images were spatiallyinterpolated using ordinary kriging with a spherical semivariogram modelin ArcGIS 10 software. The absorption depths for clay (near 2200 nm) andK (near 2465 nm) absorption bands were plotted to determine the relationand coefficient of determination between clay content and K content. Theprocedure was applied for both plots on values derived after each stage ofthe experiment.
5.3 Results and Discussion
5.3.1 Potassium Fertilizer Mobility
Although the plots were not fully covered by the flow, the sampling pointswere deliberately kept the same, in order to examine the whether change iscaused by the flow. This was mainly due to the fact that the soil was fullydried and large lumps were formed. This allowed the water to accumulatenear the water tank, before it could trigger a flow. It is possible, that thishas caused leaching down the soil profile, or further dilution of the appliedfertilizer. Therefore, it can only be assumed that fertilizer is removed withthe particles under the influence of the water flow. The runoff water wasnot collected, and therefore this could not be tested with the availabledataset.
Figures 5.2 and 5.3 show the change in absorption band depth for clayabsorption feature near 2200 nm and K absorption feature near 2460 nm.The pixels shown in white colour are these with deepest absorption, whilethe green indicate the shallowest.
Figure 5.4 shows scatter plots and coefficients of determination calcu-lated based on absorption band depth values for clay and K absorptionfeatures.
70

5.3. Results and Discussion
The plot received no fertilizer, however difference is still noted. Theflow in the top 1/3 has decreased the K absorption, while the flow lineto the right coincides with an increase in K. This might indicates that thehigher concentration of K has deposited.
Higher values of absorption depth represent higher concentrations. Therepresentation of the plots before addition of fertilizer or water flow, indi-cated on Figures 5.2 and 5.3, show that the K pattern follows clay contentas expected. The application of K solution results in a heterogeneousimage, where the center has much higher K values, while the upper rightwhere water pooled, due to difference in surface roughness caused by theflow.
The results clearly show that there is change after each stage of theexperiment, however the concentrations of applied fertilizer might be toolow to indicate whether particles have moved.
The images after water flow resemble the original situation, except forthe accumulation of water at the top right. There is little evidence of flow.The fact that in the areas of the image where no flow has taken place thevalues are back to near original, suggests that leaching of K away from thesurface has occurred.
Study site with soils with lower clay content than the one at the presentlocation should be selected in order to minimize the influence of clayabsorption on K feature. Furthermore, in order to attempt quantificationof fertilizer using infrared spectra, ranging concentration of fertilizershould be applied and threshold values and statistical relationships shouldbe established.
Delineation of the plots is recommended, so that the flow can remainwithin the area of interest. In case the soil is dry and prone to formationof lumps, the flow should have higher intensity and longer duration.
To estimate the deposition, all runoff water should be collected, andthe collected sediment should be analysed for its K content. Soil samplesshould also be collected from the plots after each stage of the experimentin order to validate the produced images.
71

5. Tracing Potassium in a silty loam soil with field spectroscopy
Plot A K Feature Clay Feature Flow Outline
Ref
eren
cePlo
tA
fter
Fert
iliz
erA
pp
lica
tion
Aft
erW
ater
Flow
Figure 5.2: Spatial representation of K absorption feature depth near 2465 nmand clay absorption feature depth near 2200 nm for plot A. This plot was treatedwith 2.4 mg/g of added fertilizer. Each image comprises 110 sampling pointscollected after each stage of the field experiment (before treatment, after additionof fertilizer, and after water flow)
72

5.3. Results and Discussion
Plot B K Feature Clay Feature Flow Outline
Ref
eren
cePlo
tA
fter
Wat
erFl
ow
Figure 5.3: Spatial representation of K absorption feature depth near 2465 nm andclay absorption feature depth near 2200 nm for plot B. This plot was not treatedwith fertilizer. Each image comprises 110 sampling points collected after eachstage of the field experiment (before treatment, after addition of fertilizer, andafter water flow)
73

5. Tracing Potassium in a silty loam soil with field spectroscopy
[a]
R² = 0.9142
0
160
0 200
Cla
y F
eatu
re
K Feature[b]
R² = 0.9185
0
160
0 200
Cla
y F
eatu
re
K Feature
[c]
R² = 0.9158
0
160
0 200
Cla
y F
eatu
re
K Feature[d]
R² = 0.9418
0
160
0 200
Cla
y F
eatu
re
K Feature
Figure 5.4: Relationships between band depth near 2465 nm (K feature) and banddepth near 2200 nm (Clay feature) expressed using coefficient of determination(R2) for experimental plot A [a,b] and plot B [c,d] for each stage of the experiment.
5.3.2 Change in absorption feature depth in relation to K
concentrations
Using contact probe mode of the ASD field spectrometer has limited theinfluence of external factors. This allowed the estimation of absorptionfeature parameters at wavelength near 2460 nm. As previously discussed inChapter 4, clay absorption near 2200 nm strongly influences the identifiedK absorption feature near 2460 nm. Therefore, both features had to beexamined and compared statistically in order to establish if the amount ofclay present in the soil is sufficient to affect the depth of absorption of theK feature.
On Figure 5.4 shows the relationship between depth of absorption near2200nm and 2460nm. The values for coefficient of determination thatwere calculated for all plots indicate R2 of 0.9 and above between the two
74

5.4. Conclusions
variables. This can also be observed from the images shown on Figures 5.2and 5.3, where the change in absorption band depth are illustrated.
5.4 Conclusions
The research hypothesis states that flowing water moves surface soilparticles with adsorbed K and can be traced by observing the change inabsorption feature characteristics. The experiment was conducted ontwo plots- one was fertilized with a commercial Potassium fertilizer, byapplying recommended by the manufacturer concentrations. The secondplot was used as a reference in order to determine any natural changein surface composition under the influence of water flow. Soil spectralmeasurements were collected using ASD Fieldspec Pro Spectrometer, ina contact probe mode, prior application of fertilizer, after application offertilizer and after water flow.
Change in depth of absorption near 2460nm was observed. However,from the experiment, it is not clear whether the movement of K is dueto runoff or infiltration. More detailed analysis of clay movement andmoisture patterns could aid the interpretation of the sampling plots.
75


6Tracing Potassium in a Loess soil
with field spectroscopy
Abstract
In Chapter 5, a number of limitations of the field based experimentfor tracing soil particle movement using Potassium fertilizer and in-frared spectral measurements were outlined. The most important ofthese were the presence of high clay content, the insufficient runoffdata, as well as the low variation in applied fertilizer concentrations.These prevented the drawing of optimal conclusions, however it re-sulted outlining of key recommendations for improvement of theexperiment. A field-based water flow experiment, conducted on 6plots on silt loam Loess soils in the Netherlands, is presented in thischapter. The field area was selected due to the fact that the soils aredeveloped on Loess, and are characterized with limited clay content.The plots were treated with various concentrations of K2O and oneplot was used as reference. Infrared reflectance spectra were collectedto observe spatial variation in available K, before and after applicationof fertilizer, and after runoff simulation by water flow. The runoffsediment was also collected in order to establish potential removal offertilizer under the influence of the water flow. 1
1This chapter is based on: Luleva, M, van der Werff, H, van der Meer, F., Jetten, V. (2013),Observing change in potassium abundance in a soil erosion experiment with field infraredspectroscopy, Chemistry, 22, pp 91–109, Luleva et al. [2013]
77

6. Tracing Potassium in a Loess soil with field spectroscopy
6.1 Introduction
Soil erosion and sedimentation have been studied extensively in the lastdecades [Boardman, 2006]. An approach to predict soil erosion is to usechemical tracers [Onda et al., 2007] as a proxy for tracking of erodingsoil particles [Zhang et al., 2006]. Soil particles are moved by wind, wateror gravity [Moran et al., 2002]. Soil particle tracing is an approach tomeasure net soil flux in arid and semi-arid environments and to detectearly signs of hazard [Chappell, 1999]. The Cesium 137 isotope (137Cs ) isconsidered to be the primary chemical tracer for detection of soil particlemovement. This element has been used in a number of soil erosion studiesfor over 40 years. Most recent publications cover the use of 137Cs eitherfor comparison between various methods [Sac et al., 2008, Xiaojun et al.,2010], or as a validation technique of historical records [deGraffenried Jrand Shepherd, 2009, Estrany et al., 2010, Meusburger et al., 2010, Rodway-Dyer and Walling, 2010]. Cesium- 137 was introduced to the environmentbetween the 1950s and 1970s through nuclear fallout of atomic bombtests, and in 1986 through the Chernobyl power plant accident. Once fallenonto the Earth surface, 137Cs attaches to soil particles. Its redistributionis mainly controlled by erosion, transport and deposition of sediments[Porto et al., 2001]. The use of 137Cs for soil particle tracking has someassumptions [Parsons and Foster, 2011]: The distribution of 137Cs fallout is homogeneous (while being limited to the Northern hemisphere),and particles would only move by the influence of soil erosion [Campbellet al., 1982, Chappell, 1999, Walling and Quine, 1990]. Furthermore, theuse is limited by the half-life of the isotope and the cost of soil chemicalanalysis, preventing its use over large areas [Boardman, 2006]. Thereis hence a demand for a substitute of 137Cs by a chemical element thathas similar physical and chemical behaviour, can be distributed evenly inthe environment and can be measured with already established analyticaltechniques.
Remote sensing allows the acquisition of continuous spatial informationover larger areas [Alatorre and Begueria, 2009, Jetten et al., 2003, Vrieling,2006]. Recently, we suggested in Luleva et al. [2011] that the spectrallyactive element Potassium (K) can be used as a proxy to 137Cs in soil particletracing. Potassium has similar electrical, chemical and physical properties
78

6.1. Introduction
to Cs [Andrello and Appoloni, 2004, Relman, 1956], and both elementsshow similar chemical behaviour in the environment [Relman, 1956]. Aspectral absorption feature near 2465 nm is indicative for the abundanceof K in soils, and absorption band depth is linearly related to concentration[Luleva et al., 2011].
Potassium (K) is found in soils in three forms: readily available to plantsin a water soluble form, slowly available when released from clay mine-rals, and unavailable as part of the crystalline structure of soil minerals.Potassium (K) can be introduced as a fertilizer in the form of PotassiumOxide (K2O ). The recommended amount of fertilizer for EU countries is0.6–2.0 mg/g of soil, although quantities may be higher. When appliedas a fertilizer, the majority of available K ions adsorb onto the surface ofsoil particles in the first 30 seconds to 2 minutes after application Whensoils are not plowed, 1.003 mg of K per gram of soil is adsorbed, while ifdisturbed, this amount reduces depending on quantity of removed organicmatter in soil [Wang and Huang, 2001]. The mobility of K is determinedby various factors, the most important of which include physical and che-mical properties such as soil texture [Luleva et al., 2011], organic matter[Askegaard and Eriksen, 2000], cation exchange capacity and presence ofCalcium, Sodium and Gypsum [Jalali, 2007, Jalali and Rowell, 2009].
The aim of the study presented in this chapter is to determine whetherchange in K concentration, when applied in the form of commerciallyavailable K fertilizer in concentrations commonly applied in agriculture,can be observed using field infrared spectroscopy on Loess soils withlimited clay content.
We will examine this by answering three questions:
• Can a relative change in abundance of K in the field be observed withspectroscopy using the absorption feature near 2465 nm?
• Does a change in absorption depth of the 2465nm absorption featurecorrespond with the controlled addition and removal of K?
• Does the amount of K removed by water flow correspond to theconcentration of K found in runoff water?
79

6. Tracing Potassium in a Loess soil with field spectroscopy
6.2 Methodology
6.2.1 Site Description
The experiment was done in an agricultural field in South Limburg region,The Netherlands. This region is part of the European Loess belt whichcovers parts of England, Northwest France, Belgium, The Netherlands,Germany, Poland and Russia [Kwaad et al., 2006]. Typical landformsinclude dry valleys, incised roads and manmade cultivation terraces. Thesoils belong to Typic Hapludalf soil type (Soil Taxonomy) or Albic Luvisol[FAO, 2006] and were developed on the Loess during the Holocene period.These soils are highly vulnerable to soil erosion and runoff due to their lowstructural stability. Top soils contain up to 60 % silt, while sub soils arestony and dry due to underlying gravel of palaeo river terraces depositedby the river Meuse. The slope varies from 2 to 12 % [de Bakker, 1979].The annual precipitation is distributed throughout the whole year withhigh-intensity rainfall restricted between April and October. The averagerainfall is 60mm per month, with maximum reaching 1–2 mm/min [Kwaadet al., 2006]. Erosion is enhanced by a continuous change in land coverand decrease of grassland in favour of arable land [Boardman et al., 1994].The area is mainly used for crop production, therefore the soil is bare forthe period outside the growing season [Winteraeken and Spaan, 2010].
6.2.2 Field Experiment Design
A standard practice in soil erosion studies is the use of experimentalplots [Morgan, 2005]. In this chapter, the field-based experiment wasbased on six experimental plots. Each plot was sprayed with a differentconcentration of K fertilizer. Controlled water flow was generated to triggersoil erosion and runoff. The six plots were 2.5 m in length and 0.6m inwidth, following Morgan [2005]. Each plot was evened out and clearedfrom larger soil aggregates or loose vegetation residuals to achieve optimalflow conditions. Plot edges were raised 5–10 cm above the soil surfaceto contain the runoff. The degree of slope naturally varied from 9.0 % to9.6 %. 30 l water tanks with dispenser were used to generate water flowand doormats to distribute the flow evenly. Galvanized steel sheets placed
80

6.2. Methodology
[a] [b]
1
4
51. Water Tank2. Water Dispenser3. Flow Distribution Mat4. Experimental Plot5. Galvanized Steel Sheet6. Water Collecting Tank
2
3
6
Figure 6.1: Experimental plot set up and components. a) photo of the setup in thefield, b) a schematic diagram of the setup.
at the bottom of each plot (20 cm below the surface) were used to collectrunoff into collector tanks (Figure 6.1).
400 ml of commercially available K fertilizer (K2O ) solution was sprayedonto each plot (except the reference plot C) with a plant sprayer, applyinga fixed volume as evenly on the plot as possible. The concentrations ofapplied fertilizer were 0.6 mg/g (plot A and plot F), 2.48 mg/g concentra-tion (plot B), one with 1.18 mg/g (Plot D) and 1.76 mg/g (Plot E). Plot Cwas used as a reference to observe the behaviour of naturally occurring Kunder the influence of flowing water. The duration of the flow was 14–20min., depending on the path of the flow. 10 l of runoff water and erodedsoil were collected at the bottom of the plot during the flow simulation,which corresponds with a rainfall event of 90 mm per hour.
6.2.3 Field Data Collection
Before and after the flow experiment, Loess soil samples for validationwere collected from the surface (0–2 cm) and at 15 cm depth of each plot,following a grid-point sampling strategy [Hengl et al., 2003]. Initial mois-ture content was measured in the field using an IRROMETER Watermarksoil moisture meter. Water samples were collected per litre of runoff water,up to a maximum of 10 samples or until runoff had stopped. Mixed water
81

6. Tracing Potassium in a Loess soil with field spectroscopy
samples were collected from the runoff tank, taken from the surface, 10 cmand 20 cm depth.
Infrared spectral measurements were acquired with an Analytical Spec-tral Devices (ASD) Fieldspec Pro instrument with a 450–2500 nm wave-length range coverage at a 3–10 nm spectral resolution. The fore-optic wasa high-intensity contact probe with internal light source and a spot sizeof 10 mm in diameter. The measurements were collected in three stages:prior to application of fertilizer to determine background values of K, afterapplication of fertilizer to establish the distribution of fertilizer, and afterwater flow to observe particle displacement. Data were obtained in a gridwith 6 measurements across flow direction and 18 measurements alongflow direction, up to a total of 108 measurements per plot per stage. Thesame locations were measured at each stage of the experiment.
6.2.4 Geochemical analysis
The soil samples were dried overnight at 30◦ Celsius and sieved througha 2 mm sieve to remove large particles. Water samples were filteredusing laboratory membrane filters and the residual sediments were airdried overnight. All samples were analysed for total K content followingstandard laboratory procedures [Van Reeuwijk, 2002] with InductivelyCoupled Plasma-Optical Emission Spectroscopy (ICP-OES) with a detectionlimit of 0.01 mg/ml. Texture and bulk density analyses were performed todetermine the sand-silt-clay fractions.
The relationship between water contents and spectral absorption of Kwas analysed in a laboratory. A soil sample was passed through a 2 mmsieve and evenly distributed in three sample dishes, each dish containingapproximately 50 grams of dry material. Three different concentrationsof K fertilizer were added. The first set as a reference with addition of10 ml of demineralized water and 0 mg/g of K, the remaining two withaddition of 1.20 mg K/ g of soil and 2.48 mg K/g of soil in 10 ml solutionrespectively.
Spectral absorption was measured under laboratory conditions usingthe same instrument specifications and settings as during the field expe-riment (section 6.2.2).
Collection of spectra was done for 6 contiguous hours over 2 days,
82

6.2. Methodology
adding up to a total of 117 measurements. Each sample was weighedbefore spectra were collected in order to measure the amount of moisturethat had evaporated. The experiment was terminated when the initialmoisture content of the samples was reached.
6.2.5 Spectral analysis
All ASD infrared spectra were mosaicked to produce artificial images, eachrepresentative for a plot in one of the three stages of the experiment. Eachpixel within an image contains the spectral information collected fromthe corresponding sampling point in a plot. A spectral subset of bandswas created for the 1800–2500 nm wavelength range to include the waterabsorption band around 1900 nm, the clay feature near 2200 nm and theK absorption feature near 2465 nm [Luleva et al., 2011]. A continuumremoval conversion was applied to all spectra to eliminate brightnessdifferences and thus enhance colour difference while standardizing theshape of absorption features [Noomen et al., 2006]. The absorption featureparameters- depth, position and area were computed for each pixel in IDLENVI software, following van der Meer [2004].
The values of absorption band depth were mosaicked into artificialimages, following the sampling pattern in IDL ENVI software. Each imagepixel was then assigned the corresponding absorption parameter valuesfor the water, clay and K absorption feature. The images were spatiallyinterpolated using ordinary kriging with a spherical semivariogram modelin ArcGIS 10 software. Validation of the spectrally obtained images wasdone by comparison with laboratory determined K concentrations in thecollected water and soil samples, as well as digitized images of the flowpatterns.
A spectral library was built from spectra collected during the control-led moisture experiment. Absorption band depth was calculated in IDLENVI software [ITT Visual Information Solutions, 2009] following van derMeer [2004]. The absorption depths of the water (near 1900 nm), clay(near 2200 nm) and K (near 2465 nm) absorption bands were plotted todetermine the relation and coefficient of determination between moisturecontent, clay content and K content. The Normalized Soil Moisture Index(NSMI) was calculated in order to minimize the influence of varying soil
83

6. Tracing Potassium in a Loess soil with field spectroscopy
texture and albedo [Haubrock et al., 2008]. The index was chosen becauseit has linear correlation with soil moisture but is not influenced by surfacecrusting or substrate heterogeneity. It is calculated by combining reflec-tance values at 1800 and 2119 nm [Haubrock et al., 2008]. The resultingvalues are in spectral reflectance units. The same procedure was appliedto the images corresponding to each experimental field plot.
6.3 Results
K adsorbs onto the surface of soil particles at the latest 10 minutes afterapplication of fertilizer [Wang and Huang, 2001]. Once attached, K remainsimmobile [Garrett, 1996] unless displaced by water or taken up by plants[Jalali and Rowell, 2009]. Soil particles are considered displaced if mea-sured K concentrations are lower than what has been applied in the formof a fertilizer, or are similar to the concentration prior to application offertilizer.
Moisture influences the results, so it is hard to distinguish the effectof K alone because of moisture changes during and after application. Inaddition, K is absorbed by the clay particles,which could influence theresults, together with the exchange between absorbed K and K in solution.
In the context of soil erosion, clay particles move and create a movementof free K, absorbed K and clay. Furthermore the top few centimeters of thesoil dry out and reach an equilibrium value, such as field capacity, whichdepends partly on the amount of clay and partly on the soil structure. Thedrying out affects the depth of absorption features and the rate with whichclay and K can be detected.
These processes are illustrated on figures 6.5 and 6.6. Figures 6.7– 6.12show whether K movement can be isolated and distinguished.
6.3.1 Laboratory analysis
Table 6.1 shows the characteristics of the soil found in each plot. Theseconsist of the amount of fertilizer applied, initial soil moisture tempera-ture values, water fraction per volume (WFV), total salt content, texturecharacteristics and bulk density per plot. The table shows that, in all plots,the K concentration at 15 cm depth is lower than at the surface. Bulk
84

6.3. Results
0
0.5
1
1.5
2
2.5
3
3.5
4
1 2 3 4 5 6 7
K c
once
ntra
tion
in se
dim
ent (
mg/
g)
Litres of discharge
K in sediment (Plot A) K in sediment (Plot B) K in sediment (Plot C)
1 2 3Mix 1 Mix 2 Mix 3
Figure 6.2: Bar chart showing a decrease in K concentration measured in sedimentper litre of discharge (1 to 7) for plots A, B and C. The values under Mix 1, 2and 3 are derived from analysis of water samples at three depths from the totalcollected runoff.
density varies with 0.03 g/cm3 between the plots. Texture characteristicsindicate that these soils have typical characteristics of silt loam derivedfrom Loess with silt content 53–58 % and maximum clay content of 18%(see table 6.1).
Figure 6.2 shows the change in K concentration per litre of discharge du-ring the flow experiment. The concentration of K in the collected sedimentcollected decreases indicating removal of fertilizer.
Figure 6.3 shows the area of each plot covered by water flow after theexperiment was completed. It can be noted that parts of plots A, B and Ewere not affected by runoff water.
6.3.2 Spectral analysis
Figure 6.4 shows the change in K absorption feature depth (near 2465 nm)for each plot at each stage of the experiment. It can be observed thatfor most pixels, depth of absorption features increases with addition offertilizer. After water flow, K absorption continues to increase for all plots.
85

6. Tracing Potassium in a Loess soil with field spectroscopy
Table 6.1: Field conditions in the experimental plots, obtained by geochemicalanalysis of soil samples from each plot.
Plot Reference K, depth cm AddedK2O
Moisture Characteristics Texture % BulkDen-sity
0-2cm(mg/g)
5-20cm(mg/g)
0-2cm(mg/g)
Temp.(C)
WFV TotalSalt(s/m)
Sand Silt Clay g/cm3
A 2.61 0.72 0.6 14.9 0.34 0.29 31 56 13 1.32B 2.93 0.87 2.48 15.1 0.34 0.35 30 58 12 1.29C 2.60 0.57 0 15.7 0.34 0.28 29 53 18 1.32D 4.23 0.72 1.18 17.4 0.35 0.29 32 53 18 1.35E 3.21 0.67 1.76 17.6 0.32 0.27 30 52 18 1.36F 2.74 0.63 0.6 17.5 0.34 0.28 29 53 18 1.32
d) f)e)
b) c)a)
Figure 6.3: Schematic outline of each plot with the area inside the white polygonthat was covered by flowing water. The area outside the polygon remained dry.
86

6.3. Results
0
10
Reference After Fertilizer After Water Flow
Ab
sorp
tio
n D
ep
th (%
)
Plot A
0
10
Reference After Fertilizer After Water FlowA
bso
rpti
on
D
ep
th
(%)
Plot B
0
10
Reference After Water Flow
Ab
sorp
tio
n D
ep
th (
%)
Plot C
0
10
Reference After Fertilizer After Water Flow
Ab
sorp
tio
n D
ep
th (%
)
Plot D
0
10
Reference After Fertilizer After Water Flow
Ab
sorp
tio
n
Dep
th
(%)
Plot E
0
10
Reference After Fertilizer After Water FlowA
bso
rpti
on
D
ep
th (
%)
Plot F
Figure 6.4: Change in K absorption feature depth, for each plot for each stage ofthe experiment.
Figure 6.5 and figure 6.6 show relationships between the NSMI index(soil moisture), clay absorption bands at 2200 nm and K absorption bandsat 2465 nm. For all plots, after application of fertilizer, the values for R2
indicate that the influence of moisture on K absorption is higher than it isof clay. After water flow, however, R2 values between clay and moisture,as well as clay and K feature increase.
Figures 6.7– 6.12 show the results of absorption feature analysis. Thenatural variation in K can be observed from Figures 6.7– 6.12(top rows)for each plot. The range of K absorption band depth is 1.3–8.3 % for plot A,1.3–8.5 % for plot B, and 3.2–4.5 % for plot C. In all images, NSMI is highestafter water flow. The images showing clay absorption band depth show adecreased absorption after water flow (figures 6.7– 6.12, right column).
87

6. Tracing Potassium in a Loess soil with field spectroscopy
Plo
tA A
fter
Fert
iliz
er
�
R² = 0.5625
0
60
0 5 10 15 20
K fe
atur
e
Moisture �
R² = 0.0136
0
16
0 20 40 60
K fe
atur
e
Clay feature�
R² = 0.021
0
16
0 5 10 15 20
Cla
y fe
atur
e
Moisture
Aft
erFl
ow
�
R² = 0.477
0
90
0 10 20 30 40
K fe
atur
e
Moisture
R² = 0.23450
90
0 5 10 15
K fe
atur
e
Clay depth
R² = 0.5332
0
16
0 10 20 30 40
Cla
y fe
atur
e
Moisture
Plo
tB Aft
erFe
rtil
izer
�
R² = 8E-080
100
0 5 10 15
K fe
atur
e
Moisture �
R² = 0.17980
100
0 5 10 15
K fe
atur
e
Clay feature �
R² = 0.0012
0
16
0 5 10 15
Cla
y fe
atur
e
Moisture
Aft
erFl
ow
�
R² = 0.5577
0
90
0 10 20 30 40
K fe
atur
e
Moisture �
R² = 0.21370
90
0 5 10 15
K fe
atur
e
Clay feature�
R² = 0.490
16
0 10 20 30 40
Cla
y fe
atur
e
Moisture
Plo
tC
Ref
eren
ce
�
R² = 0.2601
0
45
0 5 10 15
K fe
atur
e
Moisture �
R² = 0.0074
0
45
0 5 10 15
K fe
atur
e
Clay feature �
R² = 0.0022
0
12
0 5 10 15
Cla
y fe
atur
e
Moisture
Aft
erFl
ow
�
R² = 0.1687
0
80
0 10 20 30
K fe
atur
e
Moisture
R² = 0.0465
0
80
0 5 10 15
K fe
atur
e
Clay feature �
R² = 0.2265
0
12
0 10 20 30
Cla
y fe
atur
e
Moisture
Figure 6.5: Relationships between band depth near 2465 nm (K feature), banddepth near 2200nm (Clay feature) and NSMI values (Soil moisture) expressed usingcoefficient of determination (R2) for experimental plots A, B and C.
88

6.3. ResultsPlo
tD A
fter
Fert
iliz
er
R² = 0.2073
0
60
0 10 20 30 40 50
Kfe
atur
e
Moisture
R² = 0.0072
0
60
0 5 10 15
K fe
atur
e
Clay feature
R² = 0.0943
0
14
0 10 20 30 40 50
Clay
feat
ure
Moisture
Aft
erFl
ow
R² = 0.2264
0
80
0 5 10 15 20 25
K fe
atur
e
Moisture
R² = 0.0034
0
80
0 5 10 15
K fe
atur
e
Clay feature
R² = 0.1048
0
14
0 5 10 15 20 25
Clay
feat
ure
Moisture
Plo
tE Aft
erFe
rtil
izer
R² = 0.1641
0
45
0 5 10 15 20
K fe
atur
e
Moisture
R² = 0.0005
0
45
0 5 10 15
K fe
atur
e
Clay feature
R² = 0.0644
0
14
0 5 10 15 20
Clay
feat
ure
Moisture
Aft
erFl
ow
R² = 0.5726
0
70
0 5 10 15 20 25
K fe
atur
e
Moisture
R² = 0.1339
0
70
0 5 10 15
K fe
atur
e
Clay feature
R² = 0.2412
0
12
0 5 10 15 20 25
Clay
feat
ure
Moisture
Plo
tF Aft
erFe
rtil
izer
R² = 0.1877
0
70
0 10 20 30
K fea
ture
Moisture
R² = 0.0264
0
70
0 5 10 15
K fe
atur
e
Clay feature
R² = 0.3261
0
12
0 10 20 30
Clay
feat
ure
Moisture
Aft
erFl
ow
R² = 0.2975
0
70
0 10 20 30
K fe
atur
e
Moisture
R² = 0.0506
0
70
0 3 6 9 12
K fe
atur
e
Clay feature
R² = 0.3776
0
12
0 5 10 15 20 25
Clay
feat
ure
Moisture
Figure 6.6: Relationships between band depth near 2465 nm (K feature), banddepth near 2200 nm (Clay feature) and NSMI values (Soil moisture) expressedusing coefficient of determination (R2) for experimental plots D, E and F.
89

6. Tracing Potassium in a Loess soil with field spectroscopy
Plot A K Feature NSMI Clay Feature Flow OutlineR
efer
ence
Plo
tA
fter
Fert
iliz
erA
pp
lica
tion
Aft
erW
ater
Flow
Figure 6.7: Spatial representation of K absorption feature depth near 2465 nm,Normalised Soil Moisture Index (NSMI) and clay absorption feature depth near2200 nm for plot A. This plot was treated with 0.6 mg/g of fertilizer. Each imagecomprises 108 sampling points collected after each stage of the field experiment(before treatment, after addition of fertilizer, and after water flow).
90

6.3. Results
Plot B K Feature NSMI Clay Feature Flow Outline
Ref
eren
cePlo
tA
fter
Fert
iliz
erA
pp
lica
tion
Aft
erW
ater
Flow
Figure 6.8: Spatial representation of K absorption feature depth near 2465 nm,Normalised Soil Moisture Index (NSMI) and clay absorption feature depth near2200 nm for plot B. This plot was treated with 2.4 mg/g of added fertilizer.Each image comprises 108 sampling points collected after each stage of the fieldexperiment (before treatment, after addition of fertilizer, and after water flow)
91

6. Tracing Potassium in a Loess soil with field spectroscopy
Plot C K Feature NSMI Clay Feature Flow Outline
Ref
eren
cePlo
tA
fter
Wat
erFl
ow
Figure 6.9: Spatial representation of K absorption feature depth near 2465 nm,Normalised Soil Moisture Index (NSMI) and clay absorption feature depth near2200 nm for plot C. This plot had no added fertilizer. Each image comprises 108sampling points collected from the untreated plot and after water flow.
92

6.3. Results
Plot D K Feature NSMI Clay Feature Flow Outline
Ref
eren
cePlo
tA
fter
Fert
iliz
erA
pp
lica
tion
Aft
erW
ater
Flow
Figure 6.10: Spatial representation of K absorption feature depth near 2465 nm,Normalised Soil Moisture Index (NSMI) and clay absorption feature depth near2200 nm for plot D. This plot was treated with 1.18 mg/g of added fertilizer.Each image comprises 108 sampling points collected after each stage of the fieldexperiment (before treatment, after addition of fertilizer, and after water flow) 93

6. Tracing Potassium in a Loess soil with field spectroscopy
Plot E K Feature NSMI Clay Feature Flow OutlineR
efer
ence
Plo
tA
fter
Fert
iliz
erA
pp
lica
tion
Aft
erW
ater
Flow
Figure 6.11: Spatial representation of K absorption feature depth near 2465 nm,Normalised Soil Moisture Index (NSMI) and clay absorption feature depth near2200 nm for plot E. This plot was treated with 1.76 mg/g of added fertilizer.Each image comprises 108 sampling points collected after each stage of the fieldexperiment (before treatment, after addition of fertilizer, and after water flow)
94

6.3. Results
Plot F K Feature NSMI Clay Feature Flow Outline
Ref
eren
cePlo
tA
fter
Fert
iliz
erA
pp
lica
tion
Aft
erW
ater
Flow
Figure 6.12: Spatial representation of K absorption feature depth near 2465 nm,Normalised Soil Moisture Index (NSMI) and clay absorption feature depth near2200 nm for plot F. This plot was treated with 0.6 mg/g of added fertilizer.Each image comprises 108 sampling points collected after each stage of the fieldexperiment (before treatment, after addition of fertilizer, and after water flow)
95

6. Tracing Potassium in a Loess soil with field spectroscopy
6.4 Discussion
6.4.1 Potassium Fertilizer Mobility
The K concentration in the mixed runoff sediment samples was 1.2 mg/g,which is 0.6 mg/g higher than the amount of K that was added with thefertilizer (0.6 and 2.4 mg/g for plot A and plot B respectively). This mightbe due to the release of slowly available K under the influence of waterflow. Alternatively, it may so result from K fertilizer that had been appliedby farmers before the experiment, as the experiment took place in anagricultural field. Unknown concentrations of K in the water that wasused for the experiment could also add to these amounts. Soil textureis not considered to have an influence, since the texture analysis of thesoil material indicates a comparable sand-silt-clay content of all plots(table 6.1).
6.4.2 Change in absorption feature depth in relation to K
concentrations
For all plots, figures 6.5 and 6.6 show that after applying fertilizer, theincrease in K is associated with increase in moisture, indicating that moreK was added. In addition, there is no relation between K and clay, which isexpected due to the fact that K was added to the plots and the concentra-tions became higher than the natural K that is already attached to the clay.The lack of relationship between moisture and clay can be explained bythe soil saturation, which is irrespective of clay content.
After the flow, the relation between K and moisture is generally decrea-sing. K and clay relation increases, because clay starts absorbing K, somore clay means less free K. The moisture is removed from the top soilso the clay content causes the moisture to be retained and shows a highrelation again.
Figures 6.7–6.12 show the change in surface soil moisture, K absorptionband depth and clay absorption band depth for all plots and all stages ofthe experiment. With the addition of K, a change in depth of the featurenear 2465 nm is observed. Although the fertilizer was applied as evenlyas possible to the surface of all plots, a uniform distribution cannot beobserved. This is likely to be a result of natural variation in the initial K
96

6.4. Discussion
concentration, application of fertilizer by farmers prior to the experiment,or due to the difference in surface roughness.
On Figure 6.7 the reference images clearly indicate that K in concentra-tions of 0.6 mg/g cannot be used to explain soil erosion. K has low values,absorption feature depth increases as fertilizer solution is added and stayshigher as additional water is added with the flow. The high moisture valuesindicate that the plot has not dried out completely. A general decreasein clay can be due to erosion and movement of particles. However sincethe central plot shows a higher content of clay, there is interference frommoisture and K.
Figure 6.8 shows the images from the plot with 2.4 mg/g of addedfertilizer. Although the added concentrations are much higher, the resultsdo not indicate runoff. The wetter plots after the experiment show thatthe plots have not dried out completely. The decrease in clay could againbe associated with movement of particles due to erosion.
Figure 6.9 shows the results from the reference plot with no addedfertilizer. All measurements were collected from points on the plot coveredby the flow. The variability suggests movement of K downslope after theflow experiment. Clay content shows a similar pattern to K, and thereforethere is an indication that clay has moved downslope. This suggests that Kmovement is caused by the movement of clay particles with the flow.
Figure 6.10 illustrates the plot with added 1.18 mg/g of fertilizer.The image in the middle shows that moisture was evenly distributedafter applying the fertilizer solution. The added K has moved down andspread over showing a clear movement of K. Moisture has influenced clayabsorption, and therefore movement cannot be established.
Figure 6.11 shows the results from the plot with added 1.76 mg/g ofK fertilizer. After the flow, loss of K can be observed in some parts ofthe image. The moisture values indicate that the plot has not dried outcompletely. The clay images show small movement of clay away form theplot at the lower and upper middle portions.
Figure 6.12 illustrates the results from the experiment with 0.6 g/mg ofadded fertilizer. The low K concentrations show a little bit of movementfrom the applied K in the center to the bottom of the plot. Moisture imagesuggests moisture is relatively homogeneous and so not of great influence.Clay does not seem to show changes.
97

6. Tracing Potassium in a Loess soil with field spectroscopy
In general, after water flow, the K absorption feature appears deeper.From Figure 6.3 that shows flow coverage, and Figures 6.7–6.12 showingchange in absorption depth, it can be observed that the patches that werenot covered by the water flow have the shallowest spectral absorptionfeatures. Variations within the plots can also be due to larger particlesthat travel shorter distances and might be deposited early [Morgan, 2005],before reaching the end of the plot.
The spatial representation of soil moisture and clay content, as pre-sented by NSMI and clay absorption band depth, show their influence onspectroscopic detection of K in soils.
In all images, NSMI increased after each stage of the experiment (Fi-gures 6.7–6.12). The depth of clay absorption feature decreased afterwater flow, which can be explained by the removal of fine clay particles byflowing water.
Based on the work of Luleva et al. [2011] and Yitagesu et al. [2009], itwas expected that clay content would influence the depth of absorptionnear 2465 nm. The experimental field was hence selected in the Loessderived soils, which only have a maximum of 18 % clay [Jacobs and Mason,2007]. However, as stated by Jacobs and Mason [2007], clay content inLoess soils can be higher if post sedimentation has taken place. Theconcentration of K applied to the plots was insufficient to show a spectralsignature given the high amounts of water and clay are present. Additionaltests are required in order to establish whether decrease in clay absorptioncan be used to indicate removal of particles due to erosion.
A direct relationship between the K absorption band depth near 2465 nmand its distribution in the field could not be established. This would pro-bably be possible if higher amounts of fertilizer would have been added(as done in Luleva et al. [2011]). These amounts however exceed what isrecommended for agricultural practices. Exploring absorption featuresassociated with K in the thermal (mid) infrared could minimize the in-fluence of moisture and clay. Imaging spectrometers that acquire spatialdata simultaneously could limit the noise that was now introduced whilemeasuring individual points.
98

6.5. Conclusions
6.4.3 Potential use of Potassium as a tracer for soil erosion
In all soil erosion studies using chemical particle tracers, the even distri-bution of the chemical has been assumed [Chappell, 1999]. The naturalvariation of the element due to parent material or crop residue, as well aspreviously applied fertilizer, presents a limitation. This could however beovercome by collecting and analysing soil spectra prior to fertilization.
Knowing the concentration of K prior to fertilizer application is crucialfor using the element as a tracer. Compared to 137Cs , however, Potassium(K) is spectrally active, and the absorption feature near 2465 nm allowsrapid detection of its abundance in the environment prior to additionalapplication of the element. Furthermore, this provides an opportunity tocollect measurements before each stage of the field experiment. This helpsdetermining the natural distribution of the element or previously appliedquantities of fertilizer, as well as testing the method and distribution ofadded K before the flow experiment.
A factor that should be considered when using K as a tracer is itsbehaviour when introduced to the environment. While radioactive elementsare considered to move only due to erosion, when attached to soil particles,K can be moved due to uptake by plants or by leaching into the subsurface.To prevent vegetation uptake and to allow collection of soil spectra usinghyperspectral imagers, measurements are limited to the time betweenfertilizer application and crop growth. In addition, clay and moisturecontent restrict the applicability of the method at concentrations of appliedfertilizer lower than 2.48 mg/g soil, as presented in this study.
6.5 Conclusions
In this chapter, we discussed the use of infrared spectroscopy for de-tecting changes in K concentrations in soils. Potassium (K) fertilizer forcommercial use was applied in various concentrations to six experimentalplots on silt loam soils. A flow experiment was conducted, and spectralmeasurements were collected to determine change in K before applicationof fertilizer, after application of fertilizer and after water flow. Labora-tory and spectral analyses were performed to determine the change inabsorption characteristics associated with K.
99

6. Tracing Potassium in a Loess soil with field spectroscopy
The study aimed to provide answers to three main questions.
• Can a relative change in abundance of K in the field be observed withspectroscopy using the absorption feature near 2465 nm? A relativechange in abundance of K could be observed in the field using thespectral absorption feature near 2465 nm.
• Does the amount of K removed by water flow correspond to theconcentration of K found in runoff water? The amount of K removedwith water flow corresponds to concentrations of K found in thesediment of the runoff water, although background concentrationsfrom either naturally occurring K or previously applied fertilizer hadincreased the amount of K.
• Does a change in depth of the 2465 nm absorption feature corres-pond with the controlled addition and removal of K? Change in the2465 nm absorption feature depth does not seem to correspond tothe controlled addition and removal of K. This is likely to be a resultof external influences such as moisture and clay content.
Although previous studies indicate the suitability of the method atlaboratory level [Luleva et al., 2011], in the field, the absorption featurenear 2465 nm, associated with K, is highly influenced by moisture and claycontent, at concentrations of K typically applied to agricultural fields.
If further work is intended, the method can only be applied successfullyusing quantities of fertilizer higher than 2.48 mg/g, or on soils with lowerthan 18 % clay content. Establishing K as a particle tracer can provide anopportunity for increase in size of study area and density of samplingpoints. This however could be possible only give that the limitations,identified in the current study, can be overcome at field level.
100

7General Discussion and
Conclusions
The aim of this research was to identify the most suitable chemical soilparticle tracer, and to evaluate whether change in concentration of thiselement can be detected with infrared spectroscopy by establishing directrelationships between concentrations and absorption band parameters ofthe soil spectral signature. The scope of the research is limited by theconcentrations, in which the element is present. They should be highenough to have influence on the shape of the spectral curve, but lowenough not to cause disturbance and contamination to the environment.
In Chapter 2, the use of remote sensing techniques in land degradationand soil erosion studies was evaluated. It was established that the majorityof studies used data derived only from the visible and near infrared part ofthe spectrum. There are a number of reasons behind this, most probableof which are the low cost and availability of the imagery, as well as therelatively easy to apply analytical techniques. Shortwave infrared spectrum,covered by many of the available sensors, however, contains informationabout soil chemical composition that has not been fully explored in stu-dies of soil erosion. Soil particle tracing technique was outlined, whereshortwave infrared data could be used to improve the findings. To date,the most commonly used soil particle tracer is the isotope Cesium 137(137Cs ). There are a number of limitations associated with the use of thisisotope, including its limited half-life, assumed even spatial distributionas well as high cost of measuring techniques. Hence in this chapter it issuggested that there is a clear gap and need in finding an alternative soilparticle tracer that can be measured using remote sensing techniques.
101

7. General Discussion and Conclusions
Following in Chapter 3, a method to establish direct and indirect re-lationships between soil chemical composition and infrared spectral res-ponse is presented. The aim of the chapter was to evaluate commonelements abundant in prone to erosion soils that have the potential to beused as an alternative particle tracer. Specific wavelength ranges that sta-tistically predict and quantify soluble fractions of chemical elements, fromnear infrared and shortwave infrared spectroscopy were outlined. Partialleast squares regression (PLSR) was used to develop prediction models forCalcium (Ca), Magnesium (Mg), Potassium (K), Sodium (Na), Iron (Fe), andacidity (pH) in silt loam soil samples. The element that showed highestcoefficients of determination with spectra and had the closest physical andchemical properties as 137Cs was Potassium.
The study was then focused more closely on testing whether Potassiumcan serve as a potential soil particle tracers as an alternative to Cesium 137(137Cs ). When large areas are considered, the expensive soil samplingand analysis present an obstacle for determining concentrations of thisisotope. Infrared spectral measurements provide a solution, however thesmall concentrations of the isotope do not influence the spectral signalsufficiently. Therefore, based on the fact that Potassium (K) has similarelectrical, chemical and physical properties it was initially hypothesisedthat it can be used as possible replacement in soil particle tracing. Thestudy was conducted under laboratory conditions on soils of six differenttexture types. The results were promising, identifying wavelengths bet-ween 2450 and 2470 nm to be affected directly by the amount of appliedK. Absorption feature parameters (absorption band depth, width and area)were also found to change with K concentration with coefficient of deter-mination between 0.85 and 0.99. In order for this methodology to work,however, there were two main aspects that had to be considered. First, thepresence of high clay content in the soil sample, showed to have influenceon the depth of absorption near 2460 nm. Second, at low concentrations,change in absorption of Potassium was observed with addition of fertilizer,however statistical relationships between absorption band parameters andadded concentrations were not established, and therefore quantificationcould not be performed.
Based on these findings, the study was taken to the field, where thebehaviour of K was tested by applying typically used concentrations of K
102
fertilizer. Chapter 5 and 6 describe the flow experiment that was conduc-ted on silt loam Calcisols and Loess soils. Spectral measurements werebuilt into synthetic images to represent the spatial extent and variation ofthe tests. In Chapter 5, the study was conducted in highly susceptible toerosion area in Murcia, Spain. Clay content of Calcisols, however, showedto be sufficiently high, while the concentration of fertilizer applied to theexperimental plot was too low. Moreover, the runoff sediment were notcollected, and therefore it could not be shown if the fertilizer was removedby the water flow with the soil particles, or it has been diluted or hasleached down the soil profile. However, the methodology of spectral datacollection and analysis proved effective in terms of minimizing the amountof noise caused by external factors in the far end of the shortwave electro-magnetic spectrum, and at the same time allowed spatial representationof absorption caused by K presence.
Taking these limitations into account, a second field experiment tookplace, described in Chapter 6. The study area in Southeast Limburg, TheNetherlands, was selected due to the fact that the soil is Loess, characteri-zed by minimal clay content. The setup was improved by including moreplots and adding various concentrations of fertilizer. The runoff sedimentwas collected together with soil samples for validation. The presence ofmoisture and clay in the soils, however, still proved to mask the influenceof K on the spectral signal.
The advantage of using K as a particle tracer and measuring it withinfrared spectroscopy is that the initial distribution of the element canbe determined prior and after additional application. By doing so, thedistribution of the element can be established and assumptions do notneed to be made. In comparison, the even distribution of 137Cs is alwaysassumed and therefore it has been a cause of debate, although some studieshave provided supporting arguments based on climatological factors andstudy area locations [Chappell, 1999].
Knowing the concentrations of K prior to fertilizer application is crucialfor using the element as a tracer. The natural variation of K due tothe nature of the parent material or crop residue, as well as previouslyapplied fertilizer should be established or measured. One way is to analysereference soil samples prior to annual fertilizer application, as shown inthe current study, or consult reference soil maps and farmers.
103

7. General Discussion and Conclusions
A factor that should be considered when using K as a tracer is itsbehaviour when introduced to the environment. While radioactive elementsare considered to move only due to erosion, as attached to soil particles,K can be moved due to uptake by plants or by leaching. To prevent thevegetation uptake, a soil erosion study using K should take place betweenthe time of fertilizer application and crop growth. The study should alsobe performed on silt loam soils, characteristic for soil erosion, and at thesame time limiting K leaching by having higher organic matter contents[Askegaard and Eriksen, 2000].
Exploring K as a soil particle tracer introduces a number of advantagesto current erosion studies. It is applied annually as a fertilizer and there-fore does not have a half-life as radioactive elements do. The scope of thestudy, however, was limited to K concentrations that are not harmful to theenvironment, and are regularly applied during agricultural practices. Thus,a methodology would be suitable for effective monitoring of early signs ofsoil erosion. Although high concentrations of Potassium in the laboratoryshowed promising results, high amounts of fertilizer were not used inthe field experiments. The focus of this study was put on the removalof K under the influence of water flow. Therefore, in order to establishwhether sedimentation and deposition can be measured, additional testsshould be conducted at the locations where the flow stops. Additionally, itis recommended that further tests on K leaching are performed, despitethat, as described in Chapters 4 and 6, leaching is unlikely to occur forthe duration of the proposed experiment. Considering the need to find analternative to 137Cs particle tracer, applying the above recommendationsare encouraged. Potassium is harmless to the environment, and thereforewould be a desirable particle tracer.
Based on the findings of this research, the concentrations of the elementshow high correlations with absorption feature parameters within theshortwave infrared only at very high concentrations and under laboratoryconditions [Luleva et al., 2011]. At concentrations typically applied byfarmers, the influence of moisture and clay content limit the applicationof the technique in field conditions.
The detailed spatial patterns vary wildly between phases of the expe-riment, although in some cases they are logical with movement of K andclay. Varying moisture contents obscure clear results. Also the amount
104

of water applied did not cause any visible erosion in the form of rills, therelatively high clay content creates a relatively stable structure.
However, common features can be observed from the correlation plots.These coincide with the processes that are taking place (runoff, infiltration,absorption and solution of K, movement of clay particles). In futureexperiments where higher rate of erosion is created (e.g. with a rainfallsimulator) or under field circumstances with heavy rainfall, the resultsmight be clearer.
In most plots, a movement of clay particles was observed. Detailedroughness analysis and identifying indicators for where puddles and micro-sedimentation occur, could widen the scope for further explanation of thecrusting process. In addition, studies of pesticides absorbing to the clay onthe soil surface, could benefit from these results, but further investigationis necessary.
Infrared cameras should replace the use of ASD spectrometer in orderto reduce cross contamination and noise introduced during the measure-ments. Studies use information derived from the thermal infrared partof the spectrum [Yitagesu et al., 2009] where it is seen that clays rich inK show distinct absorption based on the concentration of the element.Exploring this part of the spectrum could provide a mean to deal with thenoise introduced by clay content in the shortwave infrared. Due to theselimitations, the study was terminated at an experimental stage. Conside-ring that K is applied by farmers in relatively low concentrations, rapidparticle tracing detection might not prove successful in uncontrolled fields.Nevertheless, if the method is applied on fields that are fertilized withhigher amounts of K2O , the method has potential. A condition that has tobe met is that the initial concentration of K before fertilizer application isknown.
Upscaling the experiment to hyperspectral remotely sensed imagery wasinitially intended, however this would only be successful once the abovelimitations are handled. A possible continuation of the study will have tolook into testing new methodologies outside the controlled experimentalsetting prior to image interpretation.
105


Bibliography
L. C. Alatorre and S. Begueria. Identification of eroded areas using remotesensing in a badlands landscape on marls in the central Spanish Pyrenees.CATENA, 76(3):182–190, 2009.
J. Ali, K. Pramod, and S. Ansari. Near-infrared spectroscopy for nondes-tructive evaluation of tablets. Systematic Reviews in Pharmacy, 1:17–23,2010.
Alterra. Desire project, http://www.desire-project.eu/. DESIRE, 2007.
T. J. Andersen, O. A. Mikkelsen, A. L. Moller, and P. Morten. Deposition andmixing depths on some European intertidal mudflats based on 210Pband 137Cs activities. Continental Shelf Research, 20(12–13):1569–1591,2000.
K. Anderson and N. J. Kuhn. Variations in soil structure and reflectanceduring a controlled crusting experiment. International Journal of RemoteSensing, 29(12):3457–3475, 2008.
A. C. Andrello and C. R. Appoloni. Spatial variability and Cesium-137inventories in native forest. Brazilian Journal of Physics, 34:800–803,2004.
M. Askegaard and J. Eriksen. Potassium retention and leaching in anorganic crop rotation on loamy sand as affected by contrasting potassiumbudgets. Soil Use and Management, 16(3):200–205, 2000.
G. P. Asner and K. B. Heidebrecht. Imaging spectroscopy for desertificationstudies: comparing AVIRIS and EO-1 Hyperion in Argentina drylands.Geoscience and Remote Sensing, IEEE Transactions on, 41(6):1283–1296,2003.
107

Bibliography
J. Baartman, A. Veldkamp, J. Schoorl, J. Wallinga, and L. Cammeraat. Un-ravelling late Pleistocene and Holocene landscape dynamics: The upperGuadalentin basin, SE Spain. Geomorphology, 125(1):172 – 185, 2011.
E. M. Barnes, K. A. Sudduth, J. W. Hummel, S. M. Lesch, D. L. Corwin, C. H.Yang, C. S. T. Daughtry, and W. C. Bausch. Remote- and ground-basedsensor techniques to map soil properties. Photogrammetric Engineeringand Remote Sensing, 69(6):619–630, 2003.
P. Barre, C. Montagnier, C. Chenu, L. Abbadie, and B. Velde. Clay mineralsas a soil potassium reservoir: observation and quantification throughX-ray diffraction. Plant and Soil, 302(1):213–220, 2008.
M. Baumgardner, L. Silva, L. Biehl, and E. Stoner. Reflectance properties ofsoil. Advances in Agronomy, 38:1–44, 1985.
M. Belivermis. Vertical distributions of 137Cs, 40K, 232Th, and 226Ra insoil samples from Istanbul and its environs, Turkey. Radiation ProtectionDosimetry, 2012.
E. Ben-Dor. Quantitative remote sensing of soil properties, volume 75, pages173–243. Academic Press, 2002.
E. Ben-Dor and A. Banin. Near infrared analysis (NIRA) as a method tosimultaneously evaluate spectral featureless constituents in soils. SoilScience, 159(4):259–270, 1995.
E. Ben-Dor, N. Goldlshleger, Y. Benyamini, M. Agassi, and D. G. Blumberg.The spectral reflectance properties of soil structural crusts in the 1.2 to2.5 micrometers spectral region. Soil Sci Soc Am J, 67(1):289–299, 2003.
E. Ben-Dor, D. Heller, and A. Chudnovsky. A novel method of classifyingsoil profiles in the field using optical means. Soil Sci. Soc. Am. J., 72(4):1113–1123, 2008.
H. D. Betts and R. C. DeRose. Digital elevation models as a tool for monito-ring and measuring gully erosion. International Journal of Applied EarthObservation and Geoinformation, 1(3–4):235–235, 1999.
J. Boardman. Soil erosion science: Reflections on the limitations of currentapproaches. CATENA, 68(2–3):73–86, 2006.
J. Boardman and B. Evans. Britain, pages 439–453. John Wiley & Sons, Ltd,2006.
108

Bibliography
J. Boardman, L. Ligneau, A. de Roo, and K. Vandaele. Flooding of property byrunoff from agricultural land in Northwestern Europe. Geomorphology,10(1–4):183–196, 1994.
J. Boardman, M. L. Shepheard, E. Walker, and I. D. L. Foster. Soil erosionand risk-assessment for on- and off-farm impacts: A test case using theMidhurst area, West Sussex, UK. Journal of Environmental Management,90(8):2578–2588, 2009.
P. Bogaert and D. D’Or. Estimating soil properties from thematic soilmaps: The Bayesian maximum entropy approach. Soil Sci Soc Am J, 66(5):1492–1500, 2002.
I. Bogrekci and W. S. Lee. Effects of soil moisture content on absorbancespectra of sandy soils in sensing phosphorus concentrations using UV-VIS-NIR spectroscopy. Trans. ASABE, 49(4):1175–1180, 2006.
CAMO Software AS. The unscrambler, 2010.
B. L. Campbell, R. J. Loughran, and G. L. Elliott. Caesium-137 as an indi-cator of geomorphic processes in a drainage basin system. AustralianGeographical Studies, 20(1):49–64, 1982.
R. Casa, F. Castaldi, S. Pascucci, A. Palombo, and S. Pignatti. A comparisonof sensor resolution and calibration strategies for soil texture estimationfrom hyperspectral remote sensing. Geoderma, 197âAS198(0):17–26,2013.
O. Cerdan, G. Govers, Y. Le Bissonnais, K. Van Oost, J. Poesen, N. Saby,A. Gobin, A. Vacca, J. Quinton, K. Auerswald, A. Klik, F. J. P. M. Kwaad,D. Raclot, I. Ionita, J. Rejman, S. Rousseva, T. Muxart, M. J. Roxo, andT. Dostal. Rates and spatial variations of soil erosion in Europe: A studybased on erosion plot data. Geomorphology, 122(1–2):167–177, 2010.
S. Chabrillat, A. F. H. Goetz, L. Krosley, and H. W. Olsen. Use of hyperspec-tral images in the identification and mapping of expansive clay soils andthe role of spatial resolution. Remote Sensing of Environment, 82(2–3):431–445, 2002.
A. Chappell. Modelling the spatial variation of processes in the redistri-bution of soil: digital terrain models and 137Cs in southwest Niger.Geomorphology, 17(1–3):249–261, 1996.
109

Bibliography
A. Chappell. Using remote sensing and geostatistics to map 137Cs-derivednet soil flux in South-west Niger. Journal of Arid Environments, 39(3):441–455, 1998.
A. Chappell. The limitations of using 137Cs for estimating soil redistri-bution in semi-arid environments. Geomorphology, 29(1–2):135–152,1999.
A. Chappell, T. M. Zobeck, and G. Brunner. Using on-nadir spectral reflec-tance to detect soil surface changes induced by simulated rainfall andwind tunnel abrasion. Earth Surface Processes and Landforms, 30(4):489–511, 2005.
R. N. Clark, T. V. V. King, M. Klejwa, G. A. Swayze, and N. Vergo. Highspectral resolution reflectance spectroscopy of minerals. J. Geophys.Res., 95(B8):12653–12680, 1990.
A. L. Collins, D. E. Walling, H. M. Sichingabula, and G. J. L. Leeks. Using137Cs measurements to quantify soil erosion and redistribution rates forareas under different land use in the Upper Kaleya river basin, SouthernZambia. Geoderma, 104(3–4):299–323, 2001.
H. Croft, K. Anderson, and N. J. Kuhn. Characterizing soil surface roughnessusing a combined structural and spectral approach. European Journal ofSoil Science, 60(3):431–442, 2009.
R. C. Dalal and R. J. Henry. Simultaneous determination of moisture,organic carbon, and total nitrogen by near infrared reflectance spectro-photometry. Soil Sci Soc Am J, 50(1):120–123, 1986.
S. Dasgupta, J. J. Qu, X. Hao, and S. Bhoi. Evaluating remotely sensed livefuel moisture estimations for fire behavior predictions in georgia, usa.Remote Sensing of Environment, 108(2):138–150, 2007.
B. S. Dayal and J. F. MacGregor. Recursive exponentially weighted PLS andits applications to adaptive control and prediction. Journal of ProcessControl, 7(3):169–179, 1997.
H. de Bakker. Major soils and soil regions in the Netherlands. W. Junk,PUDOC, The Hague etc. ; Wageningen, 1979.
S. M. de Jong and V. G. Jetten. Estimating spatial patterns of rainfall inter-ception from remotely sensed vegetation indices and spectral mixture
110

Bibliography
analysis. International Journal of Geographical Information Science, 21(5):529–545, 2007.
S. M. de Jong, M. L. Paracchini, F. Bertolo, S. Folving, J. Megier, and A. P. J.de Roo. Regional assessment of soil erosion using the distributed modelSEMMED and remotely sensed data. CATENA, 37(3–4):291–308, 1999.
J. B. deGraffenried Jr and K. D. Shepherd. Rapid erosion modeling in aWestern Kenya watershed using visible near infrared reflectance, clas-sification tree analysis and 137Cesium. Geoderma, 154(1–2):93–100,2009.
S. H. Doerr, R. A. Shakesby, and R. P. D. Walsh. Soil water repellency: itscauses, characteristics and hydro-geomorphological significance. Earth-Science Reviews, 51(1–4):33–65, 2000.
M. Eghbal, M. Hajabbasi, and H. Golsefidi. Mechanism of crust formationon a soil in central Iran. Plant and Soil, 180(1):67–73, 1996.
W. Ellison. Studies of raindrop erosion. Journal of Agricultural Engineering,25:131–136, 1944.
J. Estrany, C. Garcia, and D. E. Walling. An investigation of soil erosion andredistribution in a Mediterranean lowland agricultural catchment usingCaesium-137. International Journal of Sediment Research, 25(1):1–16,2010.
R. Evans. An alternative way to assess water erosion of cultivated land— field-based measurements: and analysis of some results. AppliedGeography, 22(2):187–207, 2002.
J. S. Famiglietti, J. A. Devereaux, C. A. Laymon, T. Tsegaye, P. R. Houser,T. J. Jackson, S. T. Graham, M. Rodell, and P. J. van Oevelen. Ground–based investigation of soil moisture variability within remote sensingfootprints during the Southern Great Plains 1997 (sgp97) hydrologyexperiment. Water Resour. Res., 35(6):1839–1851, 1999.
FAO. World reference base for soil resources. Technical Report Reports103, ISRIC, ISSS, 1998.
FAO. World reference base for soil resources. Technical Report Reports103, Food and Agriculture Organization of the United Nations, 2006.
J. Farifteh, F. van der Meer, C. Atzberger, and E. J. M. Carranza. Quantitativeanalysis of salt-affected soil reflectance spectra: A comparison of two
111

Bibliography
adaptive methods (PLSR and ANN). Remote Sensing of Environment, 110(1):59–78, 2007.
D. Flanagan and J. Laflen. USDA water erosion prediction project, WEPP.Eurasian soil science, 30(5):524–530, 1997.
L. S. Galvao and I. Vitorello. Variability of laboratory measured soil lines ofsoils from Southeastern Brazil. Remote Sensing of Environment, 63(2):166–181, 1998.
D. E. Garrett. Potash: Deposits, Processing, Properties and Uses. Chapman &Hall, London, first edition edition, 1996.
N. Goldshleger, E. Ben-Dor, R. Lugassi, and G. Eshel. Soil degradation moni-toring by remote sensing: Examples with three degradation processes.Soil Sci. Soc. Am. J., 74(5):1433–1445, 2010.
N. Goldshleger, I. Livne, A. Chudnovsky, and E. Ben-Dor. New results inintegrating passive and active remote sensing methods to assess soilsalinity: A case study from jezre’el valley, israel. Soil Science, 177(6):392–401, 2012.
C. Gomez, P. Lagacherie, and G. Coulouma. Continuum removal versusplsr method for clay and calcium carbonate content estimation fromlaboratory and airborne hyperspectral measurements. Geoderma, 148(2):141–148, 2008.
M. F. Guimaraes, V. F. N. Filho, and J. Ritchie. Application of cesium-137in a study of soil erosion and deposition in Southeastern Brazil. SoilScience, 168(1):45–53, 2003.
D. M. Haaland and E. V. Thomas. Partial least-squares methods for spectralanalyses. 1. relation to other quantitative calibration methods and theextraction of qualitative information. Analytical Chemistry, 60(11):1193–1202, 1988.
D. Haase, J. Fink, G. Haase, R. Ruske, M. Pécsi, H. Richter, M. Altermann,and K. D. Jäger. Loess in Europe — its spatial distribution based on aEuropean loess map, scale 1:2,500,000. Quaternary Science Reviews, 26(9–10):1301–1312, 2007.
H. Hasegawa. Spectroscopic studies on the color reaction of acid clay. iii.the coloration with polyenes and polyacenes. The Journal of PhysicalChemistry, 67(6):1268–1270, 1963.
112

Bibliography
S. N. Haubrock, S. Chabrillat, C. Lemmnitz, and H. Kaufmann. Surfacesoil moisture quantification models from reflectance data under fieldconditions. International Journal of Remote Sensing, 29(1):3–29, 2008.
T. Hengl, D. G. Rossiter, and A. Stein. Soil sampling strategies for spatialprediction by correlation with auxiliary maps. Soil Research, 41(8):1403–1422, 2003.
J. Hernandez Bastida, N. Vela De Oro, and R. Ortiz Silla. Electrolyticconductivity of semiarid soils (Southeastern Spain) in relation to ioncomposition. Arid Land Research and Management, 18(3):265–281,2004.
W. Herrmann, M. Blake, M. Doyle, D. Huston, J. Kamprad, N. Merry, andS. Pontual. Short wavelength infrared (SWIR) spectral analysis of hydro-thermal alteration zones associated with base metal sulfide deposits atRosebery and Western Tharsis, Tasmania, and Highway-Reward, Queens-land. Economic Geology, 96(5):939–955, 2001.
R. Hessel and V. Jetten. Suitability of transport equations in modelling soilerosion for a small Loess plateau catchment. Engineering Geology, 91(1):56–71, 2007.
A. Holden. Engineering soil mapping from airphotos. Photogrammetria,23(6):185–199, 1968.
G. Hunt and J. Salisbury. Visible and near-infrared spectra of minerals androcks: I silicate minerals. Modern Geology, 1:283–300, 1970.
ITT Visual Information Solutions. IDL core version 7.1.1, 2009.
P. M. Jacobs and J. A. Mason. Late Quaternary climate change, loesssedimentation, and soil profile development in the central Great Plains:A pedosedimentary model. Geological Society of America Bulletin, 119(3–4):462–475, 2007.
M. Jalali. Site-specific potassium application based on the fertilizer po-tassium availability index of soil. Precision Agriculture, 8(4):199–211,2007.
M. Jalali and D. Rowell. Potassium leaching in undisturbed soil coresfollowing surface applications of gypsum. Environmental Geology, 57(1):41–48, 2009.
113

Bibliography
M. Jalali and D. L. Rowell. The role of calcite and gypsum in the leachingof potassium in sandy soils. Experimental Agriculture, 39(04):379–394,2003.
L. J. Janik, R. H. Merry, and J. O. Skjemstad. Can mid infrared diffusereflectance analysis replace soil extractions? Australian Journal ofExperimental Agriculture, 38(7):681–696, 1998.
V. Jetten, G. Govers, and R. Hessel. Erosion models: quality of spatialpredictions. Hydrological Processes, 17(5):887–900, 2003.
C. T. Johnston. Probing the nanoscale architecture of clay minerals. ClayMinerals, 45(3):245–279, 2010.
R. J. A. Jones, G. Spoor, and A. J. Thomasson. Vulnerability of subsoils ineurope to compaction: a preliminary analysis. Soil and Tillage Research,73(1–2):131–143, 2003.
Y. Julien and J. A. Sobrino. The yearly land cover dynamics (ylcd) method:An analysis of global vegetation from NDVI and LST parameters. RemoteSensing of Environment, 113(2):329–334, 2009.
M. Khawlie, M. Awad, A. Shaban, R. Bou Kheir, and C. Abdallah. Remotesensing for environmental protection of the eastern Mediterranean rug-ged mountainous areas, Lebanon. ISPRS Journal of Photogrammetry andRemote Sensing, 57(1–2):13–23, 2002.
R. Kimura. Estimation of moisture availability over the Liudaogou riverbasin of the loess plateau using new indices with surface temperature.Journal of Arid Environments, 70(2):237–252, 2007.
C. King, N. Baghdadi, V. Lecomte, and O. Cerdan. The application of remote-sensing data to monitoring and modelling of soil erosion. CATENA, 62(2–3):79–93, 2005.
R. F. Kokaly and R. N. Clark. Spectroscopic determination of leaf bioche-mistry using band-depth analysis of absorption features and stepwisemultiple linear regression. Remote Sensing of Environment, 67(3):267–287, 1999.
Z. Kolahchi and M. Jalali. Effect of water quality on the leaching of po-tassium from sandy soil. Journal of Arid Environments, 68(4):624–639,2007.
114

Bibliography
F. Kwaad, A. de Roo, and V. Jetten. The Netherlands, pages 477–487. JohnWiley & Sons, Ltd, 2006.
F. J. P. M. Kwaad and H. J. Mücher. Degradation of soil structure by welding— a micromorphological study. CATENA, 23(3–4):253–268, 1994.
X. Lai, Y. Zheng, I. Sondergaard, H. Josephsen, H. Lowenstein, J. N. Larsen,H. Ipsen, and S. Jacobsen. Determination of aluminium content in alu-minium hydroxide formulation by FT-NIR transmittance spectroscopy.Vaccine, 25(52):8732–8740, 2007.
Y. Le Bissonnais, O. Cerdan, V. Lecomte, H. Benkhadra, V. Souchère, andP. Martin. Variability of soil surface characteristics influencing runoffand interrill erosion. CATENA, 62(2–3):111–124, 2005.
J.-C. Lee and M. H. Ramsey. Modelling measurement uncertainty as afunction of concentration: An example from a contaminated land inves-tigation. The Analyst, 126(10):1784–1791, 2001.
M. Lemenih, E. Karltun, and M. Olsson. Assessing soil chemical and phy-sical property responses to deforestation and subsequent cultivationin smallholders farming system in Ethiopia. Agriculture, Ecosystems &Environment, 105(1–2):373–386, 2005.
Y. Li, M. J. Lindstrom, J. Zhang, and J. Yang. Spatial variability of soilerosion and soil quality on hillslopes in the Chinese Loess Plateau. ActaGeologica Hispanica, 35(3–4):261–270, 2000.
X. Liu. Airborne lidar for dem generation: some critical issues. Progress inPhysical Geography, 32(1):31–49, 2008.
D. B. Lobell and G. P. Asner. Moisture effects on soil reflectance. Soil Sci.Soc. Am. J., 66(3):722–727, 2002.
F. Lopez-Granados, M. Jurado-Exposito, J. M. Pena-Barragán, and L. Garcia-Torres. Using geostatistical and remote sensing approaches for mappingsoil properties. European Journal of Agronomy, 23(3):279–289, 2005.
M. Luleva, H. Van Der Werff, F. Van Der Meer, and V. Jetten. Observingchange in potassium abundance in a soil erosion experiment with fieldinfrared spectroscopy. Chemistry, 22(1):91–109, 2013.
M. I. Luleva, H. van der Werff, V. Jetten, and F. van der Meer. Can infraredspectroscopy be used to measure change in potassium nitrate concentra-
115

Bibliography
tion as a proxy for soil particle movement? Sensors, 11(4):4188–4206,2011.
M. I. Luleva, H. Van Der Werff, F. Van Der Meer, and V. Jetten. Gaps andopportunities in the use of remote sensing for soil erosion assessment.Chemistry, 21(5):748–764, 2012.
L. Lyles. Basic wind erosion processes. Agriculture, Ecosystems & Environ-ment, 22 – 23(0):91 – 101, 1988.
L. Mabit, M. Benmansour, and D. E. Walling. Comparative advantages andlimitations of the fallout radionuclides 137Cs, 210Pbex and 7Be forassessing soil erosion and sedimentation. Journal of EnvironmentalRadioactivity, 99(12):1799–1807, 2008.
G. W. McCarty, J. B. Reeves III, V. B. Reeves, R. F. Follett, and J. M. Kimble.Mid–infrared and near–infrared diffuse reflectance spectroscopy for soilcarbon measurement. Soil Science Society of America Journal, 66(2):640–646, 2002.
G. I. Metternicht and A. Fermont. Estimating erosion surface features bylinear mixture modeling. Remote Sensing of Environment, 64(3):254–265,1998.
G. I. Metternicht and J. A. Zinck. Evaluating the information content ofjers-1 sar and landsat tm data for discrimination of soil erosion features.ISPRS Journal of Photogrammetry and Remote Sensing, 53(3):143 – 153,1998.
K. Meusburger, N. Konz, M. Schaub, and C. Alewell. Soil erosion modelledwith USLE and PESERA using QuickBird derived vegetation parameters inan Alpine catchment. International Journal of Applied Earth Observationand Geoinformation, 12(3):208–215, 2010.
M. S. Moran, D. C. Hymer, J. Qi, and Y. Kerr. Comparison of ERS-2 SAR andLandsat TM imagery for monitoring agricultural crop and soil conditions.Remote Sensing of Environment, 79(2–3):243–252, 2002.
R. Morgan. Soil erosion and conservation. Blackwell, Malden, third editionedition, 2005.
V. Mulder, S. de Bruin, M. Schaepman, and T. Mayr. The use of remotesensing in soil and terrain mapping - a review. Geoderma, 162(1-2):1 –19, 2011.
116

Bibliography
M. Nael, H. Khademi, and M. A. Hajabbasi. Response of soil quality indi-cators and their spatial variability to land degradation in central Iran.Applied Soil Ecology, 27(3):221–232, 2004.
S. E. Nicholson and T. J. Farrar. The influence of soil type on the relation-ships between NDVI, rainfall, and soil moisture in semiarid Botswana.i. NDVI response to rainfall. Remote Sensing of Environment, 50(2):107–120, 1994.
R. Nigel and S. Rughooputh. Mapping of monthly soil erosion risk ofmainland Mauritius and its aggregation with delineated basins. Geomor-phology, 114(3):101–114, 2010.
M. F. Noomen, A. K. Skidmore, F. D. van der Meer, and H. H. T. Prins.Continuum removed band depth analysis for detecting the effects ofnatural gas, methane and ethane on maize reflectance. Remote Sensingof Environment, 105(3):262–270, 2006.
L. Oldeman. The extent of human-induced soil degradation, in oldeman,l.r. et al., world map of the status of human-induced soil degradation. InUnited Nations Environment Programme and International Soil Referenceand Information Centre. Wageningen, The Netherlands, 1991.
C. T. Omuto and D. P. Shrestha. Remote sensing techniques for rapiddetection of soil physical degradation. Int. J. Remote Sens., 28(21):4785–4805, 2007.
Y. Onda, H. Kato, Y. Tanaka, M. Tsujimura, G. Davaa, and D. Oyunbaatar.Analysis of runoff generation and soil erosion processes by using en-vironmental radionuclides in semiarid areas of Mongolia. Journal ofHydrology, 333(1):124–132, 2007.
M. Owe, R. de Jeu, and J. Walker. A methodology for surface soil moistureand vegetation optical depth retrieval using the microwave polarizationdifference index. IEEE Transactions on Geoscience and Remote Sensing,39(8):1643–1654, 2001.
A. Palacios-Orueta and S. L. Ustin. Remote sensing of soil properties inthe Santa Monica mountains i. spectral analysis. Remote Sensing ofEnvironment, 65(2):170–183, 1998.
S. Park, J. J. Feddema, and S. L. Egbert. Impacts of hydrologic soil propertieson drought detection with MODIS thermal data. Remote Sensing ofEnvironment, 89(1):53–62, 2004.
117

Bibliography
A. J. Parsons and I. D. L. Foster. What can we learn about soil erosion fromthe use of 137Cs? Earth-Science Reviews, 108(1–2):101–113, 2011.
A. V. Peterburgsky and F. V. Yanishevsky. Transformation of forms ofpotassium in soil during long-term potassium fertilization. Plant andSoil, 15(3):199–210, 1961.
J. Poesen, J. Nachtergaele, G. Verstraeten, and C. Valentin. Gully erosionand environmental change: importance and research needs. CATENA,50(2–4):91–133, 2003.
V. O. Polyakov and M. A. Nearing. Rare earth element oxides for tracingsediment movement. CATENA, 55(3):255–276, 2004.
P. Porto, D. E. Walling, and V. Ferro. Validating the use of Caesium-137measurements to estimate soil erosion rates in a small drainage basin inCalabria, Southern Italy. Journal of Hydrology, 248(1–4):93–108, 2001.
D. F. Post, A. Fimbres, A. D. Matthias, E. E. Sano, L. Accioly, A. K. Batchily,and L. G. Ferreira. Predicting soil albedo from soil color and spectralreflectance data. Soil Science Society of America Journal, 64(3):1027–1034,2000.
V. Prasannakumar, H. Vijith, S. Abinod, and N. Geetha. Estimation of soilerosion risk within a small mountainous sub-watershed in Kerala, India,using revised universal soil loss equation (RUSLE) and geo-informationtechnology. Geoscience Frontiers, 3(2):209–215, 2012.
J. B. Reeves III, G. W. McCarty, and J. J. Meisinger. Near infrared reflectancespectroscopy for the analysis of agricultural soils. Journal of NearInfrared Spectroscopy, 7(3):179–193, 1999.
A. S. Relman. The physiological behavior of Rubidium and Cesium inrelation to that of Potassium. Yale Journal of Biology and Medicine, 29(3):248–262, 1956.
K. G. Renard, G. R. Foster, G. A. Weesies, and J. P. Porter. RUSLE: Reviseduniversal soil loss equation. Journal of Soil and Water Conservation, 46(1):30–33, 1991.
N. Richter, T. Jarmer, S. Chabrillat, C. Oyonarte, P. Hostert, and H. Kauf-mann. Free iron oxide determination in Mediterranean soils using diffusereflectance spectroscopy. Soil Sci. Soc. Am. J., 73(1):72–81, 2009.
118
Bibliography
S. J. Rodway-Dyer and D. E. Walling. The use of 137Cs to establish longer-term soil erosion rates on footpaths in the UK. Journal of EnvironmentalManagement, 91(10):1952–1962, 2010.
M. Sac, E. Yumurtaci, G. Yener, B. Camgoz, A. Ugur, and B. Ozden. Soilerosion determinations by using 137Cs technique in the agriculturalregions of Gediz Basin, Western Turkey. Environmental Geology, 55(3):477–483, 2008.
J.-A. Sanchez-Cabeza, M. Garcia-Talavera, E. Costa, V. Pea, J. Garcia-Orellana,P. Masque, and C. Nalda. Regional calibration of erosion radiotracers(210Pb and 137Cs): Atmospheric fluxes to soils (Northern Spain). Envi-ronmental Science & Technology, 41(4):1324–1330, 2007.
A. Savitzky and M. J. E. Golay. Smoothing and differentiation of databy simplified least squares procedures. Analytical Chemistry, 36(8):1627–1639, 1964.
T. Schmid, A. Palacios-Orueta, S. Chabrillat, E. Bendor, A. Plaza, M. Rodri-guez, M. Huesca, M. Pelayo, C. Pascual, P. Escribano, and V. Cicuendez.Spectral characterisation of land surface composition to determine soilerosion within semiarid rainfed cultivated areas. Proceedings of IGARSS,2012, Munchen, Germany, 22-27 July 2012, pages 7082 –7085, july 2012.
E. E. Schulte and K. A. Kelling. Understanding plant nutrients: soil andapplied potassium. University of Wisconsin Extension, Publ. A2521, 1998.
P. Seiden, R. Bro, L. Poll, and L. Munck. Exploring fluorescence spectra ofapple juice and their connection to quality parameters by chemometrics.Journal of Agricultural and Food Chemistry, 44(10):3202–3205, 1996.
A. Sharma. Integrating terrain and vegetation indices for identifying poten-tial soil erosion risk area. Geo-Spatial Information Science, 13(3):201–209,2010.
A. N. Sharpley. Relationship between soil potassium forms and mineralogy.Soil Science Society of America Journal, 53(4):1023–1028, 1989.
K. D. Shepherd and M. G. Walsh. Development of reflectance spectrallibraries for characterization of soil properties. Soil Sci Soc Am J, 66(3):988–998, 2002.
119

Bibliography
K. D. Shepherd and M. G. Walsh. Diffuse reflectance spectroscopy for rapidsoil analysis. Encyclopedia of Soil Science: Second Edition, pages 480 –484, 2006.
M. Shoshany. Satellite remote sensing of natural mediterranean vegetation:A review within an ecological context. Progress in Physical Geography,24(2):153–178, 2000.
D. P. Shrestha, J. A. Zinck, and E. Van Ranst. Modelling land degradation inthe Nepalese Himalaya. CATENA, 57(2):135–156, 2004.
D. P. Shrestha, D. E. Margate, F. v. d. Meer, and H. V. Anh. Analysis andclassification of hyperspectral data for mapping land degradation: Anapplication in Southern Spain. International Journal of Applied EarthObservation and Geoinformation, 7(2):85–96, 2005.
R. B. Shruthi, N. Kerle, and V. Jetten. Object-based gully feature extractionusing high spatial resolution imagery. Geomorphology, 134:260–268,2011.
M. J. Smith and C. D. Clark. Methods for the visualization of digital elevationmodels for landform mapping. Earth Surface Processes and Landforms,30(7):885–900, 2005.
J. A. Sobrino and N. Raissouni. Toward remote sensing methods for landcover dynamic monitoring: Application to Morocco. International Journalof Remote Sensing, 21(2):353–366, 2000.
W. Spaan, H. Winteraeken, and P. Geelen. Adoption of SWC measures inSouth Limburg (The Netherlands): Experiences of a water manager. LandUse Policy, 27(1):78–85, 2010.
B. Stenberg, R. A. Viscarra Rossel, A. M. Mouazen, J. Wetterlind, and L. S.Donald. Visible and Near Infrared Spectroscopy in Soil Science, volume107, pages 163–215. Academic Press, 2010.
A. Stevens, T. Udelhoven, A. Denis, B. Tychon, R. Lioy, L. Hoffmann, andB. van Wesemael. Measuring soil organic carbon in croplands at regionalscale using airborne imaging spectroscopy. Geoderma, 158(1–2):32–45,2010.
N. Syversen, L. Oygarden, and B. Salbu. Cesium-134 as a tracer to studyparticle transport processes within a small catchment with a buffer zone.J. Environ. Qual., 30(5):1771–1783, 2001.
120

Bibliography
I. Takken, L. Beuselinck, J. Nachtergaele, G. Govers, J. Poesen, and G. De-graer. Spatial evaluation of a physically-based distributed erosion model(LISEM). CATENA, 37(3–4):431–447, 1999.
A. K. Thurmond, M. G. Abdelsalam, and J. B. Thurmond. Optical-radar-DEM remote sensing data integration for geological mapping in the Afardepression, Ethiopia. Journal of African Earth Sciences, 44(2):119–134,2006.
A. Q. Timothy, G. Gerard, E. W. Desmond, Z. Xinbao, J. J. D. Philippe,Z. Yusheng, and V. Karel. Erosion processes and landform evolution onagricultural land – new perspectives from Caesium-137 measurementsand topographic–based erosion modelling. Earth Surface Processes andLandforms, 22(9):799–816, 1997.
D. Troufleau and H. Sogaard. Deriving surface water status in the sahelfrom the pathfinder AVHRR land data set. Physics and Chemistry of TheEarth, 23(4):421–426, 1998.
A. N. Tyler. In situ and airborne gamma-ray spectrometry, volume 11,pages 407–448. Elsevier, 2008.
T. Udelhoven, C. Emmerling, and T. Jarmer. Quantitative analysis of soilchemical properties with diffuse reflectance spectrometry and partialleast-square regression: A feasibility study. Plant and Soil, 251(2):319–329, 2003.
L. S. Unganai and F. N. Kogan. Drought monitoring and corn yield estima-tion in southern africa from AVHRR data. Remote Sensing of Environment,63(3):219–232, 1998.
F. van der Meer. Analysis of spectral absorption features in hyperspec-tral imagery. International Journal of Applied Earth Observation andGeoinformation, 5(1):55–68, 2004.
F. van der Meer. The effectiveness of spectral similarity measures for theanalysis of hyperspectral imagery. International Journal of Applied EarthObservation and Geoinformation, 8(1):3–17, 2006.
G. Van Lynden. European soil resources. current status of soil degradation,causes, impacts and need for action. Nature and Environment, (71):1–99,1995.
L. Van Reeuwijk. Procedures for soil analysis. Technical report, 2002.
121

Bibliography
R. A. Viscarra Rossel. Parles: Software for chemometric analysis of spec-troscopic data. Chemometrics and Intelligent Laboratory Systems, 90(1):72–83, 2008.
R. A. Viscarra Rossel, D. J. J. Walvoort, A. B. McBratney, L. J. Janik, andJ. O. Skjemstad. Visible, near infrared, mid infrared or combined diffusereflectance spectroscopy for simultaneous assessment of various soilproperties. Geoderma, 131(1–2):59–75, 2006.
R. A. Viscarra Rossel, P. A. B. McBratney, D. B. Minasny, B. Stenberg, andR. A. V. Rossel. Diffuse Reflectance Spectroscopy for High-Resolution SoilSensing Proximal Soil Sensing, volume 1 of Progress in Soil Science, pages29–47. Springer Netherlands, 2010.
A. Vrieling. Satellite remote sensing for water erosion assessment: A review.CATENA, 65(1):2–18, 2006.
P. J. Wallbrink and A. S. Murray. Use of fallout radionuclides as indicatorsof erosion processes. Hydrological Processes, 7(3):297–304, 1993.
D. E. Walling and T. A. Quine. Calibration of Caesium-137 measurements toprovide quantitative erosion rate data. Land Degradation & Development,2(3):161–175, 1990.
F. L. Wang and P. M. Huang. Effects of organic matter on the rate ofpotassium adsorption by soils. Canadian Journal of Soil Science, 81(3):325–330, 2001.
S. D. Warren, H. Mitasova, M. G. Hohmann, S. Landsberger, F. Y. Iskander,T. S. Ruzycki, and G. M. Senseman. Validation of a 3-D enhancementof the universal soil loss equation for prediction of soil erosion andsediment deposition. CATENA, 64(2–3):281–296, 2005.
L. Weidong, F. Baret, G. Xingfa, T. Qingxi, Z. Lanfen, and Z. Bing. Relatingsoil surface moisture to reflectance. Remote Sensing of Environment, 81(2–3):238–246, 2002.
S. L. West, G. N. White, Y. Deng, K. J. McInnes, A. S. R. Juo, and J. B. Dixon.Kaolinite, halloysite, and iron oxide influence on physical behavior offormulated soils. Soil Sci. Soc. Am. J., 68(4):1452–1460, 2004.
F. Westad, M. Hersleth, P. Lea, and H. Martens. Variable selection in pca insensory descriptive and consumer data. Food Quality and Preference, 14(5–6):463–472, 2003.
122

Bibliography
H. J. Winteraeken and W. P. Spaan. A new approach to soil erosion andrunoff in South Limburg – The Netherlands. Land Degradation & Deve-lopment, 21(4):346–352, 2010.
W. Wischmeier and D. Smith. Predicting rainfall erosion losses : a guide toconservation planning. Supersedes agriculture handbook no. 282, "Predic-ting rainfall-erosion losses from Cropland East of the Rocky Mountains".Science and Education Administration United States Department of Agri-culture (USDA), Purdue Agricultural Experiment Station, 1978.
S. Wold, M. Sjöström, and L. Eriksson. Pls-regression: a basic tool ofchemometrics. Chemometrics and Intelligent Laboratory Systems, 58(2):109–130, 2001.
N. Xiaojun, W. Xiaodan, L. Suzhen, G. Shixian, and L. Haijun. 137Cs tra-cing dynamics of soil erosion, organic carbon and nitrogen in slopingfarmland converted from original grassland in Tibetan plateau. AppliedRadiation and Isotopes, 68(9):1650–1655, 2010.
F. A. Yitagesu, F. van der Meer, H. van der Werff, and W. Zigterman. Quanti-fying engineering parameters of expansive soils from their reflectancespectra. Engineering Geology, 105(3–4):151–160, 2009.
F. A. Yitagesu, F. van der Meer, H. van der Werff, and C. Hecker. Spectralcharacteristics of clay minerals in the 2.5–14 μm wavelength region.Applied Clay Science, 53(4):581–591, 2011.
P. Zhang, L. Li, G. Pan, and J. Ren. Soil quality changes in land degradationas indicated by soil chemical, biochemical and microbiological propertiesin a karst area of southwest guizhou, china. Environmental Geology, 51(4):609–619, 2006.
P. Zhou, O. Luukkanen, T. Tokola, and J. Nieminen. Effect of vegetationcover on soil erosion in a mountainous watershed. CATENA, 75(3):319–325, 2008.
M. Zribi, S. Le Hégarat-Mascle, C. Ottlé, B. Kammoun, and C. Guerin. Surfacesoil moisture estimation from the synergistic use of the (multi-incidenceand multi-resolution) active microwave ERS wind scatterometer and SARdata. Remote Sensing of Environment, 86(1):30–41, 2003.
M. Zribi, N. Baghdadi, N. Holah, and O. Fafin. New methodology for soilsurface moisture estimation and its application to ENVISAT-ASAR multi-
123

Bibliography
incidence data inversion. Remote Sensing of Environment, 96(3–4):485–496, 2005.
124

Summary
Assessing soil erosion over large areas has been a challenge for decades.The large spatial extent of the process creates difficulties in data acqui-sition, for both measuring and validation. Remotely sensed data providespatial coverage and are used to derive information for various soil erosionparameters, such as vegetation cover, topography, and soil moisture.
As part of this work, various applications of remotely sensed data insoil erosion studies were reviewed to identify gaps in current soil erosionresearch. To date, infrared spectroscopy has been applied in only a limitednumber of studies. A way to better integrate these data in studies of soilerosion was to detect the chemical composition of the soil and apply themethod for soil chemical particle tracing.
To identify a potential soil particle tracer that has similar physical andchemical properties as the commonly used radioactive isotope Ceasium-137 (137Cs ), but at the same time does possess a distinctive spectralsignature, a number of abundant in the environment chemical elementswere tested. Wavelength ranges that statistically predict and quantifysoluble fractions of chemical elements, from infrared spectroscopy wereidentified. Partial least squares regression (PLSR) was used to developprediction models for naturally occurring Calcium (Ca), Magnesium (Mg),Potassium (K), Sodium (Na), Iron (Fe), and acidity (pH) in silt loam soilsamples. Significant wavelength ranges were determined by establishingdirect and indirect relationships between soil spectra and soluble fractionsof these elements.
The feasibility of using Partial Least Squares Regression for identifyingsoluble fractions of soil chemical elements in silt loam soils using infrared
125

Summary
spectroscopy was tested. By outlining wavelength ranges where the changein reflectance was associated with change in the concentration of theelement, Potassium was identified as having the closest to 137Cs propertiesthat can be predicted from infrared spectra.
A laboratory based study on the use of Potassium (K) as a potentialreplacement of 137Cs in soil particle tracing was then conducted. Theelement was found to have similar electrical, chemical and physical pro-perties. In order to test the suitability of the element as a particle tracer,heavy clay, clay loam, loam, silty loam and sandy loam and fine sand soilswere sampled for the study. Sensitivity analyses were performed on soilchemical properties and spectra to identify the wavelength range relatedto K concentration. Different concentrations of K fertilizer were added tosoils with varying texture in order to establish spectral characteristics ofthe absorption feature associated with K.
Quantifying concentrations of K by using commercial fertilizer andinfrared spectroscopy was possible for soils with sandy and sandy silttexture. The current study suggested the method as a new approachthat could potentially grow to a technique for rapid monitoring of soilparticle movement. A flow experiment was conducted in the area of theGuadalentin basin in Murcia, South East Spain in order to identify soilparticle movement using Potassium fertilizer and infrared spectroscopy inthe field. The severe soil erosion that takes place in the region, as well asthe silty loam texture of the soil, determined the selection of the field area.
This experiment allowed identification of key factors that determinethe detection of K, when tested as a potential particle tracer. A followup experiment was designed to take into consideration soil clay content,runoff data and concentrations of applied fertilizer. Consequently, a field-based water flow experiment was conducted on 6 plots in silty loam soilsin the Netherlands. The field area was selected due to the fact that thesoils were developed on Loess, and were characterized with limited claycontent. The plots were treated with various concentrations of K2O andone plot was used as reference. Infrared reflectance spectra were collectedto observe spatial variation in available K, before and after application offertilizer, and after runoff simulation by water flow. The runoff sedimentwas also collected in order to establish potential removal of fertilizer underthe influence of the water flow.
126

Exploring K as a soil particle tracer introduced a number of advantagesto current erosion studies. It is applied annually as a fertilizer and there-fore does not have a half-life as radioactive elements do. The scope of thestudy, however, was limited to K concentrations that are not harmful to theenvironment, and are regularly applied during agricultural practices. Al-though high concentrations of Potassium in the laboratory show promisingresults, high amounts of fertilizer were not used in the field experiments.Thus, the methodology would be suitable for effective monitoring of earlysigns of soil erosion.
The focus of this study was put on the removal of K under the influenceof water flow. Therefore, in order to establish whether sedimentationand deposition can be measured, additional tests should be conducted atthe locations where the flow stops. Moreover, it was recommended thatfurther tests on K leaching should be performed, despite that leachingis unlikely to occur for the duration of the proposed experiment. Thereis a strong need to find an alternative to 137Cs for soil erosion modeling,considering the radioactive properties and half life of the element. If usedas a particle tracer, potassium is environmentally friendly, readily availablein the form of a fertilizer, and its abundance can be detected with infraredspectroscopy in dry, silty loam or sandy soils, with low clay content.
127


Samenvatting
Het waarnemen van bodemerosie over grote landoppervlaktes is al voorlangere tijd een uitdaging in de wetenschap. De ruimtelijke schaal waaropdit proces zich afspeelt maakt het moeilijk gegevens te vergaren voorzowel het meten van het proces als het valideren van deze meetgegevens.Aardobservatie geeft de benodigde ruimtelijke dekking en wordt gebruiktom informatie te verkrijgen over verscheidene bodem erosie parameters,zoals vegetatie bedekking, topografie en bodemvocht gehalte.
Als deel van dit onderzoek werd een overzicht gemaakt van verschei-dene toepassingen van aardobservatie voor bodemerosie, en mogelijkhe-den die in huidig onderzoek naar bodem erosie onbenut bleken, kondendaarmee geïdentificeerd worden. Infrarood spectroscopie werd tot nu toegebruikt in slechts een beperkt aantal studies, en een mogelijkheid voor hetgebruik van deze techniek bleek te liggen in het meten van de chemischesamenstelling van bodems en het volgen van verplaatsende bodemdeeltjes.
Gewoonlijk wordt in bodem erosie studies het radio-actieve Caesium-137 (137Cs ) isotoop gebruikt voor volgen van verplaatsende bodemdeeltjes.Dit element heeft echter geen absorptie kenmerken heeft in het infrarodespectrum. Er werd daarom gezocht naar een alternatief element dat verge-lijkbare fysische en chemische eigenschappen heeft, maar wel spectraalactief is.
Partial Least Squares regressie (PLSR) werd gebruikt om de absorp-tie golflengtes te bepalen die statistisch de wateroplosbare fractie vanchemische elementen voorspellen, waarbij zowel directe alsook indirecterelaties tussen spectra en de elementen gebruikt werden. Van de natuur-lijk voorkomende elementen Calcium (Ca), Magnesium (Mg), Kalium (K),
129

Samenvatting
Natrium (Na), IJzer (Fe), en van de zuurtegraad (pH), konden in silt leembodem monsters de golflengtes vastgesteld worden die een significantevoorspelling geven.
Uit het systematisch testen van veranderingen in het absorptie spec-trum als gevolg van veranderende concentraties van opgeloste elementen,bleek dat PLSR gebruikt kon worden voor het identificeren van de water-oplosbare fracties van bodem elementen in silt leem bodems. Van debovengenoemde elementen, die alle spectroscopisch detecteerbaar zijn,komt Kalium chemisch met meest overeen met 137Cs .
Een laboratorium onderzoek werd uitgevoerd om de geschiktheid vanKalium (K) als mogelijke vervanger van 137Cs te bepalen. Een gevoeligheids-analyse werd uitgevoerd tussen infrarood spectra en bodemchemischeeigenschappen van klei, klei leem, leem, silt leem en zand leem bodemmonsters, waaraan verschillende concentraties van een Kalium houdendekunstmest toegevoegd werden. Hiermee werden de absorptie golflengtesgerelateerd aan veranderingen in Kalium concentratie vastgesteld. Hetbleek dat het vaststellen van deze Kalium concentratie met behulp vaninfrarood spectroscopie aleen mogelijk was in zand of zand leem bodems.
In dit proefschrift is dit gegeven gezien als een mogelijkheid om bewe-ging van bodemdeeltjes te observeren. Om beweging van bodemdeeltjes inhet veld te observeren, werd een vloei experiment met Kaliumhoudendekunstmest en infrarood spectroscopie uitgevoerd in het Guadalentin bek-ken, nabij Murcia in Zuidoost Spanje. Dit gebied heeft bodems met eenoverwegend silt leem textuur en gaat tevens gebukt onder hevige erosie.Dit experiment belichtte een aantal sleutel factoren die het detecteren vanKalium beinvloeden. In een vloei experiment gedaan in een Loess gebied inZuid Nederland, dat gekenmerkt worden door bodems met een relatief laagklei gehalte, werd ook de invloed van klei gehalte, stroomsterkte van wateren de concentratie van de toegevoegde kunstmest bepaald. Hiertoe werdenvijf plekken in een silt leem grond voorzien van verschillende concentra-ties K2O, terwijl één plek als referentie gebruikt werd. Infrarood spectrawerden gebruikt om de ruimtelijke variatie van Kalium te bepalen voor enna het vloeien van water. Het verplaatste sediment werd opgevangen omhet transport van kunstmest door het water vast te stellen.
Het gebruik van Kalium als indicator voor transport van bodemdeeltjesgeeft nieuwe mogelijkheden aan bodemerosie studies. Kalium wordt jaar-
130

lijks opgebracht als meststof, en het heeft geen beperkende halfwaardetijd zoals radioactieve elementen. Dit onderzoek bleef beperkt tot hetgebruik van Kalium concentraties die gebruikelijk jaarlijks opgebrachtworden en die niet schadelijk zijn voor het milieu. Hoewel het gebruikvan hogere concentraties Kalium in laboratorium experimenten duidelijkerresultaten laat zien, en daarmee geschikt zou zijn om de eerste signalenvan bodemerosie op te vangen, zijn deze hoge hoeveelheden in het veldniet gebruikt.
Deze studie was gericht op het verwijderen van Kalium door het latenvloeien van water. Om vast te stellen of erosie en sedimentatie daadwerke-lijk gemeten kan worden, zou in toekomstige experimenten ook metingengedaan moeten worden op plaatsen waar de waterstroom stopt. Ook zouhet weglekken van Kalium in de bodem beter gecontroleerd moeten wor-den, hoewel zulks niet waarschijnlijk is in de korte tijdsduur die vloeiexperimenten nemen.
Voor bodemerosie modelering is het belangrijk een alternatief voor137Cs te vinden, gezien de radio-activiteit en half-waarde tijd van dit ele-ment. Voor deze toepassing, Kalium is milieu vriendelijk, beschikbaar inde vorm van kunstmest, en kan gedetecteerd worden in droge, silt leem ofzandige bodems met infrarood spectroscopie.
131


Resume
Mila Luleva was born on January, 18th, 1984 in Sofia, Bulgaria. In 2005,she obtained her Bachelor degree in Geography and Environmental Sciencewith Honors, from University of Sussex, UK, with specialization in soilcontamination. She then completed a Masters of Science course in Geo-information science and Earth Observation for Environmental Modelingand Management from University of Southampton, University of Lund, Uni-versity of Warsaw and ITC. The topic of her MSc thesis was ’Identificationof Soil Property Variation Using Spectral and Statistical Analyses on Fieldand ASTER Data - A Case Study of Tunisia’. In 2007 she began her PhDfunded by the EU DESIRE Project. Mila is currently an environmental GISand remote sensing consultant.
133


Publications
Peer Reviewed First Author Publications
• Luleva M., van der Werff, H., van der Meer, F., Jetten, V., 2013, Ob-serving change in Potassium abundance in a soil erosion experimentwith field infrared spectroscopy, Chemistry, 22(1): 91 - 109
• M. I. Luleva, H. Van Der Werff, F. Van Der Meer, and V. Jetten., 2012,Gaps and opportunities in the use of remote sensing for soil erosionassessment. Chemistry, 21(5): 748 - 764
• Luleva, M.I., van der Werff, H., Jetten, V., van der Meer, F., 2011.Can Infrared Spectroscopy Be Used to Measure Change in PotassiumNitrate Concentration as a Proxy for Soil Particle Movement? Sensors11, 4188 – 4206
• Luleva M., van der Werff, H., van der Meer, F., Jetten, V., Predicting So-luble Fractions of Chemical Elements in Silt Loam Soils Using InfraredSpectroscopy, Pedosphere (submitted)
• Luleva, M., 2007, Economic Impact of Global Worming: The Ever-Lasting Debate, Economy Life, In Press, [In Bulgarian]
• Luleva M., Ignatova, M, 2007, NATURA 2000 in Bulgaria: The CurrentSituation of the Country in Respect to the EU Directives, EconomyLife, submitted and approved [In Bulgarian]
• Luleva M., 2007, Environmental Tax on Airplanes: Is it a FeasibleIdea?, Economy Life, submitted and approved [In Bulgarian]
135

Publications
Conference Proceedings
• Luleva, M, van der Meer, F, van der Werff, H., Jetten, V., Tracing soilparticle movement using Potassium Nitrate and Infrared spectralresponse, DESIRE Conference, May, 2010, Enschede, The Netherlands
• Luleva, M, van der Meer, F, van der Werff, H., Jetten, V., ApplyingPartial Least Squares Regression technique for rapid detection of soilchemical composition related to land degradation, High ResolutionGeological Remote Sensing, GRSG Annual General Meeting, 10-11December, 2008-10-01, The Geological Society of London
MSc Thesis
• Luleva, M, 2007, Identification of Soil Property Variation Using Spec-tral and Statistical Analyses on Field and ASTER Data. A Case Studyof Tunisia. Available: http://www.itc.nl/library
136

ITC dissertations
A complete list of ITC dissertations is online on the ITC website:
www.itc.nl/research/phd/phd_graduates.aspx.
This dissertation has number 228.
137