tracer study vii may 2007 - world...
TRANSCRIPT

JOINT JAPAN/WORLD BANK
GRADUATE SCHOLARSHIP
PROGRAM (JJ/WBGSP)
TRACER STUDY VII
May 2007
Phone: 202-473-6849
Fax: 202-522-4036
www.worldbank.org/wbi/scholarships/
Email: [email protected]
THE WORLD BANK
1818 H. Street, NW
Washington, DC 20433
USA
www.worldbank.org/
Information Line: 202-458-2498
Email: [email protected]
44281
Pub
lic D
iscl
osur
e A
utho
rized
Pub
lic D
iscl
osur
e A
utho
rized
Pub
lic D
iscl
osur
e A
utho
rized
Pub
lic D
iscl
osur
e A
utho
rized
Pub
lic D
iscl
osur
e A
utho
rized
Pub
lic D
iscl
osur
e A
utho
rized
Pub
lic D
iscl
osur
e A
utho
rized
Pub
lic D
iscl
osur
e A
utho
rized

Joint Japan/World Bank
Graduate Scholarship Program
(JJ/WBGSP)
Tracer Study VII
May 2007
T r a c e r S t u d y

The Scholarship Program will create a community of highlytrained professionals working in development-related field;…the scholars will return to their countries to apply theirenhanced knowledge and skills toward helping accelerate thepace of economic and social development.
Kenji Yamaguchi, Executive Director for Japan,
to the President of the World Bank
May 27, 1987

iii
Table of Content
Executive Summary....................................................................................................................................................1
Section 1: Introduction...............................................................................................................................................5
Program Background and Description ......................................................................................................................6
Objective of the Study...............................................................................................................................................7
Organization of the Study .........................................................................................................................................8
Section 2: Methodology of Analysis..........................................................................................................................9
Databases...............................................................................................................................................................10
Tracer Survey..........................................................................................................................................................10
Indicators ................................................................................................................................................................13
Section 3: Input Indicators: Selection Process; Scholars’ Profile; and Academic Programs..............................15
Selection and Awards Process................................................................................................................................16
Scholars’ profile ......................................................................................................................................................16
Host Regions and Academic Programs ..................................................................................................................18
Costs of the program..............................................................................................................................................19
Section 4: Output Indicators: Completion and Skills Enhancement.................................................................................21
Degree Attainment ..................................................................................................................................................22
Skills enhancement .................................................................................................................................................22
Section 5: Outcome Indicators: Impact on Individual Scholars; and on Development Environment .................25
Impact on Individual Scholars .................................................................................................................................26
Impact on Development Environment .....................................................................................................................27
Residence status ..................................................................................................................................................27
Employment after Return to Home Country ..........................................................................................................30
Link to Development.............................................................................................................................................32
Section 6: Results and Outlook ...............................................................................................................................35
Conclusions, Lessons Learned and Recommendations..........................................................................................39
Appendix I: Statistical Tables .................................................................................................................................41
Appendix II: Eligibility and Selection Criteria.........................................................................................................61
Appendix III: Tracer Survey 2006 Questionnaires .................................................................................................64

Table of Content
Boxes
The Program in Economic Policy Management at Columbia University .....................................................................7
The Tax Program in Japan ......................................................................................................................................14
The Program in Economic Policy Management at CERDI .......................................................................................33
The Economic Policy Management Program at Makerere University .......................................................................38
The Williams College Center for Development Economics ......................................................................................40
Figures
Breakdown of JJ/WBGSP Scholars and Graduates, 1987–2006............................................................................10
Respondents to Tracer Survey per Cohort ..............................................................................................................11
Average Age of Awardees, 1987–2006 ...........................................................................................................16
Share of Female Scholars ..................................................................................................................................17
JJ/WBGSP Scholars’ Main Host Countries.............................................................................................................18
JJ/WBGSP Main Fields of Study, 1987–2006 .........................................................................................................18
Rating of Benefits Gained through Studies Supported by JJ/WBGSP ....................................................................23
Rating of Usefulness at Work of Studies Supported by JJ/WBGSP........................................................................23
Rating of Individual Professional Benefits ................................................................................................................26
RDC per Cluster......................................................................................................................................................29
Status of Alumni not Residing in Home Country or Another Developing Country ....................................................30
Employment Status.................................................................................................................................................30
Distribution of Employed Alumni per Employer Type ...............................................................................................31
Distribution of Employed Alumni per Cluster and Position Type...............................................................................32
Tables
Population, Respondents, and Response Rates for Tracer Studies I to VII..............................................................11
Cohort Clusters Profile ............................................................................................................................................12
Scholars’ Profile...................................................................................................................................................17
Average Costs of Scholarships for Selected Host Countries (Regular Program) ......................................................19
Partnership Universities Cost Matrix........................................................................................................................19
Trends in Attainment Rate ..................................................................................................................................22
Professional Progression per Cluster.......................................................................................................................27
Residence Status per Gender and Degree..............................................................................................................28
Respondents and RDC Tracer Studies I to VII ................................................................................................28
Residence Status per Program Type.......................................................................................................................29
Employment per Cluster .........................................................................................................................................30
Employment Status per Program Type....................................................................................................................31
Alumni Activities and Development .........................................................................................................................33
Summary of JJ/WBGSP Alumni Analysis ....................................................................................................36-37

Executive Summary
Introduction
T he Joint Japan/World Bank Graduate Scholarship Program (JJ/WBGSP) began 20 years ago as part of
the Policy and Human Resources Fund (PHRD) which had been set up by the Government of Japan in
partnership with the World Bank to enhance improvements in less-developed countries. JJ/WBGSP’s mission
has been to educate mid-career professionals from developing countries about current techniques. After
finishing their studies, the scholars will, ideally, return to their home countries where they will use their newly
acquired knowledge and skills to enhance their country’s socio-economic development.
The JJ/WBGSP delivers its mission through a Regular Program and a Partnership Scheme. The flexible Regular
Program allows the scholars from the World Bank member countries to study at universities of their choice from
around the world. The Partnership Programs give scholars specialized graduate training at selected universities.
Since1994, a series of tracer studies have provided the Government of Japan and the World Bank with
feedback about Program graduates, and has been used to continuously improve the overall program’s
performance. The 2006 tracer study, the seventh in this series, addressed the scholars’ accomplishments
during 1987-2006 by investigating specific achievements in terms of completion, return to home country,
employment, professional progression and alumni’s perception of the benefits gained through the program.
The study uses information from databases about JJ/WBGSP’s existing scholars and alumni as well as results
from a specific tracer survey conducted, in two phases, during August 2006-February 2007. The purpose of
the first phase was mainly to update the alumni database through collecting basic data on the alumni residence
and employment status as well as their contact information. The total number of respondents to this first phase
reached 812 alumni. The survey’s second phase addressed qualitative aspects of the study such as perception
of the program’s benefits, and had a total of 348 respondents. In order to incorporate the cohort effect,
respondents were grouped in clusters according to their years of graduation.
Special contributions complement the analysis by providing a feedback about the program’s effectiveness from
the perspective of host and partner universities.
Scholars’ Profile
The JJ/WBGSP awarded a total of 3,554 during 1987-2006. Most scholars were in the range of 30-34 years
old when awarded their scholarships. However the trend is to select older and hence more experienced
scholars. Although female scholars are historically outnumbered by males, the gap has narrowed. Most
scholars come from humble background. About two-thirds have parents who completed only high school and
parents of one-fourth completed only primary school. Most scholars are from Africa, followed closely by East
Asia and the Pacific region. The majority who were selected (73 percent) had previously worked in the public
sector. The rest were equally divided between nongovernmental organizations (NGOs), regional and
international organizations, and the private sector.
1

2
Host Regions and Academic Programs
Throughout the Program’s 20 years, scholarships have been awarded for studies in 150 universities in 32 World
Bank member countries. Five countries- France, Japan, the Netherlands, the United Kingdom, and the United
States- hosted 80 percent of JJ/WBGSP scholars. Historically, the United States has hosted the highest number of
scholars. However its share was cut from 53 percent during the first ten years of the program to 27 percent for the
second decade. At the same time, the shares of Japan and the Netherlands increased from 4 percent to 12 percent
for each country. Among the scholarships awarded during 1987-2006, 2,586 (73 percent) were in the Regular
Program and 968 (27 percent) under the Partnership Programs. Most of the scholars (89 percent) were studying for
Masters Degree studies. The scholars generally selected public administration and economics as their chosen fields.
From the mid-1990s, agriculture, infrastructure, environment and health; as well as development studies (including
gender and poverty reduction) have been popular choices.
Costs of the program
The average cost per scholar for the Regular Program was $ 41,000 for the most recent three cohorts of graduates.
The cost depends mainly on the level of tuition fees, on one hand, and on the stipend provided to scholars on the
other hand. Differences in costs among host countries are substantial ranging from a low $ 29,000 in Thailand to a
high of $ 57,000 in the United States. The costs of the Partnership Programs are constant and are fixed by the
current agreements between the universities and the JJ/WBGSP. The costs per scholar- including tuition,
subsistence and travel- range from US$20,000 in African partner universities to more than US$100,000 in US and
Japanese partner universities.
Degree Attainment
A total of 3,184 scholars have completed their studies by July 2006, of which 3,141, or an equivalent of 98.7percent
of the total attained their degree. The attainment rate has been improving over the years. That improvement can
be explained by a combination of (a) the discontinuation of scholarship awards to PhD candidates in 2000, for whom
the degree attainment rates were significantly lower than those for master’s degree scholars and (b) the increased
competitiveness of the program, which has resulted in better qualified scholars.
Around 90 percent of the respondents considered their improved technical and methodological skills, plus their improved
intercultural understanding and personal development through their academic program, to be high or very high.
Impact on Individual Scholars
Respondents to the tracer survey were asked to rate their personal benefits from the program in terms of recognition
of skills, higher progression in their existing job, progression into other jobs, and higher income. In this category,
three-fourths of the alumni ranked recognition of their skills as being very high or high, and their progress in the same
job was similarly rated by three-fifths of the alumni. Recognition through higher income was less favorably ranked;
because alumni who worked mostly for the public sector had to undergo inflexible and challenging rules and
regulations regarding salary increase and promotions. Alumni were also asked more specifically about the
program’s effect on their progression in their careers. Almost 76 percent of alumni confirmed that they had obtained
higher grades and more than 55 percent had been promoted.

3
Impact on Development Environment
The program’s impact on development is measured through three main indicators: residence status, employment
status and work relation to development issues. Almost 85 percent of the 812 respondent scholars returned either
to their home country (79.7 percent) or to other developing countries (4.8 percent). Moreover, the scholars who
reside in developing countries as measured in the past and previous years’ tracer studies show a continuous
increase from 71.4 percent in 1994 to 84.5 percent in 2006. Previous tracer studies have been instrumental in
adapting the program’s policy to ensure a higher effect from scholars returning to their home countries. Regular and
Partnership Programs show similar return rates among their alumni.
Overall, 93.2 percent of the respondents to the Tracer Survey 2006 were employed but 5.3 percent were continuing
further studies and 1.5 percent were unemployed. The employment shares are slightly higher for those alumni who
studied in the Partnership Programs. About three-fourths of the respondents who are employed live in Africa (30
percent), East Asia (21 percent), South Asia (12 percent), and Latin America (11 percent).
Most respondent alumni are employed at senior positions in government organizations and with public service
providers. Of the 757 of the respondent alumni who are employed; about half work for their respective governments.
Those government institutions include central government (41 percent); public sector providers (13 percent); and
regional and local governments (4 percent). More than one-fourth of employed respondents are working at
managerial and executive levels, and another one-fourth are working at the senior professional level. Those alumni
are in positions where they can influence public policy and the well-being of their communities. The experienced
alumni occupied most of the senior posts, as would be expected.
The respondent scholars found their newly acquired skills highly relevant to their countries’ needs. To further verify
and measure the effect of alumni contributions, the survey asked them to rank their perceptions about the relevance
of their current and overall professional activities to the development of their own country and of other developing
countries. About half of the respondents mentioned that at least three-fourth of their current and overall work related
to development of their own countries and one-fifth mentioned that three-fourths or more of their current and overall
work related to development of other developing countries.
Results, conclusions and recommendations
The main indicators show that the JJ/BGSP is achieving its goal at a reasonable cost. The overwhelming majority
of the scholars in fact attain their degrees, return to their countries, and engage in gainful employment that
contributes to the development of their countries, as shown in this report. Survey 2006 results, contacts with
alumni, anecdotal evidence and testimonials have shown that the positive results obtained through the program
have been sustained and the scholars continue to work, mostly at senior and executive levels, in areas that
contribute to development.
Some lessons can be learned from the process and recommendations, however. First, efforts toward tracking and
contacting the individual scholar and each of the alumni should be strengthened. The scaling-up program launched
in 2005 should be instrumental to that end because it creates a community of development practitioners and
facilitates a lifelong learning environment.
4
Second, continuous effort should be made to collect “before” as well as “after” graduation data which will improve
the analysis of the future tracer studies. For instance, the tracer survey should start when the scholarship is awarded
and should gather information related to the type of institution, nature of work, last position and ranks of the scholars
before their selection.
Third, although tracer studies have provided valuable indicators and have allowed the program to improve its
performance over the years, there is a need for a comprehensive evaluation of the program. It is recommended to
(a) undertake an external evaluation of the program that could be performed by the World Bank Institute’s
Independent Evaluation Group (WBIEG) and (b) cooperate with similar international scholarship programs in order
to set up benchmarks.
Fourth, impact indicators for the Partnership Programs are very similar to those for the Regular Program although
their costs are generally much higher. Therefore, there is a need to further evaluate individually the programs in
cooperation with partner universities.

Section 1. Introduction
• Program Background and Description
• Objective of the Study
• Organization of the Study
5

6
Section 1. Introduction
Program Background and Description
The Joint Japan/World Bank Graduate Scholarship Program (JJ/WBGSP) was initiated 20 years ago as part of a
special fund—the Policy and Human Resources Fund—that was set up by the government of Japan to
encourage and to strengthen the development of human resources in less-developed countries. The program’s mission
is to expose midcareer professionals in developing countries to the latest techniques and knowledge that are available
through graduate studies. Upon completion of their studies, the scholars are expected to return to their home countries
so they can apply and disseminate their newly acquired knowledge and skills to enhance the socioeconomic
development of their countries.
The JJ/WBGSP uses two schemes of operation to deliver its mission: the “Regular Program” and the
“Partnership Programs.”
The Regular Program
This program is very flexible and allows scholars from the World Bank member countries to study in a wide range
of universities from all around the world.1 (see example Williams College, box page 40.) The study areas have
included mostly public administration, development studies, public health, and agriculture. Although the program
used to provide scholarships for doctoral studies, its support has been limited to master’s degree studies since 2000.
The Partnership Programs
These programs enable the scholars to receive specialized graduate training in selected universities around the
globe.2 In 1992, a partnership was initiated with Columbia University (in the United States) to establish the Program
in Economic Policy Management (see box page 7). In 1994, two similar programs, one “Anglophone” and one
“Francophone,” were launched in cooperation with the African Capacity Building Foundation in McGill University
(in Canada) and in CERDI (at the Universite d’Auvergne in France, see box page 33), respectively, with a view to
transferring the programs to African universities. The African Economic Policy Programs were established in 1998
at Makerere University (in Uganda, see page 38) and at the University of Ghana in Legon for the Anglophone part,
and at the University of Yaounde II and the University of Cocody in Abidjan for the Francophone part.
The Partnership Programs in Japan, which started in 1995 at four universities, further manifest Japan’s commitment
to improving human resources in the developing world. Those programs draw on Japan’s expertise in specific areas.
The Tax Program, which involves Keio University, the National Graduate Institute for Policy Studies (GRIPS) and
Yokohama National University (see box page 14), provides for those professionals working in the field of tax
administration and related areas a program of rigorous academic training complemented by a practicum at the
National Tax Agency. The Infrastructure Management Program provides midcareer engineering professionals with
chances to study the management of infrastructure projects. The objective of the Program in Policy Management
at the University of Tsukuba is to provide training and the necessary skills for the conception, design, and execution
of development policies.
1 See the JJWBGSP Annual Report 2006 for a detailed list of the eligibility criteria. Also browse the program’s website atwww.worldbank.org/wbi/scholarships/.
2 Ibid.

7
Objective of the Study
Since 1994, a series of tracer studies has been undertaken to provide the government of Japan and the World
Bank with feedback on the status of program graduates and to continuously improve the program’s performance.
The purpose of this work was to trace the performance of the scholars and alumni of the JJ/WBGSP in terms of
the program-stated mission. That is, to award scholarships for graduate studies to well-qualified midcareer
professionals, who are then expected to apply and to disseminate the newly acquired knowledge and skills in
promoting the socioeconomic development of their own and other developing countries.
The 2007 tracer study, the seventh in this series, addresses the performance of the scholars during 1987–2006
by investigating whether they:
The Program in Economic Policy Management at Columbia University
In 1991, the World Bank and the School of International and Public Affairs at Columbia University cametogether to design an innovative new graduate program that is in economic policy management and isaimed at addressing the problems within developing and transition countries. This initiative programresponded to an increasingly evident need to increase the capacity of policymakers in various countriesso they could design sound policies in all areas of economic and development policy.
Over the past 16 years, the Program in Economic Policy and Management (PEPM) has trained close to700 students in critical analytical skills such as microeconomic and macroeconomics analysis,econometrics, financial and public management, political economy, and development economics.Among those students, 299 have benefited from generous scholarships offered by the JointJapan/World Bank Graduate Scholarship Program (JJ/WBGSP). Many students would have had nooption of attending Columbia University without such assistance. The ongoing dialogue betweenColumbia University and colleagues at the World Bank has led to a continual reshaping of the program’scurriculum and focus, thereby ensuring that Columbia’s training meets the needs of policymakers in thetarget audience.
We at Columbia are gratified that the success of the PEPM has served as an inspiration and model forsimilar programs at other universities that are throughout the world and are affiliated with the WorldBank. Our success has had several dimensions. Most of our alumni return to their home countries afterobtaining their degree and immediately assume positions of greater responsibility. Within the group ofJJ/WBGSP scholars, for instance, PEPM alumni occupied or currently occupy the posts of ViceGovernor of the Central Bank of Moldavia, Secretary to the King of Bhutan, chairman of the BudgetCommittee in the Parliament of Mongolia, and member of the Board of Directors of the Czech CentralBank. Our alumni are also connected to each other and other graduates of the school in an ever-growing network of top policymakers that stretches across the globe, thus promoting bettercommunication among governments and a better flow of ideas across borders.
The JJ/WBGSP’s recent scaling-up initiative has greatly aided our efforts in this area as it hasbroadened and deepened the network by linking our students to those of other universities. Finally, wehave created a community of life-long learners and teachers. Several of our alumni have returned toPEPM to give lectures about their policymaking experiences, and one alumnus regularly teaches acourse on fiscal federalism, thereby building on his work in that area.

8
• attained their degrees successfully and benefited from their academic programs;
• returned to their home country or other developing countries;
• achieved recognition for their enhanced skills, progression and mobility, higher income, and better grades and
promotion in their jobs;
• engaged in senior professional and managerial positions that provided them with the opportunity to
disseminate their newly acquired skills and knowledge; and
• contributed to the overall socioeconomic development of their own country or of other developing countries.
In addition, the current study discusses the salient cost considerations associated with each scholar’s program of study.
Organization of the Study
The study is organized in seven sections. The first two sections set the stage in tracing and evaluating the
performance of the scholars and alumni. Section 1 gives a brief description and historical background of the
program, the objective of the study, and organization of the report. Section 2 presents the methodology of the
study including a description of databases, tracer survey and type of indicators used.
The next three sections analyze and trace the performance of the scholars and alumni in terms of input, output
and impact indicators. Section 3 discusses the Program’s “inputs” by showing the profiles of the JJ/WBGSP
applicants and scholars; the academic programs attended by JJ/WBGSP scholars; and the average costs of
scholarships.
Section 4 measures the “output” of the Program in terms of capacity enhancement of the Program graduates.
That is, the individual scholars’ capacity enhancement through completing and attaining the degrees for which
the scholarships were awarded; and through the skills acquired by scholars through their academic programs.
Section 5 analyzes the impact of the Program. First, the impact on the individual scholars is analyzed in terms
of recognition for their enhanced skills at work, added mobility within and across jobs, higher income and grades,
and promotion. Second, the impact on the socio-economic environment is analyzed at the time, when the
scholars returned to their home or other developing countries; obtained employment, especially at senior
professional, and managerial and executive levels; and applied their newly acquired skills at work.
Finally, section 6 discusses the results and outlook of the Program, and presents conclusions of recommendation
for enhancing the effectiveness of the Program.
Sid Naing is managing the CARE Health Program in Myanmar.I am currently working for CARE International, a nongovernrnental organization that is primarily of a relief
nature, but I am also working in development and health in Myanmar. In that position, I am responsible for
managing the health program. We currently have approximately five projects running with 40 full-time staff
members and a few hundred people who are semi-volunteers in the program. The program’s focuses are on
reproductive health, AIDS, and community health care and promotion. I'm glad that I could put to use the skills
and knowledge I obtained as a result of being granted the scholarship.

Section 2. Methodology of Analysis
• Databases
• Tracer Survey
• Indicators
9
Section 2. Methodology of Analysis
Databases
Scholars and alumni databases that cover 3,554 scholarships awarded during 1987–2006 are used in various parts
of this study, especially in presenting the profile of scholars as input indicators. Moreover, a comprehensive survey
was initiated in 2006 (Tracer Survey 2006) to trace the alumni who completed the program. That survey provides a rich
source of data to complement the regular databases of the program, and it was used to analyze and trace the scholars’
performance, especially in areas related to residence status, employment, and impact on development.
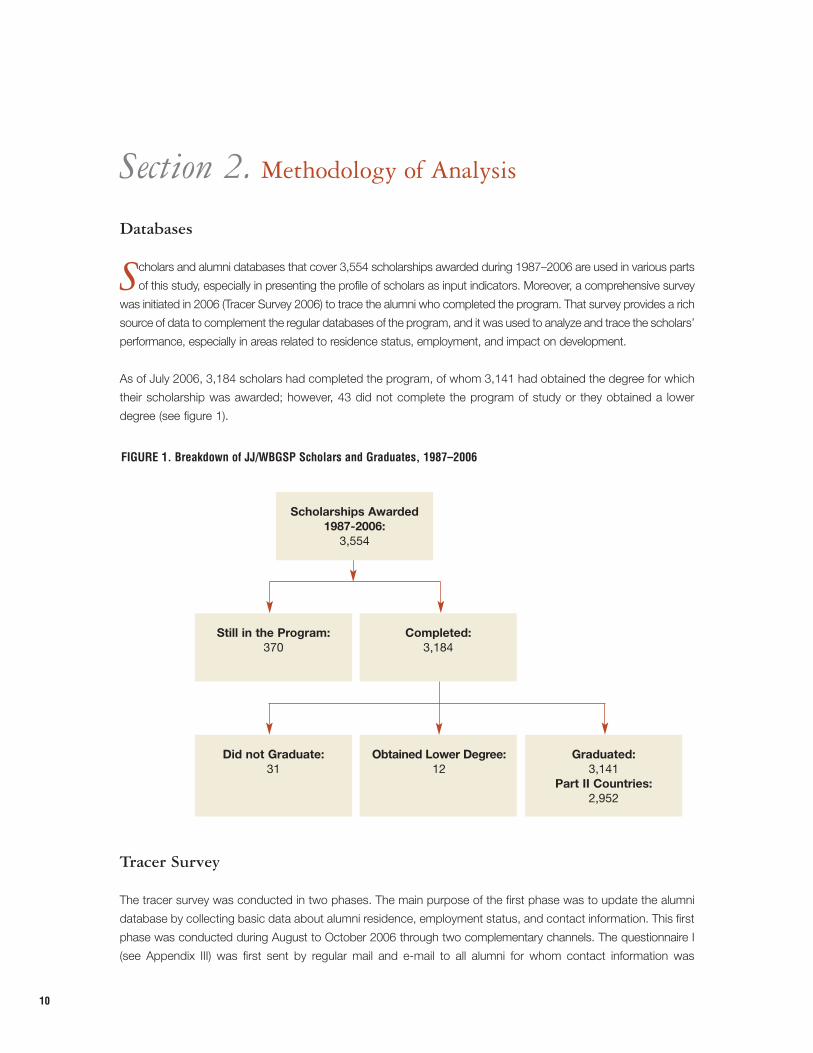
As of July 2006, 3,184 scholars had completed the program, of whom 3,141 had obtained the degree for which
their scholarship was awarded; however, 43 did not complete the program of study or they obtained a lower
degree (see figure 1).
Tracer Survey
The tracer survey was conducted in two phases. The main purpose of the first phase was to update the alumni
database by collecting basic data about alumni residence, employment status, and contact information. This first
phase was conducted during August to October 2006 through two complementary channels. The questionnaire I
(see Appendix III) was first sent by regular mail and e-mail to all alumni for whom contact information was
10
FIGURE 1. Breakdown of JJ/WBGSP Scholars and Graduates, 1987–2006
Scholarships Awarded1987-2006:
3,554
Still in the Program:370
Completed:3,184
Did not Graduate:31
Obtained Lower Degree:12
Graduated:3,141
Part II Countries:2,952

available4. The questionnaire was also posted on the program’s website and was forwarded to the main host
universities, which, in turn, were requested to update the information related to their respective alumni.
The total number of respondents to the first phase of the survey reached 812 alumni, or 27.5 percent of the
alumni who were from Part II countries and who had successfully completed the program. Although the total
respondents to Tracer Study VII (812) is the highest among all previous tracer studies, the overall response rate
has been decreasing since the first study in 1994 (see table 1).
A low response rate is a common characteristic of tracer studies. This low rate is generally caused by the lower
responsiveness of alumni who are from older cohorts and who tend not to update their contact information on a
regular basis. Almost one-third of the e-mails sent (594 of 2,127 e-mails) were rejected because the recipients
were not recognized; very few alumni responded to the 702 questionnaires sent through the regular mail. The
lower response rate for older cohorts is shown in figure 2.
11
0 500 1000 1500
Cohorts 2002–2006
Cohorts 1997–2001
Cohorts 1988–1996
509 849
262 653
41 638
Respondents Non-Respondents
POPULATION, RESPONDENTS AND RESPONSE RATES TRACER STUDIES I TO VII
TABLE 1
T R A C E RS T U D Y
Cohorts Cases Respondents Response RateI Classes 87–90 234 177 75.6%II Classes 87–91 283 213 75.3%III Classes 87–92 424 212 50.0%IV Classes 87–95 641 297 46.3%V Classes 87–96 1075 252 23.4%VI Classes 87–98 1479 494 33.4%VII Graduated 1988–2006 2952 812 27.5%
C O V E R A G E
Source: JJ/WBGSP Tracer Studies I to VI, Tracer Survey 2006.
FIGURE 2. Respondents to Tracer Survey per Cohort
Source: JJ/WBGSP Tracer Studies I to VI, Tracer Survey 2006.
4 Questionnaires were sent by e-mail to 2,127 alumni and by regular mail to 724 alumni.

12
The second phase of the survey, which addresses qualitative aspects of the study such as the perception of
the program’s benefits, was undertaken during November 2006–February 2007. The questionnaire II was
posted on the program’s website and was forwarded to the alumni who did respond to questionnaire I. A total
of 348 alumni responded to this part. They represent 42.9 percent of the respondents who responded to first
part and 11.8 percent of the total number of alumni.
In addition, in order to incorporate the cohort impact, the survey grouped respondents in three clusters
according to their years of graduation. Cluster 1 alumni had completed and graduated from their scholarship
programs at least 10 years earlier, Cluster 2 alumni had completed their program 5–10 years ago, and Cluster 3
alumni had graduated fewer than 5 years ago. The demographic profile of the three clusters is given in table 2.
COHORT CLUSTERS PROFILETABLE 2
N U M B E R O F C A S E S A V E R A G E VA L U E S
Source: JJ/WBGSP Tracer Survey 2006.
Male Female Total Age Number of Years after GraduationCluster 1: Graduated 1988-1996 29 12 41 48.4 13.0
Cluster 2:Graduated 1997-2001 171 91 262 41.8 6.7
Cluster 3:Graduated 2002-2006 325 184 509 36.8 1.7
TOTAL 525 287 812 39.0 3.9

13
Indicators
Three types of indicators are used to measure the benefits and costs associated with the program in relation to
the JJ/WBGSP mission. First, input indicators, measure the resources and processes by which the program is
implemented. For instance, the number of application received and processed, number of finalists identified,
and number of scholars selected including their profile, as well as the host institutions and areas of study
chosen. Costs associated with the program’s implementation are also analyzed as part of input indicators.
Second, output indicators measure (a) to what extent the program is delivering its output and (b) whether the
use of inputs from the program has resulted in the desired output. Such outputs would include the number of
scholars who attained their degree and the skills that the scholars acquired by benefiting from the academic
programs, including forming skills in technical, methodological, communication, and negotiations areas, as well
as by their developing personal and intercultural understanding.
Third, impact or outcome indicators assess the effectiveness on the overall socioeconomic development of the
scholars’ countries. For instance, the impact on individual scholars and on development environment might be
considered as proxies. The indicators show the extent that scholars use their enhanced knowledge and the
skills that were acquired both to perform their jobs and to disseminate to others through on-job training and
networking. They also show the number of graduate scholars who returned to their home or to other
developing countries; the number of graduate scholars who gained employment in senior positions in the
public sector, academia, nongovernmental organizations, and the private sector; and the number who were
able to use their enhanced professional and academic strengths and effectiveness in performing their
developmental duties.
Some of the indicators use self-assessment by graduates to measure the perception of benefits and
usefulness of the program. For instance, each will assess the beneficiary benefit of the academic program, the
higher income and higher progression in the same job or the improved mobility in obtaining other jobs, the
recognition for enhanced skills in beneficiary organizations, and the perception of the relevance of enhanced
skills to the developing countries’ needs. Those types of qualitative indicators are used both under output
indicators and under impact or outcome indicators.
In addition, to the extent that data permit, the analysis is conducted in before and after modes. For instance, it
is extremely useful to compare the pattern of initial organizations for which the candidate worked versus the
pattern of those organizations to which the graduate returned to work.

14
The Tax Program in Japan
The tax program was established in 1996 in partnership with Yokohama National University, Keio
University, and Saitama University (all in Japan). The latter was transferred in 2000 to the National
Graduate Institute for Policy Studies. The program provides professionals who are working in the
field of tax administration and related areas with rigorous academic training that is aimed at
developing an understanding of the theoretical, empirical, and institutional aspects of tax and
customs administration. A practicum at the National Tax Agency or the Customs Training Institute
complements the formal learning by providing hands-on experience in a tax- and customs-related
work environment. By the end of 2005, 129 midcareer professionals from 45 countries were
graduated by the three programs. However, more than half of them came from nine countries:
Indonesia (15), China (10), Mongolia (10), the Philippines (7), Pakistan (6), Ghana (5), India (5), Nepal
(5), and Tanzania (5).
Almost half (61 of 129) of the tax program alumni responded to the tracer survey: 57, or 93.5
percent, of them were working in their home countries; 3 were continuing further studies at the
doctoral level; and 1 was working for a financial institution in a Part 1 country. Most of the alumni
(55, or 90 percent) who responded to the survey were working for their respective governments at
the central or regional level. Unsurprisingly, most of them (43, or 70 percent ) were working for tax
and customs departments. The case of Indonesia is worth mentioning because 12 graduates from
the tax program are now working at the Directorate General of Taxes. Although all tax program
alumni have fewer than 10 years of post-program professional experience, almost 51 percent of
the respondents held managerial positions in their institutions, and a few reached the executive
level. Such cases include the Deputy Minister of Economy in Georgia and the Second Secretary of
the National Board Revenue in Bangladesh.
Yam Nath Sharma works at the National Planning Commission of Nepal.I was fortunate enough to have the opportunity to graduate in Public Policy and Taxation (PPT) as part of the
master’s program from Yokohama National University in 2000. Those two years of study in Japan were the
most productive parts in my life in terms of learning, building confidence, and making friends. My participation
in the program turned out to be a new beginning for my career.
On my return to my home country of Nepal, I was posted at the training center under the Ministry of Finance
as a revenue instructor. Later, I was transferred to the Ministry of Finance with assignments as a special deputy.
After being promoted, I am now working at the National Planning Commission Secretariat. The habit of working
hard and appreciating the hard work of others that I learned from studying in Japan will always help me to
succeed in any organization. I have initiated a number of activities toward achieving public sector reform, the
results of which are yet to be seen.

Section 3. Input Indicators: Selection Process,
Scholars’ Profile, and Academic Program
• Selection and Awards Process
• Scholars’ Profile
• Host Regions and Academic Programs
• Costs of the Program
15

FIGURE 3. Average Age of Awardees, 1987–2006
Year
28
29
30
31
32
33
34
35 Average age
2006200420022000199819961994199219901988
Ag
e
16
Section 3. Input Indicators: Selection Process; Scholars’ Profile; and Academic Program
Selection and Awards Process
Selection of JJ/WBGSP awardees takes different patterns for the Regular Program and for the Partnership Programs.
For the later, the selection process is undertaken mainly by partner institutions, which submit to the JJ/WBGSP
Steering Committee a short list of preselected candidates. Applications for the Regular Program are, however, submitted
directly to the program’s Secretariat, which undertakes several levels of screening, including an evaluation by external
reviewers (see Appendix II for JJ/WBGSP eligibility and selection criteria).
Eligible applications are assessed according to three main factors: academic excellence, professional experience, and
relevance of program of study. Priority is given to candidates from the public sector who have a high potential to affect
the development within their own countries after completion of their studies. To the extent permitted by program
requirements and selection standards, the JJ/WBGSP seeks (a) to maintain a reasonably wide geographical distribution
of awards and to give priority to applicants from low income countries; (b) to support promising female candidates; (c) to
give priority to those candidates who, other things equal, have limited financial resources; and (d) to encourage studies
in line with the Millennium Development Goals.
During 1987–2006, the Secretariat received a total 51,863 applications. Roughly half of them were ineligible for the
scholarship. The most frequent ineligibility criteria have been incomplete application, ineligible field of study, and insufficient
work experience. The scholarship award is highly competitive, and the ratio of awards per eligible candidate has been
decreasing over the past years: from 12 percent in 2001 to 8 percent in 2006.
Scholars’ Profile
The JJ/WBGSP awarded 3,554 scholarships during 1987–2006. Most scholars were in the 30 to 34-year-old range
when awarded the scholarship. However, the trend is for selecting older and hence more experienced scholars (see table
3 and figure 3). This trend is the result of the program’s emphasis on sponsoring midcareer professionals.

17
Although female scholars are historically
outnumbered by males, the gap has narrowed
over the years (see table 3 and figure 4). The
number of female scholars peaked in 2002 to
about 48 percent and then remained around
45 percent for later years. This improvement,
especially compared to late and early 1990s,
has been the result of special efforts on behalf
of the program to look for qualified female
candidates for awarding scholarships. The
scholars come mostly from humble back-
grounds. More than two-thirds of their parents
completed only high school, and one-fourth
completed only primary education (see table 3).
Most of the scholars are from Africa, followed
closely by scholars from East Asia and the
Pacific region. Those two regions include some
of the poorest countries of the world, and skilled
human resources are acutely scarce. Middle
East and North Africa is the least represented
region, which may be the result of a lack of
readily available information about the program
and its requirements in those countries. The
majority of the scholars selected (74 percent)
previously worked in the public sector during
2000–06. The rest were equally divided among
NGOs, regional and international organizations,
and the private sector (see table 3).
FIGURE 4. Share of Female Scholars
Year
0
0.1
0.2
0.3
0.4
0.5
0.6
2006200420022000199819961994199219901988
3554
a Average 1987–2006.b Average 2000–06.Source: JJ/WBGSP scholars database.
SCHOLARS PROFILE
TOTAL CASESAgea
Average Age of Scholar (as applicant)Poverty Index: Education of Parentsb
No EducationPrimary EducationHigh School Education Greater than High School Education
Gendera
MaleFemale
Home Regionsa
AfricaEast Asia and PacificEurope and Central AsiaLatin America and CaribbeanMiddle East and North AfricaSouth AsiaIndustrialized Countries
Employment Categoryb
Public SectorPrivate SectorR/IONGOOther
CountriesDeveloping CountriesIndustrialized Countries
32.39
21.0%22.0%27.0%30.0%
67.0%33.0%
33.0%18.0%9.0%
14.0%5.0%
13.0%8.0%
74.0%7.6%8.1%8.7%1.3%
91.7%8.3%
TABLE 3
Host Regions and Academic Programs
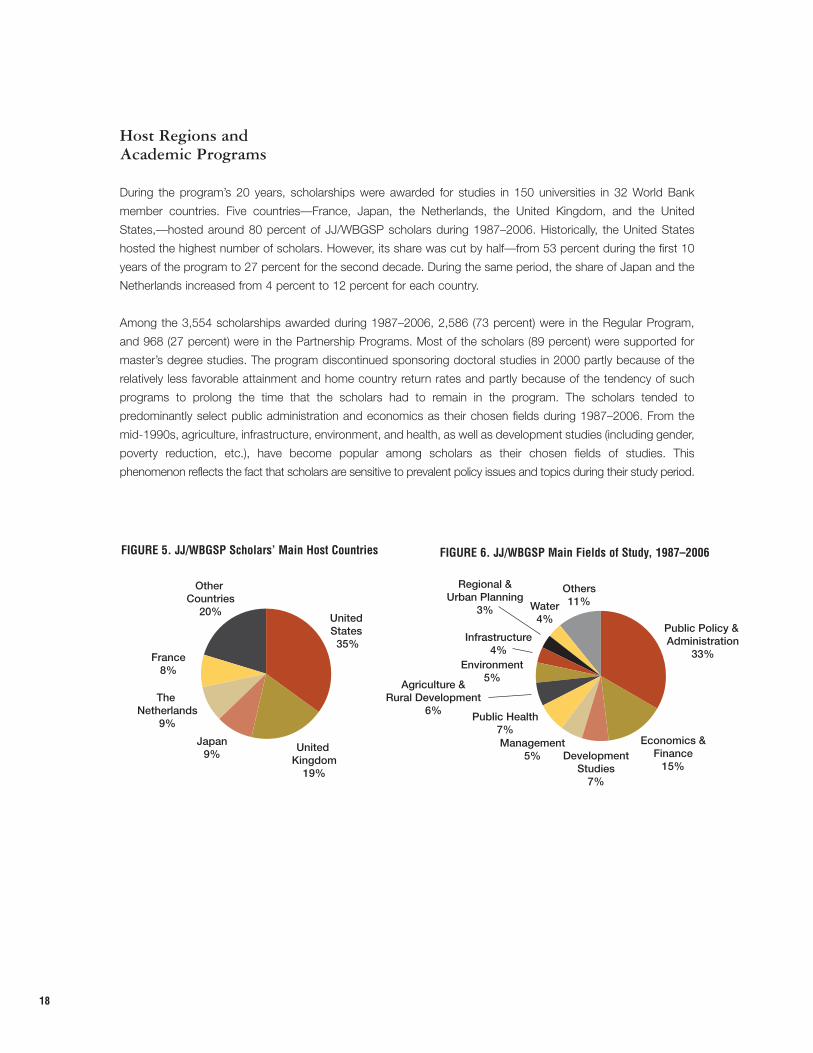
During the program’s 20 years, scholarships were awarded for studies in 150 universities in 32 World Bank
member countries. Five countries—France, Japan, the Netherlands, the United Kingdom, and the United
States,—hosted around 80 percent of JJ/WBGSP scholars during 1987–2006. Historically, the United States
hosted the highest number of scholars. However, its share was cut by half—from 53 percent during the first 10
years of the program to 27 percent for the second decade. During the same period, the share of Japan and the
Netherlands increased from 4 percent to 12 percent for each country.
Among the 3,554 scholarships awarded during 1987–2006, 2,586 (73 percent) were in the Regular Program,
and 968 (27 percent) were in the Partnership Programs. Most of the scholars (89 percent) were supported for
master’s degree studies. The program discontinued sponsoring doctoral studies in 2000 partly because of the
relatively less favorable attainment and home country return rates and partly because of the tendency of such
programs to prolong the time that the scholars had to remain in the program. The scholars tended to
predominantly select public administration and economics as their chosen fields during 1987–2006. From the
mid-1990s, agriculture, infrastructure, environment, and health, as well as development studies (including gender,
poverty reduction, etc.), have become popular among scholars as their chosen fields of studies. This
phenomenon reflects the fact that scholars are sensitive to prevalent policy issues and topics during their study period.
18
OtherCountries
20%United States35%
United Kingdom
19%
Japan9%
The Netherlands
9%
France8%
Public Policy & Administration
33%
DevelopmentStudies
7%
Economics &Finance
15%
Management5%
Agriculture &Rural Development
6% Public Health7%
Environment5%
Infrastructure4%
Regional &Urban Planning
3% Water4%
Others11%
FIGURE 6. JJ/WBGSP Main Fields of Study, 1987–2006 FIGURE 5. JJ/WBGSP Scholars’ Main Host Countries

AVERAGE COSTS OF SCHOLARSHIPS FOR SELECTED HOST COUNTRIES
(REGULAR PROGRAM)
TABLE 4
D U R AT I O N O F S T U D Y 2 0 0 2 2 0 0 3 2 0 0 4 B R E A K D O W N 2 0 0 4
Tuition Subsistence TravelUnited States 12–24 months 52,039 62,149 57,233 32,916 22,146 2,170
Europe United Kingdom 12 months 38,217 38,984 39,529 18,197 19,501 1,829France 12–14 months 31,667 39,365 40,711 16,562 21,165 2,984The Netherlands 12–18 months 15,327 24,507 30,716 7,903 20,525 2,289Belgium 12–24 months 19,785 20,840 35,861 18,112 14,826 2,924
Australia 24 months 53,165 43,556 46,304 20,029 24,687 1,589
Asia Thailand 24 months 29,715 30,248 26,418 8,365 17,750 303
Latin America Chile 24 months 28,698 7,596 20,805 297
AVERAGE COST 37,123 41,487 40,917 18,161 20,627 2,129
19
Costs of the Program
The cost per scholarship is an indicator of the average investment made in the scholars. Average cost was
calculated for scholars who started the program during 2002–04 and who graduated between 2003 and 2006. The
average cost for the Regular Program was around US$41,000 for the past three cohorts of graduate. That cost
depended mainly on the level of tuition fees (US$18,161 on average for scholarships awarded in 2004) on the one
hand and on the stipend provided to scholars (US$20,267) on the other hand. Differences in costs among host
countries are substantial with a low of US$28,700 in Thailand to a high of US$57,200 in United States. This variance
is caused mainly by the level of tuition fees, which are four times higher in the United States than they are in Thailand.
The costs of the Partnership Programs are constant and are fixed by the current agreements between the
universities and the JJ/WBGSP. The costs per scholar, including tuition, subsistence, and travel, range from
US$20,000 in African partner universities to more than US$100,000 in U.S. and Japanese partner universities.
Source: JJ/WBGSP scholars database and financial statements.
PARTNERSHIP UNIVERSITIESCOST MATRIX (2000–2006)
TABLE 5
U.S. Universities $ 52,500–110,000 12–15 14–21Japanese Universities $ 77,369–110,725 5–15 24African Universities $ 20,000 7 18
PA RT N E R S H I PU N I V E R S I T I E S
C O S T P E RS C H O L A R T O
O B TA I N D E G R E E *
# O F S C H O L A R SP E R Y E A R P E R
U N I V E R S I T Y
L E N G T H O FS T U D Y P R O G R A M
( M O N T H S )

Meynar Sihombing established a business to create employment for unemployed villagers in Indonesia.I graduated in June 2002 from the International University of Japan (IUJ) at Niigata after studying in the
International Development Program. My research interest was in SME and microfinance development
issues. Before studying at IUJ, I worked for a private local bank in my country, Indonesia, for nearly 11
years. My expertise is in trade finance and international banking business.
As some of us have experienced, I discovered that finding the right job and organization to work with is
not easy. For a while, I felt disappointed, but I finally decided that I could not simply wait for some
institutions and organizations to hire me. Instead, I could do small things. So I took a step and recently
started my own activities in development of SE's and microfinance business. My organization’s focus is
on establishing business that would create employment for unemployed villagers. Currently, we produce
different sizes of various wood flooring and mosaic wood tile. We export to Singapore and China, and I
hope we can expand to many other developing countries as well.
20

Section 4. Output Indicators:
Completion and Skills Enhancement
• Degree Attainment
• Skills Enhancement
21

Section 4. Output Indicators: Completion and Skills Enhancement
Degree Attainment
Degree attainment by scholars is one of the output indicators used to measure the capacity enhancement of those
scholars. Of the 3,554 scholars in the program during 1987–2006, 370 are still studying, and 3,184 scholars
have completed their studies, of which 3,141 (equivalent of 98.7 percent of total) have attained their degree. In addition,
the attainment rate has been improving over the
years. This improvement can be explained by the
combination of (a) the discontinuation of
scholarship awards to PhD candidates in 2000,
for whom the degree attainment rates were
significantly lower than for those who were
studying for master’s degrees, and (b) the
increased competitiveness of the program,
which resulted in better qualified scholars.
Among the 43 scholars (1.3 percent of total) who
did not attain their degrees, 7 were deceased or
unable to continue for medical reasons. The
others were recalled by their governments,
remained in all courses but did not finish their
PhD dissertation, received degrees other than a
master’s, or did not register their degree
attainment (see table T.1 in Appendix I).
Skills Enhancement
The scholars are expected not only to improve their skills and knowledge but also to gain the new perspectives and
insights that they will need to assist in their countries’ development. They are also expected to increase their academic
and professional knowledge, to develop useful communications and negotiation skills, and to gain intercultural
understanding during their study period—an awareness that may be used as a conduit for new information and for
innovation exchange and dissemination. In addition, they may take advantage of being part of an alumni community
of both host universities and the JJ/WBGSP, and they may participate in educational and other activities that are now
facilitated through the Internet and the Scaling-up program conferences and workshops.
22
TABLE 6 TRENDS IN ATTAINMENT RATE
ATTAINMENT RATE
93.8%
93.9%
91.6%
95.4%
96.8%
97.3%
98.7%
TRACER STUDY
I
II
III
IV
V
VI
VII
Source: JJ/WBGSP Scholars database.
98.7% ATTAINED THEIR DEGREE

23
Scholars were asked to rank their perceptions of the training gained through the program on a progressive scale from
“very poor” to “very high.” Those alumni were first asked to assess the impact of the academic programs on improving
their skills. Around 90 percent of the respondents considered the improvement of their technical and methodological
skills, as well as their intercultural understanding and personal development, as being high or very high (see figure 7).
Appreciation of improving their communication and negotiation skills was rated slightly lower by scholars (80 percent
used high or very high ratings).
The alumni were also asked to rank the usefulness to their work of the studies supported by the JJ/WBGSP. They
were requested to rate the overall academic program, as well as its main aspects in terms of courses and research
undertaken, network forged, and experience shared. Almost 90 percent of the alumni considered the overall
usefulness of the programs to be very high and high, especially when examining the courses they had undertaken
(see figure 8). This rating is consistent with the emphasis put on the technical and methodological skills that were seen
as the main benefits gained from the program.
0 20 40 60 80 100
Very Poor
Poor
Fair
High
Very High
Personal development
Intercultural understanding
Comm/Negociation skills
Methodological skills
Technical skills
FIGURE 7. Rating of Benefits Gained through Studies Supported by JJ/WBGSP
0 20 40 60 80 100
Very Poor
Poor
Fair
High
Very High
Experience sharing
Networks
Research
Courses
Overall Program
FIGURE 8. Rating of Usefulness at Work of Studies Supported by JJ/WBGSP

24
Mary Onyango currently works at Maseno University in Kenya and carries out research on African indigenous vegetables.I was a JJ/WBGSP scholar in 1992 at the University of London where I studied for a doctorate degree in
horticulture, graduating about 10 years ago. I am currently working at Maseno University in my home country,
Kenya. I am happy to say that despite all the problems we have in our countries, it is very gratifying to feel that
I am contributing in my own small way to the development of my country.
As a result of the training and skills I received during my studies in the United Kingdom, I am involved in
training young scholars in the field of horticulture. Kenya is an agricultural country and depends a lot on the
horticultural sector for foreign exchange. In addition to teaching at the university, I also carry out research on
vegetables, with a particular interest in African Indigenous vegetables. Such vegetables are some of the food
plants that have great value and potential and that could play a major role in the livelihoods of the many rural
communities in my country.

Section 5. Outcome Indicators:
Impact on Individual Scholars,
and on Development Environment
• Impact on Individual Scholars
• Impact on Development Environment
25

26
Section 5. Outcome Indicators - Impact on IndividualScholars; and on Development Environment
Impact on Individual Scholars
The alumni were asked to rank their personal benefits from the program in terms of recognition of skills, higher
progression in their existing job, progression into other jobs, and higher income. In this overall category,
three-fourth of the alumni ranked the recognition of their skills as being very high or high, and progress in the
same job was similarly ranked by three-fifth of the alumni (see figure 9). Recognition through higher income was
less favorably ranked, because alumni who worked mostly for the public sector had to undergo inflexible and
challenging rules and regulation regarding any salary increases and promotions.
The alumni were asked more specifically about the program’s impact of their progression in their careers in terms
of (a) higher grades or ranking and (b) promotion or higher positions. Almost 76 percent confirmed that they had
obtained higher grades, and more than 55 percent had been promoted. As expected, most promotions were
obtained by older respondent graduates (with an average age of 48.8 years) who had been in their countries the
longest (an average of 13 years). Of this group (Cluster 1), 88 percent stated they had received a higher grade,
and 69 percent mentioned that they had received a promotion after the JJ/WBGSP scholarship (see table 7).
Furthermore, most of the youngest alumni (with an average age of 36.8 years) have been back in their countries
an average of fewer than 2 years (see table 2) and have yet to insert themselves fully in the cadre of the previous
0 20 40 60 80 100
Very Poor
Poor
Fair
High
Very High
Higher income
Mobility acroos jobs
Progression in same job
Recognition of skills
FIGURE 9. Rating of Individual Professional Benefits
Source: JJ/WBGSP Survey 2006
75.6% OBTAINED HIGHERPROFESSIONAL GRADES

environment and a new work environment, especially in the public sector where most of them now work after the
program. Nevertheless, 76 percent of this group registered having received a higher grade, and 55 percent registered
having been given a promotion after the JJ/WBGSP (see table 7). The slight difference between the two younger
groups (Clusters 2 and 3) might indicate that for many alumni it takes 10 years or more to see the true impact of their
studies on their career’s progression.
Impact on Development Environment
The impact of the program on development environment is measured through three main indicators:
1.Residence status. By returning to their home countries, alumni ensure that the human capital accumulated
through the program is available so they can contribute to the development of their respective countries. Those
alumni who are residing in a developing country other than their own are also considered as contributing to the
enhancement of human capital in the developing world.
2.Employment status. Employment indicators such as employment status, type of employer institution, and professional
position provide an indication about the contribution of the human capital accumulated through the program.
3.Link to Development. The alumni’s perception of the direct link of their work to development issues is another
indicator of the focused positive impact of the program.
Residence Status
The share of alumni who are residing in a developing country (RDC) is a major indicator that measures the impact of
the program on the development environment. Almost 85 percent of the 812 respondent scholars returned either to
their home country (79.7 percent) or to another developing countries (4.8 percent). There was no significant difference
27
PROFESSIONAL PROGRESSION PER CLUSTER TABLE
7
Yes No NA Total Yes No NA TotalCluster 1 Cases 14 2 0 16 11 4 1 16
% within Group 87.5% 12.5% 0.0% 100.0% 68.8% 25.0% 6.3% 100.0%Cluster 2 Cases 73 22 4 99 54 40 5 99
% within Group 73.7% 22.2% 4.0% 100.0% 54.5% 40.4% 5.1% 100.0%Cluster 3 Cases 176 49 8 233 128 94 11 233
% within Group 75.5% 21.0% 3.4% 100.0% 54.9% 40.3% 4.7% 100.0%TOTAL Cases 263 73 12 348 193 138 17 348
% within Group 75.6% 21.0% 3.4% 100.0% 55.5% 39.7% 4.9% 100.0%
Source: JJ/WBGSP Tracer Survey 2006.
H I G H E R G R A D E I N P R O M O T I O N W O R K A F T E R J J / W B G S P A F T E R J J / W B G S P
84.5% ARE WORKING IN THEIR HOME COUNTRIES OR ANOTHERDEVELOPING COUNTRY

between the RDCs for male and female alumni. Such rates were, however, much higher (80 percent) for the alumni
who had graduated from a master’s program than for the PhD graduates (60 percent). This difference, moreover,
narrows when the return rates to other developing countries are included and becomes 84.6 percent and 73.3
percent, respectively (see table 8).
Furthermore, the RDCs as measured
in previous years’ tracer studies
show a continuous increase (see
table 9). Previous tracer studies have
been instrumental in adapting the
policy of the program so it could
ensure a higher positive impact.
Major measures taken by the
program include (a) discontinuing the
award of scholarships for PhD
studies, (b) establishing the employ-
ment restriction policy that limits
employment opportunities at inter-
national organizations, and (c) better
targeting of scholars who are the
most likely to return to their home
countries by having the selection
focus especially on candidates coming
from the public sector.
28
RESIDENCE STATUS PER GENDER AND DEGREE (PERCENTAGE)TABLE
8
Master’sFemale 79.9% 3.6% 15.8% 0.7% 100.0%Male 80.8% 4.6% 13.3% 1.4% 100.0%TOTAL 80.4% 4.2% 14.2% 1.2% 100.0%
PhD Female 66.7% 11.1% 22.2% 100.0%Male 57.1% 14.3% 28.6% 100.0%TOTAL 60.0% 13.3% 26.7% 100.0%
TOTALFemale 79.4% 4.5% 15.3% 0.7% 100.0%Male 79.8% 5.0% 13.9% 1.3% 100.0%
Cases 647 39 117 9 812% 79.7% 4.8% 14.4% 1.1% 100.0%
Own Other Part Part 1 country 2 country country Unknown Total
DEGREE RESIDENCE STATUS
TABLE 9
RESPONDENTS AND RDC* TRACER STUDIES I TO VII
RESPONDENTS
177
213
212
297
252
494
812
TRACER STUDY
I
II
III
IV
V
VI
VII
Source: JJ/WBGSP Tracer Studies I to VI and Tracer Survey 2006.*Return to Developing Country rate
RDC
71.4%
71.8%
74.1%
75.9%
79.9%
82.4%
84.5%
Source: JJ/WBGSP Survey 2006.

Alumni who graduated at least 10 years ago (Cluster 1) have a lower RDC than among younger alumni (see figure
10). This conclusion is consistent with the increase in RDC observed over time.
Both the Regular and Partnership Programs show similar return rates among their alumni (see table 10). This
similarity is relatively surprising because one should expect higher return rates for the Partnership Programs as
a result of their specific focus.
Of the 117 respondents who are residing in a developed country, 32 alumni, or 27 percent, are pursuing further
studies that are mostly at the doctoral level; they will probably return to their home country after eventually
completing their studies. Few of them (4 alumni, or 3.4 percent) are residing temporarily in a developing country
because they are representing their own countries abroad. About 14 percent work in international organizations
where they deal mostly with development issues (see figure 11).
29
0% 10% 20% 30% 40% 50% 60% 70% 80% 90% 100%
Cluster 3
Cluster 2
Cluster 1 Status unknown
Residing in developed country
Residing in other developing country
Residing in Home Country
FIGURE 10. RDC per Cluster.
RESIDENCE STATUS PER PROGRAM TYPETABLE
10
Regular Program Cases 423 26 75 6 530% 79.8% 4.9% 14.2% 1.1% 100.0%
Partnerships Cases 224 13 42 3 282% 79.4% 4.6% 14.9% 1.1% 100.0%
TOTAL Cases 647 39 117 9 812% 79.7% 4.8% 14.4% 1.1% 100.0%
Own Other Part Part 1 country 2 country country Unknown Total
PROGRAM TYPE RESIDENCE STATUS
Source: JJ/WBGSP Survey 2006.

EMPLOYMENT PER CLUSTERTABLE
11
Source: JJ/WBGSP Survey 2006.
CLUSTER EMPLOYMENT
30
Employment after Return to Home Country
Overall, 93.2 percent of the respondents to Tracer Survey 2006 were employed, 5.3 percent were continuing further
studies, and 1.5 percent were unemployed (see figure 12).
Unemployed alumni are mostly (11 out of 12) from the younger group (Cluster 3), which is possibly because of the frictional
unemployment of their just returning to their countries and adjusting to a home environment after their studies. Some
alumni sustained their employment for long periods after returning home. Thus, employment ratios progressively increase
for the groups that have been graduated longer from the program, and the ratio reaches 100 percent for members of the
group that has been graduated the longest (see table 11).
Still Studying27%
Working in Private Sector
28%
Working in Academic/Research Institution
21%
Working for an NGO
5%
Representing Own Country Based Abroad
3%
Unemployed2% Working in International/
Regional Organization14%
FIGURE 11. Status of Alumni not Residing in Home Country or Another Developing Country
Still Studying5.3%
Unemployed1.5% Employed
93.2%
FIGURE 12. Employment Status
Cluster 1 Count 41 0 0 41% within Group 100.0% 0.0% 0.0% 100.0%
Cluster 2 Count 253 8 1 262% within Group 96.6% 3.1% 0.4% 100.0%
Cluster 3 Count 463 35 11 509% within Group 91.0% 6.9% 2.2% 100.0%
TOTAL Count 757 43 12 812% within Group 93.2% 5.3% 1.5% 100.0%
Still Employed studying Unemployed Total
93.2% OF THE RESPONDENTSARE EMPLOYED

The employment shares are slightly higher for those alumni who studied in the Partnership Programs (see table
12). However, one could expect a more significant difference because the Partnership Programs more closely
represent the goal of the JJ/WBGSP in preparing policy and development professionals and managers.
Almost three-fourths of the employed respondents live in Africa (30 percent), East Asia (21 percent), South Asia (12
percent), and Latin America (11 percent). Within the regions, the alumni have employment rates ranging from 93.2 percent
in the Middle East and North Africa to 100 percent in South Asia. The relatively higher unemployment rates in Latin America
(4.9 percent) might be related to inability of the scholars to obtain study leaves, especially from positions in the public sector,
for which the majority of alumni work. (see table T.11 in Appendix I).
Most respondent alumni are employed at senior
positions in the government organizations and for
public service providers. Of the 757 respondent
alumni who are employed, about half work for
their respective governments (see table T.11 in
Appendix I, as well as figure 13). Those
government institutions include central
government (41 percent), public sector providers
(13 percent), and regional and local governments
(4 percent). Aside from government ministries and
agencies, more than one-third of the respondent
scholars obtained employment in academic and
research institutions (13.1 percent), NGOs (10.3
percent), and the private sector (13.5 percent).
31
45.2% WORK FOR CENTRAL ANDLOCAL GOVERNEMENTS
EMPLOYMENT STATUS PER PROGRAM TYPETABLE
12
Source: JJ/WBGSP Survey 2006.
Regular Program Cases 493 29 8 530% 93.0% 5.5% 1.5% 100.0%
Partnerships Cases 264 14 4 282% 93.6% 5.0% 1.4% 100.0%
TOTAL Cases 757 43 12 812% 93.2% 5.3% 1.5% 100.0%
Still Employed studying Unemployed Total
PROGRAM TYPE EMPLOYMENT
International/Regional Organization
8%
Bilateral Agency2%
Central Government/
Agency42%
Private Sector13%
NGO10%
Academic/Research Institution
14%Financial Institution
3%Public Service Provider
4%
Regional/Local Government4%
FIGURE 13. Distribution of Employed Alumni per Employer Type

32
More than one-fourth of employed respondents are working at managerial and executive levels, and a further one-
fourth work at senior professional levels. Those alumni are in positions where they can influence both public policy
and the well-beings of their people. The more experienced alumni occupied most of the senior posts, as would be
expected. Alumni working in regional or local governments and for financial institutions seem more likely to obtain
managerial and executive positions (see table T.11 in Appendix I, as well as figure 14).
Link to Development
The primary focus of the current employment for most of the 348 respondents—after completing their
scholarships and returning to their home country—was to provide policy inputs, information and knowledge
dissemination, management, and services. The proxy impact indicators show that most scholars are in positions
that can influence the policy and developmental programs of their countries—as was intended by the objectives
of the JJ/WBGSP. In fact, scholars are likely to engage in multifocus positions and to exercise a variety of
developmentally relevant job responsibilities.
Moreover, the respondent scholars found that their newly acquired skills were highly relevant to their countries’
needs. To further verify and measure the impact of the alumni’s contributions, the survey asked them to rank their
perceptions on the relevance of their current and overall professional activities to the development of their own
country and other developing countries on a progressive scale from zero to 100 percent. About half of the
respondents mentioned that at least three-fourth of their current and overall work related to development of their
own countries, and one-fifth of respondents mentioned that three-fourth or more of their current and overall work
related to the development of other developing countries.
0% 10% 20% 30% 40% 50% 60% 70% 80% 90% 100%
Exec. Manager/Policy maker
Senior Manager
Manager
Senior Professional
Professional
Cluster 3
Cluster 2
Cluster 1
FIGURE 14. Distribution of Employed Alumni per Cluster and Position Type
26.2% HOLD MANAGERIALPOSITIONS

33
ALUMNI ACTIVITIES AND DEVELOPMENTTABLE
13
C U R R E N T A C T I V I T I E S O V E R A L L A C T I V I T I E S
Appreciation Cases % Cases % Cases % Cases %75–100% 169 48.6% 66 19.0% 164 47.1% 63 18.1%50–75% 80 23.0% 72 20.7% 94 27.0% 72 20.7%25–50% 36 10.3% 64 18.4% 37 10.6% 66 19.0%0–25% 29 8.3% 86 24.7% 18 5.2% 84 24.1%NA 34 9.8% 60 17.2% 35 10.1% 63 18.1%TOTAL 348 100.0% 348 100.0% 348 100.0% 348 100.0%
Source: JJ/WBGSP Survey 2006.
RELATED TODEVELOPMENT INOWN COUNTRY
RELATED TODEVELOPMENT IN
OTHER COUNTRIES
RELATED TODEVELOPMENT INOWN COUNTRY
RELATED TODEVELOPMENT IN
OTHER COUNTRIES
The Program in Economic Policy Management at CERDI
In 1994, the Centre d’Etudes et de Recherches sur le Développement (CERDI) was selected by the JJ/WBGSP toestablish a program in Economic Policy Management (EPM) that would enhance the capabilities of African partneruniversities and would enable them to offer master’s programs. After 3 years of preparation and a detailedinstitution-building plan, the program was successfully transferred to the University of Cocody in Côte d’Ivoire andthe University of Yaoundé II in Cameroon. However, the EPM at CERDI continued. Since its inception, 360 scholarshave graduated from the program in EPM. About half of them (159) received a scholarship from the JJ/WBGSP.
The program in EPM at CERDI is taught mainly, but not exclusively, in French because most scholars come fromfrancophone countries, specifically sub-Saharan Africa. About two-thirds (99 of 159) of the scholars come fromsub-Saharan Africa. North Africa is also well represented with 27 scholars (or 17 percent), as well as Europe andCentral Asia with 19 scholars (12 percent). The total number of sponsored females is 36, or 22 percent of the total.
The aim of the EPM program at CERDI is to train primarily, but not exclusively, economists from the public sector.Half of the scholars work in policymaking ministries, the main one being the Ministry of Economy and Finance.Some scholars work in sector ministries such as Agriculture, Commerce, Foreign Affairs, Health, Industry, andPublic Works. Throughout the years, other public institutions have been represented, such as the Offices of thePresidents, Offices of the Prime Ministers, Parliaments, and Central Banks, which shows the great diversity of thescholars’ profiles. In total, almost two-thirds of the scholars work in policymaking positions and are at the heart ofthe policymaking process.
Many other scholars (17 percent) work in academia, in research, and as independent consultants. Those activitiesare considered to be upstream of the policymaking process. Some scholars (12 percent) exercise their talent inthe banking and finance sector, most of whom are in the Central Bank of their countries and are de facto in theheart of analysis and policymaking decisions. A few scholars (7 percent) have joined regional and internationalinstitutions, but generally they are stationed in country offices in the developing world and are very often in theirown country (UNDP, ADB, CEMAC, COMESA).
Overall, 152 of 159, or 95.6 percent. of the JJ/WBGSP scholars reside in developing countries. Only 12 scholars(7.5 percent) are expatriates: 5 reside in developing countries, other than their own; 3 study in France for specificreasons; 3 work at the headquarters of an international organization in developed countries; and 1 is a diplomat ina developed country embassy.

34
Peter Andrew Sinon, who is from Seychelles, is monitoring reforms at the African Development Bank.I am the first beneficiary of a JJ/WBGSP from the Republic of Seychelles. This scholarship has made a world
of difference to my career. It enhanced my analytical and technical skills, improved my confidence, and
expanded the potential limits of my career as a development economist.
The master’s degree has been the main catalyst that moved me from the position of principal economist to
that of director general of International Economic Affairs. It then propelled me to become the first resident of
the Seychelles High Commissioner of the African Continent, which is based in Pretoria, Republic of South
Africa. My next career move led me to the African Development Bank (ADB) in 2004 as advisor and alternate
for the executive director of Eritrea, Ethiopia, Kenya, Rwanda, Seychelles, Tanzania, and Uganda. I am also
involved in analyzing and advising about the sanctioning, as well as the monitoring and evaluation, of
ongoing reforms that the newly elected president of the ADB, Dr. Donald Kaberuka, is undertaking.

Section 6. Results and Outlook
• Conclusions, Lessons Learned
and Recommendations
35
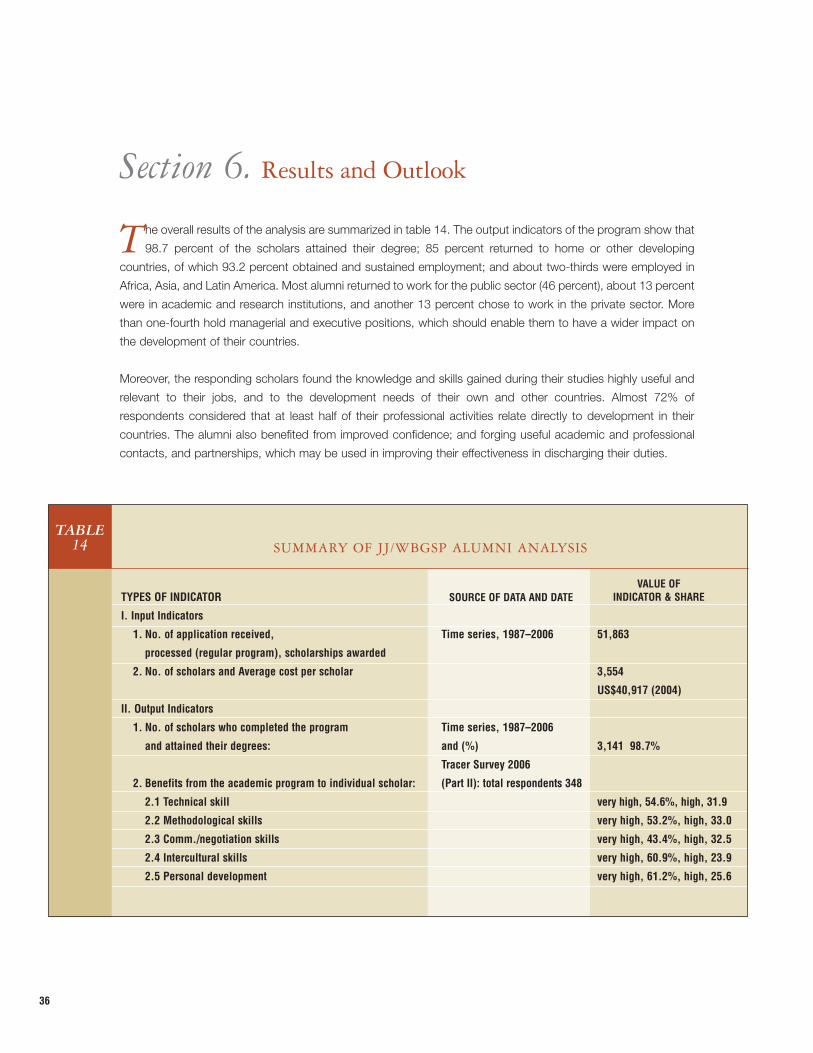
Section 6. Results and Outlook
The overall results of the analysis are summarized in table 14. The output indicators of the program show that
98.7 percent of the scholars attained their degree; 85 percent returned to home or other developing
countries, of which 93.2 percent obtained and sustained employment; and about two-thirds were employed in
Africa, Asia, and Latin America. Most alumni returned to work for the public sector (46 percent), about 13 percent
were in academic and research institutions, and another 13 percent chose to work in the private sector. More
than one-fourth hold managerial and executive positions, which should enable them to have a wider impact on
the development of their countries.
Moreover, the responding scholars found the knowledge and skills gained during their studies highly useful and
relevant to their jobs, and to the development needs of their own and other countries. Almost 72% of
respondents considered that at least half of their professional activities relate directly to development in their
countries. The alumni also benefited from improved confidence; and forging useful academic and professional
contacts, and partnerships, which may be used in improving their effectiveness in discharging their duties.
TYPES OF INDICATOR
I. Input Indicators
1. No. of application received,
processed (regular program), scholarships awarded
2. No. of scholars and Average cost per scholar
II. Output Indicators
1. No. of scholars who completed the program
and attained their degrees:
2. Benefits from the academic program to individual scholar:
2.1 Technical skill
2.2 Methodological skills
2.3 Comm./negotiation skills
2.4 Intercultural skills
2.5 Personal development
SOURCE OF DATA AND DATE
Time series, 1987–2006
Time series, 1987–2006
and (%)
Tracer Survey 2006
(Part II): total respondents 348
VALUE OFINDICATOR & SHARE
51,863
3,554
US$40,917 (2004)
3,141 98.7%
very high, 54.6%, high, 31.9
very high, 53.2%, high, 33.0
very high, 43.4%, high, 32.5
very high, 60.9%, high, 23.9
very high, 61.2%, high, 25.6
SUMMARY OF JJ/WBGSP ALUMNI ANALYSISTABLE
14
36

TYPES OF INDICATOR
III. Outcome Indicators
1. Alumni benefits from the scholarship program:
1.6 Recognition of skills
1.7 Progression in same job
1.8 Mobility across jobs
1.4 Higher income
2. No. of scholars who returned to:
2.1. Home country
2.2. Other developing countries
2.3. Part I countries
2.4. Unknown
3. No. of scholars who were:
3.1 Employed
3.2 Still studying
3.3 Unemployed
4. No. of scholars who returned to positions in:
4.1. Public sector (including central,
regional & local gov. and public sector providers)
4.2. Academic & research institutions
4.3 Private sector
4.4. NGOs
5. No. of employed alumni who work
at managerial and executive levels:
6. Relevance of alumni activities to development:
6.1 Current activities
6.1.1 Related to the development of own country
6.1.2 Related to the development of other countries
SOURCE OF DATA AND DATE
Tracer Survey 2006 (Part II):
total respondents 348
Tracer Survey 2006 (Part I):
total respondents 812
Tracer Survey 2006 (Part I):
total respondents 812
Tracer Survey 2006 (Part I):
total respondents 812
Tracer Survey 2006 (Part I):
total respondents
751 over 812
Tracer Survey 2006 (Part II):
total respondents 348
VALUE OFINDICATOR & SHARE
very high, 48.9%; high, 26.1
very high, 36.5%, high, 26.1
very high, 33.3%, high, 26.1
very high, 19.5%, high, 21.8
647 and 79.7%
119 and 14.7%
37 and 4.6%
9 and 1 %
751 and 92.5%
49 and 6%
12 and 1.5%
374 and 46%
97 and 12.9%
101 and 13.4%
77 and 10.3%
280, 26.2%
75–100%; 48.6%
50–75%; 23.0%
75–100%; 19.0%
50–75%; 20.7%
37
TABLE 14 SUMMARY OF JJ/WBGSP ALUMNI ANALYSIS (CONTINUED)

38
The Economic Policy Management Program at Makerere University
In pursuit of their common objective to strengthen the public sector capacity in sub-Saharan Africa,
the World Bank and the African Capacity Building Foundation (ACBF) launched the Economic
Policy Management program (EPM) in 1998 in four African universities: Makerere University
(Uganda), University of Ghana–Legon, University of Yaounde II (Cameroon), and the University of
Cocody (Côte d’Ivoire). Since its inception, the EPM program has trained more than 950 midcareer
professionals who are supported by ACBF and the JJ/WBGSP and are from 32 countries.
Established in 1922 as a technical school, Makerere University is one of the oldest and most
prestigious universities in Africa. Today, Makerere University has 22 faculties, institutes, or schools
offering study programs to a student body of about 30,000 undergraduates and 3,000
postgraduates. The EPM program has been hosted since 1998 by the faculty members who teach
economics and management. The program has trained eight cohorts, or a total of 285 scholars of
whom 81 (28.4 percent) were females and 132 (46.3 percent) were non-Ugandan. Although most
students (88 percent) were funded by ACBF and the World Bank Institute (the co-sponsors of the
program), the Makerere EPM program has succeeded in attracting 26 self-financed students and 8
scholars who are supported by other donors, such as the French Cooperation, the Government of
Kenya or the Bank of Uganda.
A tracer study conducted by Makerere University covering the six first cohorts of the program
showed that more than 76 percent of EPM alumni were able to improve their professional situation
during the 5 years following their graduation; they were either being promoted by their previous
employers or were moving from their previous jobs to better positions. Although they work mainly
for central and local governments and agencies (54 percent), Makerere EPM alumni are also
present in the private sector (16 percent), academia (13 percent), NGOs (13 percent,) and
independent organizations (4 percent). Positions occupied by EPM alumni include chief economist
at the Zambia Competition Commission; senior economists at the Ministry of Finance of Kenya;
and senior economist at the Ministry of Planning, Economy, and Empowerment of Tanzania.

39
Conclusions, Lessons Learned, and Recommendations
JJ/WBGSP is one the few development-focused scholarship programs that provide the recipients—midcareer
professionals from developing countries—with the enhanced knowledge and skills, exposure, and confidence
needed to serve their countries. Substantial numbers of applications and a rigorous selection policy ensure
quality at entry and high attainment rates. The focus on midcareer professionals, the formal commitment of
scholars, and the employment restriction at the World Bank and the International Monetary Fund ensure that the
scholars return home after completing their studies.
The main indicators show that the JJ/BGSP is achieving its goal at reasonable costs. The overwhelming majority
of scholars, in fact, attain their degree, return to their countries, and engage in gainful employment that
contributes to the sociodevelopment of their countries, as shown in this report. Survey 2006 results, contacts
with alumni, anecdotal evidence, and testimonials have shown that the positive results obtained through this
program have been sustained and that the scholars continue to work in areas that contribute to development,
especially at senior executive and professional levels.
There are some lessons to be learned from the process and recommendations, however. First, extensive efforts
went into tracking and contacting the individual scholars and alumni. The recommendations of the previous
report (Tracer Study VI) regarding tracing alumni,—such as stepping up the process of providing regular
opportunities for alumni to register and to attend short courses and for them to create a forum electronically and
through the Web—were initiated. The scaling-up program launched in 2005 is a significant step toward creating
a community of development practitioners and toward facilitating a lifelong learning environment. These efforts
need to be sustained and strengthened.
Second, continuous effort should be made to collect data both before and after graduation, which will improve
the analysis of the future tracer studies. Additional data can be collected for the type of institutions, nature of
work, and ranks of the scholars before their selection. For instance, the tracer survey should start when the
scholarship is awarded and should gather information about such topics. Those data will provide a more
thorough understanding of the impact of the program on both scholars and their employment institutions.
Third, although tracer studies have provided valuable indicators and have allowed the program to improve its
performance over the years, those studies do not constitute a comprehensive evaluation of the program. It is
recommended to (a) undertake an external evaluation of the program ,which could be performed by the World
Bank Institute’s Independent Evaluation Group, and (b) cooperate with similar international scholarship programs
in order to set up benchmarks.
Fourth, impact indicators for the Partnership Programs are very similar to those of the Regular Program although
their costs are generally much higher. Therefore, there is a need to further evaluate the programs individually and
in cooperation with partner universities.

40
The Williams College Center for Development Economics
Since 1960, the Williams College Center for Development Economics (CDE) has trained more than
1,000 future economic policymakers from around the world. Generous support has come from the
JJ/WBGSP. Many alumni have risen to critical leadership positions in their nations. Overall, more
than 90 percent of alumni still live in their home nations, and more than 80 percent remain engaged
in the public policy process.
From the 1990s, close cooperation with the JJ/WBGSP has enabled the CDE to extend its reach to
nations in transition. Among CDE alumni, 22 now serve in South African institutions, and more than
100 South African members of parliament were trained by CDE faculty members through a series of
short courses.
At Willliams College, our involvement in the CIS has been most obvious in the Kyrgyz Republic
(with 10 recent alumni) and in Georgia. Since November 2003, many CDE graduates in Georgia
have risen to important leadership positions in a short time. The following are some examples:
• Chairman, Georgian Tax Department—Kakha Baidurashvili, JJ/WBGSP 2005–06
• Advisor to the Minister of Finance—Mikheil Giorgadze, JJ/WBGSP 2000–01
• Deputy Minister of Finance—Grigoli Gobejishvili, JJ/WBGSP 2003–04
• Vice Premier, Tbilisi Municipality—Ucha Gelashvili, JJ/WBGSP 2003–04
• Head, Monetary Policy, National Bank—Giorgi Laliashvili, JJ/WBGSP 2005–06
• Project Manager, German foreign aid in Georgia—Maia Gikoshvili, JJ/WBGSP 2001–02
The World Bank and IFC publication titled “Doing Business, September 2006” cited Georgia as the
world’s top reformer for 2005–06.
Most recently, the CDE program has reached out to enroll participants from postconflict nations,
including Afghanistan, Lebanon, and Liberia. We also have begun recruitment in Iraq.
Going forward, Williams College hopes to continue our cooperation with the JJ/WBGSP.

*Data sources are: (i) JJ/WBGSP Scholars database for Tables A1 to A4 and T, and (ii) Tracer Survey 2006 for tables T2 to T16
Appendix I. Statistical tables*
Table A1 JJ/WBGSP Regular Program Applicants: Distribution by Region and Gender 1987–2006 . . . . . . . . . . . . . . . . . .42Table A2 JJ/WBGSP Regular Program Applicants: Distribution by Region and Country 1987–2006 . . . . . . . . . . . . .43-47Table A3 JJ/WBGSP Scholarship Awards: Distribution by Region and Gender 1987–2006 . . . . . . . . . . . . . . . . . . . . . . . . . . . .48Table A4 JJ/WBGSP Scholarship Awards: Distribution by Region and Country 1987–2006 . . . . . . . . . . . . . . . . . . . . . . .49-52Table T.1. Degree Attainment by Alumni Awarded Scholarships, 1987–2004* . . . . . . . . . . . . . . . . . . . . . . . . . . . . . . . . . . . . . . . . . . . . . .53Table T.2. Cohort Groups Statistics . . . . . . . . . . . . . . . . . . . . . . . . . . . . . . . . . . . . . . . . . . . . . . . . . . . . . . . . . . . . . . . . . . . . . . . . . . . . . . . . . . . . . . . . . . . . . . . . .53Table T.3. Residence status per gender and degree . . . . . . . . . . . . . . . . . . . . . . . . . . . . . . . . . . . . . . . . . . . . . . . . . . . . . . . . . . . . . . . . . . . . . . . . . . . . .54Table T.4. Residence status per field of study . . . . . . . . . . . . . . . . . . . . . . . . . . . . . . . . . . . . . . . . . . . . . . . . . . . . . . . . . . . . . . . . . . . . . . . . . . . . . . . . . . . . .55Table T.5. Residence status per program type . . . . . . . . . . . . . . . . . . . . . . . . . . . . . . . . . . . . . . . . . . . . . . . . . . . . . . . . . . . . . . . . . . . . . . . . . . . . . . . . . . . .55Table T.6. Status of alumni residing in Part 1 countries . . . . . . . . . . . . . . . . . . . . . . . . . . . . . . . . . . . . . . . . . . . . . . . . . . . . . . . . . . . . . . . . . . . . . . . . . .56Table T.7. Employment status per field of study . . . . . . . . . . . . . . . . . . . . . . . . . . . . . . . . . . . . . . . . . . . . . . . . . . . . . . . . . . . . . . . . . . . . . . . . . . . . . . . . . . 56Table T.8. Employment per group . . . . . . . . . . . . . . . . . . . . . . . . . . . . . . . . . . . . . . . . . . . . . . . . . . . . . . . . . . . . . . . . . . . . . . . . . . . . . . . . . . . . . . . . . . . . . . . . . . .57Table T.9. Employment status per program type . . . . . . . . . . . . . . . . . . . . . . . . . . . . . . . . . . . . . . . . . . . . . . . . . . . . . . . . . . . . . . . . . . . . . . . . . . . . . . . . . 57Table T.10. Employment status per region of residence . . . . . . . . . . . . . . . . . . . . . . . . . . . . . . . . . . . . . . . . . . . . . . . . . . . . . . . . . . . . . . . . . . . . . . . . . . 57Table T.11. Distribution of employed alumni per organization type and position . . . . . . . . . . . . . . . . . . . . . . . . . . . . . . . . . . . . . . . . . . . . .58Table T.12. Distribution of employed alumni per group and position . . . . . . . . . . . . . . . . . . . . . . . . . . . . . . . . . . . . . . . . . . . . . . . . . . . . . . . . . . .59Table T.13. Skills enhancement . . . . . . . . . . . . . . . . . . . . . . . . . . . . . . . . . . . . . . . . . . . . . . . . . . . . . . . . . . . . . . . . . . . . . . . . . . . . . . . . . . . . . . . . . . . . . . . . . . . . . . . . 59Table T.14. Extent to which academic program was useful at work . . . . . . . . . . . . . . . . . . . . . . . . . . . . . . . . . . . . . . . . . . . . . . . . . . . . . . . . . . . .59Table T.15. Rating of professional benefits attributed to the program . . . . . . . . . . . . . . . . . . . . . . . . . . . . . . . . . . . . . . . . . . . . . . . . . . . . . . . . . .60Table T.16. Professional progression after the program . . . . . . . . . . . . . . . . . . . . . . . . . . . . . . . . . . . . . . . . . . . . . . . . . . . . . . . . . . . . . . . . . . . . . . . . . . . 60Table T.17. Alumni activities and development . . . . . . . . . . . . . . . . . . . . . . . . . . . . . . . . . . . . . . . . . . . . . . . . . . . . . . . . . . . . . . . . . . . . . . . . . . . . . . . . . . . . . .60
41

Region Africa E. Asia ECA LCR MNA S. Asia Unknown Part 1 Total
Total 1987–2000
Total 18,881 2,871 1,055 2,797 1,279 3,945 18 625 31,471
# Male 15,781 1,818 617 1,841 1,015 3,319 17 366 24,774
# Female 3,100 1,053 438 956 264 626 1 259 6,697
2001
Total 2,822 288 145 419 258 457 0 34 4,423
# Male 2,283 150 69 232 188 358 0 16 3,296
# Female 539 138 76 187 70 99 0 18 1,127
2002
Total 1,542 260 105 313 88 365 0 50 2,723
# Male 1,252 129 52 165 66 278 0 20 1,962
# Female 290 131 53 148 22 87 0 30 761
2003
Total 1,830 263 93 329 93 362 0 50 3,020
# Male 1,449 137 34 166 78 275 0 24 2,163
# Female 381 126 59 163 15 87 0 26 857
2004
Total 2,178 234 100 407 149 331 0 62 3,461
# Male 1,793 128 52 205 126 250 0 24 2,578
# Female 385 106 48 202 23 81 0 38 883
2005
Total 2,169 241 92 321 129 352 0 82 3,386
# Male 1,764 125 37 171 92 263 0 34 2,486
# Female 402 116 57 151 37 89 0 48 900
2006
Total 2,226 209 71 332 115 358 0 68 3,379
# Male 1,779 92 31 170 81 287 0 27 2,467
# Female 447 117 40 162 34 71 0 41 912
Grand Total
Total 31,648 4,366 1,661 4,918 2,111 6,170 18 971 51,863
# Male 26,101 2,579 892 2,950 1,646 5,030 17 511 39,726
# Female 5,544 1,787 771 1,969 465 1,140 1 460 12,137
TABLE A1JJ/WBGSP Regular Program Applicants: Distribution by Region and Gender 1987–2006
42

TABLE A2JJ/WBGSP Regular Program Applicants: Distribution by Region and Country 1987-2006
AFRICA 1987-2000 2001 2002 2003 2004 2005 2006 Totals
Angola 79 10 4 2 6 0 4 105Benin 378 69 22 37 42 32 46 626Botswana 59 7 3 9 9 6 5 98Burkina Faso 329 45 38 41 44 42 43 582Burundi 85 19 5 5 6 6 9 135Cameroon 617 129 42 86 126 103 87 1,190Cape Verde 20 3 1 3 1 1 3 32Central African Republic 58 9 7 12 11 27 12 136Chad 206 64 21 31 31 38 30 421Comoros 17 4 1 3 4 7 10 46Congo, Democratic Republic of 621 100 48 53 88 67 50 1,027Congo, Republic of 252 61 21 18 35 30 19 436Cote d'Ivoire 401 55 18 32 42 24 20 592Djibouti 20 2 1 1 3 0 0 27Equatorial Guinea 7 2 6 0 0 0 0 15Eritrea 20 12 30 16 14 16 27 135Ethiopia 1,009 180 143 213 205 268 276 2,294Gabon 28 8 2 2 2 1 5 48Gambia, The 126 12 14 21 21 23 21 238Ghana 1,563 214 166 183 199 144 134 2,603Guinea 212 67 23 31 30 31 38 432Guinea Bissau 23 0 1 3 2 1 1 31Kenya 1,649 231 113 111 95 108 104 2,411Lesotho 73 12 8 10 12 6 16 137Liberia 126 11 3 2 3 4 6 155Madagascar 280 28 12 52 28 14 44 458Malawi 354 66 40 29 35 35 46 605Mali 214 21 7 10 20 17 19 308Mauritania 67 8 6 9 15 11 11 127Mauritius 17 1 6 3 2 0 0 29Mozambique 51 17 4 3 2 5 5 87Namibia 42 6 2 2 1 4 6 63Niger 146 52 47 33 24 28 33 363Nigeria 3,469 605 298 348 506 525 543 6,294Rwanda 154 26 8 23 25 29 31 296Sao Tome & Principe 8 2 2 0 1 4 2 19Senegal 319 70 24 27 36 46 47 569Seychelles 4 0 0 0 2 0 2 8Sierra Leone 373 39 18 10 36 34 45 555Somalia 108 0 0 1 1 0 0 110South Africa 104 11 9 8 11 5 5 153Sudan 566 35 19 16 19 21 22 698Swaziland 65 3 4 4 6 7 3 92Tanzania 1,785 177 102 101 127 145 138 2,575Togo 188 42 32 33 41 34 23 393Uganda 1,503 128 73 91 107 121 101 2,124Zambia 622 110 69 87 91 81 106 1,166Zimbabwe 464 49 19 15 11 18 28 604Grand Total 18,881 2,822 1,542 1,830 2,178 2,169 2,226 31,648
43

TABLE A2JJ/WBGSP Regular Program Applicants: Distribution by Region and Country 1987–2006
JJ/WBGSP Europe and Central Asia Applicants: Distribution by Region and Country 1987–2006
E. ASIA 1987–2000 2001 2002 2003 2004 2005 2006 Total
Cambodia 87 12 14 11 10 20 5 159China 1,094 46 56 81 47 36 18 1,378East Timor 0 0 0 0 6 0 1 7Fiji 15 0 6 1 1 1 2 26Indonesia 478 64 54 29 27 21 35 708Kiribati 3 0 1 0 0 0 0 4Korea 78 7 0 0 0 0 0 85Lao PDR 26 8 1 5 7 5 2 54Malaysia 61 3 2 7 12 5 8 98Mongolia 51 15 10 11 13 13 7 120Myanmar 110 58 46 40 62 68 66 450Papua New Guinea 14 1 3 10 6 10 6 50Philippines 514 37 34 35 20 30 32 702Solomon Islands 2 0 0 0 0 1 0 3Thailand 162 12 9 8 4 2 5 202Tonga 9 0 0 1 0 0 0 10Vanuatu 0 2 0 1 0 0 0 3Vietnam 157 23 24 22 18 28 22 294Western Somoa 10 0 0 1 1 1 0 13Grand Total 2,871 288 260 263 234 241 209 4,366
ECA 1987–2000 2001 2002 2003 2004 2005 2006 Total
Albania 78 5 8 5 3 6 1 106Armenia 22 5 3 2 4 6 6 48Azerbaijan 19 2 2 2 4 5 2 36Belarus 36 3 5 2 3 0 4 53Bosnia 11 2 0 0 0 0 2 15Bulgaria 94 10 12 6 4 9 3 138Croatia 8 0 1 4 2 2 2 19Czech Republic 18 0 0 1 0 0 0 19Estonia 11 2 3 1 2 0 0 19Georgia 31 17 12 8 9 4 8 89Hungary 64 3 2 1 0 0 0 70Kazakhstan 24 7 3 4 1 1 3 43Kyrgyz Rep. 30 13 7 5 9 7 4 75Latvia 9 1 0 4 1 0 0 15Lithuania 10 6 3 2 1 1 0 23Macedonia 5 2 0 2 0 1 1 11Moldova 16 3 5 2 5 2 2 35Poland 51 0 2 2 0 0 0 55Portugal 11 0 0 0 0 0 0 11Romania 95 16 6 6 9 9 7 148Russia Federation 90 13 6 8 3 3 3 126Serbia and Montenegro 54 3 1 2 2 4 3 69Slovak Republic 19 3 1 1 0 1 0 25Slovenia 6 1 3 0 1 0 0 11Tajikistan 5 2 2 4 8 5 2 28Turkey 168 7 10 10 20 9 9 233Turkmenistan 2 0 0 1 1 0 1 5Ukraine 43 10 3 3 2 3 2 66Uzbekistan 25 9 5 5 6 14 6 70TOTAL 1,055 145 105 93 100 92 71 1,661
44

TABLE A2JJ/WBGSP Regular Program Applicants: Distribution by Region and Country 1987–2006
LCR 1987–2000 2001 2002 2003 2004 2005 2006 Total
Antigua 4 1 1 0 0 2 1 9Argentina 218 22 30 27 26 15 15 353Bahamas 11 0 1 0 0 0 0 12Barbados 26 2 0 1 2 1 1 33Belize 9 0 0 1 0 0 0 10Bolivia 108 20 15 18 23 12 16 212Brazil 181 31 17 20 21 24 27 321Chile 145 14 19 12 21 23 25 259Colombia 330 46 30 29 73 44 59 611Costa Rica 54 8 7 2 5 10 7 93Cuba 0 1 1 0 0 0 0 2Dominica 18 2 2 1 0 0 23Dominican Republic 27 3 0 1 3 3 3 40Ecuador 145 26 11 10 9 12 11 224El Salvador 40 4 1 1 3 2 2 53Grenada 11 0 0 1 1 2 1 16Guatemala 31 2 4 1 0 2 5 45Guyana 49 8 6 5 2 1 4 75Haiti 91 52 25 25 21 20 17 251Honduras 27 7 2 4 9 9 4 62Jamaica 72 7 12 7 5 2 8 113Mexico 511 48 45 55 73 61 53 846Nicaragua 27 7 7 8 4 8 10 71Panama 16 2 4 0 1 0 0 23Paraguay 26 1 2 1 2 3 5 40Peru 341 74 51 62 61 42 31 662St. Kitts 3 0 1 1 3 1 0 9St. Lucia 29 6 1 1 0 2 0 39St. Vincent 12 0 0 1 0 1 2 16Suriname 9 0 0 0 0 1 2 12Trinidad & Tobago 46 7 1 2 0 1 0 57Uruguay 99 14 13 22 19 6 9 182Venezuela 79 6 4 9 19 11 14 142West Indies 2 0 0 0 0 0 0 2Grand Total 2,797 419 313 329 407 321 332 4,918
45

TABLE A2JJ/WBGSP Regular Program Applicants: Distribution by Region and Country 1987–2006
JJ/WBGSP Regular Program Applicants: Distribution by Region and Country 1987–2006
MNA 1987–2000 2001 2002 2003 2004 2005 2006 Total
Afghanistan 13 2 0 1 5 10 14 45Algeria 164 46 14 17 29 13 18 301Bahrain 4 0 0 0 0 0 0 4Egypt 483 68 17 34 25 22 18 667Iran 74 16 3 3 21 19 10 146Iraq 19 4 1 1 0 0 12 37Jordan 118 14 16 3 11 12 7 181Kuwait 6 1 0 0 0 0 0 7Lebanon 27 1 0 1 0 4 0 33Libya 6 0 0 2 0 0 0 8Malta 2 0 0 0 0 0 0 2Morocco 147 48 10 10 5 10 6 236Oman 6 1 5 1 2 11 5 31Saudi Arabia 11 0 0 1 0 0 0 12Syria 26 9 1 1 1 3 2 43Tunisia 78 26 6 2 2 3 6 123West Bank and Gaza 31 10 10 11 27 10 7 106Yemen Republic 64 12 5 5 21 12 10 129Grand Total 1,279 258 88 93 149 129 115 2,111
SOUTH ASIA 1987–2000 2001 2002 2003 2004 2005 2006 Total
Bangladesh 779 53 57 51 54 49 52 1,095Bhutan 29 8 5 9 5 13 15 84India 1,126 83 114 119 108 98 102 1,750Maldives 40 3 3 0 0 0 0 46Nepal 797 103 67 61 71 88 75 1,262Pakistan 939 172 100 100 67 76 79 1,533Sri Lanka 235 35 19 22 26 28 35 400TOTAL 3,945 457 365 362 331 352 358 6,170
46

TABLE A2JJ/WBGSP Regular Program Applicants: Distribution by Region and Country 1987–2006
PART I 1987–2000 2001 2002 2003 2004 2005 2006 Total
Australia 13 0 0 0 0 0 0 13Austria 1 0 0 0 0 0 0 1Bahrain 0 0 0 0 1 0 0 1Belgium 5 0 0 0 0 0 0 5Canada 35 0 0 0 0 0 0 35Cyprus 21 0 0 0 1 0 0 22Finland 4 0 0 0 0 0 0 4France 36 0 0 0 0 0 0 36Germany 23 0 0 0 0 0 0 23Greece 32 0 0 0 0 0 0 32Iceland 1 0 0 0 0 0 0 1Ireland 9 0 0 1 0 0 0 10Israel 18 0 0 1 0 1 0 20Italy 21 0 0 0 0 0 1 22Japan 208 31 50 45 56 80 65 535Korea, Rep. 0 0 0 0 2 1 0 3Kuwait 0 0 0 0 1 0 2 3Qatar 1 0 0 0 0 0 0 1Netherlands 7 0 0 0 0 0 0 7New Zealand 3 0 0 0 0 0 0 3Norway 2 0 0 0 0 0 0 2Saudi Arabia 0 0 0 0 0 0 0 0Singapore 17 3 0 2 1 0 0 23Spain 20 0 0 1 0 0 0 21Sweden 5 0 0 0 0 0 0 5Switzerland 1 0 0 0 0 0 0 1Taiwan 1 0 0 0 0 0 0 1United Kingdom 44 0 0 0 0 0 0 44United States 97 0 0 0 0 0 0 97Grand Total 625 34 50 50 62 82 68 971
1987–2000 2001 2002 2003 2004 2005 2006 Total
Total of Developing Member Countries 30,828 4,389 2,673 2,970 3,399 3,304 3,311 50,874Total of Industrialized Countries 625 34 50 50 62 82 68 971Unknown 18 0 0 0 0 0 0 18Total Member Countries 31,471 4,423 2,723 3,020 3,461 3,386 3,379 51,863
47
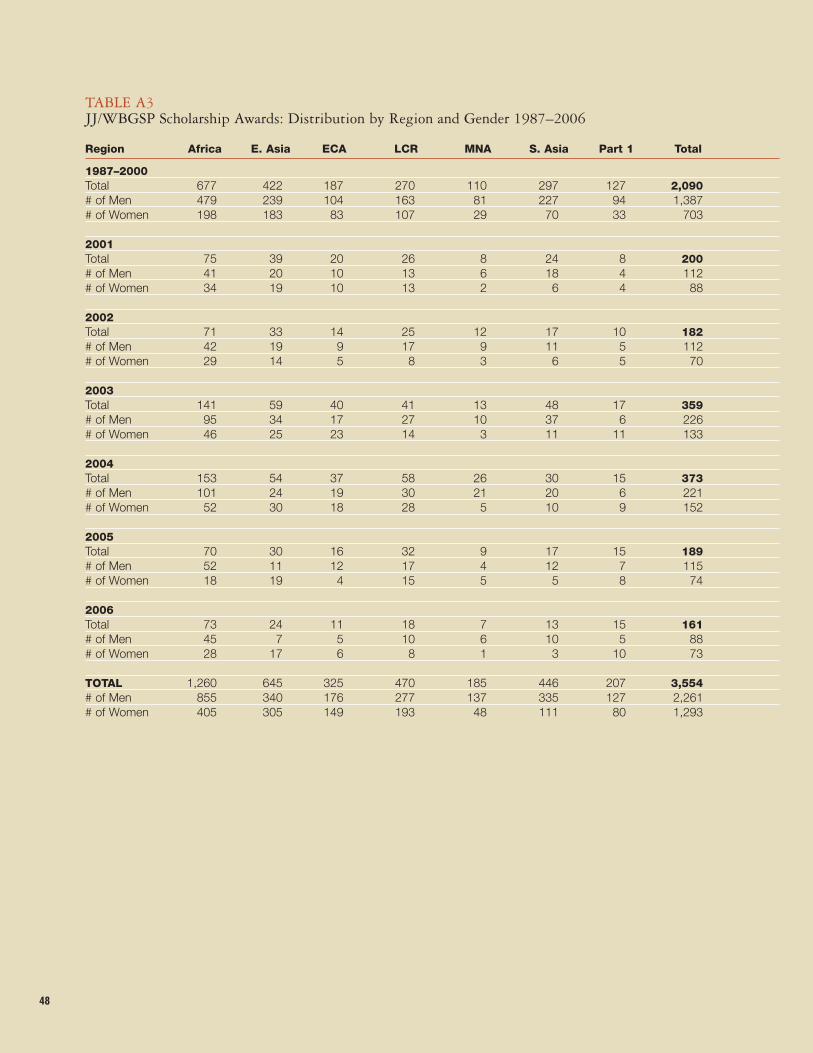
TABLE A3JJ/WBGSP Scholarship Awards: Distribution by Region and Gender 1987–2006
Region Africa E. Asia ECA LCR MNA S. Asia Part 1 Total
1987–2000Total 677 422 187 270 110 297 127 2,090# of Men 479 239 104 163 81 227 94 1,387# of Women 198 183 83 107 29 70 33 703
2001Total 75 39 20 26 8 24 8 200# of Men 41 20 10 13 6 18 4 112# of Women 34 19 10 13 2 6 4 88
2002Total 71 33 14 25 12 17 10 182# of Men 42 19 9 17 9 11 5 112# of Women 29 14 5 8 3 6 5 70
2003Total 141 59 40 41 13 48 17 359# of Men 95 34 17 27 10 37 6 226# of Women 46 25 23 14 3 11 11 133
2004Total 153 54 37 58 26 30 15 373# of Men 101 24 19 30 21 20 6 221# of Women 52 30 18 28 5 10 9 152
2005Total 70 30 16 32 9 17 15 189# of Men 52 11 12 17 4 12 7 115# of Women 18 19 4 15 5 5 8 74
2006Total 73 24 11 18 7 13 15 161# of Men 45 7 5 10 6 10 5 88# of Women 28 17 6 8 1 3 10 73
TOTAL 1,260 645 325 470 185 446 207 3,554# of Men 855 340 176 277 137 335 127 2,261# of Women 405 305 149 193 48 111 80 1,293
48

TABLE A4JJ/WBGSP Scholarship Awards: Distribution by Region and Country 1987–2006
AFRICA 1987–2000 2001 2002 2003 2004 2005 2006 Total
Angola 5 1 0 0 1 0 0 7Benin 22 0 1 4 4 2 1 34Botswana 4 0 0 0 2 0 0 6Burkina Faso 26 2 2 7 8 2 2 49Burundi 9 1 2 3 3 2 2 22Cameroon 27 3 4 5 5 2 4 50Cape Verde 2 0 0 1 0 0 1 4Central African Republic 4 2 2 3 3 2 2 18Chad 12 1 3 2 4 2 2 26Comoros 2 0 2 0 2 1 2 9Congo, Democratic Republic of 7 2 3 2 3 1 1 19Congo, Republic of 11 1 2 3 5 2 1 25Côte d'Ivoire 17 3 2 3 3 3 3 34Djibouti 1 0 0 0 0 0 0 1Eritrea 3 1 0 2 3 0 1 10Ethiopia 40 4 3 7 8 5 5 72Gabon 4 1 0 1 1 1 1 9Gambia 6 1 0 3 3 1 2 16Ghana 58 4 6 5 8 3 3 87Guinea 17 2 0 4 3 1 3 30Guinea-Bissau 2 0 0 0 0 0 0 2Kenya 47 6 5 12 7 6 3 86Lesotho 3 0 1 1 3 0 1 9Liberia 7 1 0 0 2 1 1 12Madagascar 20 3 1 5 4 1 1 35Malawi 16 1 1 1 3 2 2 26Mali 9 0 1 3 4 2 2 21Mauritania 4 1 1 2 3 2 2 15Mauritius 1 0 1 1 0 0 0 3Mozambique 2 1 0 0 0 0 1 4Namibia 3 1 0 0 0 1 0 5Niger 9 2 1 4 3 2 1 22Nigeria 63 5 3 7 8 2 3 91Rwanda 12 1 1 6 4 3 3 30Sao Tome & Principe 2 0 0 0 0 0 0 2Senegal 16 3 2 5 6 1 2 35Seychelles 1 0 0 0 1 0 1 3Sierra Leone 14 3 3 6 5 4 2 37Somalia 3 0 0 0 1 0 0 4South Africa 6 2 0 3 0 1 1 13Sudan 22 3 3 5 5 1 2 41Swaziland 4 0 1 0 3 0 0 8Tanzania 36 3 3 8 5 3 3 61Togo 11 1 3 4 7 1 1 28Uganda 46 5 4 7 4 3 3 72Zambia 26 3 3 5 4 2 2 45Zimbabwe 15 1 1 1 2 2 0 22TOTAL 677 75 71 141 153 70 73 1,260
49

TABLE A4JJ/WBGSP Scholarship Awards: Distribution by Region and Country 1987–2006
JJ/WBGSP Scholarship Awards: Distribution by Region and Country 1987–2006
EAST ASIA& PACIFIC 1987–2000 2001 2002 2003 2004 2005 2006 Total
Cambodia 14 3 4 5 2 1 1 30China 133 7 5 8 8 5 5 171Fiji 2 0 0 0 1 1 0 4Indonesia 40 4 4 8 4 6 4 70Kiribati 0 0 1 0 0 0 0 1Korea 16 0 0 0 0 0 0 16Lao PDR 11 1 1 2 4 0 1 20Malaysia 6 0 1 2 3 0 2 14Mongolia 26 3 3 5 3 4 3 47Myanmar 31 5 4 12 9 4 3 68Papua New Guinea 4 0 1 1 3 1 1 11Philippines 54 5 2 5 6 3 2 77Thailand 24 5 1 2 1 0 1 34Tonga 2 0 0 1 0 0 0 3Vietnam 57 6 6 8 9 5 1 92Western Somoa 2 0 0 0 1 0 0 3TOTAL 422 39 33 59 54 30 24 661
EUROPE &CENTRAL ASIA 1987–2000 2001 2002 2003 2004 2005 2006 Total
Albania 10 0 2 1 3 1 0 17Armenia 9 1 0 4 1 0 2 17Azerbaijan 5 1 0 1 2 1 0 10Belarus 6 0 2 0 0 0 0 8Bosnia 1 0 0 0 0 0 0 1Bulgaria 20 4 1 3 1 0 29Croatia 2 0 0 1 0 0 0 3Czech Republic 1 1 0 1 0 0 0 3Estonia 3 0 0 0 1 0 0 4Georgia 12 1 1 4 3 3 2 26Hungary 11 0 0 1 0 0 0 12Kazakhstan 6 2 1 2 2 0 0 13Kosovo 0 0 0 0 0 1 0 1Kyrgyz Republic 4 2 1 2 2 1 1 13Latvia 4 0 0 1 0 0 0 5Lithuania 3 2 0 1 1 0 0 7Macedonia 3 0 0 0 0 0 0 3Moldova 4 0 2 0 3 0 0 9Poland 4 0 0 1 0 0 0 5Romania 17 1 1 5 3 1 1 29Russia Federation 18 0 0 3 0 1 0 22Serbia and Montenegro 2 0 0 1 1 0 1 5Slovak Republic 4 0 0 0 0 0 0 4Slovenia 3 0 0 0 0 0 0 3Tajikistan 3 0 1 0 2 2 0 8Turkey 12 1 1 4 6 2 1 27Turkmenistan 0 1 0 0 2 0 0 3Ukraine 9 2 0 0 0 1 1 13Uzbekistan 11 1 1 4 4 2 2 25TOTAL 187 20 14 40 37 16 11 32550

TABLE A4JJ/WBGSP Scholarship Awards: Distribution by Region and Country 1987–2006
JJ/WBGSP Scholarship Awards: Distribution by Region and Country 1987–2006
LCR 1987–2000 2001 2002 2003 2004 2005 2006 Total
Antigua and Barbuda 0 0 0 0 0 0 1 1Argentina 22 2 3 2 3 2 0 34Bahamas 1 0 0 0 0 0 0 1Barbados 0 0 0 0 0 0 0 0Belize 2 0 0 0 0 0 0 2Bolivia 9 1 1 2 6 2 1 22Brazil 19 2 3 2 8 3 1 38Chile 18 2 0 4 5 4 1 34Colombia 29 4 1 4 4 2 3 47Costa Rica 4 1 2 0 1 1 0 9Dominica 1 0 0 1 0 0 0 2Dominican Republic 2 0 0 0 0 1 0 3Ecuador 15 1 1 1 1 1 1 21El Salvador 3 2 1 1 0 1 0 8Grenada 2 0 0 0 1 1 0 4Guatemala 6 0 1 1 0 0 0 8Guyana 15 1 1 1 2 0 1 21Haiti 15 0 3 2 1 0 0 21Honduras 1 1 0 1 2 2 1 8Jamaica 5 0 1 0 1 0 1 8Mexico 33 4 1 5 7 3 1 54Nicaragua 2 0 1 2 0 0 1 6Panama 0 0 0 0 1 0 0 1Paraguay 1 0 0 0 0 0 0 1Peru 40 3 2 6 6 5 4 66St. Kitts 1 0 0 1 2 1 0 5St. Lucia 2 1 1 0 0 1 0 5St. Vincent 1 0 0 1 0 0 1 3Suriname 1 0 0 0 0 0 0 1Trinidad & Tobago 5 0 1 1 0 1 0 8Uruguay 9 1 1 2 3 0 0 16Venezuela 6 0 0 1 4 1 0 12TOTAL 270 26 25 41 58 32 18 470
MNA 1987–2000 2001 2002 2003 2004 2005 2006 Total
Algeria 14 1 2 1 3 1 1 23Egypt 35 3 1 3 6 2 1 51Iran 14 1 1 2 6 1 1 26Iraq 2 0 0 0 0 0 0 2Jordan 13 1 2 1 3 1 0 21Lebanon 2 0 1 0 0 1 0 4Morocco 15 2 1 1 1 1 1 22Oman 0 0 0 0 0 0 0 0Syria 1 0 0 0 0 1 0 2Tunisia 6 0 1 1 1 1 1 11West Bank & Gaza 6 0 2 2 3 0 1 14Yemen Republic 2 0 1 2 3 0 1 9TOTAL 110 8 12 13 26 9 7 185
51

TABLE A4JJ/WBGSP Scholarship Awards: Distribution by Region and Country 1987–2005
JJ/WBGSP Scholarship Awards: Distribution by Region and Country 1987–2005
SOUTH ASIA 1987–2000 2001 2002 2003 2004 2005 2006 Total
Afghanistan 1 0 0 1 1 1 1 5Bangladesh 38 3 2 9 4 2 2 60Bhutan 9 3 3 5 3 3 3 29India 116 8 4 11 7 3 2 151Maldives 5 0 0 0 0 0 0 5Nepal 48 3 3 5 5 3 2 69Pakistan 60 5 3 11 4 4 1 88Sri Lanka 20 2 2 6 6 1 2 39TOTAL 297 24 17 48 30 17 13 446
PART I 1987–2000 2001 2002 2003 2004 2005 2006 Total
Australia 1 0 0 0 0 0 0 1Belgium 1 0 0 0 0 0 0 1Canada 4 0 0 0 0 0 0 4Cyprus 1 0 0 0 0 0 0 1Ireland 1 0 0 0 0 0 0 1Italy 1 0 0 0 0 0 0 1Japan 112 8 10 17 15 15 15 192Sweden 1 0 0 0 0 0 0 1United Kingdom 1 0 0 0 0 0 0 1United States 4 0 0 0 0 0 0 4TOTAL 127 8 10 17 15 15 15 207
TOTAL AWARDEES 1987–2000 2001 2002 2003 2004 2005 2006 Total
Total of Developing Member Countries 1,963 192 172 342 358 174 146 3,347Total of Industrialized Countries 127 8 10 17 15 15 15 207Total Member Countries 2,090 200 182 359 373 189 161 3,554
52

53
TABLE T.1.Degree Attainment by Alumni Awarded Scholarships, 1987–2004*
Degree Attainment of Degree Attainment of Alumni Alumni Part 2, 1987–2004* the Entire Program, 1987–2004*
Indicators Related to Degree Attainment Total % Total %Total Cases: 2,992 100% 3,184 100%
Male 1,919 64% 2,046 64%Female 1,073 36% 1,138 36%
Did not Attain Degree 40 1.3% 43 1.3%Medical/ Deceased During Study Period 7 0% 7 0%Did not Meet Academic Requirements 3 0% 3 0%Other 20 1% 21 1%
Did not Attain Proposed Degree 0% 0%All but Dissertation 2 0% 2 0%Received Degree Other than PhD 6 0% 8 1%Received Degree Other than Master’s 2 0% 2 0%Remaining as Degree Analysis Denominator 2,952 93% 3,141 99%Percent Attained Degree 99% 93% 99% 99%
TOTAL % TOTAL %2992 100% 3184 100%
TABLE T.2.Cohort Groups Statistics
Number of Cases Average Values
Number of yearsMale Female Total Age after graduation
Group 1: Graduated 1988–96 29 12 41 48.4 13.0Group 2: Graduated 1997–2001 171 91 262 41.8 6.7Group 3: Graduated 2002–06 325 184 509 36.8 1.7TOTAL 525 287 812 39.0 3.9

54
TABLE T.3.Residence Status per Gender and Degree
Degree Residence Status TotalOwn country Other Part 2 country Part 1 country Unknown
Master’s Female Cases 222 12 42 2 278% 79.9% 3.6% 15.8% 0.7% 100.0%
Male Cases 407 23 67 7 504% 80.8% 4.6% 13.3% 1.4% 100.0%
TOTAL Cases 629 35 109 9 782% 80.4% 4.2% 14.2% 1.2% 100.0%
PhD Female Cases 6 1 2 9% 66.7% 11.1% 22.2% 100.0%
Male Cases 12 3 6 21% 57.1% 14.3% 28.6% 100.0%Cases 18 4 8 30% 60.0% 13.3% 26.7% 100.0%
TOTAL Female Cases 228 13 44 2 287% 79.4% 4.5% 15.3% 0.7% 100.0%
Male Cases 419 26 73 7 525% 79.8% 5.0% 13.9% 1.3% 100.0%Cases 647 39 117 9 812% 79.7% 4.8% 14.4% 1.1% 100.0%

55
TABLE T.4.Residence Status per Field of Study
Field of Study Residence Status TotalOwn country Other Part 2 country Part 1 country Unknown
Public Policy & Administration Number of cases 125 4 39 2 170
% within field 73.5% 2.4% 22.9% 1.2% 100.0%Economic Policy Management Number of cases 97 10 4 1 112
% within field 86.6% 8.9% 3.6% 0.9% 100.0%Economics & Finance Number of cases 73 7 9 1 90
% within field 81.1% 7.8% 10.0% 1.1% 100.0%Development Studies Number of cases 41 4 9 0 54
% within field 75.9% 7.4% 16.7% 0.0% 100.0%Infrastructure & Civil Engineering Number of cases 67 2 6 0 75
% within field 89.3% 2.7% 8.0% 0.0% 100.0%Environment & Natural Resources Number of cases 30 1 7 0 38
% within field 78.9% 2.6% 18.4% 0.0% 100.0%Water Studies Number of cases 36 1 8 1 46
% within field 78.3% 2.2% 17.4% 2.2% 100.0%Regional & Urban Planning Number of cases 21 0 4 0 25
% within field 84.0% 0.0% 16.0% 0.0% 100.0%Agriculture & Rural Development Number of cases 51 0 11 2 64
% within field 79.7% 0.0% 17.2% 3.1% 100.0%Public Health & Medical Studies Number of cases 29 5 9 1 44
% within field 65.9% 11.4% 20.5% 2.3% 100.0%Other Fields Number of cases 77 5 11 1 94
% within field 81.9% 5.3% 11.7% 1.1% 100.0%TOTAL Number of cases 647 39 117 9 812
% within field 79.7% 4.8% 14.4% 1.1% 100.0%
TABLE T.5.Residence Status per Program Type
Program Type Residence Status TotalOwn country Other Part 2 country Part 1 country Unknown
Regular Program Cases 423 75 26 6 530% 79.8% 14.2% 4.9% 1.1% 100.0%
Partnerships Cases 224 42 13 3 282% 79.4% 14.9% 4.6% 1.1% 100.0%
TOTAL Cases 647 117 39 9 812% 79.7% 14.4% 4.8% 1.1% 100.0%

56
TABLE T.6.Status of Alumni Residing in Part 1 Countries
Gender TotalFemale Male
Working in international/regional organization Count 6 10 16% 13.6% 13.7% 13.7%
Representing own country abroad Count 2 2 4% 4.5% 2.7% 3.4%
Working in academic/research institution Count 7 18 25% 15.9% 24.7% 21.4%
Working in private sector Count 11 21 32% 25.0% 28.8% 27.4%
Working for an NGO Count 5 1 6% 11.4% 1.4% 5.1%
Still studying Count 11 21 32% 25.0% 28.8% 27.4%
Unemployed Count 2 0 2% 4.5% 0.0% 1.7%
TOTAL Count 44 73 117% 100.0% 100.0% 100.0%
TABLE T.7.Employment Status per Field of Study
Employment TotalEmployed Still studying Unemployed
Public Policy & Administration Number of cases 150 17 3 170% within field 88.2% 10.0% 1.8% 100.0%
Economic Policy Management Number of cases 109 1 2 112% within field 97.3% 0.9% 1.8% 100.0%
Economics & Finance Number of cases 86 3 1 90% within field 95.6% 3.3% 1.1% 100.0%
Development Studies Number of cases 51 2 1 54% within field 94.4% 3.7% 1.9% 100.0%
Infrastructure & Civil Engineering Number of cases 75 0 75% within field 100.0% 0.0% 0.0% 100.0%
Environment & Natural Resources Number of cases 34 4 0 38% within field 89.5% 10.5% 0.0% 100.0%
Water Studies Number of cases 41 4 1 46% within field 89.1% 8.7% 2.2% 100.0%
Regional & Urban Planning Number of cases 22 3 0 25% within field 88.0% 12.0% 0.0% 100.0%
Agriculture & Rural Development Number of cases 60 3 1 64% within field 93.8% 4.7% 1.6% 100.0%
Public Health & Medical Studies Number of cases 42 2 0 44% within field 95.5% 4.5% 0.0% 100.0%
Other Fields Number of cases 87 4 3 94% within field 92.6% 4.3% 3.2% 100.0%
TOTAL Number of cases 757 43 12 812% within field 93.2% 5.3% 1.5% 100.0%

57
TABLE T.8.Employment per Group
Group Employment TotalEmployed Still studying Unemployed
Group 1 Count 41 0 0 41% within Group 100.0% 0.0% 0.0% 100.0%
Group 2 Count 253 8 1 262% within Group 96.6% 3.1% 0.4% 100.0%
Group 3 Count 463 35 11 509% within Group 91.0% 6.9% 2.2% 100.0%
TOTAL Count 757 43 12 812% within Group 93.2% 5.3% 1.5% 100.0%
TABLE T.9.Employment Status per Program Type
Program Type Employment TotalEmployed Still studying Unemployed
Regular Program Cases 493 29 8 530% 93.0% 5.5% 1.5% 100.0%
Partnerships Cases 264 14 4 282% 93.6% 5.0% 1.4% 100.0%
TOTAL Cases 757 43 12 812% 93.2% 5.3% 1.5% 100.0%
TABLE T.10.Employment Status per Region of Residence
Employment TotalEmployed Still studying Unemployed
Africa Cases 227 2 1 230% within Region 98.7% 0.9% 0.4% 100.0%
E. Asia Cases 158 2 2 162% within Region 97.5% 1.2% 1.2% 100.0%
ECA Cases 66 2 2 70% within Region 94.3% 2.9% 2.9% 100.0%
LCR Cases 82 2 4 88% within Region 93.2% 2.3% 4.5% 100.0%
MNA Cases 43 0 0 43% within Region 100.0% 0.0% 0.0% 100.0%
S. Asia Cases 92 0 1 93% within Region 98.9% 0.0% 1.1% 100.0%
Part 1 Cases 83 32 2 117% within Region 70.9% 27.4% 1.7% 100.0%
Unknown Cases 6 3 0 9% within Region 66.7% 33.3% 0.0% 100.0%
TOTAL Cases 757 43 12 812% within Region 93.2% 5.3% 1.5% 100.0%

58
TABLE T.11.Distribution of Employed Alumni per Organization Type and Position
Executive Manager/
Senior Senior Policy-Organization Type Position Type Professional Professional Manager Manager maker TotalCentral Government/Agency Cases 138 87 52 13 18 30
% within Type of Organization 44.8% 28.2% 16.9% 4.2% 5.8% 100.0%% of Total 40.7%
Regional/Local Government Cases 11 4 11 4 4 34% within Type of Organization 32.4% 11.8% 32.4% 11.8% 11.8% 100.0%% of Total 4.5%
Public Service Provider Cases 14 10 9 1 0 34% within Type of Organization 41.2% 29.4% 26.5% 2.9% 0.0% 100.0%% of Total 4.5%
Financial Institution Cases 6 8 4 7 1 26% within Type of Organization 23.1% 30.8% 15.4% 26.9% 3.8% 100.0%% of Total 3.4%
Academic/Research Institution Cases 62 25 7 4 1 99
% within Type of Organization 62.6% 25.3% 7.1% 4.0% 1.0% 100.0%% of Total 13.1%
NGO Cases 32 22 13 2 9 78% within Type of Organization 41.0% 28.2% 16.7% 2.6% 11.5% 100.0%% of Total 10.3%
Private Sector Cases 47 22 14 9 10 102% within Type of Organization 46.1% 21.6% 13.7% 8.8% 9.8% 100.0%% of Total 13.5%
International/Regional Organization Cases 43 14 2 0 1 60
% within Type ofOrganization 71.7% 23.3% 3.3% 0.0% 1.7% 100.0%
% of Total 7.9%Bilateral Agency Cases 9 5 2 0 0 16
% within Type of Organization 56.3% 31.3% 12.5% 0.0% 0.0% 100.0%% of Total 2.1%
TOTAL Cases 362 197 114 40 44 757% within Type of Organization 47.8% 26.0% 15.1% 5.3% 5.8% 100.0%% of Total 100.0%

59
TABLE T.12.Distribution of Employed Alumni per Group and Position
Executive Manager/
Senior Senior Policy-Professional Professional Manager Manager maker Total
Group 1 Count 15 11 6 3 6 41% within Group 36.6% 26.8% 14.6% 7.3% 14.6% 100.0%% of Total 2.0% 1.5% 0.8% 0.4% 0.8% 5.4%
Group 2 Count 125 50 40 19 19 253% within Group 49.4% 19.8% 15.8% 7.5% 7.5% 100.0%% of Total 16.5% 6.6% 5.3% 2.5% 2.5% 33.4%
Group 3 Count 222 136 68 18 19 463% within Group 47.9% 29.4% 14.7% 3.9% 4.1% 100.0%% of Total 29.3% 18.0% 9.0% 2.4% 2.5% 61.2%
TOTAL Count 362 197 114 40 44 757% within Group 47.8% 26.0% 15.1% 5.3% 5.8% 100.0%% of Total 47.8% 26.0% 15.1% 5.3% 5.8% 100.0%
TABLE T.13.Skills Enhancement
Methodological Communication & Intercultural Personal Appreciation Technical Skills Skills Negotiation Skills Understanding Development
Cases % Cases % Cases % Cases % Cases %
Very High 190 54.6% 185 53.2% 151 43.4% 212 60.9% 213 61.2%High 111 31.9% 115 33.0% 113 32.5% 83 23.9% 89 25.6%Fair 36 10.3% 40 11.5% 72 20.7% 38 10.9% 36 10.3%Poor 0.0% 0.0% 2 0.6% 1 0.3% 1 0.3%Very Poor 0.0% 0.0% 0.0% 1 0.3% 1 0.3%NA 11 3.2% 8 2.3% 10 2.9% 13 3.7% 8 2.3%TOTAL 348 100.0% 348 100.0% 348 100.0% 348 100.0% 348 100.0%
TABLE T.14.Extent to Which Academic Program Was Useful at Work
Experience- Appreciation Overall Program Courses Research Networks sharing
Cases % Cases % Cases % Cases % Cases %
Very High 196 56.3% 182 52.3% 151 43.4% 125 35.9% 132 37.9%High 102 29.3% 97 27.9% 95 27.3% 102 29.3% 103 29.6%Fair 39 11.2% 54 15.5% 80 23.0% 94 27.0% 95 27.3%Poor 2 0.6% 3 0.9% 5 1.4% 12 3.4% 2 0.6%Very Poor 1 0.3% 1 0.3%NA 9 2.6% 12 3.4% 17 4.9% 14 4.0% 15 4.3%TOTAL 348 100.0% 348 100.0% 348 100.0% 348 100.0% 348 100.0%

60
TABLE T.15.Rating of Professional Benefits Attributed to the Program
Progression MobilityAppreciation Recognition of Skills in Same Job Across Jobs Higher Income
Cases % Cases % Cases % Cases %
Very High 170 48.9% 127 36.5% 116 33.3% 68 19.5%High 91 26.1% 91 26.1% 91 26.1% 76 21.8%Fair 56 16.1% 74 21.3% 91 26.1% 129 37.1%Poor 8 2.3% 20 5.7% 21 6.0% 37 10.6%Very Poor 6 1.7% 8 2.3% 6 1.7% 11 3.2%NA 17 4.9% 28 8.0% 23 6.6% 27 7.8%TOTAL 348 100.0% 348 100.0% 348 100.0% 348 100.0%
TABLE T.17.Alumni Activities and Development
Current Activities Overall Activities
Related to Related to Related to Related to development in own development in other development in own development in other
Appreciation country countries country countries
Cases % Cases % Cases % Cases %
75–100% 169 48.6% 66 19.0% 164 47.1% 63 18.1%50–75% 80 23.0% 72 20.7% 94 27.0% 72 20.7%25–50% 36 10.3% 64 18.4% 37 10.6% 66 19.0%0–25% 29 8.3% 86 24.7% 18 5.2% 84 24.1%NA 34 9.8% 60 17.2% 35 10.1% 63 18.1%TOTAL 348 100.0% 348 100.0% 348 100.0% 348 100.0%
TABLE T.16.Professional Progression after the Program
Higher Grade in Work after JJ/WBGSP Promotion after JJ/WBGSPYes No NA Total Yes No NA Total
Group 1 Cases 14 2 0 16 11 4 1 16% within Group 87.5% 12.5% 0.0% 100.0% 68.8% 25.0% 6.3% 100.0%
Group 2 Cases 73 22 4 99 54 40 5 99% within Group 73.7% 22.2% 4.0% 100.0% 54.5% 40.4% 5.1% 100.0%
Group 3 Cases 176 49 8 233 128 94 11 233% within Group 75.5% 21.0% 3.4% 100.0% 54.9% 40.3% 4.7% 100.0%
TOTAL Cases 263 73 12 348 193 138 17 348% within Group 75.6% 21.0% 3.4% 100.0% 55.5% 39.7% 4.9% 100.0%

Appendix II. Eligibility and Selection Criteria
61

ELIGIBILITY
To apply for a JJ/WBGSP scholarship under the Regular Program, an applicant must:
• Be a national of a World Bank member country that is eligible to borrow.
• Be between the ages of 25 and 45. Applicants born before April 1, 1962 or after March 31, 1982, will not
be considered.
• Have, by March 31, 2007, at least 2 years of recent full-time professional experience acquired after a
university degree, in the applicant’s home country or in another developing country.
• Hold a bachelor's degree or its equivalent;
• Be in good health.
• Be of good character.
• Not be a permanent resident or a national of any industrialized country.
• Not be residing in an industrialized country for more than one year.
• Executive Directors, their alternates, staff of the World Bank Group (the World Bank, International Finance
Corporation, International Development Association, Multilateral Investment Guarantee Agency, and
International Center for Settlement of Investment Disputes), consultants, and relatives of the
aforementioned are excluded from consideration.
PROGRAM OF STUDY
• Eligible applicants should propose a program of study related to development at the master's level, in
fields such as agriculture, economics, education, environment, health, natural resource management, or
other development-related subject.
• The proposed program of study should start during the academic year 2007/2008 for a maximum
duration of two years. The JJ/WBGSP Program does not support applicants who are already enrolled (i.e.,
taking classes) in graduate degree programs.
• Applicants should submit evidence of current unconditional admission to at least one development-
related university master’s degree program and proof of application to a second such program in one
of the Program’s host institutions (see Annex 1). Only admissions in institutions listed in Annex 1
will be considered.
• The Program does not support studies in the applicant’s home country.
• The Program does not support applicants for MBA, MPhil, or PhD degrees.
• The Program does not support legal studies such as JD, LLM, or SJD, except for LLMs related to human
rights, environment, or good governance.
62

63
SELECTION CRITERIA
Eligible applications are assessed according to three main factors: academic excellence, professional
experience, and relevance of program of study. Priority is given to candidates from the public sector with a
high potential to affect the development in their own countries after completion of their studies. To the extent
permitted by Program requirements and selection standards, the JJ/WBGSP
• seeks to maintain a reasonably wide geographical distribution of awards and gives priority to applicants
from low income countries.
• supports promising female candidates;
• gives priority to those candidates who, other things equal, have limited financial resources; and
• encourages studies in line with the Millennium Development Goals, among which are poverty, education,
gender equality, and maternal health. For more details, refer to the following web site:
http://www.developmentgoals.org
SPECIAL CONDITIONS
• In accepting the JJ/WBGSP scholarship, candidates commit themselves to return to and work in their
home countries after completion of their studies.
• In accepting this scholarship, candidates consent to the employment restriction policy of the JJ/WBGSP
and acknowledge that they will not be able to work at the World Bank Group or International Monetary
Fund for three years after completion of their academic program.

Appendix III. Tracer Survey 2006 questionnaires
64

65

66

67

68
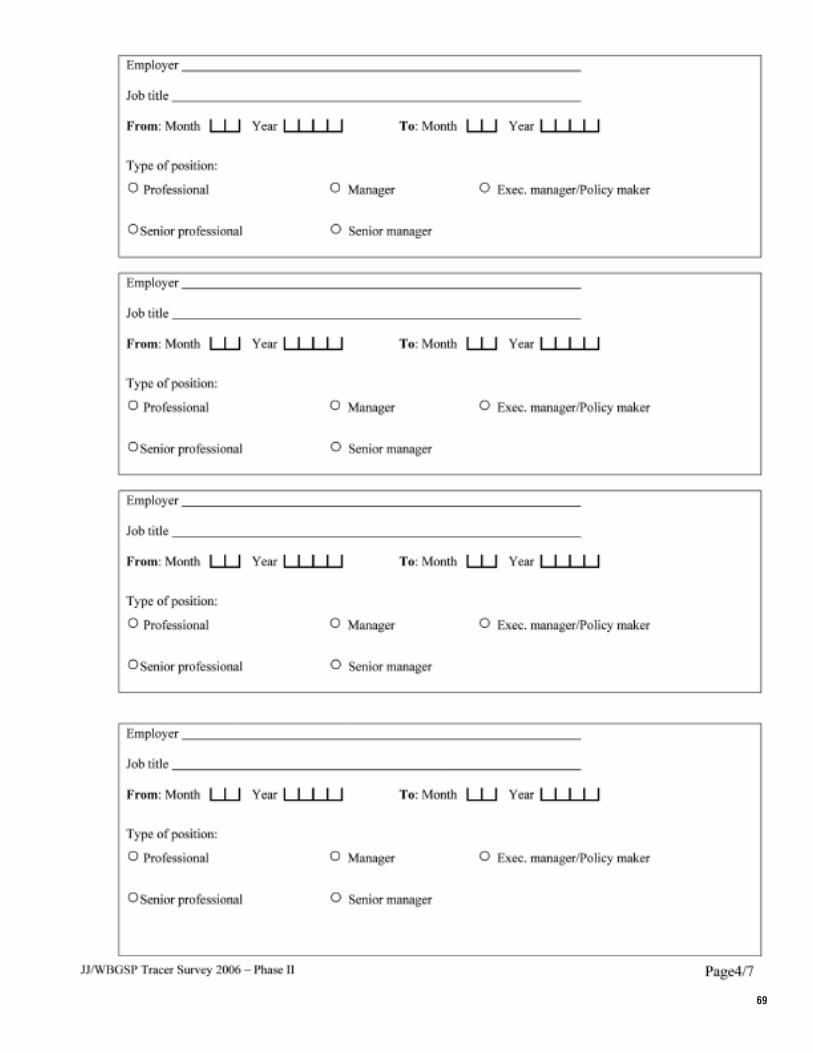
69

70

71

72

73
Mary Onyango currently works at Maseno University in Kenya and carries out research on African indigenous vegetables.I was a JJ/WBGSP scholar in 1992 at the University of London where I studied for a doctorate degree in
horticulture, graduating about 10 years ago. I am currently working at Maseno University in my home country,
Kenya. I am happy to say that despite all the problems we have in our countries, it is very gratifying to feel that
I am contributing in my own small way to the development of my country.
As a result of the training and skills I received during my studies in the United Kingdom, I am involved in
training young scholars in the field of horticulture. Kenya is an agricultural country and depends a lot on the
horticultural sector for foreign exchange. In addition to teaching at the university, I also carry out research on
vegetables, with a particular interest in African Indigenous vegetables. Such vegetables are some of the food
plants that have great value and potential and that could play a major role in the livelihoods of the many rural
communities in my country.
Yam Nath Sharma works at the National Planning Commission of Nepal.I was fortunate enough to have the opportunity to graduate in Public Policy and Taxation (PPT) as part of the
master’s program from Yokohama National University in 2000. Those two years of study in Japan were the
most productive parts in my life in terms of learning, building confidence, and making friends. My
participation in the program turned out to be a new beginning for my career.
On my return to my home country of Nepal, I was posted at the training center under the Ministry of Finance
as a revenue instructor. Later, I was transferred to the Ministry of Finance with assignments as a special
deputy. After being promoted, I am now working at the National Planning Commission Secretariat. The habit
of working hard and appreciating the hard work of others that I learned from studying in Japan will always
help me to succeed in any organization. I have initiated a number of activities toward achieving public sector
reform, the results of which are yet to be seen.

JOINT JAPAN/WORLD BANK
GRADUATE SCHOLARSHIP
PROGRAM (JJ/WBGSP)
TRACER STUDY VII
May 2007
Phone: 202-473-6849
Fax: 202-522-4036
www.worldbank.org/wbi/scholarships/
Email: [email protected]
THE WORLD BANK
1818 H. Street, NW
Washington, DC 20433
USA
www.worldbank.org/
Information Line: 202-458-2498
Email: [email protected]