traceability and demand sensitiveness: evidences from...
TRANSCRIPT

1
Traceability and demand sensitiveness: evidences from Italian fresh potatoes consumption1
Francesco Caraccioloa, Luigi Cembaloa
aDepartment of Agricultural Economics and Policy, University of Naples Federico II, Italy Keywords: Traceability, early potato, censored demand system estimation, sample
selection approach. JEL classification: [D12, C31, C34]
Abstract
When a traceability system takes place, either when mandatory or voluntary, many questions arise that need to be addressed and answered. One of the firsts concerns whether it introduces new costs with no gain in efficiency or, on the contrary, the system efficiency increases lowering costs and, as a consequence, market price of the good in hand. Among others, another issue that only rarely is addressed regards the effect of a price change on the final market. The objective of this paper was to simulate the effect on fresh Italian vegetables market of prices change due to a newer traceability procedure, focusing on early potato. Reasons why early potato was the main object of our study will be explained in detail later in the paper. Moreover, this study concerns a demand system estimation that has, as main goal, the measurement of own and cross price elasticities as well as expenditure elasticities. Such estimations are not strictly related with traceability because they measure any change in quantity demanded due to price changes due to any market perturbation. However, since early potato is experiencing a peculiar market and chain change in Italy, our simulation is meant to reason in terms of a “what if” approach, formally simulating the effect of any change in price due to an hypothesis of traceability system involved. In order to estimate a demand system, real household consumption data (3,000 observations) of a statistically representative sample of the Italian population of households was taken into account. Relevant measures of market variables were estimated by means of a Linear Almost Ideal Demand System implementing a large set of fresh vegetables: potato split in early and late, cabbage, salad, mushrooms, fruits vegetables, roots, asparagus, onion, tomatoes, peppers, cucumbers, beans, zucchinis and others.
1 This research was financed by the Italian Ministry of Agricultural Food and Forestry
Policies (TIPIPAPA project). We would like to thank Gary D. Thompson, Pasquale Lombardi, as well as colleagues and participants from various seminars for useful discussions and comments. However, authors are solely responsible for all errors and omissions. Corresponding author: Luigi Cembalo (Ph.D). Dipartimento di Economia e Politica Agraria, Via Universita’, 96 - 80055 Portici (Naples) ITALY. Tel. +39 0812539065 Email address: [email protected]

2
1 Introduction
Traceability can serve various purposes in the food sector, including that of chain
quality control. However, the aspects that seem to be most frequently required of
traceability are those related to food safety. Nevertheless, traceability systems
development has recently shifted its focus from the major aspects of food safety to a
price premium search approach. Although such an approach often appears to lie
behind production strategies, there is no technical or theoretical evidence to support
it: traceability systems do not guarantee, per se, quality. On the other hand, a rigorous
traceability system that pursues multiple objectives involves costly procedures that
are very likely to feed all the way up to the consumer side. However, in some cases, a
traceability system involves an efficiency gain along the chain that induces costs
reduction and market price stability and/or enhancement. In both cases, the most
likely scenario is that some changes in prices occur.
The mainstream literature is rich in technical and economic studies on
traceability. Nevertheless, little has been written on the effects of traceability costs
change on quantity demanded. While numerous studies show a higher consumer
willingness to pay for certified products, it is not clear in what way and to what extent
price changes affect the market.
The objective of the present study is to estimate the effect of the introduction of a
potentially rigorous traceability procedure on the Italian fresh vegetables market, with
particular attention to new potatoes. In order to do so, a system of demand functions
was built on real household consumption data (3,000 observations) statistically
representative of the Italian population of households. Own- and cross-price
elasticities, as well as other relevant measures of market variables, were estimated by

3
means of a demand system for a large set of fresh vegetables (potatoes split into early
and late, salad, pulses, eggplants and peppers, asparagus, spinach, tomatoes, carrots,
fennel, IV vegetables and others).
The traceability procedure took in mind in our study is only potential. It is now
under study at the University of Naples Federico II in a project financed by the Italian
Ministry of Agricultural and Forestry Policy. This system allows a fresh vegetable
product to be unequivocally traced by means of molecular and spectrometer
techniques. Although the study concerns new potato, results can be easily applied to
other fresh vegetables. Indeed, while our demand system estimation focused on new
potato, since we implemented a system of equations representing a large set of fresh
vegetables, a larger amount of information for a wider set of products was obtained.
From an empirical point of view, according to the established consensus, demand
system estimates based on household cross section data can be cumbersome on
several grounds. The two main ‘dangers’ are violation of theoretical regularity
restrictions (Barnett and Serletis, 2008) and possible sample selection bias due to only
a fraction of the population that has non-zero consumption for the items under study
(new potatoes are consumed by 51.7% of Italian households). A Linear
Approximation of an Almost Ideal Demand System (LA-AIDS) was used applying a
two-step censored demand system approach (Shonkwiler and Yen, 1999).
In section 2 some background on traceability is outlined. In section 3 research
outline and study motivation are presented. Section 4 is dedicated to data description.
Section 5 concerns demand model specification, some econometric issues addressed,
result and forecasts obtained by the demand model. The paper ends with some
concluding remarks.

4
2 Background on traceability
Traceability may be considered as a product differentiation system and is commonly
used by the food industry. Once contamination has been detected, traceability systems
allow the source of a product to be identified, thereby enabling the situation to be
remedied and limiting costs to total or partial product withdrawal from the market.
Traceability has to be primarily viewed as a means to enhance safety in the food
chain. The recent development of traceability systems for production and market
sectors has sought to translate attention from the primary concept of food safety into
the search for a consumer price premium. This approach appears to be becoming
increasingly established in product strategies even if there seems to be no theoretical
motivation in support: traceability systems do not guarantee pursuance of product
quality; rather, they ‘simply’ trace it ‘from the field to the fork’.
The International Organization for Standardization (ISO 9001:2000) defines
traceability as the ability to identify and trace the history, distribution, location, and
application of products, parts, and materials. The Codex has adopted this definition to
determine guidelines and standards for traceability (Codex Alimentarius Commission,
2001). The European Union has defined traceability with particular reference to GMO
products or their derivatives.
The most significant motivation was to be ready for any undesired eventuality at
any stage of the chain for withdrawing the products causing a potential risk for
consumers. In this case, traceability ensures the timely intervention of product
withdrawal, as well as the reduction in costs in implementing withdrawal, being able
to focus on withdrawing one or more brands, rather than withdrawing from the
market an entire product category.

5
The economic literature has studied the phenomenon and functioning of
traceability in various respects. Although traceability arose for the main purpose of
ensuring food safety, Dickinson and Bailey (2002) showed, in an experimental
market study, that consumers are willing to pay a price premium for those products
that clearly show they are traceable.
Various traceability systems have been established in Europe and North America.
In Canada, for example, traceability has been developed jointly with an integrated
quality system so as to give foreign markets assurances, especially with regard to
meat. In this case, it should be noted that the prime resistance came from producers
insofar as they resented government interference on the issue of regulation, and hence
violation of the freedom to make entrepreneurial decisions, of their own business.
Moreover, the incentives derived from any price premium are unlikely to affect the
production phase, tending to be distributed among the various actors in the chain in
the post-production phase.
Since January 1st 2005 in the European Union, it has become mandatory for all
food products to follow a procedure of traceability (Regulation EC no. 178/2002; de
Stefano, 2007). The European Union issued two laws which, amongst others,
provided the definitive thrust for setting traceability procedures that met the absolute
priority for food safety. One of these, EC Reg. 178/2002 established the general
principles and requisites of food legislation and set up the European Authority for
Food Safety, establishing procedures in the ambit of food safety. The other, EC
Regulation 1830/2003, concerned traceability and the labelling of GM products or
their derivatives.
While the objectives and guidelines for the mandatory introduction of traceability
in the agro-food system are clear, the effects that this system might have on

6
production, the distribution chain and end-consumers are somewhat controversial. A
recent report of the USDA (United States Department of Agriculture) concerning
traceability in the USA summarises the results from the most recent economic studies
on traceability2. The essential points that are considered appropriate to stress are as
follows: 1) economic efficiency of traceability varies from case to case; 2) in almost
all cases complete traceability cannot be achieved or, if it can, it is done so at very
high costs; 3) benefits, especially at the production level, are not always assured, and
when they are, their distribution is often asymmetric and inefficient.
3 Research outline and motivation
The demand for food safety is an age-old demand from the consumer. Obviously,
albeit necessary and a reason for pleasure, food consumption entails the intake into
the human organism of completely extraneous substances. Hence, a latent demand for
food with a zero hazard level has always existed. What has changed in a highly
evolved technological society is the relationship of the consumer with the eternal
dilemma: need for nutrition vs. risk of introducing harmful substances into the
organism.
The society of risk, according to Beck’s definition, generates as a ‘spillover’
permanent new fears and new risks together with the undoubted benefits arising from
a hitherto unknown process of technological innovation. Faced with this situation,
consumers on the one hand appreciate or negatively experience innovations; on the
other, in particular in the food sector, they show increasing demand for safety.
Together with a subjective perception of the distribution of probability of the adverse
2 For further details on this study see the Internet site http://www.usda.org where the
document is available

7
situation, which is completely different from that defined by the experts, this
increased demand for food safety systematically generates crises of collective panic
(risk of pesticides, BSE, avian flu, etc.) which in turn give rise to serious instabilities
on agri-food markets.
As has been amply shown by Bevilacqua (2004), the path followed by public and
private research in the agri-food sector in the last two decades explains the deep-
seated mistrust harboured by many consumers, especially in Europe, over statements
coming from the scientific community. Hence any reassurance made by experts in a
period of crisis has a negligible effect on consumers.
In the context of industrialised countries, the benefits to be achieved by food
safety policies are twofold. They not only allow the saving of human lives and
avoidance of suffering, but also reduce the instability of the product markets
concerned. As regards the latter, the cases of BSE and avian flu are particularly
illustrative. Due to avian flu, poultry consumption in Italy collapsed in the months
following the event. Twelve months from the outbreak of panic, consumption was
about 18% lower than the previous year’s levels. At the same time, prices had fallen
by about 8%. The drop in demand and prices following the outbreak hit all the
developed countries, but to a different extent. Italy was the country with the largest
decline, showing extreme sensitivity to the crisis in the food safety system
(Mazzocchi, 2005).
The aim of policies such as those for traceability, set up immediately after the
wave of panic generated by BSE, is to reduce the impact of such crises upon markets.
One wonders, however, when tackling a completely new consumer hazard like BSE
or avian flu, whether this instrument is really effective.

8
Yet food safety policies usually entail particularly high social costs. It is therefore
important to know the effects on consumption of price increases arising from added
costs due to traceability procedures. The conviction is that pursuing the worries of the
consumer could have a profoundly detrimental effect upon system efficiency.
The present paper refers to a traceability procedure being studied within the
framework of a project at the Agricultural Faculty of Naples University funded by the
Italian Ministry of Agricultural and Forestry Policy. The project sets out to ascertain
whether a traceability system can be found for the potato using the analytical method
based on Nuclear Magnetic Resonance (NMR), which allows the product to be linked
to soil through chemical analysis. In this way, the product’s geographical origin can
be determined by region, macroregion and/or continent3.
Achievement of geographical recognisability would lead to two major results in
the ambit of food safety and quality:
1. identification of product origin would combat counterfeiting and fraud,
regrettably somewhat widespread, thereby safeguarding production value;
2. characterisation of various products would enhance knowledge of quality
aspects and capitalise on their typicality with clear benefits for the consumer.
The research typically adopts a chain approach. However, an important link is the
behaviour of consumers faced with end product price variations. In particular, it
becomes indispensable to know the effects on demand for the good in question and
the reallocation determinants of household expenditure for fresh vegetables.
3 This newer and potential traceability system would be stricter than the one required by the
actual regulation. The underline idea is to implement this procedure to pursue a premium price generated by a clear identification system.

9
As regards products, the key focus of our research is the new potato. Though
present on the market for no more than two months a year, the new potato is a
particular important crop chiefly in Sicily, Campania and Puglia. The fortunes of this
crop lie in the fact it ripens before the common potato, reaching markets in a period
when there is not yet active competition with the common potato. The economics of
the sector comprising the new potato is particularly important. However, the problem
which the sector has to tackle is twofold: both competition, especially pricewise, from
non-EU Mediterranean countries and, above all, the fact that, after entry into Italy,
imported new potatoes can no longer be distinguished from their Italian counterparts.
This chiefly occurs due to insufficiently stringent legislation on the origin of farm
produce. Hence, the objective to set up a traceability system based on an analysis
technique such as to detect the source of produce through soil residues on tubers.
As we already point out in the introduction, a rigorous traceability system
involves, at least in the short period, costly procedures that are very likely to feed all
the way up to the consumer side. So it is consistent to predict the effects of this
increasing of prices due to traceability on the demand side. The following three-step
strategy has been performed. First a benchmark has been built through the demand
system estimation; second the traceability adoption has been included increasing the
sale price; third, the estimated model has been used to forecast the traceability effects,
providing a set of quantitative predictions on measures of interest.
4 Data description
In our paper household consumption micro-data are used to distinguish among
different household types (e.g. by socio-demographic characteristics, Huang and Lin,
2000) and evaluate how they respond to changes in prices. Households are sampled in
10
a statistically representative way by GFK-Eurisko (a leading market research
organization operating in Europe) which collects household real consumption of
many products. Households involved in the GfK panel regularly record their
purchases through a scanner (ConsumerScan). In accordance with our study purposes,
the collected data thus consist of household expenditure and are representative of
Italian domestic consumption of fresh vegetables. For each household GFK-Eurisko
also collects other information, such as socio-demographic data, that are crucial in a
consumer side study.
We collected value (€) and volume (kg.) of purchases made by 2,849
representative Italian households for fresh vegetables (for a total of 49 items), during
the period September 2008 - September 2009. Information on prices paid by each
household are provided through unit values (€/kg.).
Following the guidelines in Deaton and Zaidi (2002), when the prices were
unavailable due to the household’s non-consumption of the listed item, we replace
unobserved values with the median reported by households per degree of urbanization
and region of residence. Quantities (kg.), prices (€/kg.) and expenditure (€) of fresh
vegetables are then grouped in 12 homogeneous categories. The final fresh-vegetable
groups are: salad, pulses, potatoes, eggplants and peppers, asparagus, spinach,
tomatoes, new potatoes, carrots, fennel, IV vegetables and other vegetables.
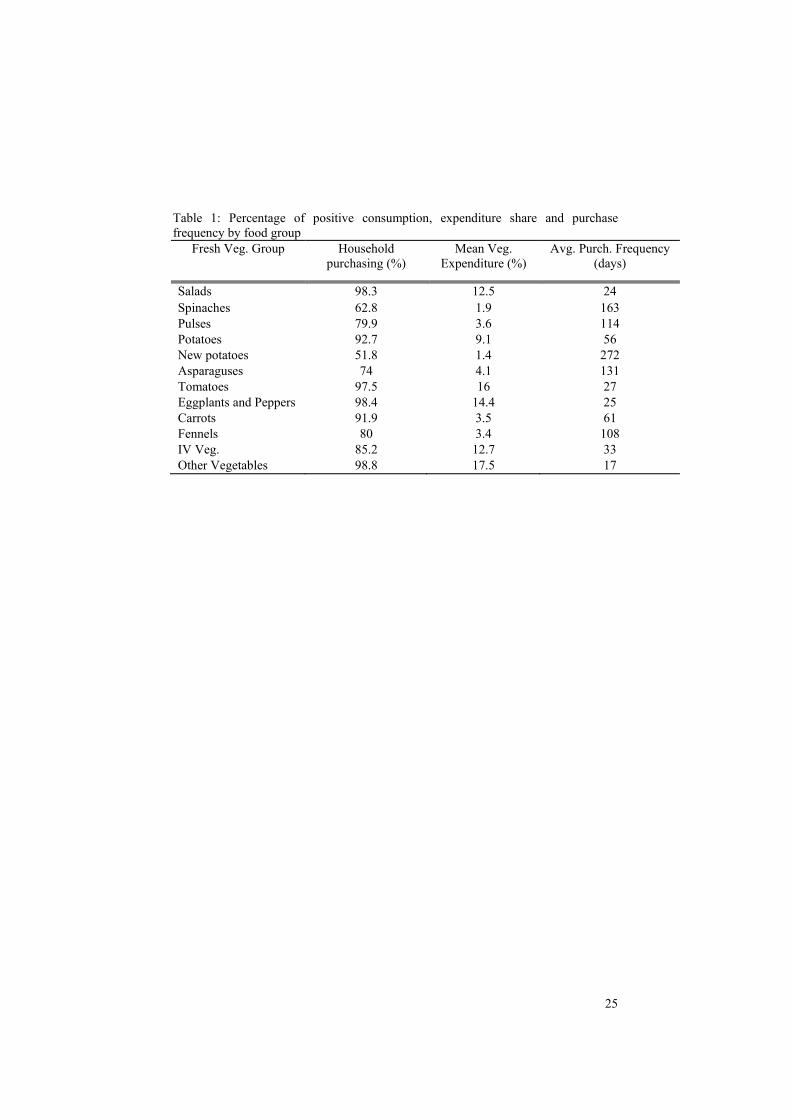
As can be seen from the summarised statistics of the vegetable groups included in
the model (Tab. 1), for our representative sample the average household expenditure
on fresh vegetables per year is nearly €257. Percentages of zero food-consumption
(censoring) are substantial, especially for our target food category, new potatoes,
which were consumed by 51.8 percent of households. Italian households spent 1.5
percent of their fresh vegetables budget on new potatoes, 9.1 percent on potatoes,

11
although the prices of the two food items (potatoes and new potatoes) are quite
similar (respectively €0.90/kg and €0.96/kg).
Finally, Table 2 describes the variables used in the empirical model. Almost 70
percent of households have no children younger than 15 years old, and 27 percent live
in a city with more than 100,000 inhabitants. As regards the educational level of
household heads, 44 percent of household heads have high school diplomas or
university degrees.
5 Traceability: Demand System approach
5.1 Demand Model Specification
In this section, we present the economic model adopted to estimate the system of
demand. Huge attention in the economic literature has focused on consumer demand
modelling. A recent work of Barnett and Serletis (2008) surveys the extensive
scientific discussion on the subject. Following other food demand studies applied to
cross sectional survey data on expenditure (Huang and Biig-Hwan Lin, 2000; Akbay,
et al., 2007; Haq et al., 2008;) the functional form chosen to specify the model is a
linear approximation (LA) of the Almost Ideal Demand system (Deaton and
Muellbauer, 1980). Although many alternatives to the AID system exist, including the
QAIDS (Banks, et al, 1997) which has the advantage of a more flexible specification
of the Engel curves, the LA-AIDS model was preferred for its well-known theoretical
properties. Furthermore, it presents a computationally reasonable level of
complication when a two-stage estimating equations approach for the censored
dependent variable is empirically embedded. The adopted procedure (Shonkwiler and

12
Yen, 1999) consistently solves the problem of corner solutions of zero-food
consumption.
We consider a consumer multi-stage budgeting process that implies home
consumption of fresh vegetables as strictly separable from the demands for other
goods. This hypothesis justifies the exclusion of other goods expenditure on which
information is not fully available. The assumption is reasonable if the estimation
objectives are restricted to understanding consumption substitutability in the same
food category.
Deaton and Muellbauer (1980) consider a first order approximation of the demand
functions allowing exact aggregation over consumers, and propose a system of
equations for the budget share wi of the ith good (LA model) as
∑=
+⎟⎟⎠
⎞⎜⎜⎝
⎛++=
J
jiijijii u
PXPw
1 ** lnln βγα ∀ i= 1,…, I (1)
where Pj is the price of the j-th good, X is the total expenditure on food categories in
the system, αi*, βi and γij are parameters for the demand shifter, for own-, cross-price
and expenditure elasticities respectively, ui is the error term and P* is a price index,
useful to standardize all prices. It must be recognized that the possible measurement
error introduced by the Stone price index would make the estimate inconsistent.
Hence, in line with other studies we use the following specification (Moschini, 1995):
∑=
=I
iii PwP
1* lnln (2)
where iw is the mean budget share. We also introduce a set of K demographic
attributes that are demand shifters, such that:

13
∑=
+=K
kkikii Daa
1* δ ∀ i= 1,…, I (3)
The economic theory provides a set of restrictions that are known as homogeneity,
adding-up and symmetry. The symmetry and homogeneity conditions are respectively
imposed by:
γij= γji ∀ i,j= 1,…, I; (4)
and
∑ =j
ij 0γ ∀ i,j= 1,…, I; (5)
As the adding-up issue is still an open question in censored demand systems,
following other studies we prefer to perform estimation ignoring the restriction
(Drichoutis et al., 2008).
5.2 Econometric model issue
The statistical and economic importance of censoring data has amply demonstrated,
starting from the works by Gronau (1974) and Heckman (1979). In consumer demand
studies the zero-food consumption problem arises because only a subset of
households shows a positive consumption for the i-th good. If a consumption
equation were to be based only on the subset, it would probably estimate a significant
effect on the level of consumption for those covariates that, instead, affect the
probability of positive consumption (a spurious relation). More formally, estimates
would be inconsistent but simple procedures fix the problem, treating it as a
specification error. Heckman (1979) suggests a simple two-step approach to solve the
censoring problem: in the first step the probability of non-nill in the censored variable

14
is estimated, then in the second step the new set of covariates includes the inverse
Mills ratio to correct for the selection bias.
In a demand system case, since the seminal work of Heien and Wessels (1990),
several empirical procedures for censored data have been developed such as those
suggested by Perali and Chavas (2000) and Shonkwiler and Yen (1999). Following
Shonkwiler and Yen (1999) the zero-food consumption for a demand system of I
equations is modelled as below:
1222211*
1 )ˆ()ˆ()( exxxy ++Φ= βδφββ ⎩⎨⎧
==
∀Nn
Ii,,1,,1
K
K (6)
and
⎥⎦⎤
⎢⎣⎡ −+⎥⎦
⎤⎢⎣⎡ Φ−Φ+= ),2
ˆ,2(),2,2(),2
ˆ,2(,2,2(),1,1( iixiixiiixiixiixiuie βφβφδβββ (7)
where )ˆ( 22βφ x and )ˆ( 22βxΦ are the probability density function (PDF) and the
cumulative distribution function (CDF) respectively, which are obtained from a probit
model using the equation 8 in the first stage,
y2*=(x2β2+e2) (8)
with
⎪⎩
⎪⎨⎧
=
>=
00
01*2
*2
2 yif
yify (9)
and
y1=y2y1* (10)

15
To estimate a system of I equations, an ITSUR approach jointly considers the
covariance in the consumption equations. For the same reason as in the single-
equation case due to the downward bias of the population variance, we also
bootstrapped the standard errors.
5.3 Empirical results
The entire sample was used in the above-specified model, addressing the problem of
corner solutions of non-positive food consumption. Overall, the demand system
results (Tab. 3) show a reasonable goodness-of-fit in spite of the cross-sectional
characteristics of our estimation: R2 values lie between 0.22 (new potatoes) and 0.78
(other vegetables). Coefficients on the PDF (δφ) are on the whole statistically
significant (except for the spinach equation) and positive (except for fennel equation).
It strongly supports the idea that correction for sample selection bias was necessary.
Although 65 percent of the estimated parameters are different from zero at the 10 per
cent level or less, almost all the own-price parameters are significantly different from
zero (except for the potato equation).
As discussed in the previous section the cross-price parameters are symmetric due
to the imposed restriction γij=γji. Socio-characteristic variables included in the model
also influence demand statistically, especially the regional dummies. Most degrees of
urbanization and employment status of the household head dummies are also
statistically significant.
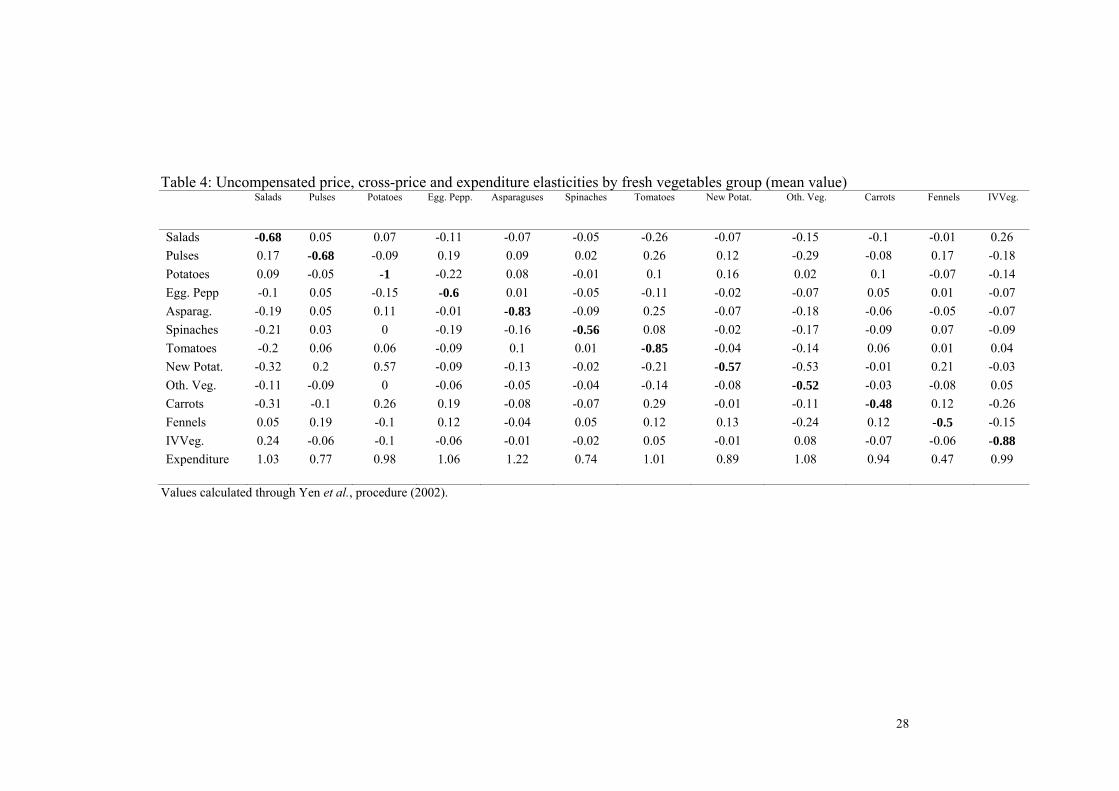
Marshallian own- and cross-price average elasticities and expenditure average
elasticities are shown in Table 4. The elasticities are calculated by the parameters
estimated (Tab. 3) through the procedure suggested by Yen et al., 2002:

16
1ˆ/)()ˆ( 22 −Φ−= iiiiiii wxw ββγη , (11)
ijiijii wxw ˆ/)()ˆ( 22ββγη Φ−= (12)
and
iii wx ˆ/)(1exp 22 ββΦ+= (13)
The sign of own-price and expenditure elasticities are consistent with theory, and
their magnitudes are within the expected range.
The demands for IV vegetables are more price-sensitive to price changes (ηii= -
0.88) than cheaper food such as carrots (ηii = -0.48), new potatoes (ηii = -0.57) and
fennel (ηii = -0.50). Uncompensated cross-price elasticities are generally small in
magnitude, especially when there is a complementarity relation (ηij < 0). The
relationship of complementarity (ηij < 0) and substitutability (ηij > 0) between fresh-
vegetable categories indicate changes in consumption pattern resulting from price
changes.
Combining the box plot and density trace (or smoothed histogram) into one
diagram (Hintze and Ray, 1998) the distribution of heterogeneity among households
may be further explored for new potato own-price elasticities. Figure 1 shows two
distinct peaks around the values of ηii equal to - 0.6 and - 0.4. The heterogeneity is
due mainly to regional characteristics of the population, as also demonstrated in more
details by Fig. 2. In southern Italy demand for new potatoes is more inelastic than in
northern or central Italy due to local food habits. The discovered heterogeneity will be
used in the course of this paper to figure out the impact of traceability on consumers
choices.

17
The consequences of a j-th good price change on the demand for i goods (ceteris
paribus) is reported by each j-th column (Tab. 4). As regards the new potatoes
column, the results strongly confirm a relation of substitutability with potatoes (ηij =
0.16), fennel (ηij = 0.13) and pulses (ηij = 0.12). Although some complementarities
exist, they are small in magnitude and except for salad (ηij = -0.07) and other
vegetables (ηij = -0.08) they are not statistically significant. The above result may
suggest that consumers do not compare often relative prices among all the widely
differing fresh vegetables. Nevertheless, it is not a coincidence that the cross price
elasticities between potatoes and new potatoes magnitudes’ are large and statistically
bigger than zero, confirming the obvious substitutability between the two vegetables.
The consequences of changes in demand for the i-th good due to the change in j good
prices (ceteris paribus) can be investigated from each i-th row. As regards the new
potatoes row, an increase in the price of potatoes (ηij = 0.57) has practically the same
impact on the demand for new potatoes as an increase in the price of new potatoes (ηii
= 0.57). Unexpectedly, both other vegetable (ηij = -0.53) and salad prices (ηij = -0.32)
also seem to considerably affect the demand for new potatoes. A reasonable
explanation lies in the fact that both demands are quite inelastic, and are characterized
by a high expenditure share. An increase in their prices causes a reallocation of the
expenditure among the goods, with direct repercussion on new potato consumption.
In the next paragraph the relevance of estimation results will be stressed
especially as concerns the interpretation of the relationships between the goods
involved in the traceability program. The quantitative evidence will support the
qualitative intuition about the link between price-sensitiveness and consumers’
attitude toward traceability.

18
5.4 Simulation results
The previous analysis is the first step for the main objective of the paper, which
consists on the assessment of the effects of the introduction of a newer and stricter
traceability program on new potatoes. With regard to adopted strategy, it is crucial to
remind that the modelling aim’s is in showing roughly trends, rather than precise
predictions, consequently due the following approximations used. First of all, the
traceability adoption has been included in the model as a “pure cost” t increasing by a
quota s, the sale price, of the product of interest (t = s x P).
Secondly, a possible higher consumer willingness to pay for traceable product has
not been here considered. Thirdly, the analysis includes only ceteris paribus short-
time effects, involving the strict separability of the estimated demand model.
Regarding the choice of the quota s, Regattieri et al. (2007) calculated a total cost
of traceability implementation equal to 0.07 €/kg for the Parmiggiano Reggiano
cheese. Focusing on Italian beef supply chain, Mora and Menozzi (2005) reported a
total cost of around 4 percent on total costs of production of meat. This cost
represents obviously a very delicate point when the value of the product is very low
(Regattieri et al., 2007) while tracing and tracking the origin of a raw perishable food
product with a large area of production such as new potato poses a scientifically
complex challenge. The s parameters are so motivated, by choosing a small interval
around the nominal value of s x P = 0.07 €/kg (s = 0.05; s = 0.07; s = 0.10; s = 0.15).
Table 5 shows the simulated traceability impact on household’s food
consumption, per different values of t. Notice that there is a compounded effect, one
indirect on the propensity to buy the product, measured by the changes in market
penetration, one direct on the quantity consumed.

19
The different traceability scenarios imply an expected reduction of new potatoes
consumption across household while they shift consumption to other food groups, in
particular to potatoes. Regarding the consumed quantity, the result confirms that we
could likely observe a significant change in potatoes consumption set, due to
variations of the sale price. The outcome is definitely not surprising and fully
consistent with the previous elasticity estimation.
Beyond the estimated impact reported, it is necessary to remind that the common
potato is, in terms of Italian food habits, a direct substitute of the new potato. In the
presence of similar prices between the two potato types, increasing the price scissor
would amplify the substitution effect. A similar result set can be, in fact, observed
lowering the price of common potatoes.
6 Concluding remarks
The purpose of our research was to estimate the effects of potential price changes
upon fresh vegetable demand resulting from the introduction of an innovative method
of traceability that ensures the geographical identification of the product. Although
our study focused on the new potato, by implementing a demand estimation model for
the whole category of fresh vegetables we were able to obtain detailed information on
almost all the other complementary and substitute products of the new potato. The
study was carried out in 2009 using consumption data for about 3,000 Italian
households that were statistically representative of the nationwide population.
The hypothesis empirically tested in this study was motivated by the fact that,
with respect to food safety, consumer attitudes and those of policy makers appear
more focused on reassurance at any cost rather than actual knowledge of the effects

20
on markets arising from the introduction of regulatory standards that impose product
traceability along the whole chain. This behaviour has not always obtained the
desired results. Faced with the mere perception of hazard for a certain product,
consumers react in the vast majority of cases with behaviour of real collective panic
towards that project or category of products, despite the presence of control and
traceability systems.
The cost of implementing the new traceability system, and how it will be
transmitted along the supply chain to the consumption side, is not yet known.
However, some reflections may be made on the new potato market according to how
the system is introduced. Let us assume that a stricter traceability system would
become mandatory for all or some of the products of the same goods category. This
will lead to the current situation in which, assuming that the unit costs of
implementation are the same for each product, a negative externality is induced in the
short run in the market whose costs are likely to be borne by the end consumers. This
has already happened in Italy for other product categories in which the obligation of
traceability entailed an inefficient allocation of costs among the economic agents of
the chain. This holds even more for production in which an almost entirely
competitive form of market may be observed4.
Alternatively, one could conceive of a voluntarily implemented traceability
system, like that currently researched by the University of Naples, which also certifies
product origin. In this case, entrepreneurial success would stem only from consumer
willingness to pay a premium if the certified end product is perceived as a superior
4 Many farm products in Italy show that in the business phase the production costs do not
deviate significantly from the sale price of the product.
21
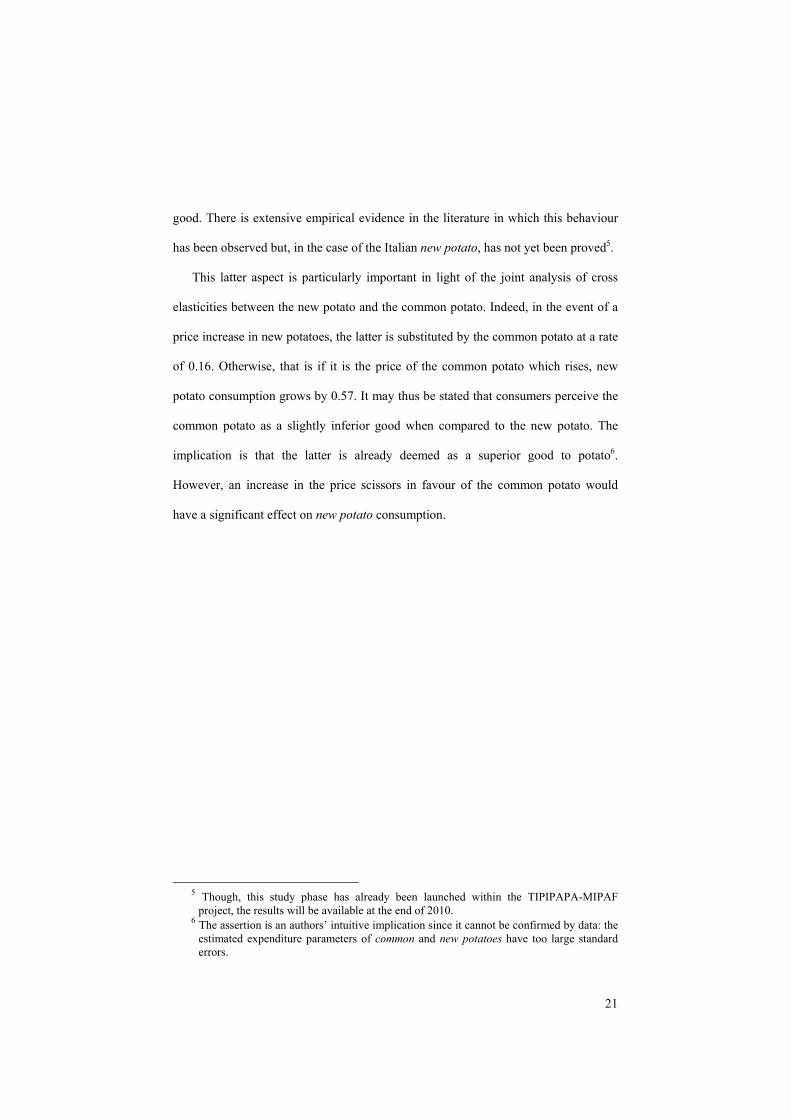
good. There is extensive empirical evidence in the literature in which this behaviour
has been observed but, in the case of the Italian new potato, has not yet been proved5.
This latter aspect is particularly important in light of the joint analysis of cross
elasticities between the new potato and the common potato. Indeed, in the event of a
price increase in new potatoes, the latter is substituted by the common potato at a rate
of 0.16. Otherwise, that is if it is the price of the common potato which rises, new
potato consumption grows by 0.57. It may thus be stated that consumers perceive the
common potato as a slightly inferior good when compared to the new potato. The
implication is that the latter is already deemed as a superior good to potato6.
However, an increase in the price scissors in favour of the common potato would
have a significant effect on new potato consumption.
5 Though, this study phase has already been launched within the TIPIPAPA-MIPAF
project, the results will be available at the end of 2010. 6 The assertion is an authors’ intuitive implication since it cannot be confirmed by data: the
estimated expenditure parameters of common and new potatoes have too large standard errors.

22
References
Akbay, C. , Boz I. and W. Chern, (2007). “Household food consumption in
Turkey. ”, European Review of Agricultural Economics, 34(2): 209–231.
Banks, J., Blundell, R. and A. Lewbel, (1997). “Quadratic Engel curves and
consumer demand”, Review of Economics and Statistics 79, 527539.
Barnett, W. A. and A. Serletis (2008). “Consumer preferences and demand
systems“, Journal of Econometrics 147(2): 210-224.
Beck, U. (2000). La società del rischio. Verso una seconda modernità, Roma,
Cartocci Editore.
Bevilacqua P. (2004). La mucca è savia: ragioni storiche della crisi alimentare
europea, Donzelli Editore, Roma, pag. 130.
Dickinson, D. L. and B. DeeVon, (2002). “Meat traceability: Are U.S. consumers
willing to pay for it? ”, Journal of Agricultural and Resources Economics,
vol. 27, issue 2(December).
Deaton, A. and J. Muellbauer, (1980). “Economics and Consumer Behavior”,
Cambridge University Press.
Deaton, A. and Zaidi, S. (2002), “Guidelines for Constructing Consumption
Aggregates for Welfare Analysis”, World Bank Publications.
de Stefano F. (2007), “Problematiche economico-sociali dei paesi avanzati:
intervento pubblico sulla sicurezza alimentare”, XLIV Convegno SIDEA

23
“Produzioni agroalimentari tra rintracciabilità e sicurezza: analisi economiche
e politiche di intervento”, Taormina, 8-10 novembre 2007
Drichoutis, A. C., Klonaris, S., Lazaridis, P. and R. M. Nayga, (2008).
“Household food consumption in Turkey: a comment.”, European Review of
Agricultural Economics 35:93–98.
Gronau, R. (1974). “Wage Comparisons - A Selectivity Bias”, The Journal of
Political Economy 82: 1119–43.
Heckman, J. (1979). “Sample Selection Bias as a Specification Error”,
Econometrica 47: 153–61.
Heien, D. and C.R. Wessells, (1990). “Demand System Estimation with
Microdata: A Censored Regression Approach”, Journal of Business and
Economic Statistics 8: 365–371.
Hintze, J. L., and R. D. Nelson, (1998). “Violin Plots: A Box Plot-Density Trace
Synergism”, The American Statistician 52(2):181-84.
Huang, K.S. and B.H. Lin, (2000). “Estimation of Food Demand and Nutrient
Elasticities from Household Survey Data”, Technical Bulletin No. TB1887,
USDA, pp. 40.
Mazzocchi, M. (2005). “Sicurezza alimentare, nutrizione e salute: tendenze
recenti in Europa e negli Stati Uniti”, Agriregionieuropa, Anno I, n.3.
Mora, C., and D. Menozzi. (2005). Vertical contractual relations in the Italian
beef supply chain, Agribusiness 21, 213-235.

24
Moschini, G. (1995). “Units of measurements and the stone index in demand
system estionation”, American Journal of Agricultural Economics 77: 63–8.
Perali, F. and J. P. Chavas, (2000). “Estimation of censored demand equations
from large cross-section data”, American Journal of Agricultural Economics
82: 1022–1037.
Regattieri, A., Gamberi, M. and R. Manzini, (2007). “Traceability of food
products: General framework and experimental evidence”, Journal of Food
Engineering, 81 (2), 347–356.
Shonkwiler, J.S. and S. Yen, (1999). “Two-Step Estimation of a Censored System
of Equations”, American Journal of Agricultural Economics 81: 972–82.
Ul-Haq, Z., Nazli H. and K. Meilke, (2008). “Implications of high food prices for
poverty in Pakistan”, Agricultural Economics vol. 39(s1): 477-84.
Yen, S. T., Kan, K. and S. Su, (2002). “Household demand for fats and oils: two-
step estimation of a censored demand system”, Applied Economics 34: 1799–
1806.
25
Table 1: Percentage of positive consumption, expenditure share and purchase frequency by food group
Fresh Veg. Group Household purchasing (%)
Mean Veg. Expenditure (%)
Avg. Purch. Frequency (days)
Salads 98.3 12.5 24 Spinaches 62.8 1.9 163 Pulses 79.9 3.6 114 Potatoes 92.7 9.1 56 New potatoes 51.8 1.4 272 Asparaguses 74 4.1 131 Tomatoes 97.5 16 27 Eggplants and Peppers 98.4 14.4 25 Carrots 91.9 3.5 61 Fennels 80 3.4 108 IV Veg. 85.2 12.7 33 Other Vegetables 98.8 17.5 17

26
Table 2: Description of variables used in food demand system
Parameters Variable Mean sd γij Price of Salads 2.15 0.72 γij Price of Spinaches 1.54 0.62 γij Price of Pulses 2.41 0.49 γij Price of Potatoes 0.9 0.2 γij Price of New potatoes 0.96 0.18 γij Price of Asparaguses 4.34 0.98 γij Price of Tomatoes 2.05 0.48 γij Price of Eggplants and Peppers 1.73 0.35 γij Price of Carrots 1.16 0.18 γij Price of Fennels 1.43 0.26 γij Price of IV Veg. 9.26 2.36 γij Price of Other Vegetables 1.82 0.52 βi Total fresh vegetables expenditure of the household (€/year) 256.95 219.43 δ1,i 1 if the head of the household has finished High School or Univ. 0.44 0.5 δ2,i 1 if the household lives in North Est Region 0.19 0.39 δ3,i 1 if the household lives in Centre&Sardinia Region 0.21 0.41 δ4,i 1 if the household lives in South&Sicily Region 0.3 0.46 δ5,i 1 for highest income group and 0 otherwise 0.29 0.45 δ6,i 1 if the household lives in more than 100.000 in-habitants city 0.27 0.44 δ7,i 1 if the head of the household is ≥44 years old 0.64 0.48 δ8,i 1 if the household has more than 2 members 0.53 0.5 δ9,i 1 for the presence of a children ≤15 years old 0.3 0.46 δ10,i 1 if the household head is employed 0.26 0.44

27
Table 3: Estimated parameter demand Salads Pulses Potatoes Eggpl.&Pepp. Asparag. Tomatoes New
potatoesCarrots Fennels Oth. Veg. Spinach IV Veg.
γSalads 0.041*** 0.007** 0.009** -0.014*** -0.009** -0.032*** -0.009*** -0.012*** -0.001 -0.018*** -0.007*** 0.034***
γPulses 0.007** 0.014*** -0.005 0.007* 0.003 0.010** 0.005* -0.004 0.007** -0.015*** 0.001 -0.009***
γPotatoes 0.009** -0.005 0 -0.021*** 0.007* 0.010* 0.015*** 0.010*** -0.006* 0.001 -0.001 -0.014***
γ Egg.Pepp. -0.014*** 0.007* -0.021*** 0.061*** 0.001 -0.015*** -0.003 0.007* 0.002 -0.009* -0.007* -0.009**
γAsparag. -0.009** 0.003 0.007* 0.001 0.010* 0.016*** -0.004 -0.003 -0.003 -0.008* -0.005* -0.002
γTomatoes -0.032*** 0.010** 0.010* -0.015*** 0.016*** 0.024*** -0.006 0.011*** 0.002 -0.022*** 0.001 0.007
γNew potat. -0.009*** 0.005* 0.015*** -0.003 -0.004 -0.006 0.012*** 0 0.005* -0.015*** -0.001 -0.001
γCarrots -0.012*** -0.004 0.010*** 0.007* -0.003 0.011*** 0 0.020*** 0.004 -0.005* -0.003 -0.010***
γFennels -0.001 0.007** -0.006* 0.002 -0.003 0.002 0.005* 0.004 0.021*** -0.014*** 0.002 -0.009***
γOth. Veg. -0.018*** -0.015*** 0.001 -0.009* -0.008* -0.022*** -0.015*** -0.005* -0.014*** 0.088*** -0.006** 0.011***
γSpinach -0.007*** 0.001 -0.001 -0.007* -0.005* 0.001 -0.001 -0.003 0.002 -0.006** 0.013*** -0.004
γIV Veg. 0.034*** -0.009*** -0.014*** -0.009** -0.002 0.007 -0.001 -0.010*** -0.009*** 0.011*** -0.004 0.016***
βi 0.004** -0.010*** -0.002 0.008*** 0.012*** 0.001 -0.003 -0.002* -0.023*** 0.013*** -0.008*** -0.001
δ1 -0.007** 0.001 -0.007*** -0.004 0 0.004 0.001 0 0 -0.011*** 0.004** 0.019***
δ2 0.027*** 0.005** -0.021*** -0.004 -0.009*** -0.013*** -0.003 0.002 0.005** 0.032*** 0.005* -0.024***
δ3 0.010** 0.003 -0.009** -0.001 0.002 0.024*** 0.016*** -0.008*** -0.006*** -0.003 0.009*** -0.021***
δ4 0.001 0.022*** 0.031*** 0.049*** -0.017*** 0.015*** 0.016*** -0.002 -0.002 0.005 0.011*** -0.106***
δ5 0.014*** -0.006*** -0.003 0.001 -0.010*** 0 -0.003 -0.003** -0.005*** 0.007* -0.004*** 0.010***
δ6 0.003 0.006*** -0.011*** 0.008*** 0.009*** -0.008** 0 -0.003** -0.002 -0.006* 0.005*** -0.003
δ7 0.003 0.003 0.001 -0.020*** 0.018*** -0.010** 0.003 -0.005*** 0.002 0.003 -0.002 0.001
δ8 -0.002 -0.005*** 0.004 0.012*** -0.013*** 0 0.005*** 0.001 0.002 -0.008** 0.002 0.011***
δ9 0.012*** -0.003 0.001 0 -0.005 0.003 -0.004* 0.002 0.003 -0.009** 0.001 -0.007
δ10 -0.008* 0.006*** 0.008** -0.027*** 0.008** -0.010** 0.004* -0.006*** 0.002 0 0.001 0.018***
δφ 0.481*** -0.019* 0.135*** 0.518*** 0.054*** 0.144*** 0.047*** 0.034*** -0.055*** 0.272*** -0.006 0.042***
αi 0.035*** 0.084*** 0.110*** 0.100*** -0.03 0.133*** 0.019 0.081*** 0.180*** 0.105*** 0.081*** 0.102***
R2 0.65 0.41 0.6 0.71 0.34 0.71 0.22 0.47 0.43 0.78 0.26 0.58
legend: (* p<0.10; **p<0.05; ***p<0.01)
28
Table 4: Uncompensated price, cross-price and expenditure elasticities by fresh vegetables group (mean value) Salads Pulses Potatoes Egg. Pepp. Asparaguses Spinaches Tomatoes New Potat. Oth. Veg. Carrots Fennels IVVeg.
Salads -0.68 0.05 0.07 -0.11 -0.07 -0.05 -0.26 -0.07 -0.15 -0.1 -0.01 0.26 Pulses 0.17 -0.68 -0.09 0.19 0.09 0.02 0.26 0.12 -0.29 -0.08 0.17 -0.18 Potatoes 0.09 -0.05 -1 -0.22 0.08 -0.01 0.1 0.16 0.02 0.1 -0.07 -0.14 Egg. Pepp -0.1 0.05 -0.15 -0.6 0.01 -0.05 -0.11 -0.02 -0.07 0.05 0.01 -0.07 Asparag. -0.19 0.05 0.11 -0.01 -0.83 -0.09 0.25 -0.07 -0.18 -0.06 -0.05 -0.07 Spinaches -0.21 0.03 0 -0.19 -0.16 -0.56 0.08 -0.02 -0.17 -0.09 0.07 -0.09 Tomatoes -0.2 0.06 0.06 -0.09 0.1 0.01 -0.85 -0.04 -0.14 0.06 0.01 0.04 New Potat. -0.32 0.2 0.57 -0.09 -0.13 -0.02 -0.21 -0.57 -0.53 -0.01 0.21 -0.03 Oth. Veg. -0.11 -0.09 0 -0.06 -0.05 -0.04 -0.14 -0.08 -0.52 -0.03 -0.08 0.05 Carrots -0.31 -0.1 0.26 0.19 -0.08 -0.07 0.29 -0.01 -0.11 -0.48 0.12 -0.26 Fennels 0.05 0.19 -0.1 0.12 -0.04 0.05 0.12 0.13 -0.24 0.12 -0.5 -0.15 IVVeg. 0.24 -0.06 -0.1 -0.06 -0.01 -0.02 0.05 -0.01 0.08 -0.07 -0.06 -0.88 Expenditure 1.03 0.77 0.98 1.06 1.22 0.74 1.01 0.89 1.08 0.94 0.47 0.99
Values calculated through Yen et al., procedure (2002).

29
Table 5: New potatoes price change simulation, percentage of positive consumption, quantity consumption (Kg.) and percentage variation.
Fresh Veg. Group
Household purchasing (%) and percentage variation
Quantity consumption (Kg.) per household per year and
percentage variation
Benchmark Potatoes 92.7 26.11 New Potatoes 51.8 3.34 t = 0.05Pnew potatoes Potatoes 92.7 0 +0.21 +0.8 New Potatoes 51.4 -0.8 -0.09 -2.7 t = 0.07Pnew potatoes Potatoes 92.7 0 +0.29 +1.1 New Potatoes 51.2 -1.2 -0.12 -3.7 t = 0.1Pnew potatoes Potatoes 92.7 0 +0.40 +1.6 New Potatoes 51 -1.6 -0.18 -5.3 t = 0.15Pnew potatoes Potatoes 92.7 0 +0.59 +2.3 New Potatoes 50.7 -2.1 -0.26 -7.7

30
Figure1: Violinplot of new potato own-price elasticity

31
Figure 2: Violinplot of new potato own price elasticity by region