tra crp1.html 2006 basin highlights report basin highlights report.pdf · in greater detail in the...
TRANSCRIPT

Introduction In 1991, the 72nd Texas Legislative Session passed Senate Bill 818 which established the Clean Rivers Program (CRP.) The CRP has evolved to ensure that an ongoing, sys-tematic, quality-controlled monitoring system is established to help protect and improve Texas’ surface water quality. Fund-ing for the CRP Program comes, in part, from fees assessed on water and wastewater permits. The Clean Rivers Program for the Trinity River basin is managed by the Trinity River Authority under contract with the Texas Commission on Environmental Quality. In this 15th year of the CRP, the TRA continues to focus on the three cornerstones of the program: routine monitoring, special studies, and public outreach. Learn more about us online at http://trinityra.org/BasinPlan/CRP/tra_crp1.html. The CRP Basin Highlights Report is produced annu-ally and is intended to present an overview of the Trinity River basin’s Clean Rivers Program goals and current activi-ties. Many of the issues highlighted in this publication, as well as statistical analyses of water quality data, are addressed in greater detail in the semi-decadal 2005 Basin Summary Re-port (BSR) published in 2005. If you would like to access the 2005 BSR in its entirety, visit http://www.trinityra.org/BasinPlan/basin_highlight_2005.htm.
Trinity Quick Facts: • The Trinity River was discovered on May
19, 1690 by Spanish explorer General Alonzo de Leon two days before “The Feast of the Most Holy Trinity.”
• The Trinity River is 715 miles long, and drains about 18,000 mi² of Texas before she delivers her water into Trinity Bay near Anahuac.
• It begins with four forks—the East Fork in Grayson County, the Elm Fork in Monta-gue County, the West Fork in Archer County, and the Clear Fork in Parker County.
• The basin contains more than 25% of Texas’ population.
• Currently, there are 22 major reservoirs that cover a total of 320,000 acres.
• 83,000-acre Lake Livingston is the largest reservoir in the Trinity River Basin
Trinity Basin Population by Incorporated City
Introduction 1
This Year’s Highlights 2
Water Quality Conditions 3 - 6
Water Quality Monitoring 7
Public Outreach 8
Recently Completed Special Studies 8
Table of Contents:
T R I N I T Y R I V E R A U T H O R I T Y Learn More About Us Online at:
http://www.trinityra.org/BasinPlan/CRP/tra_crp1.html
2006 Basin Highlights Report

T R I N I T Y R I V E R A U T H O R I T Y
This Year’s Highlights 2
Rita At four o’clock a.m. on September 24, 2005, Category 3 Hurricane Rita made landfall at Sabine Pass. With sustained winds at 120 mph, Rita devas-tated the Texas/Louisiana coastline. Eight counties (Liberty, Chambers, Walker, Hardin, San Jacinto, Polk, Trinity, and Houston) within the Trinity River basin were declared disaster areas by FEMA. Because of her direction of travel, Rita battered Lake Livingston with a 120 mph north wind. This wind acted like a giant foot pushing tons-upon-tons of water against the dam and causing waves to crest over the top and remove existing riprap. To avoid damage to the earthen dam structure, Livingston’s water level was lowered by four feet—equal to the elevation of the remaining riprap. The water level will remain at 127 feet above mean sea level until repair operations are completed. Dye On January 3, 2006, a red dye was observed entering the TRA’s Central Regional Wastewater Treatment plant located in the DFW Metroplex. This input created a reddish effluent that discolored the Trinity River. Later, on the 7th of January, a rust col-ored input entered the treatment facility and created a “burnt orange” tint to the effluent. During routine monitoring on January 9th, CRP personnel observed a dark red color to the Trinity River at station number 10934 located approximately 18 river miles downstream from the treatment plant. TRA laboratory personnel completed toxicity tests and found that both the water flea and bullhead minnow survived and reproduced as normal when sub-jected to the discolored media. The source of the dye
is unknown, but the incident of the “burnt orange” color occurred quickly after the University of Texas’ football team won the National Championship. This incident remains under investigation. Drought Much of the Trinity Basin is experiencing se-vere drought conditions. As of January 2006, the DFW area was approximately 17 inches shy of nor-mal rainfall amounts. Further, low relative humidity and high winds have produced dangerous wildfire conditions. A burn ban for the State of Texas has been in effect for much of the winter and wildfires have burned hundreds of acres in the basin. Lands scarred by fire can have a negative short-term affect on a river system’s water quality. At these times of minimal precipitation, wastewater effluent makes up almost all of the Trin-ity River’s base flow. The discharging of clean efflu-ent is essential for river bottom flora and fauna to sur-vive these periods of minimal rainfall.
“Burnt Orange” coloration of the Main Stem Trinity River. Taken January 9, 2006 in Dallas County (10934-South Loop 12 near I-45.)
TRA’s Central Wastewater Discharging into the West Fork, Grand Prairie, TX.
Yearly Rainfall Totals
05
101520253035404550
1995
1996
1997
1998
1999
2000
2001
2002
2003
2004
2005
inch
es

T R I N I T Y R I V E R A U T H O R I T Y
Water Quality Conditions 3
The Trinity River’s tributaries and reservoirs are divided into “segments” which group stretches of river that share common attributes. The boundaries could be dams, confluences, or tidal reach. Segments are broken down into assessment units (AU’s) so that a segment may be further categorized, analyzed, and compared both within and across basins. Waterbodies are assessed based on the “designated uses” applicable to that segment. The des-ignated use and its necessary analysis is noted in the table below.
In theory, the stream standards are adjusted for each segment’s designated use. For example, Segment A is a perennial river in the upper reaches of a water-shed and is given a “high aquatic life use” (DO criteria > 5 mg/L) and shows values ranging from 6.1 to 8.9 mg/L. Segment B is a shallow, shaded creek and is given a “limited aquatic life use” (DO criteria > 3 mg/L) and shows values ranging from 3.1 to 4.8 mg/L. Although Stream B shows significantly lower DO val-ues than Stream A, it is “fully supporting” its desig-nated use.
Stream and reservoir data submitted to Texas’ water quality database by the Texas Clean Rivers Part-ners are used by TCEQ assessment teams to determine if streams and reservoirs are meeting their designated uses. In other words, how does an actual sample measurement compare to its pre-determined bench-mark value? For additional information on stream standards and assessment methods, visit the monitoring page of TCEQ’s website.
Once assessed, a segment is assigned one of 5 major category designations. These “ratings” deter-mine whether or not further investigation of the seg-ment or AU is warranted. Comparing water quality data to numeric stream standards is simple, right? Big Picture Issues In reality, the application of standards is quite complicated. For example, can standards created for reservoirs apply to the deep open-water areas and the shallow backwater coves? Both areas are within the reservoir, yet are hydrologically, biologically, and physically quite different. Are the stream standards relevant for coves? Where do the coves begin and end? Should there be specific cove standards? Can a standard be created that is relevant across many res-ervoirs? A Use Attainability Analysis (UAA) is com-pleted on streams to determine if the water quality standards are appropriate for that particular segment or AU. If no UAA has been completed, the stream criteria defaults to a “high” aquatic life use. Are many streams erroneously listed because water qual-ity data is compared to an inappropriate standard?
“So, how’s the water quality in the Trinity River?”
http://www.tceq.state.tx.us/compliance/monitoring/crp/index.html
Uses & Secondary Concerns Analyses Aquatic Life Use dissolved oxygen, water and sediment toxicity, and habitat screening Public Water Supply Use organic and inorganic MCLs (ex. benzene, chlordane, atrazine, PCBs) Contact Recreation Use e. coli, fecal coliform, enteroccoci Fish Consumption Use Human Health Criteria in Water & TDH’s toxicity analysis of fish filets General Use water temperature, pH, chloride, sulfate, TDS Nutrient Concerns NH3-N, NO2-N + NO3-N, OP, & TP Algal Growth Concerns chlorophyll a


T R I N I T Y R I V E R A U T H O R I T Y
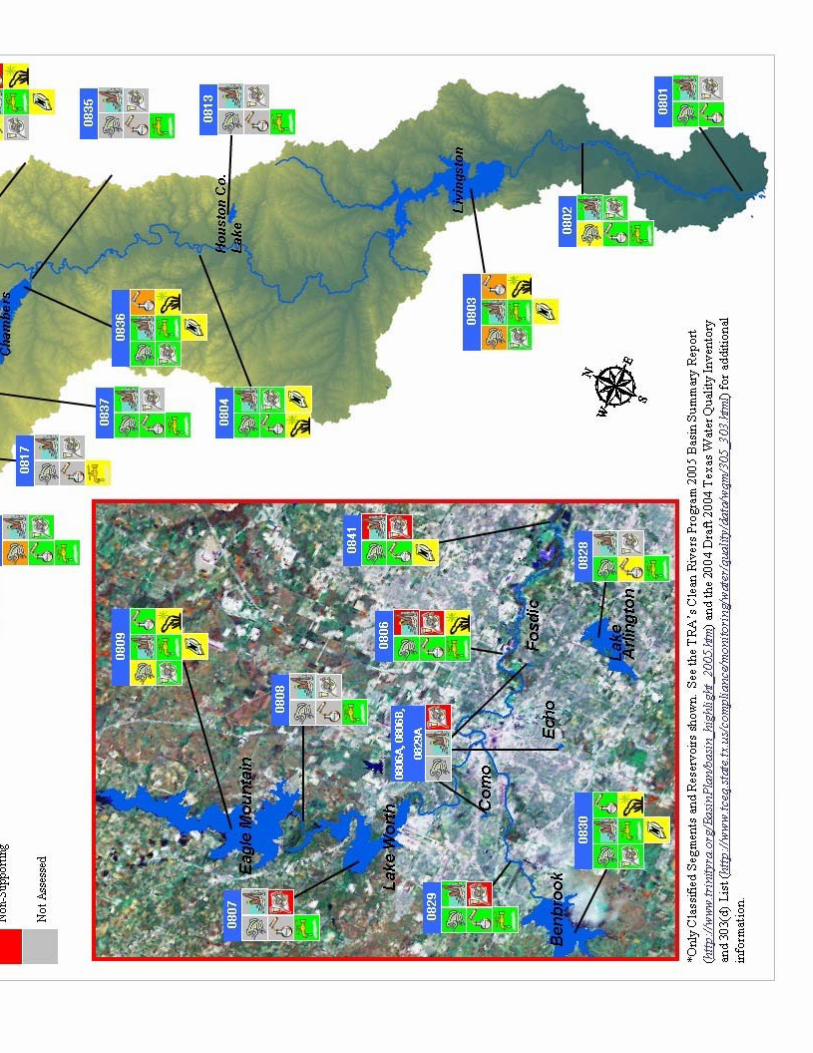
Water Quality Conditions In July 2005, the TRA completed and published its Basin Summary Report; an in-depth analysis of the water quality within the Trinity River watershed. Because no new assessment data is available, only a brief summary and spatial overview (pp. 4 & 5) is included in this report. For additional information and a statisti-cal summary of the data, please visit http://www.trinityra.org/BasinPlan/basin_highlight_2005.htm.
West Fork Trinity River 807, 808, 809, 810, 811, 812, & 834
From Lake Worth dam north into Archer and Montague Counties Headwaters considered the start of the Trinity River. Predomi-nant agriculture is cattle grazing with a significant amount of oil and gas mining. Urbanization increases as the West Fork ap-proaches Fort Worth.
Elm Fork Trinity River 822, 823, 823A, 823C, 824, 825, 826, 826A, 839, 840, & 840A
From Frasier dam in Dallas N into Montague Co. Gently-rolling plains with patches of forest in lowlands. Predominant agriculture is row-crop, cattle grazing, and, in northern portion, dairy. Consid-erable urbanization in the south-ern half of the watershed.
East Fork Trinity River 819, 820, 820A, 821, 821A, & 821B
Main Stem Trinity River 803, 803A, 804, 805, 806, 806A, 806B, 813, 827, 835, & 841
Village Creek 828 & 828A
Richland-Chambers 814, 815, 816, 817, 836, & 837
Mountain Creek 838
Lower Trinity River 801 & 802
Clear Fork Trinity 829, 829A, 830, 831, 832, & 833
Cedar Creek 838
From Lake Ray Hubbard dam NE into Grayson Co. The landscape is mostly flat prairies and southern portion is heavily urbanized. In addition, the surface waters receive sig-nificant effluent. The northern reaches contain significant row-crop farming operations.
From SH80 and Vickery in W Ft. Worth NW to Parker Co. The terrain here is mostly flat with some gently rolling prairie. The southern reaches are heavily urbanized but, in general, the population is relatively low. Pri-mary agriculture: cattle ranching and some row-crop.
From the Lake Livingston dam north to Fort Worth Begins in the densely populated Dallas/Fort Worth Metroplex and meanders 200 miles. Develop-ment along the upper southeast portion is extensive and the pub-lic’s perceptions of “The River of Death” are changing.
From Trinity Bay N to Livingston South of the Livingston dam, the Lower Trinity gingerly traverses a the flat coastal prairie. Near the end of her voyage, Houston taps into this perennial water source. At last, the water passes through the Wallisville saltwater barrier and into Trinity Bay.
From the Lake Arlington dam SW into Johnson Co. Village Creek is the smallest of the subwatersheds. It begins in the rural sandy soils of the East-ern Cross Timbers and empties into Lake Arlington. The reser-voir is an important water source for Arlington and NE Tarrant Co.
From Mt. Creek Lake dam W to John-son Co. The Blackland Prairie soils sup-port an abundance of row-crop agriculture in this highly rural wa-tershed. It is important to monitor the water quality of Mountain Creek because of the increasing urbanization.
From the Richland-Chambers dam NW into 1)Johnson Co. & 2) Hill Co. Agriculture is predominant across the flat to gently rolling prairies of the subwatershed. Urbaniza-tion has been slow to this area and the population remains low. During the summer months, base flow is minimal.
From Cedar Creek Lake dam N into Rockwall Co. Cedar Creek Reservoir was cre-ated to satisfy the water demands of Fort Worth and Tarrant County. Development has been intensive near the reservoir, but the watershed remains sparsely populated.
6

T R I N I T Y R I V E R A U T H O R I T Y
Water Quality Monitoring 7
Entity Sites Parameters Dallas 37 Field and Metals Fort Worth 6 Field and Bacteria
Arlington 12 Field, Bacteria, Nutrients/Conventionals, and Metals
Grand Prairie 22 Field, Bacteria, Organics, and Metals, Nutrients/Conventionals
Irving 6 Field, Bacteria, Conventionals, and Met-als
TRA GO 8 Field, Bacteria, and Nutrients/Conventionals
TRA LL 21 Field, Bacteria, Nutrients/Conventionals, Organics, and Metals
TRWD 39 Field, Bacteria, Nutrients/Conventionals, and Metals
µ
“During Fiscal year 2005, the TRA was responsible for adding 3370 Events and 32,000 Results to TRACS.”
Monitoring AgencyE Arlington# Dallas& Fort Worth" Grand PrairieX Irvinga TRA LLP$+ TRWD’ TRA GO
SubwatershedCedar CreekClear Fork Trinity RiverEast Fork Trinity RiverElm Fork Trinity RiverLower Trinity RiverMain Stem Trinity RiverMountain CreekRichland CreekVillage CreekWest Fork Trinity River
2005 Trinity River Authority Routine Monitoring Stations Water quality monitoring is one of the corner-
stones of the Clean Rivers Program. Much of the data collected within the purview of the CRP is used to as-sess and manage the surface water within the Trinity River basin. The Texas Commission on Environmental Quality relies on water quality data, including CRP data, to assess stream segments on a bi-annual basis. Each classified waterbody is divided into assessment units and is evaluated to determine if it is meeting its designated use(s.) Since the program’s inception, efforts to de-velop and maintain partnerships with existing agencies have been a focus of the TRA’s Clean Rivers Program. Sustaining a monitoring network for the 18,000 mi² Trinity River basin would not be possible without the cities of Arlington, Dallas, Grand Prairie, Fort Worth, and Irving, the Tarrant Regional Water District, and the Trinity River Authority’s Lake Livingston Project. To-gether, the basin is covered by a network of 150 routine sites monitored at various intervals for an array of pa-rameters. For more specific information, see the Coor-dinated Monitoring Schedule online at http://cms.lcra.org/schedule.asp?basin=8&FY=2006. After the data is received from each partner en-tity, it is converted, formatted, quality assured (QA/QC,) and submitted to TCEQ. TCEQ performs addi-tional checks on the data and posts it to Texas’ water quality database where it is made available to the pub-lic. To download TRA CRP water quality data, visit http://www.trinityra.org/BasinPlan/CRP/viewer/viewer.asp.
“During Fiscal year 2005, the TRA added 3370 Events and 32,000 Results to Texas’ water quality database.”

T R I N I T Y R I V E R A U T H O R I T Y
Public Outreach & Special Studies 8
The Trinity River Authority’s Clean Rivers Program is involved in a myriad of public outreach and educational activities. In 2005, the TRA staff continued its participation in Gatorfest in Anahuac, Texas Watch, the University of Texas at Arlington’s Earth Day event, and presented to over 300 people at Brookhaven College’s GIS Day. In addition, the TRA funded the clean-up of debris from the White Rock Creek cove of Lake Livingston.
The TRA continued its support of the Water-borne Education Center—a non-profit organization that educates citizens on the conservation and pres-ervation of Texas’ coastal resources. The WBEC maintains floating classrooms built from modified Coast Guard buoy tenders which create a unique per-spective for students to learn about wetlands, marshes, and estuaries. If you would like more in-formation regarding the WBEC tour and field trips, please call (409) 267-3547. A modest amount of financial assistance was given to the River Legacy Foundation for the pur-chase of computers and software for Geographical Information Systems (GIS.) These tools are used for hands-on environmental education.
Stakeholder Participation The 2005 stakeholder meeting was held in Au-gust. TRA personnel presented an overview of current activities and stakeholders gave feedback, ideas, and suggestions about upcoming special studies. Stake-holder meetings occur once a year and all interested par-ties are welcome. Visit our website for more informa-tion about the stakeholder process and what you can do to improve water quality in your watershed!
Recently Completed Special Studies Low Dissolved Oxygen in Johnson Lake
The City of Jacksboro applied to renew their dis-charge permit in July, 2000. During permit review, TCEQ utilized a new model to evaluate receiving waters and determined that, even if there was no effluent dis-charged in to the stream, the dissolved oxygen (DO) standards could not be met. This study used historical analysis, new data collection, analysis of system hydrau-lics and lake levels, a review of existing Surface Water Quality Standards, and a new modeling system to con-clude that the previous TCEQ model was the appropri-ate standard from which to evaluate the City of Jacks-boro’s permit renewal request. The study concluded that, due to natural environmental factors, lake arms should not be evaluated against the same “high aquatic life” (5.0 mg/L) use standards as the lake.
Water Quality Standards Evaluation: Richland Cham-bers
This study was initiated due to a concern about the DO levels in backwater areas of Post Oak Creek. The study found that backwater DO concentrations were depressed regardless of whether they received dis-charges. Visual inspection of the data showed that natu-rally occurring DO levels are influenced by the width to depth ratio and climatic factors.
Trinity County cleanup, September 2005. The clean up was aided by the drawdown of Lake Livingston due to damage sus-tained from Hurricane Rita.
After
Before
For a comprehensive look at TRA’s ongoing and completed Special Studies, see the 2005 Basin Summary Report online: http://www.trinityra.org/BasinPlan/basin_highlight_2005.htm.