toxicological profile for cyanide - atsdr
TRANSCRIPT
CYANIDE 153
6. POTENTIAL FOR HUMAN EXPOSURE
6.1 OVERVIEW
The term cyanide in this Toxicological Profile means a compound that contains the cyanogen (CN)
radical. Since the CN portion of the compound is of concern in poisons, any reference to the amount
present in air, water, soil, sediments, or other media refers only to this part of the compound. The term
free cyanide refers to hydrogen cyanide and cyanide ion (CN–) (EPA 1981e; Oudjehani et al. 2002;
Shifrin et al. 1996; WHO 2004b).
Cyanide (reported as cyanide, hydrogen cyanide, sodium cyanide, potassium cyanide, or copper (I)
cyanide) has been identified in at least 464 of the 1,662 hazardous waste sites that have been proposed for
inclusion on the EPA National Priorities List (NPL) (HazDat 2005). However, the number of sites
evaluated for cyanide is not known. The frequency of these sites can be seen in Figure 6-1. Of these
sites, 462 are located within the United States, 1 is located in Guam (not shown), and 1 is located in the
Commonwealth of Puerto Rico (not shown).
Anthropogenic (of human origin) sources are responsible for much of the cyanide in the environment.
Cyanide-containing substances also occur naturally in the fruits, seeds, roots, and leaves of numerous
plants, and are released to the environment from natural biogenic processes from higher plants, bacteria,
and fungi (Cicerone and Zellner 1983; Crutzen and Carmichael 1993; EPA 1981e; Jones 1998; Knowles
1988; Mudder and Botz 2000). However, an estimate of the amount of cyanide released to the
environment from natural biogenic processes is not available. The major cyanide releases to water are
discharges from metal-finishing industries, iron and steel mills, and organic chemical industries (EPA
1981e). Effluents from the cyanidation process used in precious metal extraction contain high amounts of
cyanide (EPA 1994c; Huiatt 1985; Scott 1985). The contribution of this source to the total cyanide
discharge in water is insignificant on average (EPA 1981e). However, large, short-term releases can
occur from the failure of tailing ponds resulting in the introduction of high concentrations of cyanide into
local surface waters and subsoils (Fields 2001; Mudder and Botz 2000). Vehicle exhaust (EPA 1981e)
and biomass burning (Crutzen and Carmichael 1993; Lobert and Warnatz 1993) are major sources of
cyanide released into the air. The major sources of simple and complex cyanide releases to soil appear to
be from the disposal of cyanide wastes in landfills and the use of cyanide-containing road salts (EPA
1981e; Gaffney et al. 1987). Cyanogen chloride is formed in drinking water from reaction of humic
154 CYANIDE
6. POTENTIAL FOR HUMAN EXPOSURE
Figure 6-1. Frequency of NPL Sites with Cyanide Contamination
Frequency of NPL Sites
1-34-67-1213-18
Derived from HazDat 2005 19-2526-35
CYANIDE 155
6. POTENTIAL FOR HUMAN EXPOSURE
substances with chloramine produced during chlorination (Jacangelo et al. 1989; Ohya and Kanno 1987).
Thiocyanate is released to water primarily from discharges of industrial waste waters from coal
processing and extraction of gold and silver (Boucabeille et al. 1994a); the thiocyanate is formed from the
reaction of sulfur donors that are present in coal and crushed rock with the cyanide that is used in the
processing of these materials. Thiocyanate is also found in mining waste waters where it results from the
interaction of the cyanide anion (CN–) with sulphur (Boucabeille et al. 1994b). Releases of thiocyanate to
soil result from anthropogenic and natural sources. Anthropogenic releases occur primarily from direct
application in herbicidal formulations and from disposal as byproducts from industrial processes.
Nonanthropogenic sources include damaged or decaying tissues of plants from the family Brassica (e.g.,
cabbage, mustard, kale) (Brown and Morra 1993).
Cyanide is released into air mainly as hydrogen cyanide gas and, to a lesser extent, as particulate
cyanides. Hydrogen cyanide can potentially be transported over long distances before reacting with
photochemically generated hydroxyl radicals. The residence time of hydrogen cyanide in the atmosphere
has been estimated to be approximately 2.5 years, with a range of 1.3–5.0 years, depending on the
hydroxyl radical concentration (Cicerone and Zellner 1983). Neither photolysis nor deposition by
rainwater is expected to be a significant removal mechanism. Only 2% of the tropospheric hydrogen
cyanide is expected to be transported to the stratosphere (Cicerone and Zellner 1983). In water, cyanide
occurs most commonly as hydrogen cyanide. Hydrogen cyanide is expected to be removed from water
primarily by volatilization. Cyanide may also be removed by aerobic or anaerobic biodegradation (Akcil
and Mudder 2003; EPA 1979, 1994c). At soil surfaces, volatilization of hydrogen cyanide is a significant
loss mechanism for cyanides. In subsurface soil, cyanide at low concentrations would probably
biodegrade under both aerobic and anaerobic conditions. In cases where cyanide levels are toxic to
microorganisms (i.e., landfills, spills), the concentrations of water-soluble cyanides may be sufficiently
high to leach into groundwater.
The environmental fate of thiocyanate has not been thoroughly investigated. Aerobic and anaerobic
biodegradation are significant transformation processes for thiocyanates in water (Boucabeille et al.
1994a, 1994b; Shivaraman et al. 1985) and soil (Brown and Morra 1993). At near-ambient temperatures,
sorption and volatilization are not significant partitioning processes for thiocyanate in soil (Brown and
Morra 1993).
Despite the various ways cyanide is thought to be released into the environment, available monitoring
data are limited. The available data indicate that the general population is exposed to cyanide primarily
CYANIDE 156
6. POTENTIAL FOR HUMAN EXPOSURE
by ingestion of foods that contain substances that release cyanides when ingested and through smoking,
and to a lesser extent, by consumption of contaminated drinking water and inhalation of contaminated air.
Dermal absorption is not a significant exposure route for the general population. The concentration of
cyanide in the northern hemisphere's non-urban troposphere ranges from 160 to 166 ppt (ppt = parts per
trillion) (Cicerone and Zellner 1983; Jaramillo et al. 1989). The mean cyanide concentration in most
surface waters is not greater than 3.5 μg/L (EPA 1981e). The cyanide content in certain varieties of lima
beans can be as high as 3 mg/g (Honig et al. 1983), although values between 0.10 and 0.17 mg/g are
common in U.S. lima beans (EPA 1978c). Much lower cyanide concentrations in various cereal grains
and cereal products have been reported, ranging from 0.001 to 0.45 μg/g (Honig et al. 1983). Mean
cyanide concentrations in soybean products have been found to range from 0.07 to 0.3 μg/g, whereas the
mean cyanide concentration in soybean hulls was 1.24 μg/g (Honig et al. 1983). Due to the lack of data
on cyanide content in total diet samples, the average daily intake could not be estimated.
Cyanogen chloride has been measured in drinking water with a concentration ranging between 0.45 and
0.80 μg/L (Krasner et al. 1989).
Available monitoring data on thiocyanate are also very limited. No information was found in the
available literature on major routes of exposure among the general population or on estimates of
exposure. Because thiocyanate is a major metabolite of cyanide in the body, exposure to cyanide is a
source of thiocyanate exposure. Thiocyanate occurs naturally in many edible plants. Vegetables in the
family Brassica contain high levels of thiocyanate with concentrations ranging up to 660 μg/g, whereas
other commonly consumed vegetables (e.g., spinach, radishes, celery) generally contain thiocyanates at
concentrations <2 μg/g. Thiocyanate concentrations in milk and other dairy products and in meat have
been reported to be <1–9.0 and 0.5–0.7 μg/g, respectively (Weuffen et al. 1984). Thiocyanate
concentrations in coal plant waste waters (Jensen and Tuan 1993) and mining waste waters (Boucabeille
et al. 1994b) have been found to be 100–1,500 and 300–450 mg/L, respectively. No data were found in
the available literature on thiocyanate concentrations in surface, ground, or drinking waters. Soils treated
with rapeseed meal (from the family Brassica) contained thiocyanate at concentrations on the order of
6 μg/g (Brown et al. 1991).
It should be noted that the amounts of cyanide or thiocyanate found by chemical analysis are not
necessarily the amounts that are bioavailable.
CYANIDE 157
6. POTENTIAL FOR HUMAN EXPOSURE
Among the general population, subpopulations with the most likely potential of exposure to cyanide at
concentrations higher than background levels include active and passive tobacco smokers (EPA 1981e)
and individuals who are exposed to house fires or other types of building fires (Andrews et al. 1989;
Bolstad-Johnson 2000). Subpopulations with potential for exposure to cyanides or thiocyanates are
residents who live near industrial sites releasing these compounds to the environment, residents who live
near cyanide- or thiocyanate-containing hazardous waste sites, and people who consume foods high in
cyanogenic glycosides. Fetuses of smoking mothers or mothers exposed to high levels of environmental
smoke may also be at risk of exposure to relatively high concentrations of cyanide and thiocyanate
(Bottoms et al. 1982; EPA 1992f; Hauth et al. 1984). For example, mean thiocyanate concentrations of
88.6 and 32.0 μg/L have been measured in fetal blood of mothers who smoked or were exposed to passive
smoke, as compared to a mean thiocyanate concentration of 24.3 μg/L in unexposed mothers (Bottoms et
al. 1982).
Occupational exposures to cyanide occur primarily through inhalation and, less frequently, through
dermal absorption. Estimates from the National Occupational Exposure Survey (NOES) conducted by the
National Institute for Occupational Safety and Health (NIOSH) indicate that over 250,000 workers are
potentially exposed to cyanide compounds, including cyanogen chloride (NIOSH 1989a). Workers may
be exposed to cyanides in various occupations, including electroplating, metallurgy, pesticide application,
firefighting, steel manufacturing, gas works operations, and metal cleaning (EPA 1981e; WHO 2004b).
The manufacture of industrial inorganic chemicals may be a potential source of occupational exposure to
cyanogen chloride (NIOSH 1989a). Potential sources of occupational exposure to ammonium
thiocyanate include the manufacture of electronic computing equipment, research and development
laboratories, newspaper and other commercial printing, general medical and surgical hospitals, production
of adhesives and sealants, and the construction and furniture industries (NIOSH 1989a). Potential
occupational exposures may also occur during the direct application of herbicidal formulations (e.g.,
amitrol-T, a mixture of ammonium thiocyanate and amino-1,2,4-triazole) and from handling, treatment,
or disposal of thiocyanate-containing wastes from industrial processes (Brown and Morra 1993).
6.2 RELEASES TO THE ENVIRONMENT
The Toxics Release Inventory (TRI) data should be used with caution because only certain types of
facilities are required to report (EPA 2005b). This is not an exhaustive list. Manufacturing and
processing facilities are required to report information to the TRI only if they employ 10 or more full-time
employees; if their facility is included in Standard Industrial Classification (SIC) Codes 10 (except 1011,
CYANIDE 158
6. POTENTIAL FOR HUMAN EXPOSURE
1081, and 1094), 12 (except 1241), 20–39, 4911 (limited to facilities that combust coal and/or oil for the
purpose of generating electricity for distribution in commerce), 4931 (limited to facilities that combust
coal and/or oil for the purpose of generating electricity for distribution in commerce), 4939 (limited to
facilities that combust coal and/or oil for the purpose of generating electricity for distribution in
commerce), 4953 (limited to facilities regulated under RCRA Subtitle C, 42 U.S.C. section 6921 et seq.),
5169, 5171, and 7389 (limited S.C. section 6921 et seq.), 5169, 5171, and 7389 (limited to facilities
primarily engaged in solvents recovery services on a contract or fee basis); and if their facility produces,
imports, or processes ≥25,000 pounds of any TRI chemical or otherwise uses >10,000 pounds of a TRI
chemical in a calendar year (EPA 2005b).
6.2.1 Air
Cyanide emissions into the air have been conservatively estimated at 44 million pounds/year based on
data obtained during the mid-to-late 1970s. Over 90% of these emissions were attributed to releases from
automobile exhaust. The second largest source of cyanide emission to the air was reported to be from the
manufacture of methyl methacrylate, acrylonitrile, and hydrogen cyanide (EPA 1981e). From data
acquired from the California Air Resources Board (ARB), it is estimated that 1.2 million pounds of
hydrogen cyanide were released into air from industrial sources (CEPA 1997). Other smaller sources of
cyanide release include emissions from iron and steel production, coal combustion (EPA 1981e),
petroleum refineries (EPA 1981e), oil shale retorting processes (Hargis et al. 1986; Sklarew and Hayes
1984), municipal solid waste incinerators (Carotti and Kaiser 1972; Greim 1990), the combustion of
acrylonitriles or other nitrogen-containing plastics (Brandt-Rauf et al. 1988; EPA 1981e), cigarette smoke
(Baker and Proctor 1990; EPA 1981e; Guerin et al. 1987), volatilization from cyanide waste disposed of
in landfills, and direct release to the atmosphere from certain agricultural pest control activities (EPA
1981e). In 1976, an estimated 137,000 pounds of cyanide was released in the air from agricultural pest
control, 18,000–180,000 pounds from incineration, and 13,000–750,000 pounds from cigarette smoke
(EPA 1981e). The production of coke or other coal carbonization processes also release hydrogen
cyanide into the atmosphere (Cicerone and Zellner 1983). Release of hydrogen cyanide from cyanidation
processes used in the extraction of precious metals from their ores was estimated to be 22 tons/year in the
United States in 1992, or 20,000 tons worldwide (Korte and Coulston 1995). Hydrogen cyanide is also
released into the atmosphere from natural biogenic processes from higher plants, bacteria, and fungi
(Cicerone and Zellner 1983; Crutzen and Carmichael 1993; EPA 1981e; Knowles 1988; Mudder and Botz
2000; WHO 2004b). However, an estimate of the amount of hydrogen cyanide released from natural
biogenic sources is not available (Cicerone and Zellner 1983; WHO 2004b). Crutzen and Carmichael
CYANIDE 159
6. POTENTIAL FOR HUMAN EXPOSURE
(1993) have recently suggested that biomass burning represents an important source of atmospheric
hydrogen cyanide. The combined worldwide emissions of hydrogen cyanide and acetonitrile due to
biomass burning have been estimated to range from 0.5 to 1.7x10¹² g of N/year (≈1.1–3.7 billion pounds
per year) (Crutzen and Andreae 1990). These estimates were based in part on highly uncertain global
estimates of worldwide amounts of burned fuel and area and, consequently, have a high degree of
uncertainty. Lobert and Warnatz (1993) have estimated that low molecular weight nitriles, primarily
hydrogen cyanide and acetonitrile, represent about 4% of the nitrogen balance of biomass fires and
contribute a major amount to their global atmospheric source.
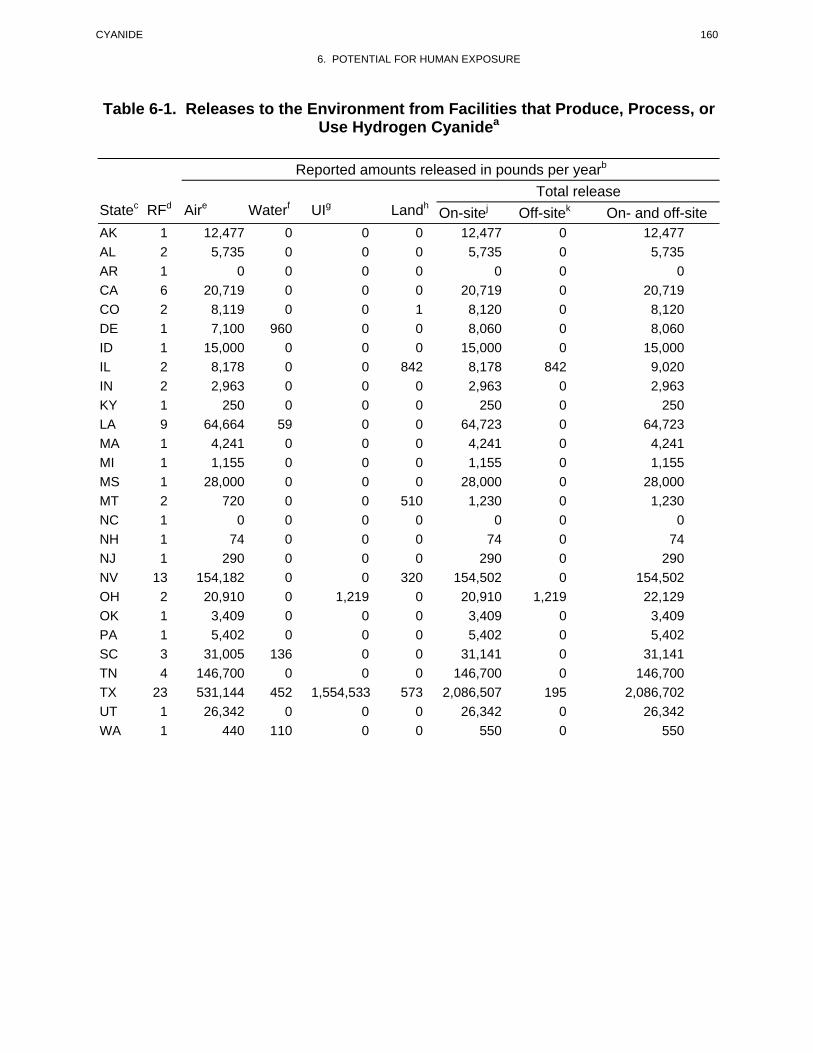
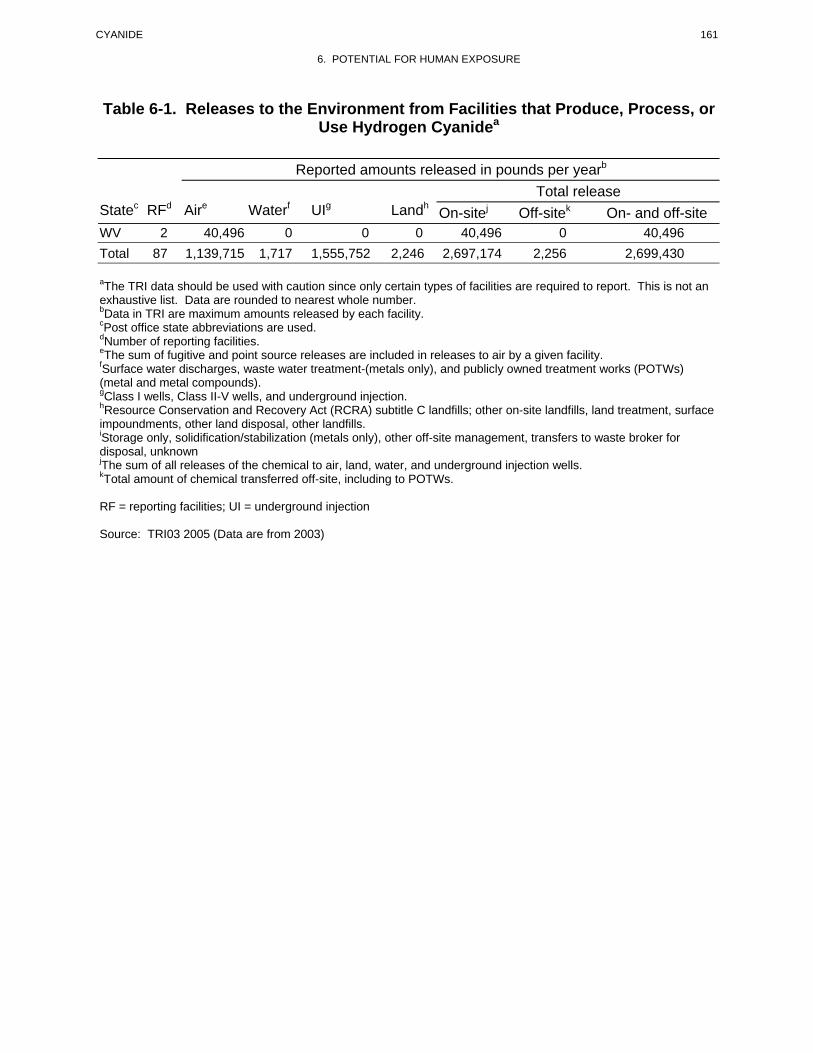
The amount of hydrogen cyanide released to the atmosphere in 2003 by U.S. industrial facilities sorted by
state is given in Table 6-1 (TRI03 2005). According to TRI03 (2005), an estimated total of 1.14 million
pounds (approximately 517 metric tons) of hydrogen cyanide was discharged into air, amounting to
approximately 42.2% of the total amount of hydrogen cyanide released into the environment from
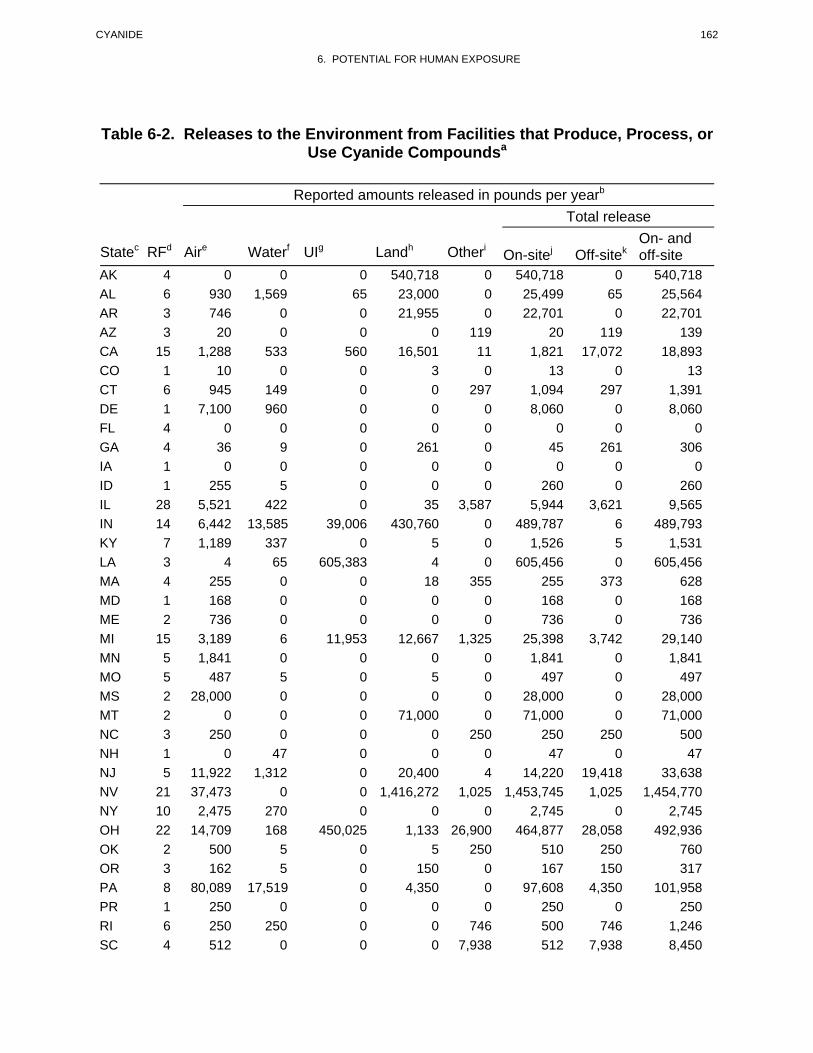
manufacturing and processing facilities in the United States in 2003. The release of cyanide compounds
(as X+CN–, where X+=H+ or any group where formal dissociation can occur; for example, KCN or
Ca(CN)2) into air by U.S. industrial facilities is given in Table 6-2 and sorted by state (TRI03 2005).
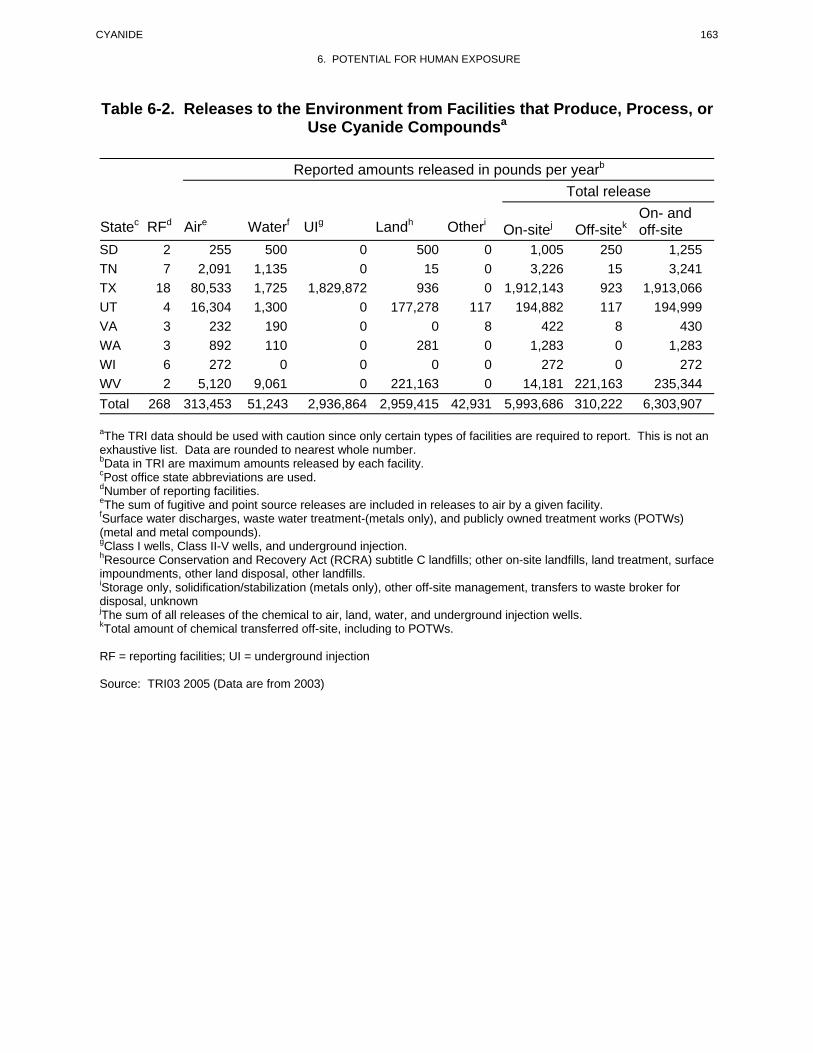
According to the data given in Table 6-2, it is estimated that 0.313 million pounds (approximately
142 metric tons) of cyanide compounds were released into air in 2003, which amounts to approximately
4.97% of the total environmental release. The TRI data should be used with caution since only certain
types of facilities are required to report. This is not an exhaustive list. No information is available in the
TRI database for other cyanide and thiocyanate compounds in this profile because these compounds are
not included under SARA, Title III, and therefore, are not among the chemicals that facilities are required
to report (EPA 1993g, 2001).
6.2.2 Water
There are numerous sources that release cyanide into water. Cyanide is released into water from both
point and nonpoint sources. The major point sources of cyanide released to water are discharges from
publicly owned treatment works (POTWs), iron and steel production, and organic chemical industries
(EPA 1981e). Estimates based on data from the mid-to-late 1970s indicate that these sources account for
≈89% of the estimated 31 million pounds of total cyanide discharged annually to surface waters. Since
metal finishing and organic chemical industries are estimated to account for 90% of the influent to
POTWs, they are the dominant sources of both direct and indirect discharge of cyanide to water (EPA
1981e). The amount of cyanide released to surface water by U.S. industrial facilities that manufactured or
CYANIDE 160
6. POTENTIAL FOR HUMAN EXPOSURE
Table 6-1. Releases to the Environment from Facilities that Produce, Process, or Use Hydrogen Cyanidea
Reported amounts released in pounds per yearb
Total release Statec RFd Aire Waterf UIg Landh On-sitej Off-sitek On- and off-site AK 1 12,477 0 0 0 12,477 0 12,477 AL 2 5,735 0 0 0 5,735 0 5,735 AR 1 0 0 0 0 0 0 0 CA 6 20,719 0 0 0 20,719 0 20,719 CO 2 8,119 0 0 1 8,120 0 8,120 DE 1 7,100 960 0 0 8,060 0 8,060 ID 1 15,000 0 0 0 15,000 0 15,000 IL 2 8,178 0 0 842 8,178 842 9,020 IN 2 2,963 0 0 0 2,963 0 2,963 KY 1 250 0 0 0 250 0 250 LA 9 64,664 59 0 0 64,723 0 64,723 MA 1 4,241 0 0 0 4,241 0 4,241 MI 1 1,155 0 0 0 1,155 0 1,155 MS 1 28,000 0 0 0 28,000 0 28,000 MT 2 720 0 0 510 1,230 0 1,230 NC 1 0 0 0 0 0 0 0 NH 1 74 0 0 0 74 0 74 NJ 1 290 0 0 0 290 0 290 NV 13 154,182 0 0 320 154,502 0 154,502 OH 2 20,910 0 1,219 0 20,910 1,219 22,129 OK 1 3,409 0 0 0 3,409 0 3,409 PA 1 5,402 0 0 0 5,402 0 5,402 SC 3 31,005 136 0 0 31,141 0 31,141 TN 4 146,700 0 0 0 146,700 0 146,700 TX 23 531,144 452 1,554,533 573 2,086,507 195 2,086,702 UT 1 26,342 0 0 0 26,342 0 26,342 WA 1 440 110 0 0 550 0 550
CYANIDE 161
6. POTENTIAL FOR HUMAN EXPOSURE
Table 6-1. Releases to the Environment from Facilities that Produce, Process, or Use Hydrogen Cyanidea
Reported amounts released in pounds per yearb
Total release Statec RFd Aire Waterf UIg Landh On-sitej Off-sitek On- and off-site WV 2 40,496 0 0 0 40,496 0 40,496 Total 87 1,139,715 1,717 1,555,752 2,246 2,697,174 2,256 2,699,430
aThe TRI data should be used with caution since only certain types of facilities are required to report. This is not an exhaustive list. Data are rounded to nearest whole number.bData in TRI are maximum amounts released by each facility.cPost office state abbreviations are used.dNumber of reporting facilities.eThe sum of fugitive and point source releases are included in releases to air by a given facility.fSurface water discharges, waste water treatment-(metals only), and publicly owned treatment works (POTWs) (metal and metal compounds).gClass I wells, Class II-V wells, and underground injection.hResource Conservation and Recovery Act (RCRA) subtitle C landfills; other on-site landfills, land treatment, surface impoundments, other land disposal, other landfills.iStorage only, solidification/stabilization (metals only), other off-site management, transfers to waste broker for disposal, unknown jThe sum of all releases of the chemical to air, land, water, and underground injection wells.kTotal amount of chemical transferred off-site, including to POTWs.
RF = reporting facilities; UI = underground injection
Source: TRI03 2005 (Data are from 2003)
CYANIDE 162
6. POTENTIAL FOR HUMAN EXPOSURE
Table 6-2. Releases to the Environment from Facilities that Produce, Process, or Use Cyanide Compoundsa
Reported amounts released in pounds per yearb
Total release
Statec RFd Aire Waterf UIg Landh Otheri On-sitej Off-sitek On- and off-site
AK 4 0 0 0 540,718 0 540,718 0 540,718 AL 6 930 1,569 65 23,000 0 25,499 65 25,564 AR 3 746 0 0 21,955 0 22,701 0 22,701 AZ 3 20 0 0 0 119 20 119 139 CA 15 1,288 533 560 16,501 11 1,821 17,072 18,893 CO 1 10 0 0 3 0 13 0 13 CT 6 945 149 0 0 297 1,094 297 1,391 DE 1 7,100 960 0 0 0 8,060 0 8,060 FL 4 0 0 0 0 0 0 0 0 GA 4 36 9 0 261 0 45 261 306 IA 1 0 0 0 0 0 0 0 0 ID 1 255 5 0 0 0 260 0 260 IL 28 5,521 422 0 35 3,587 5,944 3,621 9,565 IN 14 6,442 13,585 39,006 430,760 0 489,787 6 489,793 KY 7 1,189 337 0 5 0 1,526 5 1,531 LA 3 4 65 605,383 4 0 605,456 0 605,456 MA 4 255 0 0 18 355 255 373 628 MD 1 168 0 0 0 0 168 0 168 ME 2 736 0 0 0 0 736 0 736 MI 15 3,189 6 11,953 12,667 1,325 25,398 3,742 29,140 MN 5 1,841 0 0 0 0 1,841 0 1,841 MO 5 487 5 0 5 0 497 0 497 MS 2 28,000 0 0 0 0 28,000 0 28,000 MT 2 0 0 0 71,000 0 71,000 0 71,000 NC 3 250 0 0 0 250 250 250 500 NH 1 0 47 0 0 0 47 0 47 NJ 5 11,922 1,312 0 20,400 4 14,220 19,418 33,638 NV 21 37,473 0 0 1,416,272 1,025 1,453,745 1,025 1,454,770 NY 10 2,475 270 0 0 0 2,745 0 2,745 OH 22 14,709 168 450,025 1,133 26,900 464,877 28,058 492,936 OK 2 500 5 0 5 250 510 250 760 OR 3 162 5 0 150 0 167 150 317 PA 8 80,089 17,519 0 4,350 0 97,608 4,350 101,958 PR 1 250 0 0 0 0 250 0 250 RI 6 250 250 0 0 746 500 746 1,246 SC 4 512 0 0 0 7,938 512 7,938 8,450
CYANIDE 163
6. POTENTIAL FOR HUMAN EXPOSURE
Table 6-2. Releases to the Environment from Facilities that Produce, Process, or Use Cyanide Compoundsa
Reported amounts released in pounds per yearb
Total release On- and
Statec RFd Aire Waterf UIg Landh Otheri On-sitej Off-sitek off-site SD 2 255 500 0 500 0 1,005 250 1,255 TN 7 2,091 1,135 0 15 0 3,226 15 3,241 TX 18 80,533 1,725 1,829,872 936 0 1,912,143 923 1,913,066 UT 4 16,304 1,300 0 177,278 117 194,882 117 194,999 VA 3 232 190 0 0 8 422 8 430 WA 3 892 110 0 281 0 1,283 0 1,283 WI 6 272 0 0 0 0 272 0 272 WV 2 5,120 9,061 0 221,163 0 14,181 221,163 235,344 Total 268 313,453 51,243 2,936,864 2,959,415 42,931 5,993,686 310,222 6,303,907
aThe TRI data should be used with caution since only certain types of facilities are required to report. This is not an exhaustive list. Data are rounded to nearest whole number.bData in TRI are maximum amounts released by each facility.cPost office state abbreviations are used.dNumber of reporting facilities.eThe sum of fugitive and point source releases are included in releases to air by a given facility.fSurface water discharges, waste water treatment-(metals only), and publicly owned treatment works (POTWs) (metal and metal compounds).gClass I wells, Class II-V wells, and underground injection.hResource Conservation and Recovery Act (RCRA) subtitle C landfills; other on-site landfills, land treatment, surface impoundments, other land disposal, other landfills.iStorage only, solidification/stabilization (metals only), other off-site management, transfers to waste broker for disposal, unknown jThe sum of all releases of the chemical to air, land, water, and underground injection wells.kTotal amount of chemical transferred off-site, including to POTWs.
RF = reporting facilities; UI = underground injection
Source: TRI03 2005 (Data are from 2003)
CYANIDE 164
6. POTENTIAL FOR HUMAN EXPOSURE
processed cyanide compounds ranged from approximately 0 to 150,000 and 1,100 to 1,090,000 pounds,
respectively (TRI88 1990). These data indicate that the industrial discharge of cyanides into surface
water and POTWs decreased substantially in 1988 in comparison to the estimated discharge during the
1970s.
The amount of hydrogen cyanide and cyanide compounds released to surface water in 2003 by U.S.
industrial facilities sorted by state is shown in Tables 6-1 and 6-2 (TRI03 2005). According to TRI03
(2005), estimated totals of 1,717 and 51,200 pounds of hydrogen cyanide and cyanide compounds,
respectively, were discharged to surface water in 2003. These releases amount to approximately
0.064 and 0.81% of the total environmental release of hydrogen cyanide and cyanide compounds,
respectively. Hydrogen cyanide and cyanide compounds were also released through underground
injection wells at estimated totals of 1,560,000 and 2,940,000 pounds, respectively. These releases
amount to 57.7 and 46.6% of the total environmental release of hydrogen cyanide and cyanide
compounds, respectively. The TRI data should be used with caution since only certain facilities are
required to report. This is not an exhaustive list. No information is available in the TRI database for
other cyanide and thiocyanate compounds in this profile because these compounds are not included under
SARA, Title III, and therefore, are not among the chemicals that facilities are required to report (EPA
1993g, 2001).
The effluents from the cyanidation process used in the extraction of precious metals from their ores may
contain high levels of cyanide (Huiatt 1985; Korte and Coulston 1995; Mudder and Botz 2000; Scott
1985). The total cyanide content of typical tailing pond effluents from gold mill tailing ponds has been
reported to range from 0.3 to 310 mg/L (EPA 1994c; Scott 1985). Although the contribution from this
source to the total discharge of cyanide into the environment has been estimated to be negligible on
average (EPA 1981e), large, short-term releases can occur from the failure of tailing ponds, resulting in
the introduction of high concentrations of cyanide into local surface waters and subsoils (Fields 2001;
Mudder and Botz 2000). Normally, these cyanide wastes undergo decontamination through the
conversion of cyanide to the less toxic cyanate in a chemical oxidation methods commonly referred to as
alkaline chlorination. In the method, the cyanide wastes are treated with sodium hydroxide or sodium
hypochlorite. Alkaline chlorination is the most widely used commercial method for treating cyanide-
containing wastes. Depending on the cyanides present, the product will be a sludge or solution, which,
when sufficient reaction time has been allowed, will, in time, largely be devoid of free cyanide (IRPTC
1985). Leachates from solid waste disposal sites are point sources of cyanide release to groundwater
(Myers 1983; Venkataramani et al. 1984). No quantitative estimate of the amount of cyanide entering the
CYANIDE 165
6. POTENTIAL FOR HUMAN EXPOSURE
groundwater from this point source was located. The nonpoint sources of cyanide released to water are
comprised of agricultural and road runoff and atmospheric fallout and washout. The predominant sources
of cyanides found in urban runoff samples were reported to be products of gasoline combustion and
anticaking ingredients in road salts (Cole et al. 1984). It has been estimated that a maximum of
≈2 million pounds of sodium ferrocyanide, which is used as an anticaking agent in road salts during the
winter in the northeastern United States, are washed off from roads into streams and storm sewers (EPA
1981e; Gaffney et al. 1987).
Thiocyanate is released to water primarily from discharges of industrial waste waters from coal
processing and extraction of gold and silver (Boucabeille et al. 1994a). Thiocyanate is also found in
mining waste waters where it results from the reaction of the cyanide anion (CN–) with sulphur
(Boucabeille et al. 1994b). Thiocyanate has been detected in surface water samples at one of eight
hazardous waste sites, and in groundwater samples at five of eight hazardous waste sites where
thiocyanate has been detected in some environmental medium (HazDat 2005). The HazDat information
used includes data from both NPL and other Superfund sites.
6.2.3 Soil
Estimates of amounts of cyanide released to soil from anthropogenic sources are limited. The largest
anthropogenic sources of cyanide releases to soil probably result from the disposal of cyanide wastes in
landfills and the use of cyanide-containing road salts (EPA 1981e; Gaffney et al. 1987). In 77 of
124 hazardous waste sites in the United States, the median cyanide concentration in subsoil samples was
0.8 mg/kg (HazDat 2005; WHO 2004b). In the same study, topsoil samples taken from 51 of 91 had
median cyanide concentrations of 0.4 mg/kg. In the soils of former manufactured gas plant sites, the
concentrations of cyanide compounds in the United States are below 2,000 mg/kg (Shifrin et al. 1996;
WHO 2004b). The cyanides in these soils are predominately (97%) in the form of ferrocyanides.
The amount of hydrogen cyanide and cyanide compounds released to land in 2003 by U.S. industrial
facilities sorted by state is shown in Tables 6-1 and 6-2 (TRI03 2005). According to TRI03 (2005), an
estimated total of only 2,250 pounds of hydrogen cyanide was discharged to land from U.S.
manufacturing or processing facilities in 2003. Conversely, an estimated 2.96 million pounds of cyanide
compounds were discharged to land in 2003, which amounts to 46.9% of the total release to the
environment. An estimated 2,260 and 310,000 pounds of hydrogen cyanide and cyanide compound
wastes were transferred off-site (see Tables 6-1 and 6-2) and may be ultimately disposed of on land. The
CYANIDE 166
6. POTENTIAL FOR HUMAN EXPOSURE
TRI data should be used with caution since only certain facilities are required to report. This is not an
exhaustive list. No information is available in the TRI database for other cyanide and thiocyanate
compounds in this profile because these compounds are not included under SARA, Title III, and
therefore, are not among the chemicals that facilities are required to report (EPA 1993g, 2001).
Natural biogenic processes of bacteria, fungi, and cyanogenic plants such as sorghum, soybeans, and
cassava, also release cyanide into the soil (EPA 1978c; Knowles 1988; WHO 1992, 2004).
Releases of thiocyanate to soil result from anthropogenic and natural sources. Anthropogenic releases
occur primarily from direct application in herbicidal formulations (e.g., amitrol-T, a mixture of
ammonium thiocyanate and amino-1,2,4-triazole) and from disposal as byproducts from industrial
processes. Nonanthropogenic sources include damaged or decaying tissues of plants from the family
Brassica (e.g., mustard, rape) (Brown and Morra 1993).
6.3 ENVIRONMENTAL FATE
6.3.1 Transport and Partitioning
Because hydrogen cyanide is a gas and has a relatively slow degradation rate in air (see Section 6.3.2), the
atmosphere will be the ultimate sink for this compound. Almost all of the hydrogen cyanide released to
the atmosphere remains in the lower altitudes (troposphere); only 2% of tropospheric hydrogen cyanide is
transferred to the stratosphere (Cicerone and Zellner 1983). Cyanide has the potential to be transported
over long distances from its emission source. Despite higher water solubility at saturated pressure, the
removal of hydrogen cyanide by rainwater appears to be a negligible partitioning pathway (Cicerone and
Zellner 1983). Because hydrogen cyanide is a gas, its removal from air by dry deposition is also likely to
be negligible. However, metal cyanide particles, particularly water-soluble cyanide particles, are
expected to be removed from the air by both wet and dry deposition.
Volatilization and sorption are the two physical processes that contribute to the loss of cyanide from
water. At pH <9.2, most of the free cyanide in solution should exist as hydrogen cyanide, a volatile
cyanide form (EPA 1978c). On the basis of Henry's law constant (see Table 4-2) and the volatility
characteristics associated with various ranges of Henry's law constant (Thomas 1982), volatilization is a
significant and probably dominant fate process for hydrogen cyanide in surface water (EPA 1992f). The
most common alkali metal cyanides (e.g., sodium and potassium cyanide) may also be lost from surface
CYANIDE 167
6. POTENTIAL FOR HUMAN EXPOSURE
water primarily through volatilization; whereas, the sparingly soluble metal cyanides such as copper (I)
cyanide are removed from water predominantly by sedimentation and biodegradation (see
Section 6.3.2.2) (EPA 1992f). Variations in the volatilization rate are expected because this process is
affected by several parameters including temperature, pH, wind speed, and cyanide concentration (EPA
1979). EPA (1979) summarized the unpublished results of a laboratory study that indicated that the
volatilization half-life of hydrogen cyanide from solutions at concentrations of 25–200 μg/L ranged from
22 to 110 hours. First-order kinetics were observed. In outdoor experiments with moderate winds, the
rate of hydrogen cyanide loss increased by a factor of 2–2.5. In a study to evaluate the effect of cyanide
on biochemical oxidation, there was a 50% loss of 6 ppm (mg/L) cyanide in river water kept in open
biochemical oxygen demand bottles (without aeration) at pH 7.4 within ≈10 days (Ludzack et al. 1951).
When the bottles were aerated (rate of aeration not given), 50% loss occurred in only ≈10 hours. The
kinetics of the rate of loss due to volatilization were not rigorously investigated. The volatilization rate
was pH-dependent, with the rate faster at a lower pH. Data indicated that cyanide volatilization is a more
important fate process than cyanide loss due to chemical and biodegradation reactions (see
Section 6.3.2.2) (Ludzack et al. 1951; Raef et al. 1977a). Because volatilization is not an important fate
process for cyanide in groundwater, cyanide would be expected to persist for considerably longer periods
of time in underground aquifers than in surface water.
Cyanides are sorbed by various natural media, including clays (Cruz et al. 1974), biological solids (Raef
et al. 1977b), and sediments (EPA. 1979). However, additional data are necessary to assess the
significance of cyanide sorption to suspended solids and sediments in water. Hydrogen cyanide and the
alkali metal cyanides are not likely to be strongly sorbed onto sediments and suspended solids because of
their high water solubilities (see Table 4-2). Soluble metal cyanides may show somewhat stronger
sorption than hydrogen cyanide, with the extent of sorption increasing with decreasing pH and increasing
iron oxide, clay, and organic material contents of sediment and suspended solids (EPA 1979). However,
sorption is probably insignificant even for metal cyanides when compared to volatilization and
biodegradation (EPA 1979, 1992f).
There are no data available to indicate that simple metal cyanides and hydrogen cyanide bioconcentrate in
aquatic organisms (EPA 1979, 1980a, 1985a, 1992f). Bioconcentration factors (BCFs) of 0.73 and
1.62 can be calculated for hydrogen cyanide, using the equation of Veith et al. (1979) for the BCF of a
chemical in whole fish (log BCF, 0.85; log Kow, -0.70) and the log Kow values in Table 4-2. Similarly, the
calculated BCF for sodium cyanide is 0.47. There is some evidence that certain metal cyanide complexes
bioaccumulate in aquatic organisms. Fish from water with soluble silver and copper cyanide complexes
CYANIDE 168
6. POTENTIAL FOR HUMAN EXPOSURE
were found to have metal cyanides in their tissues at concentrations ranging up to 168 and 304 μg/g,
respectively (wet or dry weight not specified) (EPA 1979). It is difficult to evaluate the toxicologic
significance of bioaccumulation of metal cyanide complexes because these compounds are much less
toxic than soluble hydrogen cyanide, sodium cyanide, or potassium cyanide (EPA 1992f). There is no
evidence of biomagnification of cyanides in the food chain (EPA 1978c). Accumulation of cyanide in
food webs is not expected, considering the rapid detoxification of cyanide by most species and the lethal
effects of large doses of cyanide (EPA 1978c).
Volatilization of hydrogen cyanide would be a significant loss mechanism for cyanides from soil surfaces
at a pH <9.2. Cyanides are fairly mobile in soil. Mobility is lowest in soils with low pH and high
concentrations of free iron oxides, positively charged particles, and clays (e.g., chlorite, kaolin, gibbsite),
and highest in soils with high pH, high concentrations of free CaCO3 and negatively charged particles,
and low clay content (EPA 1979). Although cyanide has a low soil sorption capability, it is usually not
detected in groundwater, probably because of fixation by trace metals through complexation or
transformation by soil microorganisms (see Section 6.3.2.3) (EPA 1978c). In soils where cyanide levels
are high enough to be toxic to microorganisms (i.e., landfills, spills), this compound may leach into
groundwater (EPA 1984a). Also, leaching of cyanide into a shallow aquifer can occur, as demonstrated
by the high concentration of cyanide (1,200 μg/L) in groundwater sampled from the Biscayne Aquifer in
Dade County, Florida, which lies below a solid waste site (Myers 1983).
No information could be found in the available literature on the transport and partitioning of cyanogen
chloride in the environment, or its partitioning coefficients (Koc, Kow) or Henry's law constants (see
Table 4-2). Like cyanogen, cyanogen chloride is a highly volatile gas (see Table 4-2). Therefore, it
would be expected that volatilization from water and soil would be a primary route of environmental
partitioning for both cyanogen and cyanogen chloride.
Similarly, little information could be found in the available literature on the environmental transport and
partitioning of thiocyanate in the environment. At near ambient temperatures (≈30 °C), it appears that
sorption and volatilization are not significant partitioning processes for thiocyanate in soil, with
thiocyanate losses due primarily to microbial degradation (see Section 6.3.2.3) (Brown and Morra 1993).
CYANIDE 169
6. POTENTIAL FOR HUMAN EXPOSURE
6.3.2 Transformation and Degradation
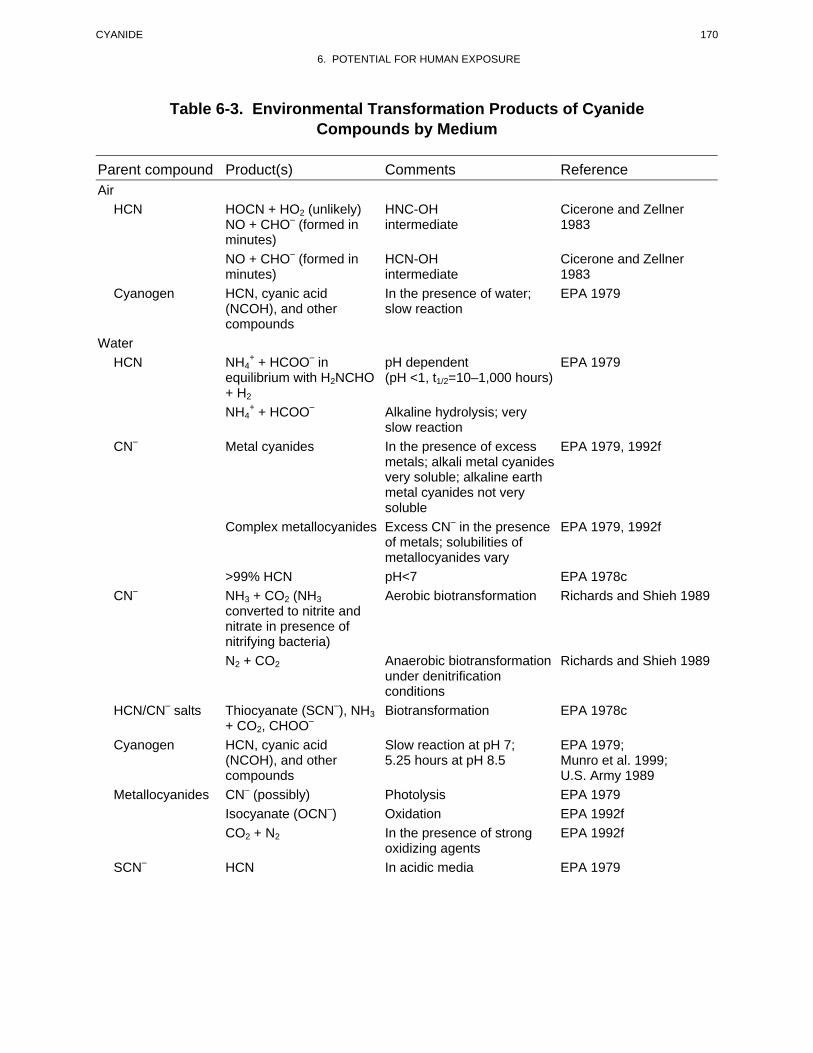
The various cyanide compounds included in this profile undergo a number of different transformation and
degradation reactions in the environment as discussed in the following sections. The resulting
environmental transformation products within different media are shown in Table 6-3.
6.3.2.1 Air
Most cyanide in the atmosphere exists almost entirely as hydrogen cyanide gas, although small amounts
of metal cyanides may be present as particulate matter in the air (EPA 1984a). Hydrogen cyanide is very
resistant to photolysis at wavelengths of normal sunlight (EPA 1979). The most important reaction of
hydrogen cyanide in air is the reaction with photochemically-generated hydroxyl radicals and subsequent
rapid oxidation to carbon monoxide (CO) and nitric oxide (NO); photolysis and reaction with ozone are
not important transformation processes, and reaction with singlet oxygen (O 1D) is not a significant
transformation process except at stratospheric altitudes where singlet oxygen is present in significant
concentrations (Cicerone and Zellner 1983). The rate of hydroxyl radical reaction with hydrogen cyanide
in the atmosphere depends on the altitude, and the rate of the reaction is at least an order of magnitude
faster at lower tropospheric altitudes (0–8 km) than at upper tropospheric altitudes (10–12 km) (Cicerone
and Zellner 1983). Based on a reaction rate constant of 3x10-14 cm3/(molecule-sec) at 25 °C (Fritz et al.
1982) and assuming an average hydroxyl radical concentration of 5x10⁵ molecules/cm3, the residence
time for the reaction of hydrogen cyanide vapor with hydroxyl radicals in the atmosphere is ≈2 years.
This value compares well with the atmospheric residence time derived by Cicerone and Zellner (1983) of
approximately 2.5 years, with a range of 1.3–5.0 years, depending on the hydroxyl radical concentrations
assumed. Using the equation t½ = 0.693τ for converting residence time (τ) to half-life (t½) (Lyman 1982)
and an estimated atmospheric residence time for hydrogen cyanide of 2–3 years, and assuming first-order
kinetics for the reaction of hydrogen cyanide with hydroxyl radicals, an atmospheric half-life of 1.4–
2.9 years can be calculated for hydrogen cyanide.
Cyanogen is reactive and does not persist in the environment unchanged (EPA 1978c). Cyanogen reacts
slowly with water to yield hydrogen cyanide and cyanic acid (HOCN) among other products (EPA 1979)
and this hydrolysis reaction may be a possible atmospheric degradation pathway. Cyanogen has also been
shown to react with hydroxyl radicals in the gas phase (Atkinson 1989). Based on a rate constant of
2.5x10⁻¹⁵ cm3/(molecule-sec) at 27 °C and assuming an average hydroxyl radical concentration of
5x10⁵ molecules/cm3, the residence time for the reaction of hydrogen cyanide vapor with hydroxyl
CYANIDE 170
6. POTENTIAL FOR HUMAN EXPOSURE
Table 6-3. Environmental Transformation Products of Cyanide Compounds by Medium
Parent compound Product(s) Comments Reference
HCN HOCN + HO2 (unlikely) NO + CHO– (formed in
HNC-OH intermediate
Cicerone and Zellner 1983
minutes) NO + CHO– (formed in minutes)
HCN-OH intermediate
Cicerone and Zellner 1983
Cyanogen HCN, cyanic acid (NCOH), and other compounds
In the presence of water; slow reaction
EPA 1979
HCN NH4 + + HCOO– in
equilibrium with H2NCHO + H2
pH dependent (pH <1, t1/2=10–1,000 hours)
EPA 1979
CN–
NH4 + + HCOO–
Metal cyanides
Alkaline hydrolysis; very slow reactionIn the presence of excess metals; alkali metal cyanides very soluble; alkaline earth
EPA 1979, 1992f
CN–
metal cyanides not very soluble
Complex metallocyanides Excess CN– in the presence
>99% HCN NH3 + CO2 (NH3 converted to nitrite and nitrate in presence of nitrifying bacteria) N2 + CO2
of metals; solubilities of metallocyanides vary pH<7 Aerobic biotransformation
Anaerobic biotransformation under denitrification conditions
EPA 1979, 1992f
EPA 1978c Richards and Shieh 1989
Richards and Shieh 1989
HCN/CN– salts
Cyanogen
Metallocyanides
SCN–
Thiocyanate (SCN–), NH3 + CO2, CHOO–
HCN, cyanic acid (NCOH), and other compounds CN– (possibly) Isocyanate (OCN–) CO2 + N2
HCN
Biotransformation
Slow reaction at pH 7; 5.25 hours at pH 8.5
Photolysis Oxidation In the presence of strong oxidizing agents In acidic media
EPA 1978c
EPA 1979; Munro et al. 1999; U.S. Army 1989 EPA 1979 EPA 1992f EPA 1992f
EPA 1979
Air
Water
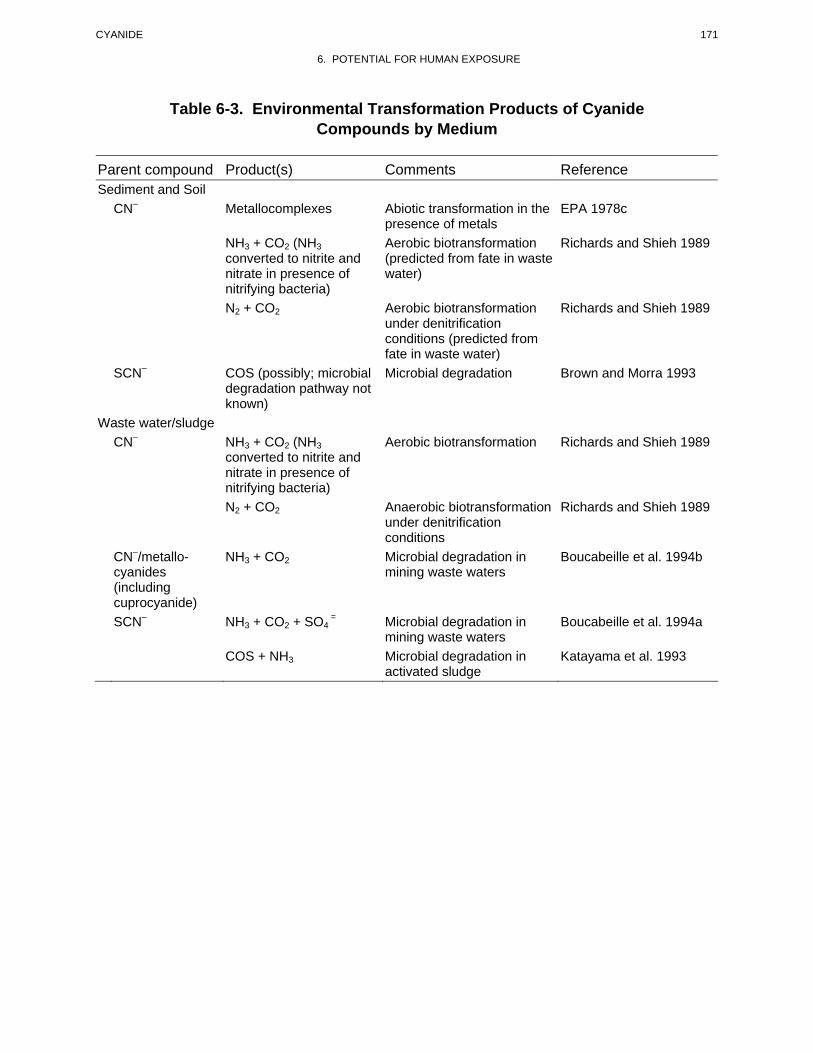
CYANIDE 171
6. POTENTIAL FOR HUMAN EXPOSURE
Table 6-3. Environmental Transformation Products of Cyanide Compounds by Medium
Parent compound Product(s) Comments Reference Sediment and Soil
CN– Metallocomplexes Abiotic transformation in the presence of metals
EPA 1978c
NH3 + CO2 (NH3 converted to nitrite and nitrate in presence of nitrifying bacteria)
Aerobic biotransformation (predicted from fate in waste water)
Richards and Shieh 1989
N2 + CO2 Aerobic biotransformation Richards and Shieh 1989 under denitrification conditions (predicted from fate in waste water)
SCN– COS (possibly; microbial degradation pathway not known)
Microbial degradation Brown and Morra 1993
Waste water/sludge CN– NH3 + CO2 (NH3
converted to nitrite and Aerobic biotransformation Richards and Shieh 1989
nitrate in presence of nitrifying bacteria) N2 + CO2 Anaerobic biotransformation Richards and Shieh 1989
under denitrification conditions
CN–/metallocyanides (including cuprocyanide)
NH3 + CO2 Microbial degradation in mining waste waters
Boucabeille et al. 1994b
SCN– NH3 + CO2 + SO4 = Microbial degradation in
mining waste waters Boucabeille et al. 1994a
COS + NH3 Microbial degradation in activated sludge
Katayama et al. 1993
CYANIDE 172
6. POTENTIAL FOR HUMAN EXPOSURE
radicals in the atmosphere is ≈25 years. Therefore, the reaction of cyanogen with photochemically-
induced hydroxyl radicals will not play a significant role in the degradation of this compound in air.
No specific information was found in the available literature on the transformation and degradation of
cyanogen chloride or thiocyanates in air. However, cyanogen chloride has been shown to undergo slow
hydrolysis in neutral aqueous solution (rate constant at pH 7 of 6.45x10⁻⁵ mol-1sec-1) (U.S. Army 1989).
Therefore, hydrolysis of this compound may be a possible atmospheric degradation pathway in air.
6.3.2.2 Water
Cyanide occurs most commonly as hydrogen cyanide in water, although it can also occur as the cyanide
ion, alkali and alkaline earth metal cyanides (potassium cyanide, sodium cyanide, calcium cyanide),
relatively stable metallocyanide complexes (ferricyanide complex [Fe(CN)6]-3), moderately stable
metallocyanide complexes (complex nickel and copper cyanide), or easily decomposable metallocyanide
complexes (zinc cyanide [Zn(CN)2], cadmium cyanide [Cd(CN)2]). The environmental fate of these
cyanide compounds varies widely (EPA 1979).
Oxidation, hydrolysis, and photolysis are the three predominant chemical processes that may cause loss of
simple cyanides in aquatic media. Certain cyanides are oxidized to isocyanates by strong oxidizing
agents; the isocyanates may be further hydrolyzed to ammonia and carbon dioxide (EPA 1978c).
However, it has not yet been determined whether such oxidation and subsequent hydrolysis of isocyanate
is a significant fate process in natural waters known to contain peroxy radicals (EPA 1992f).
In water, hydrogen cyanide and cyanide ion exist in equilibrium with their relative concentrations
primarily dependent on pH and temperature. At pH <8, >93% of the free cyanide in water will exist as
undissociated hydrogen cyanide (EPA 1978c). Hydrogen cyanide can be hydrolyzed to formamide,
which is subsequently hydrolyzed to ammonium and formate ions (EPA 1979). However, the relatively
slow rates of hydrolysis reported for hydrogen cyanide in acidic solution (Krieble and McNally 1929;
Krieble and Peiker 1933) and of cyanides under alkaline conditions (Wiegand and Tremelling 1972)
indicate that hydrolysis is not competitive with volatilization and biodegradation for removal of free
cyanide from ambient waters (EPA 1979).
The alkali metal cyanides are very soluble in water. As a result, they readily dissociate into their
respective anions and cations when released into water. Depending on the pH of the water, the resulting
CYANIDE 173
6. POTENTIAL FOR HUMAN EXPOSURE
cyanide ion may then form hydrogen cyanide or react with various metals in natural water. The
proportion of hydrogen cyanide formed from soluble cyanides increases as the water pH decreases. At
pH <7, >99% of the cyanide ions in water are converted to hydrogen cyanide (EPA 1978c). As the pH
increases, cyanide ions in the water may form complex metallocyanides in the presence of excess
cyanides; however, if metals are prevalent, simple metal cyanides are formed. Unlike water-soluble alkali
metal cyanides, insoluble metal cyanides are not expected to degrade to hydrogen cyanide (EPA 1979).
The significance of photolysis in the fate of cyanides in water has not been fully investigated. Hydrogen
cyanide and cyanide ions in aqueous solution have been found to be very resistant to photolysis by natural
sunlight, except under heterogeneous photocatalytic conditions (EPA 1979; Frank and Bard 1977).
Photocatalytic oxidation may not be significant in natural waters, however, because of significant light
reduction at increasingly greater depths (EPA 1992f). In clear water or at water surfaces, some
metallocyanides, such as ferrocyanides and ferricyanides, may decompose to the cyanide ion by
photodissociation and subsequently form hydrogen cyanide. For example, diurnal changes in free
cyanide concentrations in the drainage from spent precious metal ore heaps were found to maximize
around mid-day due to the photodissociation of iron and cobalt cyanocomplexes (Johnson et al. 2002).
Because of adsorption of ferrocyanide onto soil surfaces and sediment of surface waters, and light
scattering in turbid waters in the field, the rate of free cyanide formation from the photolysis of
ferrocyanide in runoff and surface water from washout of ferrocyanide in de-icing salt will be slower than
from laboratory photolysis with clean water (EPA 1979).
Biodegradation is an important transformation process for cyanide in natural surface waters, and is
dependent on such factors as cyanide concentrations, pH, temperature, availability of nutrients, and
acclimation of microbes. However, additional data are needed to assess the relative significance of this
process in determining the fate of aquatic cyanides (EPA 1979). Although the cyanide ion is toxic to
microorganisms at concentrations as low as 5–10 mg/L (Klecka et al. 1985; Malaney et al. 1959),
acclimation increases tolerance to this compound (Raef et al. 1977a). A number of pure cultures of
microorganisms degrade low concentrations of cyanide under both aerobic and anaerobic conditions
(EPA 1978c, 1979, 1992f). However, biodegradation data derived from use of a pure culture are not
strictly relevant to natural waters that contain mixed cultures. Mixed microorganisms in sewage sludge or
activated sludge acclimated to cyanide also significantly biodegrade concentrations ≤100 mg/L of most
simple and complex cyanides (Gaudy et al. 1982; Pettet and Mills 1954; Richards and Shieh 1989;
Shivaraman et al. 1985). In a study to evaluate the effect of the cyanide ion on biochemical oxidation
conducted in sealed vessels, a 50% loss of cyanide at concentrations ≤6 mg/L in two natural river waters
CYANIDE 174
6. POTENTIAL FOR HUMAN EXPOSURE
occurred at times estimated to range from <10 to 24 days (Ludzack et al. 1951). The rate of loss appeared
to be linear within this time frame. These data may represent a biodegradation half-life; however, the
possibility of loss by chemical reaction was not addressed in this study.
Most of the available information on the mechanisms of biodegradation of cyanides in water comes from
studies on the evaluation and use of this process as a means of detoxicifying cyanide-containing wastes
(Akcil and Mudder 2003; EPA 1994c; Raybuck 1992). It is known that there is a natural attentuation of
the cyanide ion and thiocyanide concentrations in waste waters, for example those obtained gold mill
tails, that is due the acclimation of indigenous microflora in the tailings (Akcil and Mudder 2003;
Oudjehani et al. 2002; Zagury et al. 2004). A number of microorganisms have been identified that are
capable of uptake, conversion, sorption, and/or precipitation of the cyanide ion, cyanate, and thiocyanate,
including species of the genera, Actinomyces, Alcaligenes, Arthrobacter, Bacillus, Micrococcus,
Neisseria, Paracoccus, Pseudomonas, and Thiobacillus (Akcil and Mudder 2003). Some of these
species, for example Pseudomonas, are capable of using the cyanide ion and thiocyanate as the sole
source of carbon and nitrogen and therefore, are particularly effective at cyanide degradation. In fact,
Pseudomonas is the basis of commercial applications for degrading the cyanide ion to ammonia and
carbonate in waste waters generated in mining operations that use the cyanide ion to leach gold and other
precious metals for low-grade ores (Akcil and Mudder 2003).
Raybuck (1992) has recently reviewed the role of microbes in cyanide degradation and has categorized
the microbial enzymes that use the cyanide ion as a substrate according to the following types of
reactions: substitution/addition, hydrolysis, oxidation, and reduction. Sulfur transferases such as
rhodanese are involved in substitution reactions that result in the conversion of the cyanide ion to the less
toxic thiocyanate, whereas pyridoxal phosphate enzymes are involved in substitution/addition reactions
that result in production of nitrile derivatives of α-amino acids. These organic nitriles may then be
ultimately degraded via enzyme catalyzed hydrolysis to either the corresponding amino acid and
ammonia (without formation of the free amide) or the carboxylic acid and ammonia (via formation of the
free amide). The cyanide hydratase and cyanidase enzymes catalyze the hydrolysis of the cyanide ion to
formamide or formic acid and ammonia, respectively. A strain of Alcaligenes xylosoxidans subsp.
denitrificans has been found to effectively hydrolyze the cyanide ion concentrations up to 300 mg/L down
to very low levels (0.01–0.02 mg/L) and to be resistant to inactivation by chloride, sulfate, iodide, Fe+2,
Zn+2, or Ni+2 at concentrations of 70 mg/L (Basheer et al. 1992). Thus, these hydrolytic systems are some
of the most promising for detoxification of cyanide-containing waste waters (Raybuck 1992). A number
of microbial systems have been identified that are capable of direct oxidation or reduction of the cyanide
CYANIDE 175
6. POTENTIAL FOR HUMAN EXPOSURE
ion. Bacillus pumulus, Pseudomonas fluorescens, and Pseudomonas paucimobili have all been found to
oxidize the cyanide ion to ammonia and carbon dioxide (Meyers et al. 1993). In an aerobic batch
bioreactor experiment, Pseudomonas putida was found to significantly degrade 4 mM sodium cyanide
(cyanide concentration approximately 100 mg/L) to ammonia and carbon dioxide (Chapatwala et al.
1993). Other evidence indicates that formamide and formate are additional transformation products in
microbial oxidation of the cyanide ion by this species, inferring that there may be more than one pathway
of cyanide biotransformation involved (Kunz et al. 1992; White et al. 1988). Several bacterial species
have been identified that are capable of oxidative degradation of metallocyanides (Silva-Avalos et al.
1990). The cyanide oxygenase system involved in this process offers a new technology for the treatment
of metal cyanide wastes (Raybuck 1992).
The ferrocyanide complex is not easily biodegradable (Belly and Goodhue 1976; Pettet and Mills 1954).
However, when an aqueous solution of potassium ferrocyanide was seeded with pure culture of
Pseudomona aeruginosa, or E. coli, or a mixture of the two bacteria, formation of free cyanide was
observed after a delay period of ≈2 days (Cherryholmes et al. 1985). The rate of free cyanide formation,
when measured as CN–, increased with addition of nutrient in water, and a free cyanide concentration
≤4,000 μg/L was detected at the end of 25 days. It was shown that the free cyanide formation was due to
biodegradation and not to either photolysis or hydrolysis. The relevance of this study to the fate of
ferrocyanide complexes in natural water or industrial effluents is difficult to assess because ferrocyanide
concentrations used in these experiments (3,300 mg/L) are rarely encountered in these media.
Biodegradation is also a significant transformation process for thiocyanates in natural waters; however,
additional data are needed to assess the relative importance of this process. Like the cyanide ion,
thiocyanate is toxic to microorganisms at high concentrations and acclimated cultures have increased
tolerance to this compound (Boucabeille et al. 1994a). Laboratory studies have shown that at
concentrations up to at least 1.42 g/L, thiocyanate was completely degraded within 4 days to ammonia
and sulfate ion (SO4-2) by an acclimatized co-culture of two bacteria (Acinetobacter johnsonii and
Pseudomonas diminuta) isolated from sludge from an urban sewage treatment plant (Boucabeille et al.
1994a). Thiosulfate ion (S2O3-2) was identified as the intermediate in this degradation pathway.
Several studies document the biodegradation of mixtures of cyanides and thiocyanate in waste waters
(e.g., Akcil and Mudder 2003; Boucabeille et al. 1994b; EPA 1994c; Mudder and Whitlock 1984;
Paruchuri et al. 1990; Shivaraman et al. 1985). Under aerobic conditions, the biodegradation of the
cyanide ion and thiocyanate initially produces ammonia, which is converted to nitrite and nitrate in the
CYANIDE 176
6. POTENTIAL FOR HUMAN EXPOSURE
presence of nitrifying bacteria, whereas anaerobic biodegradation under denitrification conditions may
produce nitrogen (Richards and Shieh 1989). Complete biodegradation of simple and metal complexed
cyanides and thiocyanate from mining waste waters by various bacteria belonging to the families
Pseudomonadaceae, Vibrioniaceae, and Enterobacteriaceae has recently been reported (Boucabeille et al.
1994b). Biodegradation of cyanide and thiocyanate resulted in the formation of ammonia, with or
without accumulation of nitrite and/or nitrate, depending on whether a batch, fed-batch, or continuous
treatment process was used. Sulphate ions were produced from thiocyanate degradation. Shivaraman et
al. (1985) reported the uninhibited microbial degradation of thiocyanate and the cyanide ion to ammonia
by acclimatized mixed cultures at cyanide concentrations up to 22.40±1.34 mg/L, whereas Paruchuri et al.
(1990) have reported the complete inhibition of microbial degradation of thiocyanate in the presence of
10 mg/L cyanide ion.
Cyanogen reacts slowly with water to produce hydrogen cyanide, cyanic acid, and other compounds (EPA
1979). Cyanogen chloride also hydrolyzes slowly to cyanic acid and hydrochloric acid in water at pH 7,
with a rate constant of 6.45x10⁻⁵ mol-1sec-1 (U.S. Army 1989). Hydrolysis of cyanogen chloride is more
rapid under acidic and basic conditions, with rate constants of 2x10⁻² and 6–8x10² mol-1sec-1 (pH 10),
respectively (U.S. Army 1989). The half-life of cyanogen chloride at neutral pH ranges between 1 minute
at 45 °C and 10 hours at 5 °C (Opresko et al. 1998). However, volatilization would be expected to be the
predominant fate process for both cyanogen chloride and cyanogen in water and, therefore, these
compounds are not expected to persist in water.
6.3.2.3 Sediment and Soil
Analogous to the fate of cyanides in water, it is predicted that the fate of cyanides in soil would be
dependent on cyanide concentrations, pH, temperature, metal content, concentration of microbes,
availability of nutrients, and acclimation of microbes. Cyanide may occur as hydrogen cyanide, alkali
metal salts, or as immobile metallocyanide complexes. In soil, cyanide present at low concentrations
would biodegrade under aerobic conditions with the initial formation of ammonia, which would be
converted to nitrite and nitrate in the presence of nitrifying bacteria. Under anaerobic conditions, the
cyanides ion will denitrify to gaseous nitrogen (Richards and Shieh 1989). Upper limits of 200 and
2 ppm (mg/kg CN–), respectively, have been reported for uninhibited aerobic and anaerobic
biodegradation of cyanide in soil (Fueller 1985); however, these limits have not been confirmed in other
studies (Thomas and Lester 1993). Cyanide ions in soil are not involved in oxidation-reduction reactions
but may undergo complexation reactions with metal ions in soil (EPA 1978c).
CYANIDE 177
6. POTENTIAL FOR HUMAN EXPOSURE
No information could be found in the available literature on the transformation of cyanogen or cyanogen
chloride in soil or sediment. However, because these compounds are highly volatile gases they are not
expected to persist in soils. Additionally, biotic or abiotic degradation would not be expected to be
significant fate processes compared to volatilization.
Although the fate of thiocyanate in soil is largely uncharacterized, there is evidence to suggest that
thiocyanate is not persistent in soils. Early studies have shown that thiocyanate can undergo both aerobic
(Betts et al. 1979) and anaerobic microbial degradation (Betts et al. 1979; Stafford and Callely 1969;
Youatt 1954); however, the degradation pathway has not been defined (Brown and Morra 1993).
Saturated soils treated with thiocyanate were found to emit carbonyl sulfide (COS) (Minami 1982;
Minami and Fukushi 1981). Katayama et al. (1992, 1993) have reported the formation of carbonyl sulfide
from the biodegradation of thiocyanate by pure and mixed cultures of Thiobacillus thioparus. These
species are ubiquitous in soil (Kelly and Harrison 1989). In a recent laboratory investigation of the fate of
ionic thiocyanate in six different soils, Brown and Morra (1993) concluded that microbial degradation is
the primary mechanism for thiocyanate disappearance at or below 30 °C, with carbonyl sulfide proposed
as a possible hydrolysis product. Loss of thiocyanate at higher temperatures (50–60 °C) did not appear to
result from microbial degradation; the observed decreases in thiocyanate concentrations of soil extracts
with incubation time at elevated temperatures were postulated to result primarily from increased sorption
or increased sorption kinetics, but abiotic catalysis of thiocyanate degradation was also noted as a possible
cause.
6.4 LEVELS MONITORED OR ESTIMATED IN THE ENVIRONMENT
Reliable evaluation of the potential for human exposure to cyanide depends in part on the reliability of
supporting analytical data from environmental samples and biological specimens. Concentrations of
cyanide in unpolluted atmospheres and in pristine surface waters are often so low as to be near the limits
of current analytical methods. Where levels have been measured in the environment, the values reported
for cyanide and thiocyanate must be interpreted with caution. Methods for the analysis of cyanide and
thiocyanate have many interferences (EPA 1978d, 1980e, 1996). In addition, samples containing cyanide
and/or thiocyanate may not be stable if the samples are not carefully preserved (EPA 1978d, 1980e, 1996;
Keith 1991; WHO 2004b). In reviewing data on cyanide levels monitored or estimated in the
environment, it should also be noted that the amount of chemical identified analytically is not necessarily
CYANIDE 178
6. POTENTIAL FOR HUMAN EXPOSURE
equivalent to the amount that is bioavailable (Oudjehani et al. 2002; Zagury et al. 2004). The analytical
methods available for monitoring cyanide in a variety of environmental media are detailed in Chapter 7.
6.4.1 Air
The concentration of hydrogen cyanide in the northern hemisphere's non-urban troposphere ranges from
160 to 166 ppt (Cicerone and Zellner 1983; Jaramillo et al. 1989). Although ambient monitoring data
regarding cyanide in air near source areas (e.g., hydrogen cyanide manufacturing industries, coke
production industries, waste disposal sites) were not located in the available literature, the hydrogen
cyanide concentration in the vicinity of the source areas would be expected to be higher than the non-
urban tropospheric concentration. The semiquantitatively measured hydrogen cyanide concentrations in
the offgas from shale oil retorting processes ranged from 6 to 39 ppm in one retort at one site; however,
hydrogen cyanide was not detected in retorts at another site (Sklarew and Hayes 1984).
Cyanides (reported as cyanide, hydrogen cyanide, sodium cyanide, potassium cyanide, calcium cyanide,
or copper(I) cyanide) have been detected at concentrations (measured as cyanide) between 0.00797 and
0.032 mg/m3 in 6 air samples collected at 5 of 464 hazardous waste sites where cyanides have been
detected in some environmental medium (HazDat 2005). The HazDat information used includes data
from both NPL and other Superfund sites. No information was found on the detection of cyanogen,
cyanogen chloride, or thiocyanates in air at any NPL or other Superfund hazardous waste sites (HazDat
2005). No information could be found in the available literature on the concentrations of cyanogen,
cyanogen chloride, or thiocyanates in air at other locations in the United States.
6.4.2 Water
Cyanide has been detected in waste waters from plating industries at concentrations up to 100 g/L (Chen
et al. 1994; Grosse 1986); from a textile industry at a maximum concentration of 0.2 mg/L (Rawlings and
Samfield 1979); in the primary and secondary effluents from a Los Angeles City waste water treatment
plant at mean concentrations of 29±4 and 10±6 μg/L (0.03 and 0.01 mg/L), respectively (Young 1978);
and in the final effluent from a Los Angeles County waste water treatment plant at a mean concentration
of 240 μg/L (0.24 mg/L) (Young 1978). Waste waters from a mining site storage basin were found to
contain cyanide at concentrations of >10 mg/L as simple cyanides; 20–80 mg/L as combined simple
cyanides and copper(I) cyanide; 20–190 mg/L as combined simple cyanides, copper(I) cyanide, and
CYANIDE 179
6. POTENTIAL FOR HUMAN EXPOSURE
ferrocyanide; and 300–450 mg/L as thiocyanate (Boucabeille et al. 1994b). Waste waters from gold
mines have been reported to contain total cyanide and thiocyanate concentrations ranging from 0.5 to
10 mg/L and from 45 to 75 mg/L, respectively (Mudder and Whitlock 1984). Weak acid dissociable
(WAD) cyanide was measured in tailing ponds at several Nevada gold mines in 1990; the concentrations
ranged from 8.4 to 216 mg/L at the discharge pipe and from 7.8 to 11.3 mg/L at the reclaim area (Henny
et al. 1994). In New York State alone, 47 industries discharged 3,877 pounds of cyanide into streams in
1982 (Rohmann et al. 1985). Cyanide has also been found in groundwater below landfills and disposal
sites (Agency for Toxic Substances and Disease Registry 1989a; Myers 1983; Venkataramani et al. 1984).
A maximum cyanide concentration of 1,200 μg/L (1.2 mg/L) was found in shallow groundwater
≤3 meters below an inactive drum recycling facility in Miami, Florida (Myers 1983). In another example,
a maximum cyanide concentration of 52,000 μg/L (52 mg/L) in shallow groundwater (≈3 meters) was
measured below an inactive detinning plant near Tampa, Florida (Agency for Toxic Substances and
Disease Registry 1998). Cyanide concentrations were found to range from 0.005 to 14.0 mg/L in the
leachates from 14 of 43 U.S. landfills with industrial wastes; the "typical" cyanide concentration was
reported to be 0.008 mg/L (Venkataramani et al. 1984). Data from the Nationwide Urban Runoff
Program as of 1982 indicate that cyanide was found in urban runoff samples collected in 4 of 15 urban
areas across the United States: Denver, Colorado; Long Island, New York; Austin Texas; and Bellevue,
Washington. Overall, cyanide was detected in 16% of the urban runoff samples collected, at
concentrations ranging from 2 to 33 μg/L (Cole et al. 1984).
Cyanide concentrations in run-off obtained from an area that had been burned in a 2000 wildfire that
occurred in Tennessee and North Carolina near the Smokey Mountains National Park averaged 49 μg/L
(Barber et al. 2003). This is equal to the LC50 for cyanide in rainbow trout and is more than an order
magnitude greater than the cyanide concentration measured in run-off obtained from unburned areas
surrounding the wildfire site. Higher cyanide concentrations were reported in run-off from the Cerro
Grande fire that occurred near Los Alamos, New Mexico in 2000 with an average value of 80 μg/L.
Based on data obtained from the EPA STORET database, the mean cyanide concentration in 61% of
surface waters tested in the United States is ≤3.5 μg/L and 35 % of surface waters contained cyanide (as
CN–) at concentrations of 3.5–52 μg/L (EPA 1981e). The data also show that 37 of 50 states (74%) have
locales where cyanide concentrations in ambient water are >3.5 μg/L. Areas with levels >200 μg/L
include portions of southern California, North Dakota, South Dakota, Iowa, northwest Georgia, western
New York, and western Pennsylvania (EPA 1981e). It should be noted that these results are applicable
only to the period from the late 1970s to the early 1980s. Furthermore, the reliability of some of these
CYANIDE 180
6. POTENTIAL FOR HUMAN EXPOSURE
early STORET data may be questionable. Analyses of more recent STORET cyanide data could not be
found. Cyanide at a concentration >1 μg/L was detected in water from the Great Lakes (Great Lakes
Water Quality Board 1983). The concentration of cyanide in 104 samples collected during 1980 and
1981 at various points on the Ohio River and its tributaries was reported to range from <5 to 80 μg/L
(Ohio River Valley Sanitation Commission 1982). The highest concentration was detected in water from
Beaver Falls, Pennsylvania.
A survey of 969 water supply systems in the United States in 1970 found the concentration of cyanide to
be at or below 0.008 mg/L (EPA 1981e). In 1975, a survey of interstate water supply systems found that
in 21 of 297 analyses (7.1%), the concentration of cyanide exceeded the maximum concentration limit
(MCL) of 0.2 mg/L (EPA 1981e). In more recent data from the EPA taken from 1993–1998, only 0.2%
of public water systems using groundwater exceeded the MCL of 0.2 mg/L (EPA 1999). For public water
systems using surface water, there were no reported cyanide concentrations in excess of the MCL. In a
nationwide survey of Canadian water supplies, it was found that in 70 cities, the concentration of cyanide
was <0.001 mg/L, whereas water samples taken from two cities had a cyanide concentration of
0.011 mg/L (Meranger and Lo 1992).
Cyanides (reported as cyanide, hydrogen cyanide, sodium cyanide, potassium cyanide, calcium cyanide,
or copper(I) cyanide) have been detected in surface water samples at 243 of 464 hazardous waste sites
(HazDat 2005). Cyanide concentrations in 70 surface water (lake, streams, ponds, etc.) samples ranged
between 0.0012 and 120 mg/L with mean and median values of 2.67 and 0.0385 mg/L, respectively.
Cyanides have also been detected in groundwater samples at 120 of the 464 hazardous waste sites.
Cyanide concentrations in 19 groundwater samples taken from private and public wells ranged between
0.00002 and 300 mg/L with mean and median values of 16.0 and 0.0292 mg/L, respectively (HazDat
2005). Cyanides have also been identified in leachate samples at 43 of 406 hazardous waste sites at
concentrations ranging from 0.0017 to 400 mg/L (HazDat 1996). The HazDat information used includes
data from both NPL and other Superfund sites.
Cyanogen chloride is formed in drinking water from the reaction of humic substances with chloramine
used during chlorination (Jacangelo et al. 1989; Ohya and Kanno 1987). In a mid-1970s EPA survey,
cyanogen chloride was detected in drinking water from 8 of 10 U.S. cities (Fielding and Packham 1977).
No information could be found in the available literature on the release of cyanogen to water. No
information was found on detections of cyanogen or cyanogen chloride in surface water or groundwater at
any NPL or other Superfund hazardous waste sites (HazDat 2005).
CYANIDE 181
6. POTENTIAL FOR HUMAN EXPOSURE
Cyanogen chloride is formed in drinking water due to reaction of humic substances with chloramine
formed during chlorination (Ohya and Kanno 1987). It has been reported that the concentration of
cyanogen chloride in drinking water is most influenced by the final disinfectant. The use of chloramine
as a final disinfectant produces levels of cyanogen chloride that are 4–15 times higher than levels
produced when chlorine is used (Jacangelo et al. 1989; Krasner et al. 1989). Cyanogen chloride was
qualitatively detected during a 1975 survey of Cincinnati, Ohio drinking water (Kopfler et al. 1977). A
10-city survey that was conducted as part of the 1974 EPA National Organics Reconnaissance Survey
revealed that cyanogen chloride was present in 8 of 10 drinking water supplies analyzed (no quantitative
concentration values given) (Bedding et al. 1982). In a 1988 survey of 35 water utilities, the quarterly
median cyanogen chloride concentrations in drinking water ranged from 0.45 to 0.80 μg/L (Krasner et al.
1989).
No information could be found in the available literature on the levels of thiocyanate in ground, surface,
or drinking water. Thiocyanate is found in concentrations ranging from 100 to 1,500 mg/L in coal plant
waste waters (Ganczarczyk 1979; Jensen and Tuan 1993), and from 300 to 450 mg/L in mining (gold
extraction) waste waters (Boucabeille et al. 1994b).
6.4.3 Sediment and Soil
Limited information was found in the available literature on concentrations of cyanides in soil or
sediments at several hazardous waste sites; however, no information could be found for cyanogen or
cyanogen chloride. Maximum total cyanide concentrations in soil, subsoil, and sediments at an inactive
detinning plant located near Tampa, Florida, were measured at 1.5, 19, and 0.87 μg/L, respectively
(Agency for Toxic Substances and Disease Registry 1998). At the Greenwood Chemical Site in
Albemarle, Virginia, a maximum concentration of total cyanides of 2,870 mg/kg soil was measured in
1989 along with a maximum concentration of 84.0 mg/kg in sediments obtained from abandoned waste
lagoons (Agency for Toxic Substances and Disease Registry 1999a). The maximum total cyanide
concentrations in soil samples taken from the Byron Salvage Yard NPL site and neighboring Dirk Farm
waste disposal site were measured at 133 ppm and between 1 and 835 ppm, respectively (Agency for
Toxic Substances and Disease Registry 1999b). In general, though, the highly volatile gases hydrogen
cyanide, cyanogen, and cyanogen chloride (see Table 4-2) would not be expected to be present in
sediment or soil in any appreciable amounts. Also, degradation by microorganisms in soil can convert
CYANIDE 182
6. POTENTIAL FOR HUMAN EXPOSURE
cyanide to carbon dioxide, ammonia, and other nitrogen compounds that will rapidly volatilize from soils
(CEPA 1997).
Cyanides (reported as cyanide, hydrogen cyanide, sodium cyanide, potassium cyanide, calcium cyanide,
or copper(I) cyanide) have been detected at 225 of 464 hazardous waste sites (HazDat 2005). Cyanide
concentrations in 60 topsoil (<3 inches depth) samples ranged between 0.0022 and 18,000 mg/kg, with
mean and median values of 1,017 and 4.02 mg/kg, respectively. Cyanide concentrations in 91 subsurface
soil (>3 inches depth) samples ranged between 0.00024 to 32,300 mg/kg, with mean and median values of
813 and 15.4 mg/kg, respectively. Cyanides were also detected at 118 of 464 hazardous waste sites where
cyanides have been detected in some environmental medium (HazDat 2005). Cyanide concentrations in
40 sediment samples (lakes, streams, ponds, etc.) ranged between 0.00006 and 30,700 mg/kg, with mean
and median values of 777 and 1.15 mg/kg, respectively. The HazDat information used includes data from
both NPL and other Superfund sites.
Cyanogen has been detected in soil samples taken from one hazardous waste site at a concentration of
0.063 ppm (HazDat 2005). Measurements of cyanogen chloride in soil samples at two hazardous waste
sites have been conducted; however, concentrations of cyanogens chloride were not reported (HazDat
2005). The HazDat information used includes data from both NPL and other Superfund sites. No other
information could be found in the available literature on the concentration of cyanogen or cyanogen
chloride in soil.
Monitoring data on thiocyanate concentrations in soils are scarce. Concentrations of thiocyanate in soils
amended with defatted seed meal of Brassica napus L. (rapeseed) were reported to be on the order of
6 μg/g (Brown et al. 1991). Thiocyanate has been detected in soil samples collected at three of
eight hazardous waste sites, and in sediment samples at three of eight hazardous waste sites where
thiocyanate has been detected in some medium (HazDat 2005). The HazDat information used includes
data from both NPL and other Superfund sites. No information could be found in the available literature
on thiocyanate concentrations in sediments.
6.4.4 Other Environmental Media
The primary cyanide source in food is cyanogenic glycosides. Plants containing cyanogenic glycosides
can produce hydrogen cyanide by acid hydrolysis or by the action of the enzyme β-glucosidase (EPA
1980a, 1981e; Jones 1998; Seigler 1991). Hydrogen cyanide release can occur either during maceration,
CYANIDE 183
6. POTENTIAL FOR HUMAN EXPOSURE
which activates the intracellular β-glucosidase, or in the gut by the action of β-glucosidase produced by
microflora. The level of activity of β-glucosidase in the gut depends on the bacterial composition and the
pH level (WHO 1992, 2004). There are approximately 60 known cyanogenic glycosides, which differ in
their bioavailability (Seigler 1991). For example, cyanide production from the ingestion of seeds
containing prunasin does not occur unless the seeds have been crushed. The potential toxicity of
cyanogenic plants depends on their ability to release hydrogen cyanide during preparation or digestion at
concentrations high enough to be of concern for human health (WHO 1992, 2004).
Over 2,650 plant species can produce hydrogen cyanide (Seigler 1991; Swain et al. 1992). These include
edible plants such as almonds, pits from stone fruits (e.g., apricots, peaches, plums, cherries), sorghum,
cassava, soybeans, spinach, lima beans, sweet potatoes, maize, millet, sugarcane, and bamboo shoots
(EPA 1981e). The cyanogenic glycoside content of a foodstuff is usually expressed as the amount of
cyanide released by acid hydrolysis; glycoside concentrations are rarely reported (WHO 1992).
Cyanide levels measured in some foods are as follows: cereal grains and their products, 0.001–0.45 μg/g;
soy protein products, 0.07–0.3 μg/g; and lima beans, 0.1–3 mg/g (EPA 1978c; Honig et al. 1983). The
cyanide equivalent of total cyanogenic content (i.e., cyanogenic glycosides, cyanohydrins, and hydrogen
cyanide) of cassava root has been reported to range from 91 to 1,515 mg/kg hydrogen cyanide (86–
1,458 μg/g CN–) dry weight (d/w) (O'Brien et al. 1992). Cassava is the major starchy food for more than
300 million people in many tropical countries of the world, and many cultivars are toxic (Seigler 1991).
Effective processing can reduce the amount of total cyanogen in fresh cassava roots to significantly lower
levels in foods ready for consumption (Mlingi et al. 1993; O'Brien et al. 1992). For example, the mean
cyanide content in garri (a flour product of grated, pressed, and fermented cassava root pulp) from a city
market in Nigeria ranged from 10.6 to 22.1 μg/g dry weight (d/w) (Ukhun and Dibie 1989). A somewhat
wider distribution of results was obtained in another recent evaluation of commercial garri from three
main garri-producing Nigerian communities (Aletor 1993). The mean total cyanide content (glucosidic
plus non-glucosidic) of 38.8% of all samples (n=108) ranged from 0 to 10 mg/kg hydrogen cyanide (0–
9.6 μg/g CN–), whereas 40.7, 12.9, and 7.4% of the samples had mean total cyanide contents of 10–20,
20–30, and 30–40 mg/kg hydrogen cyanide (9.6–19, 19–29, and 29–39 μg/g CN–), respectively. The
mean cyanide content of domestic samples of “sweet” to “bitter” cassava food products in Cameroon was
reported to range from 18.6 to 94.9 mg/kg hydrogen cyanide (17.9–91.4 μg/g CN–) d/w for a dried
cassava flour, and from 0.0 to 0.9 mg/kg hydrogen cyanide (0.0–0.9 μg/g CN–) d/w for a cassava paste
(O'Brien et al. 1992). Improper processing of cassava roots may result in maintenance of cyanogenic
content of cassava food products at levels that are toxic (Mlingi et al. 1992, 1993; O'Brien et al. 1992).
CYANIDE 184
6. POTENTIAL FOR HUMAN EXPOSURE
Cassava is a starch staple, but it is low in protein (Gomez et al. 1988). Low protein intake results in a
decrease in available sulfur for conversion of cyanide to thiocyanate (Mlingi et al. 1993; Tylleskar et al.
1992). Hydrogen cyanide concentrations in sorghum leaves have been reported to range from
approximately 200 to 1,300 ppm (192–1,250 μg/g CN–) wet weight (w/w), with higher concentrations
observed in early growth stages and at lower levels of phosphorus fertilization (Chand et al. 1992).
In apricot pits, the cyanide concentration may vary from 8.9 to 217 mg/100 g (89–2,170 μg/g) w/w,
depending on the type of cultivar, season, and geographic area (Lasch and El Shawa 1981). Swain et al.
(1992) reported a mean cyanide concentration in black cherry (Prunus serotina Ehrh.) fruits somewhat
greater than 3 μmol/seed at maturity, which is equivalent to a mean cyanide content of 78 μg/seed;
insufficient information was provided to allow conversion of these results to weight per weight (w:w)
units. In a recent laboratory study, Voldrich and Kyzlink (1992) reported cyanide concentrations in
canned unpitted fruits (peaches, apricots, plums, and cherries) ranging from 0 to 4 mg/kg (μg/g) w/w,
depending on the glycoside content of the raw fruits and the conditions of heat processing. These authors
noted that the observed cyanide levels were not negligible relative to an allowable daily intake (ADI)
value for cyanide of 0.05 mg/kg body weight. An adult (70 kg body weight) could consume
approximately 1 kg of canned fruits with a cyanide content of 4 mg/kg without exceeding this ADI value;
however, a safe portion for a child (15 kg body weight) would be only about 180 grams (12 mg/kg). The
analysis of 233 samples of commercially available and homemade stone-fruit juices showed that pitted
fruit juices had lower cyanide concentrations than unpitted or partially pitted fruit juices, indicating that
the pits are the primary sources of cyanides in these juices (Stadelmann 1976). For example, the
hydrogen cyanide content of a home-made mixed cherry juice from pitted fruits was 5.3 mg/L, compared
to 23.5 mg/L in a cherry juice containing 100% crushed pits. This study also reported the following
levels (median concentrations in mg/L) of hydrogen cyanide in commercial fruit juices: cherry, 4.6;
apricot, 2.2; prune, 1.9; and peach, 2.9. Stadelmann (1976) recommended that the maximum hydrogen
cyanide content allowed in fruit juices should be set at a level of 5 mg/L.
Cyanide can also be present in foodstuffs as residues from cyanide fumigation (EPA 1981e). Human
exposure to naturally occurring cyanide in foods in the United States is expected to be low compared to
certain populations in the Third World that subsist on cassava and similar crops (EPA 1981e).
Edible plants such as kale, cabbage, radishes, broccoli, brussels sprouts, cauliflower, collards, mustard
greens, turnips, and kohlrabi contain glucosinolates, are hydrolysed by the endogenous enzyme
myrosinase to produce toxic products, including thiocyanate (Abukutsa et al. 1993; Bible and Chong
CYANIDE 185
6. POTENTIAL FOR HUMAN EXPOSURE
1975; Bible et al. 1980; Carlson et al. 1985, 1987; Olea and Parras 1992; Olea-Serano et al. 1988).
Vegetables from the Brassica family (e.g., cabbages, kohlrabi, kale) contain high levels of thiocyanate
ranging from 5 to 660 μg/g w/w (Weuffen et al. 1984). Kale leaves have been reported to contain
concentrations of potassium thiocyanate at harvest ranging from 447 to 5,067 ppm (μg/g) d/w (equivalent
to thiocyanate concentrations of 267–3,035 μg/g d/w) depending on the fertilizer nitrogen source
(Abukutsa et al. 1993). Other commonly consumed vegetables (e.g., lettuce, spinach, radishes) have been
found to contain thiocyanate at concentrations ranging from approximately 0.1–5.0 μg/g w/w, with
concentrations usually <2.0 μg/g w/w (Weuffen et al. 1984). Milk and other dairy products have been
reported to contain thiocyanate at concentrations ranging from <1 to 9.0 μg/g, whereas concentrations in
meat products have been reported to range from only 0.5 to 0.7 μg/g (Weuffen et al. 1984).
Laetrile (amygdalin), a drug formerly used in clinical trials for the treatment of cancer (Khandekar and
Edelman 1979); sodium nitroprusside, a drug used to reduce high blood pressure (Aitken et al. 1977;
Vesey et al. 1976); and a series of commercially important, simple, aliphatic nitriles (e.g., acetonitrile,
propionitrile, acrylonitrile, n-butyronitrile, maleonitrile, succinonitrile) (Willhite and Smith 1981) release
cyanide upon metabolism. These drugs and industrial chemicals have been associated with human
exposure to cyanide and have caused serious poisoning and, in some cases, death.
Reported levels of cyanide in tobacco smoke are quite variable. Cyanide levels in mainstream (inhaled)
smoke from U.S. commercial cigarettes have been reported to range from 10 to 400 μg per cigarette, with
the ratio of cyanide concentration in sidestream smoke to mainstream smoke ranging from 0.006 to
0.27 per cigarette (Chepiga et al. 2000; EPA 1981e). In studies that have included non-U.S. commercial
cigarettes, hydrogen cyanide concentrations in mainstream and sidestream smoke ranging from 280 to
550 μg/cigarette and from 53 to 111 μg/cigarette, respectively, have been reported; sidestream/
mainstream ratios of hydrogen cyanide concentrations ranged from 0.06 to 0.50 (Baker and Proctor 1990;
Guerin et al. 1987).
Cyanides have been detected in automobile exhaust. The average emission rate was 11–14 mg/mile for
cars not equipped with catalytic converters and 1 mg/mile for cars with catalytic converters operating
under optimum conditions. Cars with malfunctioning catalytic converters may emit as much or more
hydrogen cyanide than cars without such equipment (EPA 1981e).
CYANIDE 186
6. POTENTIAL FOR HUMAN EXPOSURE
6.5 GENERAL POPULATION AND OCCUPATIONAL EXPOSURE
The general population may be exposed to cyanide from inhaling air and ingesting food and drinking
water contaminated with it. Since most of the cyanide in the air will be present as hydrogen cyanide (see
Section 6.3.2.1), the primary inhalation exposure to cyanide will occur from hydrogen cyanide. The
concentration of hydrogen cyanide in the air of non-urban areas is ≈160–166 ppt (see Section 6.4.1).
Based on an atmospheric hydrogen cyanide concentration of 170 ppt (0.191 mg/m3) and an average daily
inhalation volume of 20 m3, the inhalation exposure of the general U.S. non-urban, nonsmoking
population to hydrogen cyanide is estimated to be 3.8 μg/day. In drinking water, cyanide may be present
as cyanogen chloride (see Section 6.4.2). In 1988, the quarterly median cyanogen chloride concentration
in drinking water from 35 U.S. water utilities ranged from 0.45 to 0.8 μg/L (0.19–0.3 μg/L cyanide)
(Krasner et al. 1989). Based on a daily drinking water consumption of 2 L for a 70-kg adult, the daily
intake of cyanogen chloride is estimated to be 0.9–1.6 μg, which is equivalent to 0.4–0.7 μg of hydrogen
cyanide. The concentration of cyanide in drinking water in the United States in 1970 was <0.008 mg/L
(EPA 1981e). In more recent data obtained from water supply systems in Canada, the concentration of
cyanide was below 0.001 mg/L in 70 cities with two cities reporting concentrations of 0.011 mg/L
(Meranger and Lo 1992). Using the range of cyanide concentrations given in the Canadian study (0.001–
0.011 mg/L) as representative of the general population in the United States and assuming a daily water
consumption of 2 L for a 70-kg adult, the daily intake of cyanide is estimated to be 0.002–0.22 mg. EPA
has established an MCL of 0.2 mg/L for cyanide in drinking water (see Chapter 8), which is equivalent to
a daily intake of 0.4 mg, based on a daily drinking water consumption rate of 2 L for a 70-kg adult (EPA
1991a). Estimates of the cyanide concentration in the total diet of a U.S. adult were not located in the
available literature. Therefore, no estimate of daily cyanide intake from food can be made. In the United
States, human exposure to cyanide from foods in which it occurs naturally is expected to be low, but is
likely to exceed cyanide intake from inhalation of air and ingestion of drinking water (CEPA 1997; EPA
1981e). The EPA has established tolerances for hydrogen cyanide in various foods ranging from 25 to
250 ppm (EPA 1975b) and from 5 to 25 ppm (see Chapter 8). Poitrast et al. (1988) have estimated an
overall allowable daily intake of 0.6 mg for cyanide, incorporating an uncertainty factor of 100–1,000 to
ensure that the potential for an infant receiving a toxic dose of cyanide from breast milk is quite low.
The dietary cyanide intake of Tukanoan Indians in northwest Amazonia who rely heavily on high (>70%
of all foods) cyanide-containing varieties of cassava was estimated to be >20 mg/day (Dufour 1988). Yet,
Dufour (1988) did not find physical disorders in Tukanoan Indians attributable to high cassava diets, in
contrast to observations related to cassava-consuming populations in Africa. One reason that has been
CYANIDE 187
6. POTENTIAL FOR HUMAN EXPOSURE
suggested is that the cassava processing techniques of the Tukanoans are very sophisticated and very
effective in reducing the cyanide concentration in the crop. Indeed, it has been shown in several studies
of cassava processing techniques used in Africa that the level of hydrogen cyanide can be effectively and
reliably reduced by allowing sufficient time for the hydrolysis of cyanogenic glucosides and evaporation
of hydrogen cyanide (Ojo and Dean 2002; Onabolu et al. 2002). Another reason that may account for the
observed differences in toxicity among different populations is that the variety of cassava may differ
between geographical areas (Rosling 1988). When outbreaks of acute cyanide intoxications do occur in
African populations that have been found to result from incomplete processing of cassava, resulting in
highly elevated cyanide levels in combination with chronic dietary protein malnutrition (WHO 2004b).
This occurred when, due to a food shortage, the lengthy sun drying normally used to remove cyanogenic
glucosides was replaced by repeated pounding and drying to obtain flour for consumption in 1 day
(Mlingi et al. 1992, 1993; Tylleskar et al. 1992).
The primary route of exposure to thiocyanates for the general population appears to be from ingestion of
foods in which thiocyanate occurs naturally (e.g., cabbage, kale, spinach, kohlrabi). Estimates of the
thiocyanate concentration in the total diet of an adult in the United States were not located in the available
literature; however, these would be expected to be quite low. Exposure to cyanide also is a source of
thiocyanate exposure because thiocyanate is a major metabolite of cyanide in the human body.
Occupational exposures to cyanide are expected to occur primarily through inhalation and, less
frequently, through skin absorption. Preliminary data from the NOES conducted by NIOSH from 1980 to
1983 estimated that the number of workers potentially exposed to cyanide compounds in the United
States in 1981–1983 are as follows (NIOSH 1989a): cyanide, 367; hydrogen cyanide, 4,005; sodium
cyanide, 66,493; potassium cyanide, 64,244; potassium silver cyanide, 3,215; calcium cyanide, 3,606;
copper (I) cyanide, 22,339; ammonium thiocyanate, 90,599; and cyanogen chloride, 1,393. Thiocyanate
and cyanogen were not included in the NOES (NIOSH 1989a). These numbers do not include workers
potentially exposed to trade-name compounds that contain cyanides or thiocyanates. Workers in various
occupations may be exposed to cyanide compounds. People possibly exposed to cyanide include workers
involved in electroplating, metallurgy, cyanotype printing, pesticide application, firefighting, steel
manufacturing, and gas works operations; workers involved in the manufacture of cyanides, adiponitrile
and other simple, aliphatic nitriles, methyl methacrylate, cyanuric acid, dyes, pharmaceuticals, or
chelating agents; and people who work in tanneries, blacksmithing, metal cleaning, and photoengraving
or photography industries (EPA 1981e; Lucas 1992; WHO 2004b; Willhite and Smith 1981). Workers in
the oil shale retorting industry may be exposed to cyanide because the offgas from the retorting process
CYANIDE 188
6. POTENTIAL FOR HUMAN EXPOSURE
contains hydrogen cyanide (see Section 6.2.1). There is a reported case of the fatal poisoning of three
trawler crew members as they entered a refrigerated compartment containing spoiled fish in which
cyanide, in addition to methane and hydrogen sulfide, have been implicated in their deaths (Cherian and
Richmond 2000). Medical and emergency personnel (e.g., police and firefighters) who may be involved
in resuscitation efforts or removal of gastric contents of postmortem victims of cyanide poisoning are
potentially exposed to higher levels of cyanide (Andrews et al. 1989; Bolstad-Johnson et al. 2000; Nolte
and Dasgupta 1996). Workers involved in large-scale processing of cassava have been shown to have
thiocyanate levels in urine that are 2.2–2.6 times the levels found in individuals who regularly consume
cassava products (Okafor et al. 2002). The increased thiocyanate levels in cassava processors are due to
inhalation of hydrogen cyanide that is discharged to air during the processing of cassava. The
manufacture of industrial inorganic chemicals may be a significant potential source of occupational
exposure to cyanogen chloride (NIOSH 1989a). Potential sources of occupational exposure to
ammonium thiocyanate include the manufacture of electronic computing equipment, research and
development laboratories, newspaper and other commercial printing, general medical and surgical
hospitals, production of adhesives and sealants, and the construction and furniture industries (NIOSH
1989a).
In a survey of the plating facility of a national airline conducted by NIOSH in December 1981, the
concentrations of hydrogen cyanide in three work areas ranged from 0.001 to 0.004 mg/m3 (0.0009–
0.004 ppm) (NIOSH 1982). The cyanide concentrations in four work areas in a plating facility of an
electrical and electronic company in Waynesboro, Virginia, ranged from 0.07 mg/m3 (0.07 ppm hydrogen
cyanide) in a salt pot room to 4.3 mg/m3 (4.0 ppm hydrogen cyanide) beside a stripping tank (NIOSH
1976). Similarly, the concentration of cyanide in the breathing zone air of workers in a plating facility in
Galion, Ohio, was 1.7 mg/m3 (1.6 ppm hydrogen cyanide) (NIOSH 1978). In a NIOSH survey of a
university art department foundry, hydrogen cyanide was detected in the smoke produced during pouring
and knockout of castings at a concentration of approximately 4 ppm; hydrogen cyanide was not detected
in personal breathing zone samples taken during knockout of castings (Lucas and Salisbury 1992). These
levels are all below the NIOSH recommended ceiling limit of 4.7 ppm (NIOSH 1992).
Levels of cyanide and its metabolite thiocyanate in blood serum and plasma, urine, and saliva have been
used as indicators of cyanide exposure in humans, particularly in workers at risk of occupational
exposures, in smokers or nonsmokers exposed to sidestream or environmental tobacco smoke, in
populations exposed to high dietary levels of cyanide, and in other populations with potentially high
exposures (see Section 6.7). The correlation between increased cyanide exposure and urinary thiocyanate
CYANIDE 189
6. POTENTIAL FOR HUMAN EXPOSURE
levels was demonstrated in workers exposed to 6.4–10.3 ppm cyanide in air (El Ghawabi et al. 1975). In
another study, blood cyanide concentrations were found to vary from 0.54 to 28.4 μg/100 mL in workers
exposed to approximately 0.2–0.8 ppm cyanide in air, and from 0.0 to 14.0 μg/100 mL in control workers
(Chandra et al. 1988). Similar elevations in urinary thiocyanate levels were observed, with concentrations
for exposed workers and controls ranging from 0.05 to 2.80 and from 0.02 to 0.88 mg/mL, respectively.
A study of tissue distributions of cyanide in five victims of acute cyanide poisoning found that cyanide
concentrations are highest in blood (Zhang et al. 2005). Blood had the highest concentration of cyanide
in all the victims, ranging between 0.65 and 30.6 μg/mL. Normalizing cyanide concentrations in liver,
kidney, brain, and urine samples to cyanide concentrations in blood, it was found that liver had the next
highest concentrations of cyanide, with S/B ratios ranging from 0.24 to 0.35.
The results of several studies that have shown elevated cyanide or thiocyanate concentrations in body
fluids of smokers are summarized in Table 6-4. In general, these results indicate that serum cyanide
levels (Cardeal et al. 1993; Symington et al. 1987; Tsuge et al. 2000) and plasma, serum, and saliva
thiocyanate levels (Banerjee and Muthu 1994; Jarvis 1989; Maliszewski and Bass 1955; Pre and Vassy
1992, 1993; Tsuge et al. 2000; Waage et al. 1992; Yamanaka et al. 1991) could distinguish smokers from
nonsmokers and/or light smokers. Pre and Vassy (1992) found that plasma thiocyanate was an indicator
of smoking status that was not sensitive to light or passive smoking. However, inhaling smokers were
easily distinguished from noninhaling smokers. The authors concluded that a plasma thiocyanate
concentration below 20 μmol/L (1,200 μg/L) indicated that passive smoking was very unlikely, whereas
concentrations above 80–85 μmol/L (4,600–4,900 μg/L) were a reliable indication of an active inhalation
of smoke. Yamanaka et al. (1991) found a correlation between the number of cigarettes smoked per day
and the thiocyanate levels in plasma and saliva; however, in apparent contrast to results obtained by
Maliszewski and Bass (1955), thiocyanate concentrations in urine of smokers and nonsmokers were not
found to be significantly different.
Data on elevated levels of thiocyanate in body fluids resulting from consumption of cyanide-containing
foods come primarily from populations in tropical regions that may consume large quantities of
improperly processed cyanogenic plants such as cassava (WHO 2004b). Among four populations in
Africa known to be exposed to high levels of dietary cyanide because of incomplete processing of cassava
during drought periods, urinary thiocyanate concentrations (mean±SE) ranged from 350±39 to
1,120±75 μmol/L (20±2–65±4 mg/L), compared to urinary thiocyanate levels in the normal population of
<100 μmol/L (5.8 μg/L) (Mlingi et al. 1992, 1993; Tylleskar et al. 1992). The mean plasma thiocyanate
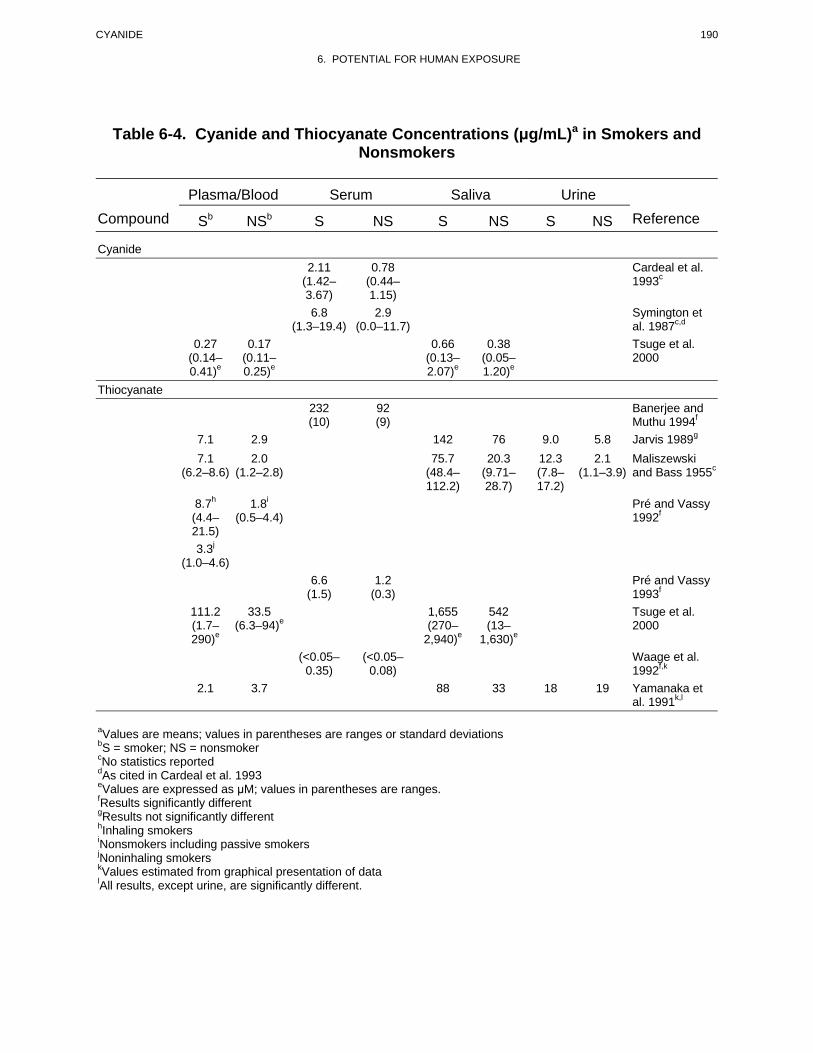
CYANIDE 190
6. POTENTIAL FOR HUMAN EXPOSURE
Table 6-4. Cyanide and Thiocyanate Concentrations (μg/mL)a in Smokers and Nonsmokers
Plasma/Blood Serum Saliva Urine Compound Sb NSb S NS S NS S NS Reference
Cyanide 2.11 0.78 Cardeal et al.
(1.42– (0.44– 1993c
3.67) 1.15) 6.8
(1.3–19.4) 2.9
(0.0–11.7) Symington et al. 1987c,d
0.27 0.17 0.66 0.38 Tsuge et al. (0.14– 0.41)e
(0.11– 0.25)e
(0.13– 2.07)e
(0.05– 1.20)e
2000
Thiocyanate 232 (10)
92 (9)
Banerjee and Muthu 1994f
7.1 2.9 142 76 9.0 5.8 Jarvis 1989g
7.1 2.0 75.7 20.3 12.3 2.1 Maliszewski (6.2–8.6) (1.2–2.8) (48.4– (9.71– (7.8– (1.1–3.9) and Bass 1955c
112.2) 28.7) 17.2) 8.7h
(4.4– 1.8i
(0.5–4.4) Pré and Vassy 1992f
21.5) 3.3j
(1.0–4.6) 6.6
(1.5) 1.2
(0.3) Pré and Vassy 1993f
111.2 (1.7– 290)e
33.5 (6.3–94)e
1,655 (270–
2,940)e
542 (13–
1,630)e
Tsuge et al. 2000
(<0.05– 0.35)
(<0.05– 0.08)
Waage et al. 1992f,k
2.1 3.7 88 33 18 19 Yamanaka et al. 1991k,l
aValues are means; values in parentheses are ranges or standard deviations bS = smoker; NS = nonsmoker cNo statistics reporteddAs cited in Cardeal et al. 1993 eValues are expressed as μM; values in parentheses are ranges. fResults significantly differentgResults not significantly different hInhaling smokers iNonsmokers including passive smokers jNoninhaling smokers kValues estimated from graphical presentation of data lAll results, except urine, are significantly different.
CYANIDE 191
6. POTENTIAL FOR HUMAN EXPOSURE
concentration in one of these populations was 335±12 μmol/L (19±1 μg/L), compared to 28±4 μmol/L
(1.6±0.2 μg/L) in a control population (Mlingi et al. 1992). Elevated mean serum thiocyanate
concentrations (11±3 μg/L compared to reference values of 0.5–4 μg/L) were observed in only one of two
populations in which this biomarker was measured (Tylleskar et al. 1992, 1994). There was no apparent
explanation for this difference.
High serum thiocyanate concentrations (>180 μmol/L) have been found in Tukanoan Indians on
traditional diets. However, the levels of residual cyanide appear to be tolerated well (Dufour 1988).
6.6 EXPOSURES OF CHILDREN
This section focuses on exposures from conception to maturity at 18 years in humans. Differences from
adults in susceptibility to hazardous substances are discussed in Section 3.7, Children’s Susceptibility.
Children are not small adults. A child’s exposure may differ from an adult’s exposure in many ways.
Children drink more fluids, eat more food, breathe more air per kilogram of body weight, and have a
larger skin surface in proportion to their body volume. A child’s diet often differs from that of adults.
The developing human’s source of nutrition changes with age: from placental nourishment to breast milk
or formula to the diet of older children who eat more of certain types of foods than adults. A child’s
behavior and lifestyle also influence exposure. Children crawl on the floor, put things in their mouths,
sometimes eat inappropriate things (such as dirt or paint chips), and spend more time outdoors. Children
also are closer to the ground, and they do not use the judgment of adults to avoid hazards (NRC 1993).
Information on exposures of cyanide to children living in the United States is mainly limited to studies on
side-stream smoke. These studies show that this is an important route of exposure to cyanide for children
in households with a resident smoker. Chen et al. (1990) found that serum thiocyanate concentrations of
18-month-old infants heavily exposed to environmental tobacco smoke (>20 cigarettes a day smoked in
the home) were significantly higher than those of unexposed infants (p<0.05). Mean concentrations
(±standard deviation [SD]) in these respective groups were 36.2±14.88 μmol/L (2.1±0.9 μg/mL) and
27.7±10.7 μmol/L (1.6±0.6 μg/mL). Positive correlations between fetal umbilical serum thiocyanate
levels and serum thiocyanate levels of smoking mothers (Bottoms et al. 1982; Hauth et al. 1984) and
mothers exposed to environmental tobacco smoke in the home (Bottoms et al. 1982) have been reported.
Hauth et al. (1984) found that the mean serum thiocyanate concentration (95 μmol/L; 5.5 μg/mL) was
significantly higher (p<0.001) in smokers than in passive smokers (35.9 μmol/L; 2.1 μg/mL) or
CYANIDE 192
6. POTENTIAL FOR HUMAN EXPOSURE
nonsmokers (32.3 μmol/L; 1.9 μg/mL). Similarly, the mean umbilical thiocyanate concentration in the
newborn infants of smoking mothers (72 μmol/L; 4.8 μg/mL) was significantly higher than those in
newborn infants of passive smokers (26 μmol/L; 1.5 μg/mL) and nonsmokers (23 μmol/L; 1.3 μg/mL). In
contrast, Bottoms et al. (1982) found that among newborn infants of nonsmoking mothers, fetal umbilical
thiocyanate concentrations increased with passive smoking in the home (p<0.05).
For children without exposures to side-steam smoke, their main cyanide exposures are expected to be
similar to those noted for the general population in Section 6.5 in air and water. Estimates of the cyanide
concentration in the total diet of children in the United States were not located in the available literature.
Therefore, no estimate of daily cyanide intake from food can be made. However, in the United States,
exposure of children to cyanide from foods in which it occurs naturally is expected to be low, but, as
noted for Section 6.5 for the general population, it is likely to exceed cyanide intake from inhalation of air
and ingestion of drinking water (EPA 1981e). Based on a concentration of cyanide in U.S. and Canadian
drinking water of 0.001–0.011 mg/L, the daily intake of cyanide in children is estimated to be 0.001–
0.011 mg, assuming a daily consumption of 1 L of water (EPA 1981e; Meranger and Lo 1992). For
cyanide as cyanogen chloride, the daily intake is estimated to be 0.5–0.8 μg, which is equivalent to 0.2–
0.4 μg of hydrogen cyanide. This estimate is based on the quarterly median cyanogen chloride
concentration in drinking water from 35 U.S. water utilities ranged from 0.45 to 0.8 μg/L (0.19–0.3 μg/L
cyanide) (Krasner et al. 1989) and the daily consumption of 1 L of drinking water.
Accidental cyanide poisonings in children are rare and are usually associated with exposures to
combustion products in smoke (Riordan et al. 2002). Poisonings have been reported for ingestion of
apricot kernels or seeds or candy made from apricot kernels. Because of their lower body weight,
children tend to be more susceptible to consumption of apricot kernels than adults, with 10 or more seeds
being fatal to a child (WHO 2004b).
6.7 POPULATIONS WITH POTENTIALLY HIGH EXPOSURES
Among the general population, subpopulations with the most likely potential for exposure to cyanide and
thiocyanate include active and passive smokers (EPA 1981e) and people who are exposed to house or
other building fires (Andrews et al. 1989; Ballantyne 1987a; Bolstad-Johnson et al. 2000). Other
subpopulations with potentially high cyanide or thiocyanate exposures are residents who live near
industrial sites releasing cyanides or thiocyanates into the environment, residents who live near cyanide-
or thiocyanate-containing hazardous waste sites, and people who consume foods high in cyanogenic
CYANIDE 193
6. POTENTIAL FOR HUMAN EXPOSURE
glycosides. The fetuses of pregnant women who smoke or who are exposed to high levels of
environmental smoke (i.e., passive smokers) may be subjected to potentially high exposures of cyanide
and thiocyanate (Bottoms et al. 1982; EPA 1992f; Hauth et al. 1984). Workers involved in electroplating,
metallurgy, pesticide application, firefighting, gas works operations, tanning, blacksmithing, metal
cleaning, photoengraving, photography, cyanotype printing, the manufacture of steel, cyanides,
adiponitrile and other nitriles, methyl methacrylate, cyanuric acid, dyes, pharmaceuticals, or chelating
agents have the potential to be occupationally exposed to higher concentrations of cyanide than the
general population (EPA 1981e; NIOSH 1989a). Workers in the following industries may also be
exposed to higher concentrations of thiocyanate than the general population: manufacture of electronic
computing equipment, research and development laboratories, newspaper and other commercial printing,
general medical or surgical hospitals, production of adhesives and sealants, pesticide application, building
and furniture construction, and handling, treatment, or disposal of thiocyanate-containing wastes from
industrial processes (Brown and Morra 1993; NIOSH 1989a; WHO 2004b). Two additional groups of
people who may be at greater risk for cyanide exposure are those who are exposed to cyanide but are
unable to smell the chemical (EPA 1987a) and patients with motor neuron disease (see Section 3.10).
Data related to the levels of cyanide or thiocyanate exposure in several of these population groups have
been presented in Section 6.5. No data were found related to the levels of cyanide or thiocyanate
exposure in cassava eaters in the United States. Also, no data were located in the available literature
related to the levels of cyanide and thiocyanate exposure of people who live near industrial sites releasing
cyanides or thiocyanates to the environment, or near hazardous waste sites. Cyanides (reported as
cyanide, hydrogen cyanide, sodium cyanide, potassium cyanide, calcium cyanide, or copper (I) cyanide)
have been detected in air, surface and groundwater, and soil samples at NPL hazardous waste sites;
cyanogen and cyanogen chloride have been detected in soil samples at NPL hazardous waste sites; and
thiocyanates have been detected in surface and groundwater, and soil samples at NPL sites (see
Section 6.2) (HazDat 2005). There is a need for reliable data on the levels at which these substances are
found in various media at these sites in order to estimate potential exposures of people living near
hazardous waste sites.
6.8 ADEQUACY OF THE DATABASE
Section 104(i)(5) of CERCLA, as amended, directs the Administrator of ATSDR (in consultation with the
Administrator of EPA and agencies and programs of the Public Health Service) to assess whether
adequate information on the health effects of cyanide is available. Where adequate information is not
CYANIDE 194
6. POTENTIAL FOR HUMAN EXPOSURE
available, ATSDR, in conjunction with NTP, is required to assure the initiation of a program of research
designed to determine the health effects (and techniques for developing methods to determine such health
effects) of cyanide.
The following categories of possible data needs have been identified by a joint team of scientists from
ATSDR, NTP, and EPA. They are defined as substance-specific informational needs that if met would
reduce the uncertainties of human health assessment. This definition should not be interpreted to mean
that all data needs discussed in this section must be filled. In the future, the identified data needs will be
evaluated and prioritized, and a substance-specific research agenda will be proposed.
6.8.1 Identification of Data Needs
Physical and Chemical Properties. As reported in Section 4.2, most of the relevant physical and
chemical properties of cyanide compounds are known. Except for soil partition (Koc) coefficient, data for
the physical and chemical properties of hydrogen cyanide are available to estimate its environmental fate.
Additional data are needed to estimate the environmental fate of the other cyanides covered in this profile.
Although qualitative information is available, quantitative data are needed for the solubility of calcium
cyanide in water. Octanol/water partition coefficient (Kow) data are needed for cyanogen chloride.
Certain physical parameters, such as Kow and Koc, are not available nor are they useful for predicting the
environmental fate and transport of the ionic cyanide compounds. These partition coefficients are
generally used to assess the partitioning of neutral organic compounds between organic matter and water
and are not good at describing the varying ionic or complexation interactions of ionic compounds, such as
the simple and metal complexed cyanides and thiocyanate, with water, aquatic biota, soil, or sediments.
Production, Import/Export, Use, Release, and Disposal. According to the Emergency Planning
and Community Right-to-Know Act of 1986, 42 U.S.C. Section 11023, industries are required to submit
substance release and off-site transfer information to the EPA. The TRI, which contains this information
for 2003, became available in May of 2005. This database is updated yearly and should provide a list of
industrial production facilities and emissions.
Knowledge of a chemical's production volume is important because it may indicate the magnitude of
environmental contamination and human exposure. Data regarding the production, trend, use pattern, and
disposal of commercially significant cyanide compounds are available (CMR 2001; Curry 1992; Homan
1987; HSDB 2004; Sittig 1980; SRI 2005; TRI03 2005). It is known that the import and export of
CYANIDE 195
6. POTENTIAL FOR HUMAN EXPOSURE
hydrogen cyanide is insignificant compared to its production; however, except for potassium, sodium and
calcium cyanide salts, recent import and export data for other individual cyanide compounds are difficult
to obtain (USDOC 2004). There are some less recent data regarding the release of cyanides in air (EPA
1981e; TRI88 1990) but, except for hydrogen cyanide (TRI03 2005), more recent quantitative data
regarding the release of individual cyanide compounds in air, water, and particularly soil and sediment are
unavailable and would be useful for assessing current human exposures to cyanides.
Cyanide is naturally present in many foods high in cyanogenic glycosides (EPA 1978c, 1981e; Honig et
al. 1983; Jones 1998). No information was located in the available literature to indicate that cyanide
enters foods during processing or that elevated cyanide concentrations are present in any consumer
products. The two most likely sources of general population exposure to cyanide include people who
inhale cigarette smoke (EPA 1981e) or individuals who are exposed to a house or other type of building
fire (Andrews et al. 1989; Ballantyne 1987a; Bolstad-Johnson et al. 2000). There are EPA regulations
regarding the disposal of cyanide wastes or OSHA and NIOSH regulations regarding the levels of
hydrogen cyanide in workplaces (see Chapter 8). Data is available on chemical and biological processes
for degrading cyanide in leachate and waste water generated during the extraction of gold and other
precious metals from low grade ore (Akcil and Mudder 2003; EPA 1994c). Additional research is needed
on improved methods of pollution prevention and biodegradation to reduce or eliminate releases of
cyanide compounds to the environment from industrial processes.
Environmental Fate. The environmental fate of hydrogen cyanide gas in air is well studied
(Cicerone and Zellner 1983; Fritz et al. 1982); however, it would be useful if the role of particulate
cyanides (e.g., sodium cyanide, potassium cyanide) in determining the fate of total cyanides in the air was
known. Given that hydrogen cyanide occurs in the atmosphere from both natural and anthropogenic
processes (Cicerone and Zellner 1983; Crutzen and Andreae 1990; Crutzen and Carmichael 1993; EPA
1981e; Knowles 1988; Lobert and Warnatz 1993), it would be useful if an estimate were available for the
contribution of anthropogenic processes to the overall hydrogen cyanide burden in the atmosphere. It is
generally known that volatilization and biodegradation will be important processes for the loss of
cyanides in water (EPA 1978c, 1979; Ludzack et al. 1951; Raef et al. 1977a), but no experimental or
estimated values for the half-life of cyanides in ambient water are available. No comprehensive data
regarding the role of sorption in determining the fate of cyanides in water are available. It is generally
known that volatilization from soil surfaces and biodegradation play significant roles in the loss of
cyanides in soil (EPA 1978c), but no quantitative data regarding the half-life of cyanides in ambient soil
are available. Additional data on the relative importance of volatilization and biodegradation in
CYANIDE 196
6. POTENTIAL FOR HUMAN EXPOSURE
determining the fate of cyanides in soils are needed. The elucidation of the role of cyanide complexation
by metals in soil and sediment in controlling the fate of cyanide would be useful.
Both cyanogen and cyanogen chloride are highly volatile gases, indicating that volatilization would be the
major transport pathway for these compounds from surface water and soils. Cyanogen is reactive and
does not persist in the environment unchanged (EPA 1979). It also has been reported to react slowly with
water to yield hydrogen cyanide and cyanic acid, among other products (EPA 1979), and this hydrolysis
reaction may be a possible degradation pathway. Likewise, cyanogen chloride has also been shown
undergo slow hydrolysis at neutral pH to form cyanic acid and hydrogen chloride (U.S. Army 1989).
Additional information on the environmental fate of cyanogen and cyanogen chloride is needed.
There is almost no available information on the environmental transport and partitioning of thiocyanate in
the environment. At ambient temperatures, it appears that sorption and volatilization are not significant
partitioning processes for thiocyanate in soil, with thiocyanate losses due primarily to microbial
degradation (Brown and Morra 1993); however, additional research is needed in this area. Although
biodegradation is a significant transformation process for thiocyanate in water, additional data are needed
on the relative importance of this process in determining the fate of thiocyanates in natural water systems.
Bioavailability from Environmental Media. Cyanide is known to be absorbed following
inhalation, oral, and dermal contact (Gosselin et al. 1984; Rieders 1971). The environmental factors that
may influence the bioavailability of cyanide from contaminated air, water, soil, or plant material have not
been studied. Since cyanides are not strongly sorbed to soil and sediments (EPA 1979), the role of
sorption may not be significant in determining the bioavailability of cyanides from different soils or
waters. The bioavailability of cyanide from an environmental medium is expected to increase if the
cyanide is present in water-soluble forms, such as ions or soluble complexes. The pH of a medium may
also be significant in determining the bioavailability because hydrogen cyanide gas may be released as the
pH of the medium decreases (EPA 1978c, 1979). Data delineating the factors affecting the bioavailability
of cyanide compounds from soil and other environmental media need further development, since the
absorption studies discussed in Section 3.4.1 have been performed with the pure chemical.
The factors that may influence the bioavailability of thiocyanate from various foods and other
environmental media have not been investigated. There is no data need at this time because exposure to
thiocyanate from environmental media is expected to be low.

CYANIDE 197
6. POTENTIAL FOR HUMAN EXPOSURE
Food Chain Bioaccumulation. Simple cyanide compounds do not bioconcentrate in fish (EPA
1979, 1985a). There is evidence suggesting that the bioconcentration of cyanide metal complexes in fish
(EPA 1979). Therefore, it would be useful to determine the bioconcentration potential for cyanide in fish
from water exposed to less toxic and water-soluble cyanide complexes. There is no indication of
biomagnification of cyanides in aquatic and terrestrial food chains (EPA 1978c). Because of the high
toxicity of cyanides at high doses and rapid metabolism at low doses, biomagnification of cyanide in
animals seems unlikely.
No information could be found in the available literature on the potential of thiocyanates for
bioconcentration or biomagnification in the food web. In the absence of this information, data would be
useful to determine the potential for thiocyanate to bioconcentrate and/or biomagnify in a food chain.
Exposure Levels in Environmental Media. Reliable monitoring data for the levels of cyanide in
contaminated media at hazardous waste sites are needed so that the information obtained on levels of
cyanide in the environment can be used in combination with the known body burden of cyanide to assess
the potential risk of adverse health effects in populations living in the vicinity of hazardous waste sites.
Data exist regarding the levels of cyanide in air and drinking water, and these data have been used to
estimate human exposure. The concentration of hydrogen cyanide in the air of non-urban areas is ≈160–
166 ppt (Cicerone and Zellner 1983; Jaramillo et al. 1989) and the inhalation exposure of the general U.S.
non-urban, nonsmoking population to hydrogen cyanide was estimated to be 3.8 μg/day. The chlorination
of public drinking water supplies may result in the formation of cyanogen chloride (Jacangelo et al. 1989;
Ohya and Kanno 1987). In 1988, the quarterly median cyanogen chloride concentration in drinking water
from 35 U.S. water utilities ranged from 0.45 to 0.8 μg/L (Krasner et al. 1989). Based on a daily drinking
water consumption of 2 L for a 70-kg adult, the daily intake of cyanogen chloride is estimated to be 0.9–
1.6 μg. These data are sufficient to estimate human exposure from air and drinking water, although
continued monitoring data in these environmental media would be useful. Cyanide and thiocyanate
concentrations in certain foods are known (Abukutsa et al. 1993; EPA 1978c, 1981e; Honig et al. 1983;
Pre and Vassy 1992); however, a data need exists to estimate the dietary exposures for the general
population to cyanide and thiocyanate from food sources. It will also be useful to develop data that would
clearly establish whether cyanides or thiocyanates pose acute or chronic exposure hazards for residents in
the vicinity of hazardous waste sites. This information should include data on background concentrations
in all media to which a resident might be exposed.
CYANIDE 198
6. POTENTIAL FOR HUMAN EXPOSURE
Information on the consumption of cassava in the United States could not be located in the available
literature. Therefore, an assessment of cassava consumption in the United States would be needed before
recommending a need for data relating to exposure levels of cyanide in cassava consumers.
Exposure Levels in Humans. The levels of cyanide and thiocyanate in various human tissues and
body fluids of both control and occupationally exposed groups and of smokers and nonsmokers are
available (see Sections 3.4.4, 3.8.1, and 6.5). Although no specific data need exists regarding levels of
cyanide and thiocyanate in human biological samples, continued monitoring data are recommended in
order to assess current human exposure. Data are available that describe the levels of these chemicals in
humans consuming foods containing cyanogenic materials (WHO 2004b). These data are mainly limited
to cyanide exposures that result from the consumption of cassava (Dufour 1988; Mlingi et al. 1992; Ojo
and Dean 2002; Okafor et al. 2002; Onabolu et al. 2002; Tylleskar et al. 1992, 1994).
This information is necessary for assessing the need to conduct health studies on these populations.
Exposures of Children. Data regarding the exposure of children to side-stream (second-hand)
cigarette smoke are available (Bottoms et al. 1982; Chen et al. 1990; Hauth et al. 1984). There are no
comprehensive data on the cyanide or thiocyanate content of total diet samples in the United States, so it
is not possible to estimate the average daily intake from foods. This is a data need for both children and
adult exposures.
Data on exposures of children to cyanides and thiocyanates in the vicinity of hazardous waste sites would
be useful to clearly establish whether cyanides or thiocyanates pose acute or chronic exposure hazards to
children living near these sites. This information should include data on background concentrations in all
media.
Child health data needs relating to susceptibility are discussed in Section 3.12.2, Identification of Data
Needs: Children’s Susceptibility.
Exposure Registries. No exposure registries for cyanide were located. This substance is not
currently one of the compounds for which a sub-registry has been established in the National Exposure
Registry. The substance will be considered in the future when chemical selection is made for sub-
registries to be established. The information that is amassed in the National Exposure Registry facilitates
CYANIDE 199
6. POTENTIAL FOR HUMAN EXPOSURE
the epidemiological research needed to assess adverse health outcomes that may be related to exposure to
this substance.
6.8.2 Ongoing Studies
No new or ongoing studies of release, environmental fate and transport, levels monitored in the
environment, or human exposures were identified for cyanide or cyanide compounds in the Federal
Research in Progress (FEDRIP 2005) database.