township of union public schools - … gr… · · 2015-09-11township of union public schools ......
TRANSCRIPT

TOWNSHIP OF UNION PUBLIC SCHOOLS
Algebra II
Curriculum Guide 2014
Curriculum Guide Reapproved August 2015

2
TOWNSHIP OF UNION PUBLIC SCHOOLS
Board Members
Mr. Francis R. Perkins, President
Mr. Richard Galante, Vice President
Mr. David Arminio
Ms. Susana Cooley
Mr. Thomas Layden
Mr. Vito Nufrio
Mr. Guy Francis
Ms. Lois Jackson
Mr. Angel Salcedo
3
TOWNSHIP OF UNION PUBLIC SCHOOLS
Administration
Chief School Administrator …………………………………...…………………………...……………...……….... Dr. Patrick Martin
Assistant Superintendent ………….………………………………………………..…………………...…….….…Mr. Gregory Tatum
Assistant Superintendent ………….……………………………….………………………….…………………..… Dr. Noreen Lishak
Board Attorney/ Board Secretary ……………………………………………………………………………..… Mr. James J. Damato
School Business Administrator ……………………………………………………………………..………...…. Mr. Manuel E. Veiera
Director of Technology and Student Information ….………………………..…………………………...…………. Ms. Ann M. Hart
Director of Special Services ………………………………………………………………………………...….……….. Ms. Kim Conti
Director of Athletics, Physical Education and Nurses…………………………………………..…………………..…Ms. Linda Ionta

4
DEPARTMENT SUPERVISORS
12- Month
School Counseling ………………………………………………………………………………………………….... Ms. Nicole Ahern
Special Services: PreK-8 ……………………………………………………………………………………………. Mr. Jason Killian
Special Services: PreK-8 ……………………………………………………………………………………….… Ms. Donna Wozniak
Special Services: 9-12 …………………………………………………………………………………………… Mr. Joseph Seugling
10-Month
English and Social Studies: PreK-2 …………………………………………………………………………...….Ms. Maureen Corbett
Mathematics and Science: 3-5 …………………………………………………………………………………...….. Ms. Deborah Ford
Social Studies: 6-12; Business …………………………………………………………………………..…...……… Ms. Libby Galante
English and Social Studies: 3-5 …………………………………………………………………………..……….. Mr. Robert Ghiretti
Science 6-12 ………………………………………………………………………………………………..……. Ms. Maureen Guilfoyle
Career Ed; World Language; ESL; Computers; G&T ………………………………………………….…..… Ms. Yvonne Lorenzo
English: 6-12; Library/Media ………………………………………………………………………………..……... Ms. Mary Malyska
Math and Science: PreK-2 ……………………………………………………………………………………….Ms. Theresa Matthews
Math: 6-12 ………………………………………………………………………………………………..………... Mr. Jason Mauriello
Art; Music …………………………………………………………………………………………………..……….… Mr. Ronald Rago

5
Curriculum Committee Academic Area
Cheryl Fiske
Sherri Horn
Nancy Mullen
MATHEMATICS—UNION HIGH SCHOOL

6
Table of Contents
Title Page Board Members Administration Department Supervisors Curriculum Committee Table of Content District Mission/Philosophy Statement District Goals Course Description Course Proficiencies Recommended Texts Curriculum Units Appendix A: Common Core Standards Appendix B: Mathematical Practices Appendix C: New Jersey Scoring Rubric

7
Mission Statement
The Township of Union Board of Education believes that every child is entitled to an education designed to meet
his or her individual needs in an environment that is conducive to learning. State standards, federal and state
mandates, and local goals and objectives, along with community input, must be reviewed and evaluated on a
regular basis to ensure that an atmosphere of learning is both encouraged and implemented. Furthermore, any
disruption to or interference with a healthy and safe educational environment must be addressed, corrected, or
when necessary, removed in order for the district to maintain the appropriate educational setting.
Philosophy Statement
The Township of Union Public School District, as a societal agency, reflects democratic ideals and concepts
through its educational practices. It is the belief of the Board of Education that a primary function of the Township
of Union Public School System is to formulate a learning climate conducive to the needs of all students in general,
providing therein for individual differences. The school operates as a partner with the home and community.

8
Statement of District Goals
Develop reading, writing, speaking, listening, and mathematical skills.
Develop a pride in work and a feeling of self-worth, self-reliance, and self discipline.
Acquire and use the skills and habits involved in critical and constructive thinking.
Develop a code of behavior based on moral and ethical principles.
Work with others cooperatively.
Acquire a knowledge and appreciation of the historical record of human achievement and failures and current societal
issues.
Acquire a knowledge and understanding of the physical and biological sciences.
Participate effectively and efficiently in economic life and the development of skills to enter a specific field of work.
Appreciate and understand literature, art, music, and other cultural activities.
Develop an understanding of the historical and cultural heritage.
Develop a concern for the proper use and/or preservation of natural resources.
Develop basic skills in sports and other forms of recreation.

9
Course Description This guide is for a college prep Algebra 2 class. Systems of equations, polynomials, radical, exponential, logarithmic, rational and
quadratic functions will be covered from an algebraic and geometric interpretation. Students will compute steps by hand and explore
through graphing. Some sequences, series, combination, permutations and matrices will be included. Projects throughout the year
will further engage students interactively and enhance understanding of applications. The use of word problems throughout also
allows for the processing of information and the drawing of conclusions.
Course Proficiencies
Students will be able to…
1) Model real-life situations using expressions and equations. 2) Identify functions, use function notation and perform function operations. 3) Solve linear equations and inequalities. 4) Find domain and range of functions. 5) Solve and graph absolute value inequalities. 6) Model real-life situations using direct, indirect and joint variation. 7) Use sampling methods to estimate populations and recognize bias surveys. 8) Write and graph linear equations given certain conditions. 9) Solve systems of equations algebraically and graphically. 10) Solve quadratics using formula, graphing, factoring and completing the square. 11) Add, subtract and multiply complex numbers. 12) Extend the properties of exponents to rational exponents. 13) Use properties of radicals in order to simplify and evaluate expressions containing radicals and various indexes. 14) Evaluate and simplify expressions written in either exponential or radical form. 15) Find real and complex roots using long and synthetic division. 16) Simplify rational expressions and solve rational equations. 17) Use properties of logs to simplify expressions and solve equations. 18) Apply formulas of geometric and arithmetic sequences and series. 19) Calculate probability, odds, combinations and permutations of given events. 20) Demonstrate knowledge of matrices. 21) Extend the domain of trigonometric functions using the unit circle. 22) Prove and apply trigonometric identities. 23) Identify the conic section from its equation.

10
Recommended Textbook…………………………………………….Prentice Hall Algebra 2
Curriculum Units
Unit 1: Equations & Inequalities Unit 2: Quadratics, Polynomial Functions, & Conic Sections Unit 3: Radical, Exponential & Logarithmic Functions Unit4: Rational Functions Unit 5: Sequences & Series Unit 6: Probability & Matrices Unit 7: Trigonometric Functions

11
Course Pacing Guide
Content Number of Days Unit 1: Equations and Inequalities 40
Unit 2: Quadratics, Polynomial Functions, and Conic Sections 45
Unit 3: Radical, Exponential and Logarithmic Functions 45
Unit 4: Rational Functions 25
Unit 5: Sequences and Series 10
Unit 6: Probability and Matrices 10
Unit 7: Trigonometric Functions 5

12
Unit 1: Equations and inequalities
Essential Questions Instructional Objectives/ Skills and Benchmarks (CPIs)
Activities Assessments
How do variables help model
situations?
How can properties of real
numbers be used to simplify
expressions?
How do you solve an equation
or inequality?
Does it matter which form of a
linear equation you use?
How do transformations help
graph absolute value functions?
How do you model data with
linear equations?
How do you determine the size
of a population?
Evaluate and simplify algebraic
expressions F.BF.1
Solve equations A.REI.3
Write and solve simple and
compound inequalities
A.CED.2
Write and solve equations and
inequalities involving absolute
value A.REI.10
Describe how an absolute value
graph is translated from its
parent graph F.BF.1
Solve problems where y varies
directly as x F.IF.6
Utilize function notation
F.BF.1
Identify functions. F.BF.1
Perform operations written in
function notation F.BF.1
Line of best fit project with
model cars.
Write your own daily wages in
an algebraic expression.
Bring in a mobile kit. Measure
entire weight. Determine
weight of each individual
figure on each side by
balancing equations.
Use elevators to explain when
both size and direction matter
in an equation.
Fish sampling project
Rotate lines to explore the
change in the slope and find the
new equation.
Use order of operations to
simplify: 7(-4x + 3) - 9x
Find solution: -27 + 6x = 3(x-3)
Graph solution to:
-3(2x-5) + 1 > 4
Find and graph solution to
512 x
Write paragraph explaining the
results of the line of best fit
project
A salesperson’s commission
varies directly with sales. If he
earned $4200 after a week of
$8000 in sales, how much was
sold for a commission of $300?
13
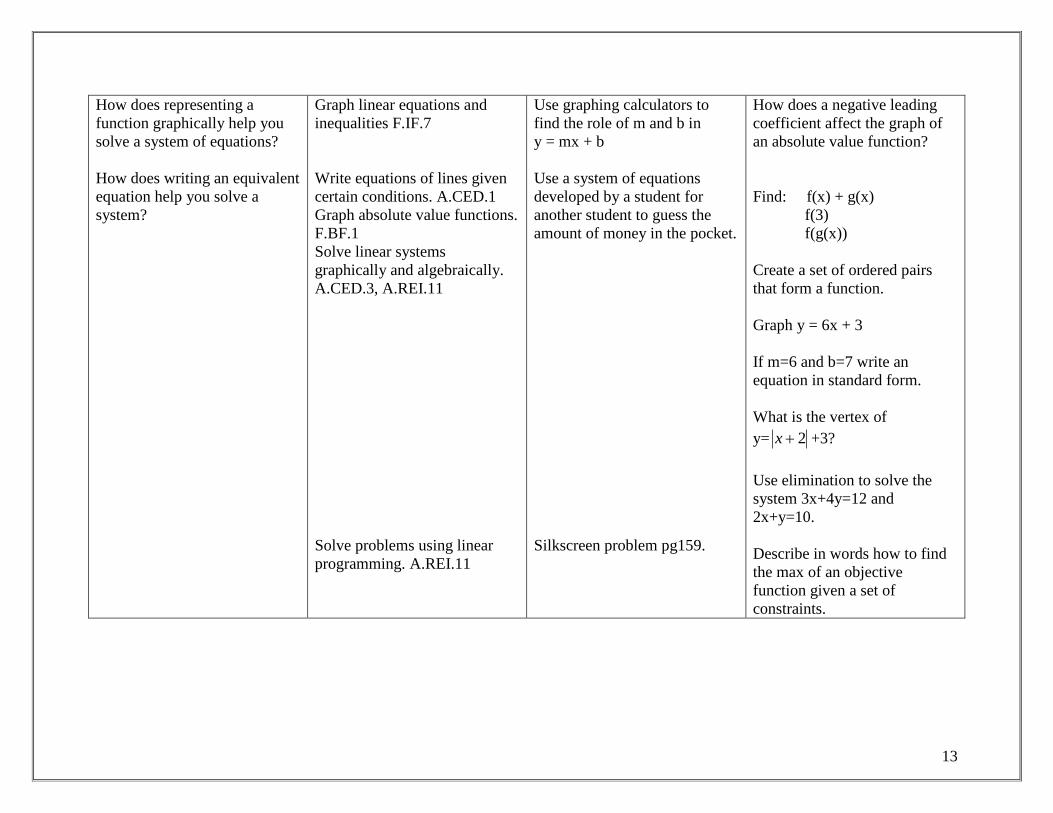
How does representing a
function graphically help you
solve a system of equations?
How does writing an equivalent
equation help you solve a
system?
Graph linear equations and
inequalities F.IF.7
Write equations of lines given
certain conditions. A.CED.1
Graph absolute value functions.
F.BF.1
Solve linear systems
graphically and algebraically.
A.CED.3, A.REI.11
Solve problems using linear
programming. A.REI.11
Use graphing calculators to
find the role of m and b in
y = mx + b
Use a system of equations
developed by a student for
another student to guess the
amount of money in the pocket.
Silkscreen problem pg159.
How does a negative leading
coefficient affect the graph of
an absolute value function?
Find: f(x) + g(x)
f(3)
f(g(x))
Create a set of ordered pairs
that form a function.
Graph y = 6x + 3
If m=6 and b=7 write an
equation in standard form.
What is the vertex of
y= 2x +3?
Use elimination to solve the
system 3x+4y=12 and
2x+y=10.
Describe in words how to find
the max of an objective
function given a set of
constraints.

14
Unit 2: Quadratics and Polynomial Functions and Conics
Essential Questions Instructional Objectives/ Skills and Benchmarks (CPIs)
Activities Assessments
What are the advantages of a
quadratic in vertex form? In
standard form?
How is any quadratic function
related to its parent graph?
How are real solutions of a
quadratic equation related to
the graph of the related
function?
How do we handle square roots
of negative numbers?
For a polynomial function how
are the factors, x-intercepts and
zeros are related?
For a polynomial equation how
are the factors and roots
related?
Identify and graph quadratic
functions from vertex and
standard form. F.IF.8
Find the domain and range of a
quadratic function. F.IF.4
Identify transformations of a
parabolic graph. F.IF.8
Factor quadratic expressions.
A.SSE.1, A.SSE.2
Solve quadratic equations by
graphs, factoring, formula and
completing the square.
A.SSE.3, F.IF.7
Determine the number of
solutions using the determinant.
A.REI.4
Perform operations with
complex numbers. N.CN.2
Divide polynomials using long
division. A.APR.1
Divide polynomials using
synthetic division. A.APR.1
Students investigate video
games to see where a parabolic
function is used for figures to
jump.
Match graphs of parabolas with
given domains and ranges.
Derive the quadratic formula
using the completing the square
method.
Use a partially completed
multiplication table with a
variable to determine a
relationship between each.
Given a polynomial of degree 3
let students find as many ways
possible to write corresponding
factors and create boxes of size
to fit.
Use the vertex and two other
points to graph y = (x+2)2
+ 5.
What would be the equation of
a parabola translated 4 units
right and 7 down from the
origin?
Find the domain and range of
the parabola that results from
the above transformations.
What is 4x2 - 2x + 36 in
factored form?
Solve for x: x2 - 3x = 6
How many real solutions does
-2x2 - 3x + 5 = 0 have?
Multiply (3i)(-5 + 2i)
Use the remainder theorem to
find f(2) for x3
+ 4x2
+ 4x
Compare the answers for long
division and synthetic division:
(x3 - 7x
2 - 7x + 20) (x + 4)

15
Unit 3: Radical, Exponential and Logarithmic Functions
Essential Questions Instructional Objectives/ Skills and Benchmarks (CPIs)
Activities Assessments
To simplify the nth root of an
expression, what must be true
of the expression?
When you square each side of
an equation is the result
equivalent to the original?
How do you model a quantity
that changes regularly over
time by the same percentage?
How are exponents and logs
related?
How are the exponential and
logarithmic functions related?
Find nth roots. N-RN.1
Add, subtract, multiply and
divide radical expressions.
N.RN.2
Simplify expressions with
rational exponents. N.RN.2
Solve square root and radical
equations. N.RN.2
Add, subtract, multiply, divide
and find composites of
functions. N.RN.2
Model and graph exponential
growth and decay.
F.IF.7,F.BF.1
Use properties of logarithms.
F.LE.4
Solve exponential and
logarithm equations. F.LE.4
Evaluate and simplify and
solve with natural logs.
F.LE.4,A.REI.11
Popcorn project on half-life.
Use polygonal shapes with the
area given to go backwards and
find sides of radical length.
Let students write functions for
sales tax and discounts.
Explore whether it is better to
apply discount before or after
tax.
Start with rings of 5 sizes and
three posts. Move all rings to a
second post never putting a
bigger on a smaller. Record
fewest number of moves
needed for 5 then 10 then 20
rings.
Project comparing salaries that
grow exponentially as
compared to linearly.
Write a paragraph explaining
the results of project.
3 128 Simplify
3 + 54 + 128 Simplify
x(1/3)
x(3/5)
Simplify
73 x = x - 1
If f(x) = 3x and g(x) = x2, find
f g(5)
Graph: y = 3x
Expand log(y
x4)
153x
= 285
Simplify ln e2.

16
Unit 4: Rational Functions
Essential Questions Instructional Objectives/ Skills and Benchmarks (CPIs)
Activities Assessments
When are 2 quantities inversely
proportional?
Are a rational function and its
simplified form equivalent?
When is a rational expression
undefined?
Recognize and use inverse and
joint variation. A.CED.2
Simplify, multiply, divide, add
and subtract rational
expressions. A.APR.7
Solve rational equations.
A.REI.2
Find the excluded values of a
rational expression. A.APR.7
Have students bring in bags of
sand and various size boxes.
Let them discover the
relationship between the depth
of the sand and the area of the
base. Have them write inverse
equations to model the
situation.
If x is 2 when y is 9, find x if y
is inversely proportional to the
square of x.
Find the quotient of
2 - x
x2 + 2x+1and
x
x2 -1
Add the above expressions
Solve the equation when the
above expressions are equal.
Find the domain of the above
expressions

17
Unit 5: Sequences and Series
Essential Questions Instructional Objectives/ Skills and Benchmarks (CPIs)
Activities Assessments
How can you model a
geometric or arithmetic
sequence?
How can you model a
geometric or arithmetic series
sum?
Define, identify and apply
arithmetic sequences. N.RN.2
Define, identify and apply
geometric sequences. N.RN.2
To identify arithmetic and
geometric series and their
sums. N.RN.2
To train for a 10 km race in 10
weeks, begin running 4km each
day. Each week increase by a
fixed amount. How many kms
should fill the days?
Use one calendar page to see
how much money would be
saved if you started with a
penny the first, two cents the
second, 4 cents the third, 8
cents the fourth day, and so on.
Find the 32nd
term of an
arithmetic sequence with a
common difference of - 1/3 and
a1 of 81.
Find the common ratio of a
geometric sequence with a 5th
term of 2 and a tenth term of
32.
Find the sum of the first 10
terms of a geometric series with
an initial term of 1 and a
common ratio of ¼.

18
Unit 6: Probability and Matrices
Essential Questions Instructional Objectives/ Skills and Benchmarks (CPIs)
Activities Assessments
What is the difference between
combinations and
permutations?
How can you use a matrix to
organize data?
How do you add, subtract, and
multiply matrices?
When are matrices used to
model real-life situations?
Count permutations. N.RN.2
Count combinations. N.RN.2
Add, subtract and multiply
matrices. N.VM.8
Use scalar multiplication.
N.VM.8
Apply matrices to solve real-
life problems. N.VM.6
Go to the school cafeteria and
determine the number of lunch
permutations given the choices
for main course, dessert and
drink.
Use the class to determine the
number of 3-person committees
possible.
Figure out the chance 2 people
will have the same birthday in a
room of a given size.
Organize the students in the
classroom by gender and hair
color into a matrix. Go to all
the rooms in the same hallway
and do the same. Add matrices
to get totals.
Discuss when this method
would be used in real life.
If 3 friends go to a video store
and rent 3 videos but only have
a chance to watch 3, how many
possible combinations of 3 are
there?
How many ways can 11
children be put in a line?
Given 2 equal matrices find the
missing variable if a term is
written as a variable
expression.
Given 2 matrices A and B find
A+B, A-B, AB and BA if
possible and 3A+5B.

19
Unit 7: Trigonometric Functions
Essential Questions Instructional Objectives/ Skills and Benchmarks (CPIs)
Activities Assessments
What are the interrelationships
among the 6 basic trig
functions?
When are inverse trig functions
used?
When do trig identities make
simplification of expressions
easier?
Write trig expressions in
various equivalent forms.
F.TF.1, F.TF.2
Use an inverse trig function to
find an angle measurement.
G.SRT.6
Simplify trig expressions using
the Pythagorean identities.
F.TF.8
Students make a chart to
remember when each trig
function is = 0 or is undefined.
Students will be given a group
of cards, each with a single step
in the solution to proving an
identity.
Students will arrange the steps
in the correct order.
Write tan x – sec x using only
sin x and cos x.
Find the angle, x, given
tan x = 1
Simplify sec2 x – tan
2 x

20
Common Core Standards
Mathematics l High School – Number and Quantity
The Real Number System N – RN Extend the properties of exponents to rational exponents. 1. Explain how the definition of the meaning of rational exponents follows from extending the properties of integer exponents to those values, allowing for a notation for radicals in terms of rational exponents. For example, we define 51/3 to be the cube root of 5 because we want (51/3)3 = 5(1/3)3 to hold, so (51/3)3 must equal 5. 2. Rewrite expressions involving radicals and rational exponents using the properties of exponents. Use properties of rational and irrational numbers. 3. Explain why the sum or product of two rational numbers is rational; that the sum of a rational number and an irrational number is irrational; and that the product of a nonzero rational number and an irrational number is irrational.
Quantities★ N –Q
Reason quantitatively and use units to solve problems. 1. Use units as a way to understand problems and to guide the solution of multi-step problems; choose and interpret units consistently in formulas; choose and interpret the scale and the origin in graphs and data displays. 2. Define appropriate quantities for the purpose of descriptive modeling. 3. Choose a level of accuracy appropriate to limitations on measurement when reporting quantities. The Complex Number System N – CN Perform arithmetic operations with complex numbers. 1. Know there is a complex number i such that i2 = –1, and every complex number has the form a + bi with a and b real.
21
2. Use the relation i2 = –1 and the commutative, associative, and distributive properties to add, subtract, and multiply complex numbers. 3. (+) Find the conjugate of a complex number; use conjugates to find moduli and quotients of complex numbers. Represent complex numbers and their operations on the complex plane. 4. (+) Represent complex numbers on the complex plane in rectangular and polar form (including real and imaginary numbers), and explain why the rectangular and polar forms of a given complex number represent the same number. 5. (+) Represent addition, subtraction, multiplication, and conjugation of complex numbers geometrically on the complex
plane; use properties of this representation for computation. For example, (–1 + 3 i)3 = 8 because (–1 + 3 i) has
modulus 2 and argument 120°. 6. (+) Calculate the distance between numbers in the complex plane as the modulus of the difference, and the midpoint of a segment as the average of the numbers at its endpoints. Use complex numbers in polynomial identities and equations. 7. Solve quadratic equations with real coefficients that have complex solutions. 8. (+) Extend polynomial identities to the complex numbers. For example, rewrite x2 + 4 as (x + 2i)(x – 2i). 9. (+) Know the Fundamental Theorem of Algebra; show that it is true for quadratic polynomials.
Vector and Matrix Quantities N –VM Represent and model with vector quantities. 1. (+) Recognize vector quantities as having both magnitude and direction. Represent vector quantities by directed line segments, and use appropriate symbols for vectors and their magnitudes (e.g., v, |v|,||v||, v). 2. (+) Find the components of a vector by subtracting the coordinates of an initial point from the coordinates of a terminal point. 3. (+) Solve problems involving velocity and other quantities that can be represented by vectors. Perform operations on vectors. 4. (+) Add and subtract vectors.
a. Add vectors end-to-end, component-wise, and by the parallelogram rule. Understand that the magnitude of a sum of
two vectors is typically not the sum of the magnitudes.
b. Given two vectors in magnitude and direction form, determine the magnitude and direction of their sum.
c. Understand vector subtraction v – w as v + (–w), where –w is the additive inverse of w, with the same magnitude as w
and pointing
22
in the opposite direction. Represent vector subtraction graphically by connecting the tips in the appropriate order, and perform vector subtraction component-wise. 5. (+) Multiply a vector by a scalar.
a. Represent scalar multiplication graphically by scaling vectors and possibly reversing their direction; perform scalar
multiplication component-wise, e.g., as c(vx, vy) = (cvx, cvy).
b. Compute the magnitude of a scalar multiple cv using ||cv|| = |c|v. Compute the direction of cv knowing that when |c|v
0, the direction of cv is either along v (for c > 0) or against v (for c < 0). Perform operations on matrices and use matrices in applications. 6. (+) Use matrices to represent and manipulate data, e.g., to represent payoffs or incidence relationships in a network. 7. (+) Multiply matrices by scalars to produce new matrices, e.g., as when all of the payoffs in a game are doubled. 8. (+) Add, subtract, and multiply matrices of appropriate dimensions. 9. (+) Understand that, unlike multiplication of numbers, matrix multiplication for square matrices is not a commutative operation, but still satisfies the associative and distributive properties. 10. (+) Understand that the zero and identity matrices play a role in matrix addition and multiplication similar to the role of 0 and 1 in the real numbers. The determinant of a square matrix is nonzero if and only if the matrix has a multiplicative inverse. 11. (+) Multiply a vector (regarded as a matrix with one column) by a matrix of suitable dimensions to produce another vector. Work with matrices as transformations of vectors. 12. (+) Work with 2 × 2 matrices as transformations of the plane, and interpret the absolute value of the determinant in terms of area.
Mathematics l High School – Algebra Seeing Structure in Expressions A-SSE Interpret the structure of expressions 1. Interpret expressions that represent a quantity in terms of its context. a. Interpret parts of an expression, such as terms, factors, and coefficients.
b. Interpret complicated expressions by viewing one or more of their parts as a single entity. For example, interpret P(1+r)n
as the product of P and a factor not depending on P. 2. Use the structure of an expression to identify ways to rewrite it. For example, see x4 – y4 as (x2)2 – (y2)2, thus recognizing it as a difference of squares that can be factored as (x2 – y2)(x2 + y2). Write expressions in equivalent forms to solve problems

23
3. Choose and produce an equivalent form of an expression to reveal and explain properties of the quantity represented by the expression.
a. Factor a quadratic expression to reveal the zeros of the function it defines.
b. Complete the square in a quadratic expression to reveal the maximum or minimum value of the function it defines.
c. Use the properties of exponents to transform expressions for exponential functions. For example the expression 1.15t
can be rewritten as (1.151/12)12t ≈ 1.01212t to reveal the approximate equivalent monthly interest rate if the annual rate is 15%.
4. Derive the formula for the sum of a finite geometric series (when the common ratio is not 1), and use the formula to
solve problems. For example, calculate mortgage payments.
Arithmetic with Polynomials and Rational Expressions A –APR Perform arithmetic operations on polynomials 1. Understand that polynomials form a system analogous to the integers, namely, they are closed under the operations of addition, subtraction, and multiplication; add, subtract, and multiply polynomials. Understand the relationship between zeros and factors of polynomials 2. Know and apply the Remainder Theorem: For a polynomial p(x) and a number a, the remainder on division by x – a is p(a), so p(a) = 0 if and only if (x – a) is a factor of p(x). 3. Identify zeros of polynomials when suitable factorizations are available, and use the zeros to construct a rough graph of the function defined by the polynomial. Use polynomial identities to solve problems 4. Prove polynomial identities and use them to describe numerical relationships. For example, the polynomial identity (x2 + y2)2 = (x2 – y2)2 + (2xy)2 can be used to generate Pythagorean triples. 5. (+) Know and apply the Binomial Theorem for the expansion of (x + y)n in powers of x and y for a positive integer n, where x and y are any numbers, with coefficients determined for example by Pascal’s Triangle.11The Binomial Theorem can be proved by mathematical induction or by a combinatorial argument. Rewrite rational expressions 6. Rewrite simple rational expressions in different forms; write a(x)/b(x) in the form q(x) + r(x)/b(x), where a(x), b(x), q(x), and r(x) are polynomials with the degree of r(x) less than the degree of b(x), using inspection, long division, or, for the more complicated examples, a computer algebra system.
24
7. (+) Understand that rational expressions form a system analogous to the rational numbers, closed under addition, subtraction, multiplication, and division by a nonzero rational expression; add, subtract, multiply, and divide rational expressions.
Creating Equations★ A –CED
Create equations that describe numbers or relationships 1. Create equations and inequalities in one variable and use them to solve problems. Include equations arising from linear and quadratic functions, and simple rational and exponential functions. 2. Create equations in two or more variables to represent relationships between quantities; graph equations on coordinate axes with labels and scales. 3. Represent constraints by equations or inequalities, and by systems of equations and/or inequalities, and interpret solutions as viable or nonviable options in a modeling context. For example, represent inequalities describing nutritional and cost constraints on combinations of different foods. 4. Rearrange formulas to highlight a quantity of interest, using the same reasoning as in solving equations. For example, rearrange Ohm’s law V = IR to highlight resistance R. Reasoning with Equations and Inequalities A –REI Understand solving equations as a process of reasoning and explain the reasoning 1. Explain each step in solving a simple equation as following from the equality of numbers asserted at the previous step, starting from the assumption that the original equation has a solution. Construct a viable argument to justify a solution method. 2. Solve simple rational and radical equations in one variable, and give examples showing how extraneous solutions may arise. Solve equations and inequalities in one variable 3. Solve linear equations and inequalities in one variable, including equations with coefficients represented by letters. 4. Solve quadratic equations in one variable.
a. Use the method of completing the square to transform any quadratic equation in x into an equation of the form (x – p)2 =
q that has the same solutions. Derive the quadratic formula from this form.
b. Solve quadratic equations by inspection (e.g., for x2 = 49), taking square roots, completing the square, the
quadratic formula and factoring, as appropriate to the initial form of the equation. Recognize when the quadratic formula gives complex solutions and write them as a ± bi for real numbers a and b.

25
Solve systems of equations 5. Prove that, given a system of two equations in two variables, replacing one equation by the sum of that equation and a multiple of the other produces a system with the same solutions. 6. Solve systems of linear equations exactly and approximately (e.g., with graphs), focusing on pairs of linear equations in two variables. 7. Solve a simple system consisting of a linear equation and a quadratic equation in two variables algebraically and graphically. For example, find the points of intersection between the line y = –3x and the circle x2 + y2 = 3. 8. (+) Represent a system of linear equations as a single matrix equation in a vector variable. 9. (+) Find the inverse of a matrix if it exists and use it to solve systems of linear equations (using technology for matrices of dimension 3 × 3 or greater). Represent and solve equations and inequalities graphically 10. Understand that the graph of an equation in two variables is the set of all its solutions plotted in the coordinate plane, often forming a curve (which could be a line). 11. Explain why the x-coordinates of the points where the graphs of the equations y = f(x) and y = g(x) intersect are the solutions of the equation f(x) = g(x); find the solutions approximately, e.g., using technology to graph the functions, make tables of values, or find successive approximations. Include cases where f(x) and/or g(x) are linear, polynomial, rational, absolute value, exponential, and logarithmic functions. 12. Graph the solutions to a linear inequality in two variables as a half-plane (excluding the boundary in the case of a strict inequality), and graph the solution set to a system of linear inequalities in two variables as the intersection of the corresponding half-planes.
Mathematics l High School – Functions Interpreting Functions F-IF Understand the concept of a function and use function notation 1. Understand that a function from one set (called the domain) to another set (called the range) assigns to each element of the domain exactly one element of the range. If f is a function and x is an element of its domain, then f(x) denotes the output of f corresponding to the input x. The graph of f is the graph of the equation y = f(x). 2. Use function notation, evaluate functions for inputs in their domains, and interpret statements that use function notation in terms of a context. 3. Recognize that sequences are functions, sometimes defined recursively, whose domain is a subset of the integers. For
example, the Fibonacci sequence is defined recursively by f(0) = f(1) = 1, f(n+1) = f(n)+f(n-1) for n 1.

26
Interpret functions that arise in applications in terms of the context 4. For a function that models a relationship between two quantities, interpret key features of graphs and tables in terms of the quantities, and sketch graphs showing key features given a verbal description of the relationship. Key features include: intercepts; intervals where the function is increasing, decreasing, positive, or negative; relative maximums and minimums; symmetries; end behavior; and periodicity. 5. Relate the domain of a function to its graph and, where applicable, to the quantitative relationship it describes. For example, if the function h(n) gives the number of person-hours it takes to assemble n engines in a factory, then the positive integers would be an appropriate domain for the function. 6. Calculate and interpret the average rate of change of a function (presented symbolically or as a table) over a specified interval. Estimate the rate of change from a graph. Analyze functions using different representations 7. Graph functions expressed symbolically and show key features of the graph, by hand in simple cases and using technology for more complicated cases.
a. Graph linear and quadratic functions and show intercepts, maxima, and minima.
b. Graph square root, cube root, and piecewise-defined functions, including step functions and absolute value functions.
c. Graph polynomial functions, identifying zeros when suitable factorizations are available, and showing end behavior.
d. (+) Graph rational functions, identifying zeros and asymptotes when suitable factorizations are available, and showing
end behavior.
e. Graph exponential and logarithmic functions, showing intercepts and end behavior, and trigonometric functions,
showing period, midline, and amplitude. 8. Write a function defined by an expression in different but equivalent forms to reveal and explain different properties of the function.
a. Use the process of factoring and completing the square in a quadratic function to show zeros, extreme values, and
symmetry of the graph, and interpret these in terms of a context.
b. Use the properties of exponents to interpret expressions for exponential functions. For example, identify percent rate of
change in functions such as y = (1.02)t, y = (0.97)t, y = (1.01)12t, y = (1.2)t/10, and classify them as representing exponential growth or decay. 9. Compare properties of two functions each represented in a different way (algebraically, graphically, numerically in tables, or by verbal descriptions). For example, given a graph of one quadratic function and an algebraic expression for another, say which has the larger maximum. Building Functions F-BF

27
Build a function that models a relationship between two quantities 1. Write a function that describes a relationship between two quantities. a. Determine an explicit expression, a recursive process, or steps for calculation from a context.
b. Combine standard function types using arithmetic operations. For example, build a function that models the
temperature of a cooling body by adding a constant function to a decaying exponential, and relate these functions to the model.
c. (+) Compose functions. For example, if T(y) is the temperature in the atmosphere as a function of height, and h(t) is the
height of a weather balloon as a function of time, then T(h(t)) is the temperature at the location of the weather balloon as a function of time. 2. Write arithmetic and geometric sequences both recursively and with an explicit formula, use them to model situations, and translate between the two forms.
Build new functions from existing functions 3. Identify the effect on the graph of replacing f(x) by f(x) + k, k f(x), f(kx), and f(x + k) for specific values of k (both positive and negative); find the value of k given the graphs. Experiment with cases and illustrate an explanation of the effects on the graph using technology. Include recognizing even and odd functions from their graphs and algebraic expressions for them. 4. Find inverse functions.
a. Solve an equation of the form f(x) = c for a simple function f that has an inverse and write an expression for the inverse.
For example, f(x) =2 x3 or f(x) = (x+1)/(x–1) for x 1.
b. (+) Verify by composition that one function is the inverse of another.
c. (+) Read values of an inverse function from a graph or a table, given that the function has an inverse.
d. (+) Produce an invertible function from a non-invertible function by restricting the domain.
5. (+) Understand the inverse relationship between exponents and logarithms and use this relationship to solve problems
involving logarithms and exponents.
Linear, Quadratic, and Exponential Models★ F –LE
Construct and compare linear, quadratic, and exponential models and solve problems 1. Distinguish between situations that can be modeled with linear functions and with exponential functions.

28
a. Prove that linear functions grow by equal differences over equal intervals, and that exponential functions grow by equal
factors over equal intervals.
b. Recognize situations in which one quantity changes at a constant rate per unit interval relative to another.
c. Recognize situations in which a quantity grows or decays by a constant percent rate per unit interval relative to another.
2. Construct linear and exponential functions, including arithmetic and geometric sequences, given a graph, a description of a relationship, or two input-output pairs (include reading these from a table). 3. Observe using graphs and tables that a quantity increasing exponentially eventually exceeds a quantity increasing linearly, quadratically, or (more generally) as a polynomial function. 4. For exponential models, express as a logarithm the solution to abct = d where a, c, and d are numbers and the base b is 2, 10, or e; evaluate the logarithm using technology. Interpret expressions for functions in terms of the situation they model 5. Interpret the parameters in a linear or exponential function in terms of a context. Trigonometric Functions F-TF Extend the domain of trigonometric functions using the unit circle 1. Understand radian measure of an angle as the length of the arc on the unit circle subtended by the angle. 2. Explain how the unit circle in the coordinate plane enables the extension of trigonometric functions to all real numbers, interpreted as radian measures of angles traversed counterclockwise around the unit circle.
3. (+) Use special triangles to determine geometrically the values of sine, cosine, tangent for /3, /4 and 6, and use the
unit circle to express the values of sine, cosine, and tangent for –x, +x, and 2–x in terms of their values for x, where x is any real number. 4. (+) Use the unit circle to explain symmetry (odd and even) and periodicity of trigonometric functions. Model periodic phenomena with trigonometric functions 5. Choose trigonometric functions to model periodic phenomena with specified amplitude, frequency, and midline. 6. (+) Understand that restricting a trigonometric function to a domain on which it is always increasing or always decreasing allows its inverse to be constructed. 7. (+) Use inverse functions to solve trigonometric equations that arise in modeling contexts; evaluate the solutions using technology, and interpret them in terms of the context.
Prove and apply trigonometric identities

29
8. Prove the Pythagorean identity sin2(θ) + cos2(θ) = 1 and use it to find sin(θ), cos(θ), or tan(θ) given sin(θ), cos(θ), or tan(θ) and the quadrant of the angle.
9. (+) Prove the addition and subtraction formulas for sine, cosine, and tangent and use them to solve problems. Mathematics l High School – Modeling Modeling Standards: Modeling is best interpreted not as a collection of isolated topics, but rather in relation to other
standards. Making mathematical models is a Standard for Mathematical Practice, and specific modeling standards appear throughout
the high standards.
Mathematics l High School – Statistics and Probabilities Interpreting Categorical and Quantitative Data S-ID Summarize, represent, and interpret data on a single count or measurement variable 1. Represent data with plots on the real number line (dot plots, histograms, and box plots). 2. Use statistics appropriate to the shape of the data distribution to compare center (median, mean) and spread (interquartile range, standard deviation) of two or more different data sets. 3. Interpret differences in shape, center, and spread in the context of the data sets, accounting for possible effects of extreme data points (outliers). 4. Use the mean and standard deviation of a data set to fit it to a normal distribution and to estimate population percentages. Recognize that there are data sets for which such a procedure is not appropriate. Use calculators, spreadsheets, and tables to estimate areas under the normal curve. Summarize, represent, and interpret data on two categorical and quantitative variables 5. Summarize categorical data for two categories in two-way frequency tables. Interpret relative frequencies in the context of the data (including joint, marginal, and conditional relative frequencies). Recognize possible associations and trends in the data. 6. Represent data on two quantitative variables on a scatter plot, and describe how the variables are related.

30
a. Fit a function to the data; use functions fitted to data to solve problems in the context of the data. Use given functions or
choose a function suggested by the context. Emphasize linear, quadratic, and exponential models.
b. Informally assess the fit of a function by plotting and analyzing residuals.
c. Fit a linear function for a scatter plot that suggests a linear association.
Interpret linear models 7. Interpret the slope (rate of change) and the intercept (constant term) of a linear model in the context of the data. 8. Compute (using technology) and interpret the correlation coefficient of a linear fit. 9. Distinguish between correlation and causation. Making Inferences and Justifying Conclusions S-IC Understand and evaluate random processes underlying statistical experiments 1. Understand statistics as a process for making inferences about population parameters based on a random sample from that population. 2. Decide if a specified model is consistent with results from a given data-generating process, e.g., using simulation. For example, a model says a spinning coin falls heads up with probability 0.5. Would a result of 5 tails in a row cause you to question the model? Make inferences and justify conclusions from sample surveys, experiments, and observational studies 3. Recognize the purposes of and differences among sample surveys, experiments, and observational studies; explain how randomization relates to each. 4. Use data from a sample survey to estimate a population mean or proportion; develop a margin of error through the use of simulation models for random sampling. 5. Use data from a randomized experiment to compare two treatments; use simulations to decide if differences between parameters are significant. 6. Evaluate reports based on data. Conditional Probability and the Rules of Probability S-CP Understand independence and conditional probability and use them to interpret data 1. Describe events as subsets of a sample space (the set of outcomes) using characteristics (or categories) of the outcomes, or as unions, intersections, or complements of other events (“or,” “and,” “not”).

31
2. Understand that two events A and B are independent if the probability of A and B occurring together is the product of their probabilities, and use this characterization to determine if they are independent. 3. Understand the conditional probability of A given B as P(A and B)/P(B), and interpret independence of A and B as saying that the conditional probability of A given B is the same as the probability of A, and the conditional probability of B given A is the same as the probability of B. 4. Construct and interpret two-way frequency tables of data when two categories are associated with each object being classified. Use the two-way table as a sample space to decide if events are independent and to approximate conditional probabilities. For example, collect data from a random sample of students in your school on their favorite subject among math, science, and English. Estimate the probability that a randomly selected student from your school will favor science given that the student is in tenth grade. Do the same for other subjects and compare the results. 5. Recognize and explain the concepts of conditional probability and independence in everyday language and everyday situations. For example, compare the chance of having lung cancer if you are a smoker with the chance of being a smoker if you have lung cancer. Use the rules of probability to compute probabilities of compound events in a uniform probability model 6. Find the conditional probability of A given B as the fraction of B’s outcomes that also belong to A, and interpret the answer in terms of the model. 7. Apply the Addition Rule, P(A or B) = P(A) + P(B) – P(A and B), and interpret the answer in terms of the model. 8. (+) Apply the general Multiplication Rule in a uniform probability model, P(A and B) = P(A)P(B|A) = P(B)P(A|B), and interpret the answer in terms of the model. 9. (+) Use permutations and combinations to compute probabilities of compound events and solve problems. Using Probability to Make Decisions S-MD Calculate expected values and use them to solve problems 1. (+) Define a random variable for a quantity of interest by assigning a numerical value to each event in a sample space; graph the corresponding probability distribution using the same graphical displays as for data distributions. 2. (+) Calculate the expected value of a random variable; interpret it as the mean of the probability distribution. 3. (+) Develop a probability distribution for a random variable defined for a sample space in which theoretical probabilities can be calculated; find the expected value. For example, find the theoretical probability distribution for the number of correct answers obtained by guessing on all five questions of a multiple-choice test where each question has four choices, and find the expected grade under various grading schemes.

32
4. (+) Develop a probability distribution for a random variable defined for a sample space in which probabilities are assigned empirically; find the expected value. For example, find a current data distribution on the number of TV sets per household in the United States, and calculate the expected number of sets per household. How many TV sets would you expect to find in 100 randomly selected households? Use probability to evaluate outcomes of decisions 5. (+) Weigh the possible outcomes of a decision by assigning probabilities to payoff values and finding expected values.
a. Find the expected payoff for a game of chance. For example, find the expected winnings from a state lottery ticket or a
game at a fast food restaurant.
b. Evaluate and compare strategies on the basis of expected values. For example, compare a high-deductible versus a
low-deductible automobile insurance policy using various, but reasonable, chances of having a minor or a major accident. 6. (+) Use probabilities to make fair decisions (e.g., drawing by lots, using a random number generator). 7. (+) Analyze decisions and strategies using probability concepts (e.g., product testing, medical testing, pulling a hockey goalie at the end of a game).

33
Mathematical Practices
1. CCSS.Math.Practice.MP1 Make sense of problems and persevere in solving them.
Mathematically proficient students start by explaining to themselves the meaning of a problem and looking for entry points to its
solution. They analyze givens, constraints, relationships, and goals. They make conjectures about the form and meaning of the
solution and plan a solution pathway rather than simply jumping into a solution attempt. They consider analogous problems, and try
special cases and simpler forms of the original problem in order to gain insight into its solution. They monitor and evaluate their
progress and change course if necessary. Older students might, depending on the context of the problem, transform algebraic
expressions or change the viewing window on their graphing calculator to get the information they need. Mathematically proficient
students can explain correspondences between equations, verbal descriptions, tables, and graphs or draw diagrams of important
features and relationships, graph data, and search for regularity or trends. Younger students might rely on using concrete objects or
pictures to help conceptualize and solve a problem. Mathematically proficient students check their answers to problems using a
different method, and they continually ask themselves, “Does this make sense?” They can understand the approaches of others to
solving complex problems and identify correspondences between different approaches.
2. CCSS.Math.Practice.MP2 Reason abstractly and quantitatively.
Mathematically proficient students make sense of quantities and their relationships in problem situations. They bring two
complementary abilities to bear on problems involving quantitative relationships: the ability to decontextualize—to abstract a given
situation and represent it symbolically and manipulate the representing symbols as if they have a life of their own, without necessarily
attending to their referents—and the ability to contextualize, to pause as needed during the manipulation process in order to probe into
the referents for the symbols involved. Quantitative reasoning entails habits of creating a coherent representation of the problem at
hand; considering the units involved; attending to the meaning of quantities, not just how to compute them; and knowing and flexibly
using different properties of operations and objects.

34
3. CCSS.Math.Practice.MP3 Construct viable arguments and critique the reasoning of others.
Mathematically proficient students understand and use stated assumptions, definitions, and previously established results in
constructing arguments. They make conjectures and build a logical progression of statements to explore the truth of their conjectures.
They are able to analyze situations by breaking them into cases, and can recognize and use counterexamples. They justify their
conclusions, communicate them to others, and respond to the arguments of others. They reason inductively about data, making
plausible arguments that take into account the context from which the data arose. Mathematically proficient students are also able to
compare the effectiveness of two plausible arguments, distinguish correct logic or reasoning from that which is flawed, and—if there
is a flaw in an argument—explain what it is. Elementary students can construct arguments using concrete referents such as objects,
drawings, diagrams, and actions. Such arguments can make sense and be correct, even though they are not generalized or made formal
until later grades. Later, students learn to determine domains to which an argument applies. Students at all grades can listen or read the
arguments of others, decide whether they make sense, and ask useful questions to clarify or improve the arguments.
4. CCSS.Math.Practice.MP4 Model with mathematics.
Mathematically proficient students can apply the mathematics they know to solve problems arising in everyday life, society, and the
workplace. In early grades, this might be as simple as writing an addition equation to describe a situation. In middle grades, a student
might apply proportional reasoning to plan a school event or analyze a problem in the community. By high school, a student might use
geometry to solve a design problem or use a function to describe how one quantity of interest depends on another. Mathematically
proficient students who can apply what they know are comfortable making assumptions and approximations to simplify a complicated
situation, realizing that these may need revision later. They are able to identify important quantities in a practical situation and map
their relationships using such tools as diagrams, two-way tables, graphs, flowcharts and formulas. They can analyze those
relationships mathematically to draw conclusions. They routinely interpret their mathematical results in the context of the situation
and reflect on whether the results make sense, possibly improving the model if it has not served its purpose.

35
5. CCSS.Math.Practice.MP5 Use appropriate tools strategically.
Mathematically proficient students consider the available tools when solving a mathematical problem. These tools might include
pencil and paper, concrete models, a ruler, a protractor, a calculator, a spreadsheet, a computer algebra system, a statistical package, or
dynamic geometry software. Proficient students are sufficiently familiar with tools appropriate for their grade or course to make sound
decisions about when each of these tools might be helpful, recognizing both the insight to be gained and their limitations. For
example, mathematically proficient high school students analyze graphs of functions and solutions generated using a graphing
calculator. They detect possible errors by strategically using estimation and other mathematical knowledge. When making
mathematical models, they know that technology can enable them to visualize the results of varying assumptions, explore
consequences, and compare predictions with data. Mathematically proficient students at various grade levels are able to identify
relevant external mathematical resources, such as digital content located on a website, and use them to pose or solve problems. They
are able to use technological tools to explore and deepen their understanding of concepts.
6. CCSS.Math.Practice.MP6 Attend to precision.
Mathematically proficient students try to communicate precisely to others. They try to use clear definitions in discussion with others
and in their own reasoning. They state the meaning of the symbols they choose, including using the equal sign consistently and
appropriately. They are careful about specifying units of measure, and labeling axes to clarify the correspondence with quantities in a
problem. They calculate accurately and efficiently, express numerical answers with a degree of precision appropriate for the problem
context. In the elementary grades, students give carefully formulated explanations to each other. By the time they reach high school
they have learned to examine claims and make explicit use of definitions.

36
7. CCSS.Math.Practice.MP7 Look for and make use of structure.
Mathematically proficient students look closely to discern a pattern or structure. Young students, for example, might notice that three
and seven more is the same amount as seven and three more, or they may sort a collection of shapes according to how many sides the
shapes have. Later, students will see 7 × 8 equals the well remembered 7 × 5 + 7 × 3, in preparation for learning about the distributive
property. In the expression x2 + 9x + 14, older students can see the 14 as 2 × 7 and the 9 as 2 + 7. They recognize the significance of
an existing line in a geometric figure and can use the strategy of drawing an auxiliary line for solving problems. They also can step
back for an overview and shift perspective. They can see complicated things, such as some algebraic expressions, as single objects or
as being composed of several objects. For example, they can see 5 – 3(x – y)2 as 5 minus a positive number times a square and use that
to realize that its value cannot be more than 5 for any real numbers x and y.
8. CCSS.Math.Practice.MP8 Look for and express regularity in repeated reasoning.
Mathematically proficient students notice if calculations are repeated, and look both for general methods and for shortcuts. Upper
elementary students might notice when dividing 25 by 11 that they are repeating the same calculations over and over again, and
conclude they have a repeating decimal. By paying attention to the calculation of slope as they repeatedly check whether points are on
the line through (1, 2) with slope 3, middle school students might abstract the equation (y – 2)/(x – 1) = 3. Noticing the regularity in
the way terms cancel when expanding (x – 1)(x + 1), (x – 1)(x2 + x + 1), and (x – 1)(x
3 + x2 + x + 1) might lead them to the general
formula for the sum of a geometric series. As they work to solve a problem, mathematically proficient students maintain oversight of
the process, while attending to the details. They continually evaluate the reasonableness of their intermediate results.
37
New Jersey Scoring Rubric
3 - Point Response The response shows complete understanding of the problem's essential mathematical concepts. The student executes procedures completely and gives relevant responses to all parts of the task. The response contains few minor errors, if any. The response contains a clear, effective explanation detailing how the problem was solved so that the reader does not need to infer how and why decisions were made.
2 - Point Response The response shows nearly complete understanding of the problem's essential mathematical concepts. The student executes nearly all procedures and gives relevant responses to most parts of the task. The response may have minor errors. The explanation detailing how the problem was solved may not be clear, causing the reader to make some inferences.
1 - Point Response The response shows limited understanding of the problem's essential mathematical concepts. The response and procedures may be incomplete and/or may contain major errors. An incomplete explanation of how the problem was solved may contribute to questions as to how and why decisions were made.
0 - Point Response The response shows insufficient understanding of the problem's essential mathematical concepts. The procedures, if any, contain major errors. There may be no explanation of the solution or the reader may not be able to understand the explanation. The reader may not be able to understand how and why decisions were made.