towner co nd economic impact 2014 - center for rural … · 1 the economic impact of towner county...
TRANSCRIPT

The Economic Impact of Towner County Medical Center on Towner County, North Dakota
Prepared by:
National Center for Rural Health Works
Oklahoma State University
July 2014

The Economic Impact of Towner County Medical Center on Towner County, North Dakota
Prepared for:
Towner County Medical Center and
Center for Rural Health The University of North Dakota School of Medicine and Health Sciences
Prepared by:
Cheryl F. St. Clair, Associate Director and Associate State Extension Specialist Email: [email protected]
Gerald A. Doeksen, Director and Regents Professor/Extension Economist
Email: [email protected]
Brandon Raczkoski, Graduate Student Associate Email: [email protected]
National Center for Rural Health Works Oklahoma Cooperative Extension Service
Oklahoma State University (405) 744-6083 or 6081
July 2014

1
The Economic Impact of Towner County Medical Center on Towner County, North Dakota
Medical facilities have a tremendous medical and economic impact on the community or
county in which they are located. This is especially true with health care facilities, such as
hospitals and nursing homes. These facilities not only employ a number of people and have a
large payroll, but they also draw into the community or county a large number of people from
rural areas that need medical services. The overall objective of this study is to measure the
economic impact of Towner County Medical Center on Towner County in North Dakota. The
specific objectives of this report are to:
1. Discuss the importance of health care services to rural development, including national health trend data;
2. Review demographic and economic data for Towner County;
3. Summarize the direct economic activities of Towner County Medical Center from
operations and construction in Towner County;
4. Present concepts of community economics and multipliers; and
5. Estimate the economic impact of Towner County Medical Center from operating activities and construction activities in Towner County.
No recommendations will be made in this report.
Health Services and Rural Development
The nexus between health care services and rural development is often overlooked. At
least three primary areas of commonality exist. A strong health care system can help attract and
maintain business and industry growth, and attract and retain retirees. A strong health care
system can also create jobs in the local area.

2
Services that Impact Rural Development
Type of Growth Services Important to Attract Growth
Industrial and Business
Health and Education
Retirees
Health and Safety
Studies have found that quality-of-life (QOL) factors are playing a dramatic role in
business and industry location decisions. Among the most significant of the QOL variables are
health care services, which are important for at least three reasons.
Business and Industry Growth
First, as noted by a member of the Board of Directors of a community economic
development corporation, the presence of good health and education services is imperative to
industrial and business leaders as they select a community for location. Employees and
participating management may offer strong resistance if they are asked to move into a
community with substandard or inconveniently located health services.
Secondly, when a business or industry makes a location decision, it wants to ensure that
the local labor force will be productive, and a key factor in productivity is good health. Thus,
investments in health care services can be expected to yield dividends in the form of increased
labor productivity.
The cost of health care services is the third factor that is considered by business and
industry in development decisions. Research shows that corporations take a serious look at
health care costs in determining site locations. Sites that provide health care services at a lower
cost are given higher consideration for new industry than sites with much higher health care
costs.

3
Health Services and Attracting Retirees
A strong and convenient health care system is important to retirees, a special group of
residents whose spending and purchasing can be a significant source of income for the local
economy. Many rural areas have environments (e.g., moderate climate and outdoor activities)
that enable them to be in a good position to attract and retain retirees. The amount of spending
embodied in this population, including the purchasing power associated with Social Security,
Medicare, and other transfer payments, is substantial. Additionally, middle and upper income
retirees often have substantial net worth. Although the data are limited, several studies suggest
health services may be a critical variable that influences the location decision of retirees. For
example, one study found that four items were the best predictors of retirement locations: safety,
recreational facilities, dwelling units, and health care. Another study found that nearly 60 percent
of potential retirees said health services were in the “must have” category when considering a
retirement community. Only protective services were mentioned more often than health services
as a “must have” service.
Health Services and Job Growth
A factor important to the success of rural economic development is job creation. The
health care sector is an extremely fast growing sector, and based on the current demographics,
there is every reason to expect this trend to continue. Data in Table 1 provide selected
expenditure and employment data for the United States. Several highlights from the national data
are:
In 1970, health care services as a share of the national gross domestic product (GDP) were 7.0 percent and increased to 17.2 percent in 2012;
Per capita health expenditures increased from $356 in 1970 to $8,915 in 2012;

4
Table 1 United States Health Expenditures and Employment Data
1970-2012; Projected for 2012-2022
Total Per Capita Health Health Avg AnnualYear Health Health as % Sector Increase in
Expenditures Expenditures of GDP Employment Employment ($Billions) ($) (%) (0) (%)
Historical
1970 $74.9 $356 7.0% 3,052 a 1980 255.8 1,110 8.9% 5,278 a 7.3% 1990 724.3 2,855 12.1% 8,211 a 5.6% 2000 1,377.2 4,878 13.4% 10,858 a 3.2% 2010 2,599.0 8,411 17.4% 13,777 b 2.7%
2001 1,493.4 5,238 14.1% 11,188 b 2003 1,778.0 6,128 15.4% 11,817 b 2.8% 2005 2,035.4 6,889 15.5% 12,314 b 2.1% 2007 2,302.9 7,649 15.9% 12,947 b 2.6%
2009 2,504.2 8,170 17.4% 13,543 b 2.3% 2010 2,599.0 8,411 17.4% 13,777 b 1.7% 2011 2,692.8 8,658 17.3% 14,026 b 1.8% 2012 2,793.4 8,915 17.2% 14,302 b 2.0%
Avg Yrly Increase 2001 to 2012 2.5%
Projections
2014 3,093.0 9,697 18.3%
2016 3,458.0 10,651 18.4% 2018 3,889.0 11,771 18.5% 2020 4,416.0 13,142 19.2% 2022 5,009.0 14,664 19.9%
SOURCES: U.S. Department of Labor, Bureau of Labor Statistics (www.bls.gov [February 2014]); U.S. Department of Health and Human Services, Centers for Medicare and Medicaid Services, National Health Expenditures 1960-2012 and National Health Expenditure Projections 2012-2022 (http://www.cms.gov/Research-Statistics-Data-and-Systems/Statistics-Trends-and-Reports/NationalHealthExpendData/index.html [February 2014]). a Based on Standard Industrial Classification (SIC) codes for health sector employment. b Based on North American Industrial Classification System (NAICS) for health sector employment.
5
Employment in the health sector increased 368.6 percent from 1970 to 2012; and Annual increases in employment from 2001 to 2012 ranged from 1.7 percent to 2.8
percent. The U. S. Department of Health and Human Services, Centers for Medicare and
Medicaid Services, also projects that health care expenditures will account for 18.5 percent of
GDP by 2018 and increase to 19.9 percent of GDP in 2022. Per capita health care expenditures
are projected to increase to $11,771 in 2018 and to $14,664 in 2022. Total health expenditures
are projected to increase to over $5.0 trillion in 2022.
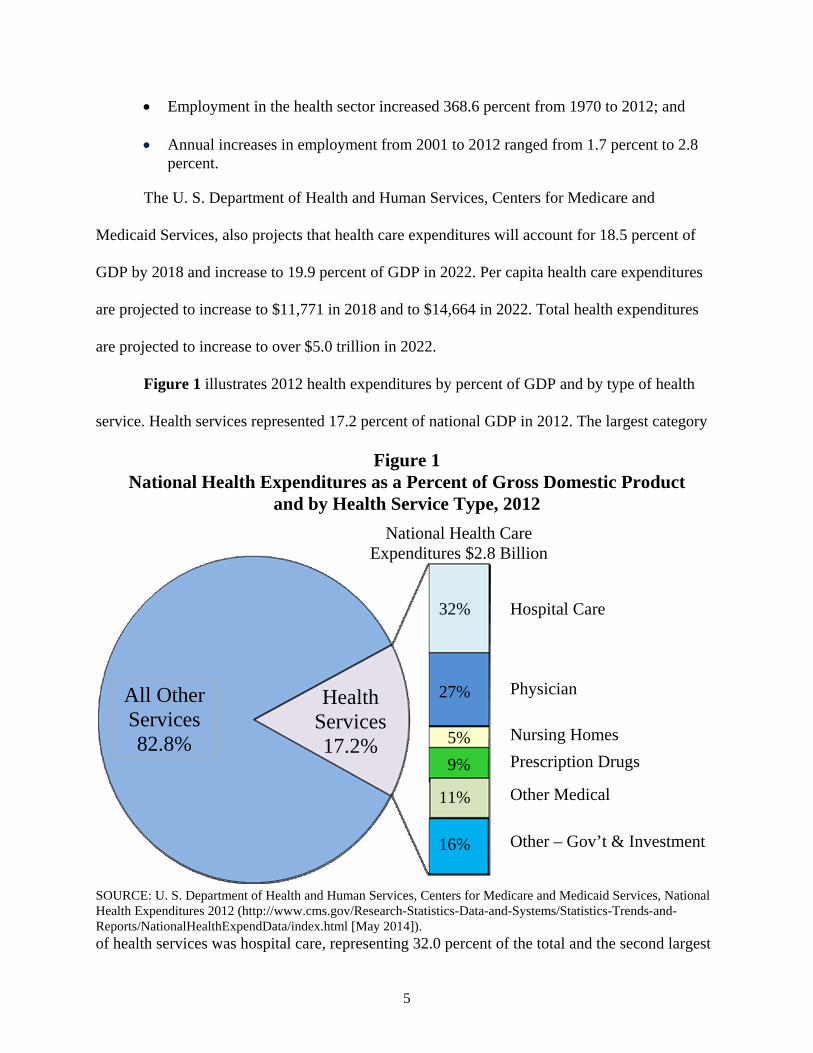
Figure 1 illustrates 2012 health expenditures by percent of GDP and by type of health
service. Health services represented 17.2 percent of national GDP in 2012. The largest category
Figure 1 National Health Expenditures as a Percent of Gross Domestic Product
and by Health Service Type, 2012
SOURCE: U. S. Department of Health and Human Services, Centers for Medicare and Medicaid Services, National Health Expenditures 2012 (http://www.cms.gov/Research-Statistics-Data-and-Systems/Statistics-Trends-and-Reports/NationalHealthExpendData/index.html [May 2014]). of health services was hospital care, representing 32.0 percent of the total and the second largest
National Health Care Expenditures $2.8 Billion
Hospital Care
Physician
Nursing Homes
Prescription Drugs
Other Medical
Other – Gov’t & Investment
All Other Services 82.8%
Health Services 17.2%
32%
27%
5%
9%
11%
16%
6
category was physician services with 27.0 percent of the total.
Towner County Demographic and Economic Data
Towner County Medical Center (TCMC) is located in Cando City in Towner County,
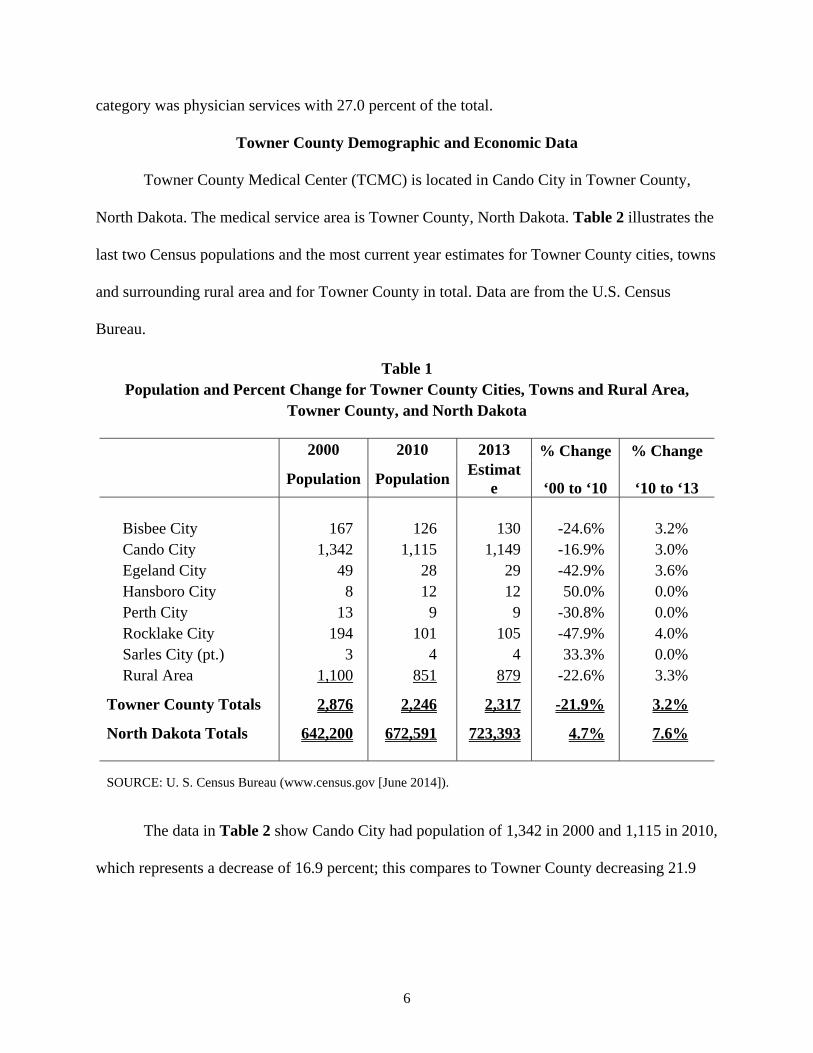
North Dakota. The medical service area is Towner County, North Dakota. Table 2 illustrates the
last two Census populations and the most current year estimates for Towner County cities, towns
and surrounding rural area and for Towner County in total. Data are from the U.S. Census
Bureau.
Table 1 Population and Percent Change for Towner County Cities, Towns and Rural Area,
Towner County, and North Dakota
2000 2010 2013 % Change % Change
Population Population
Estimate ‘00 to ‘10 ‘10 to ‘13
Bisbee City 167 126 130 -24.6% 3.2% Cando City 1,342 1,115 1,149 -16.9% 3.0% Egeland City 49 28 29 -42.9% 3.6% Hansboro City 8 12 12 50.0% 0.0% Perth City 13 9 9 -30.8% 0.0% Rocklake City 194 101 105 -47.9% 4.0% Sarles City (pt.) 3 4 4 33.3% 0.0% Rural Area 1,100 851 879 -22.6% 3.3%
Towner County Totals 2,876 2,246 2,317 -21.9% 3.2%
North Dakota Totals 642,200 672,591 723,393 4.7% 7.6%
SOURCE: U. S. Census Bureau (www.census.gov [June 2014]).
The data in Table 2 show Cando City had population of 1,342 in 2000 and 1,115 in 2010,
which represents a decrease of 16.9 percent; this compares to Towner County decreasing 21.9

7
percent and North Dakota increasing 4.7 percent. U.S. Census Bureau data estimated a
population of 1,149 for Cando City in 2013, an increase of 3.0 percent from 2010, compared to
Towner County increasing 3.2 percent and North Dakota increasing 7.6 percent. All entities
showed the same decreasing trend in population from 2000 to 2010, except Hansboro City and
Sarles City, and all are estimated to increase or remain the same in population from 2010 to
2013.
The 2010 Census populations and population projections for Towner County and North
Dakota are illustrated in Table 3. The 2010 Census populations are from the U. S. Census
Bureau and the population projections are from the North Dakota Statewide Housing Assessment
Resource Project.
Table 3 Population, Population Estimates, and Population Projections for Towner County, North Dakota
Towner County North Dakota 2010 Census 2,246 672,591 2015 Projected 2,277 750,023 2020 Projected 2,301 806,541 2025 Projected 2,315 841,820 % change 2010-2015 1.4% 11.5% % change 2010-2020 2.4% 19.9% % change 2010-2025 3.1% 25.2% SOURCE: Census populations, U.S. Census Bureau (www.census.gov [June 2014]); County and state projections, North Dakota Statewide Housing Assessment Resource Project (www.ndsu.nodak.edu [June 2014]).
The population projections are shown for 2015, 2020, and 2025 for Towner County and
North Dakota. The populations are projected to increase for each time period for both the county

8
and the state, with the state projected to increase at a much higher percentage each time period
than the county.
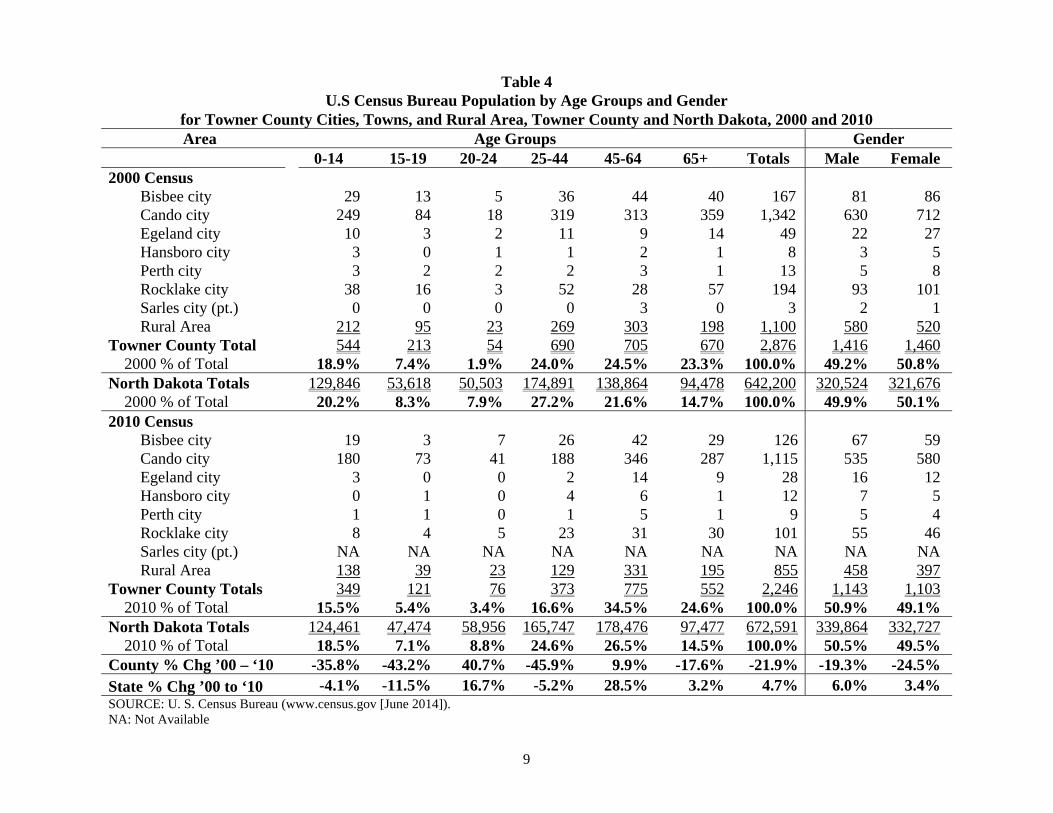
Table 4 shows the populations of Towner County and North Dakota by age group and
gender for the 2000 and 2010 Census years. From 2000 to 2010, all the age groups in Towner
County decreased in percent change of total population except for the 20-24 and 45-64 age
groups; North Dakota was similar an increase in the percent change for the 20-24, 45-64, and the
65+ age groups. The total percent change in population from 2000 to 2010 for Towner County
was a decrease of 21.9 percent while North Dakota showed an increase of 4.7 percent.
Table 5 provides the populations of the cities and rural area, Towner County and North
Dakota by race groups and Hispanic origin. Towner County shows a decrease of 22.4 percent in
the white racial group from 2000 to 2010 data. U.S., while North Dakota increased by 2.1
percent. Towner showed some significant percent changes from 2000 to 2010; however, the
absolute numbers are so low that the percent changes are misleading. For instance, the some
other race group in Towner County increased from a population of one in 2000 to six in 2010,
which represented a 500 percent increase.
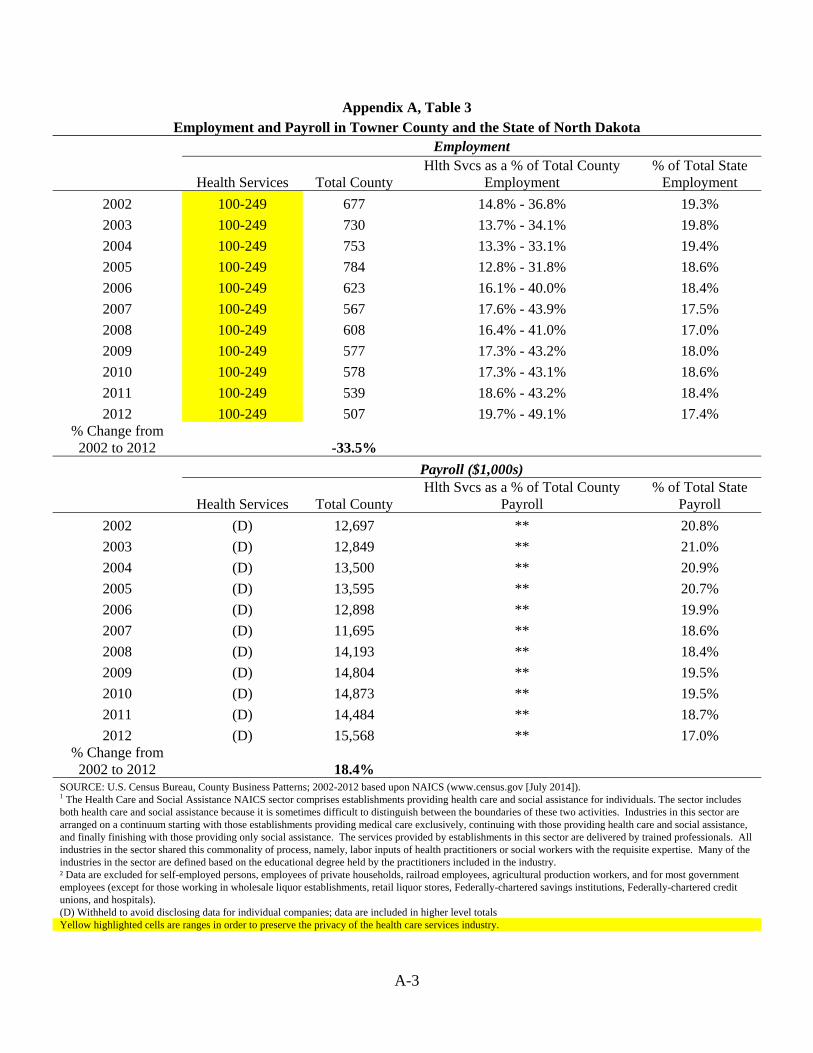
The small scale population of Towner County has limited the availability of data from
U.S. Census Bureau, County Business Patterns, and from U.S. Department of Commerce,
Regional Economic Information System, Bureau of Economic Analysis (BEA). When the data
fall below a specific threshold or a specific number of industries, data is withheld to ensure the
privacy of the industries and to avoid disclosure of confidential information. However, these data
sets for Towner County have been compiled and are available in Appendix A.
Basic economic indicators for Towner County, North Dakota, and the United States are
illustrated in Table 6. BEA data for 2012 show per capita income higher in Towner County than
9
Table 4 U.S Census Bureau Population by Age Groups and Gender
for Towner County Cities, Towns, and Rural Area, Towner County and North Dakota, 2000 and 2010 Area Age Groups Gender
0-14 15-19 20-24 25-44 45-64 65+ Totals Male Female 2000 Census
Bisbee city 29 13 5 36 44 40 167 81 86 Cando city 249 84 18 319 313 359 1,342 630 712 Egeland city 10 3 2 11 9 14 49 22 27 Hansboro city 3 0 1 1 2 1 8 3 5 Perth city 3 2 2 2 3 1 13 5 8 Rocklake city 38 16 3 52 28 57 194 93 101 Sarles city (pt.) 0 0 0 0 3 0 3 2 1 Rural Area 212 95 23 269 303 198 1,100 580 520
Towner County Total 544 213 54 690 705 670 2,876 1,416 1,460 2000 % of Total 18.9% 7.4% 1.9% 24.0% 24.5% 23.3% 100.0% 49.2% 50.8%
North Dakota Totals 129,846 53,618 50,503 174,891 138,864 94,478 642,200 320,524 321,676 2000 % of Total 20.2% 8.3% 7.9% 27.2% 21.6% 14.7% 100.0% 49.9% 50.1%
2010 Census Bisbee city 19 3 7 26 42 29 126 67 59 Cando city 180 73 41 188 346 287 1,115 535 580 Egeland city 3 0 0 2 14 9 28 16 12 Hansboro city 0 1 0 4 6 1 12 7 5 Perth city 1 1 0 1 5 1 9 5 4 Rocklake city 8 4 5 23 31 30 101 55 46 Sarles city (pt.) NA NA NA NA NA NA NA NA NA Rural Area 138 39 23 129 331 195 855 458 397
Towner County Totals 349 121 76 373 775 552 2,246 1,143 1,103 2010 % of Total 15.5% 5.4% 3.4% 16.6% 34.5% 24.6% 100.0% 50.9% 49.1%
North Dakota Totals 124,461 47,474 58,956 165,747 178,476 97,477 672,591 339,864 332,727 2010 % of Total 18.5% 7.1% 8.8% 24.6% 26.5% 14.5% 100.0% 50.5% 49.5%
County % Chg ’00 – ‘10 -35.8% -43.2% 40.7% -45.9% 9.9% -17.6% -21.9% -19.3% -24.5% State % Chg ’00 to ‘10 -4.1% -11.5% 16.7% -5.2% 28.5% 3.2% 4.7% 6.0% 3.4% SOURCE: U. S. Census Bureau (www.census.gov [June 2014]). NA: Not Available

10
Table 5 U.S Census Bureau Population by Race and Hispanic Origin
for Towner County Cities, Towns, and Rural Area, Towner County and the State of North Dakota, 2000 and 2010
Area White Black American Indian Asian
Native HI/Other Pacific Islander
Some Other Race
Two or More Races Totals¹
Hispanic Origin
2000 Census Bisbee City 162 1 2 0 0 0 2 167 0 Cando City 1,305 1 29 2 0 0 5 1,342 2 Egeland City 44 0 5 0 0 0 0 49 0 Hansboro City 8 0 0 0 0 0 0 8 0 Perth City 13 0 0 0 0 0 0 13 0 Rocklake City 186 0 7 0 0 0 1 194 0 Sarles City (pt.) 3 0 0 0 0 0 0 3 0 Rural Area 1,078 0 16 0 0 1 5 1,100 3
Towner County Total 2,799 2 59 2 0 1 13 2,876 5 2000 % of Total 97.3% 0.1% 2.1% 0.1% 0.0% 0.0% 0.5% 100.0% 0.2%
State of North Dakota 593,181 3,916 31,329 3,606 230 2,540 7,398 642,200 7,786 2000 % of Total 92.4% 0.6% 4.9% 0.6% 0.0% 0.4% 1.2% 100.0% 1.2%
2010 Census Bisbee City 121 0 5 0 0 0 0 126 1 Cando City 1,071 2 26 0 0 2 14 1,115 6 Egeland City 25 0 3 0 0 0 0 28 0 Hansboro City 12 0 0 0 0 0 0 12 0 Perth City 9 0 0 0 0 0 0 9 0 Rocklake City 96 0 5 0 0 0 0 101 0 Sarles City (pt.) NA NA NA NA NA NA NA NA NA Rural Area 839 0 10 1 0 4 1 855 3
Towner County Total 2,173 2 49 1 0 6 15 2,246 10 2010 % of Total 96.7% 0.1% 2.2% 0.0% 0.0% 0.3% 0.7% 100.0% 0.4%
State of North Dakota 605,449 7,960 36,591 6,909 320 3,509 11,853 672,591 13,467 2010 % of Total 90.0% 1.2% 5.4% 1.0% 0.0% 0.5% 1.8% 100.0% 2.0%
County % Chg '00 - '10 -22.4% 0.0% -16.9% -50.0% 0.0% 500.0% 15.4% -21.9% 100.0% State % Chg '00 - '10 2.1% 103.3% 16.8% 91.6% 39.1% 38.1% 60.2% 4.7% 73.0% SOURCE: U. S. Census Bureau (www.census.gov [June 2014]). NA: Not Available

11
Table 6 Economic Indicators for Towner County,
North Dakota, and United States
Indicator Towner County North Dakota United States
Total Personal Income (2012) 149,578,000 38,389,622,000 13,729,063,000,000Per Capita Income (2012) 64,529 54,871 43,735
Employment (2013) 916 388,975 143,929,000Unemployment (2013) 43 11,613 11,460,000Unemployment Rate (2013) 4.5% 2.9% 7.4%
Employment (May 2014) 958 401,870 146,398,000Unemployment (May 2014) 34 10,059 9,443,000Unemployment Rate (May 2014) 3.4% 2.4% 6.1%
% of People in Poverty (2012) 9.9% 11.2% 15.9%%of Under 18 in Poverty (2012) 16.1% 13.7% 22.6%
Transfer Receipts (2012) 23,779,000 4,652,610,000 2,358,236,000,000 Transfer Receipts as Percentage of Total Personal Income (2012) 15.9% 12.1% 17.2%
SOURCES: U.S. Department of Labor, Bureau of Labor Statistics; U.S. Department of Commerce, Bureau of Economic Analysis; U.S. Census Bureau [June 2014].
either the state or the nation. The employment and labor force data are from the U.S. Department
of Labor, Bureau of Labor Statistics. For 2013, the unemployment rate was 4.5 percent for
Towner County, compared to 2.9 percent for the state and 7.4 percent for the U.S. For the
preliminary year-to-date data through May 2014, the unemployment rate for Towner County was
3.4 percent; this compared to 2.4 percent for the state and 6.1 percent for the U.S. Based on 2012
U. S. Census poverty data, Towner County had 16.1 percent of the population under age 18
below poverty level; this compared to 13.7 percent for the state and 22.6 percent for the U.S.
From BEA 2012 data, transfer receipts as a percentage for total personal income for Towner
County were higher than the state percentage, but lower than the national percentage. Towner
County showed transfer receipts as 15.9 percent of total personal income, with North Dakota at

12
12.1 percent, and the U.S. at 17.2 percent. This indicator shows the entity’s percent of total
personal income that comes from federal and state funds.
Direct Economic Activities of Towner County Medical Center
TCMC provides services at the Towner County Medical Center and Emergency Room,
Cando Clinic, Devils Lake Community Clinic, Prairie View Estates, St. Francis, and Living
Center.
TCMC and Emergency Room include the following direct services: 20-bed critical access hospital and Level V trauma center, 24-hour emergency services, on-call providers, operating room, nursing services, radiology services, laboratory services, pharmaceutical services, physical therapy, social services, dietary services, medical records, housekeeping and related services including laundry, and central supply services. TCMC also provides services through agreement for anesthesia services, mobile radiology, nuclear medicine – mobile, eye donor program, electroencephalogram interpretation, mobile ophthalmology surgery services, pathology consultant, radiology consultants, respiratory care, occupational therapy, and sleep studies. Cando Clinic includes the following services: family practice, pediatric, podiatry, lower extremity circulatory assessment, sleep apnea assessment, audiograms, pulmonary function assessment, colonoscope, colposcope, endoscopy, pediatric and adult immunizations, disability exams, FFA exams, chronic disease management, chiropractic, massage therapy, diabetic nutritional consultation, cardiac rehab, EKG, Holter monitors, laboratory, radiology, and physical therapy. Cando Clinic has mobile contracts to provide digital mammograms and CT scans. The Cando Clinic also has visiting physicians for cardiology, orthopedic, obstetrics, and gynecology. Devils Lake Community Clinic includes the following services: family practice, pediatric, podiatry, lower extremity circulatory assessment, sleep apnea assessment, audiograms, pulmonary function assessment, pediatric and adult immunizations, disability exams, FFA exams, chronic disease management, diabetic nutritional consultation, bone density scan, ultrasound, digital mammograms, CT scan, laboratory, and radiology. Devils Lake Community Clinic also has visiting physicians for cardiology, orthopedic, oncology, obstetrics, and gynecology. Prairie View Estates is an independent living facility including two-bedroom apartments, noon meal daily, 24-hour emergency call system, weekly housekeeping, weekly bed linen services, and exercise room. St. Francis is a basic care facility including private rooms, double rooms, dietary service, 24-hour
13
nursing staff, recreational activities, spiritual services, daily laundry, and daily housekeeping. Living Center is a skilled nursing facility including daily recreational activities, hospice, restorative care, physical therapy, occupational therapy, speech therapy, social services, spiritual services, dietary services, 45 beds, double rooms, and private rooms. The economic impact of TCMC will be measured by employment (jobs) and labor
income (wages and salaries plus benefits). The direct economic activities will include
employment and labor income from operations activities and employment and labor income from
construction activities.
The operating activities have been divided into three categories: hospital, clinics, and
nursing home. TCMC provided the employment and wages, salaries, and benefits (labor income)
for these three categories for 2013. The hospital had 55 full- and part-time and contractual
employees with labor income of $3.0 million. The clinics had 19 full- and part-time and
contractual employees with labor income of $1.5 million. The nursing home had 35 full- and
part-time and contractual employees with labor income of $1.5 million. In 2013, TCMC had 109
employees with labor income of $6.1 million.
The direct economic activities of TCMC also include construction activities. TCMC
provided the construction data of $27,300 for 2012, $10,300 for 2013, and $80,000 for 2014.
IMPLAN data were utilized to estimate the number of construction employees directly working
on the construction activities and their resulting labor income. The construction in 2012 resulted
in approximately 0.23 employees with labor income of $11,513. Construction activities in 2013
resulted in .09 employees with labor income of $4,505 and resulted in 0.68 employees with labor
income of $34,037 in 2014. Total construction over the three-year period was estimated at
$50,055, resulting in an average per year of 0.33 employees and $16,685 in labor income.

14
Table 7 Direct Economic Activities of Towner County Medical Center
in Towner County, North Dakota, 2013
DIRECT ACTIVITIES FROM OPERATIONS Number of Labor Income
Categories Employees (Wages, Salaries, and Benefits)
Hospital 55 $3,027,000 Clinics 19 $1,506,000 Nursing Home 35 $1,520,000
TOTALS 109 $6,053,000
DIRECT ACTIVITIES FROM CONSTRUCTION
Estimated Number of Labor Income (Wages, Salaries, and
Categories Construction Employees Benefits, and/or Proprietor Income)
2012 $27,300 0.23 $11,513 2013 $10,300 0.09 $4,505 2014 $80,000 0.68 $34,037
TOTALS $117,600 1.00 $50,055
Average Per Year $39,200 0.33 $16,685
SOURCE: Local data from Towner County Medical Center, 2013; Construction ratios and average construction compensation from IMPLAN Group, LLC.
The Impact of Towner County Medical Center
The direct impacts of TCMC, measured by employment and labor income, are only
a portion of the total impact. There are additional economic impacts created as TCMC and its
employees spend money. These are known as secondary impacts and are measured by
multipliers using an input-output model and data from IMPLAN (the model and data are further
discussed in Appendix C). This model is widely used by economists and other academics across
the U. S.

15
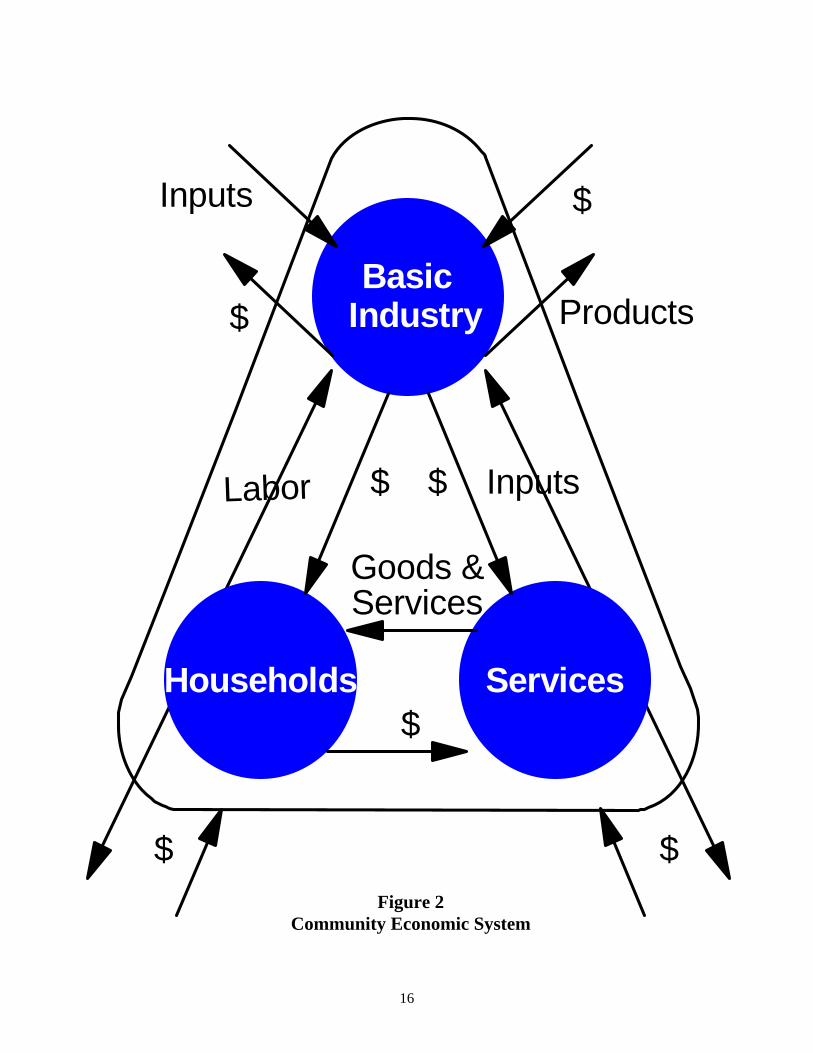
A brief description of the input-output model and the multiplier effect is included and
illustrated in Figure 2. Figure 2 illustrates the major flows of goods, services, and dollars of any
economy. The businesses which sell some or all of their goods and services to buyers outside of
the community are the foundation of a community's economy. Such a business is a basic
industry. The flow of products out of, and dollars into, a community are represented by the two
arrows in the upper right portion of Figure 2. To produce these goods and services for "export"
outside of the community, the basic industry purchases inputs from outside of the community
(upper left portion of Figure 2), labor from the residents or "households" of the community (left
side of Figure 2), and inputs from service industries located within the community (right side of
Figure 2). The flow of labor, goods, and services in the community is completed by households
using their earnings to purchase goods and services from the community's service industries
(bottom of Figure 2). It is evident from the interrelationships shown in Figure 2 that a change in
any one segment of a community's economy will have reverberations throughout the entire
economic system of the community.
Consider, for instance, the closing of a hospital. The services sector will no longer pay
employees and the dollars going to households will stop. Likewise, the hospital will not purchase
goods from other businesses, and the dollar flow to other businesses will stop. This decreases
income in the "households" segment of the economy. Since earnings would decrease, households
decrease their purchases of goods and services from businesses within the "services" segment of
the economy. This, in turn, decreases these businesses' purchases of labor and inputs. Thus, the
change in the economic base works its way throughout the entire local economy.
The total impact of a change in the economy consists of direct, indirect, and induced
impacts. Direct impacts are the changes in the activities of the impacting industry, such as the
16
Households
IndustryBasic
ServicesGoods &
$
Labor Inputs
Products
Inputs
$ $
$
$
Services
$ $Figure 2
Community Economic System
17
closing of a hospital. The impacting business, such as the hospital, changes its purchases of
inputs as a result of the direct impact. This also produces an indirect impact in the business
sectors. Both the direct and indirect impacts change the flow of dollars to the community's
households. The households alter their consumption accordingly. The effect of this change in
household consumption upon businesses in a community is referred to as an induced impact.
A measure is needed that yields the effects created by an increase or decrease in
economic activity. In economics, this measure is called the multiplier effect. Multipliers are used
in this report. An employment multiplier is defined as:
“…the ratio between direct employment, or that employment used by the industry initially experiencing a change in final demand and the direct, indirect, and induced employment.” An employment multiplier of 3.0 indicates that if one job is created by a new industry,
2.0 jobs are created in other sectors due to business (indirect) and household (induced) spending.
The same concept applies to labor income and output multipliers.
The Impact from Operating Activities
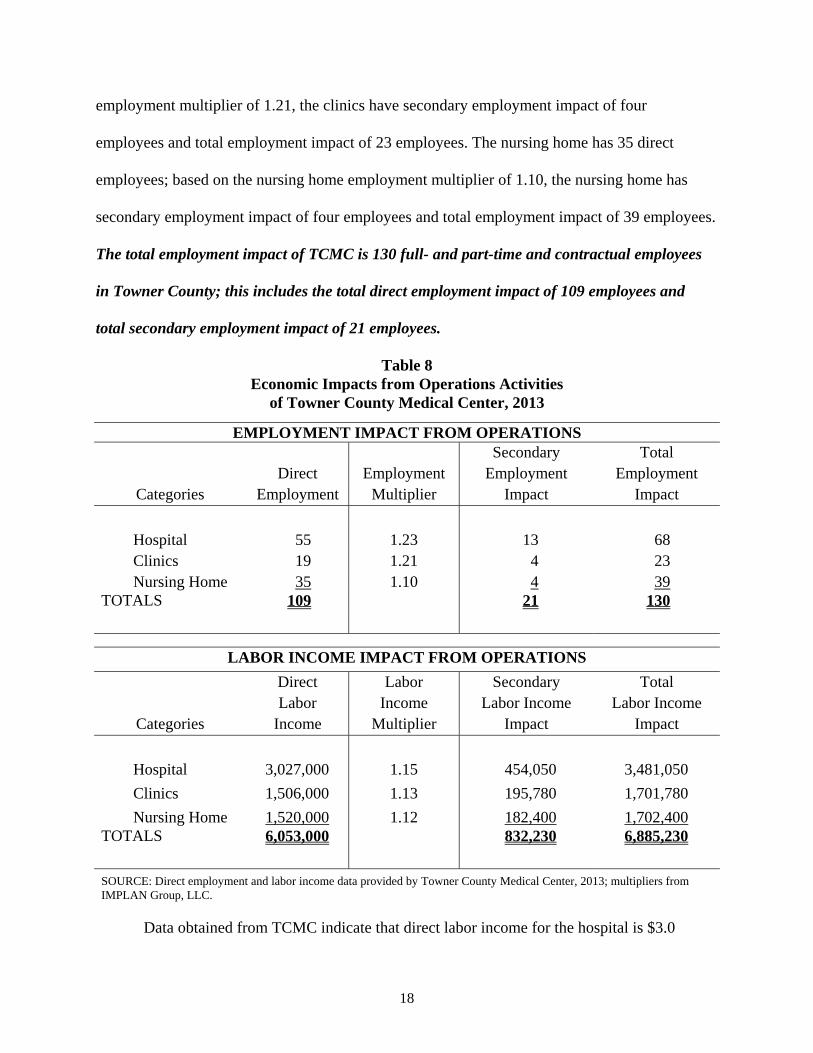
The employment and labor income impacts of TCMC from operating activities are
presented in Table 8. Direct employment and labor income from operating activities were
obtained from TCMC for the categories of hospital, clinics, and nursing home. Each of these
sectors has a unique multiplier derived from IMPLAN.
The hospital employs 55 employees. The hospital employment multiplier is 1.23; this
means for every job in the hospital sector, another 0.23 job is created in other sectors
(businesses) in Towner County. The secondary employment generated in Towner County from
the hospital sector is estimated to be 13 jobs. The hospital has a total impact of 68 jobs on the
local economy of Towner County. The clinics have 19 direct employees and based on the clinics
18
employment multiplier of 1.21, the clinics have secondary employment impact of four
employees and total employment impact of 23 employees. The nursing home has 35 direct
employees; based on the nursing home employment multiplier of 1.10, the nursing home has
secondary employment impact of four employees and total employment impact of 39 employees.
The total employment impact of TCMC is 130 full- and part-time and contractual employees
in Towner County; this includes the total direct employment impact of 109 employees and
total secondary employment impact of 21 employees.
Table 8 Economic Impacts from Operations Activities
of Towner County Medical Center, 2013
EMPLOYMENT IMPACT FROM OPERATIONS Secondary Total Direct Employment Employment Employment
Categories Employment Multiplier Impact Impact
Hospital 55 1.23 13 68 Clinics 19 1.21 4 23 Nursing Home 35 1.10 4 39
TOTALS 109 21 130
LABOR INCOME IMPACT FROM OPERATIONS
Direct Labor Secondary Total Labor Income Labor Income Labor Income
Categories Income Multiplier Impact Impact
Hospital 3,027,000 1.15 454,050 3,481,050
Clinics 1,506,000 1.13 195,780 1,701,780
Nursing Home 1,520,000 1.12 182,400 1,702,400 TOTALS 6,053,000 832,230 6,885,230
SOURCE: Direct employment and labor income data provided by Towner County Medical Center, 2013; multipliers from IMPLAN Group, LLC.
Data obtained from TCMC indicate that direct labor income for the hospital is $3.0
19
million. Using the hospital labor income multiplier of 1.15, TCMC generates secondary labor
income impact of $454,050 and total labor income impact of $3.5 million. The clinics have $1.5
million in direct labor income; based on the clinics labor income multiplier of 1.13, the clinics
have secondary labor income impact of $195,780 and total labor income impact of $1.7 million.
The nursing home has $1.5 million in direct labor income; based on the nursing home labor
income multiplier of 1.12, the nursing home has secondary labor income impact of $182,400 and
total labor income impact of $1.7 million. The total labor income impact of TCMC is $6.9
million on the Towner County economy; this includes the total direct labor income impact of
$6.1 million and total secondary labor income impact of $0.8 million.
The Impact from Construction Activities
The construction activities of TCMC will have an impact on the economy of Towner
County. This impact is often overlooked. TCMC has minimal construction activities for 2012,
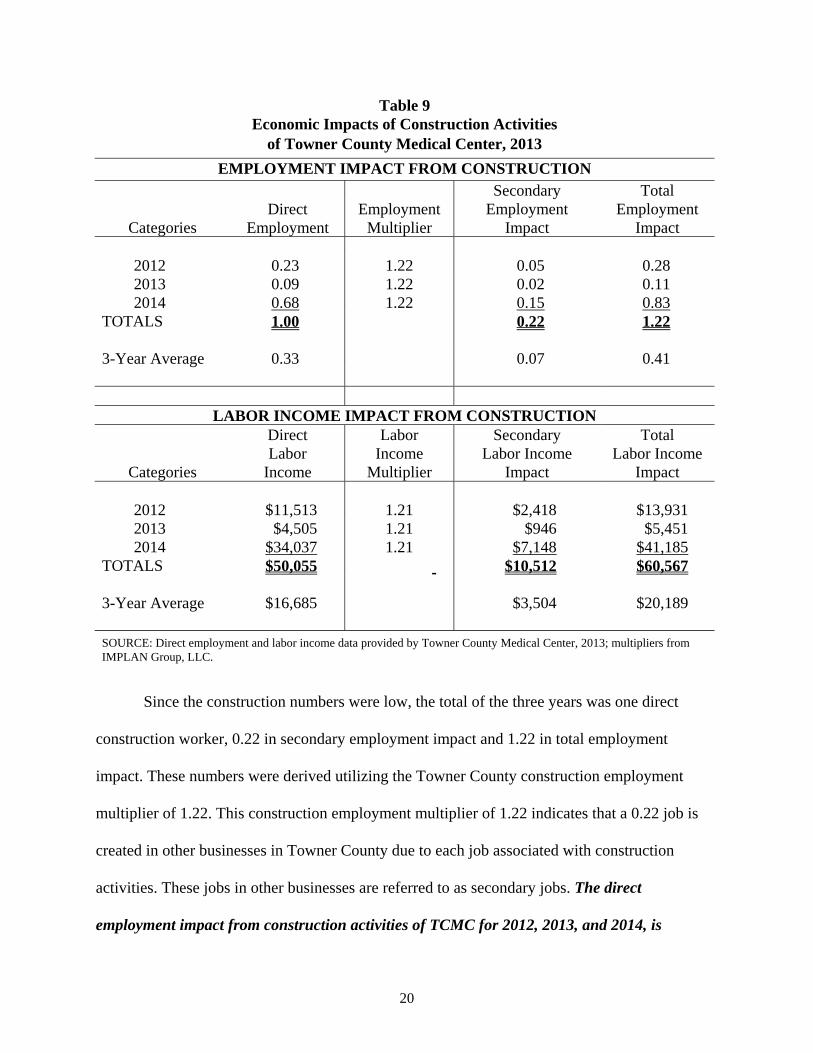
2013, and 2014. Data in Table 9 show estimated employment and labor income generated from
the construction, as well as the impacts.
Data from the IMPLAN model were utilized in estimating employment and labor income
for construction. The data were checked against industry standard and appear to be accurate
estimates. The construction or capital impacts only occur during the year the expenditures are
incurred. The $117,600 in construction costs for TCMC during 2012, 2013, and 2014 are
estimated to create one direct construction job over the three years with an estimated direct
construction labor income of $50,055 over the three years (Table 9). These are the estimated
direct employment and labor income impacts from the construction activities and not the total
construction impacts which will be estimated with multipliers.
20
Table 9 Economic Impacts of Construction Activities
of Towner County Medical Center, 2013
EMPLOYMENT IMPACT FROM CONSTRUCTION Secondary Total Direct Employment Employment Employment
Categories Employment Multiplier Impact Impact
2012 0.23 1.22 0.05 0.28 2013 0.09 1.22 0.02 0.11 2014 0.68 1.22 0.15 0.83
TOTALS 1.00 0.22 1.22
3-Year Average 0.33 0.07 0.41
LABOR INCOME IMPACT FROM CONSTRUCTION Direct Labor Secondary Total Labor Income Labor Income Labor Income
Categories Income Multiplier Impact Impact
2012 $11,513 1.21 $2,418 $13,931 2013 $4,505 1.21 $946 $5,451 2014 $34,037 1.21 $7,148 $41,185
TOTALS $50,055 $10,512 $60,567
3-Year Average $16,685 $3,504 $20,189
SOURCE: Direct employment and labor income data provided by Towner County Medical Center, 2013; multipliers from IMPLAN Group, LLC.
Since the construction numbers were low, the total of the three years was one direct
construction worker, 0.22 in secondary employment impact and 1.22 in total employment
impact. These numbers were derived utilizing the Towner County construction employment
multiplier of 1.22. This construction employment multiplier of 1.22 indicates that a 0.22 job is
created in other businesses in Towner County due to each job associated with construction
activities. These jobs in other businesses are referred to as secondary jobs. The direct
employment impact from construction activities of TCMC for 2012, 2013, and 2014, is

21
estimated to be one job over the three years, resulting in estimated secondary employment
impact of 0.22 jobs and total employment impact of 1.22 jobs over the three years.
The impact on labor income from construction is also presented in Table 9. The
construction labor income multiplier is 1.21, which means that for each dollar of labor income
paid to construction workers, another $0.21 of labor income is generated in other businesses in
Towner County. The direct labor income impact of TCMC from construction activities for
2012, 2013, and 2014 is estimated to be $50,055 over the three years, resulting in secondary
labor income impact estimated at $10,512 and total income impact estimated at $60,567 over
the three years.
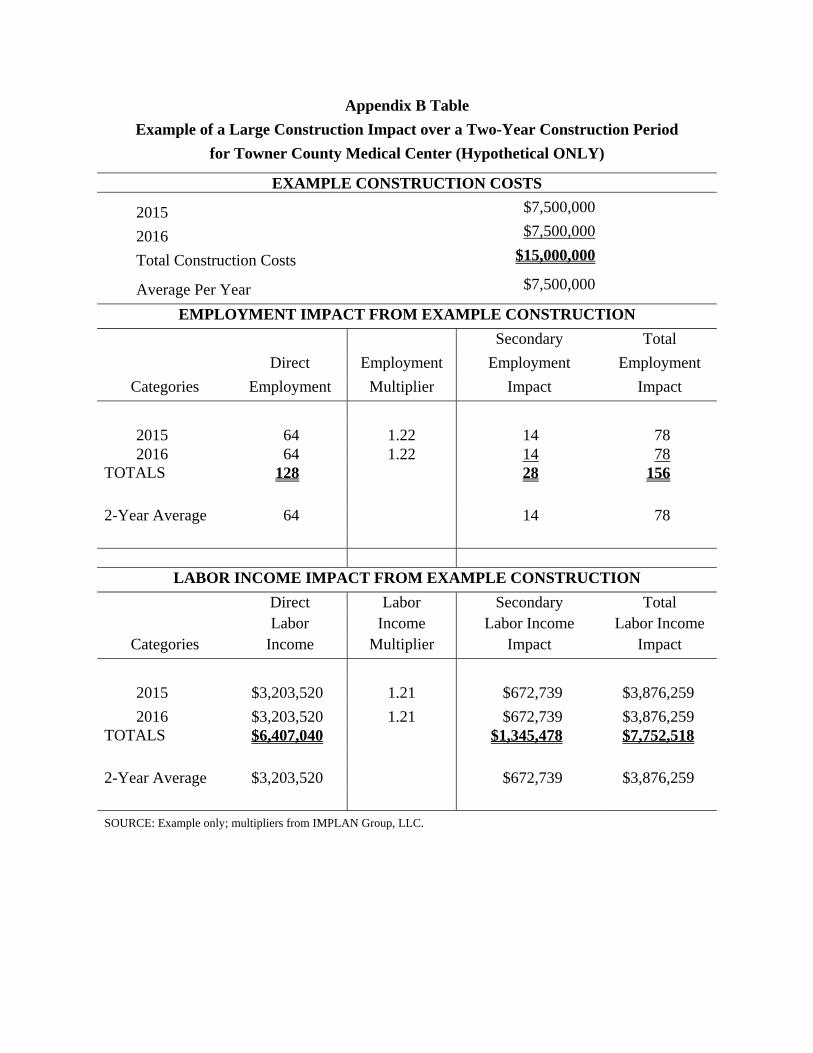
The building of a new facility or a major renovation could result in significant
construction costs and significant employment and labor income during the years of
construction. Appendix B is provided to show the construction impacts from construction of a
new facility or major renovation totaling $15,000,000 and built over a two-year period. This is
only a hypothetical example of how much impact a large construction project could provide in
economic impacts in Towner County. The results show that a $15.0 million new construction
project in the future would generate 64 direct construction employees, with 14 secondary
employees and 78 total employees each year of the two-year construction period. These, in turn,
would generate $3.2 million in direct labor income, $0.7 million in secondary labor income, and
$3.9 million in total labor income each year of the two-year construction period.
Summary
Both the operating activities and construction activities of a hospital impact the economy
of Towner County. Often overlooked can be the economic impact created from construction
activities. This report measures the impact that Towner County Medical Center will have on the

22
economy due to its normal operating activities and its construction activities. The operating
impact occurs every year; whereas, the construction impact occurs only during the construction
year.
In 2013, Towner County Medical Center employed 109 full-time and part-time and
contractual employees and generated $6.0 million in labor income (wages, salaries, and
benefits). When the secondary impacts are included, the total employment impact is 130 jobs and
the total labor income impact is $6.9 million. The employment and labor income impacts from
operating activities are annual and will continue each and every year that Towner County
Medical Center operates in the future. These are long term economic benefits of Towner County
Medical Center.
The impact from construction activities on the economy of Towner County is
estimated for the three years of construction activities. Towner County Medical Center has
indicated that $117,600 in construction will occur or have occurred during 2012, 2013, and 2014.
This construction resulted in one direct employee, 0.22 secondary employees, and 1.22 total
employees. Construction impact occurs only during the construction period.
Since the construction during this three-year period was minimal, a hypothetical example
is provided in the appendix to show the impact of a $15.0 million construction project over two
years. The results show that a $15.0 million new construction project in the future would
generate 64 direct construction employees, with 14 secondary employees and 78 total employees
each year of the two-year construction period. These, in turn, would generate $3.2 million in
direct labor income, $0.7 million in secondary labor income, and $3.9 million in total labor
income each year of the two-year construction period.

23
The impacts generated by Towner County Medical Center contribute to the local
economy of Towner County. The hospital employs local residents. The hospital and its
employees spend money in Towner County and generate a secondary impact. If the hospital
increases or decreases in size, the medical health of Towner County as well as the economic
health of Towner County can be affected. For the attraction of industrial firms, businesses, and
retirees, the local area should have quality hospital and health services. A quality hospital and
health sector can contribute to the overall economic health of Towner County, as well as the
overall medical health of the Towner County residents. Given this, not only does Towner County
Medical Center contribute to the health and wellness of the local residents but Towner County
Medical Center also contributes to the overall economic strength of Towner County.

24
References
Alward, G., Sivertz, E., Olson, D., Wagnor, J., Serf, D., and Lindall, S. Micro IMPLAN Software Manual. Stillwater, MN, University of Minnesota Press. 1989.
Chirilos, Thomas N. and Gilbert Nostel (1985). “Further Evidence on the Economic Effects of
Poor Health.” Review of Economics and Statistics. 67(1), 61-69. Doeksen, Gerald A., Tom Johnson, Diane Biard-Holmes and Val Schott (1988). “A Healthy
Health Sector is Crucial for Community Economic Development.” Journal of Rural Health. Vol. 14, No. 1, pp. 66-72.
Doeksen, Gerald A., Johnson, Tom, and Willoughby, Chuck. Measuring the Economic
Importance of the Health Sector on a Local Economy: A Brief Literature Review and Procedures to Measure Local Impacts. Southern Rural Development Center. SRDC Pub. No. 202. 1997.
Lyne, Jack (1988). “Quality-of-Life Factors Dominate Many Facility Location Decision.” Site
Selection Handbook. (33) 868-870. Lyne, Jack (1990). “Health Care and Education: Important QOL Factors, But Who’s Accurately
Measuring Them?” Site Selection Handbook. 35(5), 832-838. McGuire T. (1986). On the Relationship Between Infrastructure and Economic Development.
Stoney Brook: State University of New York. Miernyk, W.H. The Element of Input-Output Analysis. New York, NY; Random House. 1965. Minnesota IMPLAN Group, Inc. User’s Guide, Analysis Guide, Data Guide: IMPLAN
Professional Version 2.0 Social Accounting & Impact Analysis Software, 2nd Edition. June 2000.
Reginer, V. and L.E. Gelwicks (1981). “Preferred Supportive Services for Middle to Higher
Income Retirement Housing.” The Gerontologist. 21(1), 54-58. Scott, Loren C., Lewis H. Smith, and Brian Rungeling (1997). “Labor Force Participation in
Southern Rural Labor Markets.” American Journal of Agricultural Economics. 59(2), 266-274.
Siverts, Eric, Charles Palmer, Ken Walters, and Greg Alward. IMPLAN USER'S GUIDE. U.S.
Department of Agriculture, Forest Service, Systems Application Unit, Land Management Planning, Fort Collins, Colorado. 1983.
Toseland, R., and J. Rasch (1978). “Factors Contributing to Older Persons’ Satisfaction with
Their Communities.” The Gerontologist. 18(4), 395-402.

Appendix A
Economic Data Tables for Towner County from U. S. Census Bureau, County Business Patterns
and U. S. Department of Commerce, Regional Economic Information System, Bureau of Economic Analysis

A-1
Appendix A, Table 1 Full- and Part-Time Employment by Type of Employment and by Major Industry¹
for Towner County and North Dakota, 2011 and 2012 2011 2012
Towner County N. Dakota Towner County N. Dakota
Employment Categories No. of Jobs Percent Percent
No. of Jobs Percent Percent
Total FT & PT 1,785 100.0% 100.0% 1,803 100.0% 100.0%Wage & Salary 872 48.9% 78.8% 880 48.8% 79.8%Proprietors 913 51.1% 21.2% 923 51.2% 20.2%
Farm proprietors' 395 22.1% 5.0% 393 21.8% 4.7% Nonfarm proprietors'² 518 29.0% 16.2% 530 29.4% 15.5%By Industry:
Farm employment 493 27.6% 6.1% 520 28.8% 6.0%Nonfarm employment 1,292 72.4% 93.9% 1,283 71.2% 94.0%
Private 1,120 86.7% 82.9% 1,124 87.6% 83.9%Forestry, fishing, related (D) ** 0.9% (D) ** 0.9%Mining 0 0.0% 4.7% 0 0.0% 6.1%Utilities (D) ** 0.9% (D) ** 0.8%Construction (D) ** 8.2% (D) ** 8.8%Manufacturing (D) ** 6.2% (D) ** 6.0%Wholesale trade 73 6.5% 5.9% 77 6.9% 6.0%Retail trade 123 11.0% 13.6% 118 10.5% 13.0%Transp & warehousing (D) ** 5.1% (D) ** 5.8%Information (D) ** 1.9% (D) ** 1.8%Finance & ins 87 7.8% 6.4% 90 8.0% 5.9%RE rental & leasing 88 7.9% 3.6% 92 8.2% 3.5%Prof & techn svcs (D) ** 4.7% (D) ** 4.7%Mgmt of cos & enterp 0 0.0% 1.1% 0 0.0% 1.1%Admin & waste svcs (D) ** 4.3% (D) ** 4.2%Educational svcs 16 1.4% 1.4% 16 1.4% 1.3%Health care & social assist (D) ** 14.8% (D) ** 14.1%Arts, entert, & recreation 48 4.3% 1.7% (D) ** 1.7%Accom & food svcs 62 5.5% 8.4% (D) ** 8.3%Other svcs, not pub admin 74 6.6% 6.2% 76 6.8% 6.0%Sum of (D) Categories³ 549 49.0% 0.0% 655 58.3% 0.0%
Govt & govt enterprises 172 13.3% 17.1% 159 12.4% 16.1%
SOURCE: U. S. Department of Commerce, Regional Economic Information System, Bureau of Economic Analysis (www.bea.gov [July 2014]). (D) Not shown to avoid disclosure of confidential information, but estimates are included in totals. ** Due to non-disclosure of confidential data, no percentages are available. ¹ The estimates are based on the 2012 North American Industry Classification System (NAICS). ² Excludes limited partners. ³ All (D) categories have been totaled to show the amount of missing data from employment.

A-2
Appendix A, Table 2 Personal Income ($1,000s) by Major Source and Industry¹
for Towner County and North Dakota, 2011 and 2012 2011 2012
Towner County N. Dakota Towner County N. Dakota Income or Earnings Categories Income Percent Percent Income Percent Percent
Total Personal Income
Total earnings by place of work 64,028 100.0% 100.0%102,21
5 100.0% 100.0%Wage & salary disbursements 25,639 40.0% 67.4% 27,475 26.9% 64.9%Proprietors' income² 32,078 50.1% 16.9% 68,541 67.1% 21.1%Other 6,311 9.9% 15.7% 6,199 6.1% 14.0%
Earnings by Industry Farm 27,942 43.6% 8.4% 64,901 63.5% 13.9%Nonfarm 36,086 56.4% 91.6% 37,314 36.5% 86.1%
Private 28,548 79.1% 80.5% 30,346 81.3% 82.7%Forestry, fishing, related (D) ** 0.6% (D) ** 0.5%Mining 0 0.0% 9.8% 0 0.0% 12.6%Utilities (D) ** 2.3% (D) ** 1.9%Construction (D) ** 10.8% (D) ** 11.5%Manufacturing (D) ** 7.3% (D) ** 6.8%Wholesale trade 3,986 14.0% 9.2% 4,310 14.2% 9.3%Retail trade 1,685 5.9% 8.3% 1,608 5.3% 7.7%Transp & warehousing (D) ** 7.1% (D) ** 8.3%Information (D) ** 2.5% (D) ** 2.2%Finance & ins 2,371 8.3% 5.9% 2,795 9.2% 5.2%RE rental & leasing 247 0.9% 3.0% 291 1.0% 2.8%Prof & techn svcs (D) ** 5.4% (D) ** 5.5%Mgmt of cos & enterp 0 0.0% 1.9% 0 0.0% 1.8%Admin & waste svcs (D) ** 2.6% (D) ** 2.5%Educational svcs (L) ** 0.6% (L) ** 0.5%Health care & social assist (D) ** 14.9% (D) ** 13.4%Arts, entert, & recreation 217 0.8% 0.4% (D) ** 0.4%Accom & food svcs 758 2.7% 3.3% (D) ** 3.3%Other svcs, not pub admin 2,887 10.1% 4.1% 3,062 10.1% 3.7%Sum of (D)&(L) Categories³ 16,397 57.4% 0.0% 18,280 60.2% 0.0%
Govt & govt enterprises 7,538 20.9% 19.5% 6,968 18.7% 17.3%
SOURCE: U. S. Department of Commerce, Regional Economic Information System, Bureau of Economic Analysis (www.bea.gov [July 2014]). (D) Not shown to avoid disclosure of confidential information, but estimates are included in totals. (L) Less than $50,000, but the estimates for this item are included in the totals. ** Due to non-disclosure of confidential data, no percentages are available. ¹ The estimates are based on the 2012 North American Industry Classification System (NAICS). ² Proprietors' income includes the inventory valuation adjustment and capital consumption adjustment. ³ All (D) and (L) categories have been totaled to show the amount of missing data from private earnings.
A-3
Appendix A, Table 3 Employment and Payroll in Towner County and the State of North Dakota
Employment
Health Services Total County Hlth Svcs as a % of Total County
Employment % of Total State
Employment
2002 100-249 677 14.8% - 36.8% 19.3%
2003 100-249 730 13.7% - 34.1% 19.8%
2004 100-249 753 13.3% - 33.1% 19.4%
2005 100-249 784 12.8% - 31.8% 18.6%
2006 100-249 623 16.1% - 40.0% 18.4%
2007 100-249 567 17.6% - 43.9% 17.5%
2008 100-249 608 16.4% - 41.0% 17.0%
2009 100-249 577 17.3% - 43.2% 18.0%
2010 100-249 578 17.3% - 43.1% 18.6%
2011 100-249 539 18.6% - 43.2% 18.4%
2012 100-249 507 19.7% - 49.1% 17.4% % Change from
2002 to 2012 -33.5%
Payroll ($1,000s)
Health Services Total County Hlth Svcs as a % of Total County
Payroll % of Total State
Payroll
2002 (D) 12,697 ** 20.8%
2003 (D) 12,849 ** 21.0%
2004 (D) 13,500 ** 20.9%
2005 (D) 13,595 ** 20.7%
2006 (D) 12,898 ** 19.9%
2007 (D) 11,695 ** 18.6%
2008 (D) 14,193 ** 18.4%
2009 (D) 14,804 ** 19.5%
2010 (D) 14,873 ** 19.5%
2011 (D) 14,484 ** 18.7%
2012 (D) 15,568 ** 17.0% % Change from
2002 to 2012 18.4% SOURCE: U.S. Census Bureau, County Business Patterns; 2002-2012 based upon NAICS (www.census.gov [July 2014]). 1 The Health Care and Social Assistance NAICS sector comprises establishments providing health care and social assistance for individuals. The sector includes both health care and social assistance because it is sometimes difficult to distinguish between the boundaries of these two activities. Industries in this sector are arranged on a continuum starting with those establishments providing medical care exclusively, continuing with those providing health care and social assistance, and finally finishing with those providing only social assistance. The services provided by establishments in this sector are delivered by trained professionals. All industries in the sector shared this commonality of process, namely, labor inputs of health practitioners or social workers with the requisite expertise. Many of the industries in the sector are defined based on the educational degree held by the practitioners included in the industry. ² Data are excluded for self-employed persons, employees of private households, railroad employees, agricultural production workers, and for most government employees (except for those working in wholesale liquor establishments, retail liquor stores, Federally-chartered savings institutions, Federally-chartered credit unions, and hospitals). (D) Withheld to avoid disclosing data for individual companies; data are included in higher level totals Yellow highlighted cells are ranges in order to preserve the privacy of the health care services industry.

Appendix B
Hypothetical Example of Econmic Impact of $15,000,000 Construction Project over a Two-Year Period in Future
Appendix B Table
Example of a Large Construction Impact over a Two-Year Construction Period
for Towner County Medical Center (Hypothetical ONLY)
EXAMPLE CONSTRUCTION COSTS
2015 $7,500,000
2016 $7,500,000
Total Construction Costs $15,000,000
Average Per Year $7,500,000
EMPLOYMENT IMPACT FROM EXAMPLE CONSTRUCTION
Secondary Total
Direct Employment Employment Employment
Categories Employment Multiplier Impact Impact
2015 64 1.22 14 78 2016 64 1.22 14 78
TOTALS 128 28 156
2-Year Average 64 14 78
LABOR INCOME IMPACT FROM EXAMPLE CONSTRUCTION
Direct Labor Secondary Total Labor Income Labor Income Labor Income
Categories Income Multiplier Impact Impact
2015 $3,203,520 1.21 $672,739 $3,876,259
2016 $3,203,520 1.21 $672,739 $3,876,259 TOTALS $6,407,040 $1,345,478 $7,752,518
2-Year Average $3,203,520 $672,739 $3,876,259
SOURCE: Example only; multipliers from IMPLAN Group, LLC.

Appendix C
IMPLAN Software and Data from Minnesota IMPLAN Group, Inc. (MIG):
Model and Data Used to Derive Multipliers

C-1
IMPLAN Software and Data from Minnesota IMPLAN Group, Inc. (MIG): Model and Data Used to Derive Multipliers
A Review of Input-Output Analysis
Input-output (I/O) (Miernyk, 1965) was designed to analyze the transactions among the
industries in an economy. These models are largely based on the work of Wassily Leontief
(1936). Detailed I/O analysis captures the indirect and induced interrelated circular behavior of
the economy. For example, an increase in the demand for health services requires more
equipment, more labor, and more supplies, which, in turn, requires more labor to produce the
supplies, etc. By simultaneously accounting for structural interaction between sectors and
industries, I/O analysis gives expression to the general economic equilibrium system. The
analysis utilizes assumptions based on linear and fixed coefficients and limited substitutions
among inputs and outputs. The analysis also assumes that average and marginal I/O coefficients
are equal.
Nonetheless, the framework has been widely accepted and used. I/O analysis is useful
when carefully executed and interpreted in defining the structure of an area, the
interdependencies among industries, and forecasting economic outcomes.
The I/O model coefficients describe the structural interdependence of an economy. From
the coefficients, various predictive devices can be computed, which can be useful in analyzing
economic changes in a state, an area or a county. Multipliers indicate the relationship between
some observed change in the economy and the total change in economic activity created
throughout the economy.
The basis of IMPLAN was developed by the U. S. Forest Service to construct
input/output accounts and models. The complexity of this type of modeling had hindered
practitioners from constructing models specific to a community requesting an analysis. The

C-2
University of Minnesota utilized the U.S. Forest Service model to further develop the
methodology and expand the data sources to form the model known as IMPLAN. The founders
of IMPLAN, Scott Lindall and Doug Olson, joined the University of Minnesota in 1984 and, as
an outgrowth of their work with the University of Minnesota, entered into a technology transfer
agreement with the University of Minnesota that allowed them to form Minnesota IMPLAN
Group, Inc. (MIG).
Minnesota IMPLAN Group, Inc. (MIG) – IMPLAN Software and Data
At first, MIG focused on database development and provided data that could be used in
the Forest Service version of the software. In 1995, MIG took on the task of writing a new
version of the IMPLAN software from scratch that extended the previous Forest Service version
by creating an entirely new modeling system – an extension of input-output accounts and
resulting Social Accounting Matrices (SAM) multipliers. Version 2 of the new IMPLAN
software became available in May of 1999. MIG has continued to develop the software and now
has available IMPLAN Version 3 Software System, the new economic impact assessment
software system.
With IMPLAN Version 3 software, MIG changed the packaging of products. Versions 3
utilizes 2007 or later data. When data are ordered, the data cost plus shipping are your only costs.
Version 3.0 software and the new IMPLAN appliance are included in the cost of the data. There
are no additional fees to upgrade to IMPLAN Version 3.0. Data files are licensed to an
individual user. Version 2 is no longer compatible with 2008 and later data sets.
Version 3 allows the user to do much more detailed analyses. Users can continue to
create detailed economic impact estimates. Version 3.0 takes the analysis further, providing a
new method for estimating regional imports and exports is being implemented - a trade model.

C-3
IMPLAN can construct a model for any state, region, area, county, or zip code area in the United
States by using available national, state, county, and zip code level data. Impact analysis can be
performed once a regional input/output model is constructed.
For more information about Minnesota IMPLAN Group, Inc., contact MIG by phone at
651-439-4421, by email at [email protected], or review their website at www.implan.com.
IMPLAN Multipliers
Five different sets of multipliers are estimated by IMPLAN, corresponding to five
measures of regional economic activity. These are: total industry output, personal income, total
income, value added, and employment. Two types of multipliers are generated. Type I
multipliers measure the impact in terms of direct and indirect effects. Direct impacts are the
changes in the activities of the focus industry or firm, such as the closing of a hospital. The focus
business changes its purchases of inputs as a result of the direct impacts. This produces indirect
impacts in other business sectors. However, the total impact of a change in the economy consists
of direct, indirect, and induced changes. Both the direct and indirect impacts change the flow of
dollars to the households. Subsequently, the households alter their consumption accordingly. The
effect of the changes in household consumption on businesses in a community is referred to as
an induced effect. To measure the total impact, a Type II (or Type SAM) multiplier is used. The
Type II multiplier compares direct, indirect, and induced effects with the direct effects generated
by a change in final demand (the sum of direct, indirect, and induced divided by direct).