towards scalable interfaces using spatial cues for document …€¦ · university of canterbury...
TRANSCRIPT

Towards scalable interfaces using spatial cues for
document management
Eddie EdwardsDepartment of Computer Science
University of CanterburyNew Zealand
Supervisor: Dr. Andy Cockburn
November 2, 2001

Abstract
Document management is an unavoidable task. Previous research evaluated the effect ofbuilding document management systems exploiting spatial memory. It was proven that spatialmemory enhances retrieval tasks for systems dealing with a small number of data items. Weinvestigate the effect of spatial cues with scalable systems. We present EDM (EnhancedData Mountain), a scalable picture management system based on the Data Mountain byRobertson, Tesle, Tversky & Mullet (1991). Our system exploits the use of spatial cues andspatial memory in retrieving images. This report explains the design methodology behindEDM, in addition to an evaluation that compares EDM with Microsoft’s My Pictures (MP)system for managing pictures. Results show that our subjects were faster at retrieving picturesin the display when using the MP interface, but not significantly so. As expected, the moretime subjects spent browsing through the picture groups, the faster they became at retrieval.Subjective satisfaction rating showed an overall preference favouring the MP system over theEDM system. A conclusive statement can not be made regarding the exploitation of spatialmemory in scalable systems.

Contents
1 Introduction 21.1 Overview . . . . . . . . . . . . . . . . . . . . . . . . . . . . . . . . . . . . . . 21.2 Motivation and Problem Definition . . . . . . . . . . . . . . . . . . . . . . . . 31.3 Report Structure . . . . . . . . . . . . . . . . . . . . . . . . . . . . . . . . . . 4
2 Related Work 52.1 Spatial Memory . . . . . . . . . . . . . . . . . . . . . . . . . . . . . . . . . . . 52.2 Document Management . . . . . . . . . . . . . . . . . . . . . . . . . . . . . . 62.3 Prior Work on Picture Management . . . . . . . . . . . . . . . . . . . . . . . 10
3 System design 123.1 Design Phases . . . . . . . . . . . . . . . . . . . . . . . . . . . . . . . . . . . . 13
3.1.1 Design Alternatives . . . . . . . . . . . . . . . . . . . . . . . . . . . . 133.1.2 Implementation and Refinements . . . . . . . . . . . . . . . . . . . . . 163.1.3 Final Prototype . . . . . . . . . . . . . . . . . . . . . . . . . . . . . . . 20
3.2 Implementation . . . . . . . . . . . . . . . . . . . . . . . . . . . . . . . . . . . 23
4 Evaluation study 264.1 Experimental Design . . . . . . . . . . . . . . . . . . . . . . . . . . . . . . . . 264.2 Results . . . . . . . . . . . . . . . . . . . . . . . . . . . . . . . . . . . . . . . . 29
4.2.1 Image Revival Task . . . . . . . . . . . . . . . . . . . . . . . . . . . . 304.2.2 Browsing versus Retrieval . . . . . . . . . . . . . . . . . . . . . . . . . 304.2.3 Subjective Measures . . . . . . . . . . . . . . . . . . . . . . . . . . . . 314.2.4 Expert Timing . . . . . . . . . . . . . . . . . . . . . . . . . . . . . . . 32
4.3 Confounding Factors . . . . . . . . . . . . . . . . . . . . . . . . . . . . . . . . 324.4 Discussion and Further Work . . . . . . . . . . . . . . . . . . . . . . . . . . . 33
5 Conclusion 36
1

Chapter 1
Introduction
“It is through science that we prove, but through intuition that we discover.”
—Henri Poincare
1.1 Overview
As computers become widely used in various areas of science, arts and entertain-ment, the need for effective document management systems becomes imperative.This report addresses the main issues involved in retrieving large numbers of doc-uments using spatial cues.
Document management systems have evolved dramatically over the last decade.Until the the advent of the graphical user interfaces in the early 1980s, users usedtext-based interfaces to manage their documents. Nowadays, there are sufficientresources to support a complex – 3D, if required – graphical interface in real time.From simple text-based file management interfaces, document management hasevolved to include a suite of specialised systems, each built specifically to manageone type of document.
The Data Mountain is a document management system that attempts to easeexisting problems in document managing by exploiting the advantages of humans’spatial memory. It has been proven to be a more effective way of browsing andnavigating bookmarks than the existing bookmarking systems (Robertson, Czer-winski, Larson, Robbins, Thiel & van Dantzich 1998). Applications of the DataMountain not only apply to visualising web-pages, but can also be used to managepersonal collections of pictures. Figure 1.1 shows Cockburn & McKenzie’s (2001)implementation of the Data Mountain on which our system was based on.
As digital cameras become cheaper and more popular, it is estimated that theaverage user will have hundreds, if not thousands, of pictures on their personalcomputer. With this number of documents, an effective picture managementsystem must be implemented.
2

Figure 1.1: The Data Mountain developed by Cockburn & McKenzie (2001)
This research uses the problem of picture management as a platform for exploringscalable spatial memory. Our picture management system is based on the DataMountain.
1.2 Motivation and Problem Definition
The results of the evaluation included in Robertson et al. (1998) indicate that theData Mountain is significantly more effective that Internet Explorer’s Favouritesmechanism. This significant difference is mainly due to the Data Mountain’seffective use of spatial memory. However, The results of the evaluation of theData Mountain included in Cockburn & McKenzie (2001) indicate that the DataMountain becomes significantly less effective as the number of pages increase. Thissystem limitation motivated us to modify the behaviour of the Data Mountain tomanage larger numbers of documents and hence resolve the scalability issues. Wewere also interested in discovering whether spatial memory hold in a system thatdoes not show all data on one screen. Our system use scrollbars as the main means
3

of navigation and consequently, not all the documents show on the screen at anyone time. We were interested to know whether users would still be able to formassociations between objects and their location on a large system that does notshow all the documents at once.
1.3 Report Structure
Chapter 2 gives an overview of the previous work undertaken in the area of spatialmemory in conjunction with document management systems.
Chapter 3 explains the iterative design process that resulted with the final proto-type; EDM – the Enhanced Data Mountain.
Chapter 4 discusses the evaluation study undertaken to assess the effectivenessof the system along with the results, discussion, system limitation and potentialareas of further work.
Chapter 5 summaries the results and proposes some ideas for further research.
4
Chapter 2
Related Work
“Copy from one, it’s plagiarism; copy from two, it’s research.”—Wilson Mizner, screenwriter.
This chapter presents the previous work that was carried out in the areas ofdocument management system, concentrating on those exploiting spatial memory.It discusses the previous evaluations of the Data Mountain from which our systemevolved.
2.1 Spatial Memory
Spatial memory refers to the memory of spatial information, such as the geograph-ical layout of cities or the interior layout of a building. Spatial memory involvesremembering the location of items, by forming associations between the items andtheir environment. One of the scientific papers that describes the different typesof memory (spatial, long-term, short-term, recall, emotional, etc) is by Trumbo(1998). The author uses multimedia as a tool to illustrate the difference betweenthe different memory types and uses. Trumbo states that multimedia/HCI design-ers face major challenges “The challenge for the multimedia designer is to createan environment of sensory elements that is memorable”. It is important to creatememorable multimedia and interfaces to solve the problem of overloading users’memory. Creating system depicting memorable environments eases the task ofunderstanding those systems. It also allows users to form effective associationsbetween the environment and the newer items.
Dumais & Jones (1985) conducted an experiment comparing the times and correct-ness ratio obtained from retrieving thirty documents (news articles) per subjectusing symbolic and spatial representation of the different documents. The aimof the experiment was to assess spatial memory in building computer interfaces.The subjects were presented by a statement that described a news article and they
5

were asked to retrieve the documents they have previously filed (placed). The pa-per compares four filing schemes: name only, location only, name and locationspatially separated, and name and location combined in the same area.
Surprisingly, results show that the location only technique performed significantlyworse than the others. The authors explain the reasons behind this unexpected re-sult in detail. Firstly, the experiment does not separate between recallability andrecognisability of the news articles, which makes determining the exact reasonsbehind the failure of spatial memory uncertain. Secondly, the items being newarticles may have affected the experiment as news articles are not naturally spa-tially recognisable. Third, the news articles were filed according to their textualcontents and not their visual appearance. This is also believed to have affectedthe speed and accuracy of retrieval.
However, the authors assert that spatial memory can be used to guide users tothe general location of the correct item, but cannot be employed to retrieve theexact location. Also, the authors do claim that filing documents on a computerhas more degrees of freedom. In computers, filing may be based on several cuesand matrices including size, colour, shape, name, location, content, etc.
Another evaluation study (Donelson 1978) investigated the effect of spatial mem-ory in navigating through a Spatial Database Management System (SDMS). Inthis evaluation, the subjects used a joystick attached to a chair to navigate thedatabase, to resemble the navigation of an airplane, thereby utilising the subjects’knowledge about space and direction. The author claims navigating and usingthe spatial database system is similar to managing one’s items on a desktop. Ashortcoming of this paper is the lack of an empirical evaluation. However, the au-thors conclude that “user response to SDMS has confirmed spatial managementof information as an outstanding concept”. In summary, the paper presents a newdomain that can benefit from spatial memory.
2.2 Document Management
The most common Document Management Systems (DMSs) use hierarchical struc-tures to organise data. Despite of the simplicity and intuition of the approach,hierarchical structures impose restrictions on the users’ mental model of how thedocuments should be organised. Furthermore, these systems separate documentsfrom the activities that users perform on them. As we will see, most DMSs try tocontradict the metaphor and organise documents using new techniques aimed atmore effective and efficient management. Our work follows the trend and presentsa non-hierarchical organisation mechanism.
Research has been conducted into visualising hierarchical structures in a moreappealing way, such as Cone Trees, shown in Figure 2.1. Cone Trees are 3Danimated trees aimed at visualising hierarchical information with efficient use of
6

Figure 2.1: A screen shot of Cone Trees
screen space. Cone Trees extends the simple hierarchical structure by introducingthe third dimension and hence the illusion of space. The animation techniques shiftthe load from the user’s cognitive memory to spatial recognition. The approachhas definite potential in visualising any kind of hierarchical structure, such as a filestructure. Analytical space-efficiency comparisons between two-dimensional andthree-dimensional trees favour a 3D tree. The authors claim that “the emergingtechnologies of 3D and interactive animation, and the human perceptual systemcan be effectively exploited to improve management and access of large informationspaces.” However, we see no proof of this claim. No empirical evaluations assessthe effectiveness of Cone Trees with regard to ease-of-use and time to achievecertain tasks (Robertson, Mackinlay & Card 1991).
Research into developing new systems for window management, can also be ap-plied to document management systems. Robertson, van Dantzich, Czerwinski,Hinckley, Thiel, Robbins, Risden & Gorokhovsky (2000) present a 3D windowmanager system called the Task Gallery, shown in Figure 2.2. The system depictsa room where windows are hung on the walls as drawings are hung on the wallsof an art gallery. The user’s navigations are designed to be similar to those of
7

Figure 2.2: A screen shot of the Task Gallery
navigating through a real art gallery. Users can walk around entering differentrooms of the gallery. In addition, they can look up, down, left and right to seethe windows that are hung on each of the walls, ceiling and floor. Some empiricalexperiments were conducted during the design and implementation phases to sup-port the design decisions. However, there was a lack of experimentation showingthe merits, or otherwise, of using the Task Gallery to using a normal windowsmanagement system. In summary, the paper presents a novel approach to win-dow management which exploits spatial memory and human visual perceptionand knowledge of 3D spaces. Like our system, the Task Gallery uses a real-worldmetaphor (rooms and art galleries) to create a memorable environment aiding theuser’s cognitive ability and exploiting spatial memory.
Another system that relates to our research is Workscape, shown in Figure 2.3.The system exploits the advantages of the third dimension and the illusion ofdepth. The designers of Workscape assert that “the typical two-dimensional dis-play of documents on a screen wouldn’t provide the rich working environment wedesired”. Interestingly, the interface’s ‘look and feel’ was inspired by Italian Re-naissance paintings. These 14th and 15th centuries’ paintings used depth cues andthree-dimensionality in ways that were not seen before. The designers illustrate
8

Figure 2.3: A screen shot of Workscape
the similarity between the visual design of their system and those paintings usinggraphical examples. The main advantages of the design of Workscape is that it isable to deal with hundreds of, always open, always displayed, documents at once.This feature makes Workscape usable for managing a larger suite of documents:both text and image (Ballay 1994). Workscape is closely related to the systemwe have developed. We also wanted to maintain hundreds, if not thousands, ofalways open documents at once. However, we also seek effective categorisation ofdocuments which was a feature that was provided by Workscape.
As we will explain in detail in chapter 3, our system is based on the Data Moun-tain, an Internet bookmarks management system developed by Robertson et al.
9
(1998), called the Data Mountain. The Data Mountain is based on the use of 3Danimation and spatial memory. The system depicts a mountain on which peoplecan arbitrarily place the thumbnails of the pages being bookmarked. Texture andcolours are added to the structure of the mountain in order to provide visual cuesvia landmarks optimising the use of spatial memory. The authors clearly indicatethat the motivation behind their approach is to minimise the user’s cognitive loadby shifting it to the human perceptual system and the natural knowledge of 3Dspaces. A user study compared the effectiveness of the Data Mountain, and Inter-net Explorer’s (IE) Favourites bookmarking scheme. The Data Mountain provedto be more effective as a bookmarking system than IE’s Favourites. Also, the usersatisfication measures showed a reliable preference towards the Data Mountain.The authors claim that the reason behind the success of the Data Mountain is ofa combination of three-dimensionality and spatial memory.
An empirical evaluation by Cockburn & McKenzie (2001), compared the three-dimensional Data Mountain to a two-dimensional Data Mountain, where thethumbnails do not get scaled if they are pushed up the mountain. The exper-iment also analysed the correlation between the number of thumbnails and thetime to retrieve pages. The experiment showed that the reason behind the successof the Data Mountain is spatial memory only, as there was no significant differ-ence between 2D and 3D Data Mountains. However, users preferred the 3D DataMountain.
A number of design limitations were identified from the experiments of Cockburn& McKenzie (2001) and Robertson et al. (1998) and the resolution of these limi-tations were applied to our picture management system. From Robertson et al.’s(1998) experiment we noted that a significant number of users requested a ‘group-ing’ feature that would allow them to group related items. The coloured texturedcircles occupying different spaces on the mountain’s body, did not offer an obviousvisual cue that aids the users in grouping the related bookmarks. From Cockburn& McKenzie’s (2001) experiment we have noticed that the Data Mountain wouldnot be able to manage more than a 100 page efficiently. We have also noticed thatthe use of 3D is preferred by the majority of users, although it does not influencethe efficiency or effectiveness of the retrieval tasks.
2.3 Prior Work on Picture Management
A few papers discuss image indexing, and query-based image retrieval systems.Of these papers, the most relevant paper to our research is the paper by Rodden,Basalaj, Sinclair & Wood (2001) which discuss the organisation of pictures. Theyquestion whether organising by similarity assists in browsing and locating images.The effectiveness of organising images according to their similarity versus present-ing pictures randomly – sorting by name for example, is compared subjectively.They found that similarity of organisation aid users in retrieving images. However,
10
one draw-back of grouping similar images is that images appear to merge makingit harder and slower to identify images. It would have been beneficial to see someempirical timing tests giving insight on efficiency merits, or otherwise, of groupingsimilar pictures. In general the paper presents a good research experiment that is“of interest to anyone designing a system that involves presenting sets of imagesto users”.
To date, no picture management systems have been scientifically proposed. How-ever, since the photographic industry was revolutionised by the commercialismof digital camera in 1995, the need for effective picture management systems be-came the next logical step. The lack of effective picture management systemscontributed to our incentive to carry out our research.
11

Chapter 3
System design
“Inventions have long since reached their limit, and I see no hope for furtherdevelopment.”
—Julius Sextus Frontinus 1
Our aim is to enhance the Data Mountain, which was proven to be an effectivedocument management system. We expect that in a few years, digital cameraowners would have thousands of pictures on their desktop computer. We aim toscale the Data Mountain to handle the requirements of digital camera owners.
There are some essential properties that we intended to have in our EnhancedData Mountain (EDM) system:
Scalability. Our main goal is to design a system that can potentially handle asmany pictures as required. For experimental use, we have limited our prototypeto handling 1000 thumbnails.
Spatial cues. Our aim is to incorporate the power and speed of spatial memoryby supplying effective spatial cues.
Visual cues. In order to effectively group pictures, pictorial cues have to be pro-vided to aid the user in finding groups and retrieving pictures.
Effective Grouping. In order to deal with thousands of pictures, grouping of pic-tures becomes imperative. Users have to be able to group their pictures in anyarbitrary way. The system has to support the flexibility of grouping.
Ease of navigation. Ease of comprehension and use of the prototype is paramount.Navigating the system has to be simple and easy.
Metaphor correspondence. It is important that the system corresponds to themetaphor it depicts. The current metaphor is the metaphor of a mountain.
1Highly regarded engineer in Rome, 1st century A.D.
12
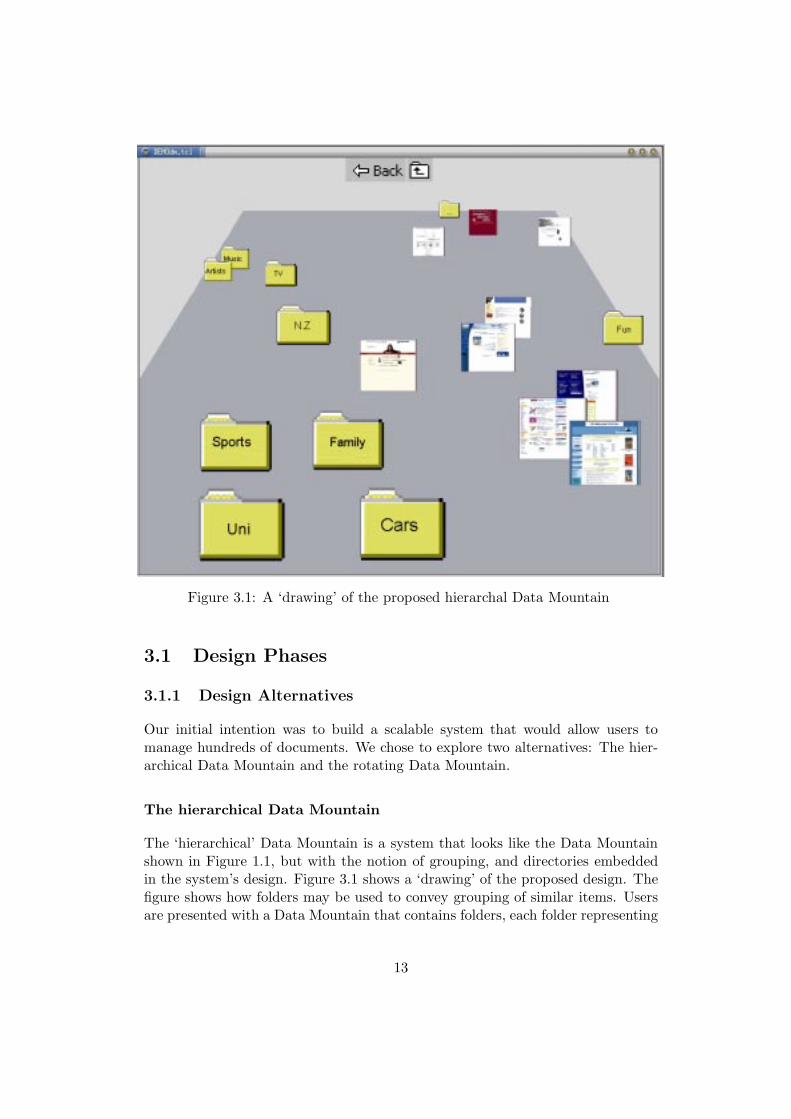
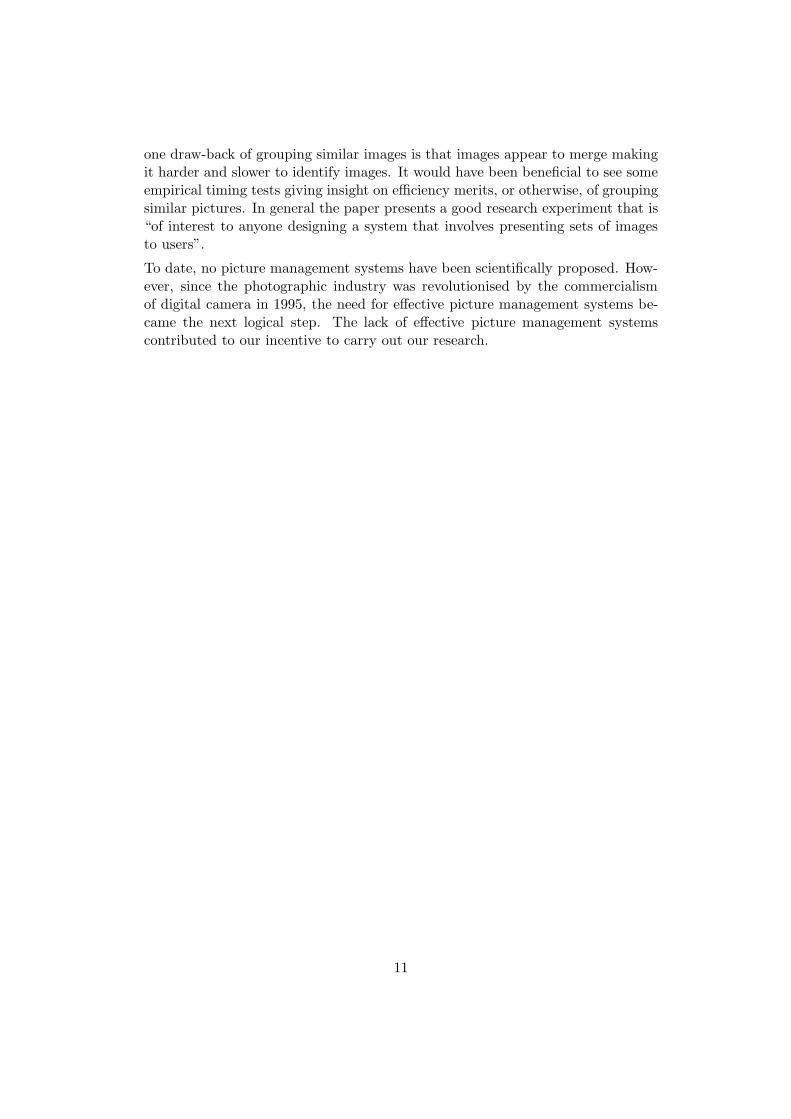
Figure 3.1: A ‘drawing’ of the proposed hierarchal Data Mountain
3.1 Design Phases
3.1.1 Design Alternatives
Our initial intention was to build a scalable system that would allow users tomanage hundreds of documents. We chose to explore two alternatives: The hier-archical Data Mountain and the rotating Data Mountain.
The hierarchical Data Mountain
The ‘hierarchical’ Data Mountain is a system that looks like the Data Mountainshown in Figure 1.1, but with the notion of grouping, and directories embeddedin the system’s design. Figure 3.1 shows a ‘drawing’ of the proposed design. Thefigure shows how folders may be used to convey grouping of similar items. Usersare presented with a Data Mountain that contains folders, each folder representing
13

Figure 3.2: Two user views of the rotating mountain
Figure 3.3: A ‘drawing’ of the proposed rotating Data Mountain
an independent Data Mountain holding related documents. Double-clicking on afolder opens the Data Mountain held by that folder, resulting in a figure similarto Figure 1.1 with some additional controls, an ‘up one level’ and a ‘back’ button.The basic operations of the Data Mountain are still supported. Holding downthe left mouse button while dragging a thumbnail moves the selected thumbnail.Holding down the right mouse button on the selected thumbnail magnifies it.
14

Scalability. The system can maintain thousands of pictures with unlimited group-ing. The system can also support groups within groups.
Spatial cues. The system allows the placement of thumbnails and folders within thespatial space provided. The system provides spatial cues for each level individually.once a folder is clicked, the position of folders and thumbnails are no longer visiblemaking the spatial cues ineffective.
Visual cues. It was suggested in the design to add background images to themountain, which would have provided visual cues. Again, clicking on the folderschanges the background images distorting the visual cues provided.
Effective Grouping. The folders provide an easy hierarchical structure allowing anarbitrary number of groups.
Ease of navigation. Double clicking on the folders provide an easy method oftraversing the hierarchy downwards. The two buttons at the top (see Figure3.1) allow upwards traversal of the the hierarchy. Although the system provideseasy navigation for simple tasks, the hierarchical design provides detail, but doesnot offer the overall context of the structure which makes performing advancednavigation difficult. For example, moving from one folder located deep within thehierarchy to another can take time and mental effort. In most cases, the user hasto navigate all the way up to the root level and then locate the desired folderwhich may be nested deep within the hierarchy.
Metaphor correspondence. Opening a folder opens another mountain within thecurrent one. This feature violates the metaphor of a real mountain.
The rotating Data Mountain
The second alternative was to make the Data Mountain not just an elevated plane,but to extend the users’ mobility, allowing them to rotate around the mountain.The idea of using the third dimension as a means of expanding the availableworking space was inspired by the research on Cone Trees. Figure 3.2 shows twopossible user viewpoints of the mountain. The same basic controls of moving andmagnifying thumbnails are provided. Additionally, a ‘pan left’ and ‘pan right’buttons act as the main means of rotating (scrolling) around the mountain. Ad-ditional features such as a compass widget (see Figure 3.3) will be added to thetop of the screen to indicate the users’ relative position and heading, preventingthem from losing orientation. A gestalt viewer was also considered to act as afaster way of viewing other sides of the mountain (see Figure 3.3). Initially, ouraim was to make the Data Mountain a system capable of handling an unlimitednumber of documents, but with a limited number of faces, the mountain wouldeventually become cluttered. To overcome this problem, a radius-control featurehas been added to the design, allowing users to increase or decrease the radius ofthe mountain to suit their personal needs. We also thought of using the additional
15

space to the left of the mountain to provide tips on how to use the system if itwere to be commercially deployed.
Scalability. The radius of the mountain controls the supported number of pictures.There is no forced limit on the radius of the mountain. However, for the evaluationpurposes, we limited our prototype to 1000 pictures. The radius-control featurewas never implemented.
Spatial cues. The rotating behaviour of the mountain may degrade the perfor-mance of users as parts of the data space are not visible at any one time.
Visual cues. Background images appearing behind the mountain were proposed.Background images provide visual cues allowing the formation of associationsbetween the thumbnails and their location on the mountain.
Effective Grouping. At this point, the association between the proposed back-ground image and the thumbnails provides a loose grouping mechanism.
Ease of navigation. Scrollbars provide a familiar and easy way of navigating thespatial space provided. The gestalt viewer provides a quick way of rotating aroundthe mountain and it facilitates moving from one group to any other via single click.
Metaphor correspondence. This design corresponds well to the metaphor of themountain. The mountain is now a full 3D mountain where users can rotate aroundit.
Enhancing and refining this design was supported by the facts listed above. Also,because this design adapts the photo album metaphor better than the ‘hierarchi-cal’ alternative.
3.1.2 Implementation and Refinements
The next few sections discuss the initial implementation of the ‘rotating’ DataMountain and refinements that were made to the design. The different phases ofthe design are also discussed.
Initial implementation
In addition to the compass widget, some visual cues were included in the initialimplementation, shown in Figure 3.4, to ensure that users maintained their ori-entation in relation to the mountain. Background images were added to achievethis goal, as these allow users to form associations between the background im-age and the locations of the different thumbnails. Thumbnails that semanticallyrelate to the background image can be grouped together into the space wherethe related background is visible. For example, users may place their holiday andtravel thumbnails on the side of the mountain that shows a background image of aresort island, beach or sea. This solution added realism to the mountain’s generalstructure and appearance.
16

Figure 3.4: Initial implementation
The scrolling buttons were implemented as designed. The scale widget was movedto the bottom in order to group all the controls in one part of the screen. Ascrollbar’s knob was also included to provide rapid view-positioning. The usermoves the knob in the scrollbar to determine the contents of the viewing area.The knob’s default position is at the very beginning, or 0 degrees; the maximumposition is 359 degrees. The position of the knob in the scrollbar changes as thebuttons are clicked to correspond to changes made to the position of the mountain.
At this stage, when the mountain is scrolled, the thumbnails move in the oppositedirection, giving the impression that the user is rotating around the mountain.The thumbnails disappear when they reach the edge of the mountain.
Scalability. In terms of scalability, our initial implementation can support around1000 thumbnails without making the display cluttered. This limit was enforcedonly for experimental purposes.
17

Spatial cues. The added background images hints the location of the user inrelation to the mountain.
Visual cues. Background images do not offer a strong visual cues because thespace allocated to them is small.
Effective Grouping. This was not achieved by this implementation because thebackground images were not very visible and hence it was difficult to make asso-ciations between the background and the thumbnails.
Ease of navigation. A scrollbar acts as the main navigation tool for this interface.The knob of the scrollbar, provide a faster way of rotating around the mountain.However, users have to associate areas of the mountain with their angle. Thisapproach load the user’s memory and therefore is not efficient.
Metaphor correspondence. The design corresponds to the mountain metaphor.However, the behaviour of the thumbnails violates the metaphor. The thumbnailsdisappear suddenly when scrolled to the either edges of the mountain. In real life,objects diminish and disappear gradually into the distance.
More spatial cues
The initial system had a few, easily remedied, limitations. Most, if not all, soft-ware packages place the controls at the top of the screen, not the bottom. Forconsistency we relocated the scrollbar to the top. The compass widget was un-necessary as the angle of viewing shows just above the knob of the scrollbar (seeFigure 3.5). The space allocated to the background image was enlarged to im-prove its effectiveness. We had to choose between expanding the vertical spaceabove the mountain or making the images visible from the sides of the mountain.However, the first alternative would mean that the distance between the controlsand the thumbnails on the mountain would increase. This, would have affectedthe performance of the system as users would have to move their mouse largerdistances, which would take more time (Fitts 1954).
When the background images were made visible from above the mountain andfrom its sides, we found that the mountain became inconspicuous, especially whencolourful backgrounds were used. To solve this problem, a border was createdaround the mountain. To solve the problem of having the thumbnails suddenlydisappear, we have used stippling techniques (see Figure 3.5) on both sides ofthe mountain to make the background semi-transparent. This feature make thethumbnails being scrolled out of the mountain gradually vanish instead of suddenlydisappear.
Scalability. These refinements did not affect the scalability of the system.
Spatial cues. Again, the current view is signalled by the background image andthe angle of viewing located on top of the knob of the scrollbar.
18

Figure 3.5: Background image of a city appears behind the Data Mountain.
Visual cues. The additional space allocated to the background images was notenough to make effective associations between the thumbnails and the backgroundimages.
Effective Grouping. Grouping was enhanced as a result of the enhancements madeto the background images but again, the grouping was not effective.
Ease of navigation. Moving the controls to the top made the system look consis-tent with other systems.
Metaphor correspondence. The thumbnails behaviour was modified to disappeargradually when scrolled towards the edges of the mountain. The current behaviouris close to the mountain metaphor. Now, the thumbnails appear to fly out of themountain which does not correspond with the mountain metaphor.
19

Figure 3.6: The panoramic background
3.1.3 Final Prototype
In this section, the last two phases of our prototype design are discussed. Weexplain the reasons behind the failure of the – theoretically perfect – panoramicbackground. We include the rationale behind our design decisions.
Panoramic background
As the system developed, further modifications were made. The stippling tech-nique discussed in Section 3.1.2, did not appear to be optimal, as the backgroundimages were still not visible enough to enable associations between thumbnailsand parts of the background. A proposed solution was to make the mountainsemi-transparent. However, we realised that this would complicate the system,and furthermore, a semi-transparent mountain does not fit the metaphor of a
20

real mountain. To solve these problems, a major change had to be made; Thegrey canvas representing the mountain was removed (see Figure 3.6). This im-provement allows the background images to be completely visible. Also, this hasincreased space allocated working which makes the manipulation of thumbnailsmore flexible.
A 360 degrees panoramic image was selected to serve as a background image. Theinitial design of the gestalt viewer, shown in Figure 3.3, did not fit the currentimplementation of the system. We developed a new design that was directlyimplemented as shown in Figure 3.6. Since, we were not showing the data in ourviewer, we could not call it a gestalt viewer, we called it a ‘shortcut viewer’. Inour prototype, the shortcut viewer was composed out of ten buttons, each buttondepicts a 40 degree view of consecutive parts of the mountain. Clicking on anyof the buttons takes the user to the view associated with that button. Eachbutton has a scaled-down version of the background image found at that view.It was argued that users may lose their orientation because of the fast transitionbetween one view and the other using the shortcut viewer. However, the knob ofthe scrollbar and the angle displayed above it give a clear indication of the relativeposition of the user.
Scalability. Removing the mountain provided more space for the placement ofthumbnails. Thumbnails can now be placed anywhere within the rectangularworking area, they are no longer restricted to the boundaries of the mountain.
Spatial cues. The panoramic background image provided some spatiality. How-ever, effective associations between the thumbnails and their location could notbe made because of the subtlety of the background.
Visual cues. Although the background image was completely visible, it was subtleand hence weakly associated to the thumbnails and their locations.
Effective Grouping. The shortcut viewer provided some sort of grouping, but thesubtle background prevented effective grouping to take place.
Ease of navigation. The shortcut viewer provided a quick method to move fromone view of the mountain to another via a single click.
Metaphor correspondence. At this stage, the metaphor of the mountain was nolonger followed. This fact has made the third-dimension illogical because it doesnot carry any information. In addition, it makes the pictures at the top of thedisplay smaller and therefore harder to match. However, having the diminishingbehaviour of the thumbnails allows for more thumbnails to be displayed at any onetime. It was proofed by Cockburn & McKenzie (2001) that the third dimensionis generally preferred to its counterparts even if the additional dimension doesnot carry any information. It was decided to leave the diminishing behaviour ofthe thumbnail – and therefore the third dimension – as it is despite of its knowndisadvantages.
21
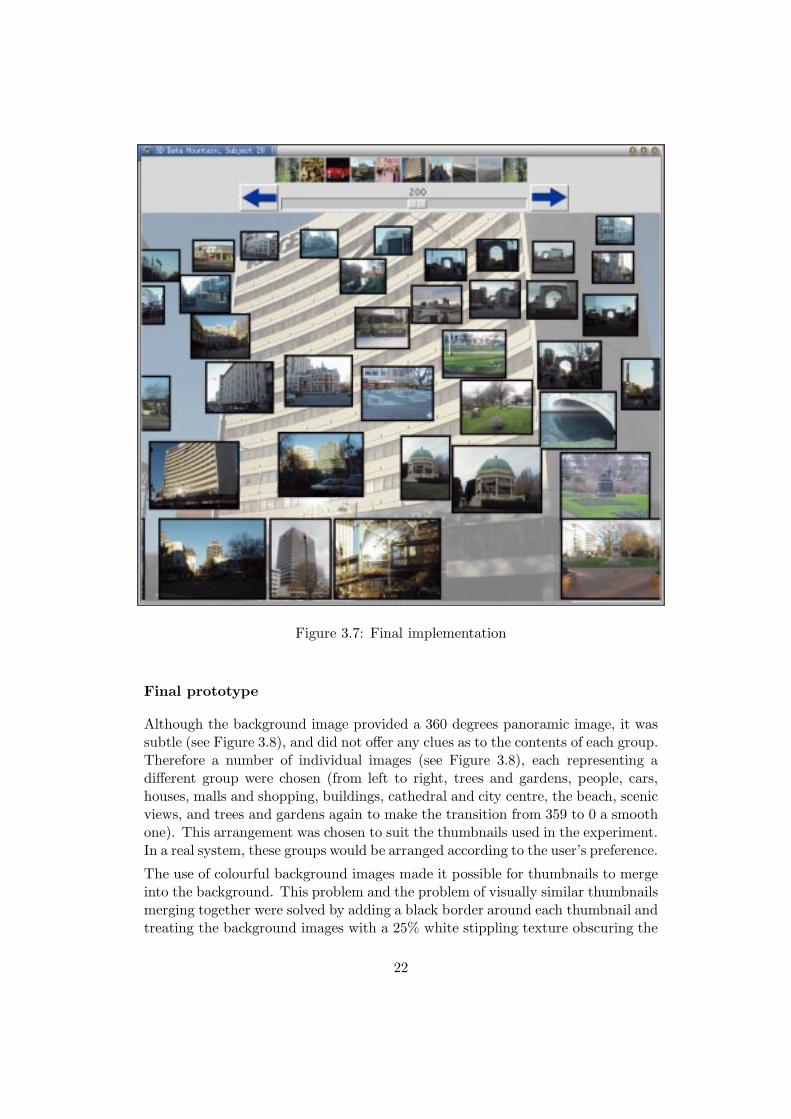
Figure 3.7: Final implementation
Final prototype
Although the background image provided a 360 degrees panoramic image, it wassubtle (see Figure 3.8), and did not offer any clues as to the contents of each group.Therefore a number of individual images (see Figure 3.8), each representing adifferent group were chosen (from left to right, trees and gardens, people, cars,houses, malls and shopping, buildings, cathedral and city centre, the beach, scenicviews, and trees and gardens again to make the transition from 359 to 0 a smoothone). This arrangement was chosen to suit the thumbnails used in the experiment.In a real system, these groups would be arranged according to the user’s preference.
The use of colourful background images made it possible for thumbnails to mergeinto the background. This problem and the problem of visually similar thumbnailsmerging together were solved by adding a black border around each thumbnail andtreating the background images with a 25% white stippling texture obscuring the
22

background while still making it visible enough to be associated to the thumb-nails. Also, having borders around the thumbnails ensures that they do not mergetogether, or with the background image, solving the problem identified by Roddenet al. (2001) (see Section 2.2).
This new arrangement of background images provides memorable landmarks, solv-ing the problem of the absence of effective landmarks indicated by Robertson et al.(1998) (see Section 2.2).
The shortcut viewer provides a fast ‘view-repositioning’ technique. In addition,it facilitates the grouping of related thumbnails in one screen identified by thecontext of the background image (see Figure 3.7).
Scalability. This final refinement did not affect the scalability of the system. Thesystem can handle up to 1000 thumbnails without cluttering the display.
Spatial cues. The categorised background removed some of the spatiality providedby the panoramic background. However, associating the content of the thumbnailswith their location hinted by the background, is made easier.
Visual cues. The new background provides visual cues helping the user to formassociation between the location of the thumbnails and the background image.
Effective Grouping. The new categorised background images provided a naturaland effective grouping. The thumbnails can be grouped according to their seman-tic meaning. The thumbnails’ semantic meaning can also be associated with thebackground’s semantic content. This associations results with an effective andmemorable grouping scheme.
Ease of navigation. The shortcut viewer’s icons provide easily recognisable images,each representing a certain group. This feature provides ease of categorisation andease of navigation.
Metaphor correspondence. The system does not correspond to the mountainmetaphor anymore. However, it corresponds more to the photo album metaphor.Usually, photos are grouped by their content within a photo album. Our systemdepicts a grouped photo album with each group (page of the album) containingclosely related photos.
This system was then evaluated and a number of limitation were discovered. Theseare discussed in Section 4.4.
3.2 Implementation
The prototype runs under Solaris and Windows 2000 on PCs equipped with256Mb, with best performance achieved with 512Mb. We realise that this is alarge amount of memory for a picture management system. However, the proto-type was written for experimental use only at this stage. Our algorithms need
23

to be more efficient both in memory usage and processing speed. All applicationcode was written in Tcl/Tk v8.0.
For the prototype and user study, images were used instead of web pages, asin previous evaluation studies of the Data Mountain. The 400 images used arethumbnails of 24-bit colour photos taken with a digital camera.
24

Figure 3.8: The difference between the original panoramic image and the categorised replace-ment one.
25

Chapter 4
Evaluation study
“If the facts don’t fit the theory, change the facts.”
—Albert Einstein
The evaluation compared our system, the Enhanced Data Mountain (EDM) withMy Pictures (MP), the picture management system available as part of the Win-dows package since Windows 2000 (see Figure 4.1).
The primary purpose of the experiment was to determine whether there were anydifferences between the two systems in terms of time to retrieve pictures. We werealso interested in whether the spatial memory of users is still effective in a systemthat cannot be viewed on one screen. Finally, we were interested in the subjectiveassessment of the two interfaces.
4.1 Experimental Design
The experiment was a paired T-test for the independent variable ‘interface type’with two levels (EDM and MP). The same set of 400 thumbnail images, takenwith a digital camera, were used for all 20 subjects. The photos, of family, friendsand scenic shots of Christchurch, New Zealand, were arranged in the same fashionacross the two interfaces. The photos were grouped according to their contents,e.g. photos of people, photos of cars, scenic photos and so on. See Section 3.1.3for details on the categories used.
Note that, in a real system, the users can control how the photos are grouped;some might choose to group photos by their contents and some might choose togroup them by date. For the purposes of this experiment, grouping the photosby date would have caused difficulties because the subjects were not familiar withthe photos and did not know when each was taken. It is also possible to sortphotos by name. However, this approach seems counter-intuitive because in reallife, it is unusual for people to name their photos. In addition, digital camera
26
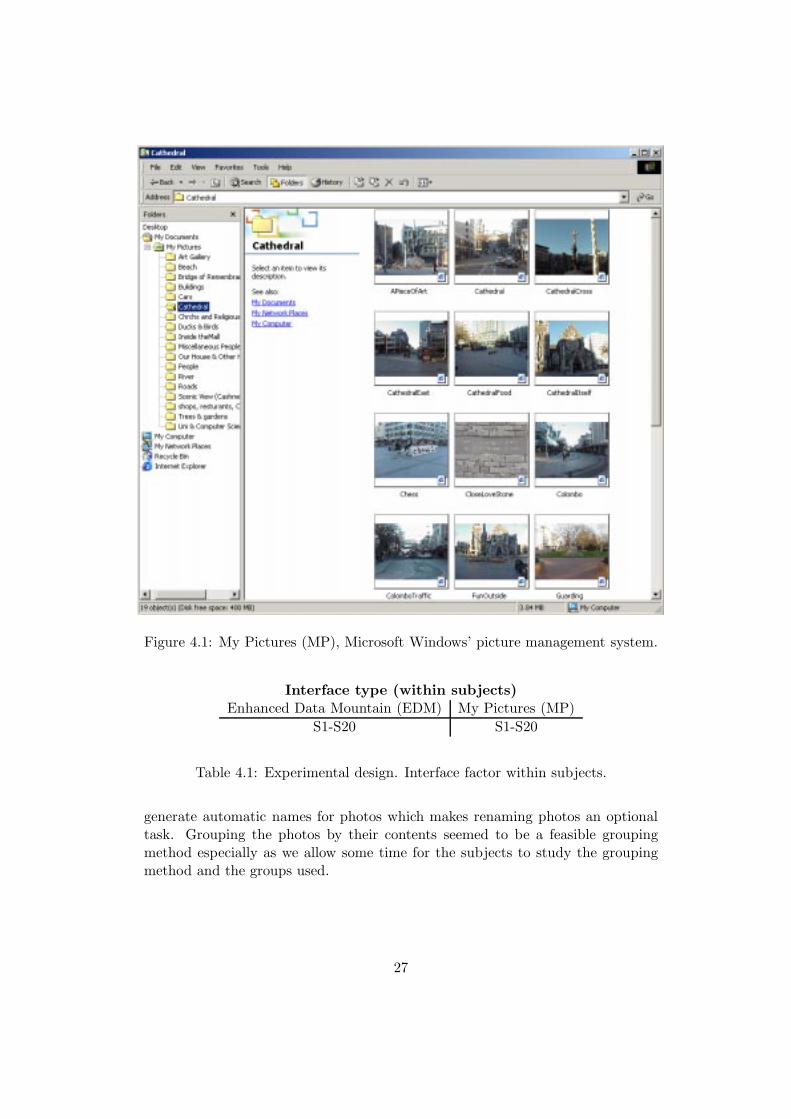
Figure 4.1: My Pictures (MP), Microsoft Windows’ picture management system.
Interface type (within subjects)Enhanced Data Mountain (EDM) My Pictures (MP)
S1-S20 S1-S20
Table 4.1: Experimental design. Interface factor within subjects.
generate automatic names for photos which makes renaming photos an optionaltask. Grouping the photos by their contents seemed to be a feasible groupingmethod especially as we allow some time for the subjects to study the groupingmethod and the groups used.
27

Evaluation procedure
For evaluation purposes, we disabled the ability to move thumbnails, as we wantedto test the same arrangement of images for all subjects. The evaluation procedureconsisted of retrieving twelve random photos from each interface. The subjectswere introduced to the features of each interface and then were given as muchtime as needed to study the arrangement of pictures, the location of each group,and in case of MP, the name of the group. The time was recorded and was calledthe ‘time of browsing’. The users were then given at least three sample tasks toensure their understanding of the procedure of the experiment. More sample taskswere given if the users did not feel confident with the system. Upon completionof the sample tasks, the subjects responded to one 5-point Likert scale question:Q1 “I will be able to quickly find the photos required”. After answering Q1 theretrieval task started.
The retrieval task consisted of finding, as quickly as possible, twelve randomly se-lected photos from the display, one at a time. The users were shown the magnifiedimage and its title in a separate window (see Figure 4.2). In the EDM system,software timed each task, with the clock stopping when the subject magnified thetargeted photo (mouse right-click), while in the MP system, a stop-watch wasused to time the tasks. To be consistent, the clock was stopped when the subjectright-clicked the picture. After the retrieval task, subjects responded to two moreLikert scale questions: Q2 “I was able to quickly find photos”, and Q3 “Overallthe interface is effective”. The subjects then performed a further twelve taskson the other system and were asked the same three Likert scale questions. Oncompletion of all the tasks on the second interface the subjects were asked a finalpreference question; Q4 “Which of the two interfaces did you prefer?”. Each eval-uation session lasted approximately 40 minutes, including the time of browsingand training.
Learning effect control
We were aware that subjects might learn the location and grouping of picturethumbnails between the EDM and MP interfaces, therefore, we controlled thelearning effect by having even numbered users carry out the experiment on theEDM and then the MP system, while odd numbered subjects used the MP systemfirst, followed by the EDM.
Initially, we thought that the ultimate control of the learning effect would beto ask users to perform a single task on the EDM system, followed by a singletask on the MP system, then repeat the process. However, this would have beenpotentially confusing for the subjects, and could have degraded their performance,as this would not have allowed them to be sufficiently familiar with either of thetwo systems.
28

Figure 4.2: The control window showing one of the retrieval tasks
Because we automated and randomised the tasks, it was possible that subjectsmay have been required to perform the same task on each interface. Therefore,we arranged the tasks into two sets. The first ten subjects were asked questionsfrom the first set on the EDM system and the second set on the MP system. Thesets’ assignment was reversed for the next ten subjects.
Subjects
The twenty subjects who participated in the evaluation were volunteer postgrad-uate (14), undergraduate (6) computer science students.
4.2 Results
Prior to the evaluation, we expected that in terms of efficiency, the EDM systemwill be significantly better. We also expected that EDM will be preferred to theMP system.
29

4.2.1 Image Revival Task
The mean times for the ‘browsing’ task in the EDM and MP systems were 515.5(s.d 224.2) and 515.2 (s.d 180.7). This difference is not significantly reliable (PairedT-test, T(19) = 0.01, p = 0.99). The mean times for retrieving twelve images inthe EDM and MP interfaces were 27.28 (s.d 31.69) and 17.65 (s.d 16.58) whichgives a non-significant difference (Paired T-test, T(19) = 0.93, p = 0.87).
The subjects’ comments reveal some of the reasons for no apparent difference be-tween the two systems. With the EDM system, users spent a small amount oftime identifying the group, and spent the majority of their time visually match-ing the images. Part of the problem is that the thumbnails were too small andhence difficult to visually distinguish and match. Ten subjects, out of the twentyparticipated in the experiment, mentioned that when searching, pictures are eas-ily missed because they are too small to recognise. The opposite happened withthe MP system; users spent most of their time determining the group, and mostquickly located the desired thumbnail by matching its label. Most of the commentsabout the MP system indicated that the name of the folder does not effectivelyindicate the contents of the folder. Another common comment was that searchingby name is a major advantage.
Cross-categorised photos also affected the efficiency of both systems. Some photosfit more than one category. For example, a picture of a garden on a hill may begrouped under the group ‘trees and gardens’ and also under ‘scenic views andhills’. Problems such as this affected the time it took users to identify the groupto which a picture belonged.
Thirteen subjects commented on the absence of titles over the thumbnails in theEDM system. We believe that this degraded EDM’s performance because userscould only visually match photos. The issue of visual matching and label matchingis discussed in Section 4.4.
4.2.2 Browsing versus Retrieval
During the evaluation, we noticed that subjects who spent longer browsing throughthe images performed better than those who did not. This observation lead toanalysing the data to determine whether there was a linear correlation betweenthe time of browsing and the average time of retrieval. A strong correlation wasfound for both systems: for the EDM system a linear correlation (F(1,18)=172.9,R2=0.91) and for the MP system a linear correlation (F(1, 18)=266.25, R2=0.93).Figures 4.3 clearly shows, that for both interfaces, increasing the ‘time to browse’significantly decreased the average retrieval time. These results strongly suggeststhat if the users had arranged the thumbnails themselves, the retrieval times wouldhave been significantly faster. Trumbo (1998) suggests that activities that are re-hearsed are moved to our long-term memory, while elements that are not, areoften forgotten. We believe that this is an adequate explanation for our results.
30

Figure 4.3: The correlation between the time of browsing and average time of retrieval forEDM(left) and MP (right).
Question EDM MP Reliablydifferent?
Q1. I will be able to quickly find thephotos required.
3.55 (0.83) 3.85 (0.99) No
Q2. I was able to quickly find thephotos.
3 (0.79) 3.25 (1.07) No
Q3. Overall the interface is effec-tive.
3.4 (0.68) 3.65 (1.18) No
Table 4.2: Mean (standard deviation) responses to 5-point Likert scale questions. ‘No’, notsignificant at the .05 level.
4.2.3 Subjective Measures
Although none of the first three Likert scale questions revealed significant differ-ences between the two interfaces (Mann-Whitney U tests) (see Table 4.2.3), therewas a significant difference in the subjects’ answers to Q4 – the overall interfacepreference question. Subjective responses to Q4 showed a higher preference forthe MP interface. Sixteen subjects preferred MP, two preferred EDM while twothought both interfaces were equally preferable. The difference in rating is signif-icant (Chi-square test χ2 = 4.5, df = 1, p < 0.05). Many of the users commentedthat because of the deterministic nature of the tasks, a deterministic – search byname – method is preferable. Many users mentioned that “EDM would be goodfor browsing rather than searching”.
31

4.2.4 Expert Timing
A very simple test to see how fast an expert, who arranged the thumbnails, coulduse both systems was undertaken. The author of this report performed 30 retrievaltasks as quickly as possible on both systems. The mean (standard deviation) timesfor retrieving 30 images using the EDM and MP interfaces were 7.67 (6.59) and9.62 (9.3). The means and standard deviations for the two interfaces were lowerand the EDM times were lower than those of the MP system suggesting potentialfor EDM.
4.3 Confounding Factors
There were several possible confounding factors in our experiment.
Self-organisation
The major issue that has affected both systems was that the subjects were pre-sented with a forced grouping that they were not allowed to change. we speculatethat allowing users to place and group thumbnails might have altered the resultsof the evaluation. We presume that this degraded the performance of both in-terfaces similarly. Section 4.2.4 clearly shows that the performance times of bothsystems improves when used by someone who arranged the thumbnails.
Deterministic tasks
Another confounding factor is that the retrieval tasks focused on retrieval of spe-cific pictures, that is to say, the tasks were in the form of “find this certain picture”instead of general browsing question of the form of “find a picture of a car”. EDMappears to have greater potential in the area of browsing than specific retrieval.
Two machines
The evaluation was separated into two parts: the EDM part and the MP part.The EDM system running on a Solaris Unix machine, while the MP system ran ona Windows 2000 machine. Subjects had to move from one machine to the otherin the middle of the experiment. However, we believe that this did not affect theresults because we gave the subjects the time needed to focus and browse throughthe images, and we provided the sample tasks to ensure that the subjects werefully comfortable with the systems.
32
EDM’s memory use
Because of the number of pictures dealt with, the EDM system used an enormousamount of memory. This made the system swap some of the images in memoryonto the hard disk. However, in our implementation, we made sure that all thebackground images and the visible images were always in memory, ensuring thatscrolling would be done in real-time. However, the enlarged thumbnails – appear-ing on right clicking – were not necessarily in memory. This affected the time ittook to enlarge a thumbnail. However, to ensure that we logged the correct times,the software recorded the time at which a thumbnail was right-clicked before at-tempting to enlarge it. This way, the time it took to find a thumbnail was notaffected by the time it took the computer to find the image on disk, move it tomemory and then show it.
Subject pool
Our subjects (computer science students, and graduates), are more familiar withcomputers than most computer users. However, we believe this is not likely tohave affected the performance of either systems.
4.4 Discussion and Further Work
To summarise, the mean task completion times for the retrieval tasks were higherwhen using the EDM system than when using the MP system. These differences,however, were not statistically significant. The mean task completion times forthe expert retrieval tasks were lower when using the EDM system. Again, thesedifferences were not statistically significant. However, these results show that theEDM has potential as a mainstream picture management system.
It is plausible that any performance enhancement the EDM interface providedwas counter-balanced by the absence of titles for the images, which forced thesubjects to visually match them. Supplying a title as well as the thumbnail wouldboost the system’s performance. Further work to eliminate this problem couldinclude excentric labelling to add titles to the thumbnails. Excentric labellingis a technique that provides dynamic labelling for any form of data. When thecursor stays idle for a certain period of time – normally, one second – excentriclabels appear and follow the cursor. Shift-clicking freezes the labels, allowing theuser to select an individual object by either clicking on the object itself or on itsfrozen label. Excentric labelling can also be useful when there are thumbnailspartially or completely obscuring other thumbnails. (Figure 4.4 shows a sketch ofhow excentric labelling may benefit our prototype.)
A ‘sketch’ of another proposed design for incorporating labels in the EDM systemis shown in Figure 4.5. This design combines both the benefits of visual cues and
33

Figure 4.4: A sketch of how excentric labelling can possibly enhance EDM
label matching. On the right side of the working space, a dynamic alphabeticallist of the visible thumbanils’ labels is stored. Clicking on a title highlights theborder of the corresponding thumbnail and vice versa. This design is very likely toenhance the performance of EDM and eliminate the problems of visual matchingthat was commented on by many users.
An idea which would eliminate the problem of cluttering, is to make the scrollingvertical as well as horizontal. In this case, the diminishing behaviour of the thumb-nails (three-dimensionality) would be disabled. This approach would give greaterflexibility and more scalability to the system.
The mean task completion times for the browsing tasks were not significantly dif-ferent. However, subjective comments revealed that EDM is preferred for brows-ing tasks. The subjective satisfaction measures showed that there is no significantdifference in the speed or effectiveness of the two interfaces. However, the final
34
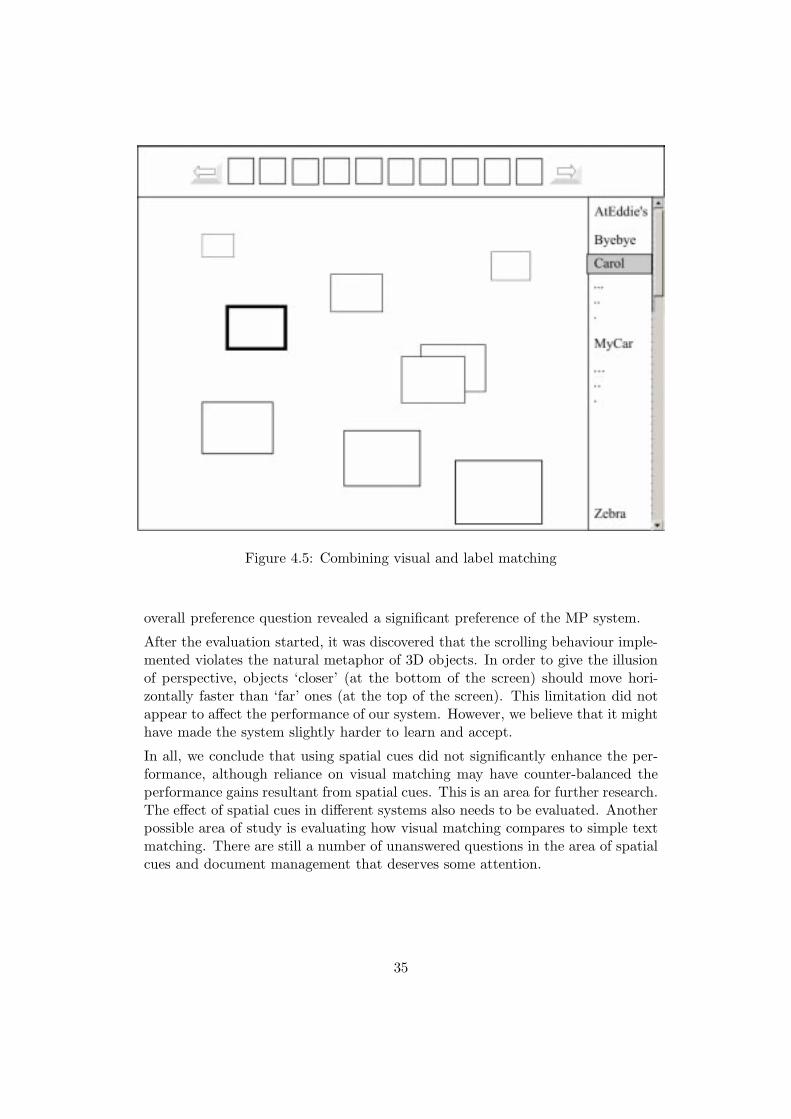
Figure 4.5: Combining visual and label matching
overall preference question revealed a significant preference of the MP system.
After the evaluation started, it was discovered that the scrolling behaviour imple-mented violates the natural metaphor of 3D objects. In order to give the illusionof perspective, objects ‘closer’ (at the bottom of the screen) should move hori-zontally faster than ‘far’ ones (at the top of the screen). This limitation did notappear to affect the performance of our system. However, we believe that it mighthave made the system slightly harder to learn and accept.
In all, we conclude that using spatial cues did not significantly enhance the per-formance, although reliance on visual matching may have counter-balanced theperformance gains resultant from spatial cues. This is an area for further research.The effect of spatial cues in different systems also needs to be evaluated. Anotherpossible area of study is evaluating how visual matching compares to simple textmatching. There are still a number of unanswered questions in the area of spatialcues and document management that deserves some attention.
35

Chapter 5
Conclusion
“I think and think for months and years. Ninety-nine times, the conclusion isfalse. The hundredth time I am right.”
—Albert Einstein
Document management is a ubiquitous activity. From text files to rich images,people spend a large portion of their time on document management. Researchhas been undertaken to incorporate the power of spatial memory and visual cueswithin document management systems. Evaluations of systems that exploit spatialmemory showed that spatial memory is a promising cue to organisation of itemsand especially to rapid retrieval. In order to preserve spatial cues, these systemsdeal with a limited number of items.
Our research concentrated on building a scalable document management systemexploiting spatial memory. Our prototype was based on photo retrieval. However,our results are generalised to all document types. We performed an evaluationthat compared our system to a state-of-the-art picture management system – Mi-crosofts’ ‘My Pictures’ (MP). Several subjects commented that EDM would bepreferred for browsing tasks rather than deterministic tasks, which shows thatvisual cues do aid such tasks. However, no significant performance difference be-tween EDM and MP were found in terms of the retrieval tasks. In general, therewas a significant overall preference for the MP system. The results also showedthat an expert user performed better using EDM. The results of our evaluationwere inconclusive. We were not able to make a firm statement about the effec-tiveness of spatial memory in scalable environments.
Future work includes investigating the conditions under which spatial cues for doc-ument management provide performance enhancements. Performance differencesbetween visual-matching search methods and text-based search ones also warrantinvestigation
36

Acknowledgements
Since I have a chance to say ‘thanks’, I really do intend to use it. First, GOD, Ifeel your presence everyday, you are such an awesome GOD. My parents, withoutyour support, your understanding and your sacrifices, I would not be what I amnow. Carol, you are an elemental drive of my existence, I love you. Dr. AndyCockburn, thank you for your time, your constant inspiration and for being themost supportive, friendliest, down-to-earth, and coolest supervisor. Thanks toJane McKenzie for her effort in reviewing this document, without her you wouldnot have understood anything I wrote. My thanks goes to all the subjects whotook part in the experiment. Finally, all of you who have helped me in one wayor another, I’m truly thankful, you are the best.
37

Bibliography
Arnheim, R. (1954), Art and Visual Perception: a psychology of the creative eye,Berkeley: University of California Press.
Ballay, J. (1994), Designing workscape: an interdisciplinary experience, in ‘Pro-ceedings of CHI’94 Conference on Human Factors in Computing Systems,Boston, April 24–28’, ACM Press, New York, USA, pp. 10–15.
Chen, C. & Czerwinski, M. (1997), ‘Spatial ability and visual navigation: Anempirical study’, New Review of Hypermedia and Multimedia 3, 67–89.
Cockburn, A. & McKenzie, B. (2001), 3D or Not 3D? Evaluating the Effect ofthe Third Dimension in a Document Management System, in ‘Proceedingsof CHI’2001 Conference on Human Factors in Computing Systems, Seattle,Washington, March 31–April 6’, pp. 434–441.
Curiel, J. & Radvansky, G. (1998), ‘Mental Organization of Maps’, Journal ofExperimental Psychology: Learning, Memory and Cognition 24(1), 202–214.
Czerwinski, M., Dumais, S., Robertson, G., Dziadosz, S., Tiernan, S. &Van Dantzich, M. (1999), Visualizing Implicit Queries For Information Man-agement, in ‘Proceedings of CHI’99 Conference on Human Factors in Com-puting Systems, Pittsburgh, May 15–20’, pp. 560–567.
Donelson, W. (1978), Spatial management of information, in ‘Proceedings of theFifth Annual Conference on Computer Graphics and Interactive Techniques’,ACM Press, New York, USA, pp. 203–209.
Dumais, S. & Jones, W. (1985), A comparison of symbolic and spatial filing,in ‘Human Factors in Computing Systems II. Proceedings of the CHI’85Conference.’, Amsterdam; North-Holland/ACM.
Ekstrom, R., French, J. & Harman, H. (1979), ‘Cognitive factors: Their identifica-tion and replication’, Multivariate Behavioral Research Monographs 79(2), 1–84.
Fitts, P. M. (1954), The information capacity of the human motor system incontrolling the amplitude of movement., in ‘Journal of Experimental Psy-chology’, pp. 381–391.
Mackinlay, J. D., Robertson, G. & Card, S. K. (1990), Rapid controlled move-ment through virtual 3D workspaces, in ‘Conference proceedings on Com-puter graphics’, pp. 171–176.
38

Miller, G. A. (1956), ‘The magical number seven, plus or minus two: Some limitson our capacity for processing information’, The Psychological Review 63, 81–97. URL: http://www.well.com/user/smalin/miller.html.
Pierce, J. S., Conway, M., Van Dantzich, M. & Roberstson, G. (1999), ToolspacesAnd Glances: Storing, Accessing, and Retrieving Objects in 3D Desktop Ap-plications, in ‘Proceedings of the 1999 symposium on Interactive 3D graph-ics’, pp. 163–168.
Robertson, G., Card, S. K. & Mackinlay, J. D. (1991), Information VisualizationUsing 3D Interactive Animation, in ‘Human factors in computing systemsconference proceedings on Reaching through technology’, pp. 461–462.
Robertson, G., Czerwinski, M., Larson, K., Robbins, D., Thiel, D. & van Dantzich,M. (1998), Data mountain: Using spatial memory for document management,in ‘Proceedings of the 1998 ACM Conference on User Interface Software andTechnology, November 1–4. San Francisco, California.’, ACM Press, pp. 153–162.
Robertson, G., Mackinlay, J. & Card, S. (1991), Cone trees: animated 3D visu-alizations of hierarchical information, in ‘Proceedings of CHI’91 Conferenceon Human Factors in Computing Systems, New Orleans, May’, pp. 189–194.
Robertson, G., Tesle, J., Tversky, B. & Mullet, K. (1991), 3D or not 3D: Moreis better or less is more?, in ‘Proceedings of CHI’95 Conference on HumanFactors in Computing Systems, Denver, May 7–11’, pp. 174–175.
Robertson, G., van Dantzich, M., Czerwinski, M., Hinckley, K., Thiel, D., Rob-bins, D., Risden, K. & Gorokhovsky, V. (2000), The task gallery: A 3D win-dow manager, in ‘Proceedings of CHI’2000 Conference on Human Factors inComputing Systems, The Hague, The Netherlands, April 1–6’, pp. 494–501.
Rodden, K., Basalaj, W., Sinclair, D. & Wood, K. (2001), Does organisation bysimilarity assist image browsing?, in ‘Proceedings of CHI’2001 Conference onHuman Factors in Computing Systems, Seattle, Washington, March 31–April6’, pp. 190–197.
Roskos-Ewoldsen, B., McNamara, T., Shelton, A. & Carr, W. (1998), ‘MentalReprestations of Large and Small Spatial Layouts Are Orientation Depen-dent’, Journal of Experimental Psychology: Learning, Memory and Cognition24(1), 215–226.
Trumbo, J. (1998), Spatial memory and design: a conceptual approach to thecreation of navigable space in multimedia design, in ‘Interactions’, ACMPress, New York, USA, pp. 26–349.
Volbracht, S., Domik, G., Shahrbabaki, K. & Fels, G. (1997), How Effective are 3DDisplay Modes?, in ‘Proceedings of the ACM SIGCHI’97 Conference on Hu-man Factors in Computing Systems, Atlanta, Georgia, March 22-27’, pp. 540–541.
39