towards defect detection in metal slm parts · pdf filetowards defect detection in metal slm...
TRANSCRIPT

TOWARDS DEFECT DETECTION IN METAL SLM PARTS USING MODAL ANALYSIS “FINGERPRINTING”
James Urban1, Nick Capps1, Brian West1, Troy Hartwig2, Ben Brown2, Robert Landers1, Douglas Bristow1, Edward Kinzel1
1Department of Mechanical Engineering and Aerospace, Missouri University of Science and Technology, Rolla MO 65401
2Kansas City National Security Complex, Kansas City MO 64147
Abstract: The validation of Additively Manufactured (AM) materials is a difficult and expensive process because the local engineering properties are a function of the thermal history. The thermal history varies with the process parameters, as well as the part geometry. This paper presents a case study using modal testing to identify defects in realistic AM parts. A setup consisting of a Scanning Laser Doppler Vibrometer (LDV) was used to identify the resonant frequencies for several geometrically identical parts on a build plate. Parts with suboptimal process parameters from purposely varying the process parameters, are identified by a shift in the mode peak frequency. Results from this study are compared to Finite Element Analysis (FEM) models and generalized for identifying defects in parts created with AM on the basis vibration/modal “fingerprinting.”
1. Introduction
Recently, demand has increased for geometrically complex manufactured components, particularly in fluid mechanical optimization, packaging optimization, rapid prototyping, and many other fields [1]. Traditional material removal manufacturing processes are often limited to simple geometries with minimal internal features, and are not competitive from a cost perspective when fabricating unique parts in small batch sizes. A promising solution to this problem is a broad assortment of new manufacturing techniques known as Additive Manufacturing (AM). Additive Manufacturing is a process that sequentially adds layers of material to a component to create a product with few limitations in geometric design.
The Selective Laser Melting (SLM) process, used in this report, consists of a laser melting a powdered metallic alloy to a previously formed layer beneath. The resulting mechanical properties heavily depend on the micro-scale thermodynamic history of the manufactured material. These thermodynamic properties are directly affected by the morphology of the printed part, and the processing parameters used to build it, i.e., laser power settings and path spacing parameters. This makes this process vulnerable to micro scale errors such as material voids, unwanted porosity, as well as decreased mechanical properties [2-4].
Current defect detection methods are both cost and time prohibitive. Computerized Tomography (CT) scanning generates three dimensional images of the internal structure of a part by piecing together successive cross-sectional X-rays [5]. “It is recognized that CT scanning is a key technique for parts with complex geometries. However, a challenge of implementation of this technique is the availability of affordable high power and high-resolution systems” [6]. A simple density test may not reveal critical flaws in the mechanical properties of the component because
2503
Solid Freeform Fabrication 2017: Proceedings of the 28th Annual InternationalSolid Freeform Fabrication Symposium – An Additive Manufacturing Conference

defects such as layer delamination and residual stresses are not related to density. These factors create the need for a new cost-effective and reliable defect detection method. Modal analysis “fingerprinting” could prove to be a key nondestructive testing method for AM components
This paper contains an overview of the fundamental theoretical framework of modal analysis. Finite Element Analysis (FEA) modeling is used to reinforce and provide visual representation of these fundamental relationships. Testing of complex AM parts is then performed to correlate theoretical predictions to experimental data. The experimental study consisted of a modal analysis for five geometrically identical parts, four of which were manufactured with nominal process parameters and one with suboptimal process parameters. The primary goals of the experiments is to determine if modal analysis could identify the part with suboptimal process parameters.
2. Variation of Process Parameters
Defects were introduced by varying the printed specimen’s hatch spacing, or the distance between each successive laser pass in the SLM process, as shown in Fig. 1. Larger hatch spacing can introduce more porosity in the part, and thus decrease Young’s Modulus and density [7]. Hatch spacings of 85 and 150 µm were selected for the experiment. The 85 µm hatch spacing was selected to be the nominal parameter. The 150 µm hatch spacing was selected to be the defective parameter because of observed reductions in mechanical properties from prior experiments. Average mechanical properties for each hatch spacing, obtained by destructive testing of ASTM E8 tension test specimens, are shown in Table 1.
Fig. 1: Hatch Spacing [2]
2504

Table 1: Tension Test Data.
85 µm 150 µm Density (g/cc) 7.862 7.467
Young's Modulus (GPa) 170.3 140.63 Ultimate Tensile (Mpa) 536.3 439.2 Yield Strength (Mpa) 372.4 294.8
3. Modal Analysis
Modal analysis is the study of mechanical systems and their natural resonant frequencies. A natural resonant frequency is the frequency at which a system oscillates after an initial disturbance and without an external force. If the given system is driven by a sinusoidal excitation at the same frequency as its natural frequency, the system will have a large increase in the output amplitude. This effect is commonly referred to as a mechanical amplifier. A structure can have many natural resonant frequencies throughout the frequency band of the applied excitation. The specific frequencies at which these natural resonant frequencies occur is a function of the part’s geometry and mechanical properties.
For a simple geometric model, an analytical solution of its natural frequencies can be obtained by solving the equations of motion assuming there is no damping and applied loading.
[𝑀𝑀]{�̈�𝑢} + [𝐾𝐾]{𝑢𝑢} = 0 (1)
where [M] (kg) = mass matrix
[K] (N/m) = stiffness matrix
{𝑢𝑢} = {𝜑𝜑} sin𝜔𝜔𝜔𝜔 (2)
where {φ} = the eigenvector or mode shape
ω = is the circular natural frequency
Equations (1) and (2) can be combined and simplified to for the Eigen equation
([𝐾𝐾] − 𝜔𝜔2[𝑀𝑀]){𝜑𝜑} = 0 (3)
Equation (3) can then be used to solve for values of ω [8]. FEA methods are generally required for more complex geometries that cannot be well-represented by a simple model.
2505

To create a simulated modal fingerprint of a subject complex geometry, an existing build of a protective housing was modeled, shown in Fig. 2. The model was then imported into ANSYS, a FEA software suite, to extract frequency response and mode shape simulation data.
Fig. 2: CAD Model of protective housing; Front (left) and Side (right) views. Dimension are in inches.
A modal simulation of the protective housing was conducted providing a three-dimensional image of the mode shape for the first three natural modes, their expected frequencies, and phase information. The first simulated mode shape was a cantilever mode, displayed in Fig. 3, which consists of a simple swaying motion from the front to back faces of the specimen. The largest deflections of this mode can be found at the top of the specimen, with the largest equivalent von-Mises stresses being located at the base. The next simulated mode shape was a torsional mode, shown in Fig. 4, which has a distinct twisting motion from side to side. The largest deformations in this mode occur on the sides of the specimen, with the greatest equivalent stresses occurring at the top edge and sides of the specimen. The final simulated mode shape was the plate mode, displayed in Fig. 5, which consists of the center portion of the specimen extruding inwards and outwards, resembling an oscillating drum head. The maximum deformation in this shape occur at the center of the plate faces, with the highest stressed being concentrated at the plate centers and sides of the specimen.
2506

Fig. 3: Cantilever mode (a)
Deflection; (b) Stress. Fig. 4: Torsion mode (a) Deflection; (b) Stress.
Fig. 5: Plate mode (a) Deflection; (b) Stress.
A Harmonic Response simulation was then conducted to provide Frequency Response Function (FRF) plots of the housings. The FRF of a given test specimen establishes a unique ‘fingerprint’, which is a function of both the part’s geometry and mechanical properties. Because each FRF is unique, a side-by-side comparison of both nominal and defective simulated specimens can be used to detect the changes in the modal fingerprints of the specimens, as the processing parameters are varied, with a corresponding shift in mechanical properties. A simulation comparing the first three natural frequencies of specimens with nominal and defective process parameters is shown in Fig. 6. The FRFs shows a decrease in the peak frequencies of the specimen with defective parameters when compared to the nominal specimen. This frequency decrease provides a criterion for discriminating future test specimens with bulk defects because of varied hatch spacing and laser power settings. A specimen with suboptimal process parameters should have decreased natural frequencies when compared to a nominal specimen.
Fig. 6: FRF modal finger print; Nominal (blue); Defective (red dashed); (a) Cantilever mode; (b) Torsion mode; (c)
Plate mode.
2507

To provide a clearer relationship between frequency and mechanical property deviations sensitivity values for the varying process parameters must be established. The sensitivities with respect to density and stiffness, respectively, are
𝒮𝒮𝑓𝑓𝑛𝑛:𝜌𝜌 = 𝜕𝜕𝑓𝑓𝑛𝑛𝜕𝜕𝜌𝜌
(4)
𝒮𝒮𝑓𝑓𝑛𝑛:𝐸𝐸 = 𝜕𝜕𝑓𝑓𝑛𝑛𝜕𝜕𝐸𝐸
(5)
To acquire numerical values for these sensitivities, a series of FEA models were created with small incremental changes to density and stiffness. These values were decreased in intervals of 5% until 80% of the nominal properties was reached. The peak values for the first three natural frequencies were then recorded for each incremental change in material property. Figures 7 and 8 show the frequencies observed changed linearly as density and stiffness varied, thus providing constant sensitivities with respect to these engineering properties. Since the trends were observed to be linear and the experiment only tested components with decreased properties, values greater than the nominal were not included. The calculated sensitivities can be found in Table 2.
Fig. 7: Frequency vs. density of first three natural frequencies
2508

Fig. 8: Frequency vs. stiffness of first three natural frequencies
Table 2: Frequency Sensitivity to Density and Stiffness.
Mode 1 Mode 2 Mode 3 Sensitivity to Density (Hz/g/cc) -56.174 -131.54 -141.54
Sensitivity to Stiffness (Hz/Gpa) 2.323 5.463 5.853
4. Experimental Setup
To test the methodology of identifying components with suboptimal mechanical properties by natural frequencies shifts, five protective housing specimens were printed next to each other on a build plate, shown in Fig. 9. Four specimens were printed with the nominal process parameters of 85 μm hatch spacing. Specimen four was printed with suboptimal process parameters of 150 µm hatch spacing.
Fig. 9: Protective housing test specimens. (Specimens will be referred to their given number from here on)
2509

The build plate was excited with a periodic-chirp using an electrodynamic shaker and a Ploytec Scanning Laser Doppler Vibrometer (LDV) was used to measure the kinetic responses of each specimen. The LDV measured the velocity at 63 predefined scan points on each specimen and were then combined into a visual model to create mode shapes of the specimens for comparison to the mode shapes generated by the FEA simulations
The LDV measurement was performed with the build plate freely supported by four air bearings, shown in Fig. 10. An accelerometer and force transducer were attached to normalize the specimen responses by force applied and to collect phase and coherence information. A sinusoidal chirp excitation was then applied to the mounting plate in the frequency range of 0.01-5 kHz.
Fig. 10: LDV test setup. (a) Electrodynamic shaker; (b) Impedance transducer; (c) Air bearing platform; (d)
Scanning LDV.
When the experimental FRFs were analyzed, the results showed a large amount of mode splitting, visible in the double peak present in Fig. 11. Mode splitting is a phenomenon that occurs when multiple specimens with similar natural frequencies undergo the same excitation. The vibration energy between the specimens couple to the build plate, which can then shift the FRF that results in two closely neighboring peaks on the FRF plot [9]. To eliminate this phenomenon, a damping media, modeling clay, was placed on the neighboring test specimens before the LDV measurement. The damping media shifts the neighboring specimen’s natural frequency away from that of the specimen being tested, eliminating mode splitting. This technique minimized the appearance of mode splitting providing a smooth FRF shown in Fig. 12.
(a) (b)
(c)
(d)
2510
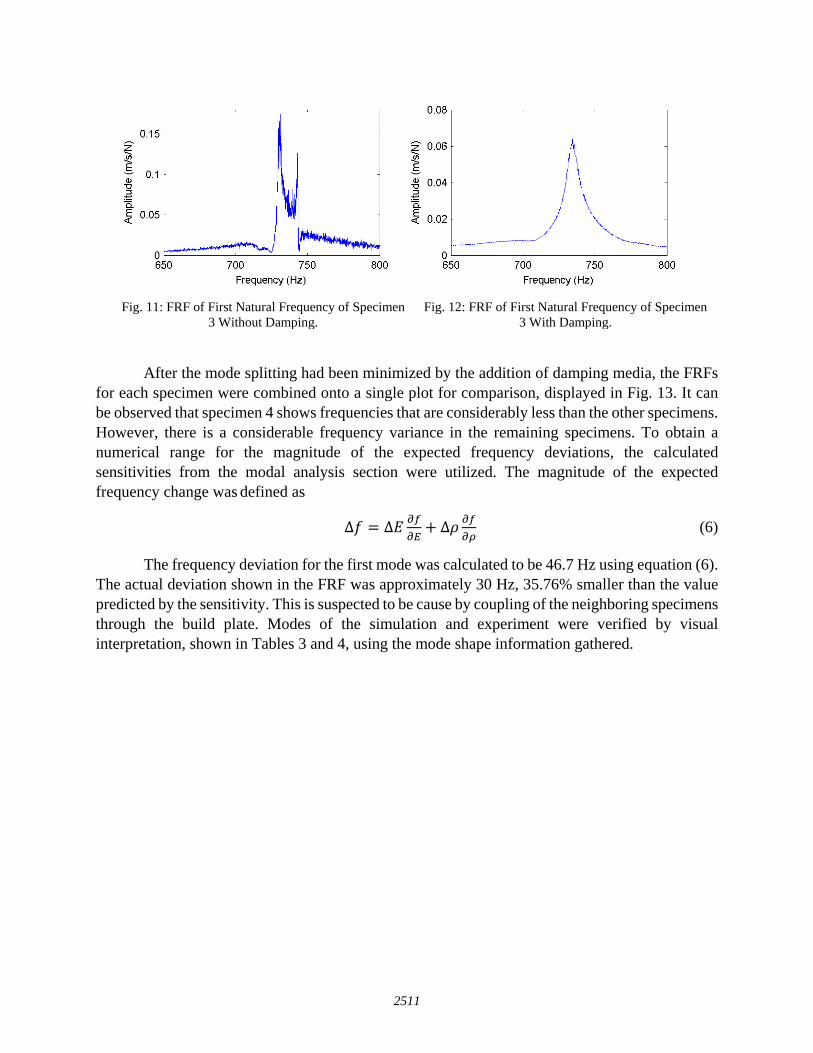
Fig. 11: FRF of First Natural Frequency of Specimen 3 Without Damping.
Fig. 12: FRF of First Natural Frequency of Specimen 3 With Damping.
After the mode splitting had been minimized by the addition of damping media, the FRFs for each specimen were combined onto a single plot for comparison, displayed in Fig. 13. It can be observed that specimen 4 shows frequencies that are considerably less than the other specimens. However, there is a considerable frequency variance in the remaining specimens. To obtain a numerical range for the magnitude of the expected frequency deviations, the calculated sensitivities from the modal analysis section were utilized. The magnitude of the expected frequency change was defined as
∆𝑓𝑓 = ∆𝐸𝐸 𝜕𝜕𝑓𝑓𝜕𝜕𝐸𝐸
+ ∆𝜌𝜌 𝜕𝜕𝑓𝑓𝜕𝜕𝜌𝜌
(6)
The frequency deviation for the first mode was calculated to be 46.7 Hz using equation (6). The actual deviation shown in the FRF was approximately 30 Hz, 35.76% smaller than the value predicted by the sensitivity. This is suspected to be cause by coupling of the neighboring specimens through the build plate. Modes of the simulation and experiment were verified by visual interpretation, shown in Tables 3 and 4, using the mode shape information gathered.
2511

Fig. 13: LDV generated FRF plot of test specimens.
2512
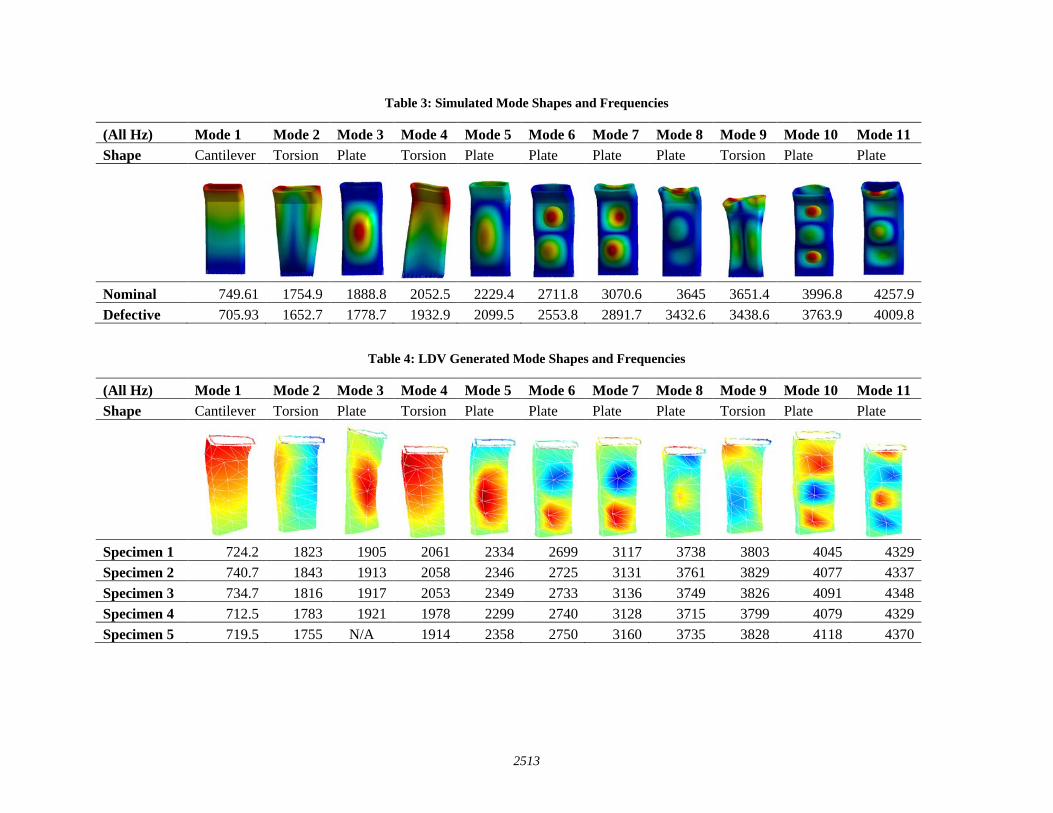
Table 3: Simulated Mode Shapes and Frequencies
(All Hz) Mode 1 Mode 2 Mode 3 Mode 4 Mode 5 Mode 6 Mode 7 Mode 8 Mode 9 Mode 10 Mode 11 Shape Cantilever Torsion Plate Torsion Plate Plate Plate Plate Torsion Plate Plate
Nominal 749.61 1754.9 1888.8 2052.5 2229.4 2711.8 3070.6 3645 3651.4 3996.8 4257.9 Defective 705.93 1652.7 1778.7 1932.9 2099.5 2553.8 2891.7 3432.6 3438.6 3763.9 4009.8
Table 4: LDV Generated Mode Shapes and Frequencies
(All Hz) Mode 1 Mode 2 Mode 3 Mode 4 Mode 5 Mode 6 Mode 7 Mode 8 Mode 9 Mode 10 Mode 11 Shape Cantilever Torsion Plate Torsion Plate Plate Plate Plate Torsion Plate Plate
Specimen 1 724.2 1823 1905 2061 2334 2699 3117 3738 3803 4045 4329 Specimen 2 740.7 1843 1913 2058 2346 2725 3131 3761 3829 4077 4337 Specimen 3 734.7 1816 1917 2053 2349 2733 3136 3749 3826 4091 4348 Specimen 4 712.5 1783 1921 1978 2299 2740 3128 3715 3799 4079 4329 Specimen 5 719.5 1755 N/A 1914 2358 2750 3160 3735 3828 4118 4370
2513

5. Discussion of Results
Based on the results of experiment, the specimen printed with suboptimal parameters had lower resonant frequencies than the nominal specimens. The experimental results show the torsional and plate modes to have higher frequencies than predicted by the simulations and larger frequency variance in the torsional modes compared to other modes. The simulated results do not show this trend. The same phenomenon has been observed using similar testing methods on composite structures [10]. Specimen five showed a large frequency decrease in the first two torsional modes shapes. However, the higher frequency modes showed vary little variations from the other nominal specimens. The FRF of specimen five shows significant noise in this frequency range. The first plate mode could not be identified at all. It is possible that specimen five could be an unintentional defective part. Further destructive testing is required to confirm this hypothesis.
The resonant frequencies of the four nominal specimens were not as closely grouped as the simulation predicted. This could be because each individual part has greater variation in its mechanical properties than expected. Also, each individual specimen could have variance in its damping properties. This could provide an explanation for the modes’ peak magnitudes considerably varying from the simulated values. A better understanding of multiple specimen modal interaction and developing sensitivities to include other important modal parameters will be essential to establish a more rigorous acceptance criterion. Future testing of the components, including establishing density and geometry variations, may help in explaining the observed inconsistent modal responses.
6. Summary and Future Work
In this study, modal analysis was performed on five additively manufactured protective housing specimens. Hatch spacing was altered from the nominal value when fabricating one of the specimens, intentionally weakening it. ANSYS simulations of the housings were performed to predict what type of frequency deviations the altered process parameter would cause. The specimens were then evaluated using modal analysis with an electrodynamic shaker table and a scanning LDV. The experimental FRFs were then analyzed for variations that could indicate suboptimal mechanical properties.
Overall, modal analysis fingerprinting identified frequency deviations in a component with known decreased mechanical properties. The experimental results showed decreased frequencies in the test specimen fabricated with a non-nominal hatch spacing. However, the frequency deviations were not as large as those predicted by FEA simulations. There were also unexplained frequency deviations in another nominally printed specimen. It is possible that this method could have identified a component unintentionally manufactured with suboptimal mechanical properties. However further statistical analysis and destructive testing are required to confirm this hypothesis. Future work will include utilizing this method on topologically optimized components. Future components will be based off actual components with specified loading constraints. This will allow for ease of destructive testing and provide constraints for the resulting data to be compared to. This method will also be applied to components with point defects such as voids and delaminated layers.
2514
7. References
[1] Gibson, I., Rosen, D. W., & Stucker, B. (2010). Additive manufacturing technologies (Vol. 238). New York: Springer.
[2] Cherry, J. A., Davies, H. M., Mehmood, S., Lavery, N. P., Brown, S. G. R., and Sienz, J. (2015). Investigation into the effect of process parameters on microstructural and physical properties of 316L stainless steel parts by selective laser melting. The International Journal of Advanced Manufacturing Technology, 76(5-8), 869-879.
[3] Tolosa, I., Garciandía, F., Zubiri, F., Zapirain, F., and Esnaola, A. (2010). Study of mechanical properties of AISI 316 stainless steel processed by “selective laser melting”, following different manufacturing strategies. The International Journal of Advanced Manufacturing Technology, 51(5), 639-647.
[4] Delgado, J., Ciurana, J., and Rodríguez, C. A. (2012). Influence of process parameters on part quality and mechanical properties for DMLS and SLM with iron-based materials. The International Journal of Advanced Manufacturing Technology, 60(5-8), 601-610.
[5] Herman, G. T. (2009). Fundamentals of computerized tomography: image reconstruction from projections. Springer Science and Business Media.
[6] Waller, J. M., Parker, B. H., Hodges, K. L., Burke, E. R., Walker, J. L., and Generazio, E. R. (2014). Nondestructive Evaluation of Additive Manufacturing. National Aeronautics and Space Administration.
[7] Aboulkhair, N. T., Everitt, N. M., Ashcroft, I., & Tuck, C. (2014). Reducing porosity in AlSi10Mg parts processed by selective laser melting. Additive Manufacturing, 1, 77-86.
[8] Rao, S. S. (2004). Mechanical Virbrations (4th ed.). Upper Saddle River, NJ: Pearson Education, Inc.
[9] Pribe, J.D., West, B.M., Gegel, M.L., Hartwig, T., Lunn, T., Brown, B., Bristow, D.A., Landers, R.G., and Kinzel, E.C., 2016, “Modal Response as a Validation Technique for Metal Parts Fabricated with Selective Laser Melting,” Twenty Seventh Annual Solid Freeform Fabrication Symposium, Austin, Texas, August 8–10, pp. 151–174.
[10] Kessler, Seth S., et al. "Damage detection in composite materials using frequency response methods." Composites Part B: Engineering 33.1 (2002): 87-95.
2515