towards atomistic understanding of · pdf file2.3.5 dehydroxylation of silica nanoparticles....
TRANSCRIPT
TOWARDS ATOMISTIC UNDERSTANDING OF CATALYTIC NANOPARTICLES ON
AMORPHOUS SUPPORTS
by
Christopher S. Ewing
Bachelor of Science in Chemical Engineering, Pennsylvania State University, 2010
Submitted to the Graduate Faculty of
the Swanson School of Engineering in partial fulfillment
of the requirements for the degree of
Doctor of Philosophy
University of Pittsburgh
2015
ii
UNIVERSITY OF PITTSBURGH
THE SWANSON SCHOOL OF ENGINEERING
This dissertation was presented
by
Christopher S. Ewing
It was defended on
July 21st, 2015
and approved by
Albert Chi Fu To, Ph.D., Associate Professor, Department of Mechanical Engineering and
Materials Science
Joseph J. McCarthy, Ph.D., W.K. Whiteford Professor, Department of Chemical and
Petroleum Engineering
Gӧtz Veser, Ph.D., Nickolas A. DeCecco Professor, Department of Chemical and Petroleum
Engineering
Dissertation Director: J. Karl Johnson, Ph.D., Professor, Department of Chemical and
Petroleum Engineering

iii
Copyright © by Christopher S. Ewing
2015
iv
Metal nanoparticles (NPs) have attracted considerable attention in heterogeneous catalysis due to
their unique nanoscale properties. However, rational design and optimization of supported NP
catalysts requires an accurate description of metal-support interactions, which can significantly
impact NP stability and catalytic activity. The ability to calculate NP interactions with
amorphous supports, which are commonly used in industrial practice, has been inhibited by a
lack of accurate atomically-detailed models of amorphous surfaces.
We have developed an approach for constructing atomistic models of amorphous silica
surfaces, using a combination of classical molecular modeling and density functional theory
(DFT) calculations. To experimentally validate our model, we developed an emulsion synthesis
procedure yielding mono-disperse 6 nm silica NPs, and a simple approach for high-yield
separation of stable NPs from solution. Remarkably, our model accurately reproduces the
experimental silanol number and silanol distribution over a wide temperature range, without any
adjustable parameters.
We next developed a systematic approach for generating distributions of model NP/SiO2
structures using the discrete element method in conjunction with DFT. Using these structures, we
TOWARDS ATOMISTIC UNDERSTANDING OF CATALYTIC NANOPARTICLES
ON AMORPHOUS SUPPORTS
Christopher S. Ewing, PhD
University of Pittsburgh, 2015
v
studied NP-support interactions between amorphous silica and metal NPs ranging from 0.7 – 1.7
nm in diameter (13 – 147 atoms). Both NP adhesion energetics and charge transfer are local in
nature, and depend on the silica hydroxyl density. Because surface hydroxyl content is directly
dependent on temperature, our results suggest that both electronic charge and catalyst stability
can be tuned via the silica pretreatment temperature, the latter of which we have experimentally
validated using in situ X-ray diffraction. Finally, exploiting the local nature of NP-support
interactions, we developed a method for predicting NP-support effects of different NP sizes and
geometries based on correlations calculated for 13-atom NPs.
In this work, we show that an accurate atomistic description of not only amorphous
surfaces, but also interactions between NPs and those surfaces can be achieved. Additionally, we
developed a similar method for generating model systems of single-atom catalysts on amorphous
supports. Insights into the role of catalyst-support interactions on catalyst structure and function
gained from these atomistic models may serve to guide the design/optimization of catalytic
materials.
vi
TABLE OF CONTENTS
TITLE PAGE ................................................................................................................................. I
COMMITTEE MEMBERS PAGE ............................................................................................ II
ABSTRACT ................................................................................................................................. IV
PREFACE ................................................................................................................................. XXI
1.0 INTRODUCTION ........................................................................................................ 1
1.1 AMORPHOUS SILICA ...................................................................................... 1
1.2 SUPPORTED CATALYSTS .............................................................................. 4
2.0 ACCURATE AMORPHOUS SILICA SURFACE MODELS FROM FIRST
PRINCI-PLES THERMODYNAMICS OF SURFACE DEHYDROXYLATION ................ 5
2.1 INTRODUCTION ............................................................................................... 5
2.1.1 What we know from experiments. .................................................................. 6
2.1.2 Previous Amorphous Silica Surface Models. ................................................. 8
2.1.3 Significance. .................................................................................................... 10
2.2 MODELING AND EXPERIMENTAL METHODS ...................................... 11
2.2.1 Generation of Amorphous Silica Surfaces. .................................................. 11
2.2.2 Synthesis and Characterization of Silica Nanoparticles. ............................ 13
2.3 RESULTS AND DISCUSSION ........................................................................ 14
2.3.1 Simulating Dehydroxylation. ......................................................................... 14
vii
2.3.2 Statistical Thermodynamics Model. ............................................................. 18
2.3.3 Accurate Reproduction of Experimentally Measured Silanol Number. ... 18
2.3.4 Accurate Reproduction of Measured Silanol Distribution. ........................ 22
2.3.5 Dehydroxylation of Silica Nanoparticles. ..................................................... 24
2.4 CONCLUSIONS ................................................................................................ 29
3.0 STRUCTURAL AND ELECTRONIC PROPERTIES OF PT13
NANOCLUSTERS ON AMORPHOUS SILICA SUPPORTS .............................................. 30
3.1 INTRODUCTION ............................................................................................. 30
3.2 METHOD ........................................................................................................... 33
3.2.1 Computational Details. .................................................................................. 33
3.2.2 Model Amorphous Surfaces. ......................................................................... 33
3.2.3 Generating Initial Structures. ....................................................................... 35
3.2.4 Simulating NP Adsorption. ............................................................................ 37
3.3 RESULTS AND DISCUSSION ........................................................................ 39
3.3.1 NP-Support Binding Interactions. ................................................................ 39
3.3.2 Nanoparticle Stability Depends on Support Preparation. .......................... 41
3.3.3 Metal-Support Interactions Significantly Affect Pt Structure. .................. 44
3.3.4 Electronic Structure is Affected by Both Reconstruction and Metal-
Support Bonds. ........................................................................................................... 48
3.4 CONCLUSIONS ................................................................................................ 56
4.0 EFFECT OF SUPPORT PREPARATION AND NANOPARTICLE SIZE ON
CATALYST-SUPPORT INTERACTIONS BETWEEN PT AND AMORPHOUS SILICA
………………………………………………………………………………………...58
viii
4.1 INTRODUCTION ............................................................................................. 58
4.2 METHOD ........................................................................................................... 60
4.2.1 Computational details. ................................................................................... 60
4.2.2 Model amorphous silica surfaces. ................................................................. 61
4.2.3 Pt nanoparticles. ............................................................................................. 62
4.2.4 Simulating NP adsorption. ............................................................................. 62
4.3 RESULTS AND DISCUSSION ........................................................................ 64
4.3.1 Number of interfacial bonds depends on NP size and silica hydroxyl
density. ........................................................................................................................ 65
4.3.2 Pt-O bonds result in charge transfer from Pt to support. .......................... 67
4.3.3 Silica surface hydroxyls strengthen nanoparticle adhesion. ...................... 69
4.3.4 Pt13 results can be used to predict properties of larger NPs. ...................... 71
4.4 CONCLUSIONS ................................................................................................ 73
5.0 PREDICTING CATALYST-SUPPORT INTERACTIONS BETWEEN METAL
NANOPARTICLES AND AMORPHOUS SILICA SUPPORTS .......................................... 75
5.1 INTRODUCTION ............................................................................................. 75
5.2 METHOD ........................................................................................................... 76
5.2.1 Model amorphous silica surfaces. ................................................................. 76
5.2.2 Metal nanoparticles. ....................................................................................... 77
5.2.3 Simulating NP adsorption. ............................................................................. 78
5.2.4 Density functional theory calculations.......................................................... 79
5.2.5 Calculating nanoparticle properties. ............................................................ 80
5.3 RESULTS AND DISCUSSION ........................................................................ 81
ix
5.3.1 Adhesion energy and charge predicted from hydroxyl density and NP
size/geometry. ............................................................................................................. 81
5.3.2 Predicting favorable NP geometries. ............................................................ 84
5.3.3 Predicting effects of NP-support charge transfer. ....................................... 89
5.3.4 Linear correlations apply to other metals. ................................................... 89
6.0 IMPACT OF SUPPORT INTERACTIONS FOR SINGLE-SITE
MOLYBDENUM CATALYSTS ON AMORPHOUS SILICA .............................................. 94
6.1 INTRODUCTION ............................................................................................. 94
6.2 METHOD ........................................................................................................... 96
6.2.1 Model amorphous silica surfaces. ................................................................. 96
6.2.2 Generating isolated metal center sites. ......................................................... 97
6.2.3 Density functional theory calculations.......................................................... 97
6.3 RESULTS AND DISCUSSION ........................................................................ 98
6.3.1 Generating low-energy isolated metal center sites. ..................................... 98
6.3.2 Cluster model site energies are correlated with Si-Si distance................. 101
6.3.3 Mo sites on periodic surface models. .......................................................... 104
6.4 CONCLUSIONS .............................................................................................. 109
7.0 SIMPLE TRANSFERABLE APPROACH FOR HIGH-YIELD SEPARATION
OF STABLE NANOPARTICLES .......................................................................................... 111
7.1 INTRODUCTION ........................................................................................... 111
7.2 EXPERIMENTAL ........................................................................................... 113
7.2.1 Synthesis of 6 nm silica. ............................................................................... 113
7.2.2 Synthesis of Silica Support Materials. ........................................................ 113
x
7.2.3 Synthesis of platinum nanoparticles. .......................................................... 113
7.2.4 Conventional synthesis of Pt/SiO2. .............................................................. 114
7.2.5 Characterization of nanomaterials. ............................................................ 114
7.2.6 Nanoparticle separation via salt recrystallization. .................................... 114
7.3 RESULTS AND DISCUSSION ...................................................................... 115
7.3.1 Separation of 6 nm silica. ............................................................................. 115
7.3.2 Separation of 4 nm Pt. .................................................................................. 119
7.3.3 Synthesis of Pt/SiO2 Catalyst. ...................................................................... 119
7.3.4 Protected Annealing of 2.5 nm Pt. .............................................................. 122
7.4 CONCLUSIONS .............................................................................................. 124
8.0 FUTURE WORK ..................................................................................................... 126
8.1 EFFECTS OF NANOPARTICLE SUPPORT EFFECTS ........................... 126
8.2 PREDICTING NANOPARTICLE-SUPPORT INTERACTIONS ............ 128
APPENDIX A ............................................................................................................................ 129
BIBLIOGRAPHY ..................................................................................................................... 178

xi
LIST OF TABLES
Table 7.1. Duration of synthesis and separation steps for producing 6 nm silica NPs using conventional and salt methods. ....................................................................................... 116
Table A1.1. Comparison of bulk system properties computed from DFT in this work to experiments and other modeling results. ........................................................................ 130
Table A2.1: Percent contribution of deformation energy to the adsorption energy Edef + Eint, defined as . ....................................................................................................... 148
Table A2.2: HOMO of representative supported and unsupported Pt13 clusters. (iso-value: 0.05)......................................................................................................................................... 155
Table A2.3: LUMO of representative supported and unsupported Pt13 clusters. (iso-value: 0.05)......................................................................................................................................... 156
Table A3.1. Energy of unsupported Pt147 for different minimum cell dimension. .................... 157
Table A3.2. Linear fits (second row) of the adhesion energy (y) as a function of the number of Pt-silica bonds (x) and the net NP charge (y') as a function of the number of Pt-silica bonds (x). ........................................................................................................................ 164
Table A4.1. Linear fits (second row) of the adhesion energy (y) as a function of the number of Pt-silica bonds (x) and the net NP charge (y') as a function of the number of Pt-silica bonds (x). ........................................................................................................................ 169
Table A4.2: Coefficients of determination (R2) for Au and Pd NPs computed using the data for the NP in that row and a linear fit to the corresponding 13-atom NP data. .................... 172
Table A4.3: Parameters for linear fits to the non-vdW adhesion energy per bond for all NPs calculated using DFT in this study.................................................................................. 172
Table A4.4: Parameters for linear fits to the net charge per bond for all NPs calculated using DFT in this study. ........................................................................................................... 172
xii
LIST OF FIGURES
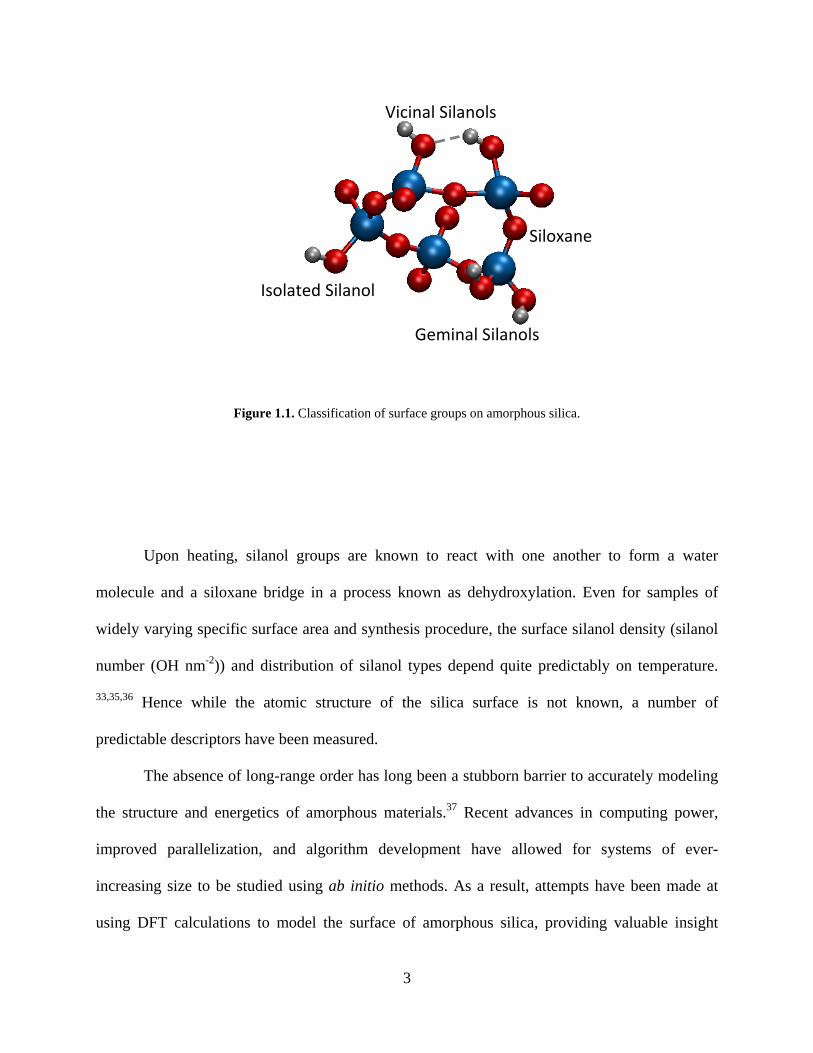
Figure 1.1. Classification of surface groups on amorphous silica. ................................................. 3
Figure 2.1. Experimentally measured silanol number as a function of temperature for 16 samples having different synthesis procedures and specific surface areas spanning 9.5 – 905 m2/g.52 ....... 8
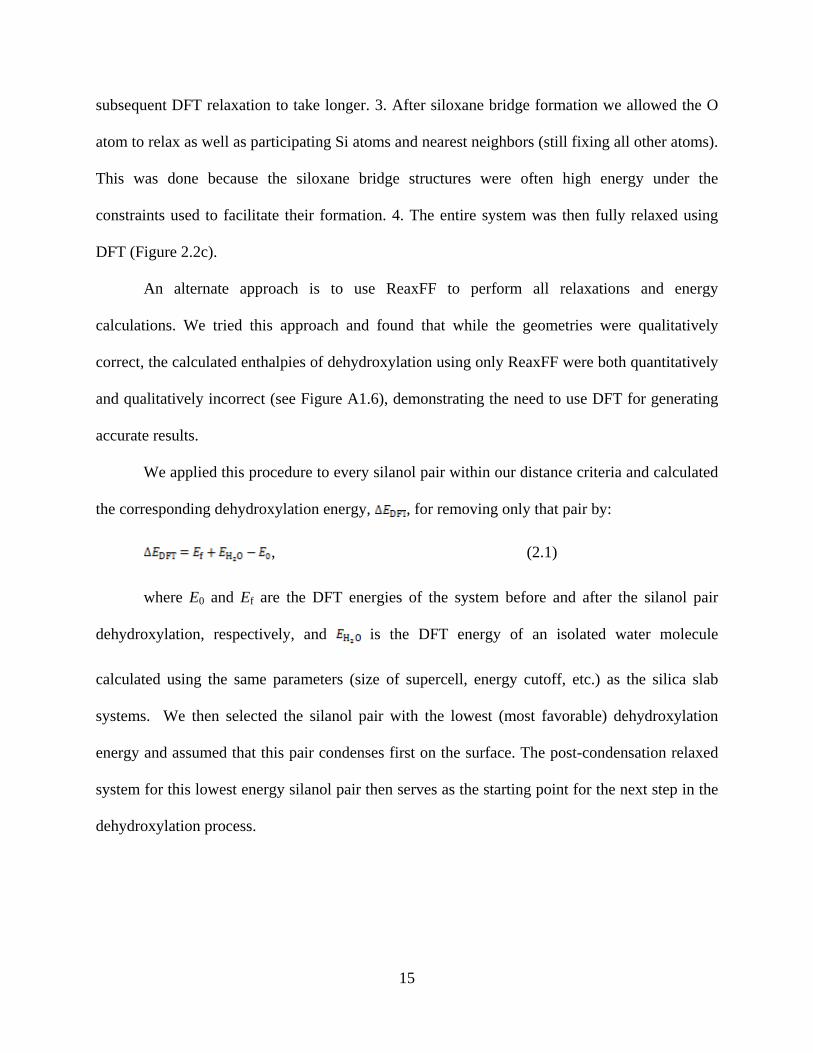
Figure 2.2. Procedure for simulating dehydroxylation. (a) Silanol groups within range to condense are identified. (b) OH groups are removed and an oxygen atom is inserted at an estimated equilibrium position. (c) First and second neighbors are relaxed with ReaxFF to form a siloxane bridge, followed by relaxation of the entire system with DFT. ...................................... 16
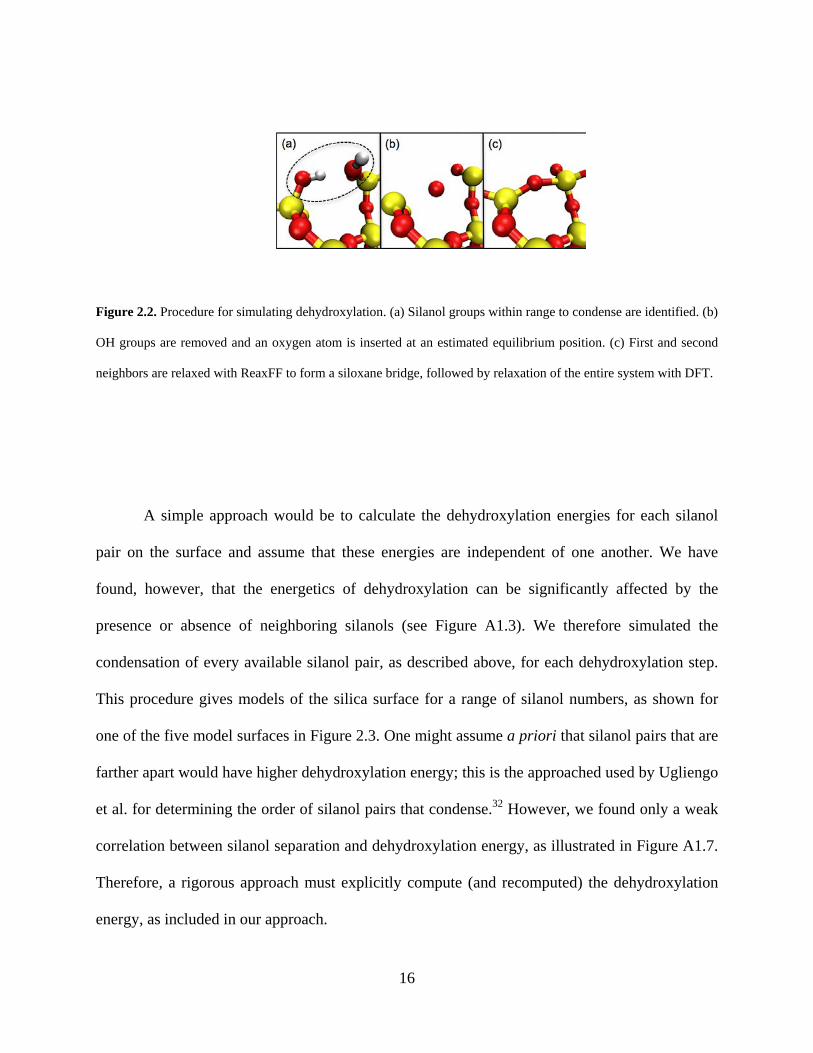
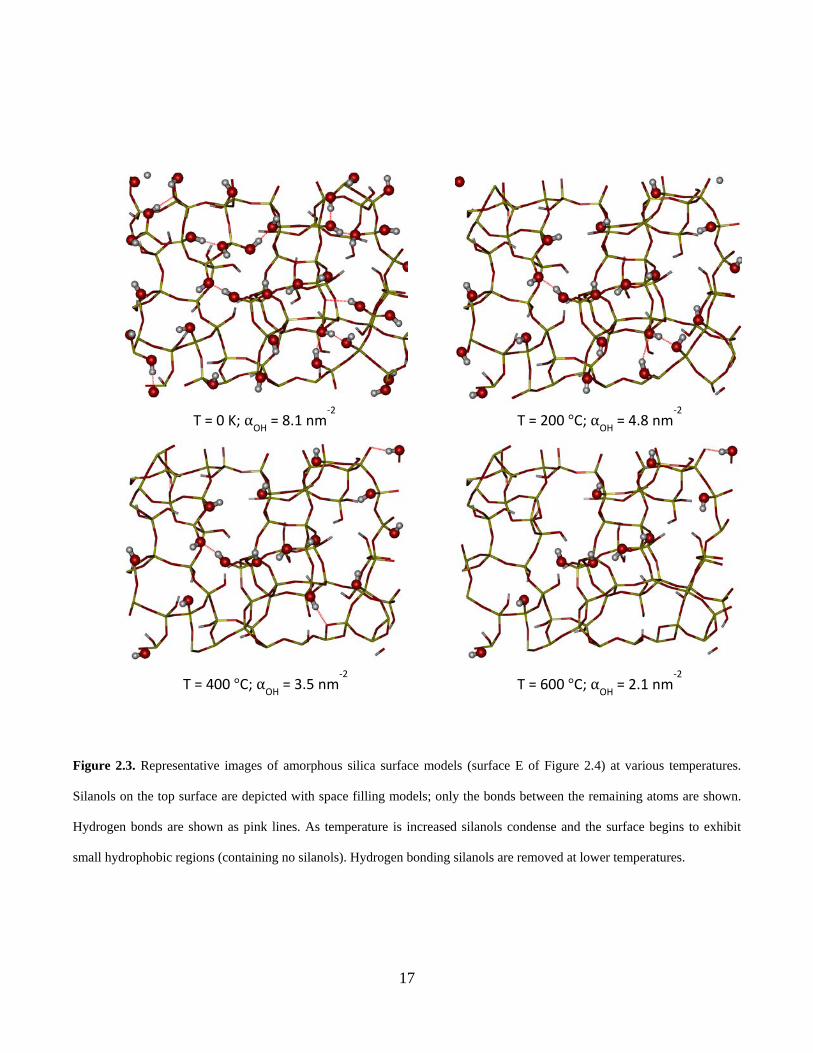
Figure 2.3. Representative images of amorphous silica surface models (surface E of Figure 2.4) at various temperatures. Silanols on the top surface are depicted with space filling models; only the bonds between the remaining atoms are shown. Hydrogen bonds are shown as pink lines. As temperature is increased silanols condense and the surface begins to exhibit small hydrophobic regions (containing no silanols). Hydrogen bonding silanols are removed at lower temperatures........................................................................................................................................................ 17
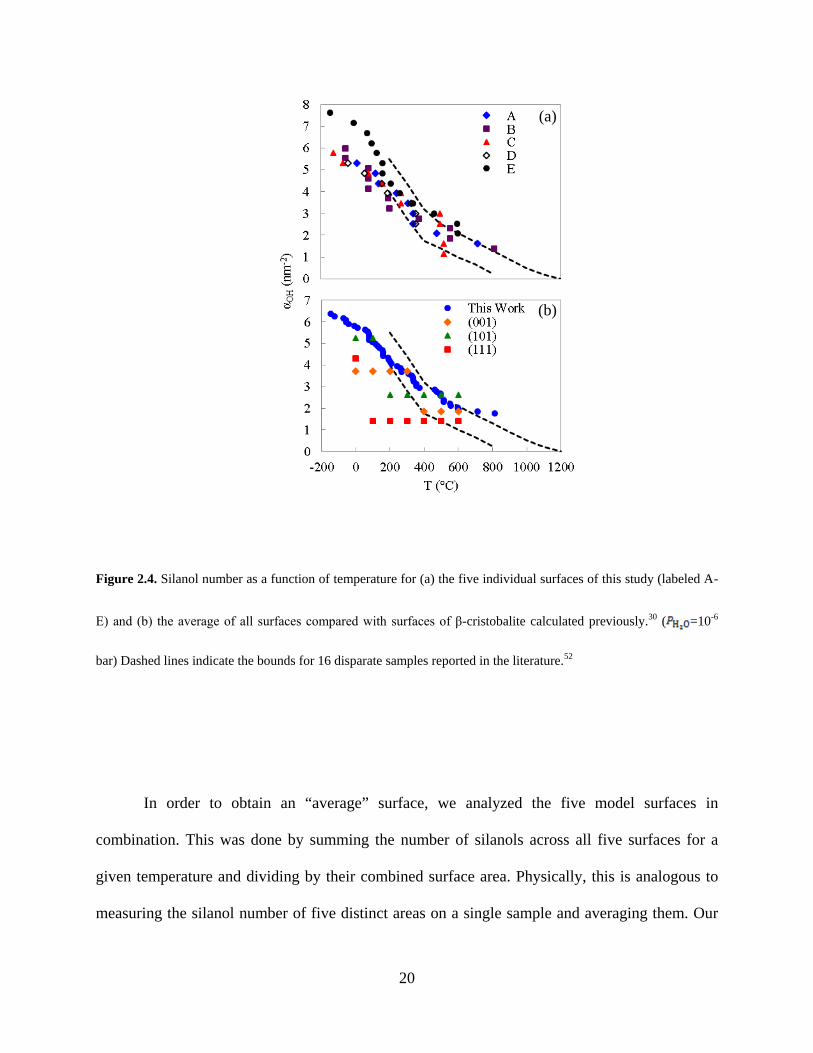
Figure 2.4. Silanol number as a function of temperature for (a) the five individual surfaces of this study (labeled A-E) and (b) the average of all surfaces compared with surfaces of β-cristobalite
calculated previously.30 ( =10-6 bar) Dashed lines indicate the bounds for 16 disparate samples
reported in the literature.52 ............................................................................................................ 20
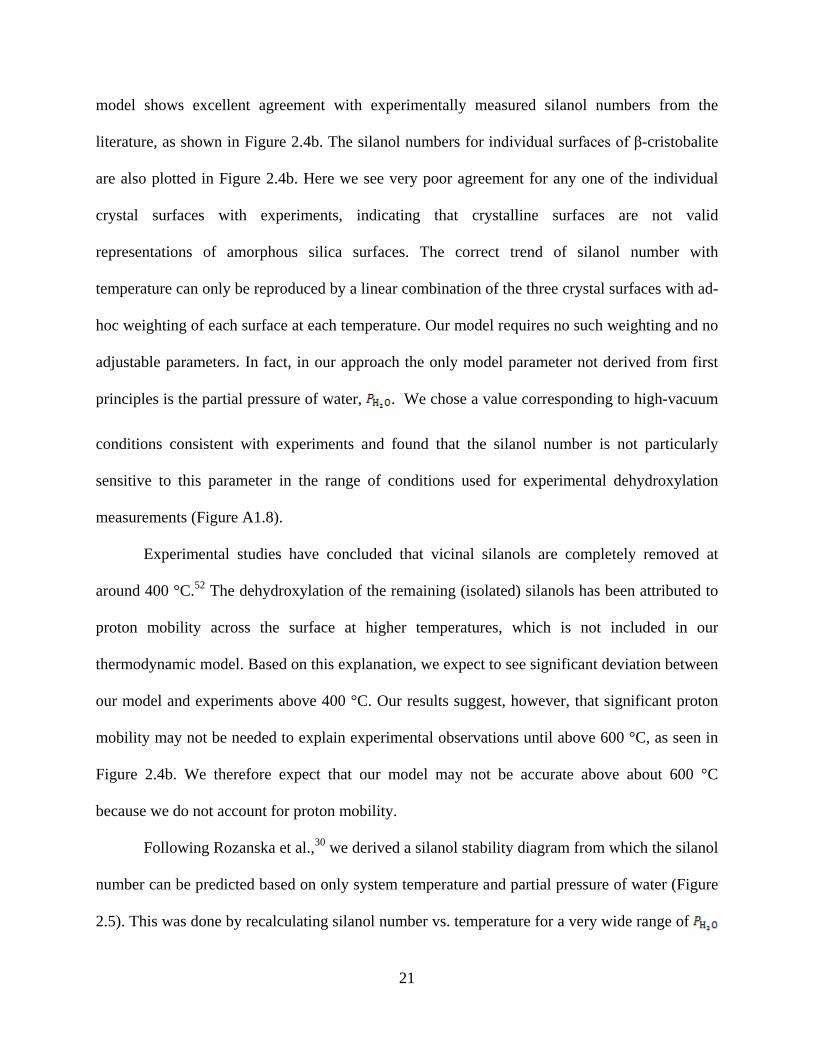
Figure 2.5. Silanol number as a function of temperature and partial pressure of water. The white area indicates no silanol groups are within range to condense directly. ....................................... 22
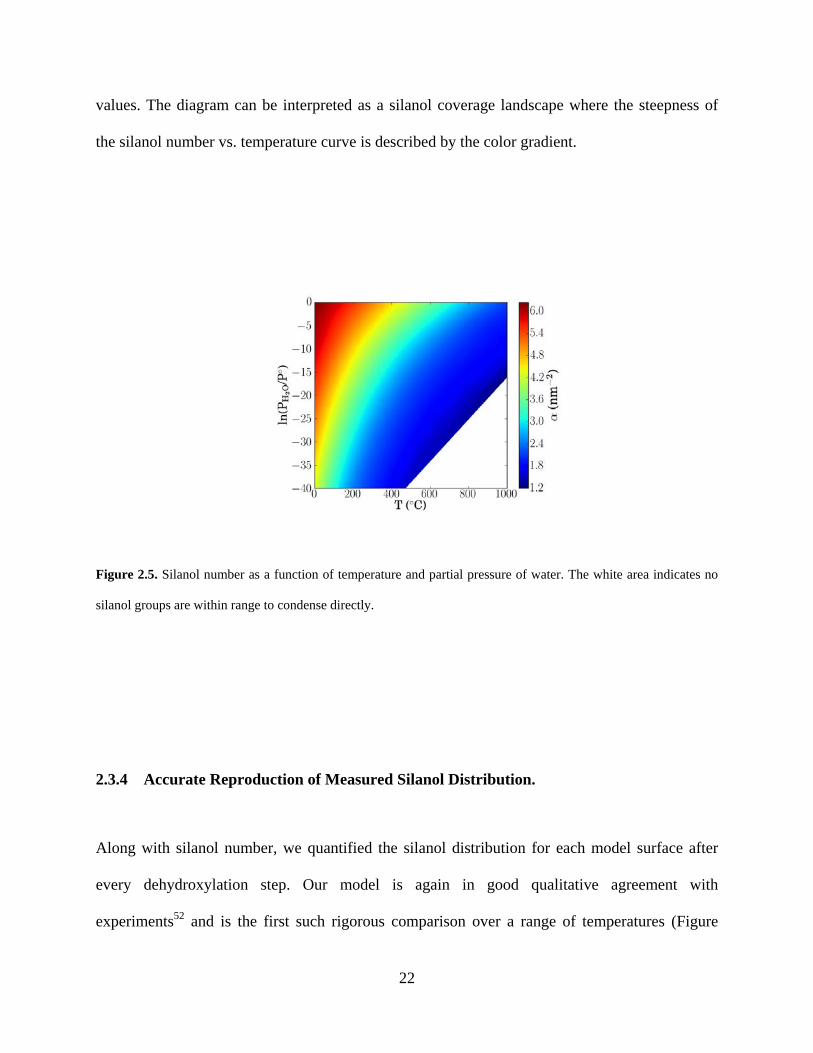
Figure 2.6. Distribution of silanol groups as a function of temperature ( =10-6 bar) for
simulation results (points) and experimental averages52 (lines). .................................................. 23
xiii
Figure 2.7. Experimental data for silica nanoparticles used in this study. (a) TEM images showing uniform size (left) and spherical shape (right). Particle diameter is ~6 nm, corresponding to a specific surface area (SA) of 460 m2/g (assuming spherical shape and a density of 2.2 g/cm3). SA = 488 m2/g as measured by the BET method. (b) Silanol number as a function of temperature measured for 6 nm silica nanoparticles (solid line) and calculated from
our model surfaces (points) assuming =10-6 bar. Dashed lines indicate the bounds reported in
the literature.52 ............................................................................................................................... 26
Figure 2.8. (a) Silanol number (filled circles) and average angle of existing Si-O-Si bridges (open diamonds) and (b) Si-O-Si angle of newly formed siloxane bridges, as a function of temperature. Dashed line indicates the equilibrium Si-O-Si bond angle for α-quartz (144 °), the most thermodynamically stable silica polymorph. ................................................................................ 27
Figure 3.1. Top-down view of the structures used in this study: (a) Amorphous silica surfaces corresponding to pretreatment temperatures of 200 °C and 570 °C, based on analysis of experimental data by Zhuravlev.52 Different types of silanol groups are illustrated. (b) Two initial orientations of cuboctahedral Pt13 corresponding to (100) (top) and (111) (bottom) surfaces facing downward upon adsorption. Images were rendered using VMD.116 ................................. 36
Figure 3.2. Procedure for simulating NP adsorption. (a) An NP having one of two different orientations is dropped to the surface from one of 20 xy grid points. Two surfaces are used, each having a different pretreatment temperature, giving a total of 80 different systems. (b) The NP is allowed to rotate using rigid-body approximations and hard-sphere interactions. (c) Pt-O bonds are facilitated by removing H atoms in contact with Pt. (d) The entire system is locally relaxed using DFT. .................................................................................................................................... 39
Figure 3.3. Distribution of the number of Pt-silica bonds (both Pt-O and Pt-Si) for silica surface pretreatment temperatures of 200 and 570 °C, having αOH values of 4.4 and 1.6 nm2, respectively. .................................................................................................................................. 41
Figure 3.4: Pt-silica interaction energy as a function of the number of bonds formed between the silica surface and the Pt cluster. The line is a least-squares fit to the data. The coefficient of determination is R2 = 0.97, the slope, which is an estimate of the energy per bond, is -3.3 eV. .. 44
Figure 3.5. (a) Distribution of atomic coordination numbers for Pt13 clusters averaged over all 80 systems in this study. Black: unsupported Pt13 cluster; Red & Blue: cluster optimized after placement on silica support. (* denotes any atom type). (b) Average coordination number vs number of Pt-silica bonds for all 80 systems in this study. U indicates unsupported. Error bars show standard deviation for both (a) and (b). ............................................................................... 46
xiv
Figure 3.6. (a) Mean Pt-Pt bond length as a function of number of bonds between Pt and silica, averaged over all 80 systems in this study. U indicates the unsupported NP. Error bars show the standard deviation. (b) Mean Pt-Pt bond length, dPt-Pt, as a function of the average Pt-Pt coordination number for each of the 80 supported clusters. Red circle: unsupported Pt13 cluster. The line is a least-squares fit having R2 = 0.76. ........................................................................... 48
Figure 3.7. (a) Net charge of Pt cluster (Bader charges) as a function of the number of silica O atoms bonding to the Pt cluster. Data for clusters with one Pt-Si bond are shown as blue circles. The line is a linear fit to the data (excluding systems with Pt-Si bonds). The coefficient of determination is R2 = 0.98. The slope, which is an estimate of the charge transferred per Pt-O bond, is 0.47. (b) Atomic charge on individual Pt atoms as a function of Pt-* coordination number for all Pt atoms in all supported clusters. Red plus signs, blue circles, green triangles, and black x symbols correspond to atoms at the Pt-silica interface, bonded to Si, unsupported cluster, and all other atoms, respectively. The line is a linear fit to the data points represented as x symbols. ........................................................................................................................................ 50
Figure 3.8. Distribution of charges on a supported Pt13 cluster with two Pt-O bonds. Atoms bonding to hydroxyls and their neighbors clearly undergo charge depletion whereas low coordinated atoms not near the silica surface have slightly negative charges. ............................. 51
Figure 3.9. Representative images of the HOMO and LUMO for unsupported cuboctahedral Pt13, Pt13/SiO2, and Pt13/SiO2 with silica atoms removed. .................................................................... 55
Figure 4.1. (a) Distribution of the number of Pt-silica bonds for Pt NPs with 13, 55, and 147 atoms. Data for each NP size are averaged over five different silica surfaces, with average silica pre-treatment temperature (Tpre) values of 200 and 570 °C. (b) Average number of Pt-Silica bonds (each point represents the average number of Pt-silica bonds for 80 grid points over two NP orientations on a single silica surface) as a function of the silica hydroxyl density. (c) Average number of Pt-silica bonds per NP as a function of Tpre calculated based on polynomial fits of data in (b). ........................................................................................................................... 64
Figure 4.2. (a) Net charge on the Pt NP as a function of the number of Pt-O bonds for Pt13, Pt55, and Pt147. The line is a least-squares fit to the Pt13 data with regression equation y = 0.457x + 0.0577 (R2 = 0.978). (b) Atomic charge distributions for representative 13, 55, and 147 atom Pt NPs. Charge data were calculated from Bader analysis. .............................................................. 66
Figure 4.3. Adhesion energy vs number of Pt-silica bonds for Pt13, Pt55, and Pt147. The line is a least-squares fit to the Pt13 data with regression equation y = -3.285x – 2.053 (R2 = 0.965). ...... 69
xv
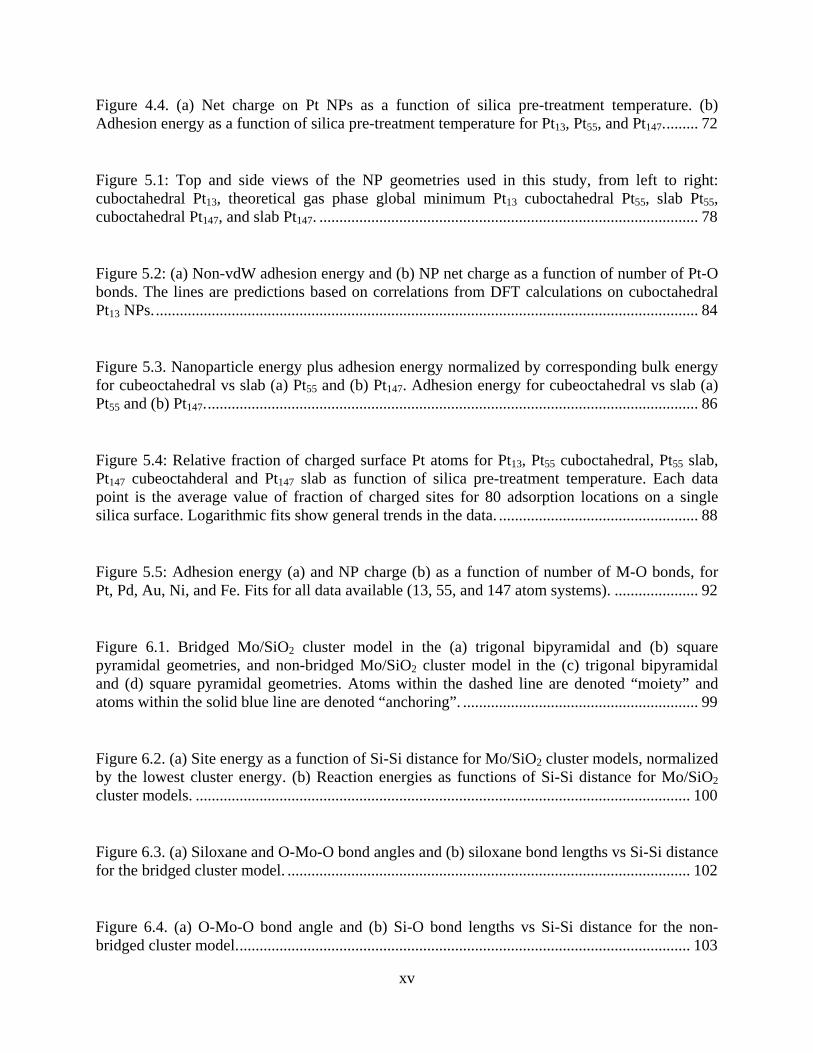
Figure 4.4. (a) Net charge on Pt NPs as a function of silica pre-treatment temperature. (b) Adhesion energy as a function of silica pre-treatment temperature for Pt13, Pt55, and Pt147. ........ 72
Figure 5.1: Top and side views of the NP geometries used in this study, from left to right: cuboctahedral Pt13, theoretical gas phase global minimum Pt13 cuboctahedral Pt55, slab Pt55, cuboctahedral Pt147, and slab Pt147. ............................................................................................... 78
Figure 5.2: (a) Non-vdW adhesion energy and (b) NP net charge as a function of number of Pt-O bonds. The lines are predictions based on correlations from DFT calculations on cuboctahedral Pt13 NPs. ........................................................................................................................................ 84
Figure 5.3. Nanoparticle energy plus adhesion energy normalized by corresponding bulk energy for cubeoctahedral vs slab (a) Pt55 and (b) Pt147. Adhesion energy for cubeoctahedral vs slab (a) Pt55 and (b) Pt147. ........................................................................................................................... 86
Figure 5.4: Relative fraction of charged surface Pt atoms for Pt13, Pt55 cuboctahedral, Pt55 slab, Pt147 cubeoctahderal and Pt147 slab as function of silica pre-treatment temperature. Each data point is the average value of fraction of charged sites for 80 adsorption locations on a single silica surface. Logarithmic fits show general trends in the data. .................................................. 88
Figure 5.5: Adhesion energy (a) and NP charge (b) as a function of number of M-O bonds, for Pt, Pd, Au, Ni, and Fe. Fits for all data available (13, 55, and 147 atom systems). ..................... 92
Figure 6.1. Bridged Mo/SiO2 cluster model in the (a) trigonal bipyramidal and (b) square pyramidal geometries, and non-bridged Mo/SiO2 cluster model in the (c) trigonal bipyramidal and (d) square pyramidal geometries. Atoms within the dashed line are denoted “moiety” and atoms within the solid blue line are denoted “anchoring”. ........................................................... 99
Figure 6.2. (a) Site energy as a function of Si-Si distance for Mo/SiO2 cluster models, normalized by the lowest cluster energy. (b) Reaction energies as functions of Si-Si distance for Mo/SiO2 cluster models. ............................................................................................................................ 100
Figure 6.3. (a) Siloxane and O-Mo-O bond angles and (b) siloxane bond lengths vs Si-Si distance for the bridged cluster model. ..................................................................................................... 102
Figure 6.4. (a) O-Mo-O bond angle and (b) Si-O bond lengths vs Si-Si distance for the non-bridged cluster model. ................................................................................................................. 103
xvi
Figure 6.5. (a) Normal site energy as a function of Si-Si distance for Mo sites on full silica surface models. (b) Reaction energy as a function of Si-Si distance for Mo sites on full silica surface models. ........................................................................................................................... 106
Figure 6.6. Contour plots relating calculated energies to Si-Si distance and O-O distance. Site energies for (a) cluster models and (b) surface models and reaction energies, for (c) cluster models and (d) surface models. Both bridged and non-bridged sites are included in all four contour plots................................................................................................................................ 108
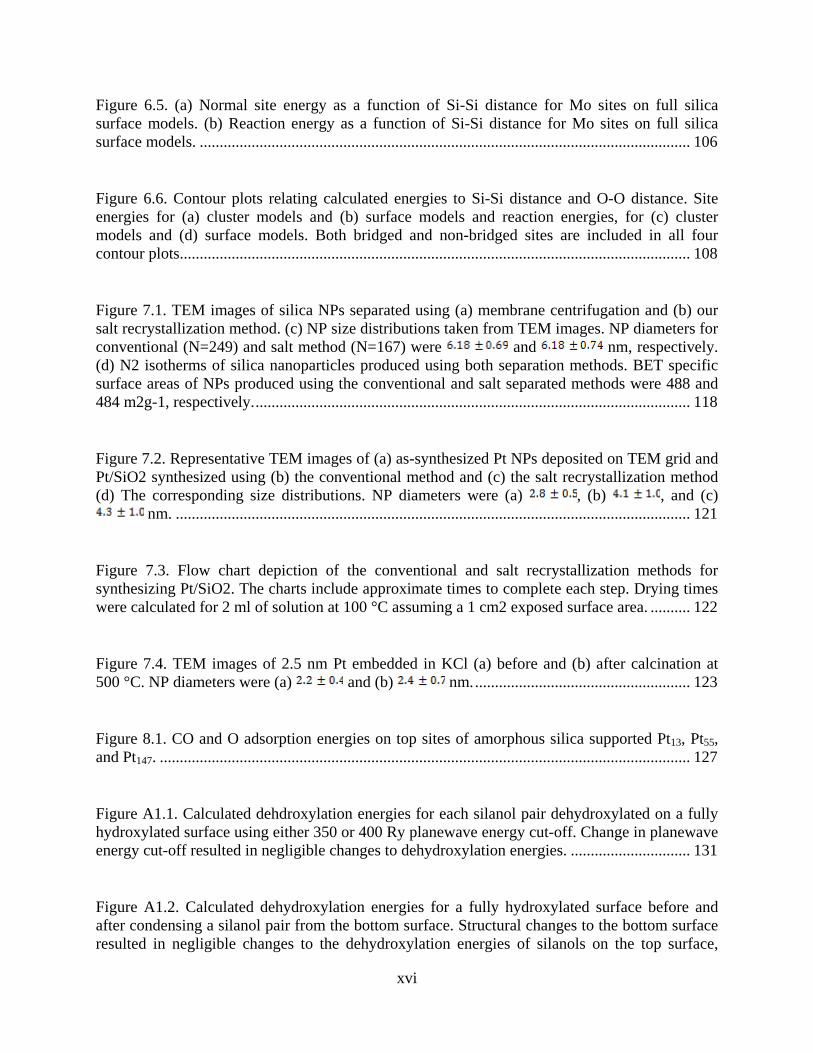
Figure 7.1. TEM images of silica NPs separated using (a) membrane centrifugation and (b) our salt recrystallization method. (c) NP size distributions taken from TEM images. NP diameters for conventional (N=249) and salt method (N=167) were and nm, respectively. (d) N2 isotherms of silica nanoparticles produced using both separation methods. BET specific surface areas of NPs produced using the conventional and salt separated methods were 488 and 484 m2g-1, respectively. ............................................................................................................. 118
Figure 7.2. Representative TEM images of (a) as-synthesized Pt NPs deposited on TEM grid and Pt/SiO2 synthesized using (b) the conventional method and (c) the salt recrystallization method (d) The corresponding size distributions. NP diameters were (a) , (b) , and (c)
nm. ................................................................................................................................. 121
Figure 7.3. Flow chart depiction of the conventional and salt recrystallization methods for synthesizing Pt/SiO2. The charts include approximate times to complete each step. Drying times were calculated for 2 ml of solution at 100 °C assuming a 1 cm2 exposed surface area. .......... 122
Figure 7.4. TEM images of 2.5 nm Pt embedded in KCl (a) before and (b) after calcination at 500 °C. NP diameters were (a) and (b) nm. ...................................................... 123
Figure 8.1. CO and O adsorption energies on top sites of amorphous silica supported Pt13, Pt55, and Pt147. ..................................................................................................................................... 127
Figure A1.1. Calculated dehdroxylation energies for each silanol pair dehydroxylated on a fully hydroxylated surface using either 350 or 400 Ry planewave energy cut-off. Change in planewave energy cut-off resulted in negligible changes to dehydroxylation energies. .............................. 131
Figure A1.2. Calculated dehydroxylation energies for a fully hydroxylated surface before and after condensing a silanol pair from the bottom surface. Structural changes to the bottom surface resulted in negligible changes to the dehydroxylation energies of silanols on the top surface,
xvii
indicating that the slab is sufficiently thick that chemical changes to the bottom surface do not affect the top surface, where dehydroxylation is studied. The disordered structure does not allow for simple addition or removal of extra layers, so generation of a whole new surface structure is required, and hence prohibits the direct comparison of dehydroxylation with different surface thicknesses. As the system size is already fairly large (almost 300 atoms), larger systems would have significantly increased the time of the current study. We therefore relied on the above test as well as the results of Goumans et al. for quartz surfaces.79 .................................................... 132
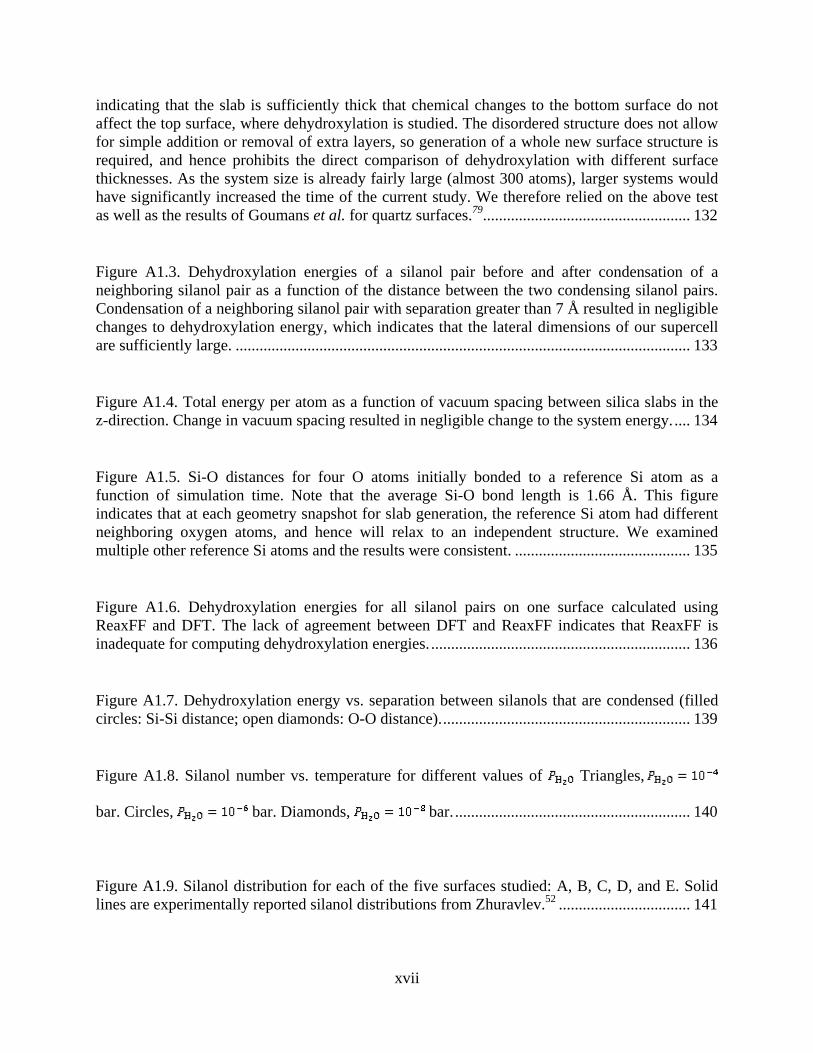
Figure A1.3. Dehydroxylation energies of a silanol pair before and after condensation of a neighboring silanol pair as a function of the distance between the two condensing silanol pairs. Condensation of a neighboring silanol pair with separation greater than 7 Å resulted in negligible changes to dehydroxylation energy, which indicates that the lateral dimensions of our supercell are sufficiently large. .................................................................................................................. 133
Figure A1.4. Total energy per atom as a function of vacuum spacing between silica slabs in the z-direction. Change in vacuum spacing resulted in negligible change to the system energy. .... 134
Figure A1.5. Si-O distances for four O atoms initially bonded to a reference Si atom as a function of simulation time. Note that the average Si-O bond length is 1.66 Å. This figure indicates that at each geometry snapshot for slab generation, the reference Si atom had different neighboring oxygen atoms, and hence will relax to an independent structure. We examined multiple other reference Si atoms and the results were consistent. ............................................ 135
Figure A1.6. Dehydroxylation energies for all silanol pairs on one surface calculated using ReaxFF and DFT. The lack of agreement between DFT and ReaxFF indicates that ReaxFF is inadequate for computing dehydroxylation energies. ................................................................. 136
Figure A1.7. Dehydroxylation energy vs. separation between silanols that are condensed (filled circles: Si-Si distance; open diamonds: O-O distance). .............................................................. 139
Figure A1.8. Silanol number vs. temperature for different values of Triangles,
bar. Circles, bar. Diamonds, bar. ........................................................... 140
Figure A1.9. Silanol distribution for each of the five surfaces studied: A, B, C, D, and E. Solid lines are experimentally reported silanol distributions from Zhuravlev.52 ................................. 141
xviii
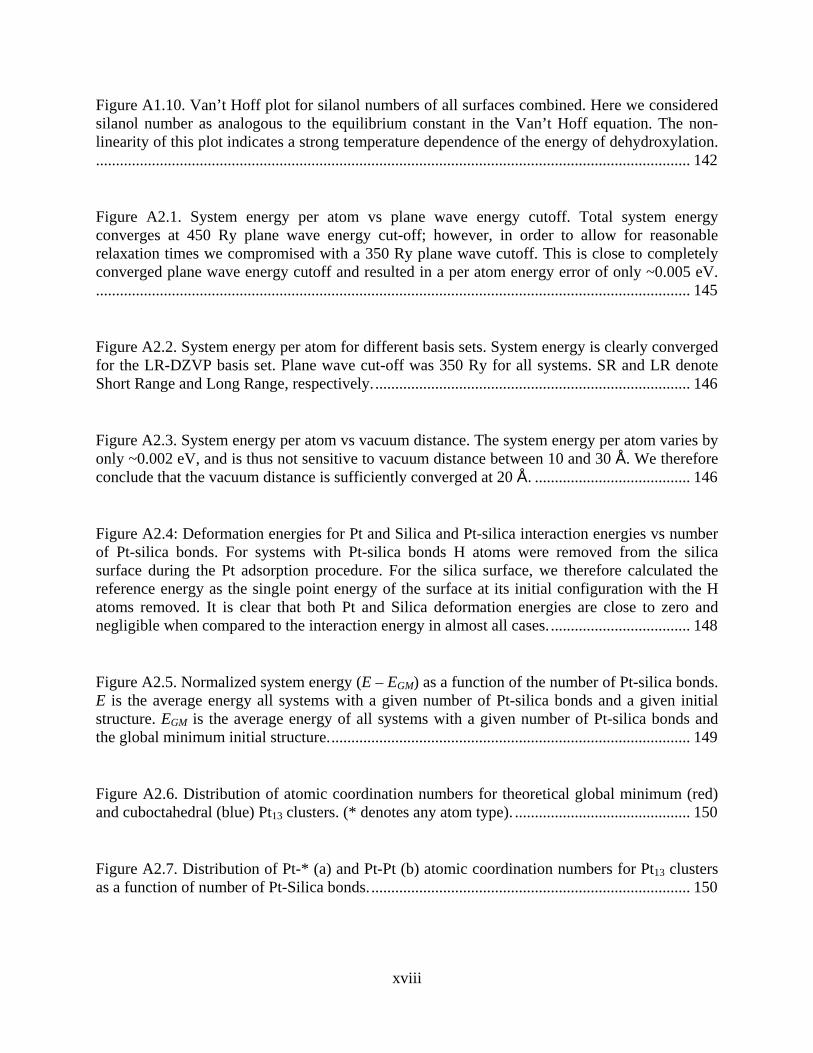
Figure A1.10. Van’t Hoff plot for silanol numbers of all surfaces combined. Here we considered silanol number as analogous to the equilibrium constant in the Van’t Hoff equation. The non-linearity of this plot indicates a strong temperature dependence of the energy of dehydroxylation...................................................................................................................................................... 142
Figure A2.1. System energy per atom vs plane wave energy cutoff. Total system energy converges at 450 Ry plane wave energy cut-off; however, in order to allow for reasonable relaxation times we compromised with a 350 Ry plane wave cutoff. This is close to completely converged plane wave energy cutoff and resulted in a per atom energy error of only ~0.005 eV...................................................................................................................................................... 145
Figure A2.2. System energy per atom for different basis sets. System energy is clearly converged for the LR-DZVP basis set. Plane wave cut-off was 350 Ry for all systems. SR and LR denote Short Range and Long Range, respectively. ............................................................................... 146
Figure A2.3. System energy per atom vs vacuum distance. The system energy per atom varies by only ~0.002 eV, and is thus not sensitive to vacuum distance between 10 and 30 Å. We therefore conclude that the vacuum distance is sufficiently converged at 20 Å. ....................................... 146
Figure A2.4: Deformation energies for Pt and Silica and Pt-silica interaction energies vs number of Pt-silica bonds. For systems with Pt-silica bonds H atoms were removed from the silica surface during the Pt adsorption procedure. For the silica surface, we therefore calculated the reference energy as the single point energy of the surface at its initial configuration with the H atoms removed. It is clear that both Pt and Silica deformation energies are close to zero and negligible when compared to the interaction energy in almost all cases. ................................... 148
Figure A2.5. Normalized system energy (E – EGM) as a function of the number of Pt-silica bonds. E is the average energy all systems with a given number of Pt-silica bonds and a given initial structure. EGM is the average energy of all systems with a given number of Pt-silica bonds and the global minimum initial structure. .......................................................................................... 149
Figure A2.6. Distribution of atomic coordination numbers for theoretical global minimum (red) and cuboctahedral (blue) Pt13 clusters. (* denotes any atom type). ............................................ 150
Figure A2.7. Distribution of Pt-* (a) and Pt-Pt (b) atomic coordination numbers for Pt13 clusters as a function of number of Pt-Silica bonds. ................................................................................ 150
xix
Figure A2.8. Mean Pt-Pt bond length as a function of number of bonds between Pt and silica. Surface and Interface values were calculated for atoms at the Pt-vacuum interface and the Pt-silica interface, respectively. U indicates the unsupported NP. .................................................. 151
Figure A2.9. d-band center as a function of coordination number for all Pt atoms in this study (shown as black x symbols) and the unsupported cuboctahedral Pt13 cluster (shown as red dots). The d-band center for the isolated cluster roughly correlates with the Pt-Pt coordination number, as illustrated by a linear fir with R2 = 0.87. Values were calculated considering eigenvalues between -8 and 6 eV for the d-states projected onto the individual Pt atom. ............................. 152
Figure A2.10. We plotted d-band center vs Pt-Pt coordination number for each Pt/silica system in this study. We then fitted a line to each data set and calculated the resulting coefficient of determination (R2). This figure shows the values of R2 for each Pt/silica system in this study as a function of the average Pt-Pt coordination number of the cluster. This clearly demonstrates that there is no universal correlation between d-band center and CN for silica-supported Pt13 clusters...................................................................................................................................................... 153
Figure A2.11. The d-band center calculated from d-DOS for entire Pt clusters vs number of Pt-silica bonds. Red circle indicates the d-band center for the unsupported cuboctahedral Pt13 cluster. ......................................................................................................................................... 154
Figure A3.1. The d-density of states for 1, 4, 13, 55, and 147 atom Pt clusters/nanoparticles. Pt147 and Pt55 have metallic electronic structure: continuous band structure that extends above the Fermi level. The Pt13 DOS has a finite gap at the Fermi level. ................................................... 159
Figure A3.2. Mulliken and Bader charges for four different randomly chosen Pt/SiO2 systems showing qualitative agreement between the two methods. ......................................................... 160
Figure A3.3. Atomic charge vs coordination number for all 13, 55, and 147 atom Pt NPs in this study. Black x symbols and red circles represent interfacial and non-interfacial Pt atoms, respectively. Charge data are from Bader charges calculated using electron density cube files obtained using the same parameters used to for system relaxations. .......................................... 161
Figure A3.4. d-band centers for individual Pt atoms as a function of Pt coordination number for (a) unsupported and (b) silica-supported, Pt13, Pt55, and Pt147. ................................................... 162
Figure A3.5. Deformation energies for Pt13, Pt55, and Pt147, defined as the change in energy of the Pt atoms associated with relaxation on the silica support. .......................................................... 163
xx
Figure A4.1: Adhesion energy as a function of number of Pt-O bonds for Pt NPs of different size and shape. .................................................................................................................................... 168
Figure A4.2: Van der Waals forces contributing to NP-silica adhesion energy as a function of number of metal atoms in contact with the support, for all DFT calculations in this study. Each data point corresponds to the average NP-silica van der Waals energy for all systems of a particular NP geometry. .............................................................................................................. 168
Figure A4.3: Comparing bond energy trend to heats of formation for different metals. Heat of oxide formation values of Au, Pt, Pd,11 Ni,153 Fe,154 are from experimental literature. ............. 170
Figure A4.4: The d-density of states for 13 atom Pt, Au, Pd, Ni, and Fe clusters. ..................... 171
Figure A5.1. Energy per atom vs plane wave energy cutoff for a Mo site on an extended silica surface. All calculations used a plane wave energy relative cutoff of 40 Ry. ............................ 174
Figure A5.2. Energy per atom vs plane wave energy relative cutoff (REL_CUTOFF) for a Mo site on an extended silica surface. All calculations used a plane wave energy cutoff of 350 Ry...................................................................................................................................................... 175
Figure A5.3. Energy per atom of a Mo site on an extended silica surface for different basis sets...................................................................................................................................................... 175
Figure A5.4. Energies of sites generated using our method compared to those after annealing, for two different sites. ....................................................................................................................... 176
Figure A5.5. Reaction energy vs normal site energy for both bridged and non-bridged cluster models. ........................................................................................................................................ 176

xxi
PREFACE
I am extremely grateful to many people who made this work a success. I would like to
thank my advisors for their guidance, insight, and motivation. Dr. J. Karl Johnson helped me to
stay continuously focused, specifically by questioning my questioning with “what’s your
hypothesis?” Dr. Gӧtz Veser was never without a new idea or perspective, and pushed me to
always connect individual results to practical importance. Dr. Joseph J. McCarthy always kept
my general studies in perspective, and pushed me to investigate for the sake of learning.
I am very grateful to Dr. Daniel S. Lambrecht for taking the time and effort to work
closely with me in developing a project that would become half of my dissertation. I thank Dr.
Albert To for taking the time and effort to read, listen, and provide helpful comments that
enriched the quality of this work.
I am very grateful to all of the graduate and undergraduate students that have helped to
make this work a success. In particular, I want to thank Dr. Saurabh Bhavsar for teaching me so
much in the laboratory and Yung-Chieh Lai for experimental advice and excellent
characterization of materials that contributed greatly to this work.
Finally, I want to thank my family, whose infinite patience and understanding are the
foundation for my success. My wife Valerie, and my kids Autumn and Owen, have provided the
support, inspiration, and motivation required for true success.
1
1.0 INTRODUCTION
Catalysis is responsible for essentially all transportation fuels and most chemicals
produced today.1 Scientific advancements in both computational methods2-8 and experimental
characterization techniques9-11 have recently begun to enable the development of catalytic
materials by rational design. Because catalysis occurs on atomistic length scales, an atomistic
understanding of catalytic materials offers great promise for the tailoring of improved or even
novel catalytic materials. Supported nanoparticle catalysts hold great potential as highly active
stable catalyst materials. Significant advances in computational materials science over recent
decades have provided atomistic-level understanding of numerous catalytic materials;7,11-17
however, such studies of supported catalysts have been limited to idealized, perfectly crystalline
supports.18-22 Although amorphous oxides are widely used as catalyst supports, their lack of
long-range order poses a major challenge to accurately describing such surfaces with atomistic
resolution.
1.1 AMORPHOUS SILICA
Amorphous silica is an abundant material with a wide range of applications including
pharmaceuticals,23 optics,24,25 coatings,26 and biosensors.27 It is also widely used as a catalyst
support due to good thermal stability, ease of production, and tunable surface area. 28,29 An
2
accurate description of the amorphous silica surface could aid in the understanding and
development of supported catalysts; however, such a description is beyond experimental
capabilities due to the absence of both long-range order and electrical conductivity.30-33 Despite
this limitation, experiments have provided a wealth of information regarding the nature of
amorphous silica surfaces.
Silanol groups are formed during the synthesis of amorphous silica and can also be
produced by reaction of siloxane bridges (≡Si-O-Si≡) with water.33 Experiments have shown
that both surface hydrophobicity and reactivity are dependent on silanol content. 2,34 Surface
silanols can be differentiated based on both hydrogen bonding status and number of OH groups
per silicon atom. For the purpose of experimental observation these have been classified (Figure
1.1) as isolated (free single silanols), ≡SiOH; geminal free (silanediols), =Si(OH)2; and vicinal
(H-bonded single or geminal).33
3
Figure 1.1. Classification of surface groups on amorphous silica.
Upon heating, silanol groups are known to react with one another to form a water
molecule and a siloxane bridge in a process known as dehydroxylation. Even for samples of
widely varying specific surface area and synthesis procedure, the surface silanol density (silanol
number (OH nm-2)) and distribution of silanol types depend quite predictably on temperature.
33,35,36 Hence while the atomic structure of the silica surface is not known, a number of
predictable descriptors have been measured.
The absence of long-range order has long been a stubborn barrier to accurately modeling
the structure and energetics of amorphous materials.37 Recent advances in computing power,
improved parallelization, and algorithm development have allowed for systems of ever-
increasing size to be studied using ab initio methods. As a result, attempts have been made at
using DFT calculations to model the surface of amorphous silica, providing valuable insight
Vicinal Silanols
Isolated Silanol
Geminal Silanols
Siloxane
4
regarding the local structure and energetics of surface features.30-32 However, despite the
accomplishments of recent studies no single surface model has been able to accurately describe
the evolution of amorphous silica surfaces upon heating.
1.2 SUPPORTED CATALYSTS
Metal nanoparticles (MNPs) have attracted considerable attention in the field of heterogeneous
catalysis due to their large surface-to-volume ratios and low-coordinated active surface
sites.13,16,28,38-44 These MNPs are typically immobilized on oxide supports, which can affect the
activity and selectivity of the MNPs by altering their morphology and electronic structure.13,41-
43,45,46 As pointed out by Norskov et al.,7 there is a critical need for a fundamental atomic-scale
understanding of catalyst-support interactions because they can dramatically impact the
electronic properties of the supported MNP. The majority of computational catalysis studies have
used extended surfaces or unsupported NPs as model catalyst particles.41,44,47 Atomistic studies
of supported catalysts have been limited to MNPs supported on ideal surfaces with point
defects.20,45,46 Technical catalysts used in industry, however, are not ideal and many oxide
supports are typically used in an amorphous state.48 The ability to calculate MNP interactions
with amorphous supports, however, is hampered due to a general lack of accurate atomically
detailed models of amorphous surfaces.
5
2.0 ACCURATE AMORPHOUS SILICA SURFACE MODELS FROM FIRST
PRINCI-PLES THERMODYNAMICS OF SURFACE DEHYDROXYLATION
The content of this chapter is taken from C. S. Ewing, S. Bhavsar, G. Veser, J. J. McCarthy, and
J. K. Johnson, “Accurate Amorphous Silica Surface Models from First-Principles
Thermodynamics of Surface Dehydroxylation” Langmuir 18 (2014) 5133-5141.
2.1 INTRODUCTION
The advances in computational materials science over recent decades have resulted in the
availability of accurate models for a wide range of crystalline materials. While this had a
profound impact on our capability to computationally screen and predict physical and chemical
properties of crystalline materials,7,49,50 many materials, oxides in particular, are utilized in
technical practice in their non-crystalline amorphous state. The lack of long-range periodicity of
amorphous surfaces, however, poses a major challenge in accurately describing such surfaces
computationally and hence has largely precluded the use of computational models for advancing
our understanding and development of this important class of materials. Silica is a typical
example from this class of materials; it is an abundant material with a wide range of applications
including pharmaceuticals,23 optics,24,25 catalysis,51 coatings,26 and biosensors.27 Surface
properties dictate the reactivity and hydrophobicity of amorphous silica.52 An accurate atomistic
6
description of the surface is therefore central to the development of applications involving
amorphous silica. For example, accurate models of amorphous silica surfaces are prerequisite to
the reliable study of metal-support interactions for realistic silica supported catalysts. Due to its
amorphous nature, however, the microstructure of such surfaces is difficult to obtain
experimentally.30-32,52 While model surfaces of crystalline materials can be constructed via
cleavage of the bulk structure obtained using X-ray scattering techniques, the lack of long-range
order prohibits this approach for amorphous materials.31 Despite this limitation, experiments
have provided significant information regarding the nature of amorphous silica surfaces.
2.1.1 What we know from experiments.
Silanol groups are formed during the synthesis of amorphous silica and can also be produced by
reaction of siloxane bridges ( Si-O-Si ) with water.52 Experiments have shown that both surface
hydrophobicity and reactivity are dependent on silanol content. For example, the rate of
deposition and quality of Al2O3 films grown on wet silicon oxides has shown dependence on the
surface silanol content.2,34
The surface of amorphous silica exhibits a diverse range of features ranging from
siloxane bridges to hydrogen bond networks between multiple silanols. Surface silanols can be
classified as single, meaning that there is a single OH group on a Si atom, or geminal (twin)
indicating two OH groups bound to the same Si atom. Each silanol can be further designated as
free, indicating not hydrogen bonded to other OH groups, or vicinal (proximate), meaning the
OH group is hydrogen bonded to a neighbor. For the purpose of experimental observation these
have been classified as isolated (free single silanols), ≡SiOH; free geminal (silanediols),
=Si(OH)2; and vicinal (either single or geminal).52
7
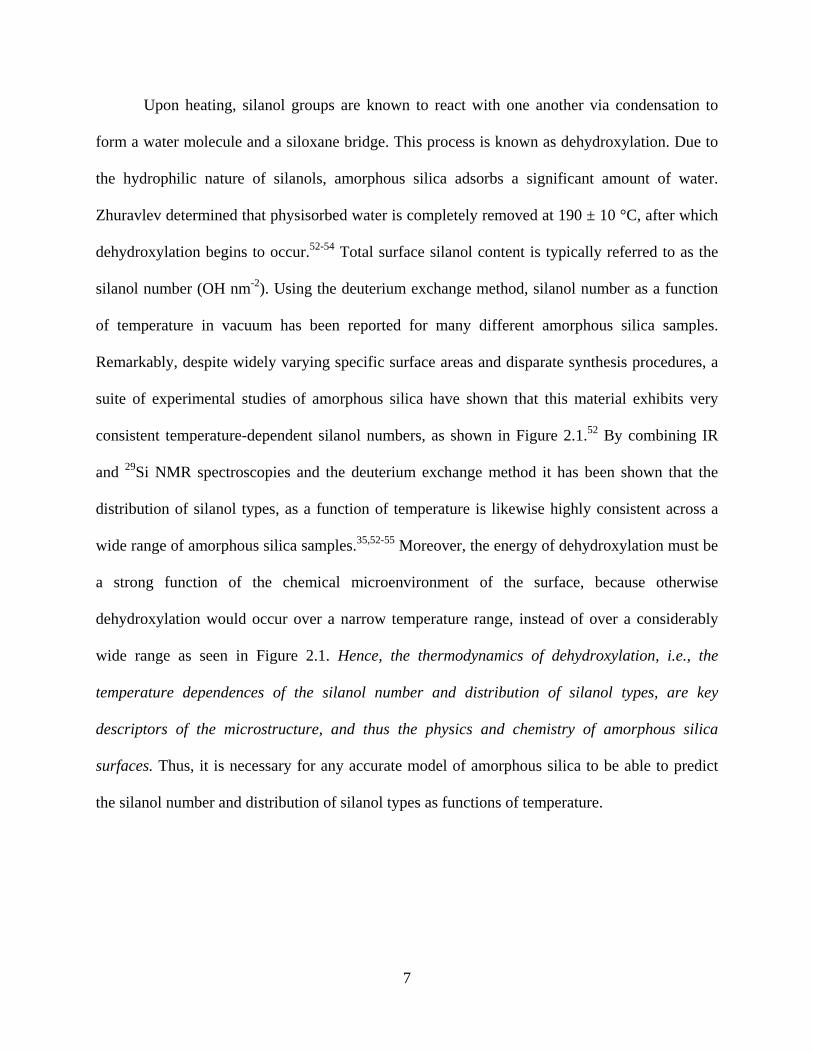
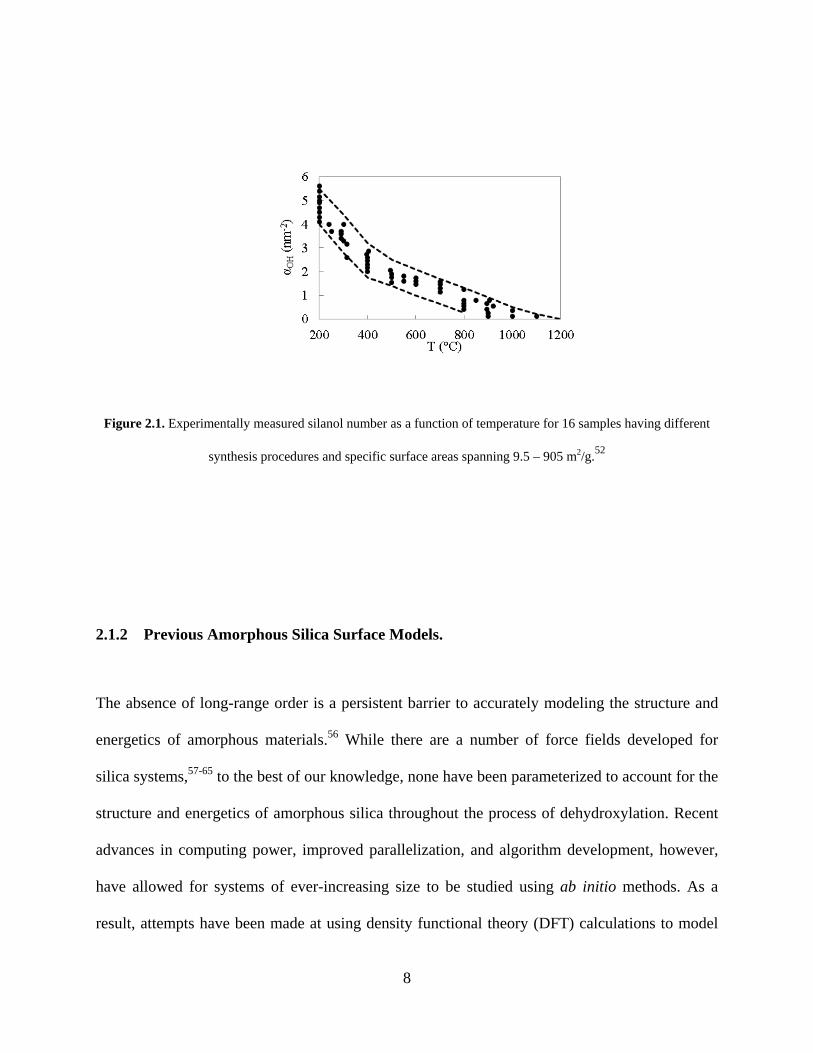
Upon heating, silanol groups are known to react with one another via condensation to
form a water molecule and a siloxane bridge. This process is known as dehydroxylation. Due to
the hydrophilic nature of silanols, amorphous silica adsorbs a significant amount of water.
Zhuravlev determined that physisorbed water is completely removed at 190 ± 10 °C, after which
dehydroxylation begins to occur.52-54 Total surface silanol content is typically referred to as the
silanol number (OH nm-2). Using the deuterium exchange method, silanol number as a function
of temperature in vacuum has been reported for many different amorphous silica samples.
Remarkably, despite widely varying specific surface areas and disparate synthesis procedures, a
suite of experimental studies of amorphous silica have shown that this material exhibits very
consistent temperature-dependent silanol numbers, as shown in Figure 2.1.52 By combining IR
and 29Si NMR spectroscopies and the deuterium exchange method it has been shown that the
distribution of silanol types, as a function of temperature is likewise highly consistent across a
wide range of amorphous silica samples.35,52-55 Moreover, the energy of dehydroxylation must be
a strong function of the chemical microenvironment of the surface, because otherwise
dehydroxylation would occur over a narrow temperature range, instead of over a considerably
wide range as seen in Figure 2.1. Hence, the thermodynamics of dehydroxylation, i.e., the
temperature dependences of the silanol number and distribution of silanol types, are key
descriptors of the microstructure, and thus the physics and chemistry of amorphous silica
surfaces. Thus, it is necessary for any accurate model of amorphous silica to be able to predict
the silanol number and distribution of silanol types as functions of temperature.
8
Figure 2.1. Experimentally measured silanol number as a function of temperature for 16 samples having different
synthesis procedures and specific surface areas spanning 9.5 – 905 m2/g.52
2.1.2 Previous Amorphous Silica Surface Models.
The absence of long-range order is a persistent barrier to accurately modeling the structure and
energetics of amorphous materials.56 While there are a number of force fields developed for
silica systems,57-65 to the best of our knowledge, none have been parameterized to account for the
structure and energetics of amorphous silica throughout the process of dehydroxylation. Recent
advances in computing power, improved parallelization, and algorithm development, however,
have allowed for systems of ever-increasing size to be studied using ab initio methods. As a
result, attempts have been made at using density functional theory (DFT) calculations to model
9
the surface of amorphous silica, providing valuable insight regarding the local structure and
energetics of surface features.30-32 Tielens and co-workers developed a model of the surface of
amorphous silica by cutting a slab from a model of bulk amorphous silica that had previously
been generated using molecular dynamics (MD) simulations using classical model potentials.
They subsequently saturated all dangling bonds on the cleaved surface with terminating hydroxyl
groups, and finally relaxed the system using DFT calculations.31 While their model reproduces
the silanol number for fully hydroxylated silica fairly well, it does not account for the
temperature dependence of the silanol number and the silanol distribution was not compared to
experimental data. Ugliengo and co-workers constructed a more comprehensive model, including
multiple degrees of silanol coverage.32 They first generated a fully hydroxylated slab of
amorphous silica, similar to Tielens et al., and incrementally condensed nearest silanol
neighbors. While intuitive, this methodology does not follow correct physics, as we show in this
work that the nearest neighbors do not always have the lowest dehydroxylation energy.
Furthermore, the model lacks a connection between model state and system temperature.
Rozanska and co-workers postulated that amorphous silica could be modeled as a combination of
the (100), (101), and (111) surfaces of crystalline silica (β-cristobalite).30 They used this
approach to model the dehydroxylation of amorphous silica surfaces.30 Adapting a statistical
thermodynamics model originally developed for alumina surfaces,66 individual dehydroxylation
steps were directly related to system temperature and the partial pressure of water via the Gibbs
free energy of reaction. Their model was able to correlate experimental silanol numbers as a
function of temperature fairly well by taking a linear combination of the three surfaces with
adjustable parameters for the weighting of each surface at each temperature. However, their
model not only lacks any information on the actual structure of the amorphous silica surface
10
(since they use crystal surfaces as a surrogate), but it also yields no predictive power due to the a
posteriori fitting.
2.1.3 Significance.
Despite the accomplishments of recent studies, no surface model has been experimentally
confirmed to accurately represent the microstructure of the real amorphous silica surface. Indeed,
it seems unreasonable to expect that a periodic atomistic model of a few square nanometers can
accurately represent amorphous macroscopic surfaces, with their attendant heterogeneity.
However, as noted above, the nearly universal behavior of the silanol number as a function of
temperature for a wide range of amorphous silica samples52 provides some evidence that a
reasonably simple model may be achievable.
It is known from experiments that dehydroxylation of the silica surface occurs over a
wide range of temperatures,52 indicating that the enthalpy of each dehydroxylation step is highly
dependent on the microscopic environment of the surface. Therefore, an atomistic model that
accurately describes the temperature dependence of the silanol number should also accurately
describe the surface microstructure. We thus constructed amorphous silica surface models by
using both DFT and empirical models to generate a series of candidate surfaces and used these
surfaces to simulate the thermodynamics of dehydroxylation, a process that can be easily
validated experimentally. Using this methodology, we have generated reliable and predictive
models of amorphous silica surfaces for a range of temperatures. Moreover, we have
demonstrated that a small periodic atomistic model of the amorphous silica surface can
accurately represent the physics and chemistry of the real surface, as characterized by
11
macroscopic measurements of the temperature dependence of the silanol number and silanol
type.
2.2 MODELING AND EXPERIMENTAL METHODS
2.2.1 Generation of Amorphous Silica Surfaces.
A model of bulk amorphous silica was constructed using a reactive potential for silica and water,
ReaxFF,60,67 that allows for bond breaking and bond formation events. The simulations were
carried out using the LAMMPS molecular dynamics engine.68 The ReaxFF potential was
parameterized using quantum mechanics calculations considering both reaction barriers and
equilibrium configurations. Simulations were carried out in the constant temperature, constant
volume ensemble with a timestep of 0.5 fs. We started with quartz structures using a supercell
with dimensions of 23.742 Å × 18.276 Å × 17.404 Å containing 456 atoms and a modified
lattice constant corresponding to the density of amorphous silica reported using this force field
(2.14 g/cm3). 60,67 Similar to Fogarty et al.,60 the system was then annealed at 4000 K for 75 ps
during which the system reached sufficient mobility to eliminate any artifacts due to the original
modified quartz structure. The system was then simulated for an additional 50 ps at 4000 K
during which snapshots of the system configuration were taken every 10 ps. The mobility at this
high temperature allowed for sufficient diffusion of atoms to produce 5 independent structures
(see Figure A1.5). The configurations from each of the five snapshots were then cooled from
4000 K to 300 K at a rate of 25 K/ps followed by energy minimization using a conjugate gradient
algorithm, resulting in a family of model bulk amorphous systems. This annealing procedure
12
allows for overcoming potential barriers that simple relaxation would encounter, making it more
likely to identify near-ground state energies, but this method does not guarantee finding ground
state structures. Mass density, bond lengths, and bond angles of the bulk periodic systems
showed good agreement with previous ab initio calculations and experimental observations (see
Table A1.1).
Each bulk system was then used to generate a surface slab by removing all atoms with a
Z-value greater than 7.5 Å. We made the bulk systems 10 Å larger than the resulting slab in the
Z-dimension in order to mitigate the interaction between the top and bottom surfaces of the slab.
The surfaces were hydroxylated by saturating all under-coordinated Si atoms with O atoms
followed by saturation of all under-coordinated O atoms with H atoms. We did not consider the
presence of surface defects, e.g. dangling oxygen bonds, because they are very rare at the low
temperatures of the systems we are modeling.69 This approach avoids the need for resolving
surface defects present following bulk cleavage.69,70 Our purpose is to generate accurate
structures of precipitated amorphous silica surfaces in contact with (low humidity) gas phases, as
commonly encountered in applications such as catalyst supports. We therefore do not consider
surface ionization, which is important for silica-water interfaces,65,71-73 because surface
ionization is highly improbable for solid-gas interfaces. The hydroxylated structure was fully
relaxed using a conjugate gradient algorithm within the CP2K code.74-78 The code employs a
Quickstep78 implementation of the DFT method using pseudopotentials and planewaves as well
as localized Gaussian basis sets. Goumans et al. showed that a slab that is 11.25 Å thick is
sufficiently thick to represent a quartz surface and that the PBE functional more accurately
describes hydrogen bonded silica surfaces than B3LYP.79 We used hydroxylated surface slabs
approximately 12 Å thick and consisting of almost 300 atoms in this work. All calculations with
13
CP2K used the PBE functional80 and GTH pseudopotentials81,82 in conjunction with triple-ζ basis
sets with polarization functions (TZVP).83 We used a 350 Rydberg cutoff energy for the plane
wave basis set. All surface slabs were relaxed using CP2K treated as periodic in the X, Y and Z
directions with at least 15 Å of vacuum between the slab surfaces in the Z direction. Validation
of the planewave energy cutoff, slab thickness, XY dimensions, and vacuum spacing can be
found in the appendix (Figures A1.1, A1.2, A1.3, and A1.4 respectively).
2.2.2 Synthesis and Characterization of Silica Nanoparticles.
We adapted the procedure of Wang et al. for synthesis of silica nanoparticles with low
polydispersity.84 Briefly, a catalyst stock solution was prepared by mixing ammonia with water
to a pH of 11.4. 2.6 g of tetraethyl-orthosilicate was diluted in 5 ml ethanol, mixed thoroughly,
and added to 34.75 g of catalyst stock solution. The solution was then stirred for 3 hours at 60
°C. The resulting nanoparticles were then separated from solution, dried, and calcined at 350 °C.
Finally, the particles were soaked in water for 24 hours at room temperature in order to re-
hydroxylate the surface. Further details of the synthesis procedure can be found in the appendix.
Transmission electron microscopy (TEM) images were taken on a JEOL JEM2100F with
an accelerating voltage of 200 keV. Specific surface area was measured by nitrogen adsorption
using a Micromeritics ASAP 2020. The surface area of N2 was taken to be 1.47 nm2/mol as
determined previously.85 Weight loss as a function of temperature was measured using a
thermogravimetric analyzer (TGA). Details of the TGA procedure used can be found in the
appendix.
14
2.3 RESULTS AND DISCUSSION
2.3.1 Simulating Dehydroxylation.
Experiments have shown that the kinetics of dehydroxylation is sufficiently fast that the state of
surface silanols can be described thermodynamically.52 In order to accurately model
dehydroxylation we first determined which silanols would condense from each of our five model
surfaces and in what order. The distance between silanols must be small enough to allow for a
siloxane bridge to form between the two Si atoms involved (Figure 2.2a). Due to local structural
rearrangement upon dehydroxylation, this distance can be significantly larger than the length of
the resulting siloxane bridge. Based on the results of preliminary studies, we considered silanol
pairs with Si-Si and O-O distances of less than 5.5 and 4.5 Å, respectively. We found that
distances larger than these did not give realistic ending structures. For each such silanol pair, we
found the enthalpy of reaction (dehydroxylation energy) by facilitating the condensation of water
in the following manner: 1. The OH groups were removed and a single O atom was placed at an
estimated equilibrium position, based on known bond lengths and angles (Figure 2.2b). 2.
Siloxane bridge formation was then facilitated by fixing the position of the inserted O atom
while relaxing only the two participating Si atoms and their nearest neighbors (including
hydrogens when the nearest neighbor was an OH group). In order to reduce computational cost
we performed these constrained relaxations using ReaxFF to provide reasonable starting points
for subsequent relaxations with DFT. The inserted O atom was fixed to avoid the formation of
defects that result when only one Si-O bond is formed (i.e., one dangling oxygen and one
undercoordinated Si atom). We restricted this relaxation to only participating Si atoms and
nearest neighbors because the slight error of ReaxFF bond lengths and angles cause the
15
subsequent DFT relaxation to take longer. 3. After siloxane bridge formation we allowed the O
atom to relax as well as participating Si atoms and nearest neighbors (still fixing all other atoms).
This was done because the siloxane bridge structures were often high energy under the
constraints used to facilitate their formation. 4. The entire system was then fully relaxed using
DFT (Figure 2.2c).
An alternate approach is to use ReaxFF to perform all relaxations and energy
calculations. We tried this approach and found that while the geometries were qualitatively
correct, the calculated enthalpies of dehydroxylation using only ReaxFF were both quantitatively
and qualitatively incorrect (see Figure A1.6), demonstrating the need to use DFT for generating
accurate results.
We applied this procedure to every silanol pair within our distance criteria and calculated
the corresponding dehydroxylation energy, , for removing only that pair by:
, (2.1)
where E0 and Ef are the DFT energies of the system before and after the silanol pair
dehydroxylation, respectively, and is the DFT energy of an isolated water molecule
calculated using the same parameters (size of supercell, energy cutoff, etc.) as the silica slab
systems. We then selected the silanol pair with the lowest (most favorable) dehydroxylation
energy and assumed that this pair condenses first on the surface. The post-condensation relaxed
system for this lowest energy silanol pair then serves as the starting point for the next step in the
dehydroxylation process.
16
Figure 2.2. Procedure for simulating dehydroxylation. (a) Silanol groups within range to condense are identified. (b)
OH groups are removed and an oxygen atom is inserted at an estimated equilibrium position. (c) First and second
neighbors are relaxed with ReaxFF to form a siloxane bridge, followed by relaxation of the entire system with DFT.
A simple approach would be to calculate the dehydroxylation energies for each silanol
pair on the surface and assume that these energies are independent of one another. We have
found, however, that the energetics of dehydroxylation can be significantly affected by the
presence or absence of neighboring silanols (see Figure A1.3). We therefore simulated the
condensation of every available silanol pair, as described above, for each dehydroxylation step.
This procedure gives models of the silica surface for a range of silanol numbers, as shown for
one of the five model surfaces in Figure 2.3. One might assume a priori that silanol pairs that are
farther apart would have higher dehydroxylation energy; this is the approached used by Ugliengo
et al. for determining the order of silanol pairs that condense.32 However, we found only a weak
correlation between silanol separation and dehydroxylation energy, as illustrated in Figure A1.7.
Therefore, a rigorous approach must explicitly compute (and recomputed) the dehydroxylation
energy, as included in our approach.
17
Figure 2.3. Representative images of amorphous silica surface models (surface E of Figure 2.4) at various temperatures.
Silanols on the top surface are depicted with space filling models; only the bonds between the remaining atoms are shown.
Hydrogen bonds are shown as pink lines. As temperature is increased silanols condense and the surface begins to exhibit
small hydrophobic regions (containing no silanols). Hydrogen bonding silanols are removed at lower temperatures.
T = 0 K; αOH = 8.1 nm-2
T = 400 °C; αOH = 3.5 nm-2
T = 200 °C; αOH = 4.8 nm-2
T = 600 °C; αOH = 2.1 nm-2

18
2.3.2 Statistical Thermodynamics Model.
The different surface silanol coverages of our model can be connected to the physical conditions
of a real system by implementing a thermodynamic model similar to those used for alumina and
crystalline silica surfaces.30,86-88 The Gibbs free energy of dehydroxylation for the removal of
two silanols in the form of one molecule of water vapor is given by:
(2.2)
where is the reaction energy computed from DFT given by eq 1, is the partial pressure
of water, and and are the translational and rotational partition functions of water in the ideal
gas state, respectively. Here we make the approximation that the dehydroxylation process does
not significantly change the phonon modes and density of states of the surface (see appendix for
a detailed derivation). While this assumption is not strictly valid, the resulting error is expected
to be less than the errors inherent in DFT. Moreover, this approximation has been found to be
reasonably accurate for β-cristobalite surfaces and should hold true for amorphous silica as
well.30
2.3.3 Accurate Reproduction of Experimentally Measured Silanol Number.
It is not obvious a priori that a small surface slab can adequately represent the complexity of a
macroscopic amorphous surface. We therefore constructed five independent initial surface
19
configurations as described above in order to capture a wider range of surface heterogeneity.
Surprisingly, we found that all five independent surface models exhibit temperature dependence
of the silanol numbers that are in close agreement with each other and with experimental data
reported in the literature,52 as can be seen in Figure 2.4a. This is a remarkable and unexpected
outcome. Significant deviation between surfaces at low temperatures, specifically between
surface E and the others, is due to the random nature of the annealing and cutting procedures. As
experimentally relevant temperatures are approached, however, discrepancy between surface
models is significantly reduced. The procedure for computing the silanol number is described in
detail in the appendix.
20
Figure 2.4. Silanol number as a function of temperature for (a) the five individual surfaces of this study (labeled A-
E) and (b) the average of all surfaces compared with surfaces of β-cristobalite calculated previously.30 ( =10-6
bar) Dashed lines indicate the bounds for 16 disparate samples reported in the literature.52
In order to obtain an “average” surface, we analyzed the five model surfaces in
combination. This was done by summing the number of silanols across all five surfaces for a
given temperature and dividing by their combined surface area. Physically, this is analogous to
measuring the silanol number of five distinct areas on a single sample and averaging them. Our
(a)
(b)
21
model shows excellent agreement with experimentally measured silanol numbers from the
literature, as shown in Figure 2.4b. The silanol numbers for individual surfaces of β-cristobalite
are also plotted in Figure 2.4b. Here we see very poor agreement for any one of the individual
crystal surfaces with experiments, indicating that crystalline surfaces are not valid
representations of amorphous silica surfaces. The correct trend of silanol number with
temperature can only be reproduced by a linear combination of the three crystal surfaces with ad-
hoc weighting of each surface at each temperature. Our model requires no such weighting and no
adjustable parameters. In fact, in our approach the only model parameter not derived from first
principles is the partial pressure of water, . We chose a value corresponding to high-vacuum
conditions consistent with experiments and found that the silanol number is not particularly
sensitive to this parameter in the range of conditions used for experimental dehydroxylation
measurements (Figure A1.8).
Experimental studies have concluded that vicinal silanols are completely removed at
around 400 °C.52 The dehydroxylation of the remaining (isolated) silanols has been attributed to
proton mobility across the surface at higher temperatures, which is not included in our
thermodynamic model. Based on this explanation, we expect to see significant deviation between
our model and experiments above 400 °C. Our results suggest, however, that significant proton
mobility may not be needed to explain experimental observations until above 600 °C, as seen in
Figure 2.4b. We therefore expect that our model may not be accurate above about 600 °C
because we do not account for proton mobility.
Following Rozanska et al.,30 we derived a silanol stability diagram from which the silanol
number can be predicted based on only system temperature and partial pressure of water (Figure
2.5). This was done by recalculating silanol number vs. temperature for a very wide range of
22
values. The diagram can be interpreted as a silanol coverage landscape where the steepness of
the silanol number vs. temperature curve is described by the color gradient.
Figure 2.5. Silanol number as a function of temperature and partial pressure of water. The white area indicates no
silanol groups are within range to condense directly.
2.3.4 Accurate Reproduction of Measured Silanol Distribution.
Along with silanol number, we quantified the silanol distribution for each model surface after
every dehydroxylation step. Our model is again in good qualitative agreement with
experiments52 and is the first such rigorous comparison over a range of temperatures (Figure
23
2.6). Furthermore, silanol distributions for the individual (i.e., non-averaged) model surfaces also
agree quite well with experiments (Figure A1.9).
Significant quantitative error between isolated and vicinal silanols is evident below 400
°C. This is likely due to differences in how the silanol types were defined in experiment and
computation. We defined vicinal silanols as exhibiting a hydrogen bond with another silanol,
where the hydrogen bond is defined as having O-O distance < 3.5 A and H-O-H angle > 110 °,
based on general findings reported by IUPAC.89 Experimentally, isolated and vicinal silanols are
differentiated based on their IR frequencies. This requires significant approximation, however, as
the relative proportions of IR modes must be deconvoluted from a single spectrum and the
frequencies assigned to isolated and vicinal silanols vary in the literature.90-93
Figure 2.6. Distribution of silanol groups as a function of temperature ( =10-6 bar) for simulation results (points)
and experimental averages52 (lines).
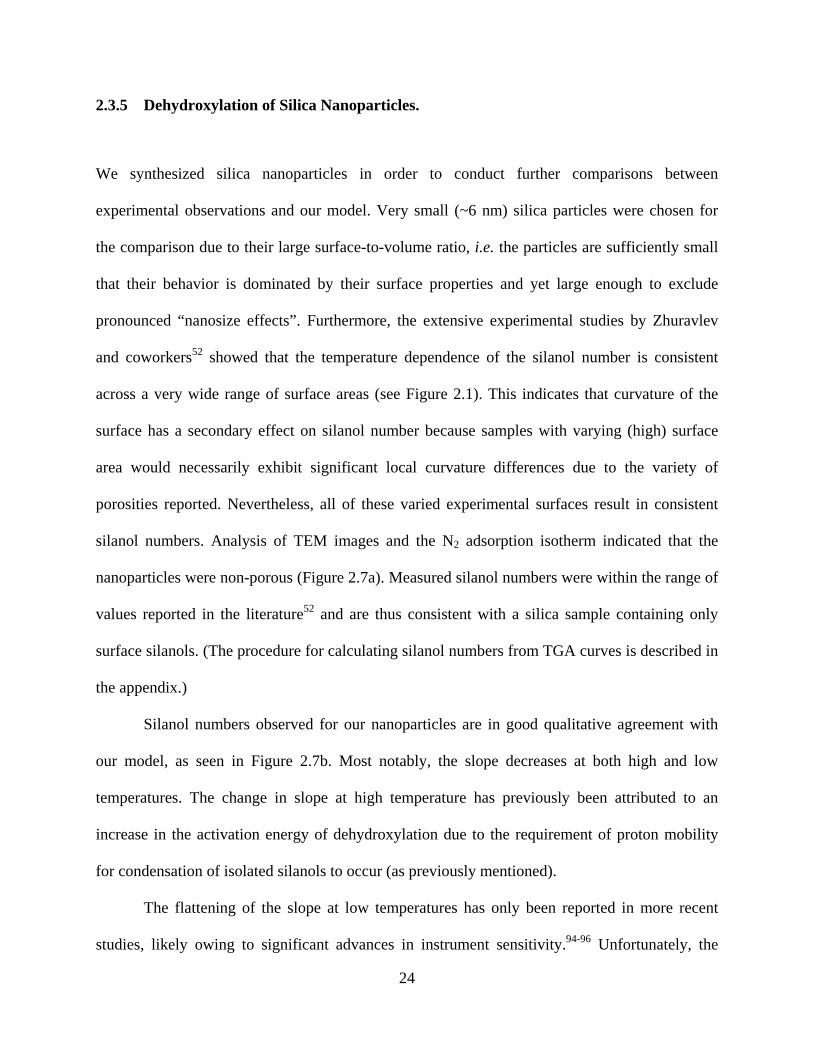
24
2.3.5 Dehydroxylation of Silica Nanoparticles.
We synthesized silica nanoparticles in order to conduct further comparisons between
experimental observations and our model. Very small (~6 nm) silica particles were chosen for
the comparison due to their large surface-to-volume ratio, i.e. the particles are sufficiently small
that their behavior is dominated by their surface properties and yet large enough to exclude
pronounced “nanosize effects”. Furthermore, the extensive experimental studies by Zhuravlev
and coworkers52 showed that the temperature dependence of the silanol number is consistent
across a very wide range of surface areas (see Figure 2.1). This indicates that curvature of the
surface has a secondary effect on silanol number because samples with varying (high) surface
area would necessarily exhibit significant local curvature differences due to the variety of
porosities reported. Nevertheless, all of these varied experimental surfaces result in consistent
silanol numbers. Analysis of TEM images and the N2 adsorption isotherm indicated that the
nanoparticles were non-porous (Figure 2.7a). Measured silanol numbers were within the range of
values reported in the literature52 and are thus consistent with a silica sample containing only
surface silanols. (The procedure for calculating silanol numbers from TGA curves is described in
the appendix.)
Silanol numbers observed for our nanoparticles are in good qualitative agreement with
our model, as seen in Figure 2.7b. Most notably, the slope decreases at both high and low
temperatures. The change in slope at high temperature has previously been attributed to an
increase in the activation energy of dehydroxylation due to the requirement of proton mobility
for condensation of isolated silanols to occur (as previously mentioned).
The flattening of the slope at low temperatures has only been reported in more recent
studies, likely owing to significant advances in instrument sensitivity.94-96 Unfortunately, the

25
majority of knowledge regarding the fundamentals of silanol interactions was determined from
much older studies, and no explanation for this effect can hence be found in the literature.52
However, the source of the decrease in slope at low temperature can now be explained by
examining our model surfaces.
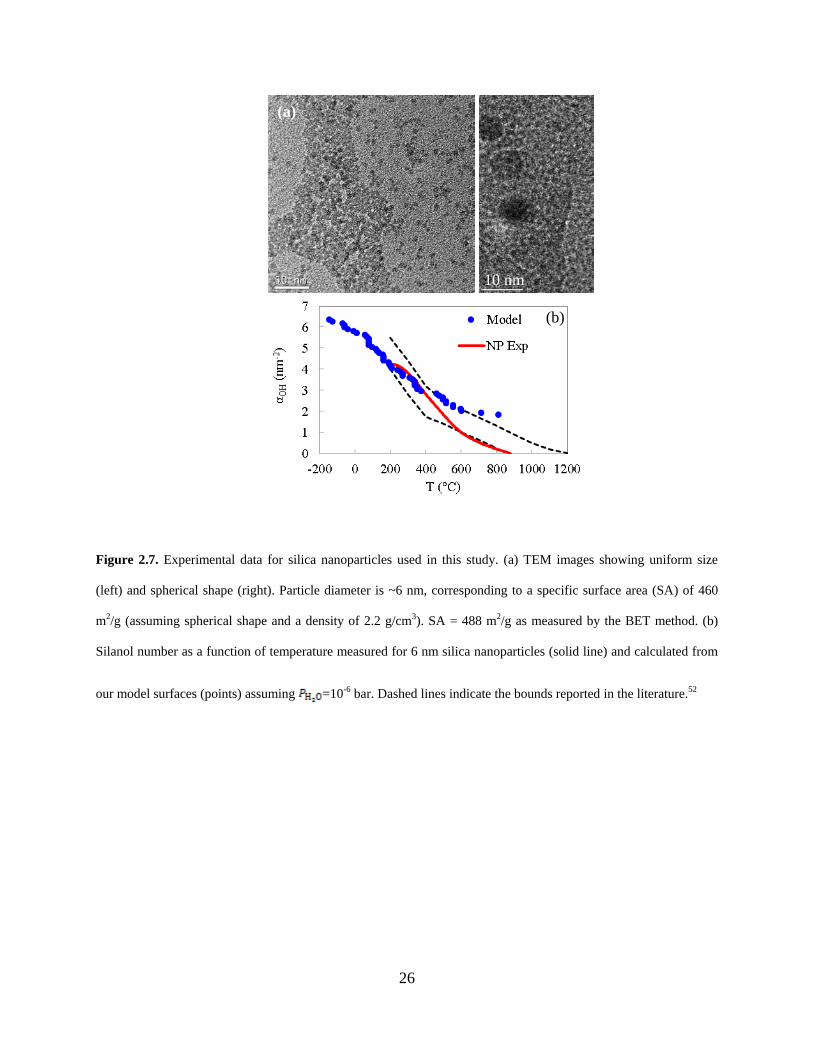
26
Figure 2.7. Experimental data for silica nanoparticles used in this study. (a) TEM images showing uniform size
(left) and spherical shape (right). Particle diameter is ~6 nm, corresponding to a specific surface area (SA) of 460
m2/g (assuming spherical shape and a density of 2.2 g/cm3). SA = 488 m2/g as measured by the BET method. (b)
Silanol number as a function of temperature measured for 6 nm silica nanoparticles (solid line) and calculated from
our model surfaces (points) assuming =10-6 bar. Dashed lines indicate the bounds reported in the literature.52
10 nm
(a)
(b)
27
136137138139140141142143144145146
0
1
2
3
4
5
6
7
-200 0 200 400 600 800 1000
Ave
rage
Si-O
-Si A
ngle
(°)
α OH
(nm
-2)
T (°C)
90
100
110
120
130
140
150
-200 0 200 400 600 800 1000
New
Si-O
-Si A
ngle
(°)
T (°C)
(a)
(b)
Figure 2.8. (a) Silanol number (filled circles) and average angle of existing Si-O-Si bridges (open diamonds) and (b)
Si-O-Si angle of newly formed siloxane bridges, as a function of temperature. Dashed line indicates the equilibrium
Si-O-Si bond angle for α-quartz (144 °), the most thermodynamically stable silica polymorph.
28
The slope of the silanol number curve depends on the energetics of dehydroxylation as a
function of temperature. A Van’t Hoff plot clearly indicates a significant temperature
dependence of the dehydroxylation energy (Figure A1.10). This temperature dependence along
with the widely varying energies of dehydroxylation for different silanol pairs on the surface
(Table A1.2) indicates a relationship between the silanol number as a function of temperature
and the local environment on the surface. Indeed, we observed a direct correlation between the
average Si-O-Si angle and silanol number, shown in Figure 2.8a. As dehydroxylation proceeds,
the average Si-O-Si angle diverges from the equilibrium value, indicative of a buildup of stress
with decreasing silanol number, resulting in an energy penalty (stress penalty) for
dehydroxylation. Changes to the average Si-O-Si angle upon dehydroxylation are not explained
by simply accounting for newly formed siloxane bridge angles (Figure 2.8b). This indicates that
the stress associated with the dehydroxylation of a single silanol pair is propagated non-locally
throughout the silica network via significant restructuring of surrounding atoms. This is not as
prevalent at low temperatures, however, where the slope of the silanol number curve appears to
flatten. Both the average Si-O-Si angle and the angle of newly formed siloxane bridges remain
fairly constant below ~50 °C. These observations are consistent with low-temperature silanols
existing in a configuration that allows for condensation and siloxane bridge formation without
significant stress to surrounding bonds.
We found that every dehydroxylation step that occurred under T = 50 °C involved at least
one geminal silanol and all steps below T = 0 °C occurred exclusively between geminal silanols.
Geminal silanols are anchored to the surface by only two siloxane bridges, in contrast to single
silanols, which are anchored by three. As a result, geminal silanols have more freedom to
rearrange during siloxane bridge formation than single silanols. The presence of neighboring
29
geminal silanols, which are unique to low temperature dehydroxylation steps, thus offering a
plausible explaination for the flattened slope of the silanol number curve at low temperatures.
2.4 CONCLUSIONS
We demonstrate that a theoretical model consisting of less than three hundred atoms can
accurately predict macroscopically measured properties of amorphous silica surfaces. By
simulating the thermodynamically limited dehydroxylation process, the described methodology
allows for direct comparison and validation with experimental data. Our method thus results in
representative surface models for a range of temperatures, which can be used for computational
studies of real systems using DFT calculations, in particular, for the study of catalyst-support
interactions. The general methodology we developed to build our model is applicable to other
complex surfaces, requiring only a measurable thermodynamic process for validation purposes.
For example, the method could be adapted to determine the oxidation state of amorphous ceria in
different reactive environments. Our general approach should hence prove valuable for
constructing increasingly accurate molecular models of disordered and complex systems.
30
3.0 STRUCTURAL AND ELECTRONIC PROPERTIES OF PT13 NANOCLUSTERS
ON AMORPHOUS SILICA SUPPORTS
The content of this chapter is taken from C. S. Ewing, M. J. Hartmann, K. R. Martin, A. M.
Musto, S. J. Padinjarekutt, E. M. Weiss, G. Veser, J. J. McCarthy, J. K. Johnson, and D. S.
Lambrecht, “Structural and Electronic Properties of Pt13 Nanoclusters on Amorphous Silica
Supports”, J. Phys. Chem. C 119 (2015) 2503-2512.
3.1 INTRODUCTION
Metal nanoparticles (NPs) have attracted considerable attention in the field of heterogeneous
catalysis due to their large surface-to-volume ratios and low-coordinated active surface sites.11-
13,15,16,28,39,40,43,97 These NPs are typically immobilized on oxide supports, which can affect the
activity and selectivity of the NPs by altering their morphology and electronic
structure.12,13,21,29,43,97 As pointed out by Norskov et al.,7 there is a critical need for a fundamental
atomic-scale understanding of catalyst-support interactions because they can dramatically impact
the electronic properties of the supported NP. This information cannot be obtained from
experiments alone98 and current modeling approaches almost always ignore the amorphous
nature of the support.12,13,15,18,19,21 Generating atomistic models of supported NPs on amorphous
supports poses challenges not faced when using crystalline surfaces, because of the diversity of

31
surface features and atomic surface roughness. The present work focuses on the development of
a transferable methodology for studying the relaxation of catalytic nanoparticles on amorphous
supports; we apply this methodology to investigate catalyst-support interactions for amorphous
silica.
Amorphous silica is a widely used catalyst support due to its good thermal stability,
tunable porosity, and highly tunable specific surface area. 28,29 Silica supported Pt has shown
promise for methane conversion99 as well as low temperature oxidation of formaldehyde28 and
ethylene.40 Although silica is relatively inert, it can be expected that its diversity of surface
features will result in a wide range of metal-support interactions involving both physisorption
and covalent Pt-O and Pt-Si bond formation at higher temperatures. A number of experimental
studies have shown that the characteristics of the silica support, such as the concentration of
surface silanols,28 significantly affect Pt dispersion, catalytic activity, and thermal
stability.11,28,29,40,43,97,100,101 The atomistic origins of these effects, however, have remained
elusive to-date. Experiments have moved toward an atomistic understanding of these interactions
by attempting to produce highly mono-disperse supported NPs in order to probe the intrinsic
catalytic activity as a function of size and shape. 102 However, given the importance of NP-
support interactions, it is unclear whether—for amorphous supports—these interactions will
induce a level of heterogeneity into the system that would make it impossible to reliably ascribe
catalytic activity to a given NP size or shape. We aim to address these issues in this study for
very small Pt NPs.
Silica has a large number of possible surface motifs that can be controlled in a
straightforward way via the calcination temperature. Silanol groups (Si-OH) are typically formed
on silica surfaces during synthesis and by exposure to water. Surface silanols can be classified as
32
single, Si-OH, or geminal, Si(OH)2. Each OH group can further be either vicinal, meaning that it
is hydrogen bonded to a neighboring silanol, or free, meaning that it is not hydrogen bonded (see
Figure 3.1). Silanol groups condense to form water vapor and siloxane bridge structures as the
surface is heated, resulting in a reduction of the silanol number, αOH, (total surface silanol
content, OH/nm2).52 Above ~1200 °C the surface is exclusively terminated by siloxane bridges
(Si-O-Si). It has been observed from experiments and modeling that αOH and the silanol type
(single, germinal, etc.) are strong functions of the thermal pretreatment (calcination) temperature,
Tpre, of the silica support.52,103 The interactions between NP and support depend on the silica
surface groups present at the time of NP deposition, which in turn directly depend on Tpre. An
atomistic understanding of metal-support interactions may thus allow for the optimization of
stability and/or activity of silica supported NPs via the surface pretreatment conditions.
In this study we use density functional theory (DFT) calculations to investigate the
impact of metal-support interactions on the morphology, electronic structure, and energetics of
13-atom Pt NPs supported on amorphous silica. Platinum clusters of this size (d = 0.7 nm) are
small enough that metal-support interactions can significantly impact cluster morphology.98
Crystalline surface models do not constitute realistic surrogates for amorphous silica because
they exhibit only a small fraction of the configurations of surface features found on the real
surface of amorphous silica. We therefore developed a procedure for generating supported Pt
systems using accurate model structures of amorphous silica surfaces103 to sample metal-support
interactions for a large number of silica surface sites. Using this approach, we investigate the
dependence of geometric and electronic properties of the supported Pt clusters on the variability
of the amorphous silica surface. Our ultimate goal is to understand metal-support interactions
and their role in catalysis for realistic model systems.
33
3.2 METHOD
3.2.1 Computational Details.
For all DFT calculations we used the CP2K code, which employs a Quickstep78 implementation
of the DFT method using plane waves/pseudopotentials and localized Gaussian basis sets (see
appendix for details). Calculations used the revised PBE functional (revPBE)104 and GTH
pseudopotentials81,82 in conjunction with short range double-ζ basis sets with polarization
functions (SR-DZVP).105 All surface slabs were relaxed using CP2K treated as periodic in all
directions with at least 20 Å of vacuum between slabs to eliminate interactions between the
periodic images of the surface slabs. Validation of the planewave energy cutoff, basis sets,
vacuum spacing and spin-restricted relaxation can be found in the appendix (Figure A2.1, A2.2,
and A2.3, respectively).
3.2.2 Model Amorphous Surfaces.
We used model amorphous silica surfaces developed by Ewing et al.103 to investigate NP-surface
interactions. Briefly, the model amorphous silica surface structures were generated as follows:
bulk amorphous silica structures were generated using reactive molecular dynamics with the
ReaxFF formalism parameterized for silica and water.106 The structures were then cut into
periodic surface slabs, which were hydroxylated by saturating undercoordinated atoms, followed
34
by full relaxation using periodic DFT. Surface structures representing a range of temperatures
were generated by simulating the thermodynamics of dehydroxylation using DFT. The
temperature corresponding to each particular surface structure was computed based on the
energetics of dehydroxylation using a statistical thermodynamics model. For more details, refer
to the original published work.103 These model surfaces have been validated against
experimentally measured silanol number and silanol distributions and found to accurately predict
silanol number as a function of temperature.103
The sizes of the surfaces we used were 23.7 Å × 18.3 Å × ~12 Å comprising between 250
and 270 atoms. We primarily use the cuboctahedral geometry for Pt13, supplemented by a few
calculations using the gas phase global energy minimum structure for Pt13.107 Experimental
characterization of sub-nanometer clusters, such as Pt13, is challenging and data regarding the
atomic structure of Pt13 is hence scarce in the literature. However, a number of experimental
studies of Pt55 (the next larger magic number cluster) supported on amorphous silica surfaces
report a cuboctahedral structure,10,108-111 motivating the use of this structure in theoretical studies.
13,15,112 Moreover, there are reports of the existence of cuboactahedral Pt13 clusters.113 We hence
chose to base most of our calculations on a cuboctahedral structure due to experimental evidence
as well as a planned future extension of the present study on the size dependence of catalyst-
support interactions, for which the cuboctahedral structure is particularly suitable because it
exhibits surfaces that are representative of multiple relevant crystal facets, (100) and (111), as
well as steps and corners. We have verified that key results of the present study hold also for the
lowest energy gas phase configuration of the Pt13 cluster (see discussion in the results section).
Starting from vacuum optimized NP structures, shown in Figure 3.1b, we simulated the
35
adsorption of NPs onto the silica surface using discrete element method114 (DEM) simulations
followed by DFT calculations.
In contrast to supported NPs on crystalline surfaces, generating initial structures of the
NPs on the support is non-trivial when modeling amorphous supports; if the NP is too close to
the surface then initial repulsive forces will cause artificial restructuring; if the NP is not close
enough to the surface, no relaxation will occur because of the lack of long-range forces in DFT.
Simulating NP adsorption—even in the gas phase—onto a support using DFT (e.g., ab initio
molecular dynamics) would be computationally expensive. Hence, the use of DEM to generate
reasonable starting NP-surface structures is crucial to our methodology. Similar to classical
molecular dynamics, particle trajectories are obtained in DEM simulations via Newton’s laws of
motion for each particle at discrete time. In their simplest form the forces on particles, described
by contact mechanics,115 include normal, Hertzian, repulsion and gravitational forces, along with
tangential friction. For the purpose of our study, the forces in DEM can be limited to only
gravity, hard-sphere interactions, and tangential friction, where rebounding of particles (atoms) is
completely avoided by tuning the viscoelasticity of the particles in the simulations. This allows
for the generation of reasonable initial structures, using negligible computational effort, which
can be followed by full relaxation using DFT.
3.2.3 Generating Initial Structures.
We generated starting geometries that sample different initial conditions. We considered two
different possible orientations of the NP with respect to the silica surface, one with the (100)
facet and one with the (111) facet facing the silica surface; these two facets are shown in Figure
3.1b. Additionally, we considered two different amorphous silica surfaces corresponding to Tpre
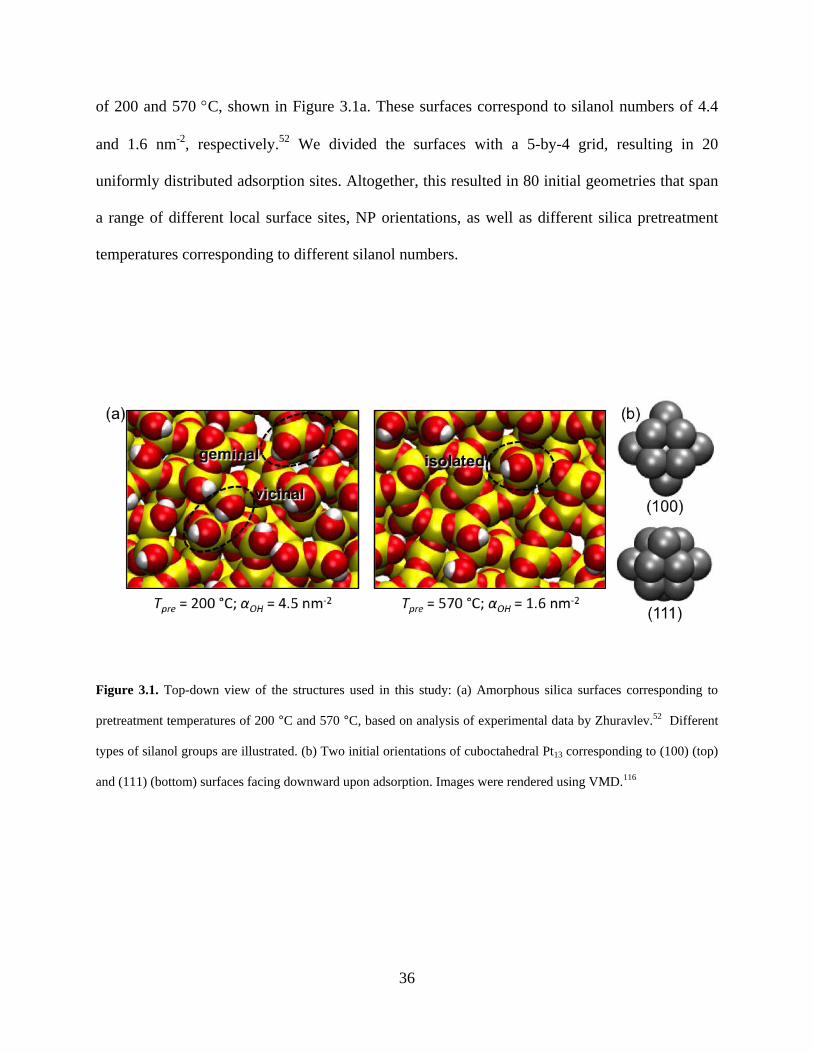
36
of 200 and 570 °C, shown in Figure 3.1a. These surfaces correspond to silanol numbers of 4.4
and 1.6 nm-2, respectively.52 We divided the surfaces with a 5-by-4 grid, resulting in 20
uniformly distributed adsorption sites. Altogether, this resulted in 80 initial geometries that span
a range of different local surface sites, NP orientations, as well as different silica pretreatment
temperatures corresponding to different silanol numbers.
Figure 3.1. Top-down view of the structures used in this study: (a) Amorphous silica surfaces corresponding to
pretreatment temperatures of 200 °C and 570 °C, based on analysis of experimental data by Zhuravlev.52 Different
types of silanol groups are illustrated. (b) Two initial orientations of cuboctahedral Pt13 corresponding to (100) (top)
and (111) (bottom) surfaces facing downward upon adsorption. Images were rendered using VMD.116
37
3.2.4 Simulating NP Adsorption.
We simulated the adsorption of Pt on silica using a procedure, illustrated in Figure 3.2, that
generates physically reasonable structures by relaxing all atom positions with DFT. We
automated the procedure using a series of Perl and Python codes that perform the following steps
for each of the systems initialized in the previous step: (a) Initialization of the cluster/support
system. Gas-phase optimized cuboctahedral Pt13 was placed on a grid point in the xy plane above
the silica surface. (b) Dropping the cluster onto the surface. The cluster was then dropped onto
the surface, by imposing a gravitational force, using a discrete element code117 invoking the
following approximations: (i) all atoms were treated as hard spheres with radius equal to their
respective van der Waals radii; (ii) the cluster and surface were treated as rigid bodies; (iii) the
particles (i.e., atoms) dissipated energy quickly enough during collisions to avoid any
rebounding. The clusters typically rotated to some degree as a result of gravity and a point of
hard-sphere contact between NP and surface. These steps generated configurations with
sufficiently close NP-surface distances to facilitate relaxation (local optimization) with DFT to
strongly bound physisorption states. Typical relaxation energies for physisorbed clusters were 2-
3 eV (i.e., the relaxed structures were 2-3 eV lower in energy than the starting configurations).
We also verified that these initial configurations were not so close that the NP-surface interaction
was repulsive. We confirmed that the energy of each initial condition was lower than the
combined energies of the isolated NP and silica slab, indicating that the DFT relaxed geometries
are not a result of an initially repulsive NP-surface interaction. The average NP-surface energy,
prior to relaxation with DFT, was -0.9 eV for all physisorbed systems. (c) Cluster-silica bond
formation. Experiments have indicated that noble metal clusters (such as Pdn) supported on silica
form metal-oxygen bonds with the support during preparation of the NP-silica catalyst systems,
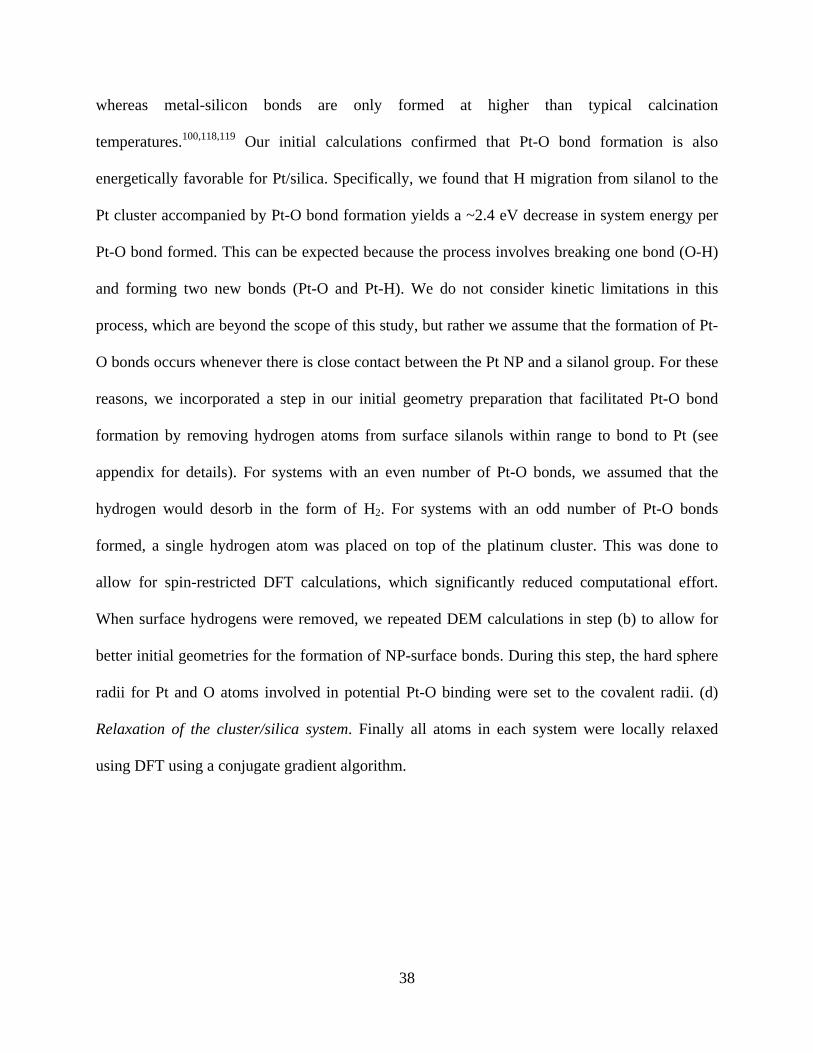
38
whereas metal-silicon bonds are only formed at higher than typical calcination
temperatures.100,118,119 Our initial calculations confirmed that Pt-O bond formation is also
energetically favorable for Pt/silica. Specifically, we found that H migration from silanol to the
Pt cluster accompanied by Pt-O bond formation yields a ~2.4 eV decrease in system energy per
Pt-O bond formed. This can be expected because the process involves breaking one bond (O-H)
and forming two new bonds (Pt-O and Pt-H). We do not consider kinetic limitations in this
process, which are beyond the scope of this study, but rather we assume that the formation of Pt-
O bonds occurs whenever there is close contact between the Pt NP and a silanol group. For these
reasons, we incorporated a step in our initial geometry preparation that facilitated Pt-O bond
formation by removing hydrogen atoms from surface silanols within range to bond to Pt (see
appendix for details). For systems with an even number of Pt-O bonds, we assumed that the
hydrogen would desorb in the form of H2. For systems with an odd number of Pt-O bonds
formed, a single hydrogen atom was placed on top of the platinum cluster. This was done to
allow for spin-restricted DFT calculations, which significantly reduced computational effort.
When surface hydrogens were removed, we repeated DEM calculations in step (b) to allow for
better initial geometries for the formation of NP-surface bonds. During this step, the hard sphere
radii for Pt and O atoms involved in potential Pt-O binding were set to the covalent radii. (d)
Relaxation of the cluster/silica system. Finally all atoms in each system were locally relaxed
using DFT using a conjugate gradient algorithm.
39
Figure 3.2. Procedure for simulating NP adsorption. (a) An NP having one of two different orientations is dropped
to the surface from one of 20 xy grid points. Two surfaces are used, each having a different pretreatment
temperature, giving a total of 80 different systems. (b) The NP is allowed to rotate using rigid-body approximations
and hard-sphere interactions. (c) Pt-O bonds are facilitated by removing H atoms in contact with Pt. (d) The entire
system is locally relaxed using DFT.
3.3 RESULTS AND DISCUSSION
3.3.1 NP-Support Binding Interactions.
Platinum NPs can bind to the support surface via physisorption or via covalent Pt-O and Pt-Si
bonds. We characterized bonding using the simple distance rules for a ball-and-stick molecular
model (see appendix for details). Due to the heterogeneity of the silica surface, there is a wide
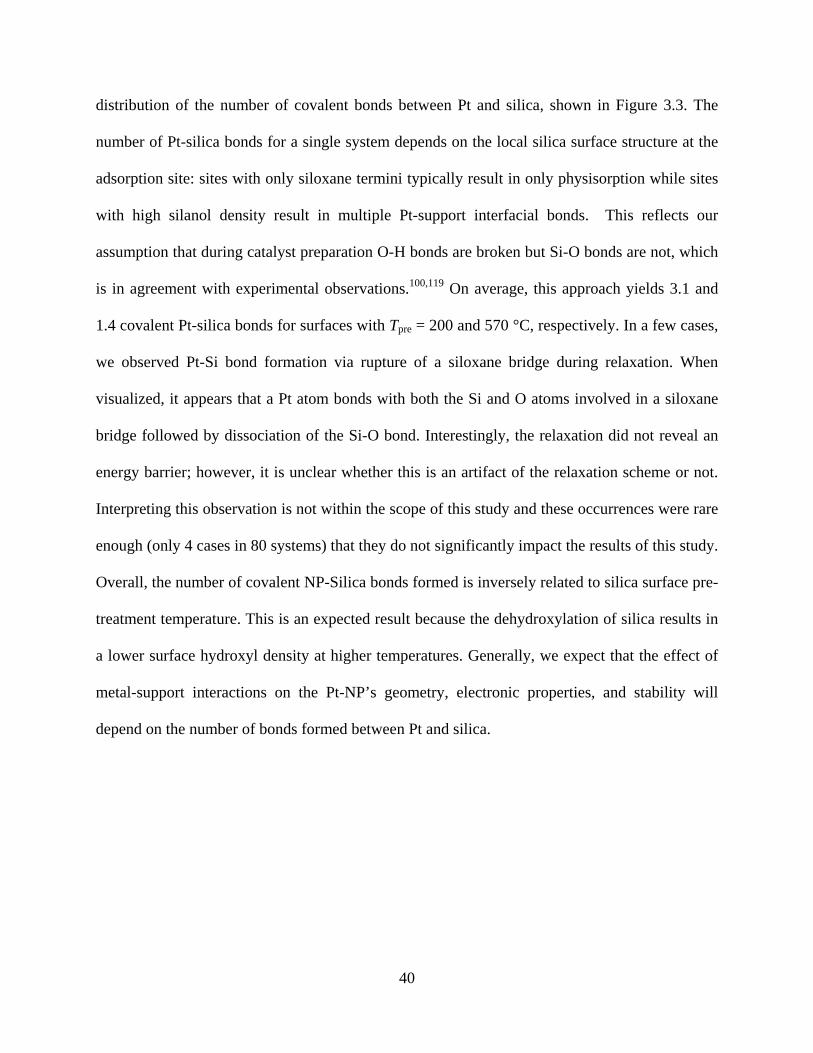
40
distribution of the number of covalent bonds between Pt and silica, shown in Figure 3.3. The
number of Pt-silica bonds for a single system depends on the local silica surface structure at the
adsorption site: sites with only siloxane termini typically result in only physisorption while sites
with high silanol density result in multiple Pt-support interfacial bonds. This reflects our
assumption that during catalyst preparation O-H bonds are broken but Si-O bonds are not, which
is in agreement with experimental observations.100,119 On average, this approach yields 3.1 and
1.4 covalent Pt-silica bonds for surfaces with Tpre = 200 and 570 °C, respectively. In a few cases,
we observed Pt-Si bond formation via rupture of a siloxane bridge during relaxation. When
visualized, it appears that a Pt atom bonds with both the Si and O atoms involved in a siloxane
bridge followed by dissociation of the Si-O bond. Interestingly, the relaxation did not reveal an
energy barrier; however, it is unclear whether this is an artifact of the relaxation scheme or not.
Interpreting this observation is not within the scope of this study and these occurrences were rare
enough (only 4 cases in 80 systems) that they do not significantly impact the results of this study.
Overall, the number of covalent NP-Silica bonds formed is inversely related to silica surface pre-
treatment temperature. This is an expected result because the dehydroxylation of silica results in
a lower surface hydroxyl density at higher temperatures. Generally, we expect that the effect of
metal-support interactions on the Pt-NP’s geometry, electronic properties, and stability will
depend on the number of bonds formed between Pt and silica.
41
Figure 3.3. Distribution of the number of Pt-silica bonds (both Pt-O and Pt-Si) for silica surface pretreatment
temperatures of 200 and 570 °C, having αOH values of 4.4 and 1.6 nm2, respectively.
3.3.2 Nanoparticle Stability Depends on Support Preparation.
Next we consider the impact of silica support properties on nanoparticle stability. Campbell and
Sellers have shown that the metal NP chemical potential is fundamental to understanding NP
stability because it represents a measure of the thermodynamic driving force for sintering. Rate
equations derived from microkinetic models for sintering have shown that the chemical potential
of the metal is inversely related to the apparent activation energy of the sintering process,
whether the sintering occurs via Ostwald ripening or particle diffusion/coalescence.11
Furthermore, the chemical potential of a supported metal NP is directly related to its adhesion
energy, Eadh, defined as the work required to separate the metal/oxide interface in vacuum per
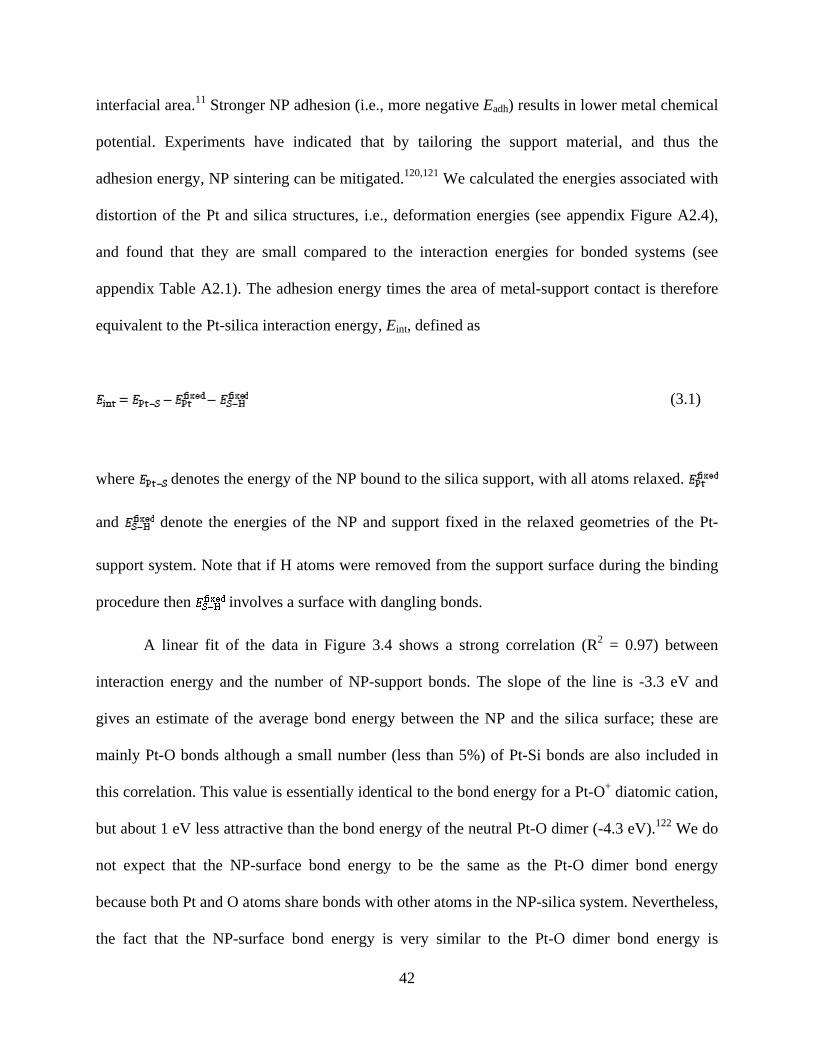
42
interfacial area.11 Stronger NP adhesion (i.e., more negative Eadh) results in lower metal chemical
potential. Experiments have indicated that by tailoring the support material, and thus the
adhesion energy, NP sintering can be mitigated.120,121 We calculated the energies associated with
distortion of the Pt and silica structures, i.e., deformation energies (see appendix Figure A2.4),
and found that they are small compared to the interaction energies for bonded systems (see
appendix Table A2.1). The adhesion energy times the area of metal-support contact is therefore
equivalent to the Pt-silica interaction energy, Eint, defined as
(3.1)
where denotes the energy of the NP bound to the silica support, with all atoms relaxed.
and denote the energies of the NP and support fixed in the relaxed geometries of the Pt-
support system. Note that if H atoms were removed from the support surface during the binding
procedure then involves a surface with dangling bonds.
A linear fit of the data in Figure 3.4 shows a strong correlation (R2 = 0.97) between
interaction energy and the number of NP-support bonds. The slope of the line is -3.3 eV and
gives an estimate of the average bond energy between the NP and the silica surface; these are
mainly Pt-O bonds although a small number (less than 5%) of Pt-Si bonds are also included in
this correlation. This value is essentially identical to the bond energy for a Pt-O+ diatomic cation,
but about 1 eV less attractive than the bond energy of the neutral Pt-O dimer (-4.3 eV).122 We do
not expect that the NP-surface bond energy to be the same as the Pt-O dimer bond energy
because both Pt and O atoms share bonds with other atoms in the NP-silica system. Nevertheless,
the fact that the NP-surface bond energy is very similar to the Pt-O dimer bond energy is
43
reassuring. Figure 3.4 implies that the adhesion energy of supported Pt NPs can be correlated
with surface pretreatment temperature because the number of Pt-surface bonds is inversely
correlated with Tpre. Average interaction energies of -12.4 and -6.8 eV for the Tpre = 200 °C and
570 °C surfaces, respectively, demonstrate the impact pretreatment temperature could have on
NP adhesion. These results suggest that support pre-treatment temperature may be used to tune
catalyst stability; however, further studies will be necessary to elucidate the exact correlation. To
determine whether our results were specific to cuboctahedral Pt13, we simulated the adsorption of
the theoretical gas phase global minimum Pt13 structure107 using the same procedure that was
used for cuboctahedral structures. We used the Tpre = 200 °C surface, one orientation, and 20 xy
gridpoints. We found that the total energies of the supported systems, as functions of the number
of Pt-silica bonds (i.e., normalized by the number of atoms in the system), were the same
regardless of initial Pt13 structure, as shown in Figure A2.5. The energy of the final structure is
thus essentially independent of the energy of the unsupported structure used for the initial
conditions. This unexpected result is due to the dominating influence of the interfacial
interactions for Pt13 NPs.
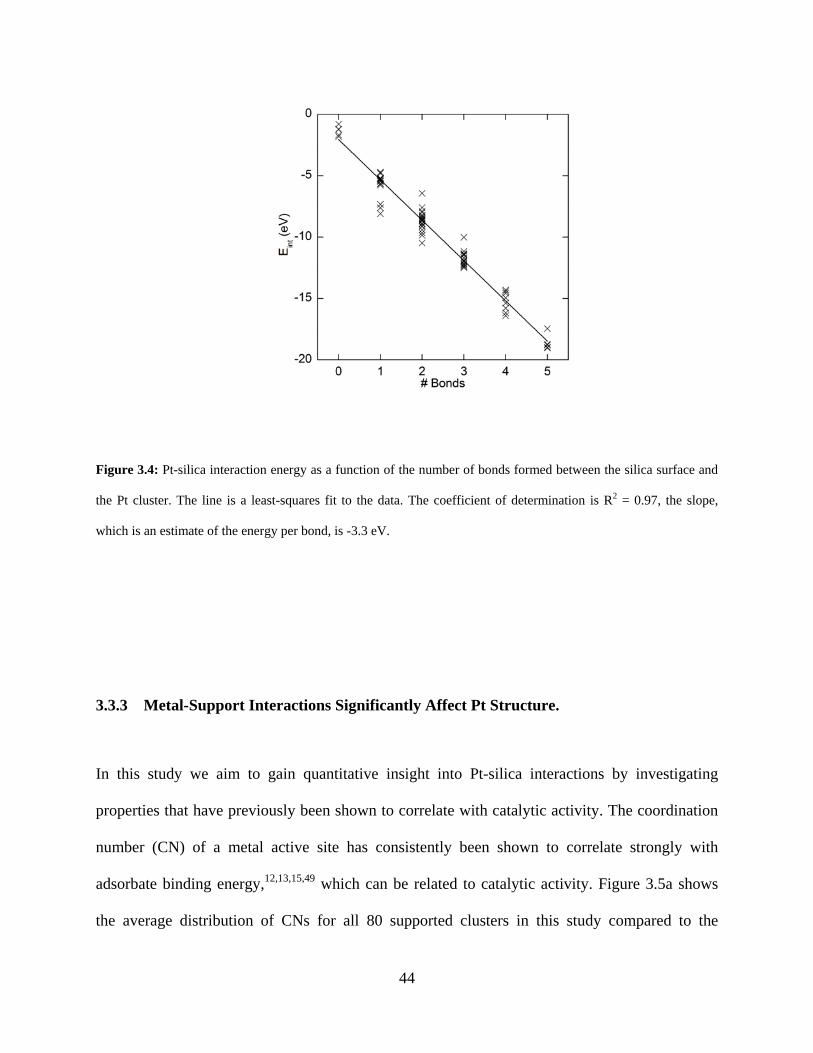
44
Figure 3.4: Pt-silica interaction energy as a function of the number of bonds formed between the silica surface and
the Pt cluster. The line is a least-squares fit to the data. The coefficient of determination is R2 = 0.97, the slope,
which is an estimate of the energy per bond, is -3.3 eV.
3.3.3 Metal-Support Interactions Significantly Affect Pt Structure.
In this study we aim to gain quantitative insight into Pt-silica interactions by investigating
properties that have previously been shown to correlate with catalytic activity. The coordination
number (CN) of a metal active site has consistently been shown to correlate strongly with
adsorbate binding energy,12,13,15,49 which can be related to catalytic activity. Figure 3.5a shows
the average distribution of CNs for all 80 supported clusters in this study compared to the
45
unsupported cluster. We calculated both metal-metal coordination (Pt-Pt) and total CN (Pt-*),
which includes coordination with Pt, Si, O, and H atoms. We found that the distribution of CNs
changed dramatically upon adsorption on the support. The number of accessible low-coordinated
sites can be assessed by comparing the Pt-Pt and Pt-* CNs. The number of 3- and 4-coordinated
sites is significantly higher for Pt-Pt than Pt-*. However, there are still many more 3 and 4 Pt-*
coordinated sites for the supported Pt than unsupported. We therefore conclude that although a
significant number of low coordinated sites are inaccessible because they are buried at the
interface, a large fraction remains available for binding. We found that the use of the gas phase
theoretical global minimum Pt13 structue, instead of the cuboctahedral structure, gave almost
identical CN distributions for both Pt-Pt and Pt-* (see Figure A2.6). This comparison shows that
our results are not due to the use of a relatively high energy initial Pt cluster structure. Clusters
with no Pt-silica bonds had CN distributions more similar to the unsupported cluster (i.e., greater
number of 5 and 6 coordinated sites) than clusters bonded to the support. However, we did not
find clear correlations between structural parameters (such as CNs) and the number of Pt-silica
bonds (see appendix Figure A2.7) except for two general trends: (1) The distribution of CNs
becomes broader in systems with Pt-silica bonds. (2) Figure 3.5b shows that on average, CNs are
smaller for supported than for unsupported systems. The reason for the apparent lack of
correlation between CN and Pt-silica bonds can be explained by the finding that NP-silica
binding has opposite effects on CN of Pt atoms buried at the silica interface and at the exposed
NP surface. In the former case, binding to silica leads to an increase of CN (as other Pt atoms are
attracted to the Pt/Silica interface), and in the latter we observe a decrease of CN (as Pt atoms
move away from the exposed surface). In summary, this gives rise to a complicated composite
effect.
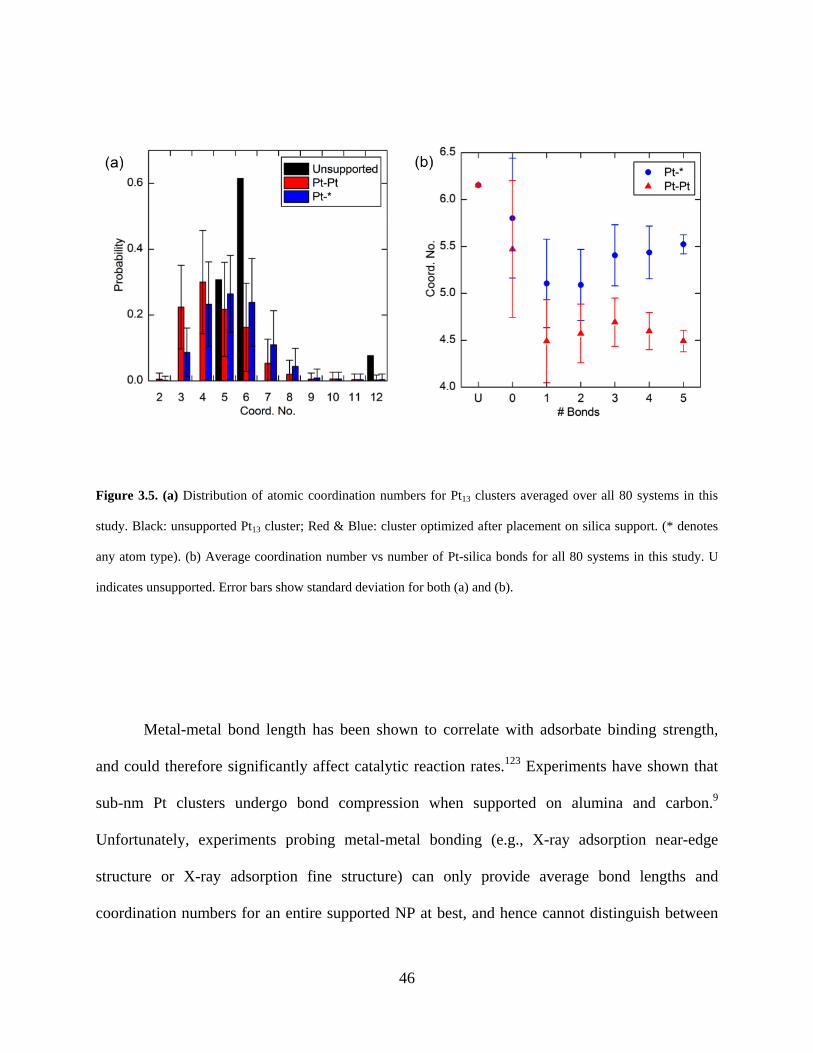
46
Figure 3.5. (a) Distribution of atomic coordination numbers for Pt13 clusters averaged over all 80 systems in this
study. Black: unsupported Pt13 cluster; Red & Blue: cluster optimized after placement on silica support. (* denotes
any atom type). (b) Average coordination number vs number of Pt-silica bonds for all 80 systems in this study. U
indicates unsupported. Error bars show standard deviation for both (a) and (b).
Metal-metal bond length has been shown to correlate with adsorbate binding strength,
and could therefore significantly affect catalytic reaction rates.123 Experiments have shown that
sub-nm Pt clusters undergo bond compression when supported on alumina and carbon.9
Unfortunately, experiments probing metal-metal bonding (e.g., X-ray adsorption near-edge
structure or X-ray adsorption fine structure) can only provide average bond lengths and
coordination numbers for an entire supported NP at best, and hence cannot distinguish between

47
accessible and non-accessible (e.g., buried in the Pt-silica interface) sites.9 Figure 3.6a shows that
Pt-silica bonding results in significant Pt-Pt bond compression. This bond compression,
furthermore, was consistent between surface, fully coordinated and interfacial atoms (see
appendix Figure A2.8).
Figure 3.6b shows that there is an approximately linear relationship between bond
compression and average Pt-Pt coordination number. Furthermore, the unsupported Pt13 cluster
(red dot) lies on the same line as the supported clusters, suggesting that the observed bond
compression is essentially a result of reduced (average) CN of the metal NP. This is not
unexpected, as surface compression is well known to occur at solid-gas interfaces. The
magnitude of the observed bond compression, however, suggests that the relationship between
CN and adsorbate binding energy calculated using surfaces or fixed bulk geometries 12,13,15 may
be significantly different than for fully relaxed small supported clusters, in particular, on
amorphous supports. Based on our results, we expect the effects of metal-support interactions on
adsorbate binding energies to be complicated because NP-support interactions give rise to two
competing phenomena, namely an increase in bond compression, which generally weakens
adsorbate binding, and a decrease in CN, which generally enhances adsorbate binding.
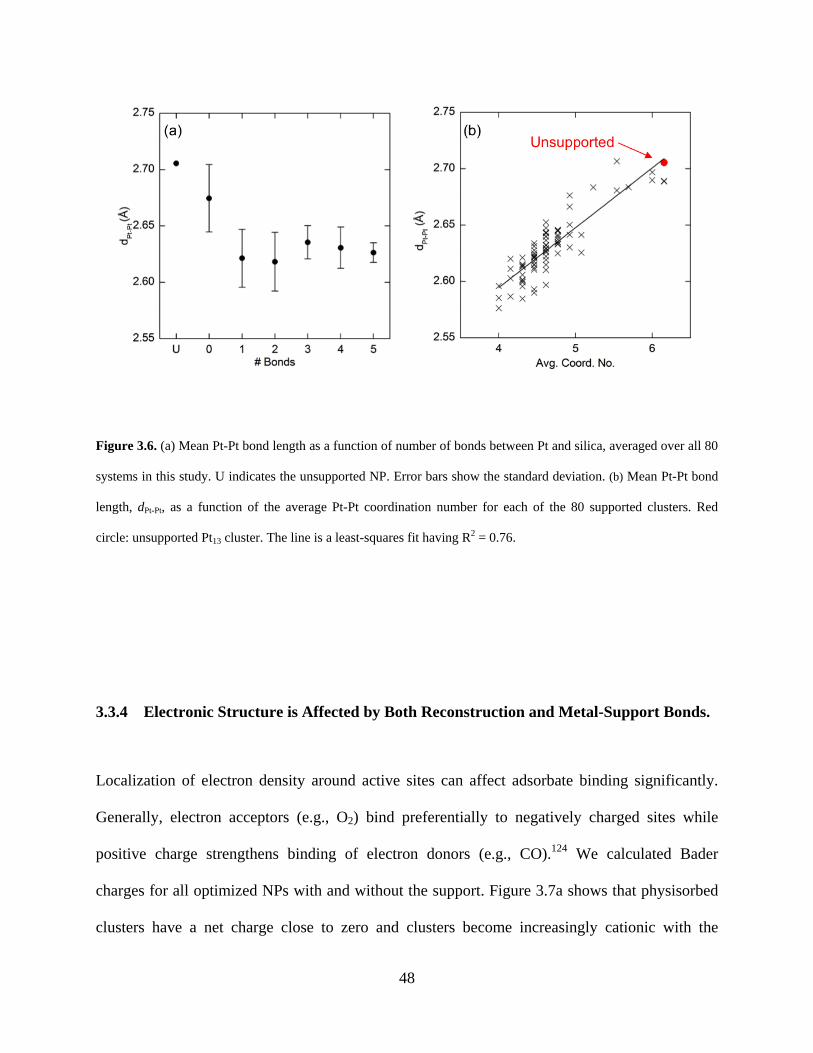
48
Figure 3.6. (a) Mean Pt-Pt bond length as a function of number of bonds between Pt and silica, averaged over all 80
systems in this study. U indicates the unsupported NP. Error bars show the standard deviation. (b) Mean Pt-Pt bond
length, dPt-Pt, as a function of the average Pt-Pt coordination number for each of the 80 supported clusters. Red
circle: unsupported Pt13 cluster. The line is a least-squares fit having R2 = 0.76.
3.3.4 Electronic Structure is Affected by Both Reconstruction and Metal-Support Bonds.
Localization of electron density around active sites can affect adsorbate binding significantly.
Generally, electron acceptors (e.g., O2) bind preferentially to negatively charged sites while
positive charge strengthens binding of electron donors (e.g., CO).124 We calculated Bader
charges for all optimized NPs with and without the support. Figure 3.7a shows that physisorbed
clusters have a net charge close to zero and clusters become increasingly cationic with the
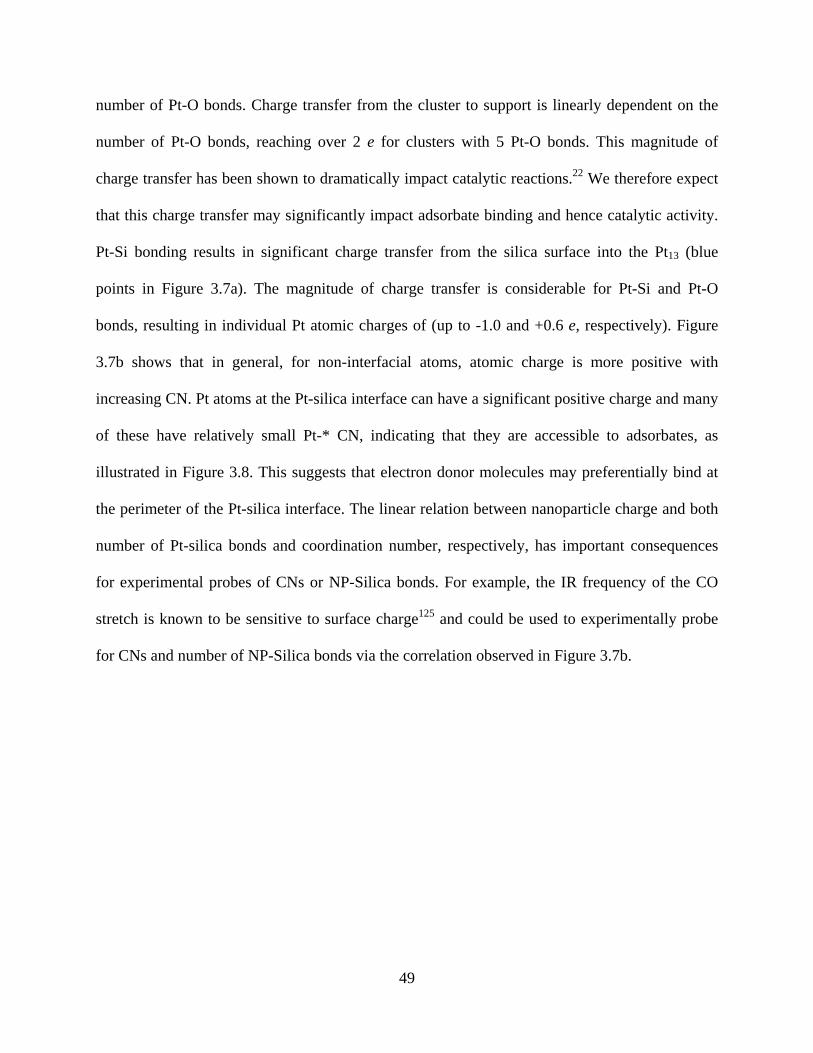
49
number of Pt-O bonds. Charge transfer from the cluster to support is linearly dependent on the
number of Pt-O bonds, reaching over 2 e for clusters with 5 Pt-O bonds. This magnitude of
charge transfer has been shown to dramatically impact catalytic reactions.22 We therefore expect
that this charge transfer may significantly impact adsorbate binding and hence catalytic activity.
Pt-Si bonding results in significant charge transfer from the silica surface into the Pt13 (blue
points in Figure 3.7a). The magnitude of charge transfer is considerable for Pt-Si and Pt-O
bonds, resulting in individual Pt atomic charges of (up to -1.0 and +0.6 e, respectively). Figure
3.7b shows that in general, for non-interfacial atoms, atomic charge is more positive with
increasing CN. Pt atoms at the Pt-silica interface can have a significant positive charge and many
of these have relatively small Pt-* CN, indicating that they are accessible to adsorbates, as
illustrated in Figure 3.8. This suggests that electron donor molecules may preferentially bind at
the perimeter of the Pt-silica interface. The linear relation between nanoparticle charge and both
number of Pt-silica bonds and coordination number, respectively, has important consequences
for experimental probes of CNs or NP-Silica bonds. For example, the IR frequency of the CO
stretch is known to be sensitive to surface charge125 and could be used to experimentally probe
for CNs and number of NP-Silica bonds via the correlation observed in Figure 3.7b.
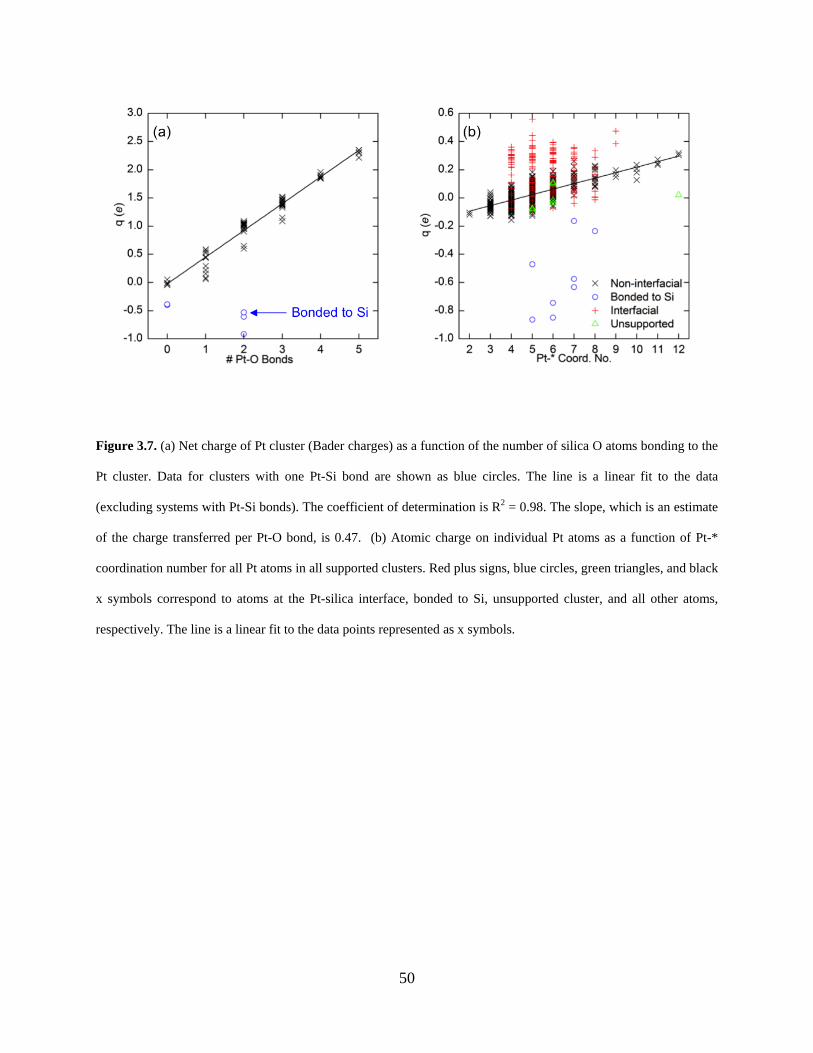
50
Figure 3.7. (a) Net charge of Pt cluster (Bader charges) as a function of the number of silica O atoms bonding to the
Pt cluster. Data for clusters with one Pt-Si bond are shown as blue circles. The line is a linear fit to the data
(excluding systems with Pt-Si bonds). The coefficient of determination is R2 = 0.98. The slope, which is an estimate
of the charge transferred per Pt-O bond, is 0.47. (b) Atomic charge on individual Pt atoms as a function of Pt-*
coordination number for all Pt atoms in all supported clusters. Red plus signs, blue circles, green triangles, and black
x symbols correspond to atoms at the Pt-silica interface, bonded to Si, unsupported cluster, and all other atoms,
respectively. The line is a linear fit to the data points represented as x symbols.
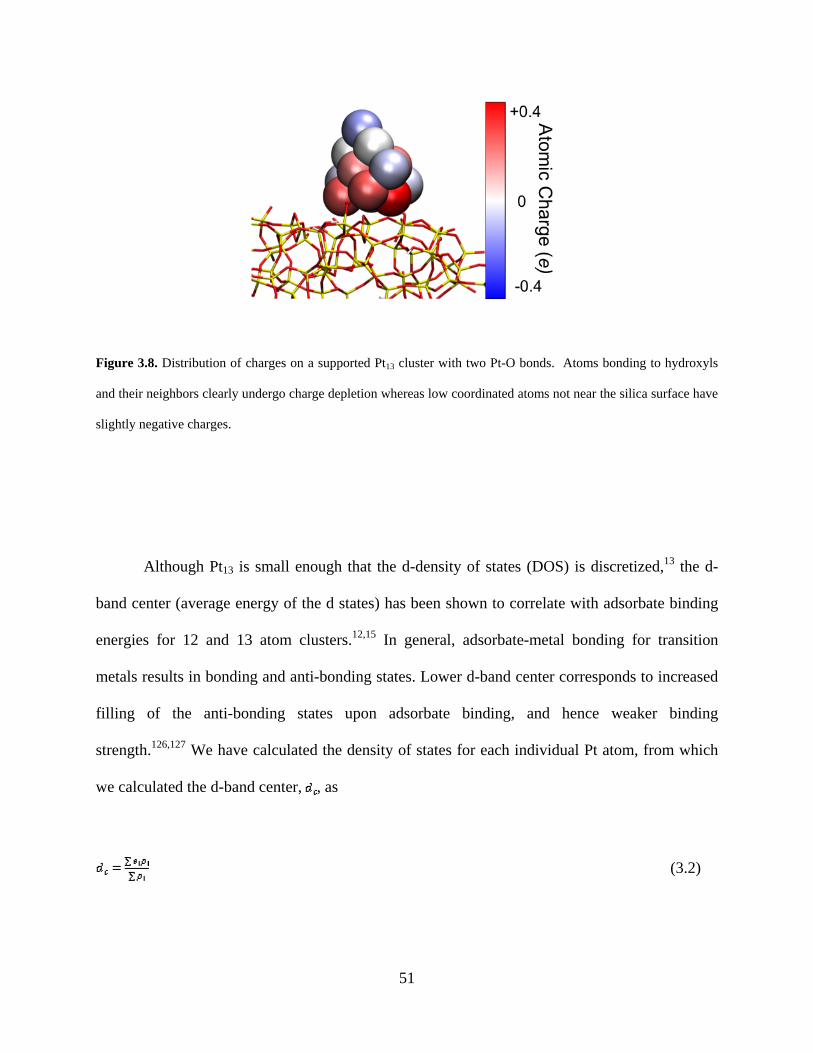
51
Figure 3.8. Distribution of charges on a supported Pt13 cluster with two Pt-O bonds. Atoms bonding to hydroxyls
and their neighbors clearly undergo charge depletion whereas low coordinated atoms not near the silica surface have
slightly negative charges.
Although Pt13 is small enough that the d-density of states (DOS) is discretized,13 the d-
band center (average energy of the d states) has been shown to correlate with adsorbate binding
energies for 12 and 13 atom clusters.12,15 In general, adsorbate-metal bonding for transition
metals results in bonding and anti-bonding states. Lower d-band center corresponds to increased
filling of the anti-bonding states upon adsorbate binding, and hence weaker binding
strength.126,127 We have calculated the density of states for each individual Pt atom, from which
we calculated the d-band center, , as
(3.2)
52
where is the eigenvalue of state i and is the density of state i. We considered states with
eigenvalues between -8 eV and +6 eV. In agreement with previous studies,12,15 we found that the
d-band center for Pt atoms roughly correlates with CN, when considering all atoms in the
isolated cluster. When analyzing Pt atoms for all supported Pt13 systems in this study, however,
there is at best a weak correlation between d-band center and CN (see appendix Figure A2.9). To
test if this lack of correlation is due to the wide range of geometries observed in this study, we
analyzed each system individually. We fit the d-band center as a function of the CN for each
individual system with a linear equation and calculated the coefficient of determination (R2). We
found that for almost all systems there was no clear correlation between the d-band center and
the Pt-Pt CN. The results clearly indicate that it is not just the wide range of different geometries
on amorphous supports, but that CN cannot be used to predict relative d-band centers for
adsorption sites on silica-supported Pt13, even when considering a single supported cluster (see
appendix Figure A2.10).
Recent work has shown that it is more appropriate to treat small, supported metal clusters
as molecules rather than small pieces of bulk metal.21,39 We therefore considered the d-bands of
entire Pt clusters. Supporting Pt13 on silica did not result in a consistent perturbation of the d-
DOS; however, d-band centers for supported systems varied significantly from about -1.87 to -
1.64 eV, compared to -1.75 eV for the unsupported cluster (see appendix Figure A2.11). When
re-calculating the DOS for systems after removing the support (but fixing the reconstructed Pt
geometry) we found that the d-DOS is unaffected by Pt-silica bonds. This means that the wide
range of d-band centers observed is due to the degree of reconstruction caused by metal-support
interactions upon adsorption of the NP and not electronic interactions with the support.
53
Supporting the notion that small supported metal clusters behave as molecules, previous
theoretical investigations have shown that, for small metal clusters, the frontier orbitals—the
highest occupied molecular oribital (HOMO) and lowest unoccupied molecular orbital
(LUMO)—can be used to accurately predict relative binding energies of adsorbates.39 In
particular, binding properties of electron acceptors and donors are particularly well correlated
with the localization of the HOMO and LUMO, respectively, on small metal clusters.20,39 We
therefore performed a qualitative analysis on a number of the systems in this study to investigate
the effects of Pt-silica interactions on frontier orbitals. We found that supporting the cluster on
amorphous silica can have a dramatic impact on the ‘extent’ (i.e., the size of an atomic orbital at
constant iso-value) and directionality of both the HOMO and LUMO at different surface sites.
These effects could be a result of multiple factors: (1) significant distortion of the cluster
geometry, (2) Pt-O bond formation, and (3) non-covalent (van der Waals and electrostatic)
interactions between cluster and support. To isolate the effects of these factors, Figure 3.9 shows
a comparison of the HOMO and LUMO for Pt13 relaxed in vacuum (unsupported), relaxed on the
silica surface, and relaxed on the silica surface followed by the removal of the silica support.
This allowed us to discern the roles of geometric reconstruction (unsupported vs supported) and
Pt-silica interactions (supported, with vs without silica atoms).
We discovered a number of general trends for all observed systems. First, it is clear by
comparing the first two columns of Figure 3.9 that distortion of the cluster geometry due to NP-
support interactions results in dramatic changes to both the extent and directionality of the
HOMO and LUMO. Comparison of the supported Pt cluster with and without silica atoms (2nd
and 3rd columns of Figure 3.9) demonstrates the effects of Pt-O bond formation on the frontier
orbitals. In general, we found that Pt-O bonds significantly affect the extent of the HOMO and
54
LUMO in a consistent way. Near Pt-O bonds, the extent of the HOMO is increased while the
LUMO is reduced. For atoms far from Pt-O bonds, however, the extent of the LUMO is
increased while the HOMO is reduced. This can be interpreted as the formation of Pt-O bonds
“pulling” the HOMO in while “pushing” the LUMO away. Analysis of supported Pt13 systems
with no Pt-O bond formation show that non-covalent Pt-silica interactions have negligible effects
on the frontier orbitals (see appendix Tables A2.2 and A2.3).
The effect of NP-silica binding on the frontier orbitals is expected to influence adsorbate
binding in the opposite way to charge distribution, discussed above. In particular, the increase of
the HOMO amplitude near Pt-O bonds suggests that the affinity to bind electron acceptors (e.g.,
O2) at the Pt-silica interface is increased upon forming Pt-silica bonds. Conversely, the reduction
of LUMO amplitude near Pt-O bonds suggests that the binding affinity for electron donors (e.g.,
CO) at the Pt-silica interface will be decreased. NP-silica binding thus results in competing
phenomena: redistribution of the frontier orbitals and electron density distribution. As we have
already seen for the geometric parameters, the correlation between structure (deformation) and
NP-silica binding is quite complicated due to a superposition of multiple effects. It can therefore
be expected that the impact of NP-support binding on catalyst-substrate adsorption may also be
quite convoluted. A detailed study of NP-substrate binding thus requires significant development
that goes beyond the scope of this work and will be presented in a future publication.

55
Figure 3.9. Representative images of the HOMO and LUMO for unsupported cuboctahedral Pt13, Pt13/SiO2, and
Pt13/SiO2 with silica atoms removed.
56
3.4 CONCLUSIONS
We have developed a methodology for studying metal nanoparticles on amorphous supports,
which can be applied to a number of NP and support materials. Our approach uses a combination
of the discrete element method and DFT calculations to generate model systems of supported
NPs. We used this method to quantitatively investigate the impact of an amorphous silica surface
on the morphology, electronic structure, and energetics of supported Pt13 clusters. Our results
reveal that the support significantly alters the physicochemical properties of the adsorbed NP. A
summary of our findings is as follows:
1. Our results suggest that surface pre-treatment temperature can be used to tune the
Pt-SiO2 interface and thus stability of silica-supported nanoparticles because the
number of Pt-silica bonds is a function of the pre-treatment temperature.
Experiments to validate this prediction are currently underway.
2. Charge transfer from Pt to silica, via Pt-O bonds, is strongly correlated with the
silica silanol number, and results in charge depletion of Pt atoms near the
perimeter of the NP-silica interface.
3. Adsorption of Pt13 NP clusters on amorphous silica results in considerable
relaxation of the NP. The surface-mediated relaxation leads to substantial
lowering of average Pt coordination numbers, significant Pt-Pt bond compression,
and dramatically affects the d-band centers and frontier orbitals.
4. The frontier orbitals are significantly affected both by the distortion of the Pt NP
cluster due to adsorption and electronic effects from the silica support. The effects
of NP-silica binding on the frontier orbitals and charge distribution result in
competing influence on adsorbate binding behavior.
57
The extent of the impact of support interactions with Pt13 NPs, i.e. the strong effect of the
Pt-SiO2 interface, means that experimental attempts to measure the innate properties of very
small NP catalysts will likely fail because the measurable physical and chemical properties will
depend critically on NP-support interactions, which will vary significantly across the surface of
an amorphous support. Furthermore, the magnitude and complexity of the changes to NP
properties induced by catalyst-support interactions indicate that the adsorbate binding properties
of these systems cannot be accurately predicted by studying either the corresponding
freestanding clusters or Pt13 on perfectly crystalline silica surfaces, i.e. the accurate description of
the Pt-SiO2 interface is critical. The range of effects observed in this study further indicates that
single geometric and electronic descriptors for adsorbate binding may not hold much meaning
for sub-nm clusters on amorphous supports. Many trends determined for larger or freestanding
clusters, therefore, cannot be expected to extrapolate to very small (i.e., 13 atom and smaller)
metal clusters on amorphous supports. In future work we will thus investigate the impact of
metal-support interactions on NP properties as a function of cluster size.
58
4.0 EFFECT OF SUPPORT PREPARATION AND NANOPARTICLE SIZE ON
CATALYST-SUPPORT INTERACTIONS BETWEEN PT AND AMORPHOUS SILICA
The content of this chapter is taken from C. S. Ewing, G. Veser, J. J. McCarthy, J. K. Johnson,
and D. S. Lambrecht, “Effect of Support Preparation and Nanoparticle Size on Catalyst-Support
Interactions between Pt and Amorphous Silica” J. Phys. Chem. C, submitted (2015).
4.1 INTRODUCTION
Recent developments in both computational methods2-7,12-15,128 and experimental characterization
techniques9-11 have facilitated detailed characterization of catalytic materials at the atomic level.
Insights relating structural and electronic properties to catalytic reactivity, selectivity, and
stability have provided some general rules for tailoring catalyst properties via what is now
ubiquitously termed “rational design.”7,11-16 Many computational results have been shown to
agree quite well with experimental observations; in particular, correlations involving simple
properties (e.g., coordination number and adsorbate binding energies) and simple systems (e.g.,
extended metal surfaces and diatomic reactants). Catalytic materials research, however, has
recently shifted towards ever-smaller nanoparticles (NPs) and increasingly complex support
materials. While approaches to understanding simple catalytic materials have been well
established and researched in recent years,7,11-17 atomistic studies of supported NP systems have
59
been limited to idealized, perfectly crystalline supports.18-22 Numerous studies have exploited
geometry constrained calculations to isolate the effects of coordination number and NP
size.12,13,15,129 This approach often provides clear trends and powerful insight regarding catalyst
design. However, distortion of the support structure has been shown to significantly alter the
structure and electronic properties of supported NPs.18,130 Amorphous supports exhibit a diverse
range of local surface structures, which result in a distribution of catalyst-support interactions.
Capturing the entire distribution is important because small differences in structure can
significantly affect catalyst reactivity and/or stability.130,131
In contrast to these approaches, we have recently embarked on a research program in
which we aim to (a) examine catalyst-support interactions on amorphous supports (commonly
used in practice), and (b) develop a transferable methodology for predicting the effects of metal-
support interactions on physicochemical properties of the supported nanoparticle. Ultimately, an
improved understanding of how support materials affect the properties of catalytic nanoparticles
should provide a set of design rules that can be used as a guide for developing novel or improved
catalytic materials.
We recently studied the catalyst-support interactions between Pt13 and amorphous silica
supports using a first-principles-based approach. Our calculations revealed that the
physicochemical properties of Pt13 (0.7 nm) are significantly altered when supported on
amorphous silica. The results indicate that both the charge transfer and the adhesion energy of
Pt13 are strongly, and linearly dependent on the surface hydroxyl density, suggesting that the pre-
treatment temperature of the amorphous silica support can be used to tune catalyst-adsorbate
interactions as well as NP stability.130
60
Here, we extend the methodology we developed to quantitatively analyze the impact of
amorphous silica supports on the morphology, electronic structure, and energetics of
cuboctahedral Pt NPs having 13, 55, and 147 atoms (0.7, 1.2 and 1.7 nm in diameter,
respectively). Our studies reveal the impact of NP size on catalyst-support interactions, as
quantified by the number of covalent catalyst-support bonds, charge transfer, and adhesion
energy between Pt and amorphous silica. We furthermore introduce a new empirical approach
for the prediction of adhesion and charge transfer properties of larger NPs that allows expedited
predictions on large NPs without requiring explicit density functional theory (DFT) calculations.
4.2 METHOD
4.2.1 Computational details.
All DFT calculations performed in this work used the CP2K code, which employs a Quickstep78
implementation of the DFT method using plane waves/pseudopotentials and localized gaussian
basis sets (see appendix for details). Calculations used the revised PBE functional (revPBE)104
and GTH pseudopotentials81,82 in conjunction with short range double-ζ basis sets with
polarization functions (SR-DZVP).105 All surface slabs were relaxed using CP2K treated as
periodic in all directions with at least 20 Å of vacuum between periodic images in the z
dimension to eliminate interactions between the periodic images of the surface slabs. The plane
wave energy cutoff, basis sets, vacuum spacing and spin-restricted relaxation for these systems
have been validated for these systems previously.130
61
4.2.2 Model amorphous silica surfaces.
We used periodic amorphous silica surface structures constructed from a model developed by
Ewing et al.103 to investigate NP-surface interactions. These model surface structures are based
on first-principles simulations and have been found to accurately predict hydroxyl density and
distribution of hydroxyl groups as a function of temperature without any adjustable
parameters.103 Five distinct model surfaces were generated and the hydroxyl density of each
system was adjusted using an algorithm to mimic a range of silica pretreatment temperatures
Tpre, giving a total of 56 different surface structures.103 For the DFT calculations in this work, we
use surface structures having high (4.5 nm-2) and low (1.6 nm-2) hydroxyl densities,
corresponding to low (200 °C) and high (570 °C) Tpre, respectively. For the discrete element
method calculations described below we use all 56 surface structures. The size of the unit cell we
used for Pt13 calculations was 23.7 Å × 18.3 Å × 32 Å having between 260 and 290 atoms,
depending on the corresponding Tpre . For Pt55 and Pt147 systems we doubled the unit cell size by
using two identical copies of the silica slab side-by-side in the y direction (resulting in unit cells
containing 550 or 690 atoms and having dimensions of 23.7 Å × 36.6 Å × 37 Å for Pt55 and 23.7
Å × 36.6 Å × 42 Å for Pt147). The minimum distances between Pt NPs and their periodic images
were 11.3, 11.7, and 6.7 Å for Pt13, Pt55 and Pt147, respectively. We confirmed that 6.7 Å is
sufficient separation to avoid significant error due to self-interaction of the cluster with its
periodic image (see appendix Table A3.1).
62
4.2.3 Pt nanoparticles.
We chose magic number cuboctahedral NPs for the present study because they exhibit surfaces
that are representative of (100) and (111) crystal facets, as well as steps and corners. The
symmetry of the cuboctahedral structure is identical for the magic number NPs that we have
chosen, allowing us to focus on the effects of NP size. Cuboctahedral Pt NPs around 1-2 nm in
size have been observed experimentally in a number of studies,10,110,111,132 including Pt55 on
amorphous silica118,133 and Pt13 on a zeolite.113 Our earlier studies show that, while these
structures are only local minima, results obtained for cuboctahedral structures and gas-phase
global minima structures are in qualitative agreement. We divided each of the silica surfaces for
Pt13, Pt55, and Pt147 into grids of 20 (5×4), 9 (3×3) and 6 (3×2) adsorption locations, respectively.
Taking into account the 4 different sets of initial conditions (two NP orientations and two silica
surface structures) we generated 80, 36, and 24 systems for DFT calculations of Pt13, Pt55, and
Pt147, respectively. More details regarding our methodology can be found in a previous
publication.130
4.2.4 Simulating NP adsorption.
We simulated the adsorption of NPs onto the silica surface using discrete element method110
(DEM) simulations followed by DFT calculations, as described in detail previously.130 Particle
trajectories were obtained in DEM simulations via Newton’s laws of motion for each particle at
discrete time. In their simplest form the forces on particles, described by contact mechanics,115
include normal, Hertzian, repulsion and gravitational forces, along with tangential friction. For
the purpose of our study, the forces in DEM were limited to only gravity, hard-sphere
63
interactions, and tangential friction, where rebounding of particles (atoms) is completely avoided
by tuning the viscoelasticity of the particles in the simulations. This allowed for the generation of
reasonable initial structures, using negligible computational effort.
Experiments have indicated that noble metal clusters supported on silica form metal-
oxygen bonds with the surface hydroxyls during preparation of the NP-silica catalyst systems,
whereas metal-silicon bonds are only formed at higher temperatures than typical for post-
synthesis calcination.100,119,134 To best represent experimentally observed Pt/silica systems we
therefore facilitate Pt-O bond formation between the NP and any surface hydroxyls that are in
contact with Pt atoms in the NP by removing the H atom from those hydroxyl groups and
reducing the hard-sphere interactions between the interacting Pt and O atoms to their covalent
rather than van der Waals radii. Each of the initialized geometries generated for the DFT studies
was fully relaxed to its local minimum using DFT. In addition, we generated many other
structures on each of the 56 surfaces using DEM in order to more fully explore the number of Pt-
silica bonds as a function of NP size (see below).
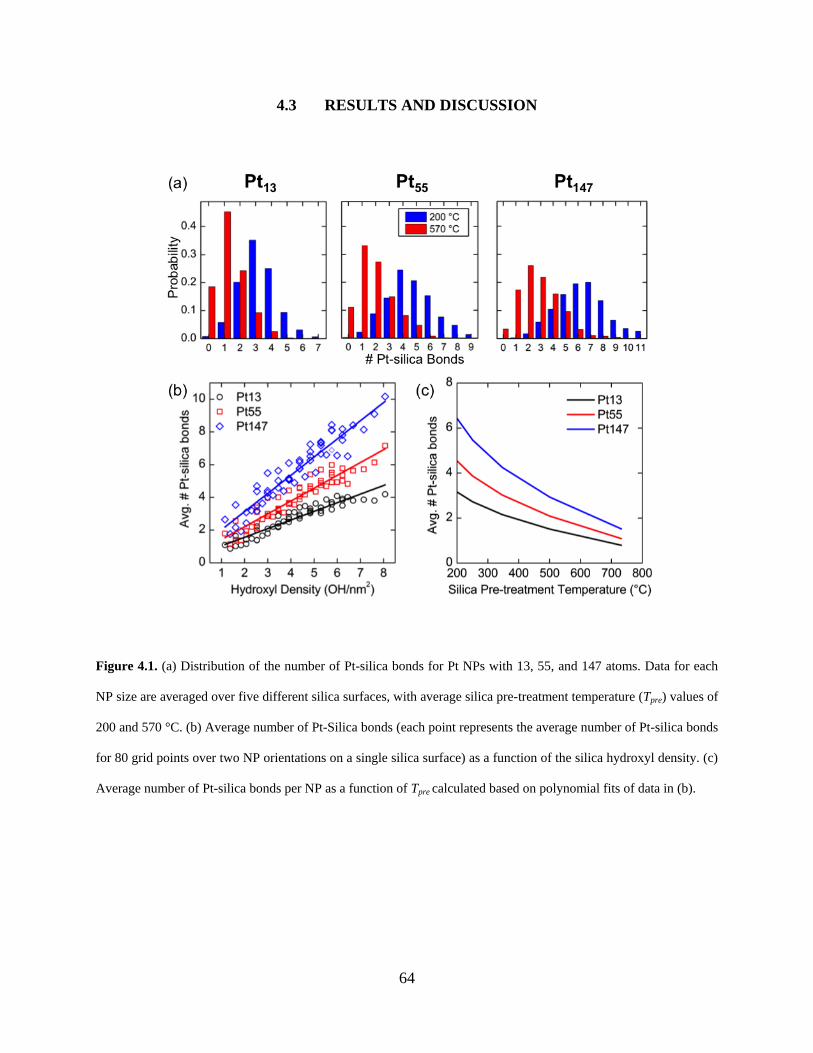
64
4.3 RESULTS AND DISCUSSION
Figure 4.1. (a) Distribution of the number of Pt-silica bonds for Pt NPs with 13, 55, and 147 atoms. Data for each
NP size are averaged over five different silica surfaces, with average silica pre-treatment temperature (Tpre) values of
200 and 570 °C. (b) Average number of Pt-Silica bonds (each point represents the average number of Pt-silica bonds
for 80 grid points over two NP orientations on a single silica surface) as a function of the silica hydroxyl density. (c)
Average number of Pt-silica bonds per NP as a function of Tpre calculated based on polynomial fits of data in (b).
65
4.3.1 Number of interfacial bonds depends on NP size and silica hydroxyl density.
In previous work130 we have shown that catalyst-support interactions between Pt and amorphous
silica are primarily governed by the number of Pt-O bonds, which depends directly on the silica
surface hydroxyl density. To characterize NP-support binding, we used simple distance rules for
a ball-and-stick molecular model130 resulting in the number of Pt-O bonds per system being
equal to the number of hydroxyls that are dissociated to facilitate bond formation during the
DEM adsorption step. Due to the heterogeneity of the amorphous silica surface, there is a wide
distribution of the number of Pt-silica bonds for a given surface structure, as shown in Figure
4.1a. This highlights the need to sample a variety of locations on the surface. Due to the
relatively high computational cost of DFT calculations involving hundreds of atoms, we limited
the number of silica structures and surface locations (as discussed in the Method section) used to
generate initial conditions for DFT calculations. The DEM simulations used in the adsorption
step of model generation, however, require negligible computational time relative to DFT
(seconds vs days, per system). To determine the effects of NP size and silica surface
pretreatment temperature (and hence hydroxyl density) on number and distribution of Pt-O bonds
we therefore applied this DEM-simulated adsorption step for all 56 of the silica surface
structures from our previous study103 (representative structures of 5 independent surfaces
corresponding to a range of temperatures). For these calculations we divided the surfaces into 80
grid points (10 × 8) for all three NP sizes. In all cases a gaussian distribution generally describes
the distribution of Pt-silica bonds (see e.g., Figure 4.1a). By averaging the number of bonds for
all 80 surface locations Figure 4.1b shows the relationship between the number of Pt-O bonds
and the hydroxyl density for different Pt NP sizes. Finally, the well-established35,52-55 relationship
between hydroxyl density and temperature was used to determine how silica pre-treatment

66
temperature affects interfacial bonding, shown in Figure 4.1c. As expected, the number of
interfacial bonds increases with Pt NP size. Furthermore, Figure 4.1a and 4.1b indicate that as
the hydroxyl density is increased (i.e., for lower silica pre-treatment temperature), the effect of
NP size on the number of interfacial bonds increases.
Figure 4.2. (a) Net charge on the Pt NP as a function of the number of Pt-O bonds for Pt13, Pt55, and Pt147. The line
is a least-squares fit to the Pt13 data with regression equation y = 0.457x + 0.0577 (R2 = 0.978). (b) Atomic charge
distributions for representative 13, 55, and 147 atom Pt NPs. Charge data were calculated from Bader analysis.
67
4.3.2 Pt-O bonds result in charge transfer from Pt to support.
Molecular binding energies are significantly affected by the electronic structure of active sites.
Electronic structure properties–electron density, d-density of states, and shape and size of the
HOMO and LUMO–often correlate with adsorbate binding energies. We limit our investigation
to electron density and d-density of states because the larger NP systems have continuous band
structures (see appendix Figure A3.1), prohibiting analysis of their frontier orbitals for
comparison to Pt13, for which the effects of amorphous silica supports has been examined
previously.130
The accumulation or depletion of electron density at a metal active site–the atomic
charge–can significantly alter adsorbate binding strength, and as a result, reactivity. 22,124 To
analyze the effects of catalyst-support interactions on charge transfer we used Bader charge
analysis.135,136 We further verified that the observed trends are not a result of charge calculation
method, observing a similar trend using Mulliken charge analysis,137 (see Figure A3.2 in the
appendix). As is typical for metals supported on hydroxylated oxides,138 Pt-O bonding results in
charge transfer from Pt to the silica support. The slope of the line in Figure 4.2a indicates
significant charge transfer to the support of ~0.5e per Pt-O bond. Figure 4.2b shows a visual
representation of Bader charge analyses, clearly indicating that the resulting effects on the
electron distribution of Pt is local in nature; quantitative analysis of atomic charges for all NP
systems of this study confirms these representative images (see Figure A3.3 in the appendix).
Positively charged metal atoms generally bind oxygen donors more strongly and oxygen
acceptors more weakly.124 Hence, a +0.5e charge is expected to significantly affect reactivity.22
Although NP size does not affect the magnitude of charge transfer per bond, NP size is expected
to significantly impact catalytic properties because the fraction of Pt surface sites that are
68
charged is inversely proportional to NP diameter. Interestingly, it has been observed on multiple
occasions102,139,140 that reactivity scales with NP-support interfacial perimeter; however, this has
previously been attributed to explicit participation of the support in the reaction. Our results
suggest that a scaling of catalytic reactivity with the NP-support interfacial perimeter could, for
some systems, be a result of catalyst-support interactions affecting the local electronic structure
of the supported NP, without any direct participation of the support in adsorption or conversion
of reactants.
The d-band center (average energy of the d states) can be calculated from the projected
density of states (PDOS). The d-band center has been shown to correlate with the strength of
adsorbate binding on transition metals.126,127 In addition, the d-band center has been shown to
correlate with the coordination number of a metal active site, even for some unsupported
transition metal nanoparticles.12,15 These correlations provide one explanation for the observed
correlation between adsorbate binding strength and active site coordination number observed on
metals (higher coordination number corresponds to lower d-band center, and in turn, weaker
adsorbate binding). Unfortunately, the latter of these correlations, relating electronic structure to
coordination number, is not valid for Pt NPs supported on amorphous silica, as shown in
appendix Figure A3.4. Pt atoms bonded to oxygen undergo electron donation to acceptor levels
that are below the conduction band. 138 Furthermore, relaxation of NPs on the silica support
results in significant distortion of the Pt lattice, giving a distribution of metal-metal bond lengths,
even for a fixed coordination number. Two atoms having the same coordination number (defined
by a cutoff distance) can thus have very different electronic structures. As a result, the predictive
power of coordination number is expected to diminish for small NPs supported on amorphous
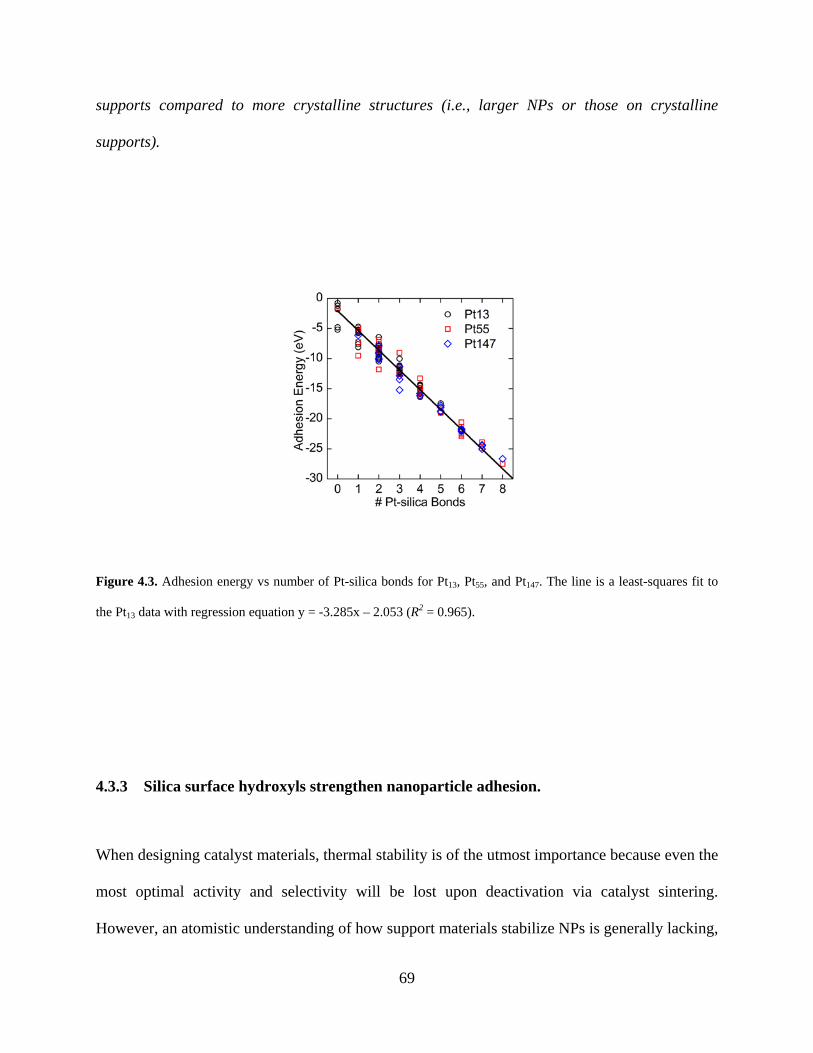
69
supports compared to more crystalline structures (i.e., larger NPs or those on crystalline
supports).
Figure 4.3. Adhesion energy vs number of Pt-silica bonds for Pt13, Pt55, and Pt147. The line is a least-squares fit to
the Pt13 data with regression equation y = -3.285x – 2.053 (R2 = 0.965).
4.3.3 Silica surface hydroxyls strengthen nanoparticle adhesion.
When designing catalyst materials, thermal stability is of the utmost importance because even the
most optimal activity and selectivity will be lost upon deactivation via catalyst sintering.
However, an atomistic understanding of how support materials stabilize NPs is generally lacking,
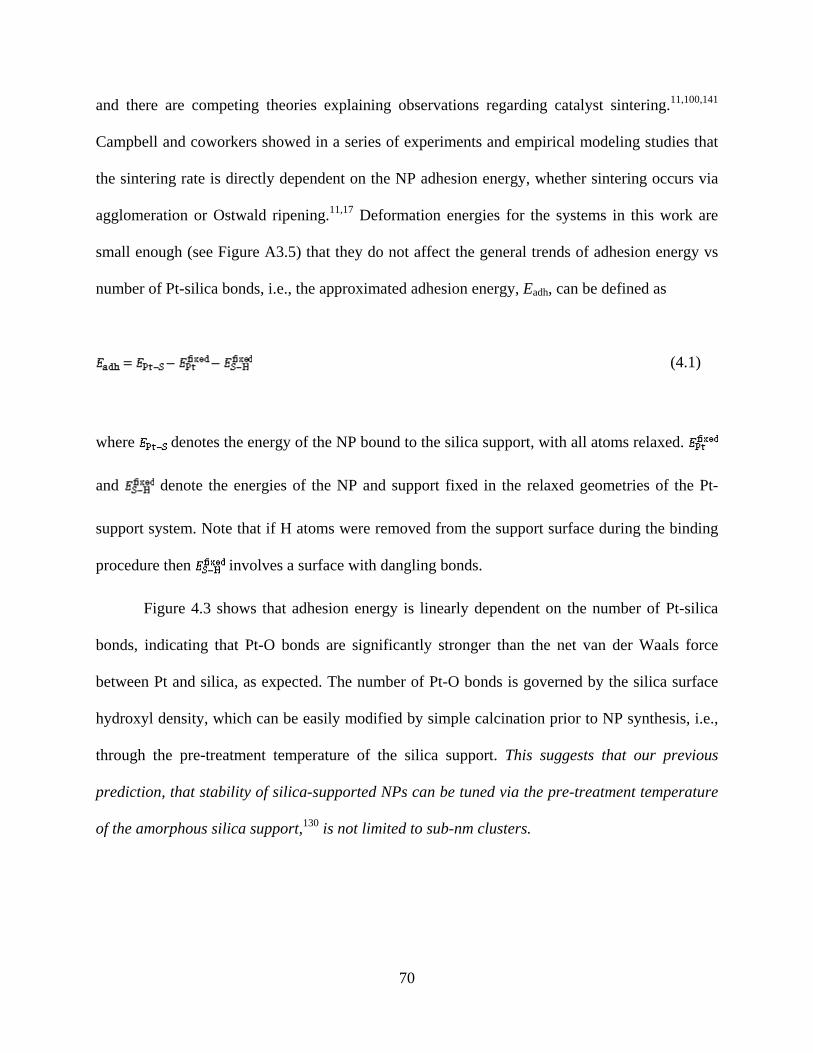
70
and there are competing theories explaining observations regarding catalyst sintering.11,100,141
Campbell and coworkers showed in a series of experiments and empirical modeling studies that
the sintering rate is directly dependent on the NP adhesion energy, whether sintering occurs via
agglomeration or Ostwald ripening.11,17 Deformation energies for the systems in this work are
small enough (see Figure A3.5) that they do not affect the general trends of adhesion energy vs
number of Pt-silica bonds, i.e., the approximated adhesion energy, Eadh, can be defined as
(4.1)
where denotes the energy of the NP bound to the silica support, with all atoms relaxed.
and denote the energies of the NP and support fixed in the relaxed geometries of the Pt-
support system. Note that if H atoms were removed from the support surface during the binding
procedure then involves a surface with dangling bonds.
Figure 4.3 shows that adhesion energy is linearly dependent on the number of Pt-silica
bonds, indicating that Pt-O bonds are significantly stronger than the net van der Waals force
between Pt and silica, as expected. The number of Pt-O bonds is governed by the silica surface
hydroxyl density, which can be easily modified by simple calcination prior to NP synthesis, i.e.,
through the pre-treatment temperature of the silica support. This suggests that our previous
prediction, that stability of silica-supported NPs can be tuned via the pre-treatment temperature
of the amorphous silica support,130 is not limited to sub-nm clusters.
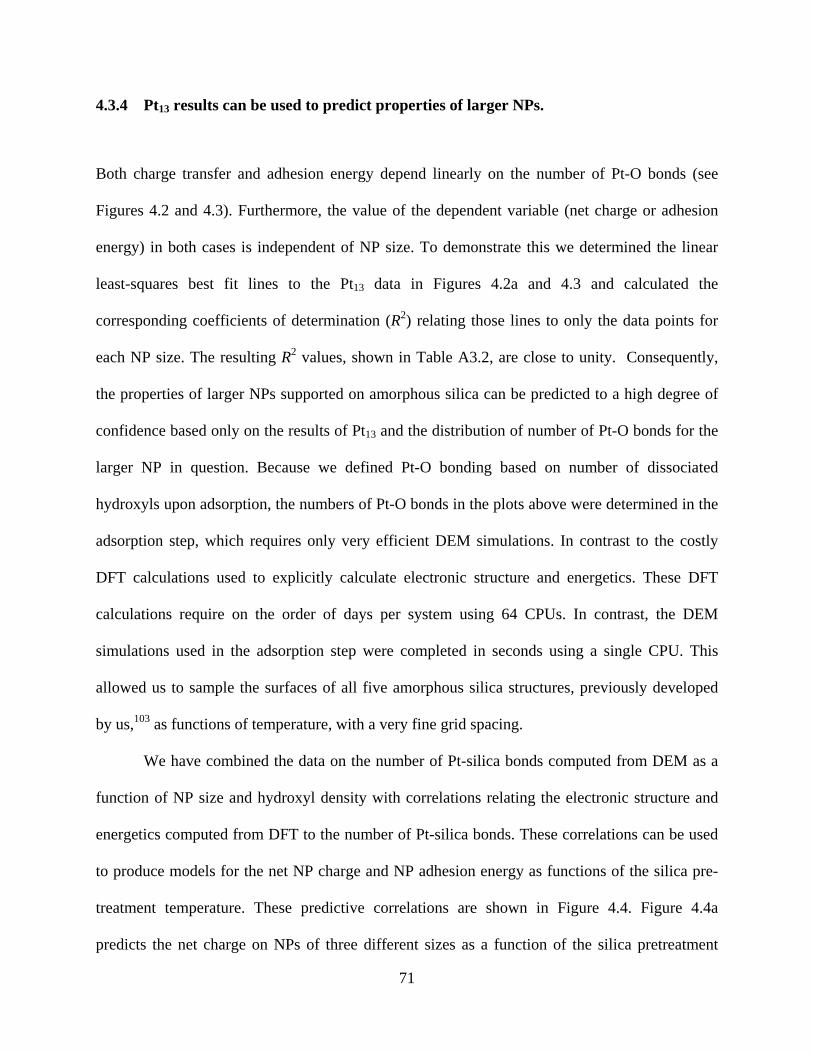
71
4.3.4 Pt13 results can be used to predict properties of larger NPs.
Both charge transfer and adhesion energy depend linearly on the number of Pt-O bonds (see
Figures 4.2 and 4.3). Furthermore, the value of the dependent variable (net charge or adhesion
energy) in both cases is independent of NP size. To demonstrate this we determined the linear
least-squares best fit lines to the Pt13 data in Figures 4.2a and 4.3 and calculated the
corresponding coefficients of determination (R2) relating those lines to only the data points for
each NP size. The resulting R2 values, shown in Table A3.2, are close to unity. Consequently,
the properties of larger NPs supported on amorphous silica can be predicted to a high degree of
confidence based only on the results of Pt13 and the distribution of number of Pt-O bonds for the
larger NP in question. Because we defined Pt-O bonding based on number of dissociated
hydroxyls upon adsorption, the numbers of Pt-O bonds in the plots above were determined in the
adsorption step, which requires only very efficient DEM simulations. In contrast to the costly
DFT calculations used to explicitly calculate electronic structure and energetics. These DFT
calculations require on the order of days per system using 64 CPUs. In contrast, the DEM
simulations used in the adsorption step were completed in seconds using a single CPU. This
allowed us to sample the surfaces of all five amorphous silica structures, previously developed
by us,103 as functions of temperature, with a very fine grid spacing.
We have combined the data on the number of Pt-silica bonds computed from DEM as a
function of NP size and hydroxyl density with correlations relating the electronic structure and
energetics computed from DFT to the number of Pt-silica bonds. These correlations can be used
to produce models for the net NP charge and NP adhesion energy as functions of the silica pre-
treatment temperature. These predictive correlations are shown in Figure 4.4. Figure 4.4a
predicts the net charge on NPs of three different sizes as a function of the silica pretreatment
72
temperature. Similarly, the adhesion energy as a function of NP size and Tpre is given in Figure
4.4b. More importantly, we can generate predictive curves like this for other NP sizes and
shapes by carrying out very simple DEM calculations; no DFT calculations are needed. We
expect these relationships to hold for much larger NPs because our PDOS calculations indicate
that Pt147 is metallic, demonstrating that the correlations apply to larger metallic NPs as well.
Figure 4.4. (a) Net charge on Pt NPs as a function of silica pre-treatment temperature. (b) Adhesion energy as a
function of silica pre-treatment temperature for Pt13, Pt55, and Pt147.
73
4.4 CONCLUSIONS
An atomistic understanding of how support materials affect the properties of catalytic
nanoparticles should provide a set of design rules that can be used as a guide for developing
novel or improved catalytic materials. Utilization of such design rules, however, also requires the
development of more efficient predictive screening methods.
We have extended our methodology for generating NP-support models to study the
effects of amorphous silica surfaces on supported Pt NPs as a function of NP size. Our results
indicate that both the net charge on the NP and the adhesion energy are linear functions of the
number of Pt-silica bonds formed during NP adsorption. Furthermore, the number of Pt-silica
bonds can be estimated from the NP geometry and the silica surface hydroxyl density. Both the
net charge and adhesion energy are important physicochemical properties, because the reactivity
for nucleophilic/electrophilic reactants can be expected to scale with charge, and adhesion
energy is directly related to NP sintering resistance.11
It has been previously noted that, for some supported NP systems, reactivity scales with
NP-support interfacial perimeter.102,139,140 Our results show that charge transfer from Pt to silica
can significantly affect the local electronic structure of Pt surface sites at the Pt-silica perimeter.
This suggests that reactivity scaling with NP-support interfacial perimeter may not be due to
participation by the support material, but can rather be a purely electronic effect resulting from
metal-support interactions.
We furthermore showed that the results obtained from DFT calculations of Pt13/SiO2 can
be used to accurately predict the DFT results of larger Pt NPs using only additional DEM
calculations, which are fast and simple to implement. This importantly circumvents the need for
computationally expensive DFT calculations and could allow for the study of larger NPs than

74
could be studied purely from DFT. In future work we will expand this approach to other NP
shapes as well as NP and support compositions.
75
5.0 PREDICTING CATALYST-SUPPORT INTERACTIONS BETWEEN METAL
NANOPARTICLES AND AMORPHOUS SILICA SUPPORTS
The content of this chapter is taken from C. S. Ewing, G. Veser, J. J. McCarthy, J. K. Johnson,
and D. S. Lambrecht, “Predicting Catalyst-Support Interactions between Metal Nanoparticles
and Amorphous Silica Supports”, in preparation.
5.1 INTRODUCTION
Control over nanoparticle (NP) catalyst-support interactions may offer a promising tool for
tuning catalytic properties; however, at present, accurate prediction of these interactions is
daunting. Furthermore, support effects are becoming increasingly important as catalytic
materials research has begun to shift towards ever more complex support materials. Yet, despite
significant progress in atomistic modeling methods, explicit inclusion of support effects remains
a challenge.7,8
Amorphous silica is a commonly used catalyst support due to its good thermal stability as
well as tunable porosity and surface area. 28,29 Additionally, the chemical and physical properties
of silica can be further controlled via doping with transition metals such as Ti, 42,142-149 making it
an attractive material for tuning catalyst-support interactions. Prediction of support effects of
76
amorphous surfaces, however, requires calculation of a broad distribution of catalyst-support
interactions because amorphous supports exhibit a range of local surface structures.
We recently developed an approach for rapid prediction of NP-support interactions
between Platinum and amorphous silica.150 We developed linear correlations for the adhesion
energy and net charge on a NP as a function of the NP size and silica support hydroxyl density
based on density functional theory (DFT) calculations for a small set of Pt NPs. We
demonstrated that these correlations are able to predict adhesion energies and charges for other
Pt NPs through the use of fast discrete element method (DEM) simulations to predict the number
of Pt-silica bonds. Here, we extend our methodology to NPs having different shapes and
compositions. Specifically, we demonstrate that (a) correlations obtained for 13 atom Pt clusters
are valid for NPs of larger sizes and different NP geometries, and (b) this approach can be
successfully applied to other catalytic metals such as Pd, Au, Ni, and Fe NPs.
5.2 METHOD
5.2.1 Model amorphous silica surfaces.
We used periodic amorphous silica surface structures constructed from a model developed by
Ewing et al.103 to investigate NP-surface interactions. These model surface structures are based
on first-principles simulations and have been found to accurately predict hydroxyl density and
distribution of hydroxyl groups as a function of temperature without any adjustable
parameters.103 Five distinct model surfaces were generated and the hydroxyl density of each
system was adjusted using an algorithm to mimic a range of silica pretreatment temperatures
77
Tpre, resulting in a total of 56 different surface structures.103 For the DFT calculations in this
work, we use two of these surface structures having high (4.5 nm-2) and low (1.6 nm-2) hydroxyl
densities, corresponding to low (200 °C) and high (570 °C) Tpre, respectively. For the discrete
element method calculations described below we use all 56 surface structures. Details of unit cell
dimensions and system sizes can be found in the Supporting Information.
5.2.2 Metal nanoparticles.
For the majority of calculations in the present study we used magic number cuboctahedral NPs
because the symmetry is independent of size. To investigate the effects of NP geometry on the
catalyst-support interactions we also used a theoretical global minimum configuration for Pt13,107
and “slab” Pt55 and Pt147 (elongated in the y dimension; 3 atomic layers thick). All NP
geometries used in this study are shown in Figure 5.1. To calculate electronic structure
correlations for NPs of different metals we used 13-atom cuboctahedral NPs of Au, Pd, Fe, and
Ni and 147-atom cuboctahedral NPs of Au and Pd.
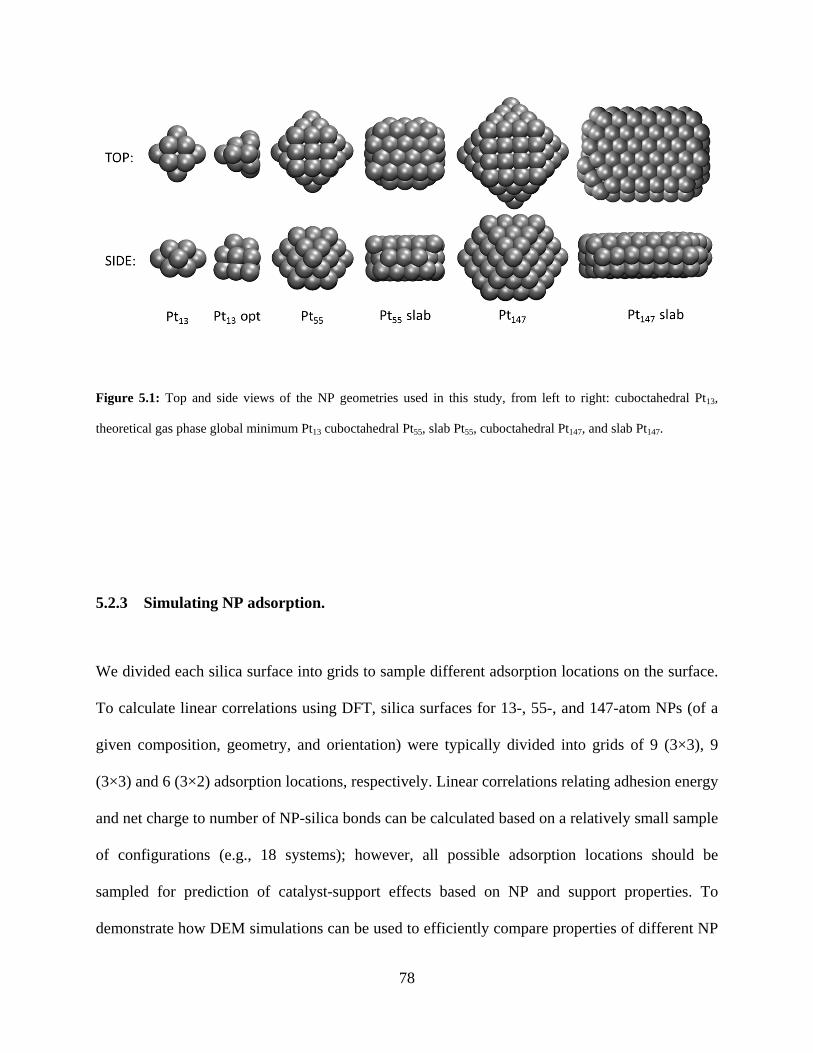
78
Figure 5.1: Top and side views of the NP geometries used in this study, from left to right: cuboctahedral Pt13,
theoretical gas phase global minimum Pt13 cuboctahedral Pt55, slab Pt55, cuboctahedral Pt147, and slab Pt147.
5.2.3 Simulating NP adsorption.
We divided each silica surface into grids to sample different adsorption locations on the surface.
To calculate linear correlations using DFT, silica surfaces for 13-, 55-, and 147-atom NPs (of a
given composition, geometry, and orientation) were typically divided into grids of 9 (3×3), 9
(3×3) and 6 (3×2) adsorption locations, respectively. Linear correlations relating adhesion energy
and net charge to number of NP-silica bonds can be calculated based on a relatively small sample
of configurations (e.g., 18 systems); however, all possible adsorption locations should be
sampled for prediction of catalyst-support effects based on NP and support properties. To
demonstrate how DEM simulations can be used to efficiently compare properties of different NP
79
sizes/geometries, we thus divided each silica surface into grids of 80 (10×8) adsorption locations.
Specific details about the division of cells into grid points are provided in the Supporting
Information.
We simulated the adsorption of NPs onto the silica surface using discrete element
method110 (DEM) simulations followed by DFT calculations, as described in detail previously.130
The DEM simulations were used to generate reasonable initial structures for the placement of
NPs on the silica surface and to compute an estimate for the number of metal-silica bonds. For
the purpose of our study, the forces in DEM were limited to only gravity, hard-sphere
interactions, 115 and tangential friction, where rebounding of particles (atoms) is completely
avoided by tuning the viscoelasticity of the particles in the simulations. It is known
experimentally that metal (M) NPs supported on silica form bonds between the metal and silica
surface through Si-O-M linkages. .100,119,134 We model M-O bond formation by creating bonds
between the NP and any surface hydroxyls that are in contact with metal atoms in the NP by
removing the H atom from those hydroxyl groups and reducing the hard-sphere interactions
between the interacting M and O atoms to their covalent rather than van der Waals (vdW) radii.
The DEM-initialized geometries were fully relaxed to their local minima using DFT for a select
group of systems. In addition, many other NP structures were generated on each of the 56 silica
surface structures using DEM in order to more fully explore the number of metal-silica bonds as
a function of NP size and geometry (see below).
5.2.4 Density functional theory calculations.
All DFT calculations performed in this work used the CP2K code, which employs a Quickstep78
implementation of the DFT method using a combination of plane waves and pseudopotentials
80
with localized gaussian basis sets (see Supporting Information for details). We used the revised
PBE functional (revPBE)104 and GTH pseudopotentials81,82 in conjunction with short range
double-ζ basis sets with polarization functions (SR-DZVP)105 in our calculations. vdW
interactions were included using the DFT-D3 method.151 All surface slabs were relaxed using
CP2K with supercells that were periodic in all directions with at least 20 Å of vacuum between
periodic images in the z dimension to mitigate interactions between the periodic images of the
surface slabs. The plane wave energy cutoff, basis sets, vacuum spacing and spin-restricted
relaxation for these systems have been validated for these systems previously.130
5.2.5 Calculating nanoparticle properties.
NP adhesion energy and net charge are primary components of this study. We approximate the
adhesion energy as the instantaneous pull-off energy of the NP from the support. Deformation
energies for these systems have been shown to be small enough that they do not affect the
general trends of adhesion energy vs number of Pt-silica bonds. We therefore calculated
adhesion energy, Eadh, as follows
(1)
where denotes the energy of the NP bound to the silica support, with all atoms relaxed.
and denote the energies of the (separated) NP and support fixed in the relaxed geometries of
the Pt-support system. Note that if H atoms were removed from the support surface during the
binding procedure then involves a surface with dangling bonds. Atomic partial charges
81
were calculated using Bader charge analysis on valence electron density cube files generated
using CP2K. 135,136 Net NP charge is simply the sum of NP atom partial charges.
5.3 RESULTS AND DISCUSSION
5.3.1 Adhesion energy and charge predicted from hydroxyl density and NP size/geometry.
In previous work we developed linear correlations relating both adhesion energy and net NP
charge to the number of Pt-silica bonds for cuboctahedral Pt13 clusters. We furthermore showed
that the correlations calculated from Pt13 data accurately predict the adhesion energies and NP
charges for cuboctahedral Pt clusters containing 55 and 147 atoms.150
In the present work we have computed adhesion energies and NP charges for Pt13 clusters
initially having the gas phase ground state structure107 and for Pt55 and Pt147 clusters having a
slab geometry. Figure 2b shows that the linear correlation of net charge vs number of Pt-O bonds
calculated for cuboctahedral Pt13 accurately predicts the net charge of other 13-, 55-, and 147-
atom Pt NPs, regardless of NP geometry. To quantify this result, we calculated coefficients of
determination (R2) relating the data points of each NP size and geometry to the linear least-
squares best fit lines of the cuboctahedral Pt13 charge data. The resulting R2 values (shown in
Supporting Information Table S1) are all close to unity, indicating that our approach can be
successfully applied to the calculation of net charge transfer using correlations from Pt13 data to
other Pt NPs, regardless of NP size or geometry. Unfortunately, extrapolation of the adhesion
energy correlation is not as straightforward.

82
A plot of adhesion energy vs number of Pt-O bonds (see Figure A4.1) shows that the
adhesion energies of Pt147 slab geometry deviate significantly from the line fit to Pt13 adhesion
energies. Results of DFT-D3 calculations using CP2K report vdW energies explicitly, which we
used to calculated the contribution of vdW energy to the adhesion energy as
(2)
The significant deviation of Pt147 slab adhesion energies from the linear correlation
calculated for cuboctahedral Pt13 is due to substantially larger vdW adhesion energies for Pt147
slab (5.6 eV) than Pt13 (-1.4 eV). Contributions to adhesion energy from vdW forces is dependent
on the Pt-silica interfacial area rather than the number of bonds. As a result, differences in vdW
adhesion energy correspond to a shift in the y-intercept, and not the slope, of the adhesion energy
plotted against number of Pt-O bonds. The vdW adhesion energies of cuboctahedral Pt13 and
Pt147 differ by only 1.5 eV, which is approximately half the energy of a Pt-O bond, and less than
the standard deviation of the adhesion energy vs number of Pt-O bonds (Figure 5.2a). The
correlation relating adhesion energy and number of Pt-O bonds is thus only universal for NP
geometries with similar values of . In order to predict adhesion energies based on the
correlations calculated for cuboctahedral Pt13, we calculate adhesion energy as:
(3)
Figure 5.2a shows the Pt-silica adhesion energies after subtracting out vdW adhesion
energies. Figure 5.2a shows that the non-vdW adhesion energy as a function of the number of Pt-
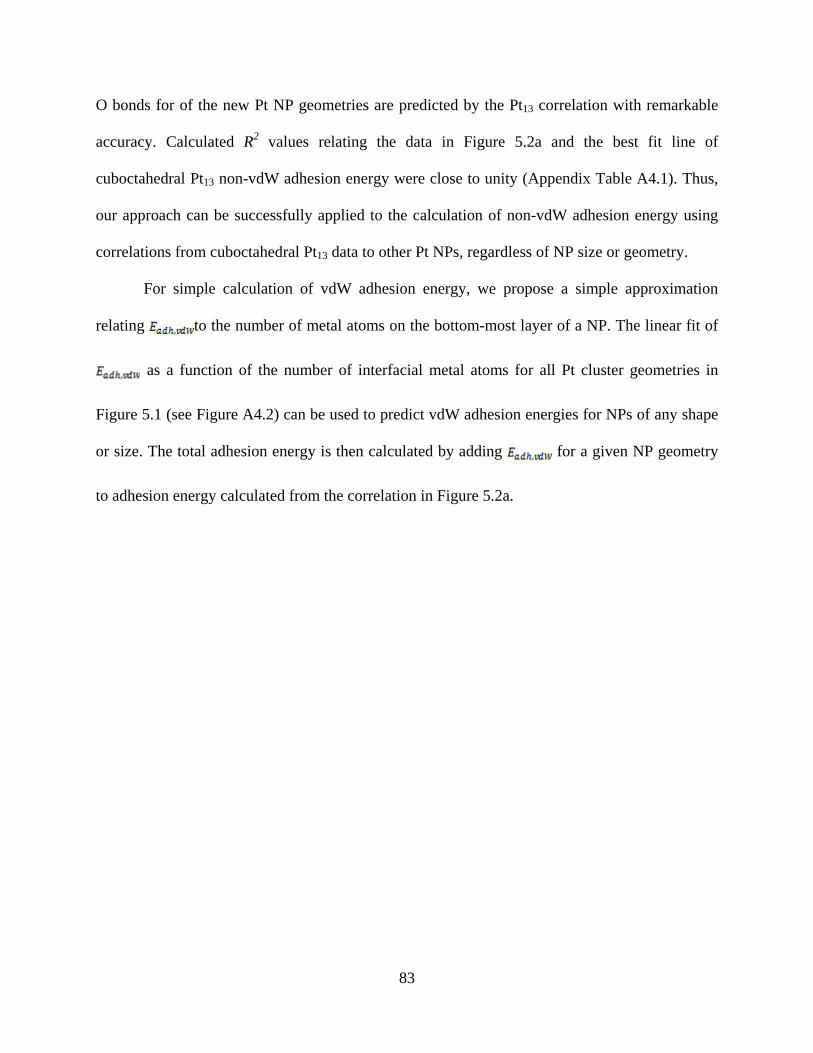
83
O bonds for of the new Pt NP geometries are predicted by the Pt13 correlation with remarkable
accuracy. Calculated R2 values relating the data in Figure 5.2a and the best fit line of
cuboctahedral Pt13 non-vdW adhesion energy were close to unity (Appendix Table A4.1). Thus,
our approach can be successfully applied to the calculation of non-vdW adhesion energy using
correlations from cuboctahedral Pt13 data to other Pt NPs, regardless of NP size or geometry.
For simple calculation of vdW adhesion energy, we propose a simple approximation
relating to the number of metal atoms on the bottom-most layer of a NP. The linear fit of
as a function of the number of interfacial metal atoms for all Pt cluster geometries in
Figure 5.1 (see Figure A4.2) can be used to predict vdW adhesion energies for NPs of any shape
or size. The total adhesion energy is then calculated by adding for a given NP geometry
to adhesion energy calculated from the correlation in Figure 5.2a.
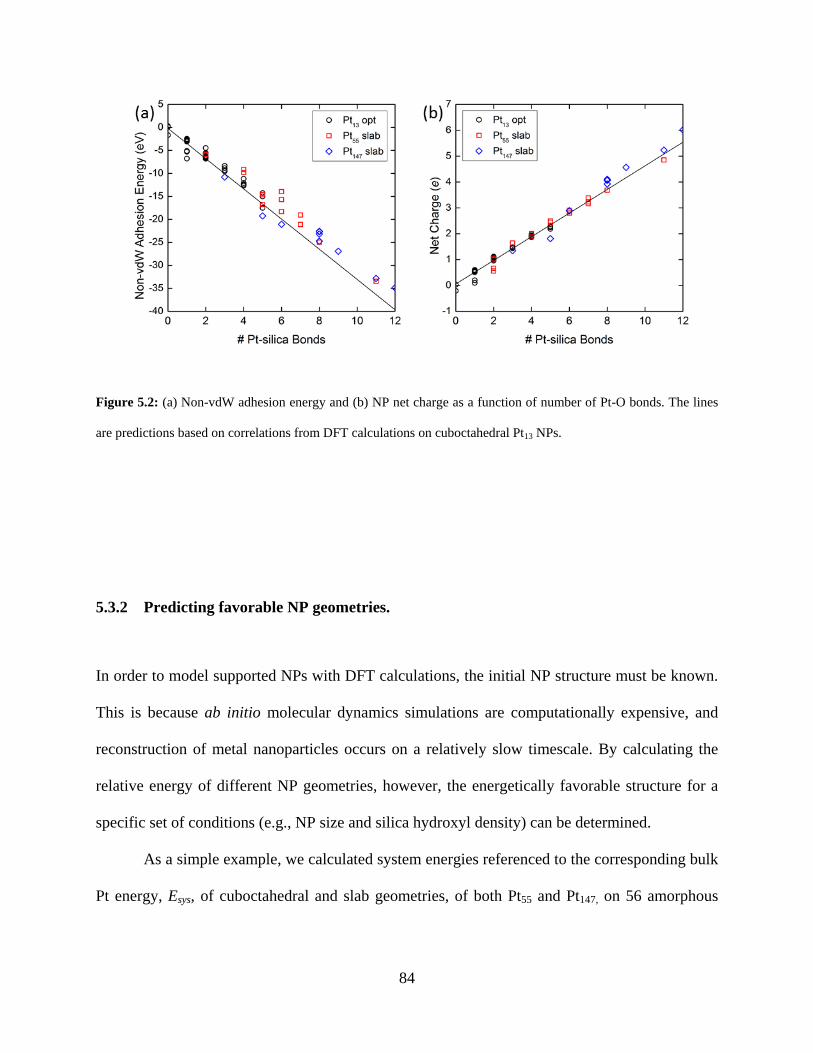
84
Figure 5.2: (a) Non-vdW adhesion energy and (b) NP net charge as a function of number of Pt-O bonds. The lines
are predictions based on correlations from DFT calculations on cuboctahedral Pt13 NPs.
5.3.2 Predicting favorable NP geometries.
In order to model supported NPs with DFT calculations, the initial NP structure must be known.
This is because ab initio molecular dynamics simulations are computationally expensive, and
reconstruction of metal nanoparticles occurs on a relatively slow timescale. By calculating the
relative energy of different NP geometries, however, the energetically favorable structure for a
specific set of conditions (e.g., NP size and silica hydroxyl density) can be determined.
As a simple example, we calculated system energies referenced to the corresponding bulk
Pt energy, Esys, of cuboctahedral and slab geometries, of both Pt55 and Pt147, on 56 amorphous

85
silica surfaces representing a range of pretreatment temperatures (Figure 5.2). Here Esys is
defined as
(4)
where Eadh is adhesion energy (including vdW adhesion energy), ENP is total energy of the
unsupported NP, n is the number of atoms in the NP and Ebulk is the energy of a single metal
atom in the bulk phase. We exclude the deformation energies of both Pt and silica because they
were shown to be small compared to Eadh.152 The third term on the right hand side of eq 2 (Ebulk)
is a constant. Hence, the relative energy is a balance between the energy of the NP geometry and
adhesion energy.
86
Figure 5.3. Nanoparticle energy plus adhesion energy normalized by corresponding bulk energy for cubeoctahedral
vs slab (a) Pt55 and (b) Pt147. Adhesion energy for cubeoctahedral vs slab (a) Pt55 and (b) Pt147.
87
Figure 5.3a shows that, for Pt55, the slab geometry is energetically preferred over
cuboctahedral, regardless of silica pretreatment temperature. The total energy of unsupported
slab Pt55 is 1.7 eV higher than cuboctahedral Pt55, which is about the same magnitude as half of a
Pt-O bond. However, slab Pt55 averages between 1.3 and 4.3 more Pt-O bonds over the entire
range of silica surfaces than cuboctahedral P55, so that the difference in adhesion energy is
significantly greater than the difference between NP energies. Figure 5.3b shows that although
the slab geometry of Pt147 results in significantly more bonds, the two geometries have very
similar normal energies because ENP for cuboctahedral Pt147 is 15.5 eV lower in energy than slab
Pt147. Note that all NP energies are positive, indicating that the bulk metal is still
thermodynamically favorable to the supported nanoparticle despite strong NP-support adhesion.
Although we are not able to calculate energy barriers for NP reconstruction using this
approach, we can gain important insight from the values of Enorm. In the above example, we can
expect Pt55 to flatten to a 3-layer NP due to Pt-silica interactions, although we cannot determine
at what temperature this will occur. Furthermore, Pt147 is only energetically favorable in a slab
geometry over a cuboctahedral geometry on low Tpre silica. We therefore predict that if Pt147 is
synthesized as cuboctahedral NPs, they will likely not wet amorphous silica supports. While slab
Pt147 becomes energetically comparable to cuboctahdral Pt147 at low Tpre, the higher temperatures
required to facilitate the cuboctahdral-to-slab NP reconstruction would result in higher Tpre
values, and hence, prefer more compact, bulk-like NPs over a spread-out slab-like NP.
Calculation of the normal energies discussed above can be used to determine
thermodynamically favored NP geometries; however, sintering by agglomeration is governed by
the rate of NP diffusion, and hence NP adhesion energy.11 Figures 5.3c and 5.3d show that both
Pt55 and Pt147 are more stable against agglomeration ins the slab geometry than cuboctahedral,
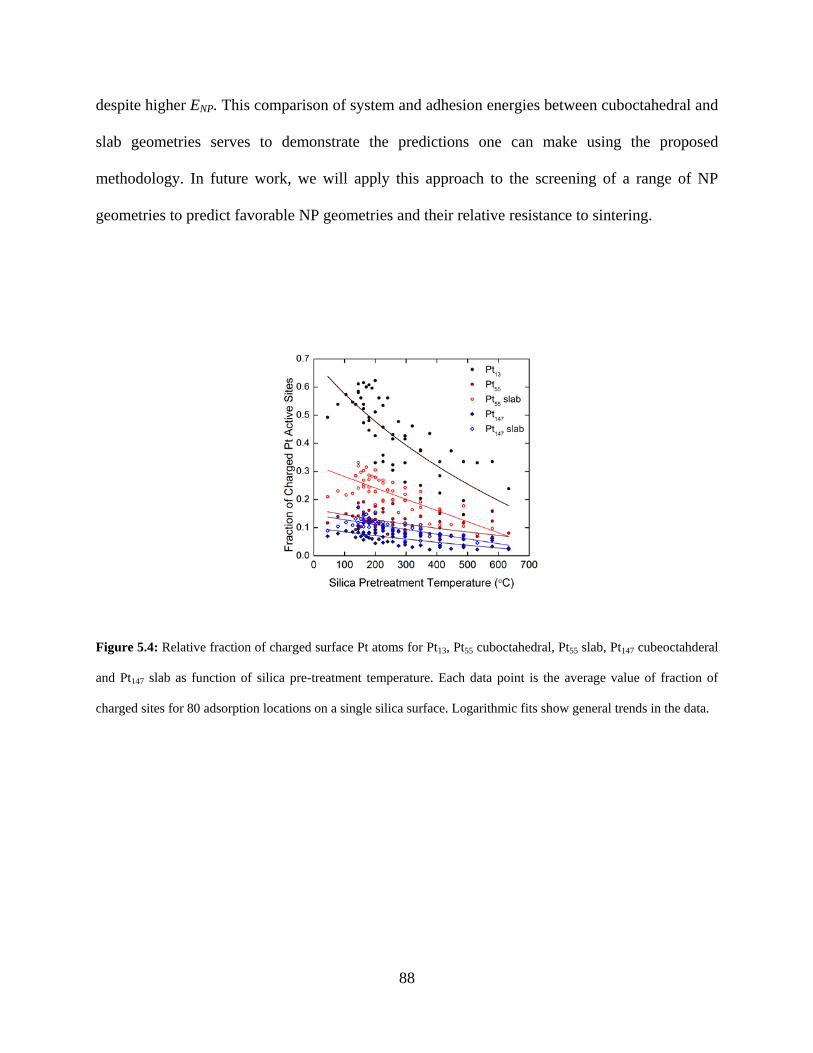
88
despite higher ENP. This comparison of system and adhesion energies between cuboctahedral and
slab geometries serves to demonstrate the predictions one can make using the proposed
methodology. In future work, we will apply this approach to the screening of a range of NP
geometries to predict favorable NP geometries and their relative resistance to sintering.
Figure 5.4: Relative fraction of charged surface Pt atoms for Pt13, Pt55 cuboctahedral, Pt55 slab, Pt147 cubeoctahderal
and Pt147 slab as function of silica pre-treatment temperature. Each data point is the average value of fraction of
charged sites for 80 adsorption locations on a single silica surface. Logarithmic fits show general trends in the data.
89
5.3.3 Predicting effects of NP-support charge transfer.
With knowledge of reactant adsorption strength as a function of transition metal site partial
charge, the same general approach can be used to predict the effects of Pt-silica charge transfer
on catalytic reactions. For example, weaker CO adsorption is expected to result in increased
reactivity for CO oxidation over Pt.12 We recently showed that Pt-O bonds result in ~0.5 e charge
transfer from metal to silica, resulting in a positive partial charge on the O-bonded Pt atom. The
rate increase of CO oxidation over Pt due to charge transfer should hence be proportional to the
fraction of active sites that are bonded to the silica support, which depends on (a) the silica
hydroxyl density and (b) the circumference of the NP-support interface. The silica hydroxyl
density dictates what fraction of Pt atoms is bonded to silica at the NP-support interface, and the
circumference of interfacial contact is proportional to the number of atoms that can be bonded to
silica and accessible by gas molecules.
Figure 5.4 shows the fraction of active sites that are positively charged due to Pt-O bond
formation for Pt13 and both cuboctahedral and slab geometries of Pt55 and Pt147. Pt13 relaxes
significantly on amorphous silica supports exposing almost all atoms to gas phase reactants.152
As a result, a large fraction of Pt atoms are positively charged (over half on low Tpre silica)..
These results suggest that the optimization of Pt/SiO2 catalyst for CO oxidation is achieved by
minimizing NP size and maximizing silica hydroxyl density.
5.3.4 Linear correlations apply to other metals.
To test the transferability of our approach, we relaxed 13-atom Au, Pd, Ni, and Fe clusters, as
well as 147-atom Au and Pd, supported on amorphous silica. Figure 5.5 shows that as with Pt,
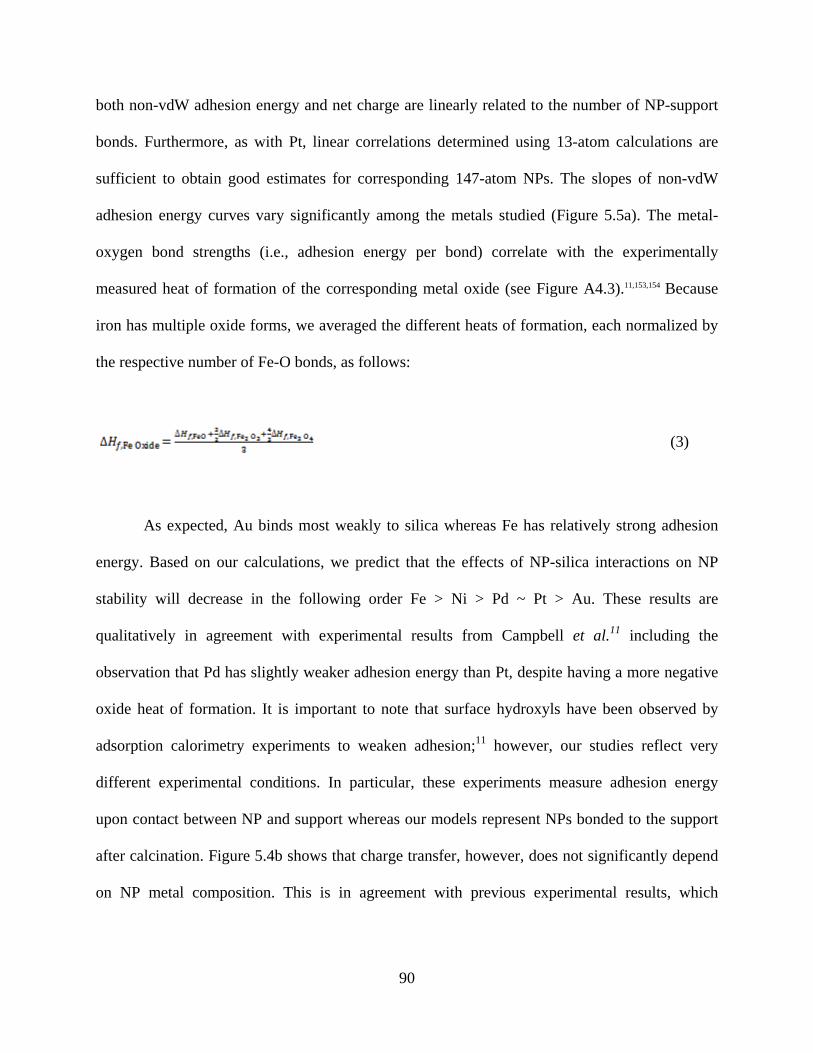
90
both non-vdW adhesion energy and net charge are linearly related to the number of NP-support
bonds. Furthermore, as with Pt, linear correlations determined using 13-atom calculations are
sufficient to obtain good estimates for corresponding 147-atom NPs. The slopes of non-vdW
adhesion energy curves vary significantly among the metals studied (Figure 5.5a). The metal-
oxygen bond strengths (i.e., adhesion energy per bond) correlate with the experimentally
measured heat of formation of the corresponding metal oxide (see Figure A4.3).11,153,154 Because
iron has multiple oxide forms, we averaged the different heats of formation, each normalized by
the respective number of Fe-O bonds, as follows:
(3)
As expected, Au binds most weakly to silica whereas Fe has relatively strong adhesion
energy. Based on our calculations, we predict that the effects of NP-silica interactions on NP
stability will decrease in the following order Fe > Ni > Pd ~ Pt > Au. These results are
qualitatively in agreement with experimental results from Campbell et al.11 including the
observation that Pd has slightly weaker adhesion energy than Pt, despite having a more negative
oxide heat of formation. It is important to note that surface hydroxyls have been observed by
adsorption calorimetry experiments to weaken adhesion;11 however, our studies reflect very
different experimental conditions. In particular, these experiments measure adhesion energy
upon contact between NP and support whereas our models represent NPs bonded to the support
after calcination. Figure 5.4b shows that charge transfer, however, does not significantly depend
on NP metal composition. This is in agreement with previous experimental results, which
91
showed that metal nanoparticles on amorphous silica supports donate approximately 0.5 eV per
bond.138,155
Ni13 and Fe13 have continuous band structures around the Fermi level, (see Supporting
Information Figure A4.4) and hence their electronic properties – including metal-oxygen bond
strength and charge transfer – are expected to be the same (per bond) as NP size is increased. Pd
has slight discontinuity at the Fermi level, and that of Au13 is even more pronounced. We thus
tested the effects of NP size on adhesion and charge correlations by generating 12 systems each
of silica-supported Pd147 and Au147. As with Pt NPs of different geometries, we tested the
predictive power of Au13 and Pd13 by calculating coefficients of determination (R2) for
comparing linear least-squares best fits of adhesion energy and net charge for Au13 and Pd13 to
data points from Au147 and Pd147, respectively. Table S2 shows that despite the small number of
147-atom systems relaxed, the R2 values are all close to unity. Finally, parameters for the
correlations relating adhesion energy and net charge to number of bonds for Pt, Pd, Au, Ni, and
Fe are shown in Table S3 and S4, respectively.
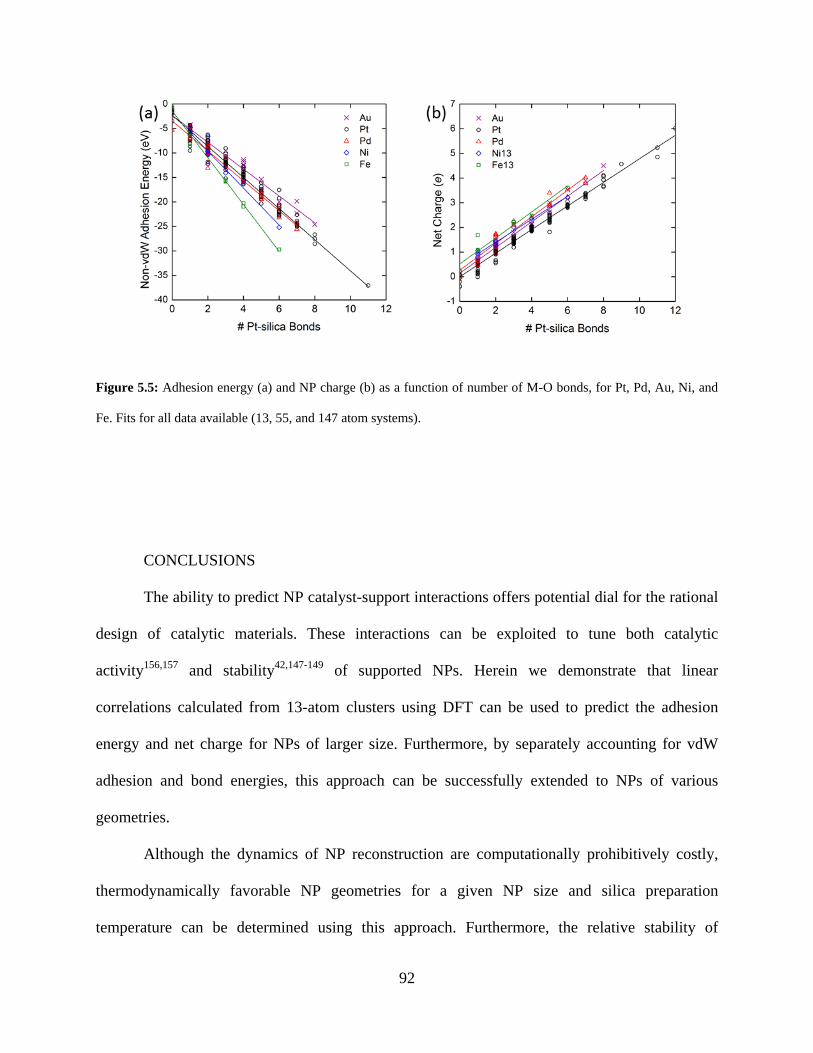
92
Figure 5.5: Adhesion energy (a) and NP charge (b) as a function of number of M-O bonds, for Pt, Pd, Au, Ni, and
Fe. Fits for all data available (13, 55, and 147 atom systems).
CONCLUSIONS
The ability to predict NP catalyst-support interactions offers potential dial for the rational
design of catalytic materials. These interactions can be exploited to tune both catalytic
activity156,157 and stability42,147-149 of supported NPs. Herein we demonstrate that linear
correlations calculated from 13-atom clusters using DFT can be used to predict the adhesion
energy and net charge for NPs of larger size. Furthermore, by separately accounting for vdW
adhesion and bond energies, this approach can be successfully extended to NPs of various
geometries.
Although the dynamics of NP reconstruction are computationally prohibitively costly,
thermodynamically favorable NP geometries for a given NP size and silica preparation
temperature can be determined using this approach. Furthermore, the relative stability of
93
different NP sizes/geometries can be estimated by screening with fast DEM simulations.
Additionally, we show how this approach can be used to predict the effects of support
interactions on electronic properties of supported NPs, and hence catalytic activity. Finally, we
have demonstrated that, this methodology is transferrable to metals other than Pt, and we provide
linear correlations relating adhesion energy and NP net charge to number of M-O bonds, for Au,
Fe, Ni, and Pd.
94
6.0 IMPACT OF SUPPORT INTERACTIONS FOR SINGLE-SITE MOLYBDENUM
CATALYSTS ON AMORPHOUS SILICA
The content of this chapter is taken from C. S. Ewing, E. G. Patriarca, A. B. Bagusetty, G. Veser,
J. J. McCarthy, and J. K. Johnson, “Impact of Support Interactions for Single-Site Molybdenum
Catalysts on Amorphous Silica”, in preparation.
6.1 INTRODUCTION
Catalyst materials consisting of isolated metal centers dispersed on amorphous surfaces (silica
and silica-alumina) are promising for a number of hydrocarbon reactions.131,158 Such isolated
metal center catalysts include: Mo(VI), W(VI), and Re(VII) supported on any of a number of
oxides for olefin metathesis, Cr(VI) for olefin epoxidation, and oxide-supported V(V) for partial
oxidation of methanol. Although many of these catalysts have been studied for decades,131,158-166
the combination of amorphous support structure and single metal atom catalytic site has severely
limited the information attainable via experiments.30-33 Furthermore, first principles calculations
of catalyst materials with amorphous surfaces have been prohibitively difficult,131,158 until
recently.103,152 A better understanding of these catalyst materials will allow for catalyst
optimization and may provide valuable insight for the development of similar catalyst materials
for other reactions.
95
Primary challenges of modeling single atom catalysts on amorphous supports center on
the difficulty of obtaining an accurate atomically resolved description of the active site.
Unfortunately, isolated metal centers on amorphous supports cannot be accurately described
using a single atomistic model structure. The local atomic structure varies significantly across
amorphous silica surfaces.103 As a result, individual single-atom sites on amorphous silica can
differ dramatically in electronic structure, and hence stability and reactivity. It is therefore
important for models of such systems to accurately capture the entire distribution of active sites
because the reactivity of single-atom catalysts is likely dominated by few sites.131,167
Despite their shortcomings, ab initio models based on cluster models have allowed for
tremendous advances in our understanding of isolated metal center catalysts.31,131,159-161,167,168
Recently, Goldsmith et al. developed a novel approach for modeling isolated metal sites on
amorphous supports, which accounts for surface structure heterogeneities.131 This complex
algorithm was used to calculate the low energy Mo/SiO2 cluster model structure for a given
ethene metathesis activation energy. Using this approach Goldsmith et al. calculated the average
reactivity, based on a Boltzmann distribution of sites, and revealed clear correlations relating
both reaction energy and Si-Si distance to ethene metathesis activation energy. Due to the size of
the cluster model used, however, this method neglects the effects of local structure beyond the
anchoring Si atoms on site energetics.
In this work we studied isolated Mo centers for ethene metathesis on recently developed
realistic amorphous silica support structures using density functional theory (DFT) calculations.
First, a method for rapid generation of Mo sites on model amorphous surface structures, based on
constrained cluster model calculations, was developed. We then examined the effects of support
structure on Mo site energy and reaction energy. Our results indicate that while many
96
correlations can be identified for the cluster model, explicit inclusion of the support material
reveals a very complex structure-energy relationship. In particular, we show that both site and
reaction energies depend more strongly on the O-Mo-O bond angle than Si-Si distance. In
general, the complex interplay between site energy and surface structure is a result of the wide
variation of hydrogen bonding, silanol types, bond lengths, and bond angles, many of which
cannot be captured without explicit treatment of the surface.
6.2 METHOD
6.2.1 Model amorphous silica surfaces.
We used periodic amorphous silica surface structures constructed from a model developed by
us103 to study single atom Mo/SiO2 catalysts. These model surface structures are based on first-
principles simulations and have been found to accurately predict hydroxyl density and
distribution of hydroxyl groups as a function of temperature without any adjustable
parameters.103 Five distinct model surfaces were generated and the hydroxyl density of each
system was adjusted using an algorithm to mimic a range of silica pretreatment temperatures
Tpre. The surface structures are 23.7 Å × 18.3 Å × ~12 Å comprising between 250 and 270 atoms.
In this work, we use three different silica surface structures from each of the five distinct model
surfaces, corresponding to Tpre values of 210, 340, and 540 °C and a total of 15 silica surfaces.
Details of unit cell dimensions and system sizes can be found in the Supporting Information.
97
6.2.2 Generating isolated metal center sites.
In a recent theoretical study, it was determined that MoO2 sites on amorphous silica are almost
exlusively anchored to two silanol groups.168 In order to obtain a distribution of surface sites, we
first determined which silanols were within range to form a Si-O-Mo-O-Si structure. Based on
the results of preliminary studies, we considered silanol pairs with Si-Si and O-O distances of
less than 6.8 and 4.5 Å, respectively. We found that distances larger than these resulted in very
high energies and/or unrealistic ending structures. A Mo site was generated at every silanol pair,
based on the previously defined Si-Si and O-O cutoff distances. The details of site generation are
explained in detail in the Results and Discussion.
6.2.3 Density functional theory calculations.
All atomistic calculations performed in this work used the CP2K code, which employs a
Quickstep78 implementation of the DFT method using plane waves/pseudopotentials and
localized gaussian basis sets. Calculations used the PBE functional80 and GTH
pseudopotentials81,82 in conjunction with short range double-ζ basis sets with polarization
functions (SR-DZVP).105 Van der Waals interactions were described using the DFT-D2
method,169 which has been shown to accurately describe MoO2.170 All surface slabs were relaxed
using CP2K treated as periodic in all directions with at least 20 Å of vacuum between periodic
images in the z dimension to eliminate interactions between the periodic images of the surface
slabs. The vacuum spacing for the silica surfaces has been validated previously.130 Validation of
the plane wave energy cutoff, plane wave energy relative cutoff, and basis sets can be found in
the Supporting Information. (Figures A5.1, A5.2, and A5.3, respectively.)
98
6.3 RESULTS AND DISCUSSION
6.3.1 Generating low-energy isolated metal center sites.
To sample a wide distribution of surface sites, it is necessary to generate Mo sites at a large
number of surface locations. The use of annealing for the generation of each surface site is
therefore not practical. We hence limited our utilization of DFT in generating Mo sites to local
relaxation. It is extremely important that the initial geometry for local relaxation is sufficiently
accurate so that the system is not optimized to an incorrect local energy minimum. Generating
the correct initial conditions for amorphous structures is particularly non-trivial because the
energy landscape is disordered and hence often difficult to predict.
We developed a transferable method for generating low-energy Mo/SiO2 sites,
representing an intermediate structure in ethene metathesis, based on atom positions taken from
cluster models. First, we generated two Mo/SiO2 cluster models, shown in Figure 6.1: a six-
membered Mo/SiO2 cluster, denoted as bridged, and a minimal Mo/SiO2 cluster model,131
denoted as non-bridged. These two structures were chosen to represent Mo sites anchored to
silanol groups that are directly connected via a siloxane bridge (bridged) and those that are not
(non-bridged). Both cluster models are terminated with basis set deficient fluorine atoms, which
mimic the size and electronegativity of oxygen atoms in an extended silica network.131,158 Hence
forth we will denote the Si atoms and their nearest neighbors as “anchoring” atoms and the
remaining Mo site atoms as “moiety” atoms (shown explicitly, for cluster models, in Figure 6.1).
To sample a distribution of potential Mo sites, we mapped atom coordinates for cluster
models having a range of Si-Si distances, obtained via optimization with fixed Si-Si positions.
This procedure resulted in cluster models representative of a wide range of surface site
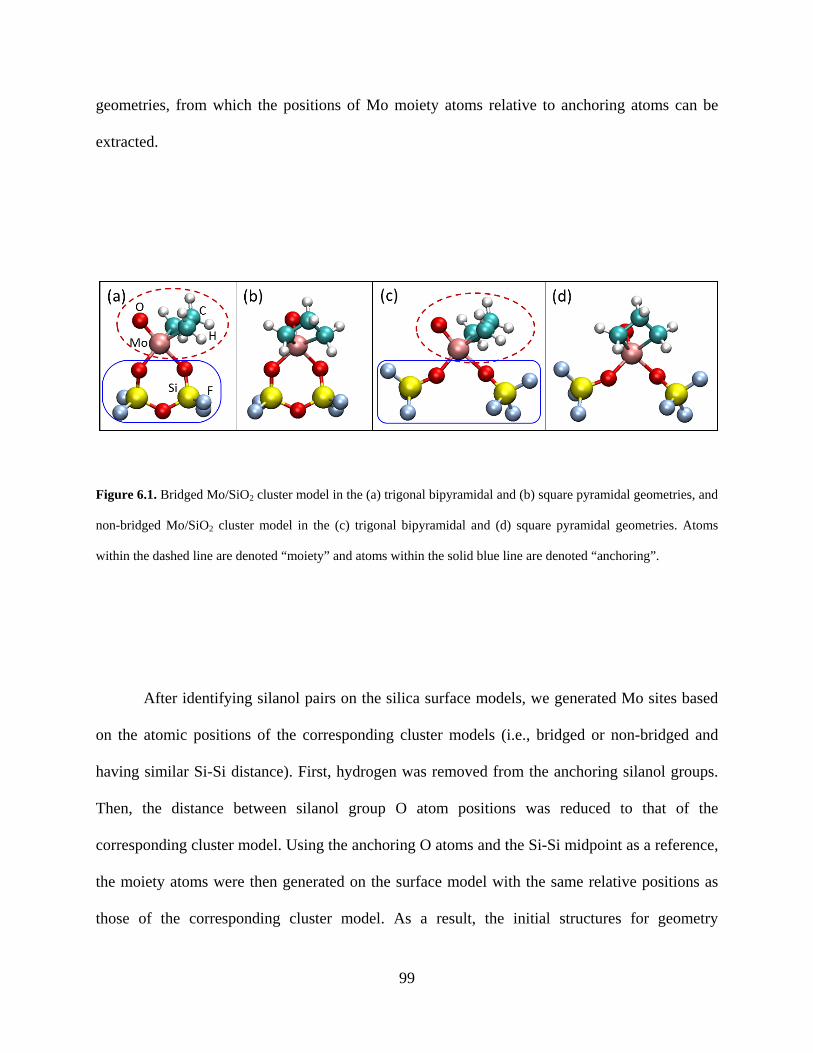
99
geometries, from which the positions of Mo moiety atoms relative to anchoring atoms can be
extracted.
Figure 6.1. Bridged Mo/SiO2 cluster model in the (a) trigonal bipyramidal and (b) square pyramidal geometries, and
non-bridged Mo/SiO2 cluster model in the (c) trigonal bipyramidal and (d) square pyramidal geometries. Atoms
within the dashed line are denoted “moiety” and atoms within the solid blue line are denoted “anchoring”.
After identifying silanol pairs on the silica surface models, we generated Mo sites based
on the atomic positions of the corresponding cluster models (i.e., bridged or non-bridged and
having similar Si-Si distance). First, hydrogen was removed from the anchoring silanol groups.
Then, the distance between silanol group O atom positions was reduced to that of the
corresponding cluster model. Using the anchoring O atoms and the Si-Si midpoint as a reference,
the moiety atoms were then generated on the surface model with the same relative positions as
those of the corresponding cluster model. As a result, the initial structures for geometry
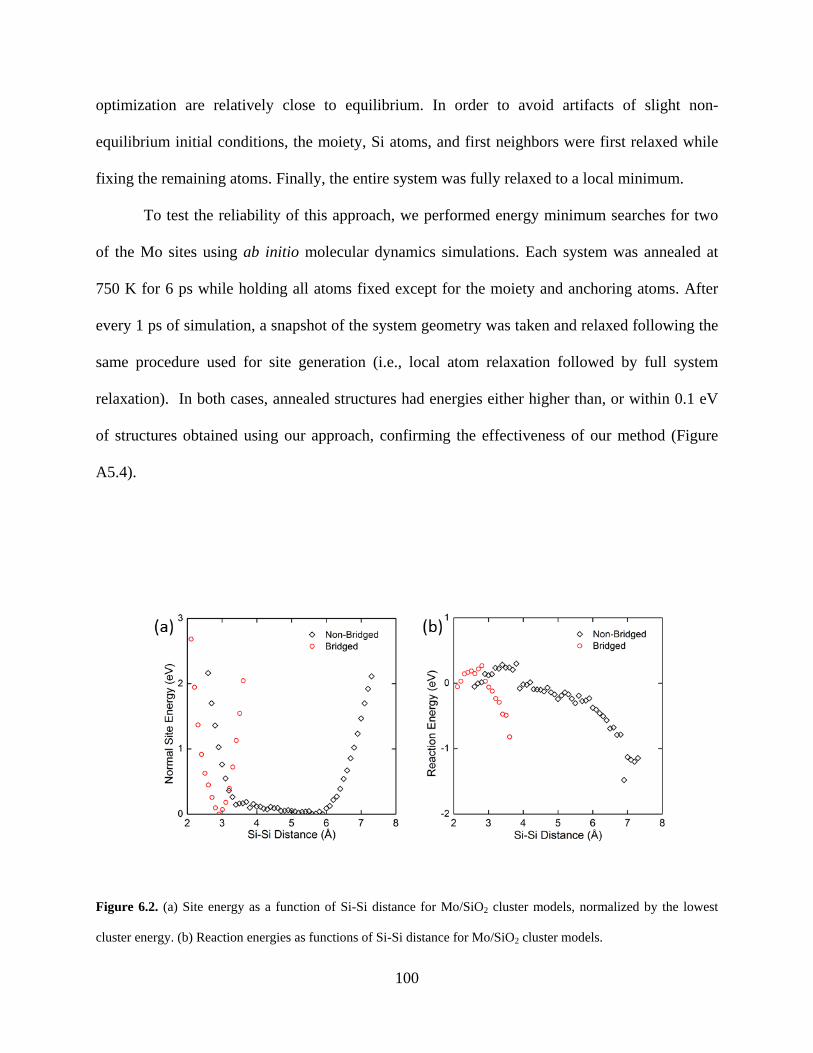
100
optimization are relatively close to equilibrium. In order to avoid artifacts of slight non-
equilibrium initial conditions, the moiety, Si atoms, and first neighbors were first relaxed while
fixing the remaining atoms. Finally, the entire system was fully relaxed to a local minimum.
To test the reliability of this approach, we performed energy minimum searches for two
of the Mo sites using ab initio molecular dynamics simulations. Each system was annealed at
750 K for 6 ps while holding all atoms fixed except for the moiety and anchoring atoms. After
every 1 ps of simulation, a snapshot of the system geometry was taken and relaxed following the
same procedure used for site generation (i.e., local atom relaxation followed by full system
relaxation). In both cases, annealed structures had energies either higher than, or within 0.1 eV
of structures obtained using our approach, confirming the effectiveness of our method (Figure
A5.4).
Figure 6.2. (a) Site energy as a function of Si-Si distance for Mo/SiO2 cluster models, normalized by the lowest
cluster energy. (b) Reaction energies as functions of Si-Si distance for Mo/SiO2 cluster models.
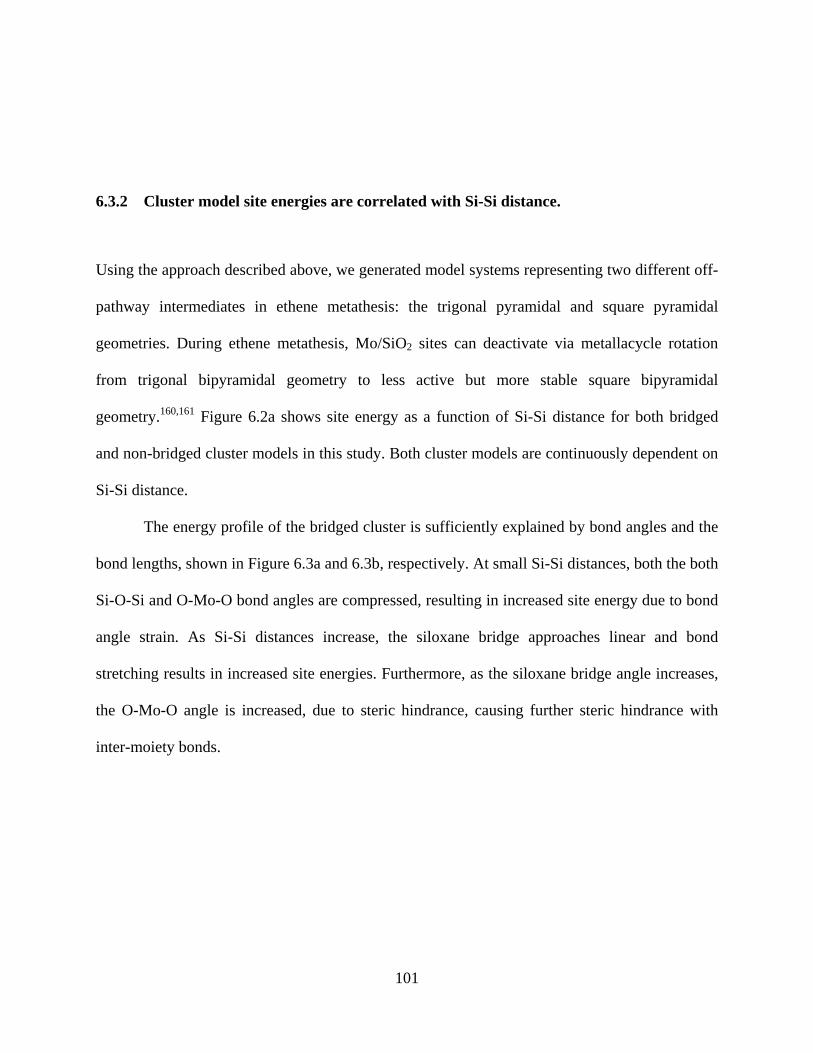
101
6.3.2 Cluster model site energies are correlated with Si-Si distance.
Using the approach described above, we generated model systems representing two different off-
pathway intermediates in ethene metathesis: the trigonal pyramidal and square pyramidal
geometries. During ethene metathesis, Mo/SiO2 sites can deactivate via metallacycle rotation
from trigonal bipyramidal geometry to less active but more stable square bipyramidal
geometry.160,161 Figure 6.2a shows site energy as a function of Si-Si distance for both bridged
and non-bridged cluster models in this study. Both cluster models are continuously dependent on
Si-Si distance.
The energy profile of the bridged cluster is sufficiently explained by bond angles and the
bond lengths, shown in Figure 6.3a and 6.3b, respectively. At small Si-Si distances, both the both
Si-O-Si and O-Mo-O bond angles are compressed, resulting in increased site energy due to bond
angle strain. As Si-Si distances increase, the siloxane bridge approaches linear and bond
stretching results in increased site energies. Furthermore, as the siloxane bridge angle increases,
the O-Mo-O angle is increased, due to steric hindrance, causing further steric hindrance with
inter-moiety bonds.
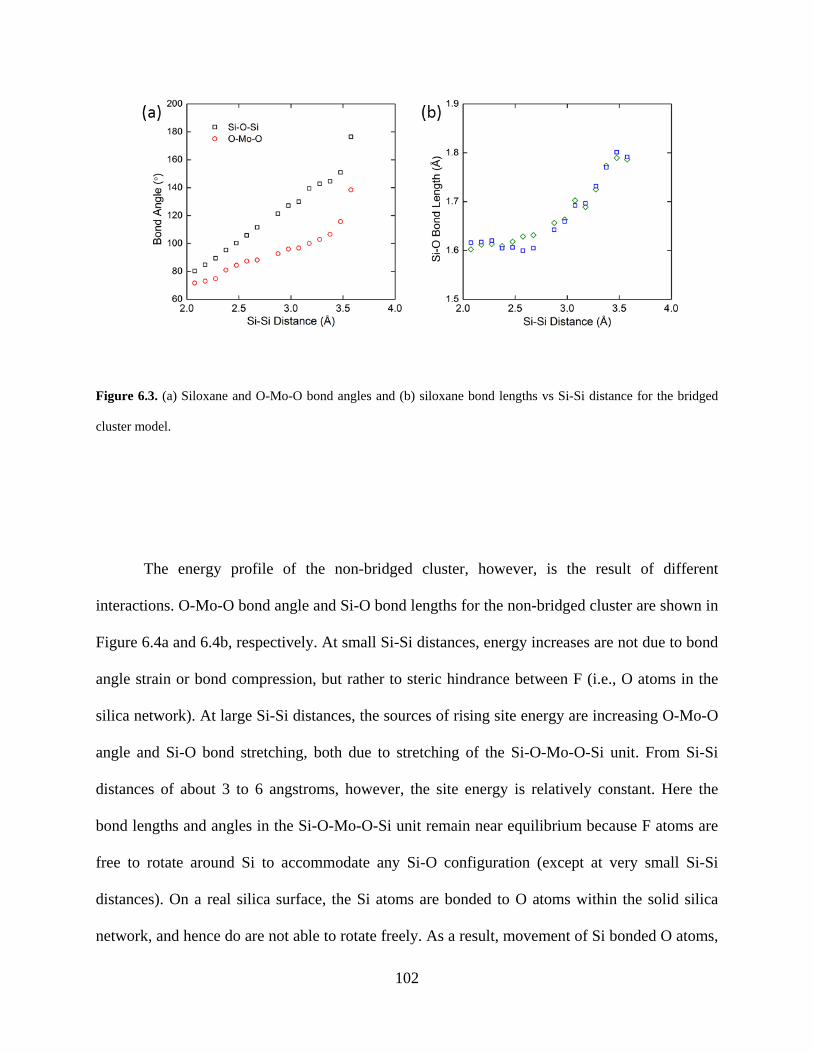
102
Figure 6.3. (a) Siloxane and O-Mo-O bond angles and (b) siloxane bond lengths vs Si-Si distance for the bridged
cluster model.
The energy profile of the non-bridged cluster, however, is the result of different
interactions. O-Mo-O bond angle and Si-O bond lengths for the non-bridged cluster are shown in
Figure 6.4a and 6.4b, respectively. At small Si-Si distances, energy increases are not due to bond
angle strain or bond compression, but rather to steric hindrance between F (i.e., O atoms in the
silica network). At large Si-Si distances, the sources of rising site energy are increasing O-Mo-O
angle and Si-O bond stretching, both due to stretching of the Si-O-Mo-O-Si unit. From Si-Si
distances of about 3 to 6 angstroms, however, the site energy is relatively constant. Here the
bond lengths and angles in the Si-O-Mo-O-Si unit remain near equilibrium because F atoms are
free to rotate around Si to accommodate any Si-O configuration (except at very small Si-Si
distances). On a real silica surface, the Si atoms are bonded to O atoms within the solid silica
network, and hence do are not able to rotate freely. As a result, movement of Si bonded O atoms,
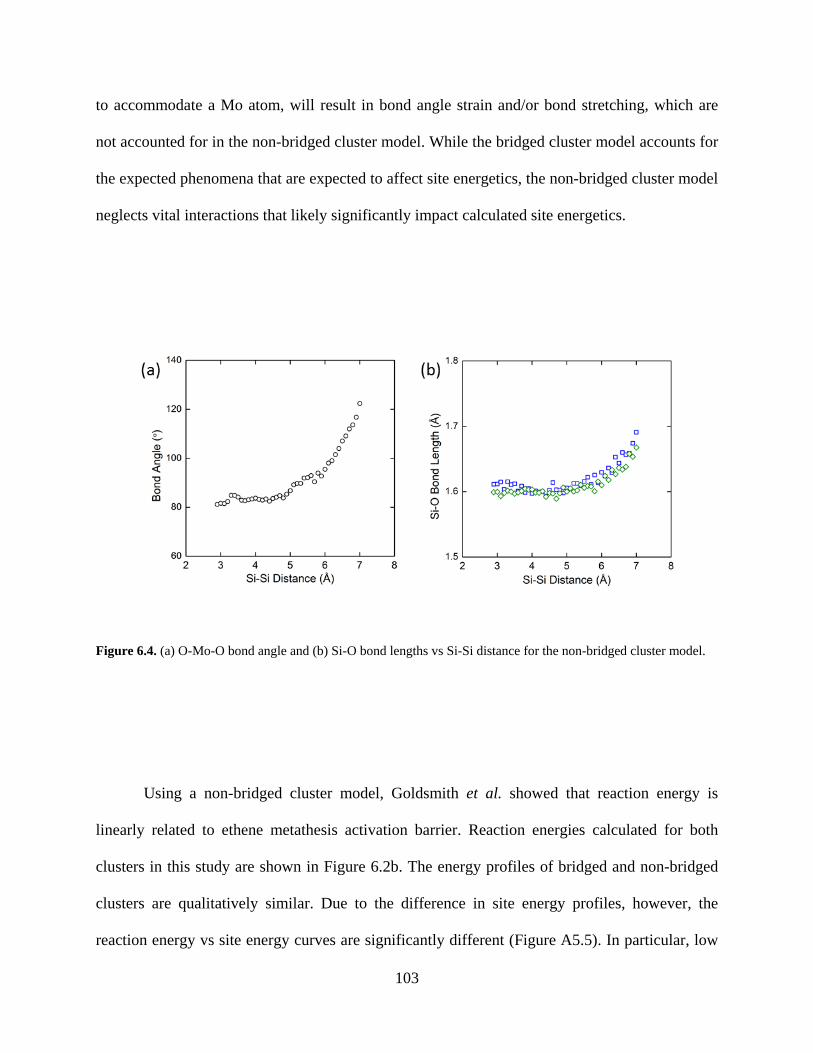
103
to accommodate a Mo atom, will result in bond angle strain and/or bond stretching, which are
not accounted for in the non-bridged cluster model. While the bridged cluster model accounts for
the expected phenomena that are expected to affect site energetics, the non-bridged cluster model
neglects vital interactions that likely significantly impact calculated site energetics.
Figure 6.4. (a) O-Mo-O bond angle and (b) Si-O bond lengths vs Si-Si distance for the non-bridged cluster model.
Using a non-bridged cluster model, Goldsmith et al. showed that reaction energy is
linearly related to ethene metathesis activation barrier. Reaction energies calculated for both
clusters in this study are shown in Figure 6.2b. The energy profiles of bridged and non-bridged
clusters are qualitatively similar. Due to the difference in site energy profiles, however, the
reaction energy vs site energy curves are significantly different (Figure A5.5). In particular, low
104
energy bridged sites generally have higher reaction energy than low energy non-bridged sites. If
the linear relationship between activation barrier and reaction energy for non-bridged clusters
(activation barrier decreases with increasing reaction energy) holds for bridged sites, this
indicates that bridged sites may be more active than non-bridged, on average.
6.3.3 Mo sites on periodic surface models.
To examine the effects the surface structure not accounted for by cluster models, we generated
Mo sites on periodic amorphous silica surfaces. When heated, silanol groups are known to react
with one another via condensation to form a water molecule and a siloxane bridge in a process
called dehydroxylation.33,53,171 As a result of dehydroxylation, both the number of silanol groups
and the local structure of the silica surface changes.33,53,103,171 It is thus likely that the properties
of Mo sites may differ on silica surfaces that have been treated at different temperatures and
hence undergone different degrees of dihydroxylation. Sites were hence generated at all possible
anchoring locations on 15 different surface structures, which represent three average silica
pretreatment temperatures (5 surfaces per temperature): 210, 340, and 540 °C.
For cluster models with a constant number of atoms, the relative stability of different
sites can be calculated as the difference in system energies.131 For sites on a surface, however,
this definition does not suffice–even for different sites on the same surface–because the Mo
moiety replaces atoms on the surface (OH groups). Typically, this problem is solved by
calculating reaction energy where the net stoichiometry of the system is conserved. For example,
the energy of gas-phase H2 may be used to conserve stoichiometry to approximate the site energy
as the reaction energy of:
105
. (1)
This definition corresponds to the energy of site formation; however, this does not necessarily
correlate with site stability because the energy of a site at a given time is not history dependent.
For example, if a Mo site forms at two silanols that are H-bonding with each other, the energy of
site formation will be higher than if the silanols were not H-bonded. The increased formation
energy is due an H-bond that is not present in the Mo/SiO2 system, and hence should not have
any effect on the stability of the system.
To compare site energies similar to the approach used for the cluster models, we
calculated site energy as follows:
(2)
where denotes the energy of the Mo/SiO2 system, with all atoms relaxed. denotes
the silica surface, minus the two anchoring OH groups, fixed in the relaxed geometry of the bare
silica surface (with all OH groups). By calculating the reference silica surface system without the
anchoring OH groups, both moiety-silica interactions and moiety deformation are explicitly
accounted for, and silica network deformation is estimated.
Figure 6.5 shows that the clear trends relating site and reaction energies to Si-Si distance
are no longer applicable when explicitly modeling the silica surface. It is easy to distinguish
between bridged and non-bridged sites, which have Si-Si distances of ~3 and > 3.5 Å,
respectively. From Figure 6.5a it is clear that bridged sites have similar site energies as non-
bridged sites; however, bridge sites are more likely to have significantly higher reaction energy
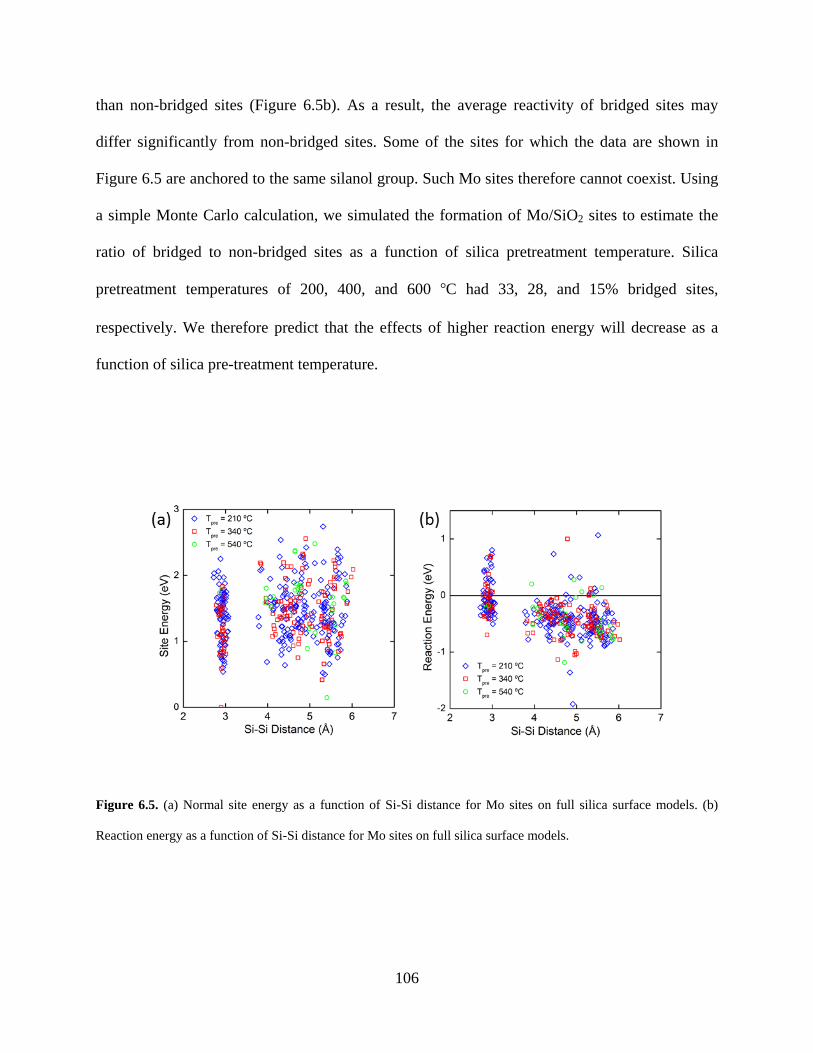
106
than non-bridged sites (Figure 6.5b). As a result, the average reactivity of bridged sites may
differ significantly from non-bridged sites. Some of the sites for which the data are shown in
Figure 6.5 are anchored to the same silanol group. Such Mo sites therefore cannot coexist. Using
a simple Monte Carlo calculation, we simulated the formation of Mo/SiO2 sites to estimate the
ratio of bridged to non-bridged sites as a function of silica pretreatment temperature. Silica
pretreatment temperatures of 200, 400, and 600 °C had 33, 28, and 15% bridged sites,
respectively. We therefore predict that the effects of higher reaction energy will decrease as a
function of silica pre-treatment temperature.
Figure 6.5. (a) Normal site energy as a function of Si-Si distance for Mo sites on full silica surface models. (b)
Reaction energy as a function of Si-Si distance for Mo sites on full silica surface models.
107
Based on the results of cluster calculations, we hypothesized that O-Mo-O bond angles
significantly impact Mo site energetics. The distance between anchoring O atoms is directly
related to the O-Mo-O bond angle. Figure 6.6 shows contour plots of site energies and reaction
energies for both cluster and surface models. For direct comparison, we limit the cluster model
results to those with Si-Si distances observed on the full surface models. The cluster models
show significantly less variation in magnitudes of both site and reaction energies than surface
models. It is also clear from Figures 6.6a and 6.6b that both site energy and reaction energy
generally vary more as a function of O-O distance than Si-Si distance.
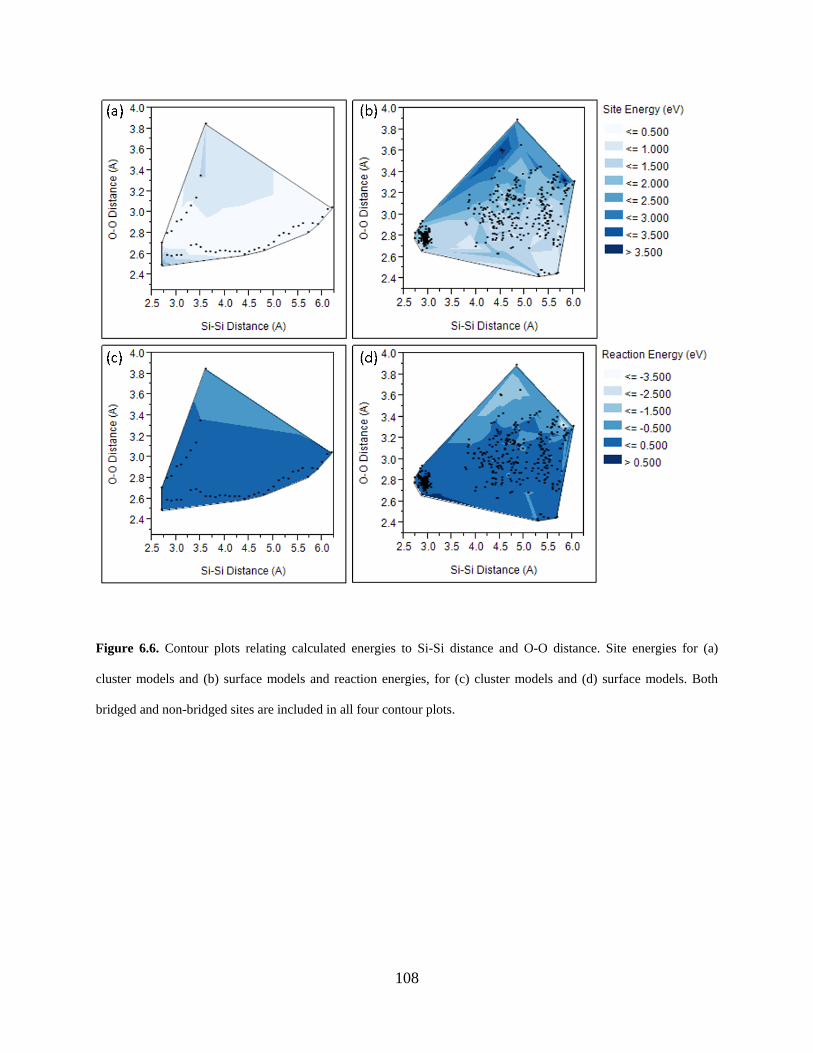
108
Figure 6.6. Contour plots relating calculated energies to Si-Si distance and O-O distance. Site energies for (a)
cluster models and (b) surface models and reaction energies, for (c) cluster models and (d) surface models. Both
bridged and non-bridged sites are included in all four contour plots.
109
Surface model calculations indicate that smaller O-O distances correspond to increased
site stability. This can be rationalized by smaller O-Mo-O angles resulting in less steric
hindrance with the moiety atoms than larger angles. Furthermore, sites with smaller O-Mo-O
angles have higher reaction energies. This is because while the ‘reactant’ energy is significantly
affected by O-Mo-O angle, the ‘product’ less sensitive to this because while O=Mo-C3H6 is
parallel to O-Mo-O in the trigonal bipyramidal geometry, it is perpendicular in the square
bipyramidal geometry. Smaller O-Mo-O angles thus lead to lower ‘reactant’ energies and hence
increased reaction energies.
6.4 CONCLUSIONS
Amorphous surfaces exhibit a wide distribution of surface structures. An accurate description of
catalysts supported on amorphous surfaces must therefore capture an entire distribution of
surface sites. Recently, methods for generating cluster models that account for such a distribution
have been developed.131,167 In order to understand the limitations of such models, we examined
commonly used Mo/SiO2 cluster models131,160,161 having a distribution of Si-Si distances. Our
results indicate that an accurate model of Mo/SiO2 catalysts should include both bridged and
unbridged sites because they’re energetics are dependent on very different properties.
Furthermore, a non-bridged cluster model that represents the silica surface as only anchoring Si
atoms their nearest neighbors does not accurately represent the real physics of Mo/SiO2 sites.
Energetically accurate atomistic models of amorphous silica surfaces were recently
developed.103 We developed a transferable method for generating a large number of isolated
metal atom sites on these amorphous surfaces based on constrained cluster calculations. This
110
approach could be applied to the development of other atomistic models of other isolated metal
center catalysts on amorphous surfaces. Finally, using previously developed model surface
structures, we have studied isolated Mo center catalysts on periodic amorphous silica surface
models. Our results indicate that the O-Mo-O bond angle plays a crucial role in determining the
Mo site energies and metallacycle reaction energies. Most importantly, the O-Mo-O angle
significantly impacted by the positions of the anchoring Si atoms nearest neighbors via the Si-O
bonds. Thus, the distribution of O-Mo-O angles could be accounted for using cluster models by
explicitly accounting for the positions of nearest neighbors to anchoring Si atoms, e.g., by
sampling a range of fixed SiF3 and SiF2 geometries.
111
7.0 SIMPLE TRANSFERABLE APPROACH FOR HIGH-YIELD SEPARATION OF
STABLE NANOPARTICLES
The content of this chapter is taken from C. S. Ewing, Y. Lai, A. P. Loughner, J. J. McCarthy,
and G. Veser “Simple Transferable Approach for High-Yield Separation of Stable
Nanoparticles”, in preparation.
7.1 INTRODUCTION
Over the past few decades, intense research developing nanomaterials has resulted in
synthesis procedures for ever smaller and more precise nanostructures.172 Very small
nanoparticles (NPs) often exhibit unique properties that are fundamentally different from their
bulk counterparts, allowing for new and/or improved materials and applications.173 In order to
achieve optimal performance, NPs of low polydispersity with controlled size and shape are
increasingly desired.
Traditional synthetic routes, such as wet impregnation, co-precipitation, and
deposition/precipitation are often scalable; however, they typically yield a broad size distribution
and consequently little control over particle size and shape.174 The use of ligand capping agents
(e.g., phosphine or thiol groups) has been extensively used to achieve precise control of
nanoparticle size and obtain extremely low polydispersity.175 Furthermore, ligand selection has
112
been shown to allow for careful control of not only size but nanoparticle shape by inhibiting the
growth of specific facets.176-189 Importantly, the use of capping agents can be made convenient
and scalable, allowing for regular use in industrial applications.190
Despite these advances, scaling up these methods has met with numerous engineering
challenges, often related to overall efficiency and cost. For example, very small ligand-protected
NPs are typically extremely stable in solution requiring tedious and expensive membrane
centrifugation to achieve separation from their synthesis solution. This approach is especially
problematic when synthesizing practical sample sizes (e.g., more than 100 mg) due to filter
clogging and time constraints.
Furthermore, removal of capping agents requires high temperature calcination, which
typically results in sintering of small nanoparticles. It has recently been shown that sintering of
~4 nm Pt3Fe nanoparticles during high temperature calcinati0n can be avoided by embedding in
KCl.191 However, the procedure is non-transferable as the precipitation of KCl requires the use of
metal-choride precursors (e.g., PtCl4) in THF.
In this work, we present a rapid, transferable method for achieving high-yield separation,
deposition, and protected annealing of ultra-small nanoparticles via salt recrystallization. We
demonstrate that salt recrystallization can be used to efficiently separate and precipitate
suspended nanoparticles in solution, circumventing the requirement of membrane centrifugation.
We then show how this approach can be tuned to produce well-dispersed supported nanoparticles
in a one-pot synthesis procedure, resulting in a significant reduction of time and number of
required steps, compared to currently employed methods. Finally, we demonstrate that removal
of capping agents can be achieved without nanoparticle sintering via protected annealing, i.e.,
calcination while embedded in thermally stable salts.
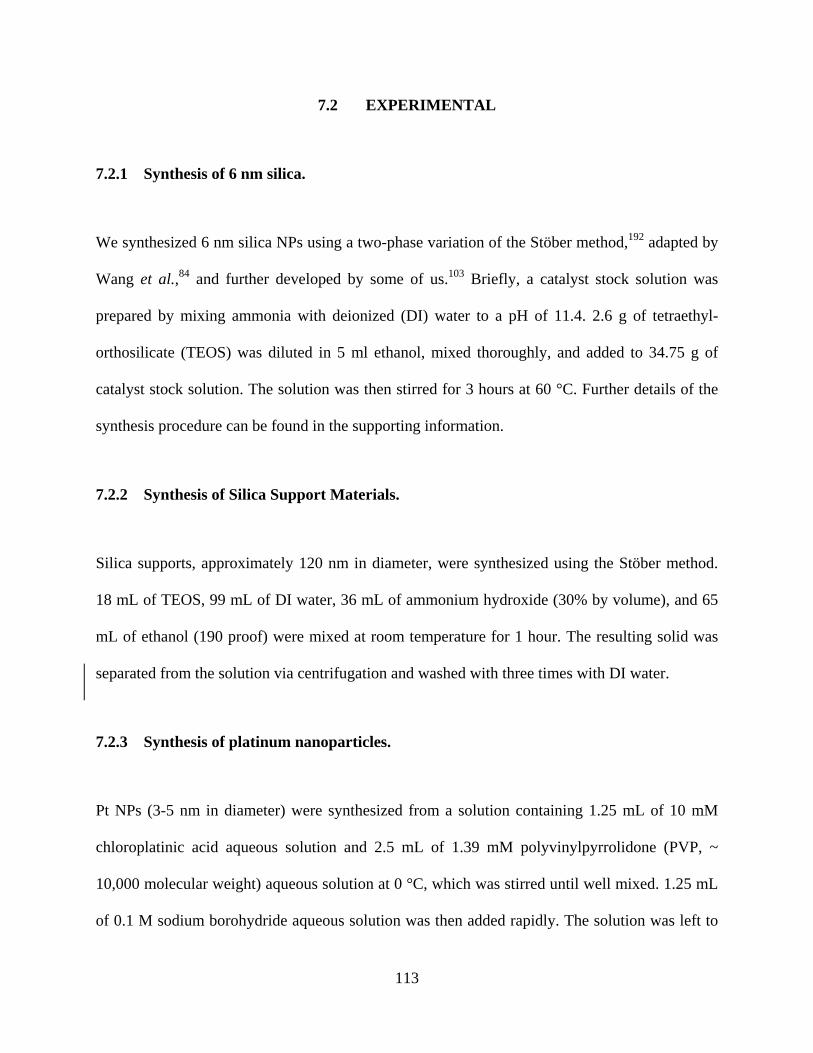
113
7.2 EXPERIMENTAL
7.2.1 Synthesis of 6 nm silica.
We synthesized 6 nm silica NPs using a two-phase variation of the Stöber method,192 adapted by
Wang et al.,84 and further developed by some of us.103 Briefly, a catalyst stock solution was
prepared by mixing ammonia with deionized (DI) water to a pH of 11.4. 2.6 g of tetraethyl-
orthosilicate (TEOS) was diluted in 5 ml ethanol, mixed thoroughly, and added to 34.75 g of
catalyst stock solution. The solution was then stirred for 3 hours at 60 °C. Further details of the
synthesis procedure can be found in the supporting information.
7.2.2 Synthesis of Silica Support Materials.
Silica supports, approximately 120 nm in diameter, were synthesized using the Stöber method.
18 mL of TEOS, 99 mL of DI water, 36 mL of ammonium hydroxide (30% by volume), and 65
mL of ethanol (190 proof) were mixed at room temperature for 1 hour. The resulting solid was
separated from the solution via centrifugation and washed with three times with DI water.
7.2.3 Synthesis of platinum nanoparticles.
Pt NPs (3-5 nm in diameter) were synthesized from a solution containing 1.25 mL of 10 mM
chloroplatinic acid aqueous solution and 2.5 mL of 1.39 mM polyvinylpyrrolidone (PVP, ~
10,000 molecular weight) aqueous solution at 0 °C, which was stirred until well mixed. 1.25 mL
of 0.1 M sodium borohydride aqueous solution was then added rapidly. The solution was left to
114
react for 30 minutes. When using the conventional method of NP separation, the NPs were then
recovered and washed with water 3 times using membrane centrifugation (Centricon Ultracel-
10K, Amicon Ultra Inc.).
7.2.4 Conventional synthesis of Pt/SiO2.
Pt NPs were synthesized as described above. After washing, the Pt NPs and 240 mg of (120 nm)
silica support were dispersed in 2 ml of DI water. The solution was stirred for 1 hour at room
temperature and then dried in vacuum at 100 °C. The resulting Pt/SiO2 sample was then calcined
at 300 °C to remove PVP.
7.2.5 Characterization of nanomaterials.
Transmission electron microscopy (TEM) images were taken on a JEOL JEM2100F with an
accelerating voltage of 200 keV. Specific surface area was measured by nitrogen adsorption
using a Micromeritics ASAP 2020. The surface area of N2 was taken to be 1.47 nm2/mol as
determined previously.85
7.2.6 Nanoparticle separation via salt recrystallization.
Salt was added to the solution containing NPs until the solution was saturated. Liquid in which
the salt is insoluble (“precipitator”) was then rapidly added to the solution and agitated to
accelerate precipitation. The resulting precipitate and NPs were then recovered via

115
centrifugation. Finally, the salt was removed via calcination in air. Details of salt
recrystallization vary with sample and are discussed in the Results and Discussion.
7.3 RESULTS AND DISCUSSION
7.3.1 Separation of 6 nm silica.
Recently, we adapted a two-phase variation of the Stöber method by Wang et al.84 to achieve
monodisperse silica nanoparticles approximately 6 nm in diameter. This one-pot synthesis
involves only water, ethanol, ammonia and tetraethyl-orthosilicate (TEOS). While purification is
theoretically simple due to the absence of surfactants, dissociation of surface hydroxyls in the
aqueous synthesis environment results in strong repulsive electrostatic interparticle forces
causing the silica NPs to be extremely stable in solution. As a result, high-speed centrifugation
returns no solid material. Furthermore, we found centrifugation to be ineffective even after pH
neutralization and traditional “salting out”–the addition of salt to screen electrostatic forces
between NPs.
The standard approach for separating stable nanoparticles is the use of membrane filtered
centrifugation. This approach, however, can be problematic for syntheses involving more than a
few ml of solution and/or a few mg of solid NPs. The synthesis of 6 nm silica results in 43 ml of
solution and 680 mg of solid NPs. As a result, membrane centrifugation requires the use of many
centrifugation cycles. For our materials, removal of the solution requires four separate
centrifugation cycles, which take approximately 45 minutes each because of membrane clogging
due to the high volume of solids. After combining the solid materials, each subsequent wash
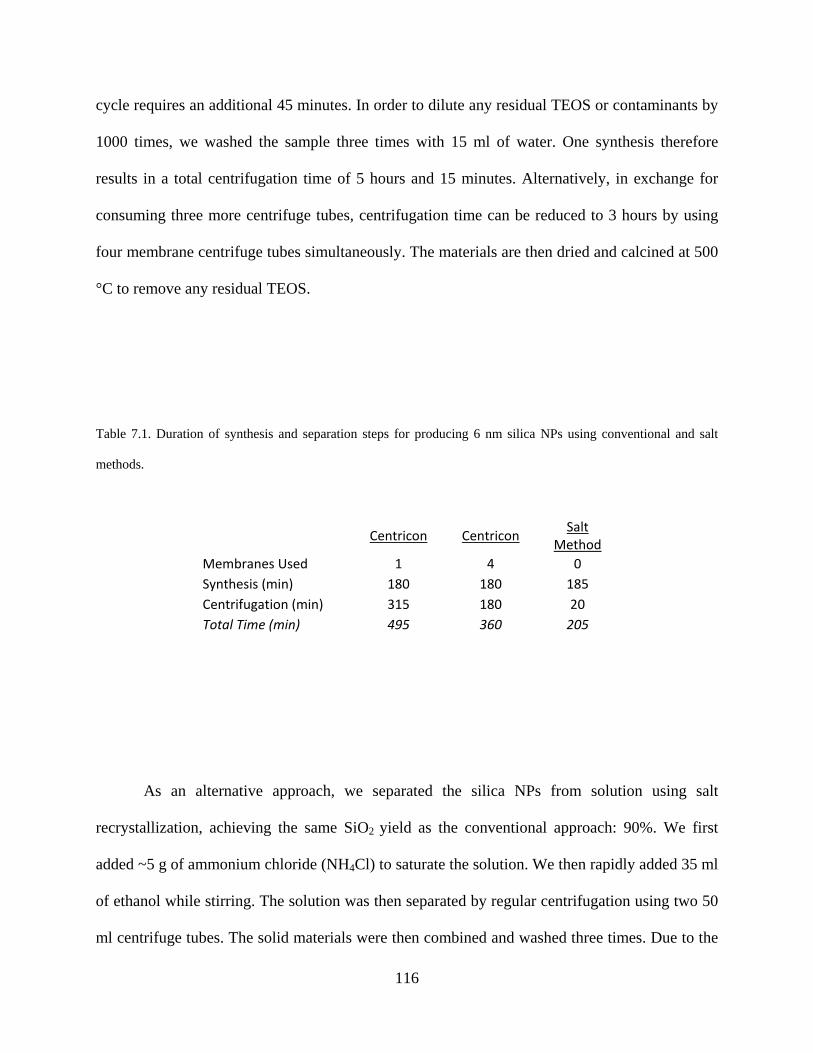
116
cycle requires an additional 45 minutes. In order to dilute any residual TEOS or contaminants by
1000 times, we washed the sample three times with 15 ml of water. One synthesis therefore
results in a total centrifugation time of 5 hours and 15 minutes. Alternatively, in exchange for
consuming three more centrifuge tubes, centrifugation time can be reduced to 3 hours by using
four membrane centrifuge tubes simultaneously. The materials are then dried and calcined at 500
°C to remove any residual TEOS.
Table 7.1. Duration of synthesis and separation steps for producing 6 nm silica NPs using conventional and salt
methods.
Centricon Centricon Salt Method
Membranes Used 1 4 0 Synthesis (min) 180 180 185 Centrifugation (min) 315 180 20 Total Time (min) 495 360 205
As an alternative approach, we separated the silica NPs from solution using salt
recrystallization, achieving the same SiO2 yield as the conventional approach: 90%. We first
added ~5 g of ammonium chloride (NH4Cl) to saturate the solution. We then rapidly added 35 ml
of ethanol while stirring. The solution was then separated by regular centrifugation using two 50
ml centrifuge tubes. The solid materials were then combined and washed three times. Due to the
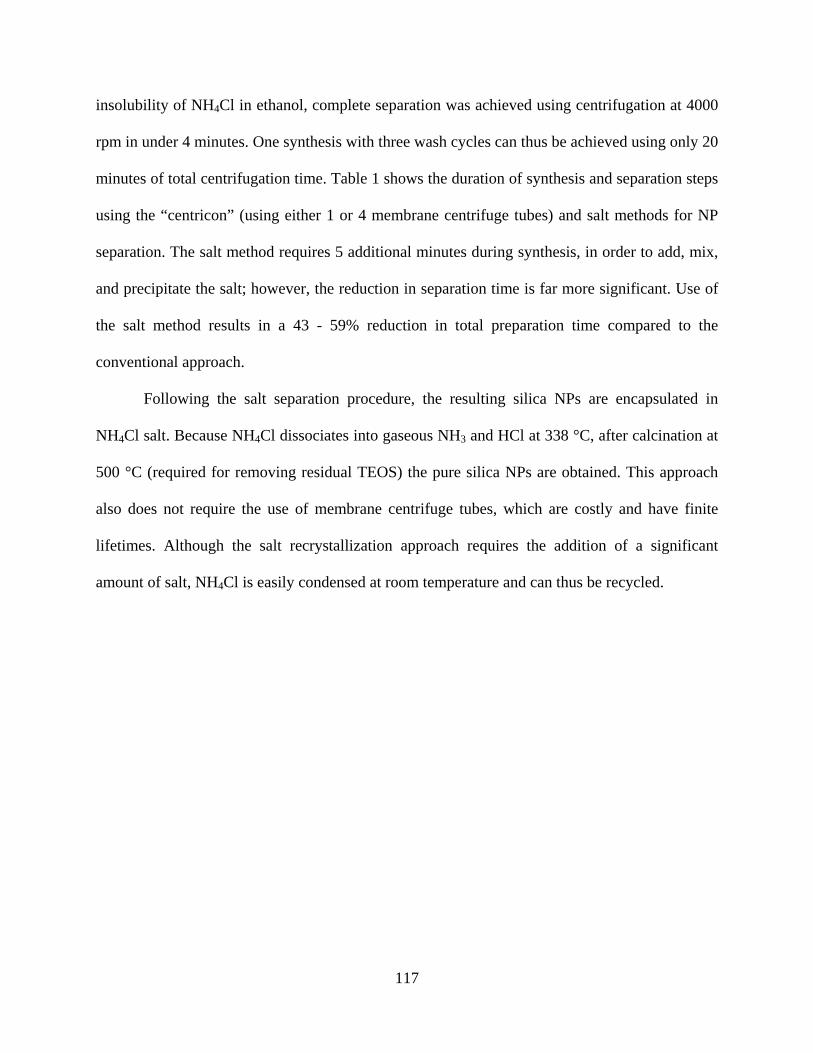
117
insolubility of NH4Cl in ethanol, complete separation was achieved using centrifugation at 4000
rpm in under 4 minutes. One synthesis with three wash cycles can thus be achieved using only 20
minutes of total centrifugation time. Table 1 shows the duration of synthesis and separation steps
using the “centricon” (using either 1 or 4 membrane centrifuge tubes) and salt methods for NP
separation. The salt method requires 5 additional minutes during synthesis, in order to add, mix,
and precipitate the salt; however, the reduction in separation time is far more significant. Use of
the salt method results in a 43 - 59% reduction in total preparation time compared to the
conventional approach.
Following the salt separation procedure, the resulting silica NPs are encapsulated in
NH4Cl salt. Because NH4Cl dissociates into gaseous NH3 and HCl at 338 °C, after calcination at
500 °C (required for removing residual TEOS) the pure silica NPs are obtained. This approach
also does not require the use of membrane centrifuge tubes, which are costly and have finite
lifetimes. Although the salt recrystallization approach requires the addition of a significant
amount of salt, NH4Cl is easily condensed at room temperature and can thus be recycled.
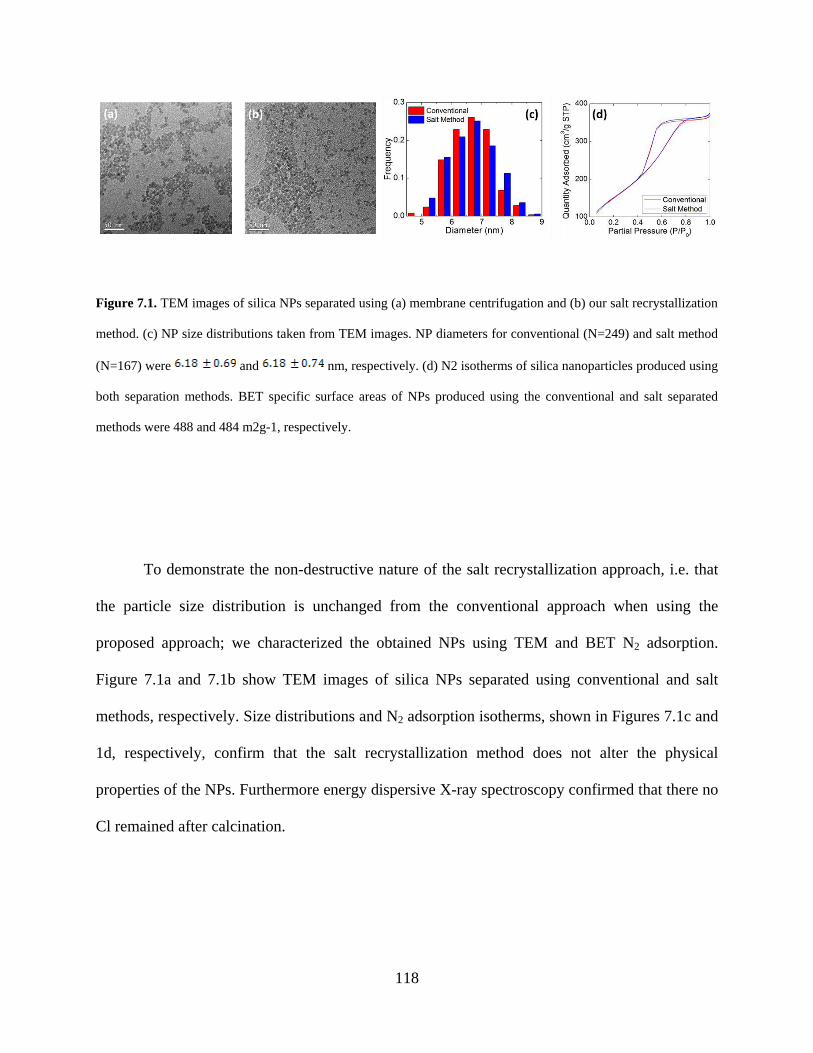
118
Figure 7.1. TEM images of silica NPs separated using (a) membrane centrifugation and (b) our salt recrystallization
method. (c) NP size distributions taken from TEM images. NP diameters for conventional (N=249) and salt method
(N=167) were and nm, respectively. (d) N2 isotherms of silica nanoparticles produced using
both separation methods. BET specific surface areas of NPs produced using the conventional and salt separated
methods were 488 and 484 m2g-1, respectively.
To demonstrate the non-destructive nature of the salt recrystallization approach, i.e. that
the particle size distribution is unchanged from the conventional approach when using the
proposed approach; we characterized the obtained NPs using TEM and BET N2 adsorption.
Figure 7.1a and 7.1b show TEM images of silica NPs separated using conventional and salt
methods, respectively. Size distributions and N2 adsorption isotherms, shown in Figures 7.1c and
1d, respectively, confirm that the salt recrystallization method does not alter the physical
properties of the NPs. Furthermore energy dispersive X-ray spectroscopy confirmed that there no
Cl remained after calcination.
119
7.3.2 Separation of 4 nm Pt.
We have demonstrated the use of salt recrystallization for isolating NPs that are stabilized
by ionic interactions (i.e., silica). However, metal NPs in particular are more commonly
stabilized by non-ionic capping agents, such as polymers.175 Furthermore, the 6 nm silica
synthesis described above has few reactants, and hence a relatively simple synthesis solution. To
demonstrate the transferability of NP separation via salt recrystallization, we applied this
approach to the separation of 4 nm Pt NPs stabilized by polyvinylpyrrolidone (PVP).
A small quantity of Pt NPs (~2.4 mg) was synthesized in a 15 ml solution that is
relatively complex, containing: Cl-, H+, Na+, BH4-, platinum NPs, and PVP. After NP growth,
the synthesis bath was saturated with NH4Cl (2 g). Ethanol (30 ml) was rapidly added and the
solution was agitated, resulting in precipitation of the salt. Pure Pt NPs were recovered at a yield
of 83% after NH4Cl was removed by calcination in air at 350 °C. The yield is significantly less
than the 90% yield obtained using membrane centrifugation. However, PVP is burned off during
calcination at 350 °C (required for removing NH4Cl) resulting in significant sintering of Pt NPs,
so no further optimization was performed. Thus, while this result demonstrates the transferability
of the method to NPs composed of other materials, it also reveals the need for tuning the salt
dissociation temperature based on NP composition.
7.3.3 Synthesis of Pt/SiO2 Catalyst.
Using a salt with a low dissociation temperature, NP separation via salt recrystallization method
can be used to synthesize 4 nm Pt/SiO2 in significantly less time than the conventional approach.
To minimize sintering the NPs should be in direct contact with the support and isolated from
120
each other at the time of calcination. Ammonium bicarbonate (NH5CO3) was chosen for the salt
because it dissociates at a temperature of about 50 °C, allowing for the removal of salt while
leaving PVP intact. The Pt NPs–still protected by PVP–can then be dispersed onto the support
and subsequently calcined to remove PVP. Finally, to reduce the number of steps required,
addition of support material was integrated into the NP separation procedure as follows.
After Pt NP growth, enough salt was added to saturate the solution (~2 g). Isopropanol
(30 ml) containing well dispersed 120 nm silica NPs (240 mg) was then rapidly added to the
synthesis bath and agitated. The solution was then centrifuged to give a dark solid containing
NH5CO3, silica, and platinum, which was then dried in a vacuum oven at 60 °C to dissociate the
salt. The Pt/SiO2 mixture was then briefly mechanically mixed using mortar and pestle to
disperse the Pt NPs on the silica surface. Finally, the sample was calcined at 300 °C to remove
PVP. Figure 7.2a shows the Pt NPs as-synthesized, prior to any calcination. From Figures 7.2b
and c we see that despite some particle growth during calcination, Pt/SiO2 produced using both
conventional and salt recrystallization methods have the same average NP size and size
distribution. Furthermore, energy dispersive X-ray spectroscopy confirms similar weight
loadings of 0.68 and 0.64 wt% Pt achieved using conventional and salt methods, respectively.
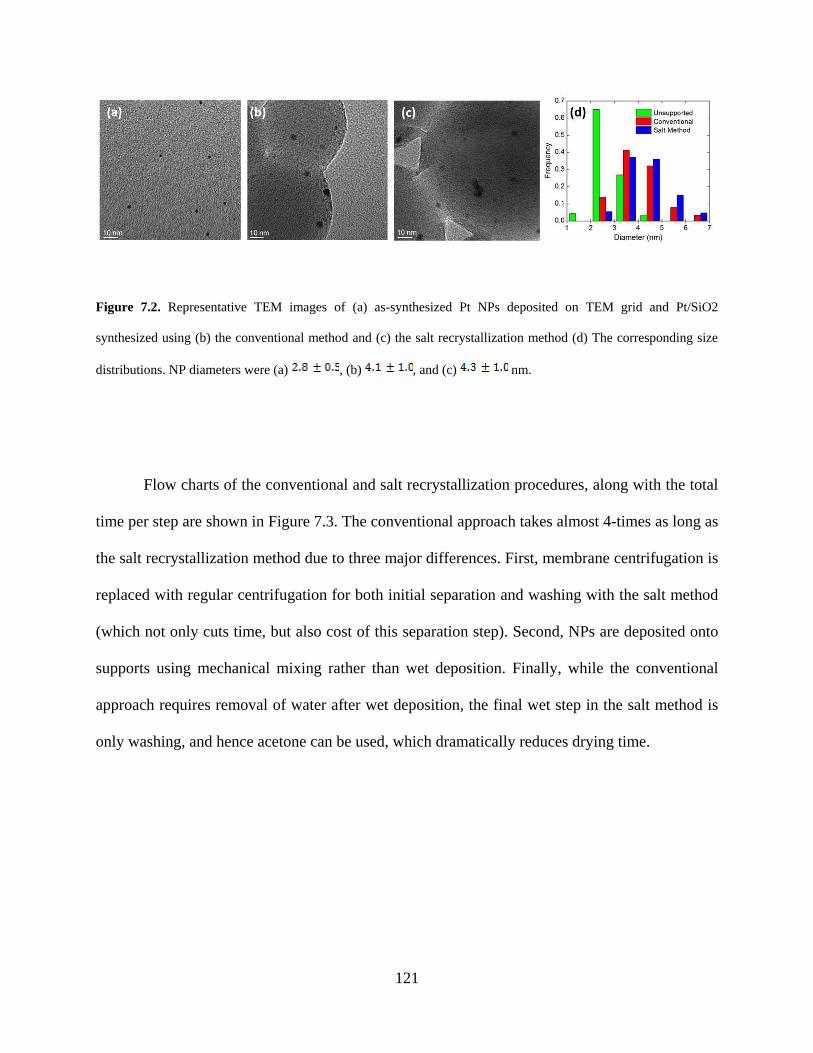
121
Figure 7.2. Representative TEM images of (a) as-synthesized Pt NPs deposited on TEM grid and Pt/SiO2
synthesized using (b) the conventional method and (c) the salt recrystallization method (d) The corresponding size
distributions. NP diameters were (a) , (b) , and (c) nm.
Flow charts of the conventional and salt recrystallization procedures, along with the total
time per step are shown in Figure 7.3. The conventional approach takes almost 4-times as long as
the salt recrystallization method due to three major differences. First, membrane centrifugation is
replaced with regular centrifugation for both initial separation and washing with the salt method
(which not only cuts time, but also cost of this separation step). Second, NPs are deposited onto
supports using mechanical mixing rather than wet deposition. Finally, while the conventional
approach requires removal of water after wet deposition, the final wet step in the salt method is
only washing, and hence acetone can be used, which dramatically reduces drying time.
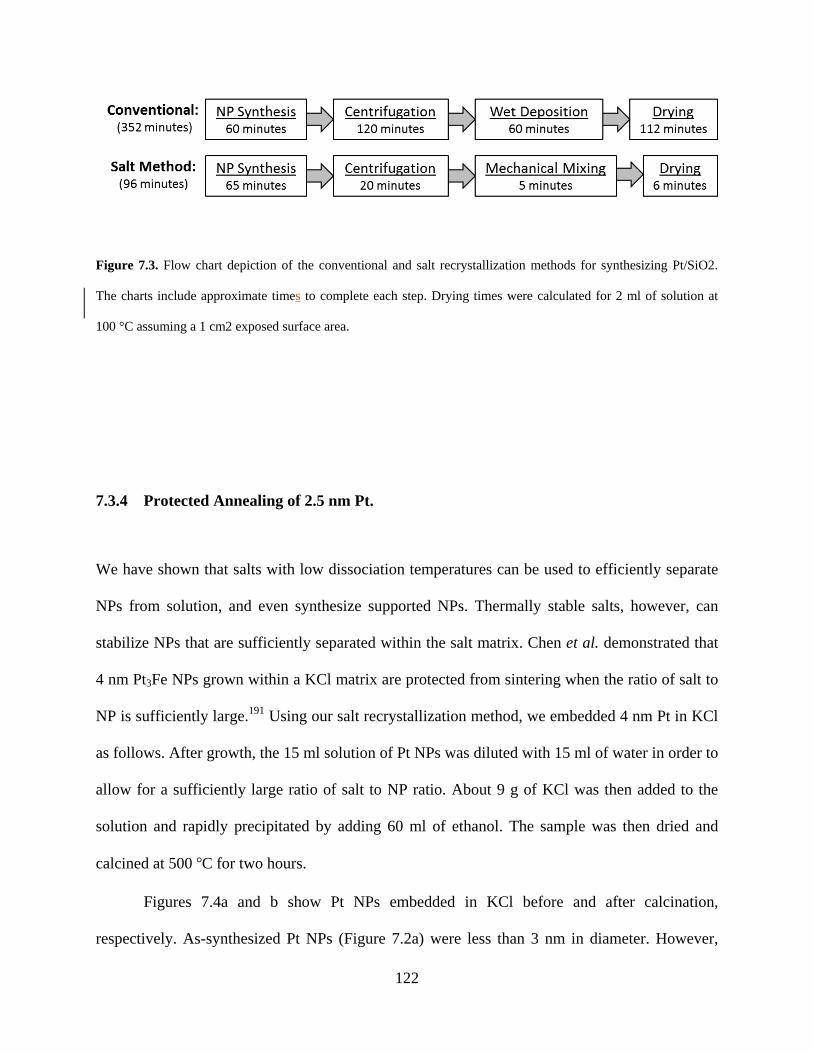
122
Figure 7.3. Flow chart depiction of the conventional and salt recrystallization methods for synthesizing Pt/SiO2.
The charts include approximate times to complete each step. Drying times were calculated for 2 ml of solution at
100 °C assuming a 1 cm2 exposed surface area.
7.3.4 Protected Annealing of 2.5 nm Pt.
We have shown that salts with low dissociation temperatures can be used to efficiently separate
NPs from solution, and even synthesize supported NPs. Thermally stable salts, however, can
stabilize NPs that are sufficiently separated within the salt matrix. Chen et al. demonstrated that
4 nm Pt3Fe NPs grown within a KCl matrix are protected from sintering when the ratio of salt to
NP is sufficiently large.191 Using our salt recrystallization method, we embedded 4 nm Pt in KCl
as follows. After growth, the 15 ml solution of Pt NPs was diluted with 15 ml of water in order to
allow for a sufficiently large ratio of salt to NP ratio. About 9 g of KCl was then added to the
solution and rapidly precipitated by adding 60 ml of ethanol. The sample was then dried and
calcined at 500 °C for two hours.
Figures 7.4a and b show Pt NPs embedded in KCl before and after calcination,
respectively. As-synthesized Pt NPs (Figure 7.2a) were less than 3 nm in diameter. However,
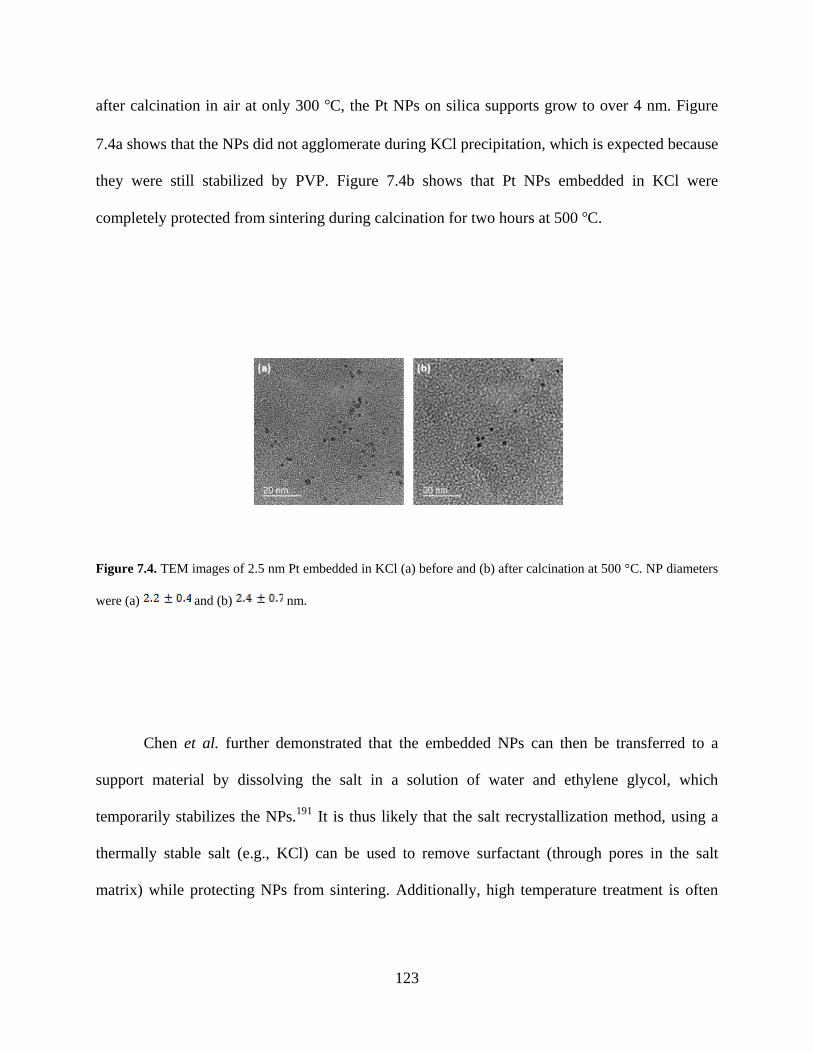
123
after calcination in air at only 300 °C, the Pt NPs on silica supports grow to over 4 nm. Figure
7.4a shows that the NPs did not agglomerate during KCl precipitation, which is expected because
they were still stabilized by PVP. Figure 7.4b shows that Pt NPs embedded in KCl were
completely protected from sintering during calcination for two hours at 500 °C.
Figure 7.4. TEM images of 2.5 nm Pt embedded in KCl (a) before and (b) after calcination at 500 °C. NP diameters
were (a) and (b) nm.
Chen et al. further demonstrated that the embedded NPs can then be transferred to a
support material by dissolving the salt in a solution of water and ethylene glycol, which
temporarily stabilizes the NPs.191 It is thus likely that the salt recrystallization method, using a
thermally stable salt (e.g., KCl) can be used to remove surfactant (through pores in the salt
matrix) while protecting NPs from sintering. Additionally, high temperature treatment is often
124
used to represent long time scales, and hence we expect that embedding in salt may be an
excellent method for maintaining NP stability for indefinite storage times.
7.4 CONCLUSIONS
Despite extraordinary developments in NP synthesis, the potential industrial (large-scale) use of
very small and precisely controlled NPs is hindered by difficulties in scaling up their synthesis.
Most effort has been focused on the development of well-defined NPs, while the problem of
scalability and cost of nanomaterials synthesis has been largely overlooked.176-189 Most small,
mono-disperse NPs are extremely stable in solution and require the use of costly and time
consuming membrane centrifugation to separate them from the synthesis solution. We present a
novel, scalable, and very straightforward approach for separation of NPs from solution via salt
recrystallization that circumvents the need for membrane centrifugation. This approach is
applicable to both metal and oxide NPs stabilized by ionic and non-ionic interactions.
Furthermore, we demonstrate that this approach can be tailored, by choice of salt, for separation
of bare NPs, synthesis of supported NPs, or even for protected annealing. Additionally, this
method significantly reduces the number of steps and total time required for both separation of
NPs from solution and for synthesis of supported NPs. Remarkably, the same size distributions
of Pt/SiO2 produced via membrane centrifugation and wet deposition are achieved using salt
recrystallization and mechanical mixing alone, making this approach far more favorable for
scaling up.

125
126
8.0 FUTURE WORK
8.1 EFFECTS OF NANOPARTICLE SUPPORT EFFECTS
In chapters 3, 4, and 5, we explained how adhesion energy can be used to predict the stability of
supported nanoparticles (NPs). In order to understand the effects of NP-support interactions on
reactivity, however, correlations relating the reaction intermediate adsorption energetics and
catalyst-support effects much first be first be ascertained. We have calculated adsorption
energies for CO and O on amorphous silica supported Pt13, Pt55, and Pt147. CO and O adsorption
energies can be used to predict reaction barriers for CO oxidation.12
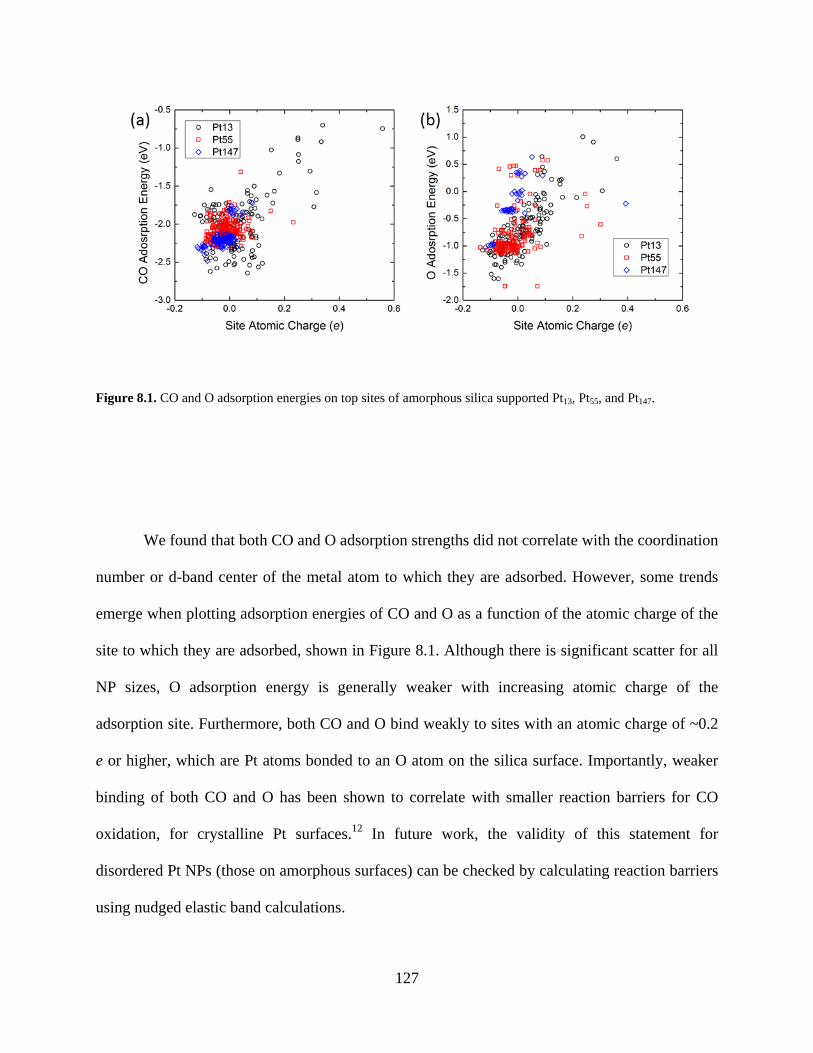
127
Figure 8.1. CO and O adsorption energies on top sites of amorphous silica supported Pt13, Pt55, and Pt147.
We found that both CO and O adsorption strengths did not correlate with the coordination
number or d-band center of the metal atom to which they are adsorbed. However, some trends
emerge when plotting adsorption energies of CO and O as a function of the atomic charge of the
site to which they are adsorbed, shown in Figure 8.1. Although there is significant scatter for all
NP sizes, O adsorption energy is generally weaker with increasing atomic charge of the
adsorption site. Furthermore, both CO and O bind weakly to sites with an atomic charge of ~0.2
e or higher, which are Pt atoms bonded to an O atom on the silica surface. Importantly, weaker
binding of both CO and O has been shown to correlate with smaller reaction barriers for CO
oxidation, for crystalline Pt surfaces.12 In future work, the validity of this statement for
disordered Pt NPs (those on amorphous surfaces) can be checked by calculating reaction barriers
using nudged elastic band calculations.
128
8.2 PREDICTING NANOPARTICLE-SUPPORT INTERACTIONS
After examining metal nanoparticle (MNP)-support interactions with an electronic structure level
of theory, we have developed an approach for predicting MNP-support effects for a wide range
of NP sizes and geometries on amorphous silica. The next logical step is to apply this
methodology towards screening various MNPs in order to map their charge and adhesion
properties. Figures 5.3 and 5.4 compare MNP charge and adhesion energies for a handful of
small Pt NP geometries. However, in order to apply this methodology to MNPs larger than ~3
nm, some further approximations must be made. Surface energies of the MNP could be
calculated using periodic density functional theory. The number of metal-oxygen bonds can be
approximated based on the hydroxyl density of the surface. Finally, the total system energy
would be calculated using a Wulff construction, which can be easily implemented without costly
calculations.
129
APPENDIX A
SUPPORTING INFORMATION
A.1 ACCURATE AMORPHOUS SILICA SURFACE MODELS FROM FIRST
PRINCIPLES THERMODYNAMICS OF SURFACE DEHYDROXYLATION
A.1.1 Silanol number calculation procedure.
The silanol number as a function of temperature plotted in Figure 2.4 is computed by the
following procedures:
1. The initial silanol number is computed for each surface by counting the number of
silanol groups and dividing by the geometric surface area of each sample. The
initial silanol number is determined by the structure of the cleaved surface
coupled with saturation of all under-coordinated O atoms with H atoms, as
described in the paper.
2. The lowest dehydroxylation energy computed for the surface is used in eq 1.2 and
the temperature is adjusted so that .
3. The silanol number is recomputed for the new surface by reducing the number of
silanol groups by two and dividing by the same surface area.
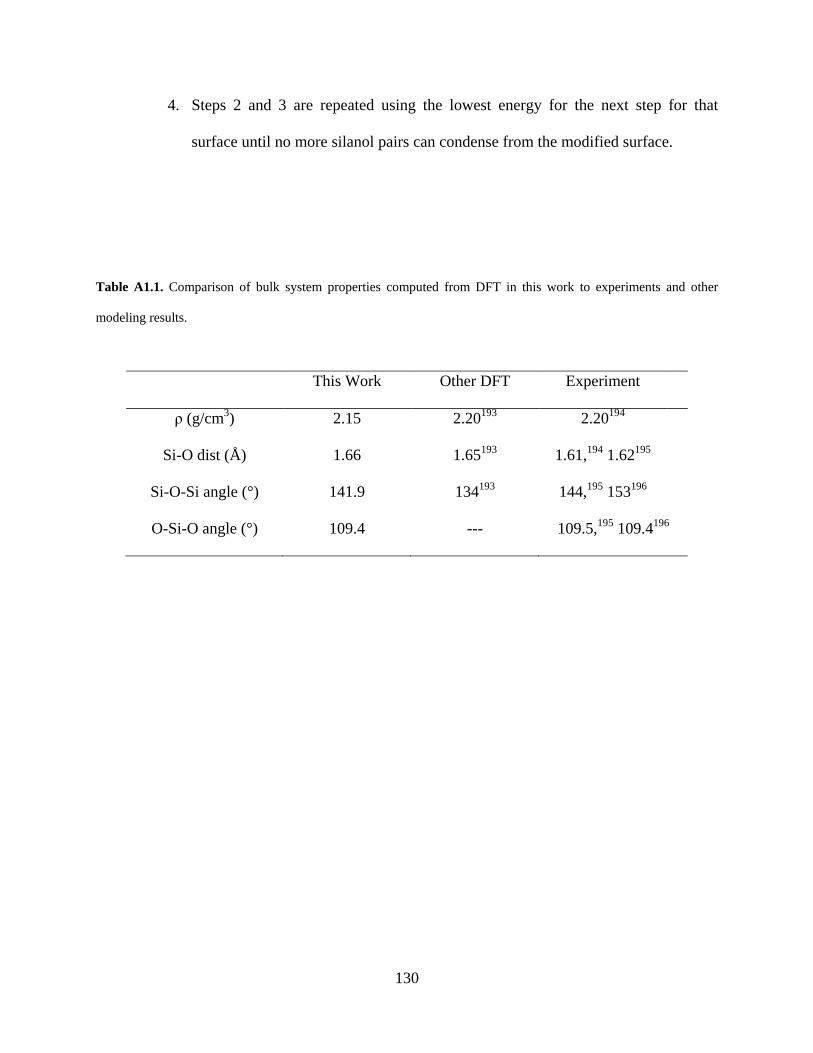
130
4. Steps 2 and 3 are repeated using the lowest energy for the next step for that
surface until no more silanol pairs can condense from the modified surface.
Table A1.1. Comparison of bulk system properties computed from DFT in this work to experiments and other
modeling results.
This Work Other DFT Experiment
ρ (g/cm3) 2.15 2.20193 2.20194
Si-O dist (Å) 1.66 1.65193 1.61,194 1.62195
Si-O-Si angle (°) 141.9 134193 144,195 153196
O-Si-O angle (°) 109.4 --- 109.5,195 109.4196
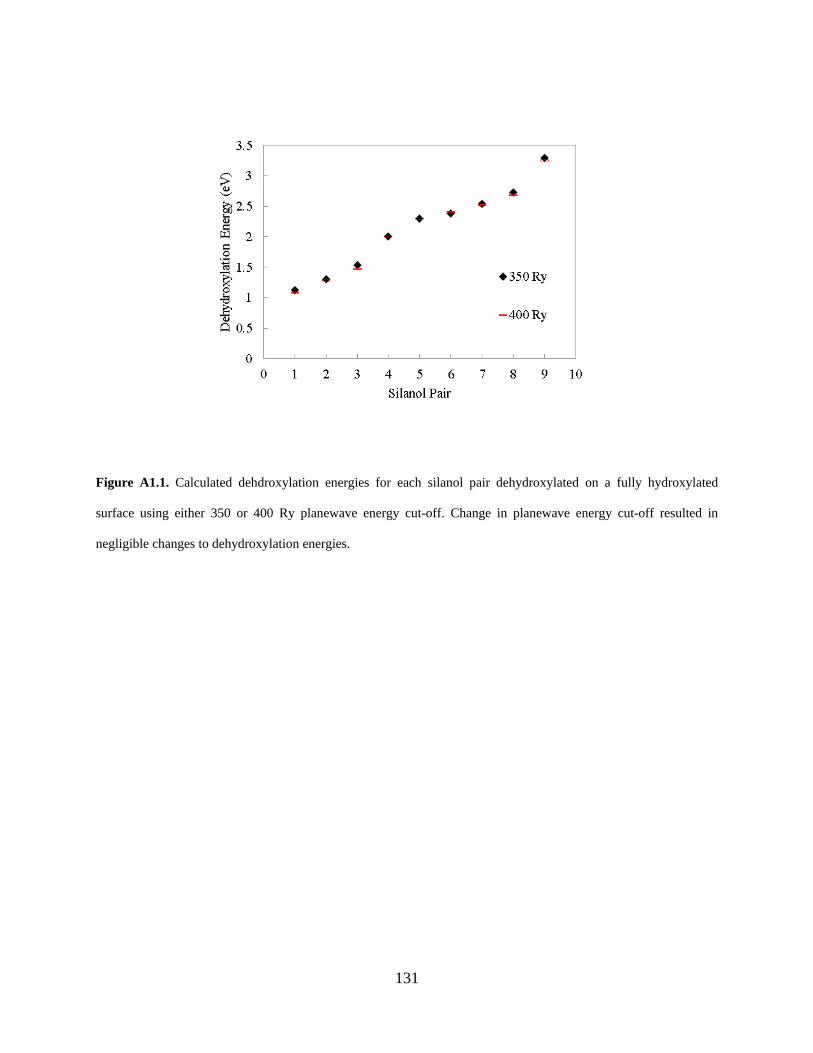
131
Figure A1.1. Calculated dehdroxylation energies for each silanol pair dehydroxylated on a fully hydroxylated
surface using either 350 or 400 Ry planewave energy cut-off. Change in planewave energy cut-off resulted in
negligible changes to dehydroxylation energies.
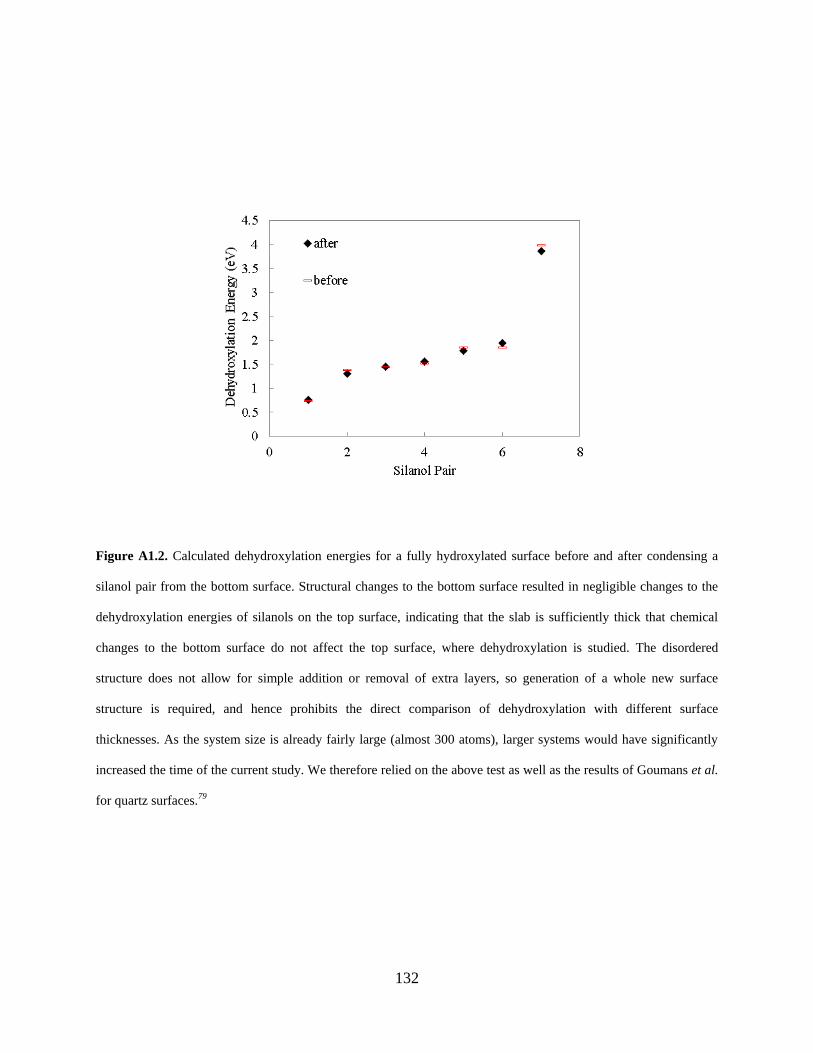
132
Figure A1.2. Calculated dehydroxylation energies for a fully hydroxylated surface before and after condensing a
silanol pair from the bottom surface. Structural changes to the bottom surface resulted in negligible changes to the
dehydroxylation energies of silanols on the top surface, indicating that the slab is sufficiently thick that chemical
changes to the bottom surface do not affect the top surface, where dehydroxylation is studied. The disordered
structure does not allow for simple addition or removal of extra layers, so generation of a whole new surface
structure is required, and hence prohibits the direct comparison of dehydroxylation with different surface
thicknesses. As the system size is already fairly large (almost 300 atoms), larger systems would have significantly
increased the time of the current study. We therefore relied on the above test as well as the results of Goumans et al.
for quartz surfaces.79
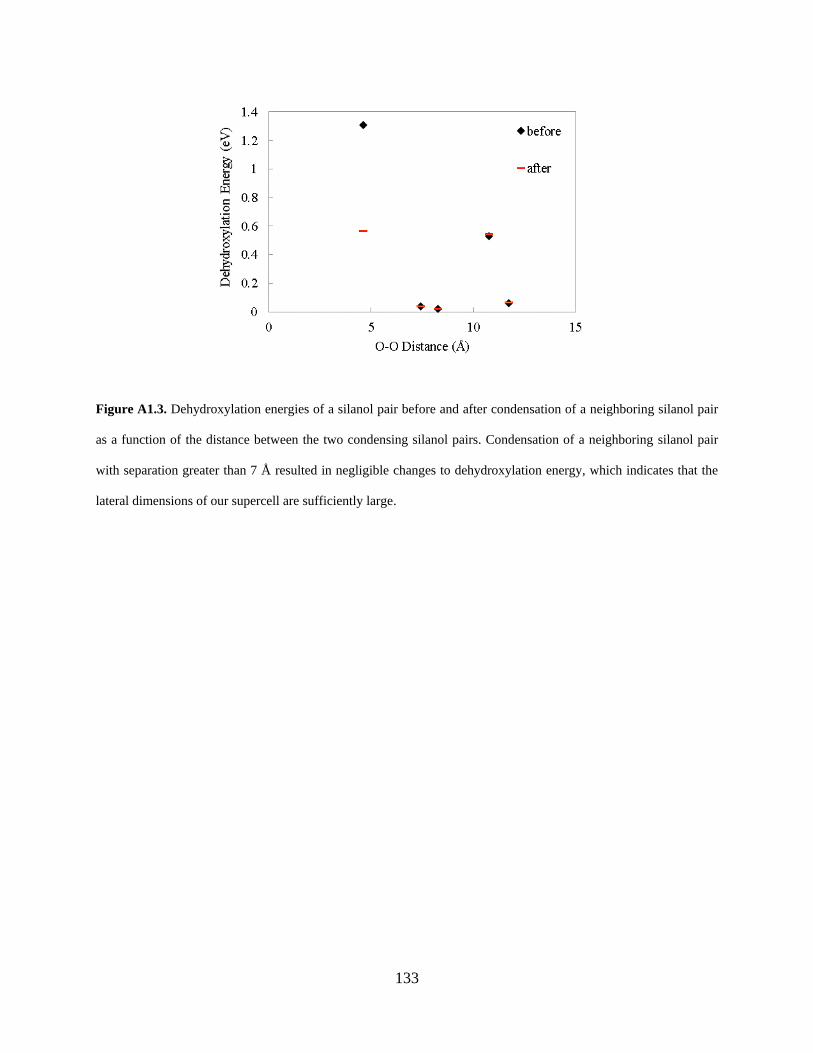
133
Figure A1.3. Dehydroxylation energies of a silanol pair before and after condensation of a neighboring silanol pair
as a function of the distance between the two condensing silanol pairs. Condensation of a neighboring silanol pair
with separation greater than 7 Å resulted in negligible changes to dehydroxylation energy, which indicates that the
lateral dimensions of our supercell are sufficiently large.
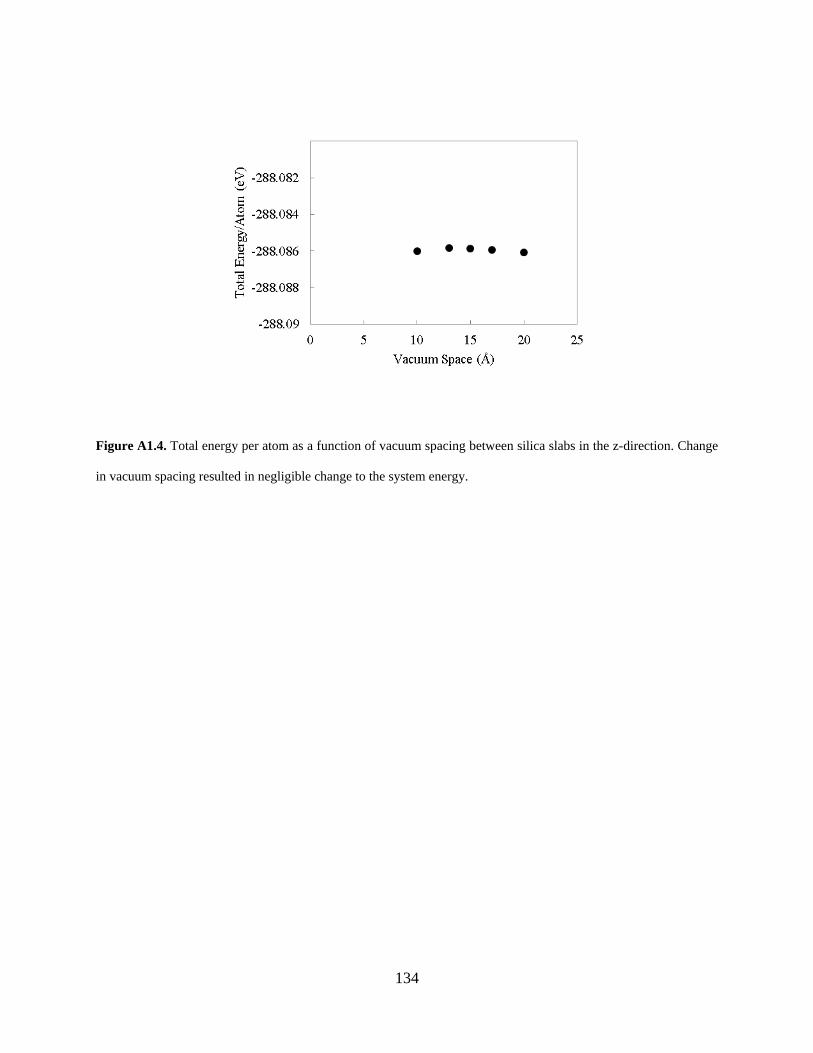
134
Figure A1.4. Total energy per atom as a function of vacuum spacing between silica slabs in the z-direction. Change
in vacuum spacing resulted in negligible change to the system energy.
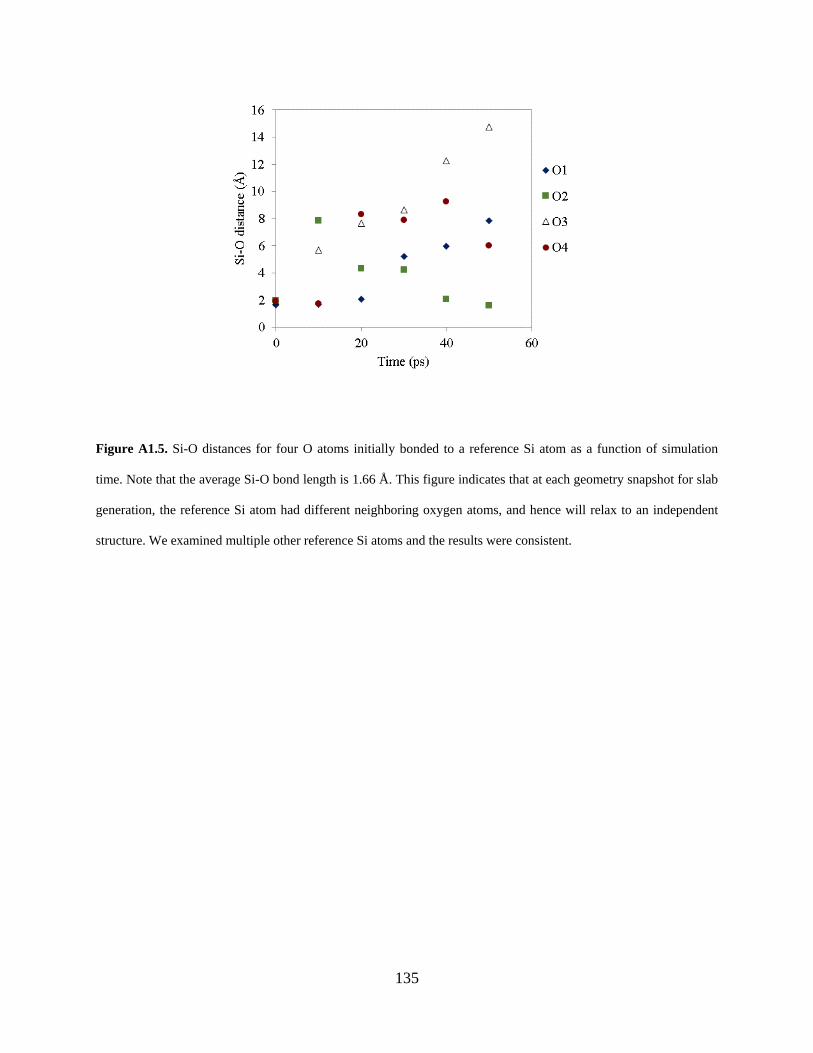
135
Figure A1.5. Si-O distances for four O atoms initially bonded to a reference Si atom as a function of simulation
time. Note that the average Si-O bond length is 1.66 Å. This figure indicates that at each geometry snapshot for slab
generation, the reference Si atom had different neighboring oxygen atoms, and hence will relax to an independent
structure. We examined multiple other reference Si atoms and the results were consistent.
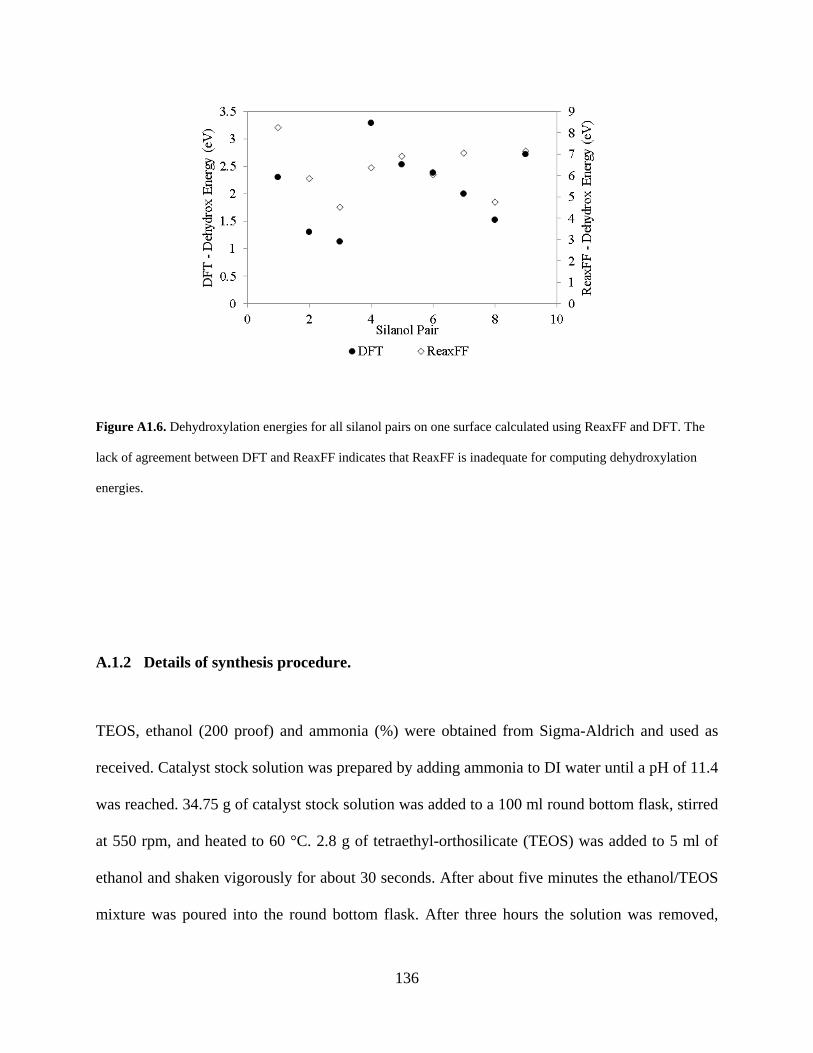
136
Figure A1.6. Dehydroxylation energies for all silanol pairs on one surface calculated using ReaxFF and DFT. The
lack of agreement between DFT and ReaxFF indicates that ReaxFF is inadequate for computing dehydroxylation
energies.
A.1.2 Details of synthesis procedure.
TEOS, ethanol (200 proof) and ammonia (%) were obtained from Sigma-Aldrich and used as
received. Catalyst stock solution was prepared by adding ammonia to DI water until a pH of 11.4
was reached. 34.75 g of catalyst stock solution was added to a 100 ml round bottom flask, stirred
at 550 rpm, and heated to 60 °C. 2.8 g of tetraethyl-orthosilicate (TEOS) was added to 5 ml of
ethanol and shaken vigorously for about 30 seconds. After about five minutes the ethanol/TEOS
mixture was poured into the round bottom flask. After three hours the solution was removed,
137
separated using a filtered centrifuge, and dried at 50 °C. The dry particles were then calcined at
350 °C and soaked in water for 24 hours, at room temperature.
A.1.3 Details of Thermogravimetric Analysis.
Sample weight as a function of temperature was measured using a thermogravimetric analyzer
(Perkin-Elmer TGA-7). Approximately 6 mg of sample was heated inside the TGA cradle in a
stream of air (Grade 0.1; 20 sccm). The sample was heated to 200 °C at a ramp rate of 10 °C/min
and then held isothermal for approximately one hour, in order to remove all physisorbed water.
The sample was then heated to 900 °C at a rate of 5 °C/min.
A.1.4 Detailed Derivation of the Statistical Thermodynamics Model (Eq. 1.2).
The Gibbs free energy associated with a dehydroxylation step (i.e., the condensation of one
water molecule) is
. (A1.1)
The subscripts s and s-H2O denote the surface before and after removal of a water molecule and
H2O is a single ideal gas water molecule. The Gibbs free energy each system, i, can be written as
, (A1.2)
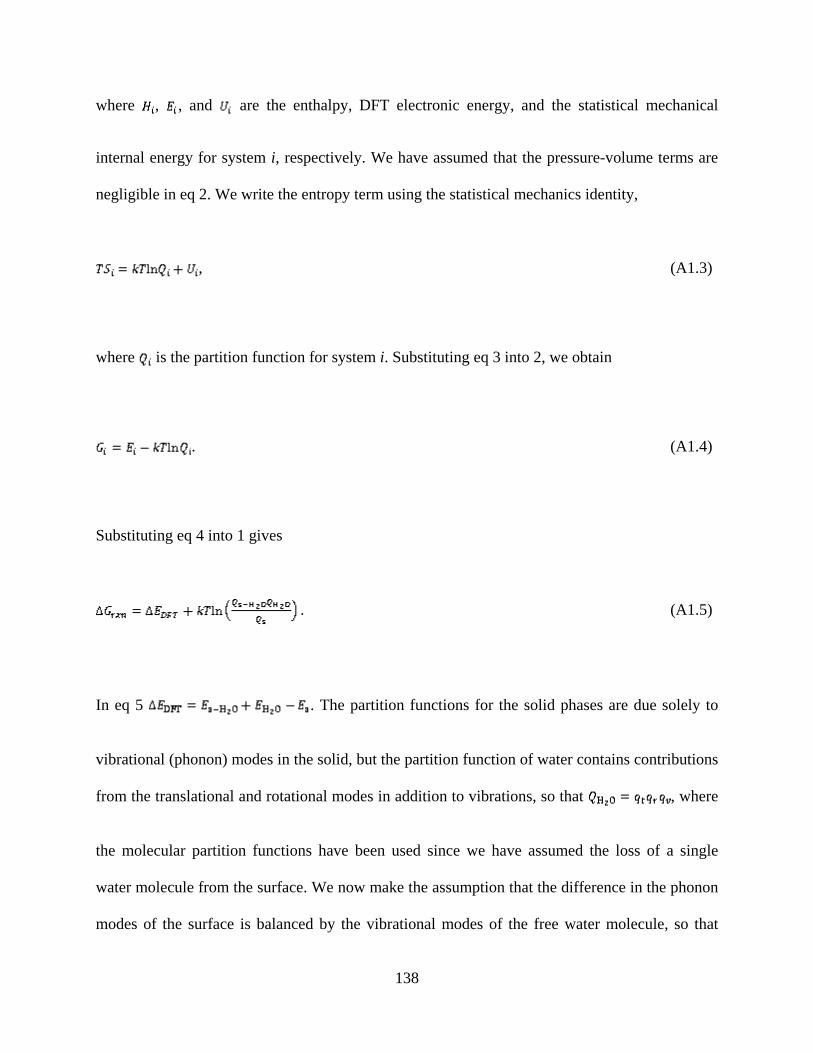
138
where , , and are the enthalpy, DFT electronic energy, and the statistical mechanical
internal energy for system i, respectively. We have assumed that the pressure-volume terms are
negligible in eq 2. We write the entropy term using the statistical mechanics identity,
, (A1.3)
where is the partition function for system i. Substituting eq 3 into 2, we obtain
. (A1.4)
Substituting eq 4 into 1 gives
. (A1.5)
In eq 5 . The partition functions for the solid phases are due solely to
vibrational (phonon) modes in the solid, but the partition function of water contains contributions
from the translational and rotational modes in addition to vibrations, so that , where
the molecular partition functions have been used since we have assumed the loss of a single
water molecule from the surface. We now make the assumption that the difference in the phonon
modes of the surface is balanced by the vibrational modes of the free water molecule, so that
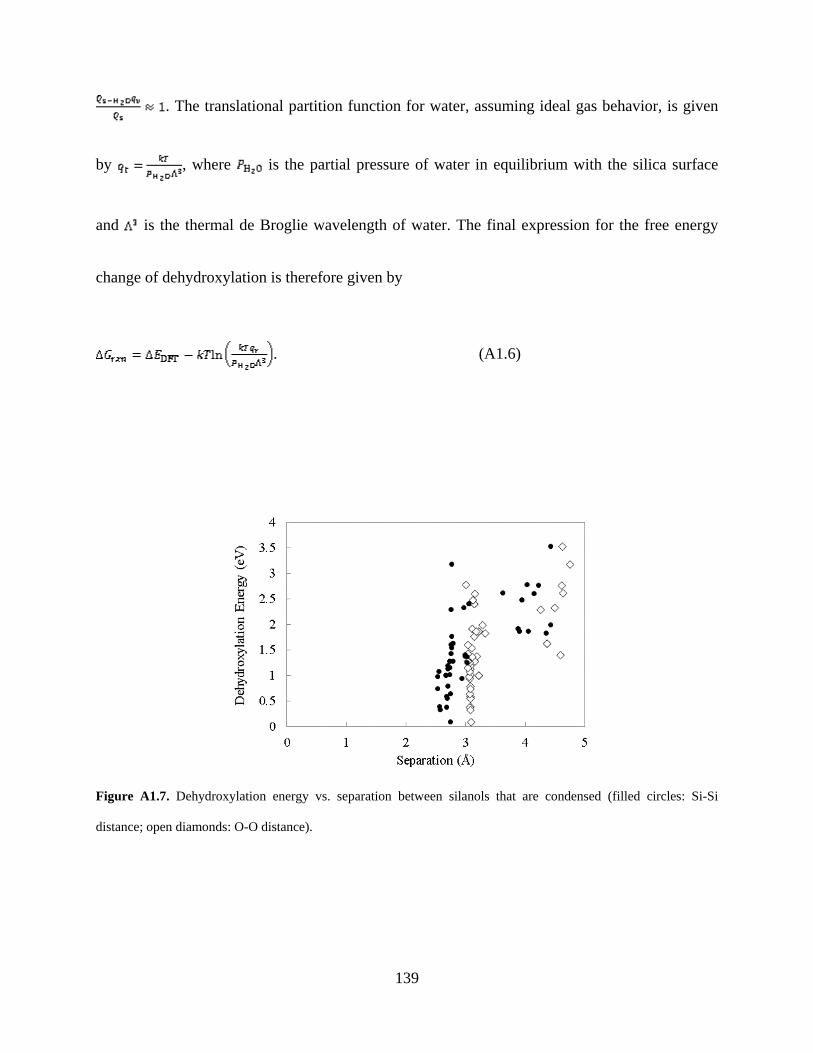
139
. The translational partition function for water, assuming ideal gas behavior, is given
by , where is the partial pressure of water in equilibrium with the silica surface
and is the thermal de Broglie wavelength of water. The final expression for the free energy
change of dehydroxylation is therefore given by
. (A1.6)
Figure A1.7. Dehydroxylation energy vs. separation between silanols that are condensed (filled circles: Si-Si
distance; open diamonds: O-O distance).
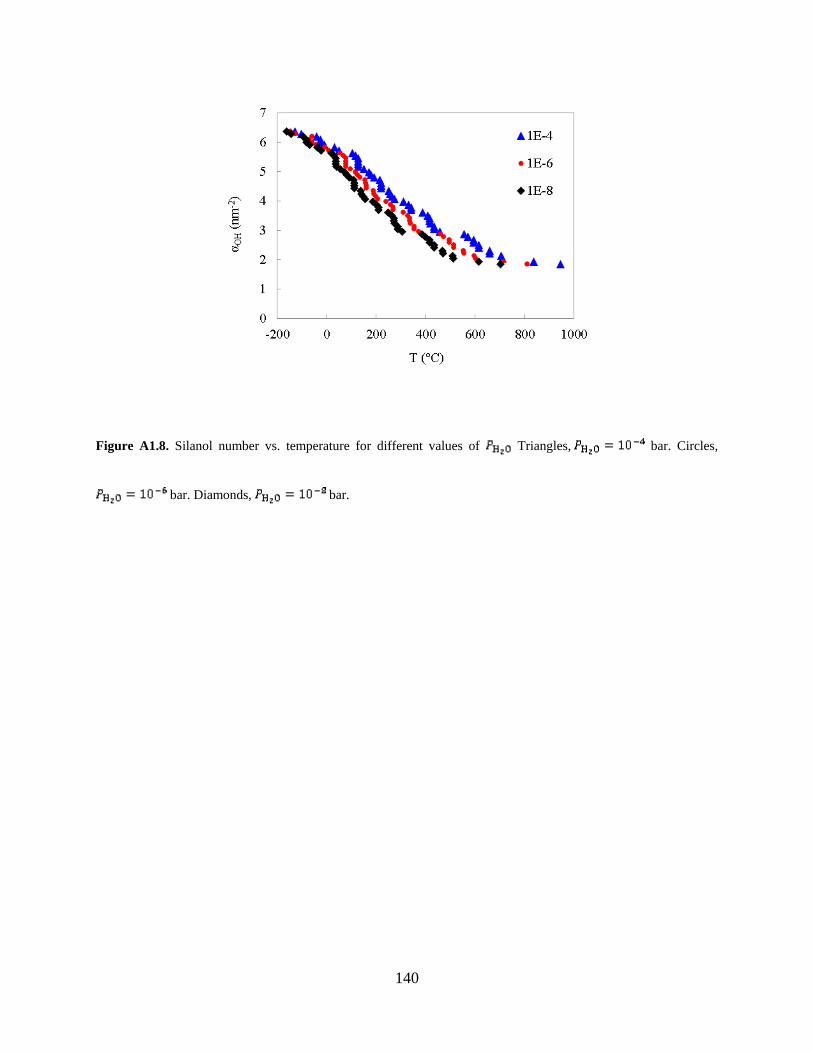
140
Figure A1.8. Silanol number vs. temperature for different values of Triangles, bar. Circles,
bar. Diamonds, bar.
141
Figure A1.9. Silanol distribution for each of the five surfaces studied: A, B, C, D, and E. Solid lines are
experimentally reported silanol distributions from Zhuravlev.52
A B
C E
E
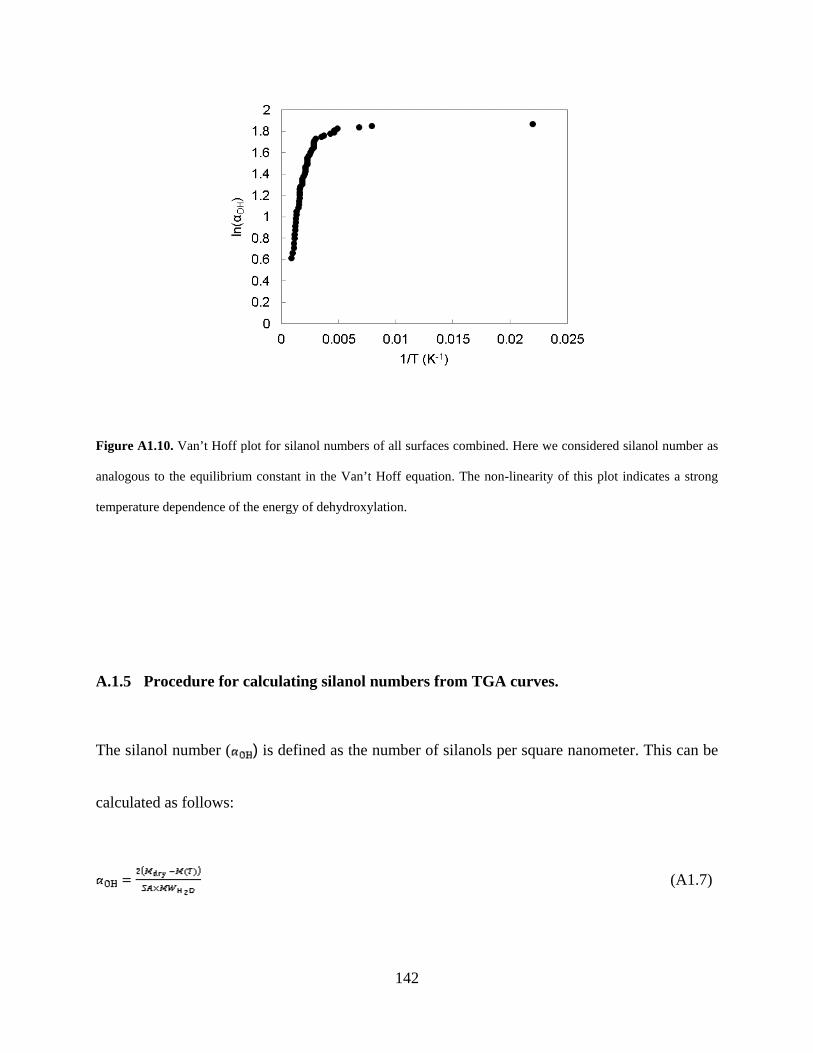
142
Figure A1.10. Van’t Hoff plot for silanol numbers of all surfaces combined. Here we considered silanol number as
analogous to the equilibrium constant in the Van’t Hoff equation. The non-linearity of this plot indicates a strong
temperature dependence of the energy of dehydroxylation.
A.1.5 Procedure for calculating silanol numbers from TGA curves.
The silanol number ( ) is defined as the number of silanols per square nanometer. This can be
calculated as follows:
(A1.7)
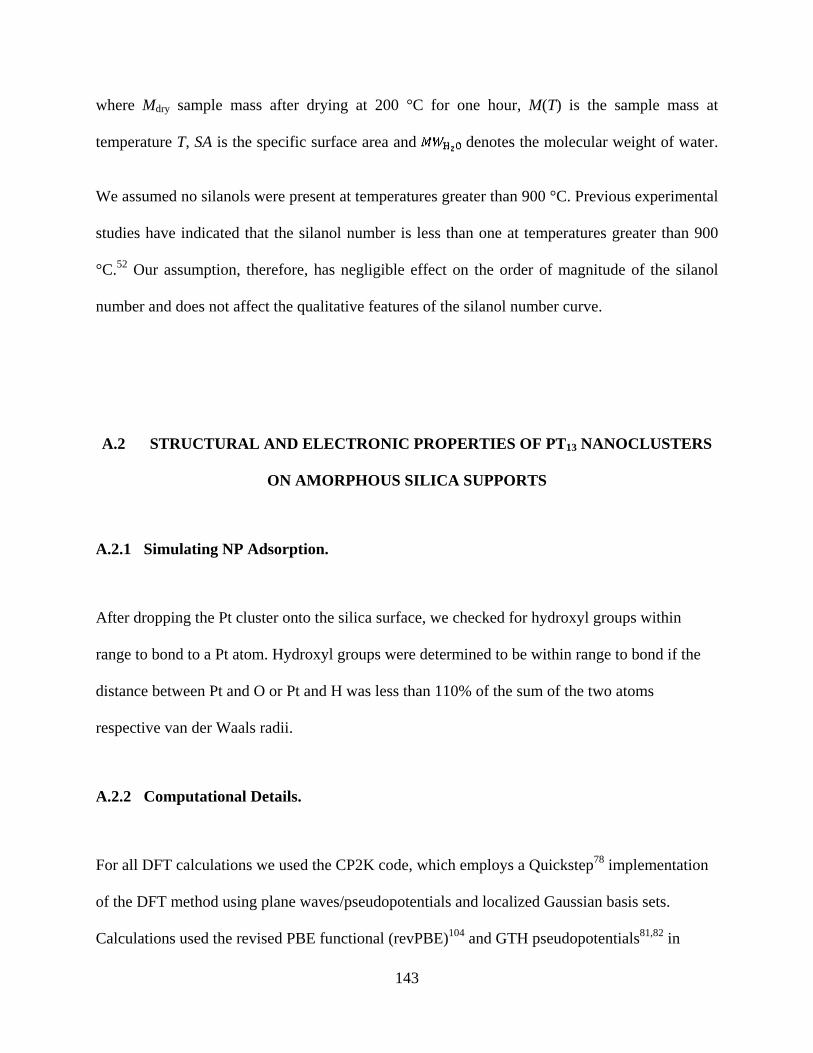
143
where Mdry sample mass after drying at 200 °C for one hour, M(T) is the sample mass at
temperature T, SA is the specific surface area and denotes the molecular weight of water.
We assumed no silanols were present at temperatures greater than 900 °C. Previous experimental
studies have indicated that the silanol number is less than one at temperatures greater than 900
°C.52 Our assumption, therefore, has negligible effect on the order of magnitude of the silanol
number and does not affect the qualitative features of the silanol number curve.
A.2 STRUCTURAL AND ELECTRONIC PROPERTIES OF PT13 NANOCLUSTERS
ON AMORPHOUS SILICA SUPPORTS
A.2.1 Simulating NP Adsorption.
After dropping the Pt cluster onto the silica surface, we checked for hydroxyl groups within
range to bond to a Pt atom. Hydroxyl groups were determined to be within range to bond if the
distance between Pt and O or Pt and H was less than 110% of the sum of the two atoms
respective van der Waals radii.
A.2.2 Computational Details.
For all DFT calculations we used the CP2K code, which employs a Quickstep78 implementation
of the DFT method using plane waves/pseudopotentials and localized Gaussian basis sets.
Calculations used the revised PBE functional (revPBE)104 and GTH pseudopotentials81,82 in
144
conjunction with short range double-ζ basis sets with polarization functions (SR-DZVP).105 We
used a 350 Rydberg energy cutoff for the plane wave basis set. All surface slabs were relaxed
using CP2K treated as periodic in all directions with at least 20 Å of vacuum between slabs to
eliminate interactions between the periodic images of the surface slabs. To reduce computational
cost, all relaxation calculations were spin-restricted. Electronic analysis calculations (frontier
orbital analysis) were performed with spin-polarized DFT. Validation of the planewave energy
cutoff, basis sets, vacuum spacing and spin-restricted relaxation are shown below. Atomic partial
charges were calculated using the Bader Charge Analysis code (version 0.28a) from the
Henkelman Group.135,136 All other post-processing analyses were calculated using in-house
Python codes.
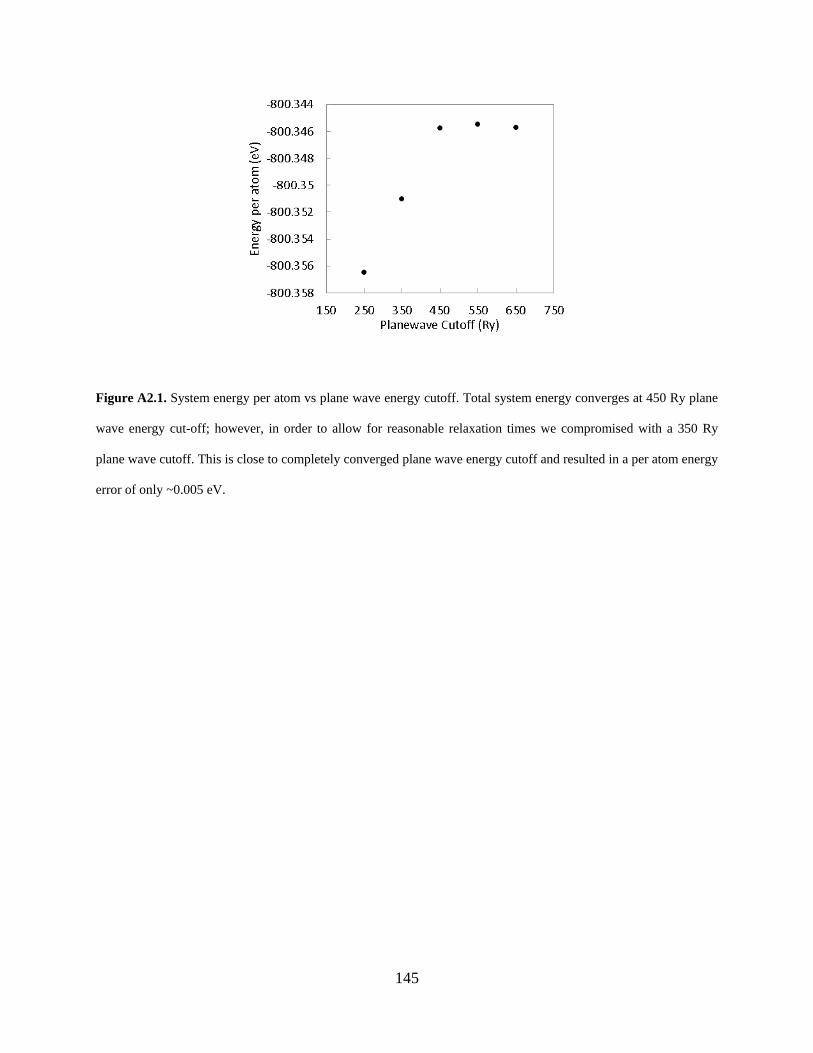
145
Figure A2.1. System energy per atom vs plane wave energy cutoff. Total system energy converges at 450 Ry plane
wave energy cut-off; however, in order to allow for reasonable relaxation times we compromised with a 350 Ry
plane wave cutoff. This is close to completely converged plane wave energy cutoff and resulted in a per atom energy
error of only ~0.005 eV.
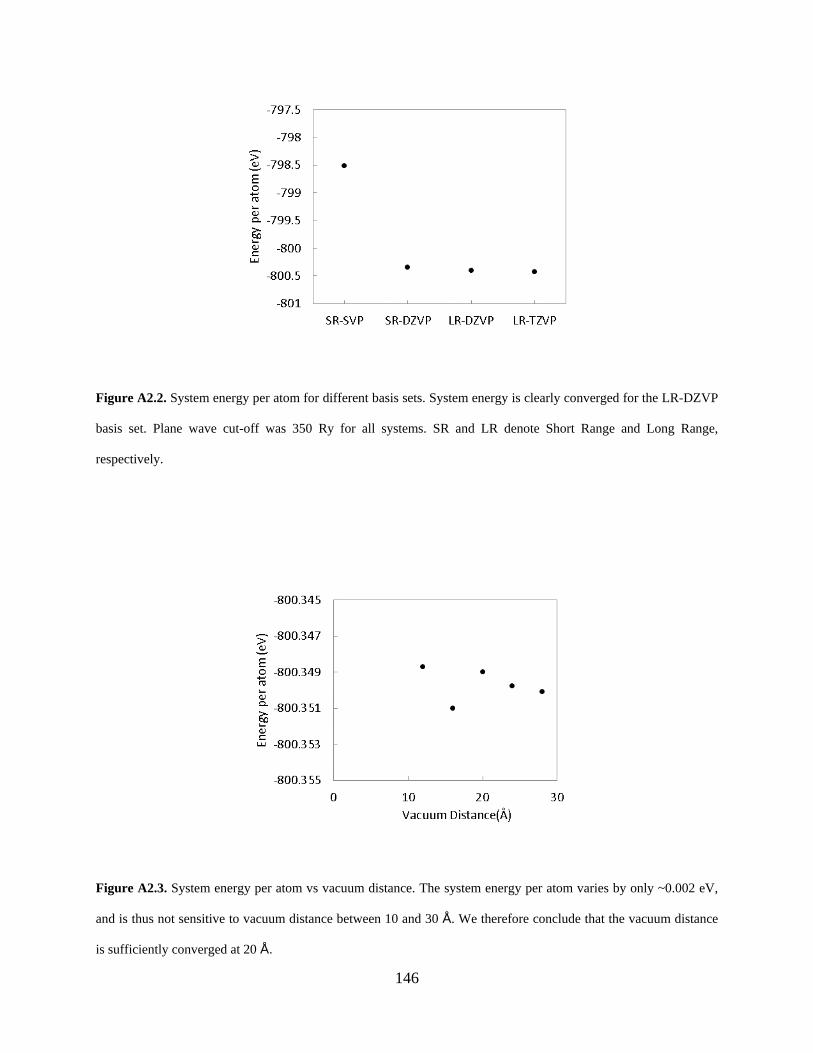
146
Figure A2.2. System energy per atom for different basis sets. System energy is clearly converged for the LR-DZVP
basis set. Plane wave cut-off was 350 Ry for all systems. SR and LR denote Short Range and Long Range,
respectively.
Figure A2.3. System energy per atom vs vacuum distance. The system energy per atom varies by only ~0.002 eV,
and is thus not sensitive to vacuum distance between 10 and 30 Å. We therefore conclude that the vacuum distance
is sufficiently converged at 20 Å.
147
A.2.3 Spin-restricted validation.
We relaxed all systems in this study using spin-restricted DFT. To test the validity of this
approximation, we first calculated single-point energies of some of the final structures using
spin-polarized DFT and found that the system was not spin polarized, having energies that are
essentially identical. We also allowed final structures to further relax using spin-polarized DFT
and again found no spin in these systems.
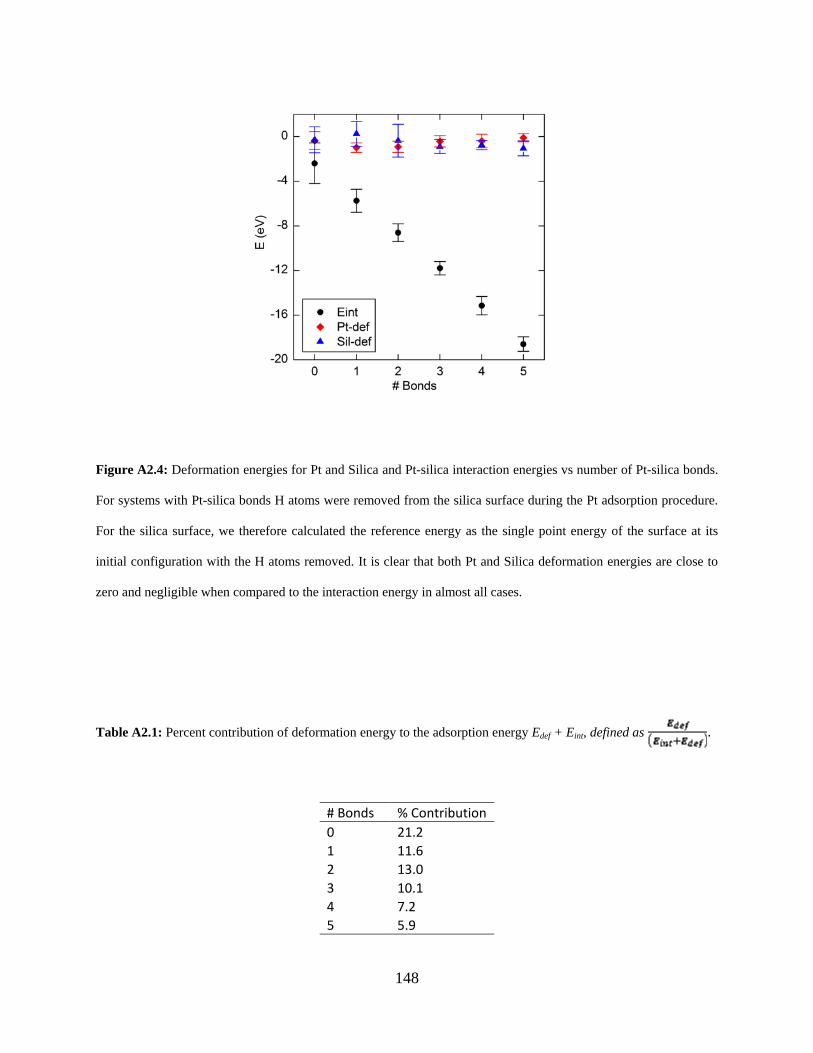
148
Figure A2.4: Deformation energies for Pt and Silica and Pt-silica interaction energies vs number of Pt-silica bonds.
For systems with Pt-silica bonds H atoms were removed from the silica surface during the Pt adsorption procedure.
For the silica surface, we therefore calculated the reference energy as the single point energy of the surface at its
initial configuration with the H atoms removed. It is clear that both Pt and Silica deformation energies are close to
zero and negligible when compared to the interaction energy in almost all cases.
Table A2.1: Percent contribution of deformation energy to the adsorption energy Edef + Eint, defined as .
# Bonds % Contribution 0 21.2 1 11.6 2 13.0 3 10.1 4 7.2 5 5.9
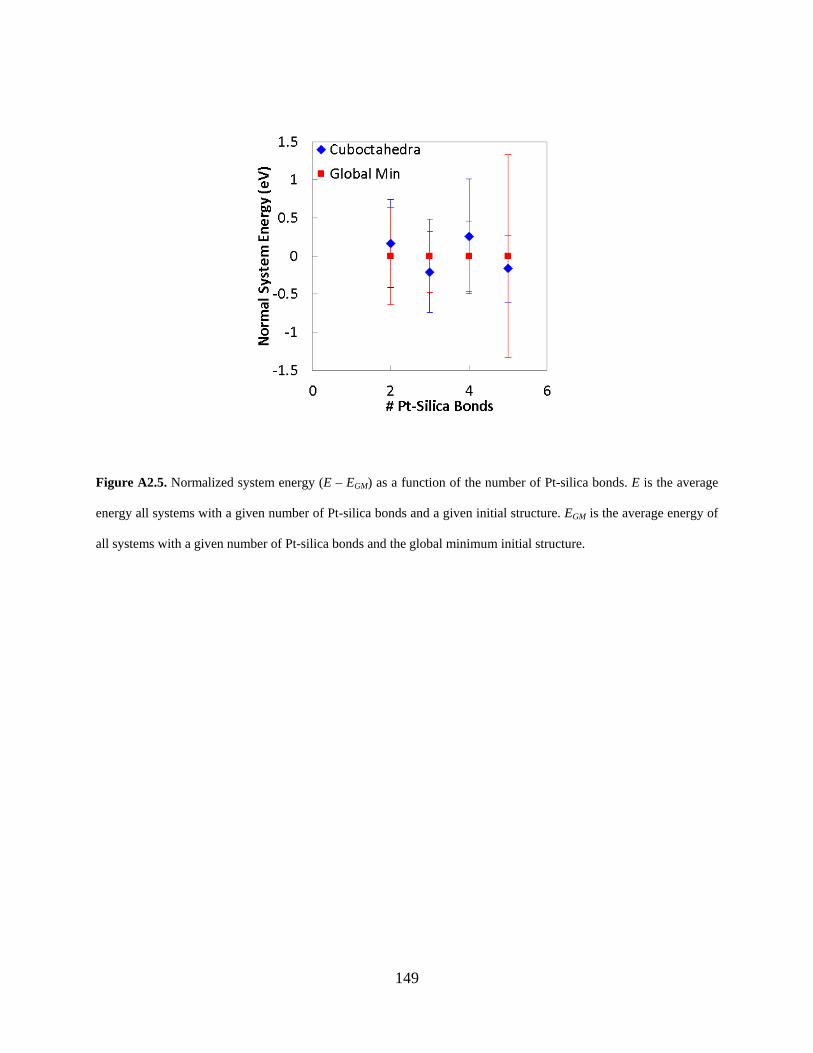
149
Figure A2.5. Normalized system energy (E – EGM) as a function of the number of Pt-silica bonds. E is the average
energy all systems with a given number of Pt-silica bonds and a given initial structure. EGM is the average energy of
all systems with a given number of Pt-silica bonds and the global minimum initial structure.
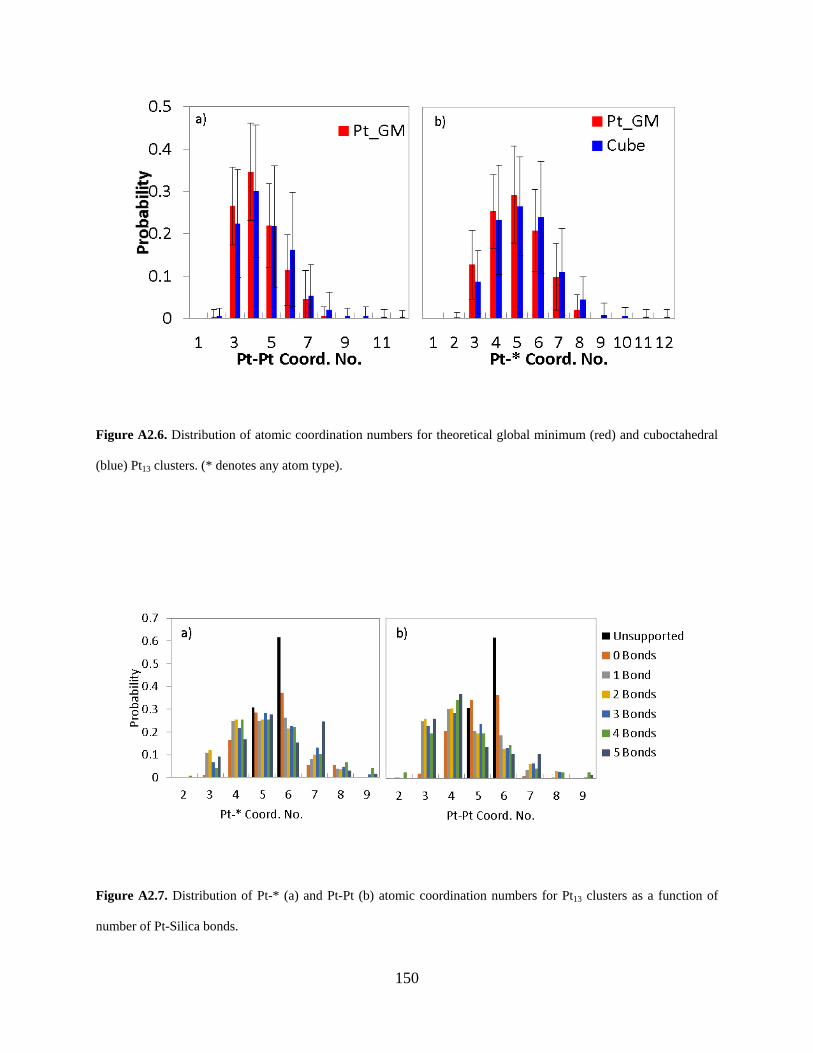
150
Figure A2.6. Distribution of atomic coordination numbers for theoretical global minimum (red) and cuboctahedral
(blue) Pt13 clusters. (* denotes any atom type).
Figure A2.7. Distribution of Pt-* (a) and Pt-Pt (b) atomic coordination numbers for Pt13 clusters as a function of
number of Pt-Silica bonds.
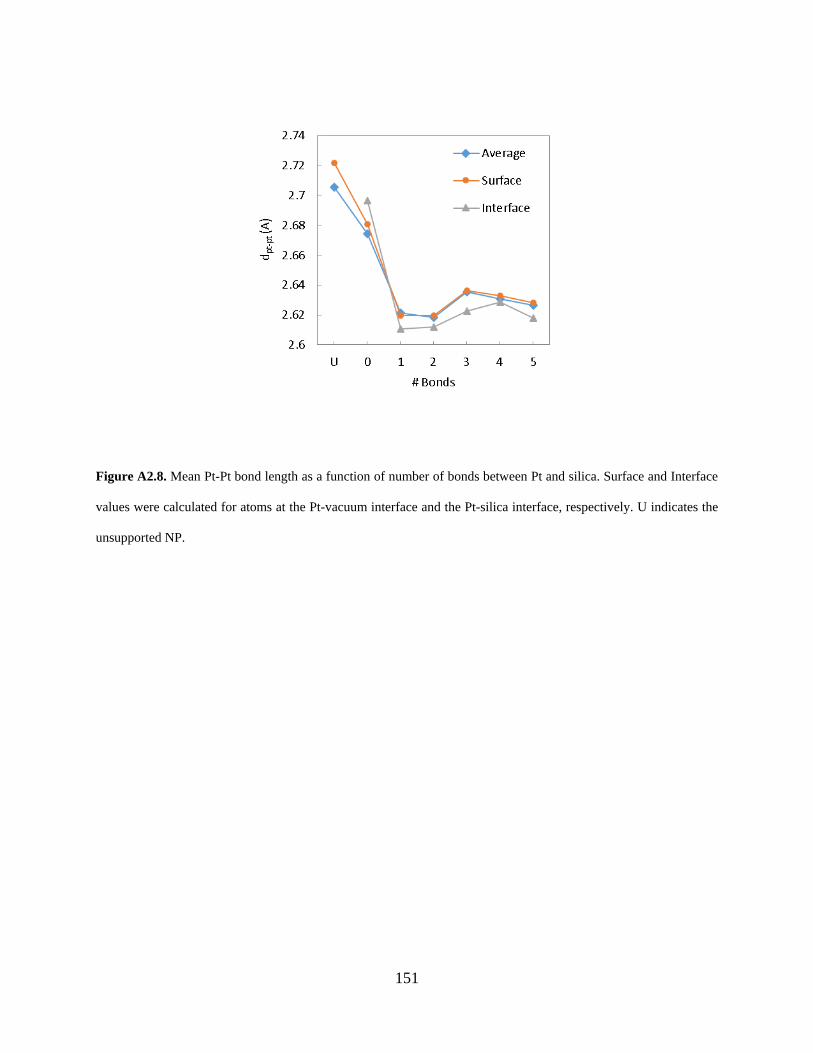
151
Figure A2.8. Mean Pt-Pt bond length as a function of number of bonds between Pt and silica. Surface and Interface
values were calculated for atoms at the Pt-vacuum interface and the Pt-silica interface, respectively. U indicates the
unsupported NP.
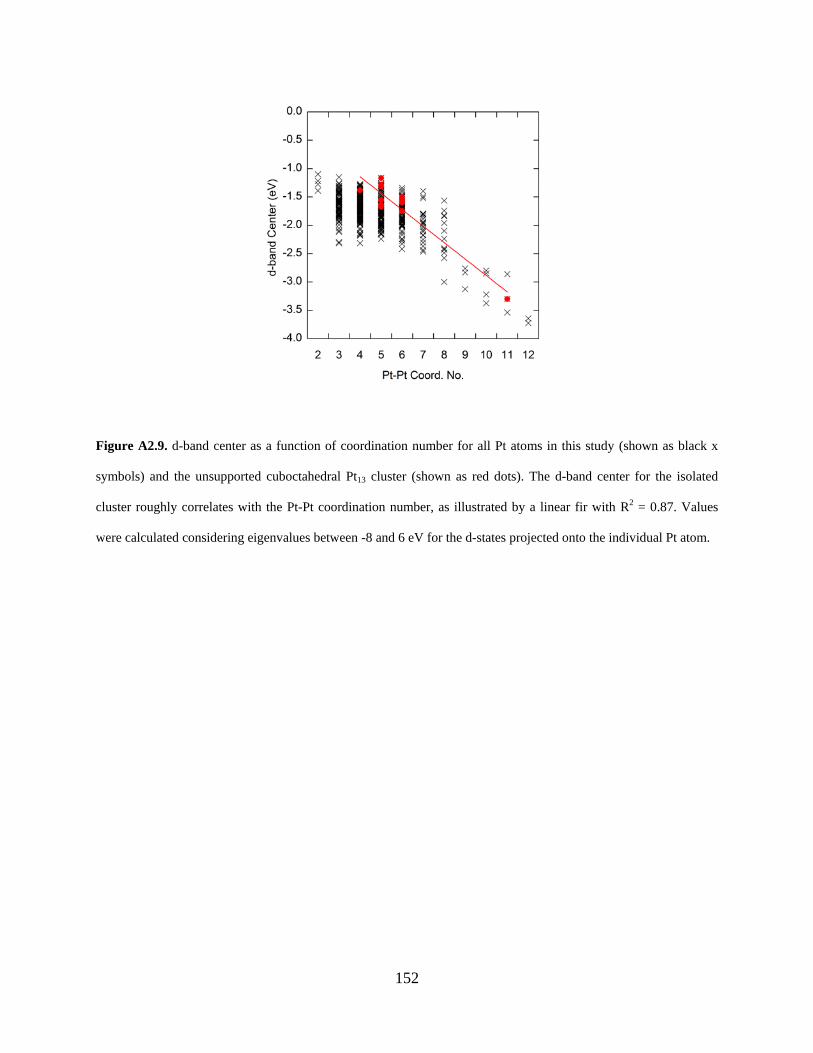
152
Figure A2.9. d-band center as a function of coordination number for all Pt atoms in this study (shown as black x
symbols) and the unsupported cuboctahedral Pt13 cluster (shown as red dots). The d-band center for the isolated
cluster roughly correlates with the Pt-Pt coordination number, as illustrated by a linear fir with R2 = 0.87. Values
were calculated considering eigenvalues between -8 and 6 eV for the d-states projected onto the individual Pt atom.
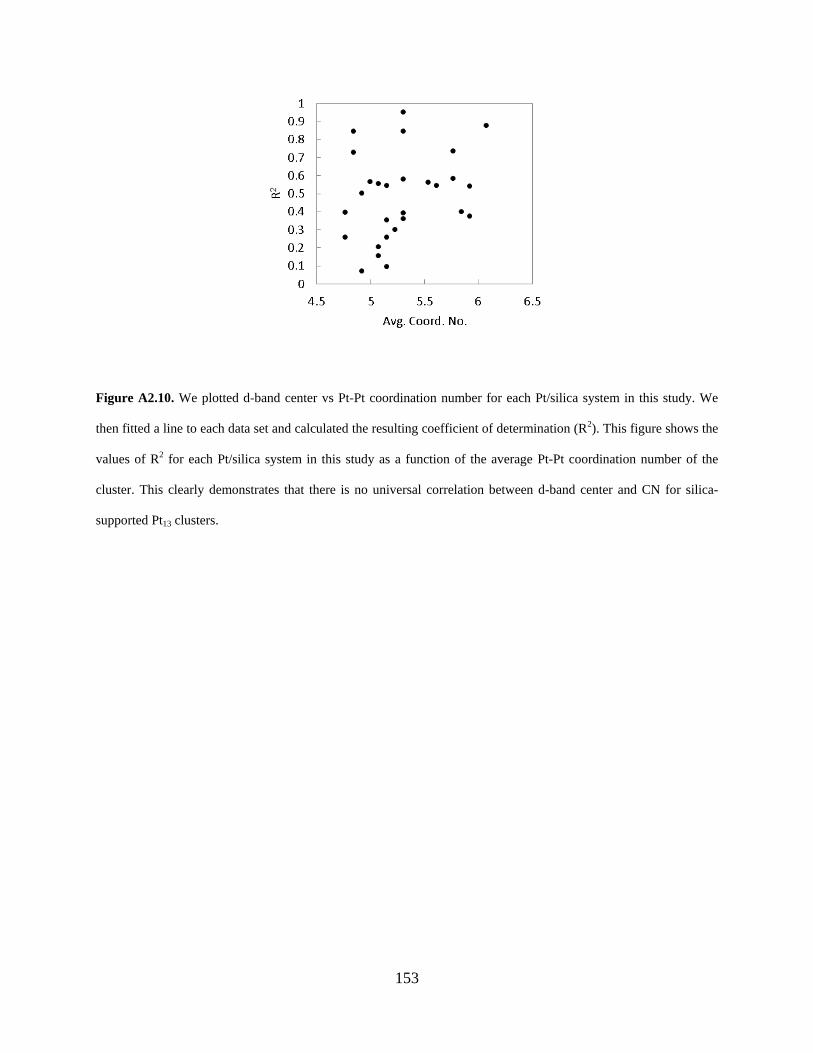
153
Figure A2.10. We plotted d-band center vs Pt-Pt coordination number for each Pt/silica system in this study. We
then fitted a line to each data set and calculated the resulting coefficient of determination (R2). This figure shows the
values of R2 for each Pt/silica system in this study as a function of the average Pt-Pt coordination number of the
cluster. This clearly demonstrates that there is no universal correlation between d-band center and CN for silica-
supported Pt13 clusters.
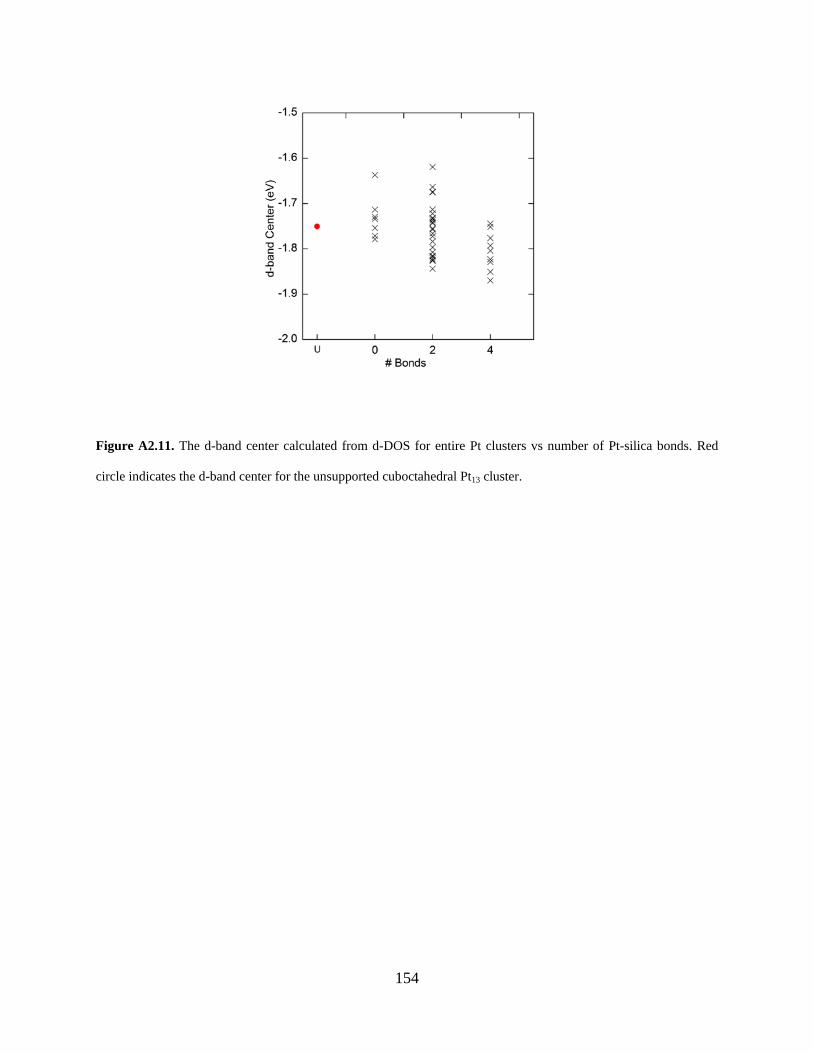
154
Figure A2.11. The d-band center calculated from d-DOS for entire Pt clusters vs number of Pt-silica bonds. Red
circle indicates the d-band center for the unsupported cuboctahedral Pt13 cluster.
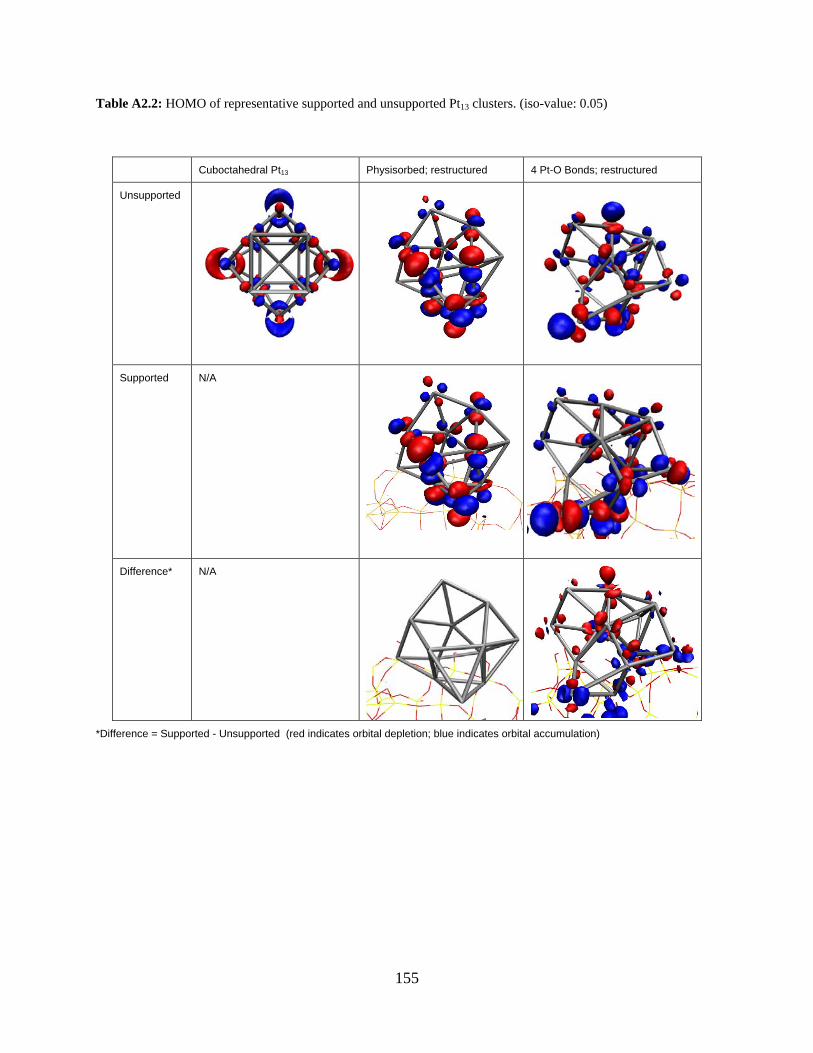
155
Table A2.2: HOMO of representative supported and unsupported Pt13 clusters. (iso-value: 0.05)
Cuboctahedral Pt13 Physisorbed; restructured 4 Pt-O Bonds; restructured
Unsupported
Supported N/A
Difference* N/A
*Difference = Supported - Unsupported (red indicates orbital depletion; blue indicates orbital accumulation)
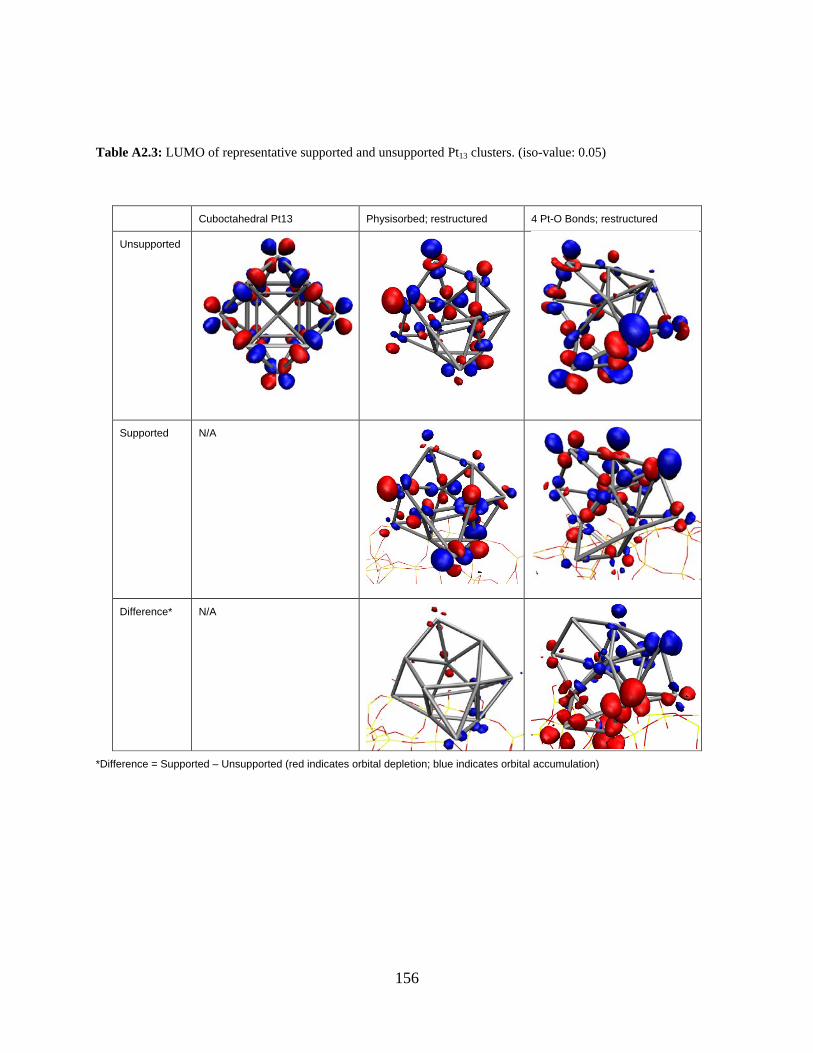
156
Table A2.3: LUMO of representative supported and unsupported Pt13 clusters. (iso-value: 0.05)
Cuboctahedral Pt13 Physisorbed; restructured 4 Pt-O Bonds; restructured
Unsupported
Supported N/A
Difference* N/A
*Difference = Supported – Unsupported (red indicates orbital depletion; blue indicates orbital accumulation)
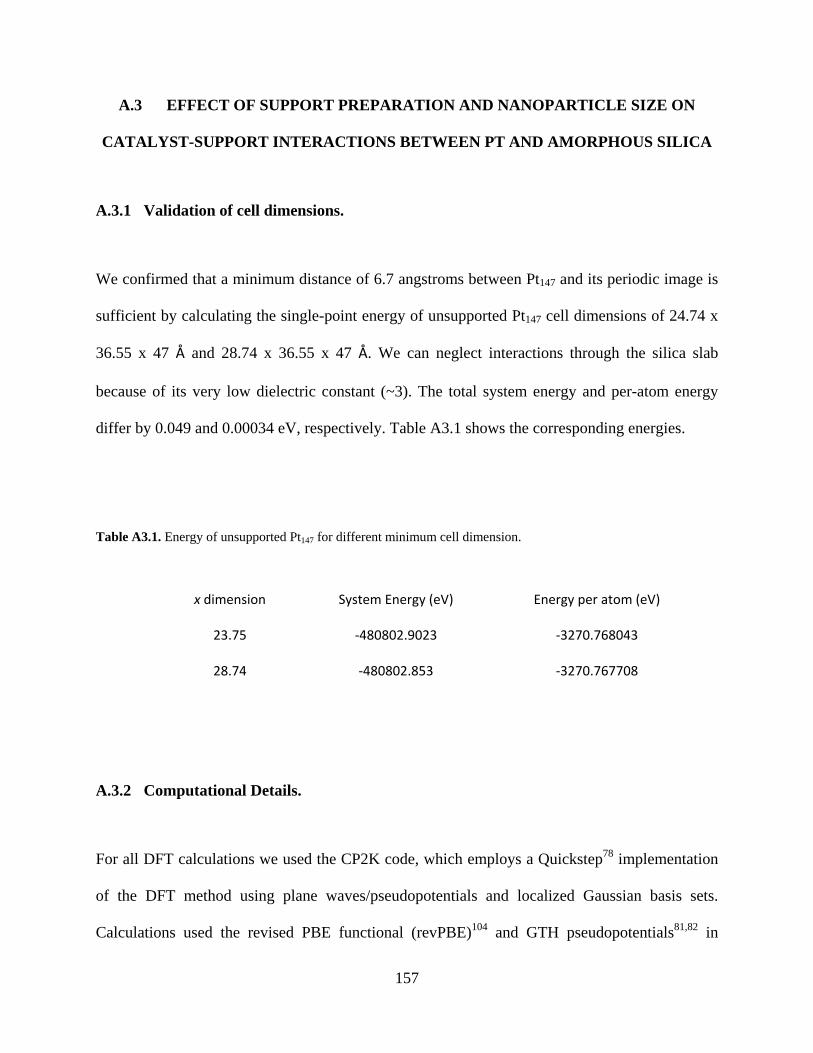
157
A.3 EFFECT OF SUPPORT PREPARATION AND NANOPARTICLE SIZE ON
CATALYST-SUPPORT INTERACTIONS BETWEEN PT AND AMORPHOUS SILICA
A.3.1 Validation of cell dimensions.
We confirmed that a minimum distance of 6.7 angstroms between Pt147 and its periodic image is
sufficient by calculating the single-point energy of unsupported Pt147 cell dimensions of 24.74 x
36.55 x 47 Å and 28.74 x 36.55 x 47 Å. We can neglect interactions through the silica slab
because of its very low dielectric constant (~3). The total system energy and per-atom energy
differ by 0.049 and 0.00034 eV, respectively. Table A3.1 shows the corresponding energies.
Table A3.1. Energy of unsupported Pt147 for different minimum cell dimension.
x dimension System Energy (eV) Energy per atom (eV)
23.75 -480802.9023 -3270.768043
28.74 -480802.853 -3270.767708
A.3.2 Computational Details.
For all DFT calculations we used the CP2K code, which employs a Quickstep78 implementation
of the DFT method using plane waves/pseudopotentials and localized Gaussian basis sets.
Calculations used the revised PBE functional (revPBE)104 and GTH pseudopotentials81,82 in

158
conjunction with short range double-ζ basis sets with polarization functions (SR-DZVP).105 We
used a 350 Ry energy cutoff and a 40 Ry rel_cutoff for the plane wave basis set. All surface slabs
were relaxed using CP2K treated as periodic in all directions with at least 20 Å of vacuum
between slabs to eliminate interactions between the periodic images of the surface slabs. To
reduce computational cost, all relaxation calculations were spin-restricted. Electronic analysis
calculations (frontier orbital analysis) were performed with spin-polarized DFT. Validation of
the planewave energy cutoff, basis sets, vacuum spacing and spin-restricted relaxation have been
reported elsewhere.152 Atomic partial charges were calculated using the Bader Charge Analysis
code (version 0.28a) from the Henkelman Group.135,136 All other post-processing analyses were
calculated using in-house Python codes.
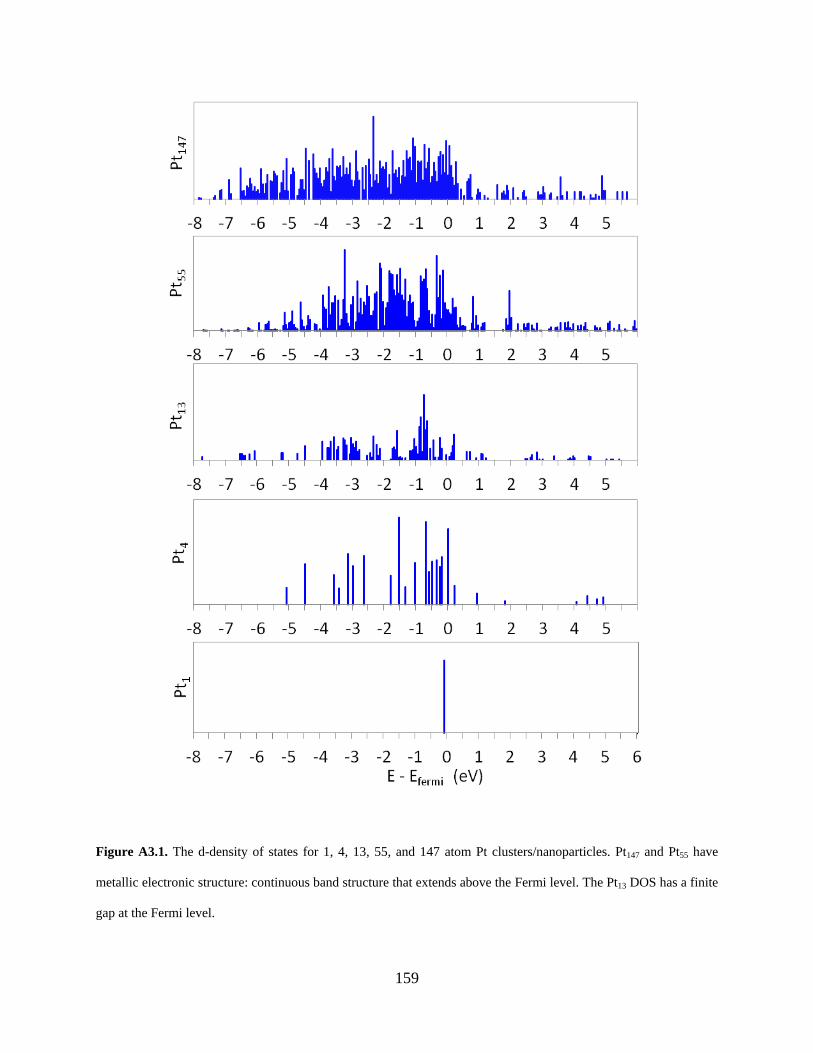
159
Figure A3.1. The d-density of states for 1, 4, 13, 55, and 147 atom Pt clusters/nanoparticles. Pt147 and Pt55 have
metallic electronic structure: continuous band structure that extends above the Fermi level. The Pt13 DOS has a finite
gap at the Fermi level.
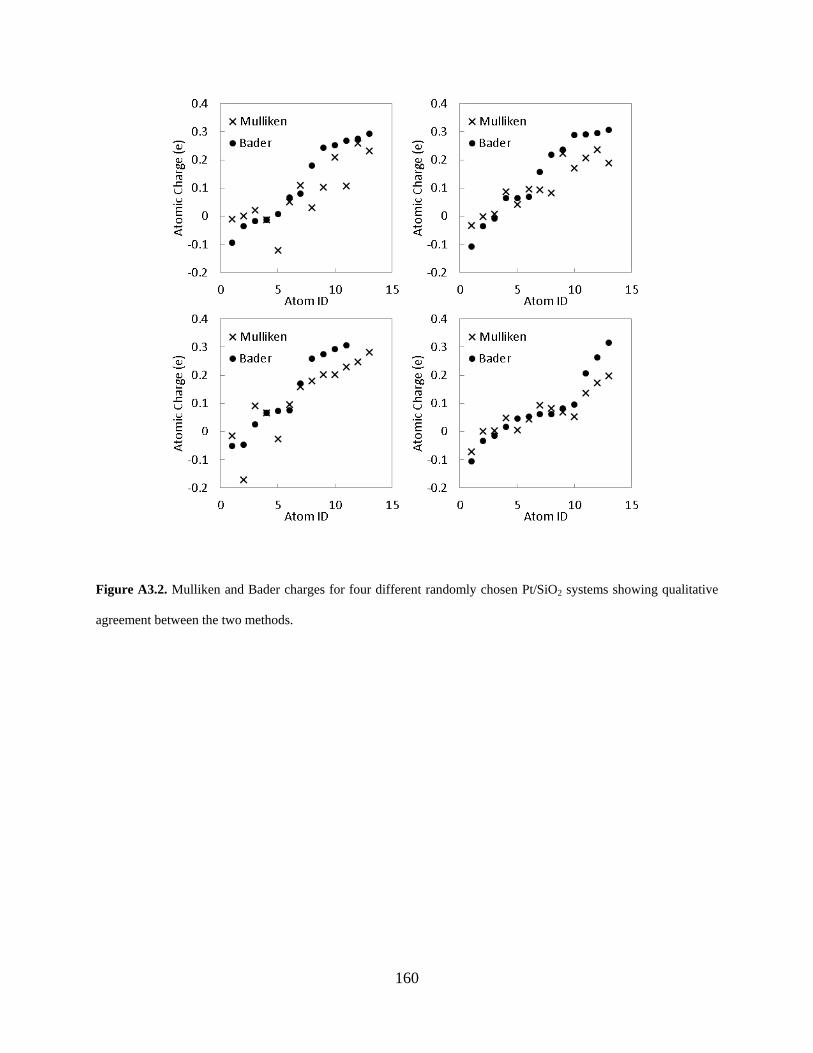
160
Figure A3.2. Mulliken and Bader charges for four different randomly chosen Pt/SiO2 systems showing qualitative
agreement between the two methods.
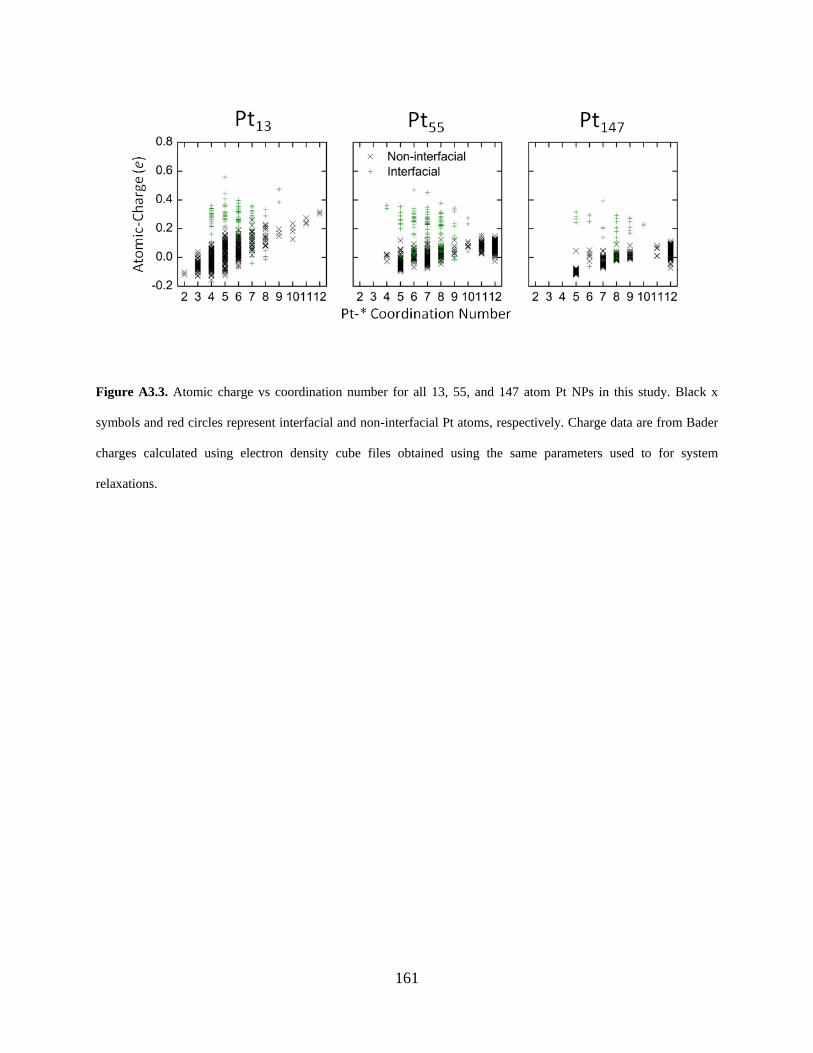
161
Figure A3.3. Atomic charge vs coordination number for all 13, 55, and 147 atom Pt NPs in this study. Black x
symbols and red circles represent interfacial and non-interfacial Pt atoms, respectively. Charge data are from Bader
charges calculated using electron density cube files obtained using the same parameters used to for system
relaxations.
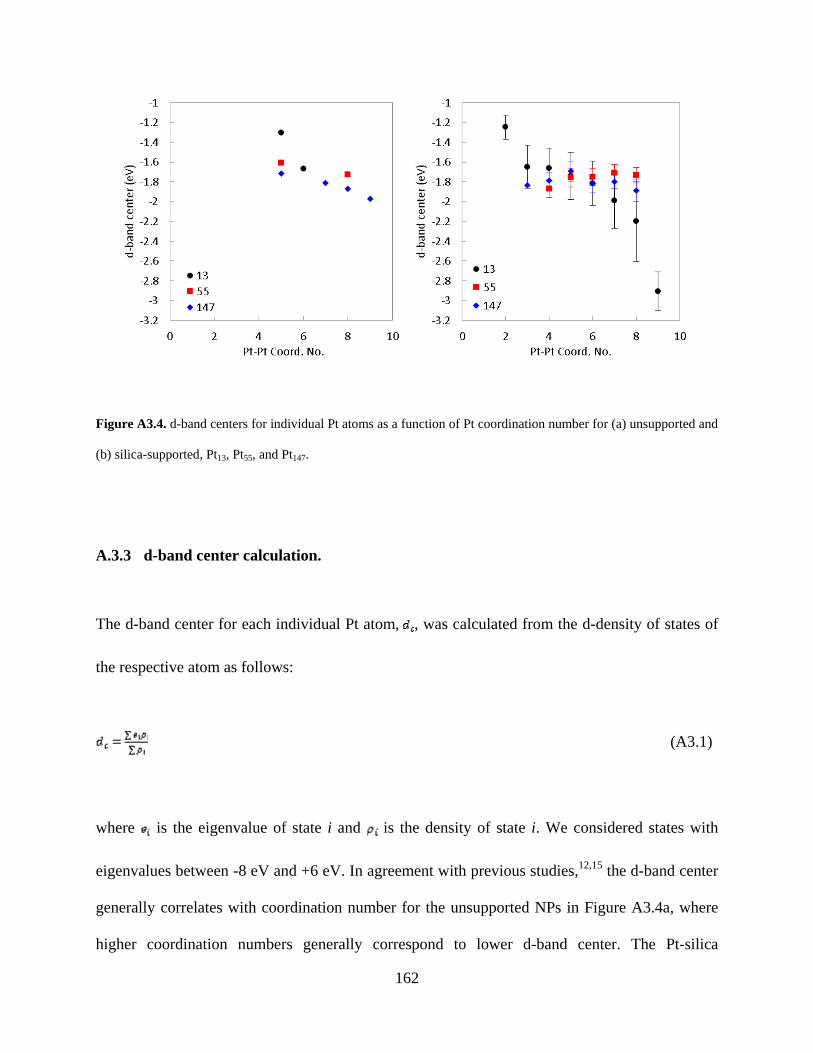
162
Figure A3.4. d-band centers for individual Pt atoms as a function of Pt coordination number for (a) unsupported and
(b) silica-supported, Pt13, Pt55, and Pt147.
A.3.3 d-band center calculation.
The d-band center for each individual Pt atom, , was calculated from the d-density of states of
the respective atom as follows:
(A3.1)
where is the eigenvalue of state i and is the density of state i. We considered states with
eigenvalues between -8 eV and +6 eV. In agreement with previous studies,12,15 the d-band center
generally correlates with coordination number for the unsupported NPs in Figure A3.4a, where
higher coordination numbers generally correspond to lower d-band center. The Pt-silica
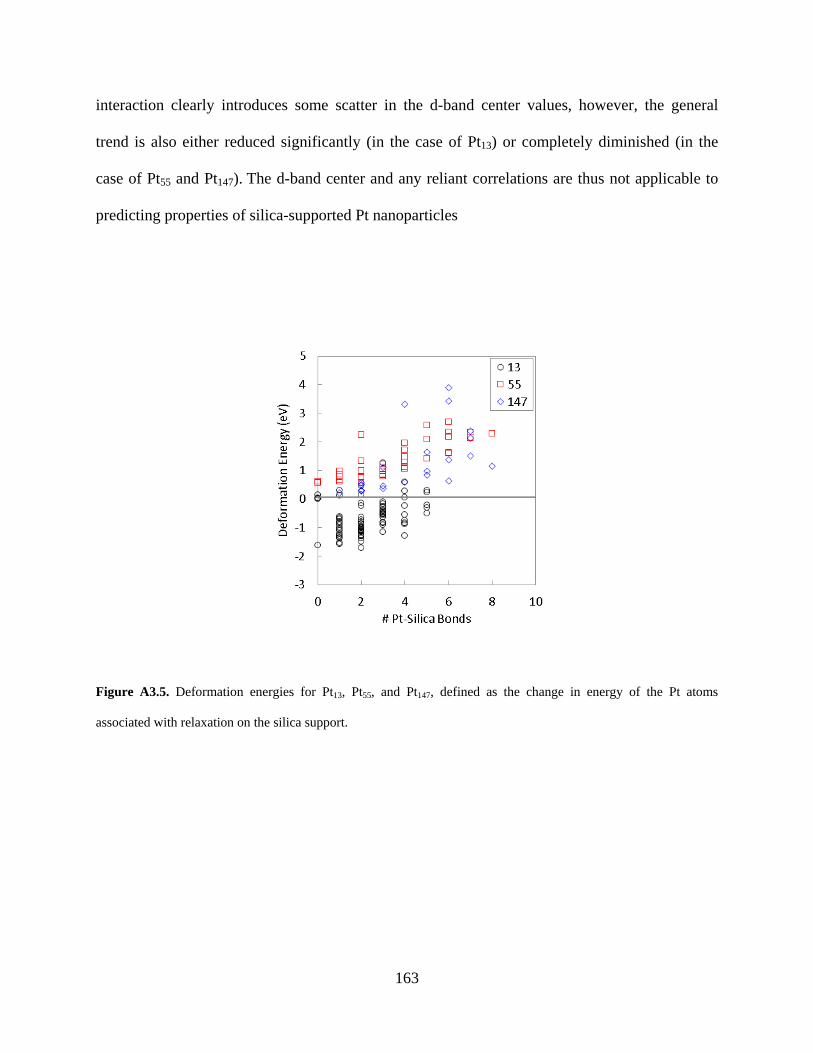
163
interaction clearly introduces some scatter in the d-band center values, however, the general
trend is also either reduced significantly (in the case of Pt13) or completely diminished (in the
case of Pt55 and Pt147). The d-band center and any reliant correlations are thus not applicable to
predicting properties of silica-supported Pt nanoparticles
Figure A3.5. Deformation energies for Pt13, Pt55, and Pt147, defined as the change in energy of the Pt atoms
associated with relaxation on the silica support.
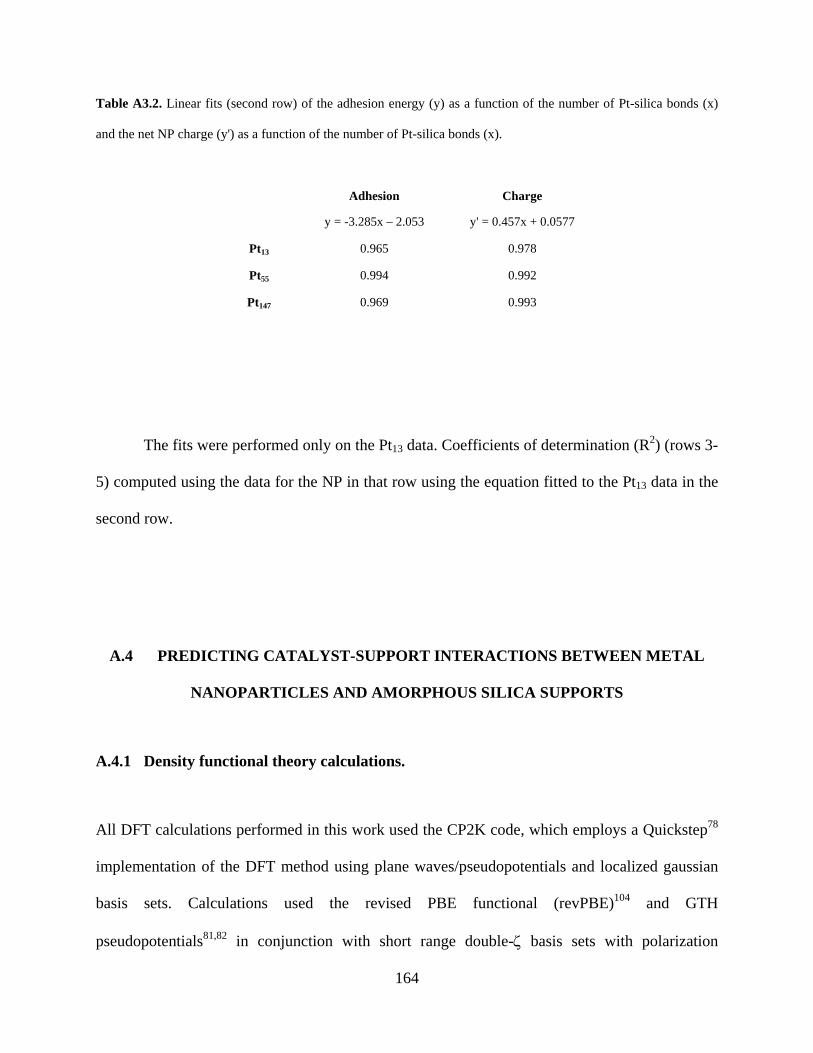
164
Table A3.2. Linear fits (second row) of the adhesion energy (y) as a function of the number of Pt-silica bonds (x)
and the net NP charge (y') as a function of the number of Pt-silica bonds (x).
Adhesion
y = -3.285x – 2.053
Charge
y' = 0.457x + 0.0577
Pt13 0.965 0.978
Pt55 0.994 0.992
Pt147 0.969 0.993
The fits were performed only on the Pt13 data. Coefficients of determination (R2) (rows 3-
5) computed using the data for the NP in that row using the equation fitted to the Pt13 data in the
second row.
A.4 PREDICTING CATALYST-SUPPORT INTERACTIONS BETWEEN METAL
NANOPARTICLES AND AMORPHOUS SILICA SUPPORTS
A.4.1 Density functional theory calculations.
All DFT calculations performed in this work used the CP2K code, which employs a Quickstep78
implementation of the DFT method using plane waves/pseudopotentials and localized gaussian
basis sets. Calculations used the revised PBE functional (revPBE)104 and GTH
pseudopotentials81,82 in conjunction with short range double-ζ basis sets with polarization
165
functions (SR-DZVP).105 All surface slabs were relaxed using CP2K treated as periodic in all
directions with at least 20 Å of vacuum between periodic images in the z dimension to eliminate
interactions between the periodic images of the surface slabs. The plane wave energy cutoff,
basis sets, vacuum spacing and spin-restricted relaxation for these systems have been validated
for these systems previously.130
A.4.2 Model amorphous silica surfaces.
We used periodic amorphous silica surface structures constructed from a model developed by
Ewing et al.103 to investigate NP-surface interactions. These model surface structures are based
on first-principles simulations and have been found to accurately predict hydroxyl density and
distribution of hydroxyl groups as a function of temperature without any adjustable
parameters.103 Five distinct model surfaces were generated and the hydroxyl density of each
system was adjusted using an algorithm to mimic a range of silica pretreatment temperatures
Tpre, giving a total of 56 different surface structures.103 For the DFT calculations in this work, we
use surface structures having high (4.5 nm-2) and low (1.6 nm-2) hydroxyl densities,
corresponding to low (200 °C) and high (570 °C) Tpre, respectively. For the discrete element
method calculations described below we use all 56 surface structures. The size of the unit cell we
used for Pt13 calculations was 23.7 Å × 18.3 Å × 32 Å having between 260 and 290 atoms,
depending on the corresponding Tpre . For 55- and 147-atom NPs we doubled the unit cell size
and used two identical copies of the silica slab side-by-side in the y direction (resulting in unit
cells containing 550 or 690 atoms and having dimensions of 23.7 Å × 36.6 Å × 37 Å for 55-atom
NP and 23.7 Å × 36.6 Å × 42 Å for 147-atom NP). The minimum distances between NPs and
their periodic images were 11.3, 11.7, and 6.7 Å for 13-, 55-, and 147-atom NPs, respectively.
166
We recently confirmed that 6.7 Å is sufficient separation to avoid significant error due to self-
interaction of the cluster with its periodic image.150
A.4.3 Metal nanoparticles.
For the majority of calculations in the present study we use magic number cuboctahedral NPs
because the symmetry is independent of size. To investigate the effects of NP geometry on the
catalyst-support interactions we also used a theoretical global minimum for Pt13 and slab
(elongated in the y dimension; 3 atomic layers thick) Pt55 and Pt147. All NP geometries used in
this study are shown in Figure 1. To calculate electronic structure correlations for NPs of
different composition we used 13-atom cuboctahedral NPs (Au, Pd, Fe, and Ni) and 147-atom
cuboctahedral NPs (Au and Pd).
We divided each of the silica surfaces for Pt13, Pt55, and Pt147 into grids of 20 (5×4), 9
(3×3) and 6 (3×2) adsorption locations, respectively. Taking into account the 4 different sets of
initial conditions (two NP orientations and two silica surface structures) we generated 80, 36, and
24 systems for DFT calculations of cuboctahedral Pt13, Pt55, and Pt147, respectively. Globaal
minimum Pt13Silica surfaces for all 13- and 147-atom Au, Pd, Ni, and Fe NPs were divided into
grids of 9 (3×3) and 6 (3×2), respectively. Taking into account two silica surface structures, we
generated 18 and 12 systems for DFT calculations of 13- and 147-atom Au, Pd, Ni, and Fe,
respectively. More details regarding our general methodology can be found in a previous
publication.130 Expedited DEM simulations were performed for all Pt NPs in this study. For all
of these DEM simulations, we divided each silica surface into grids of 80 (10×8) adsorption
locations.
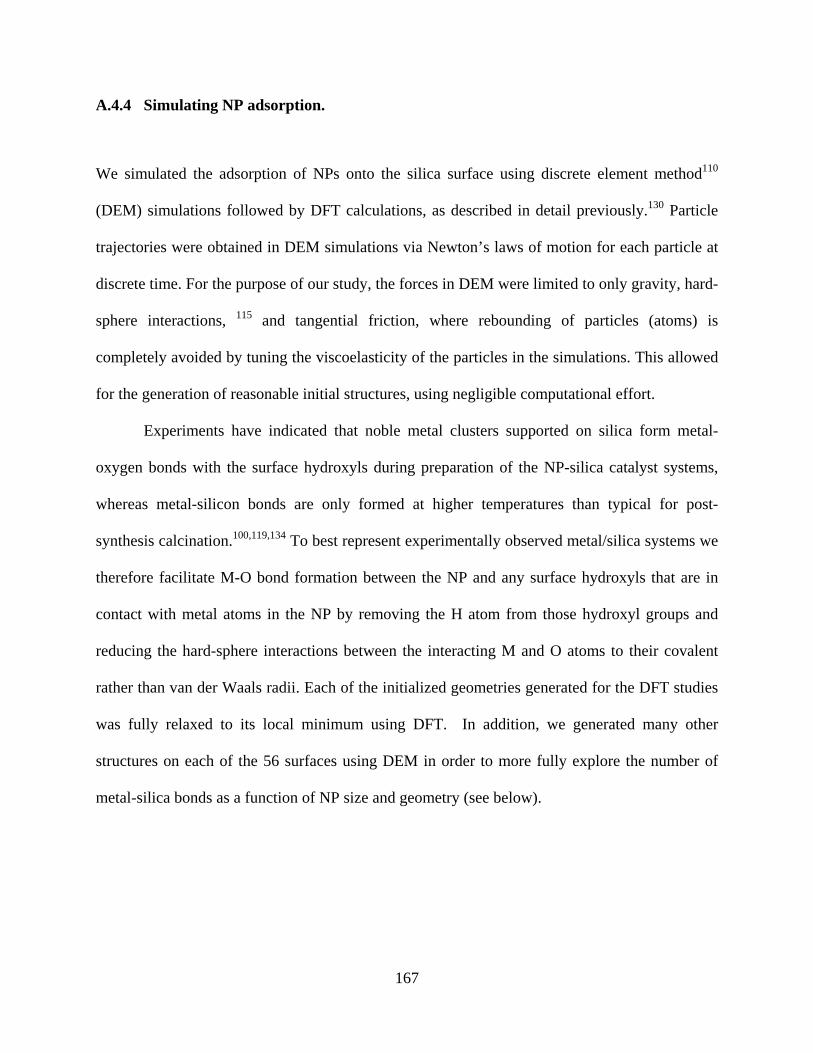
167
A.4.4 Simulating NP adsorption.
We simulated the adsorption of NPs onto the silica surface using discrete element method110
(DEM) simulations followed by DFT calculations, as described in detail previously.130 Particle
trajectories were obtained in DEM simulations via Newton’s laws of motion for each particle at
discrete time. For the purpose of our study, the forces in DEM were limited to only gravity, hard-
sphere interactions, 115 and tangential friction, where rebounding of particles (atoms) is
completely avoided by tuning the viscoelasticity of the particles in the simulations. This allowed
for the generation of reasonable initial structures, using negligible computational effort.
Experiments have indicated that noble metal clusters supported on silica form metal-
oxygen bonds with the surface hydroxyls during preparation of the NP-silica catalyst systems,
whereas metal-silicon bonds are only formed at higher temperatures than typical for post-
synthesis calcination.100,119,134 To best represent experimentally observed metal/silica systems we
therefore facilitate M-O bond formation between the NP and any surface hydroxyls that are in
contact with metal atoms in the NP by removing the H atom from those hydroxyl groups and
reducing the hard-sphere interactions between the interacting M and O atoms to their covalent
rather than van der Waals radii. Each of the initialized geometries generated for the DFT studies
was fully relaxed to its local minimum using DFT. In addition, we generated many other
structures on each of the 56 surfaces using DEM in order to more fully explore the number of
metal-silica bonds as a function of NP size and geometry (see below).
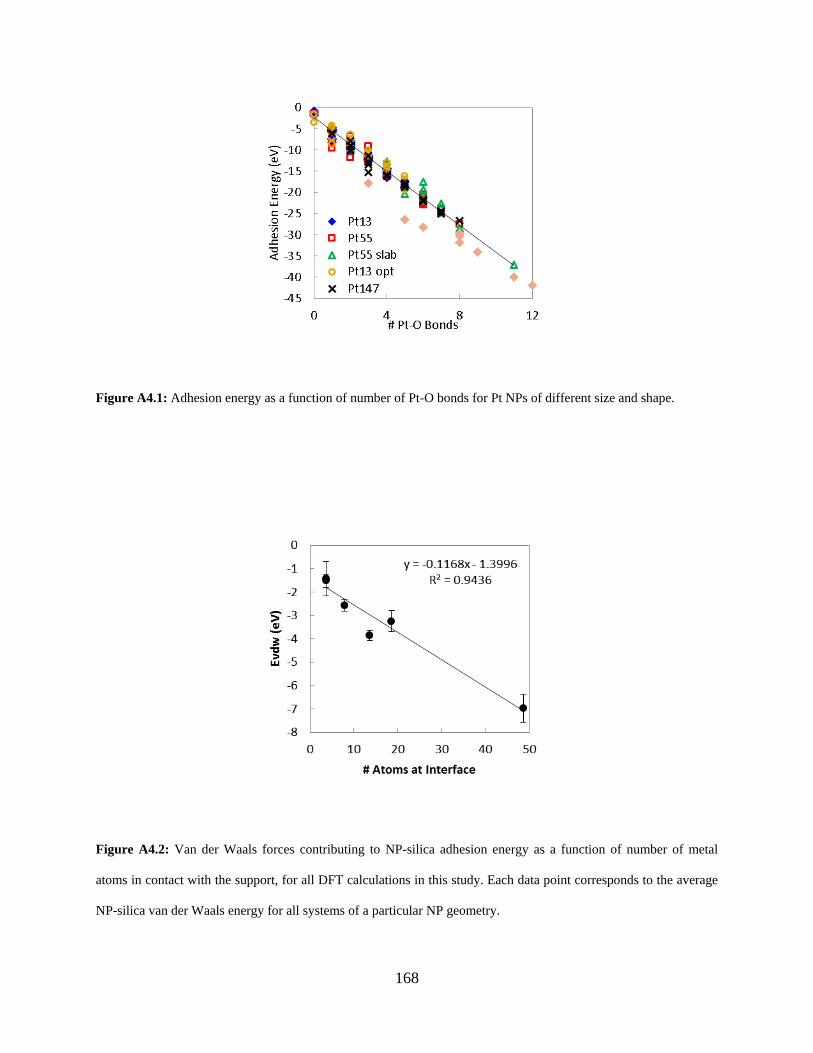
168
Figure A4.1: Adhesion energy as a function of number of Pt-O bonds for Pt NPs of different size and shape.
Figure A4.2: Van der Waals forces contributing to NP-silica adhesion energy as a function of number of metal
atoms in contact with the support, for all DFT calculations in this study. Each data point corresponds to the average
NP-silica van der Waals energy for all systems of a particular NP geometry.
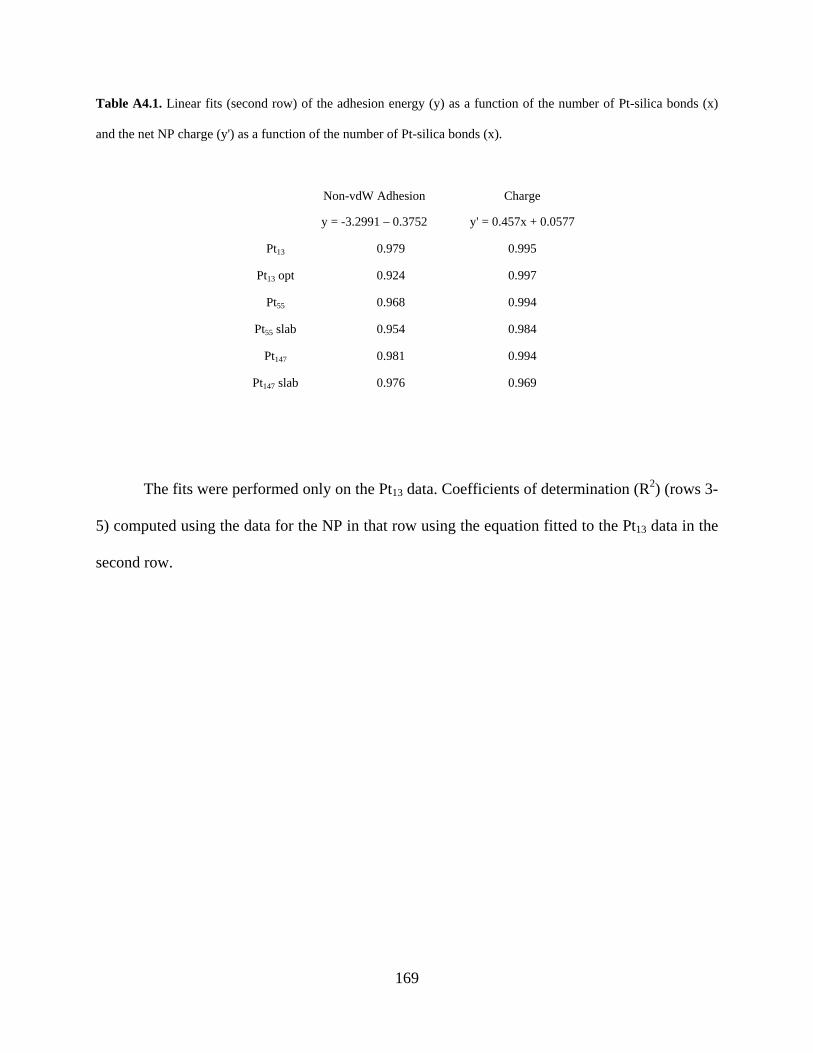
169
Table A4.1. Linear fits (second row) of the adhesion energy (y) as a function of the number of Pt-silica bonds (x)
and the net NP charge (y') as a function of the number of Pt-silica bonds (x).
Non-vdW Adhesion
y = -3.2991 – 0.3752
Charge
y' = 0.457x + 0.0577
Pt13 0.979 0.995
Pt13 opt 0.924 0.997
Pt55 0.968 0.994
Pt55 slab 0.954 0.984
Pt147 0.981 0.994
Pt147 slab 0.976 0.969
The fits were performed only on the Pt13 data. Coefficients of determination (R2) (rows 3-
5) computed using the data for the NP in that row using the equation fitted to the Pt13 data in the
second row.
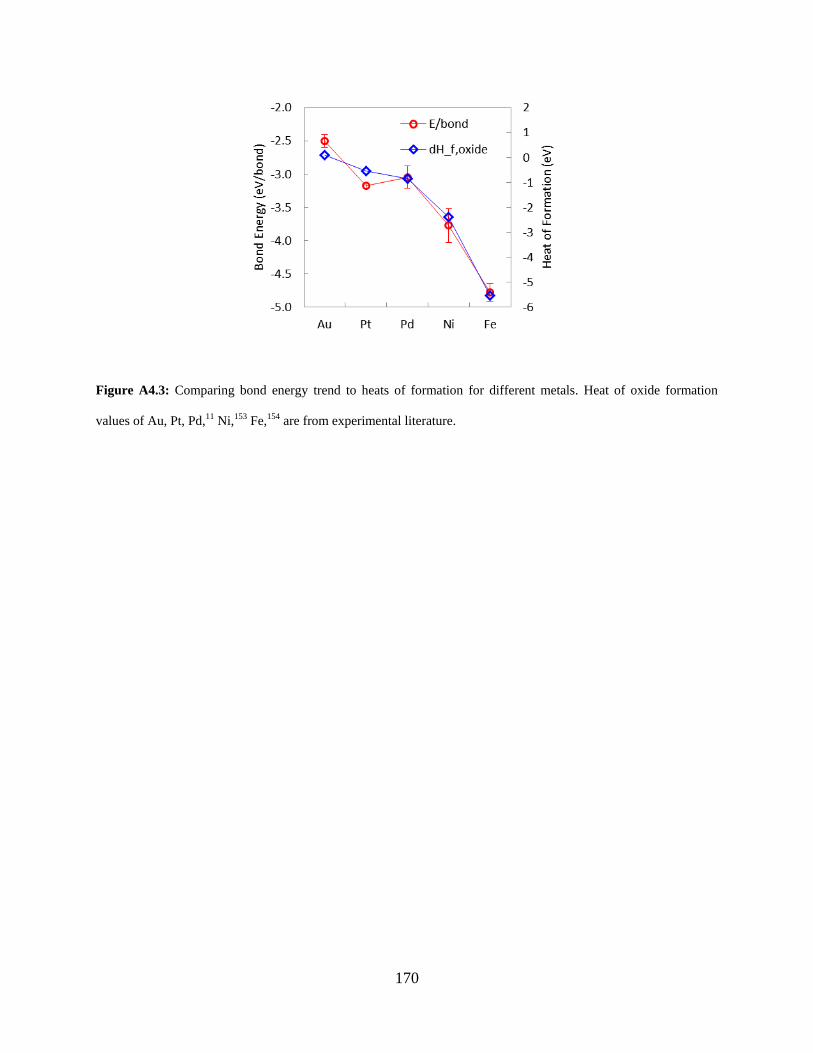
170
Figure A4.3: Comparing bond energy trend to heats of formation for different metals. Heat of oxide formation
values of Au, Pt, Pd,11 Ni,153 Fe,154 are from experimental literature.
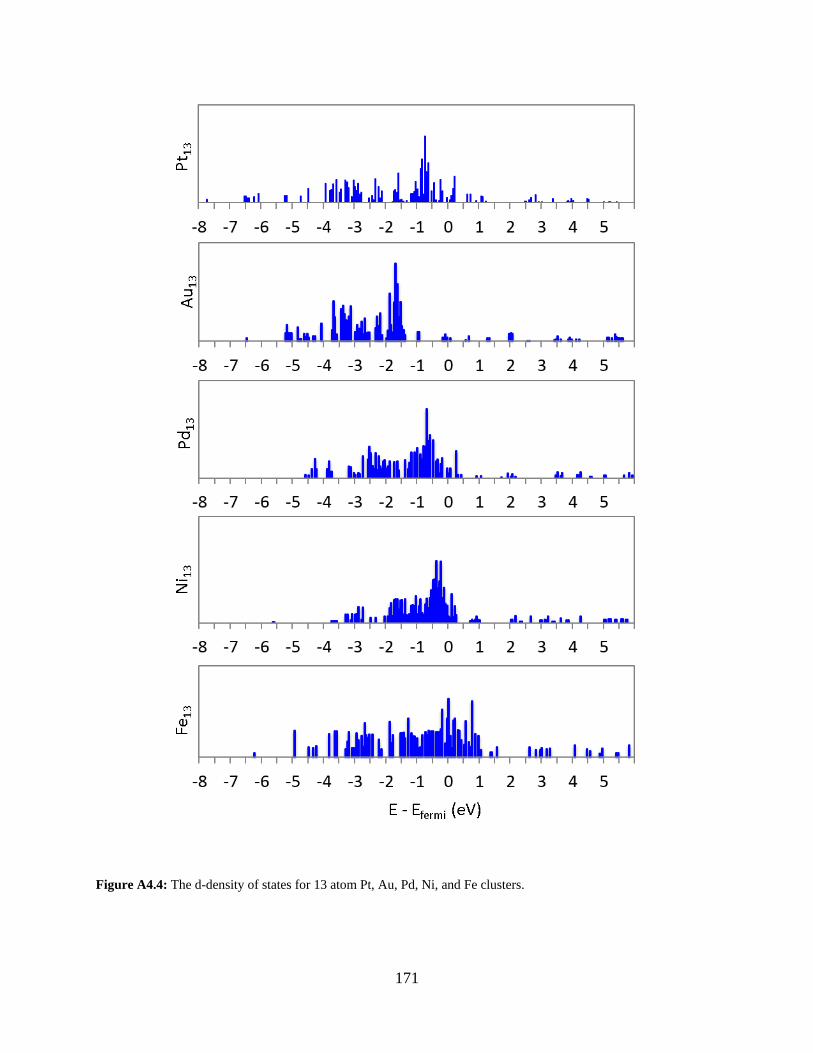
171
Figure A4.4: The d-density of states for 13 atom Pt, Au, Pd, Ni, and Fe clusters.
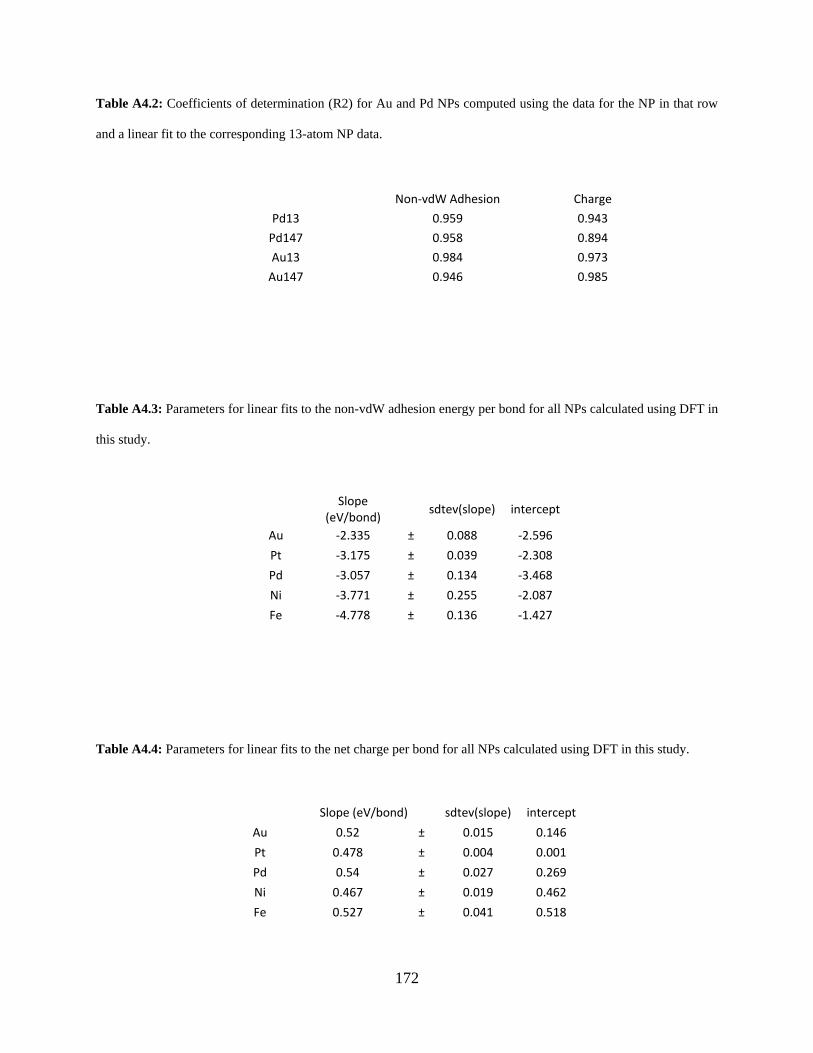
172
Table A4.2: Coefficients of determination (R2) for Au and Pd NPs computed using the data for the NP in that row
and a linear fit to the corresponding 13-atom NP data.
Non-vdW Adhesion Charge
Pd13 0.959 0.943 Pd147 0.958 0.894 Au13 0.984 0.973
Au147 0.946 0.985
Table A4.3: Parameters for linear fits to the non-vdW adhesion energy per bond for all NPs calculated using DFT in
this study.
Slope (eV/bond)
sdtev(slope) intercept
Au -2.335 ± 0.088 -2.596 Pt -3.175 ± 0.039 -2.308 Pd -3.057 ± 0.134 -3.468 Ni -3.771 ± 0.255 -2.087 Fe -4.778 ± 0.136 -1.427
Table A4.4: Parameters for linear fits to the net charge per bond for all NPs calculated using DFT in this study.
Slope (eV/bond) sdtev(slope) intercept
Au 0.52 ± 0.015 0.146 Pt 0.478 ± 0.004 0.001 Pd 0.54 ± 0.027 0.269 Ni 0.467 ± 0.019 0.462 Fe 0.527 ± 0.041 0.518
173
A.5 ATOMISTIC DESCRIPTION OF ISOLATED MO CENTER CATALYST SITES
ON AMORPHOUS SILICA SUPPORTS
A.5.1 Site generation procedure.
In order to allow for easy transformation of these coordinates into surface site structures, the O-O
midpoint was placed at the origin, and both Si-bonded O atoms were at y = z = 0, and the Si-Si
midpoint was at x = y = 0. This allowed for calculating atomic coordinates relative to easily
identified structures present in the surface model (i.e., the line between the Si-Si and O-O
midpoints and the plane also containing both Si-bonded O atoms). After identifying silanol pairs
on the silica surface models, we generated Mo sites based on the atomic positions of the
corresponding cluster models (i.e., bridged or non-bridged and having similar Si-Si distance).
First, hydrogen was removed from the anchoring silanol groups. Then, the distance between
silanol group O atom positions was reduced to that of the corresponding cluster model.
Coordinates for the moiety atoms were then generated from the corresponding cluster model, and
then geometrically transformed in accordance with the surface site location.
Geometric transformation was carried out by simple rotation and translation of the
moiety, from its initial configuration centered at the origin. Based on the positions of the Si-
bonded O atoms and the O-O and Si-Si midpoints, the moiety was rotated about the x-axis,
rotated about the y-axis, rotated about the z-axis, and then translated. This procedure produces
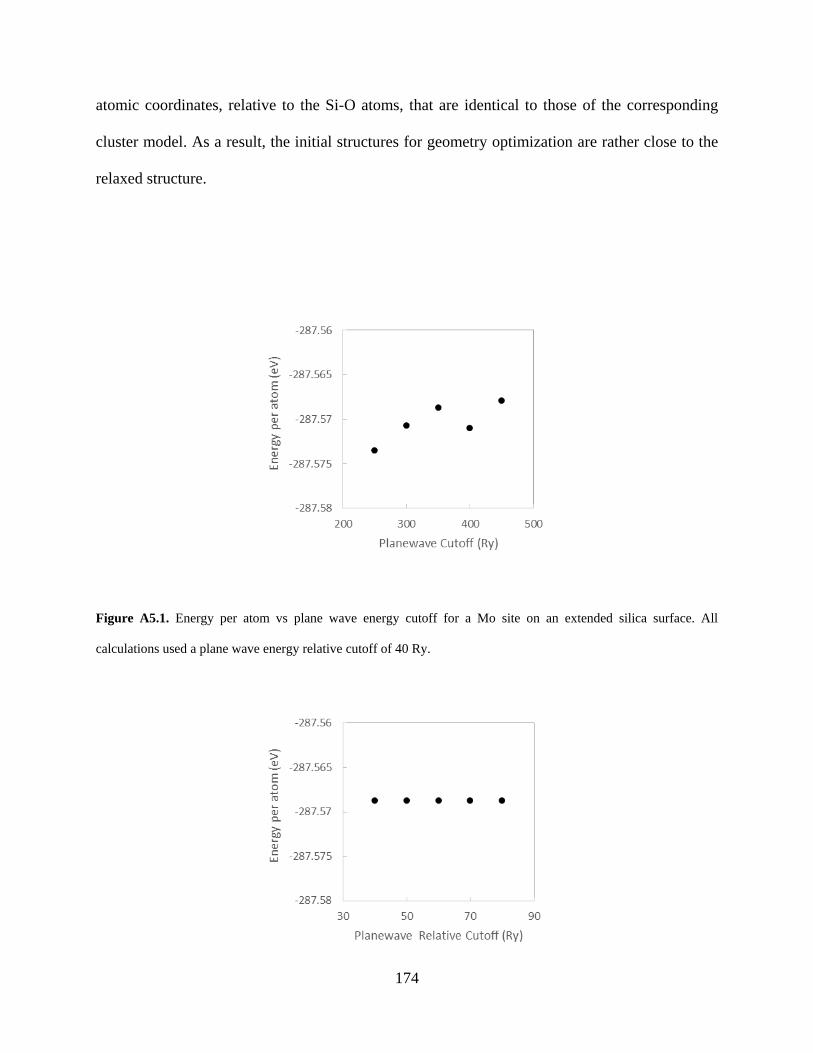
174
atomic coordinates, relative to the Si-O atoms, that are identical to those of the corresponding
cluster model. As a result, the initial structures for geometry optimization are rather close to the
relaxed structure.
Figure A5.1. Energy per atom vs plane wave energy cutoff for a Mo site on an extended silica surface. All
calculations used a plane wave energy relative cutoff of 40 Ry.
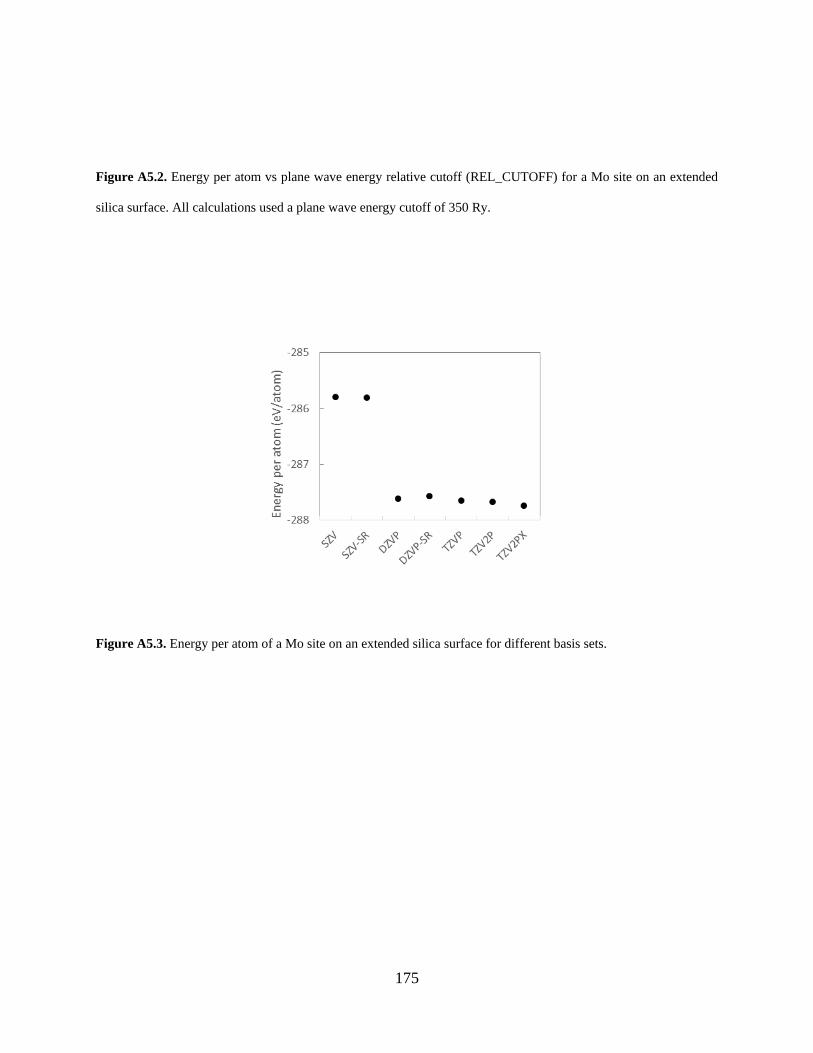
175
Figure A5.2. Energy per atom vs plane wave energy relative cutoff (REL_CUTOFF) for a Mo site on an extended
silica surface. All calculations used a plane wave energy cutoff of 350 Ry.
Figure A5.3. Energy per atom of a Mo site on an extended silica surface for different basis sets.
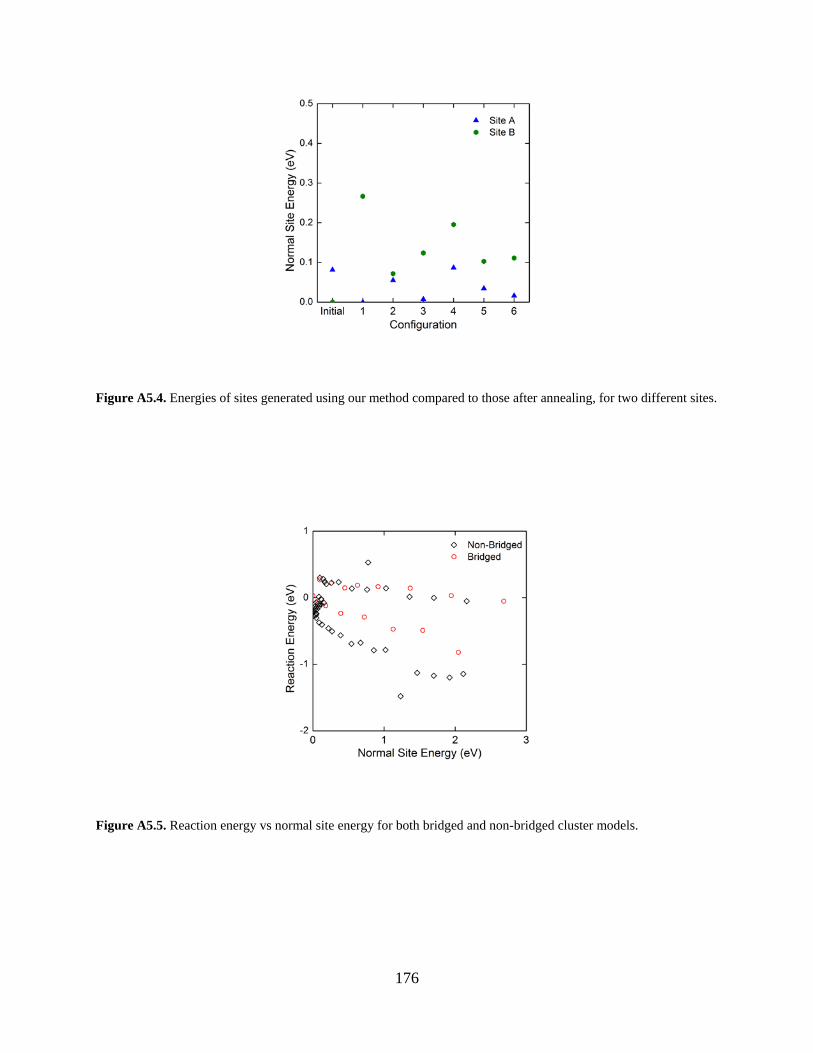
176
Figure A5.4. Energies of sites generated using our method compared to those after annealing, for two different sites.
Figure A5.5. Reaction energy vs normal site energy for both bridged and non-bridged cluster models.

177
A.5.2 Monte Carlo Simulations.
Monte Carlo simulations were performed for three silica pretreatment temperatures. All
sites on three silica surface structures were treated as a single sample at each temperature.
During each iteration, sites in a sample were randomly populated, consuming the respective
silanol group anchors. Full coverage was achieved by populating all sites for which neither
silanol group had been consumed. The results were averaged over 1000 iterations for each
sample.
178
BIBLIOGRAPHY
1 Thomas, J. M. & Thomas, W. J. (Wiley-VCH, 1997).
2 Elliott, J. A. Novel approaches to multiscale modelling in materials science. International Materials Reviews 56, 207-225, doi:10.1179/1743280410y.0000000002 (2011).
3 Bromley, S. T., Moreira, I. D. R., Neyman, K. M. & Illas, F. Approaching nanoscale oxides: models and theoretical methods. Chemical Society Reviews 38, 2657-2670, doi:10.1039/b806400h (2009).
4 Fujita, M. & Yamaguchi, Y. Mesoscale modeling for self-organization of colloidal systems. Current Opinion in Colloid & Interface Science 15, 8-12, doi:10.1016/j.cocis.2009.06.001 (2010).
5 Izvekov, S., Violi, A. & Voth, G. A. Systematic coarse-graining of nanoparticle interactions in molecular dynamics simulation. Journal of Physical Chemistry B 109, 17019-17024, doi:10.1021/jp0530496 (2005).
6 Lyubartsev, A., Mirzoev, A., Chen, L. J. & Laaksonen, A. Systematic coarse-graining of molecular models by the Newton inversion method. Faraday Discussions 144, 43-56, doi:10.1039/b901511f (2010).
7 Norskov, J. K., Bligaard, T., Rossmeisl, J. & Christensen, C. H. Towards the computational design of solid catalysts. Nature Chemistry 1, 37-46, doi:10.1038/nchem.121 (2009).
8 Thiel, W. Computational Catalysis-Past, Present, and Future. Angewandte Chemie-International Edition 53, 8605-8613, doi:10.1002/anie.201402118 (2014).
179
9 Frenkel, A. I. et al. An in Situ Study of Bond Strains in 1 nm Pt Catalysts and Their Sensitivities to Cluster-Support and Cluster-Adsorbate Interactions. Journal of Physical Chemistry C 117, 23286-23294, doi:10.1021/jp4062658 (2013).
10 Li, L. et al. Noncrystalline-to-Crystalline Transformations in Pt Nanoparticles. Journal of the American Chemical Society 135, 13062-13072, doi:10.1021/ja405497p (2013).
11 Campbell, C. T. & Sellers, J. R. V. Anchored metal nanoparticles: Effects of support and size on their energy, sintering resistance and reactivity. Faraday Discussions 162, 9-30, doi:10.1039/c3fd00094j (2013).
12 Jiang, T. et al. Trends in CO Oxidation Rates for Metal Nanoparticles and Close-Packed, Stepped, and Kinked Surfaces. Journal of Physical Chemistry C 113, 10548-10553, doi:10.1021/jp811185g (2009).
13 Li, L. et al. Investigation of Catalytic Finite-Size-Effects of Platinum Metal Clusters. Journal of Physical Chemistry Letters 4, 222-226, doi:10.1021/jz3018286 (2013).
14 Lopez, N. et al. On the origin of the catalytic activity of gold nanoparticles for low-temperature CO oxidation. Journal of Catalysis 223, 232-235, doi:10.1016/j.jcat.2004.01.001 (2004).
15 Peterson, A. A. et al. Finite-Size Effects in O and CO Adsorption for the Late Transition Metals. Topics in Catalysis 55, 1276-1282, doi:10.1007/s11244-012-9908-x (2012).
16 Campbell, C. T., Parker, S. C. & Starr, D. E. The effect of size-dependent nanoparticle energetics on catalyst sintering. Science 298, 811-814, doi:10.1126/science.1075094 (2002).
17 Campbell, C. T. The Energetics of Supported Metal Nanoparticles: Relationships to Sintering Rates and Catalytic Activity. Accounts of Chemical Research 46, 1712-1719, doi:10.1021/ar3003514 (2013).
18 Kim, H. Y. & Henkelman, G. CO Oxidation at the Interface between Doped CeO2 and Supported Au Nanoclusters. Journal of Physical Chemistry Letters 3, 2194-2199, doi:10.1021/jz300631f (2012).
180
19 Kim, H. Y., Lee, H. M. & Henkelman, G. CO Oxidation Mechanism on CeO2-Supported Au Nanoparticles. Journal of the American Chemical Society 134, 1560-1570, doi:10.1021/ja207510v (2012).
20 Mpourmpakis, G., Andriotis, A. N. & Vlachos, D. G. Identification of Descriptors for the CO Interaction with Metal Nanoparticles. Nano Letters 10, 1041-1045, doi:10.1021/nl904299c (2010).
21 Mpourmpakis, G. & Vlachos, D. G. The Effects of the MgO Support and Alkali Doping on the CO Interaction with Au. Journal of Physical Chemistry C 113, 7329-7335, doi:10.1021/jp900198m (2009).
22 Stamatakis, M., Christiansen, M. A., Vlachos, D. G. & Mpourmpakis, G. Multiscale Modeling Reveals Poisoning Mechanisms of MgO-Supported Au Clusters in CO Oxidation. Nano Letters 12, 3621-3626, doi:10.1021/nl301318b (2012).
23 Yaguee, C., Moros, M., Grazu, V., Arruebo, M. & Santamaria, J. Synthesis and stealthing study of bare and PEGylated silica micro- and nanoparticles as potential drug-delivery vectors. Chem. Eng. J. 137, 45-53, doi:10.1016/j.cej.2007.07.088 (2008).
24 Deak, A., Bancsi, B., Toth, A. L., Kovacs, A. L. & Horvolgyi, Z. Complex Langmuir-Blodgett films from silica nanoparticles: An optical spectroscopy study. Colloids Surf., A 278, 10-16, doi:10.1016/j.colsurfa.2005.11.070 (2006).
25 Deak, A. et al. Nanostructured silica Langmuir-Blodgett films with antireflective properties prepared on glass substrates. Thin Solid Films 484, 310-317, doi:10.1016/j.tsf.2005.01.096 (2005).
26 Wang, S. F. et al. Silica coating on ultrafine alpha-alumina particles. Mater. Sci. Eng., A 395, 148-152, doi:10.1016/j.msea.2004.12.007 (2005).
27 Yang, H. P. & Zhu, Y. F. Size dependence of SiO2 particles enhanced glucose biosensor. Talanta 68, 569-574, doi:10.1016/j.talanta.2005.04.057 (2006).
28 An, N. H. et al. Catalytic oxidation of formaldehyde over different silica supported platinum catalysts. Chemical Engineering Journal 215, 1-6, doi:10.1016/j.cej.2012.10.096 (2013).
181
29 Kim, M. Y. et al. Platinum catalysts supported on silicas: effect of silica characteristics on their catalytic activity in carbon monoxide oxidation. Reaction Kinetics Mechanisms and Catalysis 103, 463-479, doi:10.1007/s11144-011-0324-1 (2011).
30 Rozanska, X., Delbecq, F. & Sautet, P. Reconstruction and stability of beta-cristobalite 001, 101, and 111 surfaces during dehydroxylation. Physical Chemistry Chemical Physics 12, 14930-14940, doi:10.1039/c0cp00287a (2010).
31 Tielens, F., Gervais, C., Lambert, J. F., Mauri, F. & Costa, D. Ab initio study of the hydroxylated surface of amorphous silica: A representative model. Chemistry of Materials 20, 3336-3344, doi:10.1021/cm8001173 (2008).
32 Ugliengo, P. et al. Realistic Models of Hydroxylated Amorphous Silica Surfaces and MCM-41 Mesoporous Material Simulated by Large-scale Periodic B3LYP Calculations. Adv. Mater. 20, 4579-4583, doi:10.1002/adma.200801489 (2008).
33 Zhuravlev, L. T. The surface chemistry of amorphous silica. Zhuravlev model. Colloids and Surfaces a-Physicochemical and Engineering Aspects 173, 1-38, doi:10.1016/s0927-7757(00)00556-2 (2000).
34 Puurunen, R. L., Lindblad, M., Root, A. & Krause, A. O. I. Successive reactions of gaseous trimethylaluminium and ammonia on porous alumina. Physical Chemistry Chemical Physics 3, 1093-1102, doi:10.1039/b007249o (2001).
35 Sindorf, D. W. & Maciel, G. E. SI-29 NMR-STUDY OF DEHYDRATED REHYDRATED SILICA-GEL USING CROSS POLARIZATION AND MAGIC-ANGLE SPINNING. Journal of the American Chemical Society 105, 1487-1493, doi:10.1021/ja00344a012 (1983).
36 Sindorf, D. W. & Maciel, G. E. SI-29 NUCLEAR MAGNETIC-RESONANCE STUDY OF HYDROXYL SITES ON DEHYDRATED SILICA-GEL SURFACES, USING SILYLATION AS A PROBE. Journal of Physical Chemistry 87, 5516-5521, doi:10.1021/j150644a041 (1983).
37 Wang, Y., Zahid, F., Wang, J. & Guo, H. Structure and dielectric properties of amorphous high-kappa oxides: HfO2, ZrO2, and their alloys. Physical Review B 85, 5, doi:10.1103/PhysRevB.85.224110 (2012).
182
38 Campbell, C. T. & Sellers, J. R. V. Anchored metal nanoparticles: Effects of support and size on their energy, sintering resistance and reactivity. Faraday Discussions 162, 9-30, doi:10.1039/c3fd00094j (2013).
39 Chretien, S., Buratto, S. K. & Metiu, H. Catalysis by very small Au clusters. Current Opinion in Solid State & Materials Science 11, 62-75, doi:10.1016/j.cossms.2008.07.003 (2007).
40 Jiang, C. X., Hara, K. & Fukuoka, A. Low-Temperature Oxidation of Ethylene over Platinum Nanoparticles Supported on Mesoporous Silica. Angewandte Chemie, International Edition 52, 6265-6268, doi:10.1002/anie.201300496 (2013).
41 Jiang, T. et al. Trends in CO Oxidation Rates for Metal Nanoparticles and Close-Packed, Stepped, and Kinked Surfaces. The Journal of Physical Chemistry C 113, 10548-10553, doi:10.1021/jp811185g (2009).
42 Kim, M.-Y. et al. Preparation of Highly Dispersive and Stable Platinum Catalysts Supported on Siliceous SBA-15 Mesoporous Material: Roles of Titania Layer Incorporation and Hydrogen Peroxide Treatment. Catal Lett 129, 194-206, doi:10.1007/s10562-008-9790-0 (2009).
43 Kim, M.-Y., Park, J.-H., Shin, C.-H., Han, S.-W. & Seo, G. Dispersion Improvement of Platinum Catalysts Supported on Silica, Silica-Alumina and Alumina by Titania Incorporation and pH Adjustment. Catalysis Letters 133, 288-297, doi:10.1007/s10562-009-0188-4 (2009).
44 Peterson, A. et al. Finite-Size Effects in O and CO Adsorption for the Late Transition Metals. Top Catal 55, 1276-1282, doi:10.1007/s11244-012-9908-x (2012).
45 Mpourmpakis, G. & Vlachos, D. G. The Effects of the MgO Support and Alkali Doping on the CO Interaction with Au. The Journal of Physical Chemistry C 113, 7329-7335, doi:10.1021/jp900198m (2009).
46 Kim, H. Y., Lee, H. M. & Henkelman, G. CO Oxidation Mechanism on CeO2-Supported Au Nanoparticles. Journal of the American Chemical Society 134, 1560-1570, doi:10.1021/ja207510v (2011).
183
47 Li, L. et al. Investigation of Catalytic Finite-Size-Effects of Platinum Metal Clusters. The Journal of Physical Chemistry Letters 4, 222-226, doi:10.1021/jz3018286 (2012).
48 Huang, S., Hara, K. & Fukuoka, A. Intrinsic Catalytic Role of Mesoporous Silica in Preferential Oxidation of Carbon Monoxide in Excess Hydrogen. Chemistry – A European Journal 18, 4738-4747, doi:10.1002/chem.201102256 (2012).
49 Kleis, J. et al. Finite Size Effects in Chemical Bonding: From Small Clusters to Solids. Catalysis Letters 141, 1067-1071, doi:10.1007/s10562-011-0632-0 (2011).
50 Mowbray, D. J. et al. Trends in Metal Oxide Stability for Nanorods, Nanotubes, and Surfaces. Journal of Physical Chemistry C 115, 2244-2252, doi:10.1021/jp110489u (2011).
51 Korach, L., Czaja, K. & Kovaleva, N. Y. Sol-gel material as a support of organometallic catalyst for ethylene polymerization. European Polymer Journal 44, 889-903, doi:10.1016/j.eurpolymj.2007.11.037 (2008).
52 Zhuravlev, L. T. The surface chemistry of amorphous silica. Zhuravlev model. Colloids Surf., A 173, 1-38, doi:10.1016/s0927-7757(00)00556-2 (2000).
53 Zhuravlev, L. T. STRUCTURALLY BOUND WATER AND SURFACE CHARACTERIZATION OF AMORPHOUS SILICA. Pure and Applied Chemistry 61, 1969-1976, doi:10.1351/pac198961111969 (1989).
54 Zhuravlev, L. T. Surface characterization of amorphous silica - A review of work from the former USSR. Colloids Surf., A 74, 71-90, doi:10.1016/0927-7757(93)80399-y (1993).
55 Sindorf, D. W. & Maciel, G. E. 29Si nuclear magnetic-resonance study of hydroxyl sites on dehydrated silica-gel surfaces, using silylation as a probe. J. Phys. Chem. 87, 5516-5521, doi:10.1021/j150644a041 (1983).
56 Wang, Y., Zahid, F., Wang, J. & Guo, H. Structure and dielectric properties of amorphous high-kappa oxides: HfO2, ZrO2, and their alloys. Phys. Rev. B 85, 224110, doi:10.1103/PhysRevB.85.224110 (2012).
184
57 Butenuth, A. et al. Ab initio derived force-field parameters for molecular dynamics simulations of deprotonated amorphous-SiO2/water interfaces. Physica Status Solidi B-Basic Solid State Physics 249, 292-305, doi:10.1002/pssb.201100786 (2012).
58 Cruz-Chu, E. R., Aksimentiev, A. & Schulten, K. Water-silica force field for simulating nanodevices. Journal of Physical Chemistry B 110, 21497-21508, doi:10.1021/jp063896o (2006).
59 Du, J. C. & Cormack, A. N. Molecular dynamics simulation of the structure and hydroxylation of silica glass surfaces. Journal of the American Ceramic Society 88, 2532-2539, doi:10.1111/j.1551-2916.2005.00352.x (2005).
60 Fogarty, J. C., Aktulga, H. M., Grama, A. Y., van Duin, A. C. T. & Pandit, S. A. A reactive molecular dynamics simulation of the silica-water interface. J. Chem. Phys. 132, 174704, doi:10.1063/1.3407433 (2010).
61 Hassanali, A. A. & Singer, S. J. Model for the water-amorphous silica interface: The undissociated surface. Journal of Physical Chemistry B 111, 11181-11193, doi:10.1021/jo062971s (2007).
62 Hassanali, A. A., Zhang, H., Knight, C., Shin, Y. K. & Singer, S. J. The Dissociated Amorphous Silica Surface: Model Development and Evaluation. Journal of Chemical Theory and Computation 6, 3456-3471, doi:10.1021/ct100260z (2010).
63 Pedone, A. et al. FFSiOH: a new force field for silica polymorphs and their hydroxylated surfaces based on periodic B3LYP calculations. Chemistry of Materials 20, 2522-2531, doi:10.1021/cm703437y (2008).
64 Kramer, G. J., Farragher, N. P., van Beest, B. W. H. & van Santen, R. A. Interatomic force fields for silicas, aluminophosphates, and zeolites: Derivation based on ab initio calculations Phys. Rev. B 43, 5068-5080, doi:10.1103/PhysRevB.43.5068 (1991).
65 Heinz, H., Lin, T. J., Mishra, R. K. & Emami, F. S. Thermodynamically Consistent Force Fields for the Assembly of Inorganic, Organic, and Biological Nanostructures: The INTERFACE Force Field. Langmuir 29, 1754-1765, doi:10.1021/la3038846 (2013).
185
66 Digne, M., Sautet, P., Raybaud, P., Euzen, P. & Toulhoat, H. Use of DFT to achieve a rational understanding of acid-basic properties of gamma-alumina surfaces. Journal of Catalysis 226, 54-68, doi:10.1016/j.jcat.2004.04.020 (2004).
67 Aktulga, H. M., Fogarty, J. C., Pandit, S. A. & Grama, A. Y. Parallel reactive molecular dynamics: Numerical methods and algorithmic techniques. Parallel Computing 38, 245-259, doi:10.1016/j.parco.2011.08.005 (2012).
68 Plimpton, S. FAST PARALLEL ALGORITHMS FOR SHORT-RANGE MOLECULAR-DYNAMICS. Journal of Computational Physics 117, 1-19, doi:10.1006/jcph.1995.1039 (1995).
69 Siboulet, B., Coasne, B., Dufreche, J. F. & Turq, P. Hydrophobic Transition in Porous Amorphous Silica. Journal of Physical Chemistry B 115, 7881-7886, doi:10.1021/jp203193k (2011).
70 Bakaev, V. A. & Steele, W. A. On the computer simulation of a hydrophobic vitreous silica surface. Journal of Chemical Physics 111, 9803-9812, doi:10.1063/1.480317 (1999).
71 Bolt, G. H. DETERMINATION OF THE CHARGE DENSITY OF SILICA SOLS. Journal of Physical Chemistry 61, 1166-1169, doi:10.1021/j150555a007 (1957).
72 Patwardhan, S. V. et al. Chemistry of Aqueous Silica Nanoparticle Surfaces and the Mechanism of Selective Peptide Adsorption. Journal of the American Chemical Society 134, 6244-6256, doi:10.1021/ja211307u (2012).
73 Zerrouk, R., Foissy, A., Mercier, R., Chevallier, Y. & Morawski, J. C. Study of Ca2+-induced silica coagulation by small angle scattering. J. Colloid Interface Sci. 139, 20-29, doi:10.1016/0021-9797(90)90441-p (1990).
74 Krack, M. & Parrinello, M. All-electron ab-initio molecular dynamics. Physical Chemistry Chemical Physics 2, 2105-2112, doi:10.1039/b001167n (2000).
75 Lippert, G., Hutter, J. & Parrinello, M. A hybrid Gaussian and plane wave density functional scheme. Molecular Physics 92, 477-487, doi:10.1080/002689797170220 (1997).
186
76 Lippert, G., Hutter, J. & Parrinello, M. The Gaussian and augmented-plane-wave density functional method for ab initio molecular dynamics simulations. Theoretical Chemistry Accounts 103, 124-140, doi:10.1007/s002140050523 (1999).
77 VandeVondele, J. & Hutter, J. An efficient orbital transformation method for electronic structure calculations. Journal of Chemical Physics 118, 4365-4369, doi:10.1063/1.1543154 (2003).
78 VandeVondele, J. et al. QUICKSTEP: Fast and accurate density functional calculations using a mixed Gaussian and plane waves approach. Computer Physics Communications 167, 103-128, doi:10.1016/j.cpc.2004.12.014 (2005).
79 Goumans, T. P. M., Wander, A., Brown, W. A. & Catlow, C. R. A. Structure and stability of the (001) alpha-quartz surface. Physical Chemistry Chemical Physics 9, 2146-2152, doi:10.1039/b701176h (2007).
80 Perdew, J. P., Burke, K. & Ernzerhof, M. Generalized gradient approximation made simple. Physical Review Letters 77, 3865-3868, doi:10.1103/PhysRevLett.77.3865 (1996).
81 Goedecker, S., Teter, M. & Hutter, J. Separable dual-space Gaussian pseudopotentials. Physical Review B 54, 1703-1710, doi:10.1103/PhysRevB.54.1703 (1996).
82 Krack, M. Pseudopotentials for H to Kr optimized for gradient-corrected exchange-correlation functionals. Theoretical Chemistry Accounts 114, 145-152, doi:10.1007/s00214-005-0655-y (2005).
83 VandeVondele, J. & Hutter, J. Gaussian basis sets for accurate calculations on molecular systems in gas and condensed phases. Chem. Phys. 127, 114105 (2007).
84 Wang, J. Z. et al. Two-Phase Synthesis of Monodisperse Silica Nanospheres with Amines or Ammonia Catalyst and Their Controlled Self-Assembly. Acs Applied Materials & Interfaces 3, 1538-1544, doi:10.1021/am200104m (2011).
85 Ismail, I. M. K. CROSS-SECTIONAL AREAS OF ADSORBED N2, AR, KR, AND O2 ON CARBONS AND FUMED SILICAS AT LIQUID-NITROGEN TEMPERATURE. Langmuir 8, 360-365, doi:10.1021/la00038a006 (1992).
187
86 Digne, M., Sautet, P., Raybaud, P., Euzen, P. & Toulhoat, H. Hydroxyl groups on gamma-alumina surfaces: A DFT study. Journal of Catalysis 211, 1-5, doi:10.1006/jcat.2002.3741 (2002).
87 Digne, M., Sautet, P., Raybaud, P., Toulhoat, H. & Artacho, E. Structure and stability of aluminum hydroxides: A theoretical study. Journal of Physical Chemistry B 106, 5155-5162, doi:10.1021/jp014182a (2002).
88 Krokidis, X. et al. Theoretical study of the dehydration process of boehmite to gamma-alumina. Journal of Physical Chemistry B 105, 5121-5130, doi:10.1021/jp0038310 (2001).
89 Arunan, E. et al. Defining the hydrogen bond: An account (IUPAC Technical Report). Pure and Applied Chemistry 83, 1619-1636, doi:10.1351/pac-rep-10-01-01 (2011).
90 Aguiar, H., Serra, J., Gonzalez, P. & Leon, B. Structural study of sol-gel silicate glasses by IR and Raman spectroscopies. Journal of Non-Crystalline Solids 355, 475-480, doi:10.1016/j.jnoncrysol.2009.01.010 (2009).
91 Burneau, A., Barres, O., Gallas, J. P. & Lavalley, J. C. Comparative-study of the surface hydroxyl-groups of fumed and precipitated silicas 2. Characterization by infrared-spectroscopy of the interactions with water. Langmuir 6, 1364-1372, doi:10.1021/la00098a008 (1990).
92 Morrow, B. A., Cody, I. A. & Lee, L. S. M. Infrared studies of reactions on oxide surfaces. 7. Mechanism of adsorption of water and ammonia on dehydroxylated silica. J. Phys. Chem. 80, 2761-2767, doi:10.1021/j100566a009 (1976).
93 Musso, F., Sodupe, M., Corno, M. & Ugliengo, P. H-Bond Features of Fully Hydroxylated Surfaces of Crystalline Silica Polymorphs: A Periodic B3LYP Study. Journal of Physical Chemistry C 113, 17876-17884, doi:10.1021/jp905325m (2009).
94 D'Souza, A. S. & Pantano, C. G. Hydroxylation and dehydroxylation behavior of silica glass fracture surfaces. Journal of the American Ceramic Society 85, 1499-1504 (2002).
188
95 Gallas, J. P. et al. Quantification of Water and Silanol Species on Various Silicas by Coupling IR Spectroscopy and in-Situ Thermogravimetry. Langmuir 25, 5825-5834, doi:10.1021/la802688w (2009).
96 Mrowiec-Bialon, J. Determination of hydroxyls density in the silica-mesostructured cellular foams by thermogravimetry. Thermochimica Acta 443, 49-52, doi:10.1016/j.tca.2005.12.014 (2006).
97 Kim, M.-Y. et al. Preparation of Highly Dispersive and Stable Platinum Catalysts Supported on Siliceous SBA-15 Mesoporous Material: Roles of Titania Layer Incorporation and Hydrogen Peroxide Treatment. Catalysis Letters 129, 194-206, doi:10.1007/s10562-008-9790-0 (2009).
98 Hu, C. H. et al. Modulation of catalyst particle structure upon support hydroxylation: Ab initio insights into Pd-13 and Pt-13/gamma-Al2O3. Journal of Catalysis 274, 99-110, doi:10.1016/j.jcat.2010.06.009 (2010).
99 Eswaramoorthy, M. et al. The conversion of methane with silica-supported platinum catalysts: the effect of catalyst preparation method and platinum particle size. Catalysis Letters 71, 55-61, doi:10.1023/a:1016652207819 (2001).
100 Min, B. K., Santra, A. K. & Goodman, D. W. Understanding silica-supported metal catalysts: Pd/silica as a case study. Catalysis Today 85, 113-124, doi:10.1016/s0920-5861(03)00380-8 (2003).
101 Huang, S. J., Hara, K. & Fukuoka, A. Intrinsic Catalytic Role of Mesoporous Silica in Preferential Oxidation of Carbon Monoxide in Excess Hydrogen. Chemistry--A European Journal 18, 4738-4747, doi:10.1002/chem.201102256 (2012).
102 Cargnello, M. et al. Control of Metal Nanocrystal Size Reveals Metal-Support Interface Role for Ceria Catalysts. Science 341, 771-773, doi:10.1126/science.1240148 (2013).
103 Ewing, C. S., Bhavsar, S., Veser, G., McCarthy, J. J. & Johnson, J. K. Accurate Amorphous Silica Surface Models from First-Principles Thermodynamics of Surface Dehydroxylation. Langmuir 30, 5133-5141, doi:10.1021/la500422p (2014).

189
104 Hammer, B., Hansen, L. B. & Norskov, J. K. Improved adsorption energetics within density-functional theory using revised Perdew-Burke-Ernzerhof functionals. Physical Review B 59, 7413-7421, doi:10.1103/PhysRevB.59.7413 (1999).
105 VandeVondele, J. & Hutter, J. Gaussian basis sets for accurate calculations on molecular systems in gas and condensed phases. Journal of Chemical Physics 127, doi:10.1063/1.2770708 (2007).
106 Fogarty, J. C., Aktulga, H. M., Grama, A. Y., van Duin, A. C. T. & Pandit, S. A. A reactive molecular dynamics simulation of the silica-water interface. Journal of Chemical Physics 132, doi:10.1063/1.3407433 (2010).
107 Chou, J. P., Hsing, C. R., Wei, C. M., Cheng, C. & Chang, C. M. Ab initio random structure search for 13-atom clusters of fcc elements. Journal of Physics-Condensed Matter 25, doi:10.1088/0953-8984/25/12/125305 (2013).
108 Cuenya, B. R. et al. Solving the Structure of Size-Selected Pt Nanocatalysts Synthesized by Inverse Micelle Encapsulation. Journal of the American Chemical Society 132, 8747-8756, doi:10.1021/ja101997z (2010).
109 Cuenya, B. R. et al. Anomalous lattice dynamics and thermal properties of supported size- and shape-selected Pt nanoparticles. Physical Review B 82, doi:10.1103/PhysRevB.82.155450 (2010).
110 Cuenya, B. R. et al. Thermodynamic properties of Pt nanoparticles: Size, shape, support, and adsorbate effects. Physical Review B 84, doi:10.1103/PhysRevB.84.245438 (2011).
111 Mostafa, S. et al. Shape-Dependent Catalytic Properties of Pt Nanoparticles. Journal of the American Chemical Society 132, 15714-15719, doi:10.1021/ja106679z (2010).
112 Xu, D., Liu, Y. J., Zhao, J. X., Cai, Q. H. & Wang, X. Z. Theoretical Study of the Deposition of Pt Clusters on Defective Hexagonal Boron Nitride (h-BN) Sheets: Morphologies, Electronic Structures, and Interactions with 0. Journal of Physical Chemistry C 118, 8868-8876, doi:10.1021/jp4087943 (2014).
190
113 Bartolome, J. et al. Magnetization of Pt-13 clusters supported in a NaY zeolite: A XANES and XMCD study. Physical Review B 80, 10, doi:10.1103/PhysRevB.80.014404 (2009).
114 Cundall, P. A. & Strack, O. D. L. DISCRETE NUMERICAL-MODEL FOR GRANULAR ASSEMBLIES. Geotechnique 29, 47-65 (1979).
115 Johnson, K. L. Contact Mechanics. (Cambridge: Cambridge University Press, 1987).
116 Humphrey, W., Dalke, A. & Schulten, K. VMD: Visual molecular dynamics. Journal of Molecular Graphics & Modelling 14, 33-38, doi:10.1016/0263-7855(96)00018-5 (1996).
117 McCarthy, J. J. & Ottino, J. M. Particle dynamics simulation: a hybrid technique applied to granular mixing. Powder Technology 97, 91-99, doi:10.1016/s0032-5910(97)03391-3 (1998).
118 Moroz, E. M., Kriventsov, V. V. & Kochubei, D. I. EuroPt-1 catalyst: Radial distribution of electron density X-ray diffraction and EXAFS studies. Journal of Structural Chemistry (Translation of Zhurnal Strukturnoi Khimii) 50, 1082-1087, doi:10.1007/s10947-009-0159-z (2009).
119 Schwartz, J. M. & Schmidt, L. D. MICROSTRUCTURES OF PT-CE AND RH-CE PARTICLES ON ALUMINA AND SILICA. Journal of Catalysis 138, 283-293, doi:10.1016/0021-9517(92)90023-b (1992).
120 Kalakkad, D., Datye, A. K. & Robota, H. INTERACTION OF PLATINUM AND CERIA PROBED BY TRANSMISSION ELECTRON-MICROSCOPY AND CATALYTIC REACTIVITY. Applied Catalysis, B: Environmental 1, 191-219, doi:10.1016/0926-3373(92)80023-s (1992).
121 Libuda, J. et al. Interaction of rhodium with hydroxylated alumina model substrates. Surface Science 384, 106-119, doi:10.1016/s0039-6028(97)00170-2 (1997).
122 Luo, Y. R. (CRC Press, Boca Raton, FL, 2007).
191
123 Mavrikakis, M., Hammer, B. & Norskov, J. K. Effect of strain on the reactivity of metal surfaces. Physical Review Letters 81, 2819-2822, doi:10.1103/PhysRevLett.81.2819 (1998).
124 Wallace, W. T. & Whetten, R. L. Carbon monoxide adsorption on selected gold clusters: Highly size-dependent activity and saturation compositions. Journal of Physical Chemistry B 104, 10964-10968, doi:10.1021/jp002889b (2000).
125 Rodriguez, J. A., Truong, C. M. & Goodman, D. W. INFRARED VIBRATIONAL STUDIES OF CO ADSORPTION ON CU/PT(111) AND CUPT(111) SURFACES. Journal of Chemical Physics 96, 7814-7825, doi:10.1063/1.462378 (1992).
126 Hammer, B. & Norskov, J. K. Electronic factors determining the reactivity of metal surfaces. Surface Science 343, 211-220, doi:10.1016/0039-6028(96)80007-0 (1995).
127 Nilsson, A. et al. The electronic structure effect in heterogeneous catalysis. Catalysis Letters 100, 111-114, doi:10.1007/s10562-004-3434-9 (2005).
128 Lee, C. K. & Hua, C. C. Nanoparticle interaction potentials constructed by multiscale computation. Journal of Chemical Physics 132, doi:10.1063/1.3447890 (2010).
129 Kleis, J. et al. Finite-size effects in surface chemistry of gold nanoparticles. Abstracts of Papers of the American Chemical Society 242 (2011).
130 Ewing, C. S. et al. Structural and Electronic Properties of Pt13 Nanoclusters on Amorphous Silica Supports. The Journal of Physical Chemistry C 119, 2503-2512, doi:10.1021/jp5105104 (2015).
131 Goldsmith, B. R., Sanderson, E. D., Bean, D. & Peters, B. Isolated catalyst sites on amorphous supports: A systematic algorithm for understanding heterogeneities in structure and reactivity. Journal of Chemical Physics 138, doi:10.1063/1.4807384 (2013).
132 Cuenya, B. R. Synthesis and catalytic properties of metal nanoparticles: Size, shape, support, composition, and oxidation state effects. Thin Solid Films 518, 3127-3150, doi:10.1016/j.tsf.2010.01.018 (2010).
192
133 Garnier, A., Sall, S., Garin, F., Chetcuti, M. J. & Petit, C. Site effects in the adsorption of carbon monoxide on real 1.8 nm Pt nanoparticles: An Infrared investigation in time and temperature. Journal of Molecular Catalysis a-Chemical 373, 127-134, doi:10.1016/j.molcata.2013.02.029 (2013).
134 Moroz, E. M., Kriventsov, V. V. & Kochubei, D. I. EuroPt-1 catalyst: Radial distribution of electron density X-ray diffraction and EXAFS studies. Journal of Structural Chemistry 50, 1082-1087, doi:10.1007/s10947-009-0159-z (2009).
135 Henkelman, G., Arnaldsson, A. & Jonsson, H. A fast and robust algorithm for Bader decomposition of charge density. Computational Materials Science 36, 354-360, doi:10.1016/j.commatsci.2005.04.010 (2006).
136 Tang, W., Sanville, E. & Henkelman, G. A grid-based Bader analysis algorithm without lattice bias. Journal of Physics-Condensed Matter 21, doi:10.1088/0953-8984/21/8/084204 (2009).
137 Mulliken, R. S. ELECTRONIC POPULATION ANALYSIS ON LCAO-MO MOLECULAR WAVE FUNCTIONS .4. BONDING AND ANTIBONDING IN LCAO AND VALENCE-BOND THEORIES. Journal of Chemical Physics 23, 2343-2346, doi:10.1063/1.1741877 (1955).
138 Pacchioni, G. Electronic interactions and charge transfers of metal atoms and clusters on oxide surfaces. Physical Chemistry Chemical Physics 15, 1737-1757, doi:10.1039/c2cp43731g (2013).
139 Shekhar, M. et al. Size and Support Effects for the Water-Gas Shift Catalysis over Gold Nanoparticles Supported on Model Al2O3 and TiO2. Journal of the American Chemical Society 134, 4700-4708, doi:10.1021/ja210083d (2012).
140 Williams, W. D. et al. Metallic Corner Atoms in Gold Clusters Supported on Rutile Are the Dominant Active Site during Water-Gas Shift Catalysis. Journal of the American Chemical Society 132, 14018-14020, doi:10.1021/ja1064262 (2010).
141 Campbell, C. T. Ultrathin metal films and particles on oxide surfaces: Structural, electronic and chemisorptive properties. Surface Science Reports 27, 1-111, doi:10.1016/s0167-5729(96)00011-8 (1997).
193
142 Zheng, Z., Wang, X., Liu, J., Xiao, J. & Hu, Z. Si doping influence on the catalytic performance of Pt/TiO2 mesoporous film catalyst for low-temperature methanol combustion. Applied Surface Science 309, 144-152, doi:http://dx.doi.org/10.1016/j.apsusc.2014.04.208 (2014).
143 Zheng, G. et al. Parameter Calibration of Transition-Metal Elements for the Spin-Polarized Self-Consistent-Charge Density-Functional Tight-Binding (DFTB) Method: Sc, Ti, Fe, Co, and Ni. Journal of chemical theory and computation 3, 1349-1367, doi:10.1021/ct600312f (2007).
144 Lægsgaard, J. & Stokbro, K. Hole Trapping at Al impurities in Silica: A Challenge for Density Functional Theories. Physical Review Letters 86, 2834-2837 (2001).
145 To, J., Sokol, A. A., French, S. A., Kaltsoyannis, N. & Catlow, C. R. A. Hole localization in [AlO4]0 defects in silica materials. The Journal of Chemical Physics 122, 144704, doi:doi:http://dx.doi.org/10.1063/1.1880972 (2005).
146 Roma, G. & Limoge, Y. Density functional theory investigation of native defects in SiO2: Self-doping and contribution to ionic conductivity. Physical Review B 70, 174101 (2004).
147 Venezia, A. M., Di Carlo, G., Liotta, L. F., Pantaleo, G. & Kantcheva, M. Effect of Ti(IV) loading on CH4 oxidation activity and SO2 tolerance of Pd catalysts supported on silica SBA-15 and HMS. Applied Catalysis B: Environmental 106, 529-539, doi:http://dx.doi.org/10.1016/j.apcatb.2011.06.013 (2011).
148 Nguyen Dinh, M. T. et al. Tuning Hydrodesulfurization Active-Phase Dispersion using Optimized Mesoporous Titania-Doped Silica Supports. ChemCatChem 6, 328-338, doi:10.1002/cctc.201300521 (2014).
149 Schwartz, V. et al. Structural Investigation of Au Catalysts on TiO2−SiO2 Supports: Nature of the Local Structure of Ti and Au Atoms by EXAFS and XANES. The Journal of Physical Chemistry C 111, 17322-17332, doi:10.1021/jp074426c (2007).
150 Ewing, C. S., Veser, G., McCarthy, J. J., Johnson, J. K. & Lambrecht, D. S. Effect of Support Preparation and Nanoparticle Size on Catalyst-Support Interactions between Pt and Amorphous Silica. J. Phys. Chem, submitted (2015).
194
151 Grimme, S., Antony, J., Ehrlich, S. & Krieg, H. A consistent and accurate ab initio parametrization of density functional dispersion correction (DFT-D) for the 94 elements H-Pu. Journal of Chemical Physics 132, doi:10.1063/1.3382344 (2010).
152 Ewing, C. S. et al. Structural and Electronic Properties of Pt-13 Nanoclusters on Amorphous Silica Supports. Journal of Physical Chemistry C 119, 2503-2512, doi:10.1021/jp5105104 (2015).
153 Boyle, B. J., King, E. G. & Conway, K. C. HEATS OF FORMATION OF NICKEL AND COBALT OXIDES (NIO AND COO) OF COMBUSTION CALORIMETRY. Journal of the American Chemical Society 76, 3835-3837, doi:10.1021/ja01643a072 (1954).
154 Chase, M. W., Jr. NIST-JANAF Themochemical Tables, Fourth Edition. J. Phys. Chem. Ref. Data 9, 1-1951 (1998).
155 Komiyama, M. & Shimaguchi, T. Partial reduction of Si(IV) in SiO2 thin film by deposited metal particles: an XPS study. Surface and Interface Analysis 32, 189-192, doi:10.1002/sia.1034 (2001).
156 Venezia, A. M. et al. Oxidation of CH4 over Pd supported on TiO2-doped SiO2: Effect of Ti(IV) loading and influence of SO2. Applied Catalysis B: Environmental 88, 430-437, doi:http://dx.doi.org/10.1016/j.apcatb.2008.10.023 (2009).
157 Venezia, A. M. et al. Effect of Ti(IV) loading on CO oxidation activity of gold on TiO2 doped amorphous silica. Applied Catalysis A: General 310, 114-121, doi:http://dx.doi.org/10.1016/j.apcata.2006.05.027 (2006).
158 Peters, B. & Scott, S. L. Single atom catalysts on amorphous supports: A quenched disorder perspective. The Journal of Chemical Physics 142, 104708, doi:doi:http://dx.doi.org/10.1063/1.4914145 (2015).
159 Guesmi, H. & Tielens, F. Chromium Oxide Species Supported on Silica: A Representative Periodic DFT Model. Journal of Physical Chemistry C 116, 994-1001, doi:10.1021/jp209680r (2012).
195
160 Handzlik, J., Grybos, R. & Tielens, F. Structure of Monomeric Chromium(VI) Oxide Species Supported on Silica: Periodic and Cluster DFT Studies. Journal of Physical Chemistry C 117, 8138-8149, doi:10.1021/jp3103035 (2013).
161 Handzlik, J. & Ogonowski, J. Structure of Isolated Molybdenum(VI) and Molybdenum(IV) Oxide Species on Silica: Periodic and Cluster DFT Studies. Journal of Physical Chemistry C 116, 5571-5584, doi:10.1021/jp207385h (2012).
162 Iwasawa, Y. & Hamamura, H. MECHANISM FOR INITIAL CARBENE FORMATION IN OLEFIN METATHESIS OVER FIXED MO CATALYSTS. Journal of the Chemical Society-Chemical Communications, 130-132, doi:10.1039/c39830000130 (1983).
163 Iwasawa, Y., Ichinose, H., Ogasawara, S. & Soma, M. OLEFIN METATHESIS OVER WELL-DEFINED ACTIVE FIXED MOLYBDENUM CATALYSTS - STRUCTURE AND OXIDATION-STATE OF THE ACTIVE-SITE AND REACTION-MECHANISM. Journal of the Chemical Society-Faraday Transactions I 77, 1763-1777, doi:10.1039/f19817701763 (1981).
164 Iwasawa, Y., Kubo, H. & Hamamura, H. OLEFIN METATHESIS OVER AL2O3-ATTACHED OR SIO2-ATTACHED MOLYBDENUM CATALYSTS - ACTIVE STRUCTURES AND MECHANISM FOR INITIAL CARBENE FORMATION. Journal of Molecular Catalysis 28, 191-208, doi:10.1016/0304-5102(85)87028-0 (1985).
165 Bell, A. T. Single iron sites for catalytic, nonoxidative conversion of methane. Science China-Chemistry 57, 923-923, doi:10.1007/s11426-014-5148-1 (2014).
166 Guo, X. G. et al. Direct, Nonoxidative Conversion of Methane to Ethylene, Aromatics, and Hydrogen. Science 344, 616-619, doi:10.1126/science.1253150 (2014).
167 Peters, B. & Scott, S. L. Single atom catalysts on amorphous supports: A quenched disorder perspective. Journal of Chemical Physics 142, doi:10.1063/1.4914145 (2015).
168 Guesmi, N., Grybos, R., Handzlik, J. & Tielens, F. Characterization of molybdenum monomeric oxide species supported on hydroxylated silica: a DFT study. Physical Chemistry Chemical Physics 16, 18253-18260, doi:10.1039/c4cp02296c (2014).
196
169 Grimme, S. Semiempirical GGA-type density functional constructed with a long-range dispersion correction. Journal of Computational Chemistry 27, 1787-1799, doi:10.1002/jcc.20495 (2006).
170 Ding, H., Ray, K. G., Ozolins, V. & Asta, M. Structural and vibrational properties of alpha-MoO3 from van der Waals corrected density functional theory calculations. Physical Review B 85, doi:10.1103/PhysRevB.85.012104 (2012).
171 Zhuravlev, L. T. SURFACE CHARACTERIZATION OF AMORPHOUS SILICA - A REVIEW OF WORK FROM THE FORMER USSR. Colloids and Surfaces a-Physicochemical and Engineering Aspects 74, 71-90, doi:10.1016/0927-7757(93)80399-y (1993).
172 Bishop, K. J. M., Wilmer, C. E., Soh, S. & Grzybowski, B. A. Nanoscale Forces and Their Uses in Self-Assembly. Small 5, 1600-1630, doi:10.1002/smll.200900358 (2009).
173 Tiede, K. et al. Detection and characterization of engineered nanoparticles in food and the environment. Food Additives and Contaminants Part a-Chemistry Analysis Control Exposure & Risk Assessment 25, 795-821, doi:10.1080/02652030802007553 (2008).
174 Campelo, J. M., Luna, D., Luque, R., Marinas, J. M. & Romero, A. A. Sustainable Preparation of Supported Metal Nanoparticles and Their Applications in Catalysis. Chemsuschem 2, 18-45, doi:10.1002/cssc.200800227 (2009).
175 Kim, B. H., Hackett, M. J., Park, J. & Hyeon, T. Synthesis, Characterization, and Application of Ultrasmall Nanoparticles. Chemistry of Materials 26, 59-71, doi:10.1021/cm402225z (2014).
176 Caswell, K. K., Bender, C. M. & Murphy, C. J. Seedless, surfactantless wet chemical synthesis of silver nanowires. Nano Letters 3, 667-669, doi:10.1021/nl0341178 (2003).
177 Henglein, A. & Giersig, M. Formation of colloidal silver nanoparticles: Capping action of citrate. Journal of Physical Chemistry B 103, 9533-9539, doi:10.1021/jp9925334 (1999).
178 Jin, R. C. et al. Photoinduced conversion of silver nanospheres to nanoprisms. Science 294, 1901-1903, doi:10.1126/science.1066541 (2001).
197
179 Mpourmpakis, G. & Vlachos, D. G. Insights into the early stages of metal nanoparticle formation via first-principle calculations: the roles of citrate and water. Langmuir 24, 7465-7473, doi:10.1021/la800135s (2008).
180 Mpourmpakis, G. & Vlachos, D. G. Growth Mechanisms of Metal Nanoparticles via First Principles. Physical Review Letters 102, doi:10.1103/PhysRevLett.102.155505 (2009).
181 Munro, C. H., Smith, W. E., Garner, M., Clarkson, J. & White, P. C. CHARACTERIZATION OF THE SURFACE OF A CITRATE-REDUCED COLLOID OPTIMIZED FOR USE AS A SUBSTRATE FOR SURFACE-ENHANCED RESONANCE RAMAN-SCATTERING. Langmuir 11, 3712-3720, doi:10.1021/la00010a021 (1995).
182 Pillai, Z. S. & Kamat, P. V. What factors control the size and shape of silver nanoparticles in the citrate ion reduction method? Journal of Physical Chemistry B 108, 945-951, doi:10.1021/jp037018r (2004).
183 Redmond, P. L., Wu, X. & Brus, L. Photovoltage and photocatalyzed growth in citrate-stabilized colloidal silver nanocrystals. Journal of Physical Chemistry C 111, 8942-8947, doi:10.1021/jp0710436 (2007).
184 Sun, X. M. & Li, Y. D. Cylindrical silver nanowires: Preparation, structure, and optical properties. Advanced Materials 17, 2626-+, doi:10.1002/adma.200500957 (2005).
185 Sun, Y. G., Gates, B., Mayers, B. & Xia, Y. N. Crystalline silver nanowires by soft solution processing. Nano Letters 2, 165-168, doi:10.1021/nl010093y (2002).
186 Sun, Y. G., Mayers, B., Herricks, T. & Xia, Y. N. Polyol synthesis of uniform silver nanowires: A plausible growth mechanism and the supporting evidence. Nano Letters 3, 955-960, doi:10.1021/nl034312m (2003).
187 Sun, Y. G., Mayers, B. & Xia, Y. N. Transformation of silver nanospheres into nanobelts and triangular nanoplates through a thermal process. Nano Letters 3, 675-679, doi:10.1021/nl034140t (2003).
188 Sun, Y. G. & Xia, Y. N. Shape-controlled synthesis of gold and silver nanoparticles. Science 298, 2176-2179, doi:10.1126/science.1077229 (2002).
198
189 Wiley, B., Sun, Y. G., Mayers, B. & Xia, Y. N. Shape-controlled synthesis of metal nanostructures: The case of silver. Chemistry-a European Journal 11, 454-463, doi:10.1002/chem.200400927 (2005).
190 Brust, M., Walker, M., Bethell, D., Schiffrin, D. J. & Whyman, R. SYNTHESIS OF THIOL-DERIVATIZED GOLD NANOPARTICLES IN A 2-PHASE LIQUID-LIQUID SYSTEM. Journal of the Chemical Society-Chemical Communications, 801-802, doi:10.1039/c39940000801 (1994).
191 Chen, H. et al. A Surfactant-Free Strategy for Synthesizing, and Processing Intermetallic Platinum-Based Nanoparticle Catalysts. Journal of the American Chemical Society 134, 18453-18459, doi:10.1021/ja308674b (2012).
192 Stober, W., Fink, A. & Bohn, E. CONTROLLED GROWTH OF MONODISPERSE SILICA SPHERES IN MICRON SIZE RANGE. Journal of Colloid and Interface Science 26, doi:10.1016/0021-9797(68)90272-5 (1968).
193 Dracinsky, M., Benda, L. & Bour, P. Ab initio modeling of fused silica, crystal quartz, and water Raman spectra. Chemical Physics Letters 512, 54-59, doi:10.1016/j.cplett.2011.06.077 (2011).
194 Grimley, D. I., Wright, A. C. & Sinclair, R. N. Neutron-scattering from vitreous silica. 4. Time-of-flight diffraction. J. Non-Cryst. Solids 119, 49-64, doi:10.1016/0022-3093(90)90240-m (1990).
195 Mozzi, R. L. & Warren, B. E. STRUCTURE OF VITREOUS SILICA. Journal of Applied Crystallography 2, 164-&, doi:10.1107/s0021889869006868 (1969).
196 Da Silva, J. R. G., Pinatti, D. G., Anderson, C. E. & Rudee, M. L. A refinement of the structure of vitreous silica. Philos. Mag. 31, 713-717 (1975).