towards arti cial cells: producing ... - nanoscience.ch
TRANSCRIPT
Department of Biosystems Scienceand Engineering, ETH Zurich
Swiss Nanoscience Institute,University of Basel
Master Thesis
Towards Artificial Cells: Producing &Manipulating Liposomes On-Chip
Author: Manuel Kraus, BSc
Supervisor: Ariane Stucki, MSc
Professor: Prof. Dr. Petra S. Dittrich
Second Assessor: Prof. Dr. Wolfgang P. Meier
Duration: June 1 - December 31, 2020
Date:
December 31, 2020
Signature:
Abstract
Abstract
Traditionally, cellular mechanisms are investigated ’in bulk’ or ’top-down’, as populations of millions of cells
are manipulated and analysed. While these experiments give insights into the average behaviour of cells,
they do not account for cell-to-cell differences. Another approach to study cellular functions is to construct
artificial cells using only the most basic structural building blocks (’bottom-up’). One such basic building
block is the cellular phospholipid membrane that compartmentalises the cell and distinguishes it from the
environment.
A number of methods to create such simple compartments, also called liposomes, have been developed as
the area of artificial cells has sparked interest in the academic community. While commonly used methods
suffer from unclean production, heterogeneous populations and time-consuming procedures, recent advances
in microfluidics-based approaches adress these issues directly.
In this work, we investigated one of these methods called Octanol-assisted Liposome Assembly (OLA). OLA
allowed us to produce solvent-free giant unilamellar vesicles (GUVs) within minutes instead of the usually
needed hours. Our goal was to adapt and optimise OLA by experimenting with the microfluidic device
design, the aqueous and oil phases, as well as the procedural details. We found optimised conditions for the
production of 2-Oleoyl-1-palmitoyl-sn-glycero-3-phosphocholine (POPC) GUVs on-chip. By using 5 mg/ml
of lipids in the lipid-carrying oil phase (LO) and a surfactant concentration of 2.5/5 vol% in the inner
aqueous (IA) and outer aqueous (OA) phase, respectively, we managed to produce stable, homogeneously-
sized GUVs in a high-throughput manner. By altering the chip design, we further optimised the liposome
integrity and production efficiency on-chip.
We also developed a straightforward translocation assay, as it represents one of the most common transport
mechanisms across biological membranes. By employing the calcium-sensitive fluorescent dye Fluo-4 (F4), we
were able to monitor the transport of Ca2+ via the ionophore ionomycin across the liposomal membrane. For
this, GUVs produced off-chip were captured on-chip, in hydrodynamic traps, and investigated by fluorescence
microscopy. Adapting this assay to an OLA-based setup was unsuccessful due to the incompatibility of F4
with the method. However, initial investigations into alternative assays were conducted and led to promising
results.
While we made substantial progress in a simple application of the method, we were continuously challenged
by the unpredictable nature of OLA. Unexpected consequences following minor changes were commonly
observed and might point to a low practicality of the method. Potential future investigations in OLA-based
GUVs certainly require thorough, time-intensive preparatory work.
Front page image: ’Crab-on-a-chip’; A double-layered OLA device connected to pressure pumps is used to create and manipulate
liposomes on-chip.
List of Abbreviations
List of Abbreviations
Chol Cholesterol (ovine)
DE Double emulsion
DI deionised
DOPC 1,2-dioleoyl-sn-glycero-3-phosphocholine
DOPE 1,2-dioleoyl-sn-glycero-3-phosphoethanolamine
DOPG 1,2-dioleoyl-sn-glycero-3-phospho-(1’-rac-glycerol)
DPBS Dulbecco’s phosphate buffered saline
EGTA Egtazic acid
F4 Fluo-4
F-68 (poly)oxyethylene-(poly)oxypropylene surfactant
GUV Giant unilamellar vesicle
IA Inner aqueous phase
LO Lipid-carrying oil phase
OA Outer aqueous phase
OLA Octanol-assisted liposome assembly
OLA V5-8 OLA chip versions 5 to 8
PDMS (poly)dimethylsiloxane
POPC 2-oleoyl-1-palmitoyl-sn-glycero-3-phosphocholine
POPS 2-oleoyl-1-palmitoyl-sn-glycero-3-phospho-L-serine
PVA (poly)vinyl alcohol
P188 Poloxamer 188
Rho-PE 1,2-dioleoyl-sn-glycero-3-phosphoethanolamine-N-(lissamine rhodamine B sulfonyl)
Span®80 Sorbitan oleate
Tween®20 (poly)oxyethylene sorbitan monolaurate
vol/mol/wt% volume/mole/weight percent

Contents
Contents
Abstract
List of Abbreviations
1 Introduction and State of the Art 1
1.1 (Droplet) Microfluidics . . . . . . . . . . . . . . . . . . . . . . . . . . . . . . . . . . . . . . . . . . 1
1.2 Artificial Cells . . . . . . . . . . . . . . . . . . . . . . . . . . . . . . . . . . . . . . . . . . . . . . . 1
1.3 Octanol-assisted Liposome Assembly . . . . . . . . . . . . . . . . . . . . . . . . . . . . . . . . . . 3
1.4 Membrane Permeation Assays . . . . . . . . . . . . . . . . . . . . . . . . . . . . . . . . . . . . . . 5
1.5 Goals of the Thesis . . . . . . . . . . . . . . . . . . . . . . . . . . . . . . . . . . . . . . . . . . . . . 6
2 Methods 7
2.1 Microfluidic Device Production . . . . . . . . . . . . . . . . . . . . . . . . . . . . . . . . . . . . . 7
2.1.1 Master Mold Fabrication . . . . . . . . . . . . . . . . . . . . . . . . . . . . . . . . . . . . . 7
2.1.2 Cast Molding . . . . . . . . . . . . . . . . . . . . . . . . . . . . . . . . . . . . . . . . . . . . 7
2.1.3 Double-Layered Devices . . . . . . . . . . . . . . . . . . . . . . . . . . . . . . . . . . . . . 8
2.1.4 Bonding . . . . . . . . . . . . . . . . . . . . . . . . . . . . . . . . . . . . . . . . . . . . . . . 9
2.1.5 Coating . . . . . . . . . . . . . . . . . . . . . . . . . . . . . . . . . . . . . . . . . . . . . . . 10
2.2 Off-Chip GUV Formation . . . . . . . . . . . . . . . . . . . . . . . . . . . . . . . . . . . . . . . . . 11
2.2.1 Mineral Oil Solutions . . . . . . . . . . . . . . . . . . . . . . . . . . . . . . . . . . . . . . . 11
2.2.2 Water-in-Oil Emulsion-Transfer . . . . . . . . . . . . . . . . . . . . . . . . . . . . . . . . . 11
2.3 On-Chip GUV Formation . . . . . . . . . . . . . . . . . . . . . . . . . . . . . . . . . . . . . . . . . 13
2.3.1 Phase Compositions . . . . . . . . . . . . . . . . . . . . . . . . . . . . . . . . . . . . . . . . 13
2.3.2 Octanol-assisted Liposome Assembly . . . . . . . . . . . . . . . . . . . . . . . . . . . . . 13
2.4 Calcium Permeation Assays . . . . . . . . . . . . . . . . . . . . . . . . . . . . . . . . . . . . . . . 14
2.4.1 Assay Preparations . . . . . . . . . . . . . . . . . . . . . . . . . . . . . . . . . . . . . . . . 14
2.4.2 Translocation Assay . . . . . . . . . . . . . . . . . . . . . . . . . . . . . . . . . . . . . . . . 14
2.4.3 Data analysis . . . . . . . . . . . . . . . . . . . . . . . . . . . . . . . . . . . . . . . . . . . . 15
3 Results and Discussion 17
3.1 OLA Optimisations . . . . . . . . . . . . . . . . . . . . . . . . . . . . . . . . . . . . . . . . . . . . 17
3.1.1 Microfabrication Process . . . . . . . . . . . . . . . . . . . . . . . . . . . . . . . . . . . . . 17
3.1.2 Lipid-carrying Oil Phase Composition . . . . . . . . . . . . . . . . . . . . . . . . . . . . . 19
3.1.3 Aqueous Phase Composition . . . . . . . . . . . . . . . . . . . . . . . . . . . . . . . . . . 23
3.1.4 Design Improvements . . . . . . . . . . . . . . . . . . . . . . . . . . . . . . . . . . . . . . . 25
3.2 Calcium Permeation Assay . . . . . . . . . . . . . . . . . . . . . . . . . . . . . . . . . . . . . . . . 33
3.2.1 Assay Preparation . . . . . . . . . . . . . . . . . . . . . . . . . . . . . . . . . . . . . . . . . 33
3.2.2 Off-Chip Assay . . . . . . . . . . . . . . . . . . . . . . . . . . . . . . . . . . . . . . . . . . . 34
3.2.3 On-Chip Assay . . . . . . . . . . . . . . . . . . . . . . . . . . . . . . . . . . . . . . . . . . . 38
4 Conclusion and Outlook 41
Contents
Acknowledgements 43
Appendix 44
Machinery . . . . . . . . . . . . . . . . . . . . . . . . . . . . . . . . . . . . . . . . . . . . . . . . . . . . . 44
Software . . . . . . . . . . . . . . . . . . . . . . . . . . . . . . . . . . . . . . . . . . . . . . . . . . . . . . 45
Materials . . . . . . . . . . . . . . . . . . . . . . . . . . . . . . . . . . . . . . . . . . . . . . . . . . . . . . 46
Mask Designs . . . . . . . . . . . . . . . . . . . . . . . . . . . . . . . . . . . . . . . . . . . . . . . . . . . 48
ImageJ Macro . . . . . . . . . . . . . . . . . . . . . . . . . . . . . . . . . . . . . . . . . . . . . . . . . . . 54
List of Figures 55
List of Tables 56
References 57
Declaration on Scientific Integrity 60
Introduction and State of the Art
1 Introduction and State of the Art
1.1 (Droplet) Microfluidics
The rapidly developing field of microfluidics is the science and technology of devices that incorporate fluid
channels, microstructures and actuators with dimensions from one to several hundred micrometers. Guiding
liquids through these channels, one can use microfluidic systems to manipulate and analyse volumes in the
nanoliter scale [1]. This dimension range makes microfluidics an ideal candidate for single-cell analysis [2].
Compared to their bench-top counterparts, microfluidic assays use drastically reduced volumes, leading to
an economical consumption of reagents (up to 1000-fold less), increased sensitivity and faster reaction times
[3].
Advances in microfabrication processes have allowed for the rapid development of different microfabrication
technologies. Complex devices that include components such as valves, electrodes and pumps are now easily
achievable. The flexibility in device design also allows for a high degree of parallelisation and therefore
high-throughput analysis on a single chip. The commonly used combination of soft lithography and cast
molding using the silicone elastomer (poly)dimethylsiloxane (PDMS) allows for a relatively inexpensive,
fast fabrication of large quantities of microfluidic chips [4]. PDMS is bio-compatible, gas-permeable and its
surface can be functionalised, allowing for a wide range of both biological and chemical assays. Furthermore,
it is optically transparent, enabling a multitude of analysis tools [5, 6].
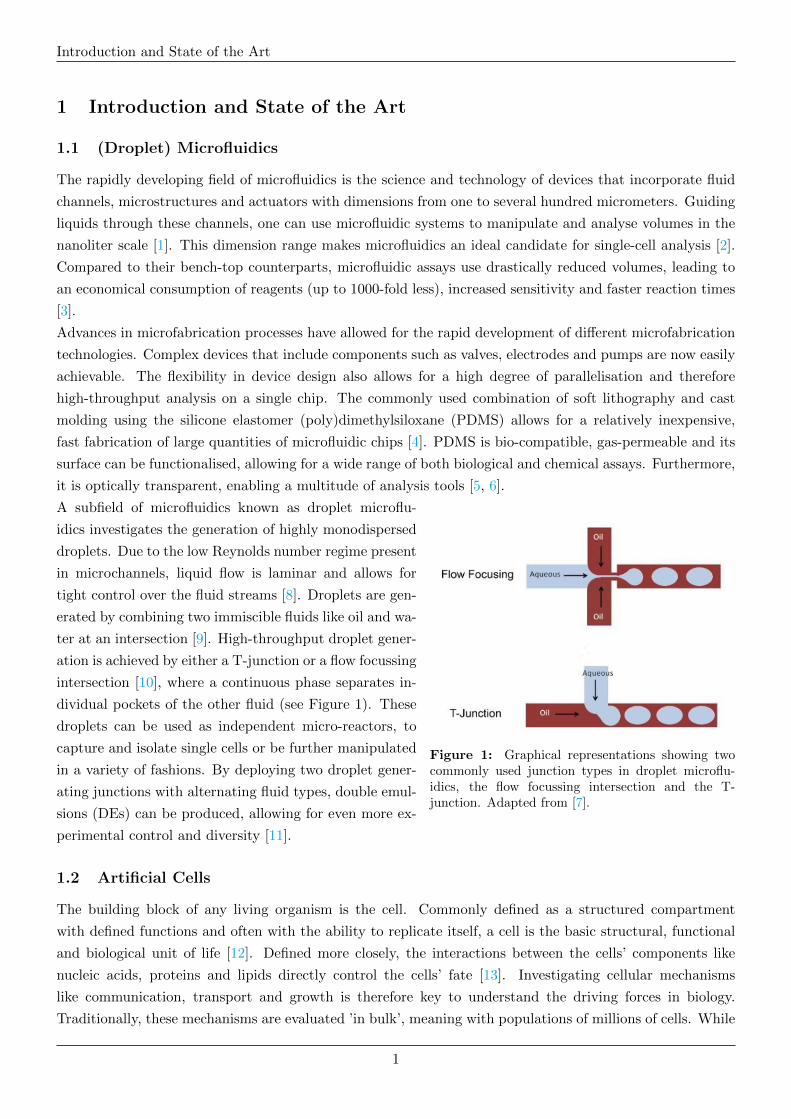
Figure 1: Graphical representations showing twocommonly used junction types in droplet microflu-idics, the flow focussing intersection and the T-junction. Adapted from [7].
A subfield of microfluidics known as droplet microflu-
idics investigates the generation of highly monodispersed
droplets. Due to the low Reynolds number regime present
in microchannels, liquid flow is laminar and allows for
tight control over the fluid streams [8]. Droplets are gen-
erated by combining two immiscible fluids like oil and wa-
ter at an intersection [9]. High-throughput droplet gener-
ation is achieved by either a T-junction or a flow focussing
intersection [10], where a continuous phase separates in-
dividual pockets of the other fluid (see Figure 1). These
droplets can be used as independent micro-reactors, to
capture and isolate single cells or be further manipulated
in a variety of fashions. By deploying two droplet gener-
ating junctions with alternating fluid types, double emul-
sions (DEs) can be produced, allowing for even more ex-
perimental control and diversity [11].
1.2 Artificial Cells
The building block of any living organism is the cell. Commonly defined as a structured compartment
with defined functions and often with the ability to replicate itself, a cell is the basic structural, functional
and biological unit of life [12]. Defined more closely, the interactions between the cells’ components like
nucleic acids, proteins and lipids directly control the cells’ fate [13]. Investigating cellular mechanisms
like communication, transport and growth is therefore key to understand the driving forces in biology.
Traditionally, these mechanisms are evaluated ’in bulk’, meaning with populations of millions of cells. While
1
Introduction and State of the Art Artificial Cells
this certainly led to fundamental knowledge about cellular mechanisms, it is only appropriate for samples in
large quantities and homogeneous distributions. Furthermore, results measured in bulk can only be viewed
as an average and do not necessarily account for cell-to-cell differences. It is therefore desired to conduct
investigations at single cell resolution to further elucidate individual behaviour.
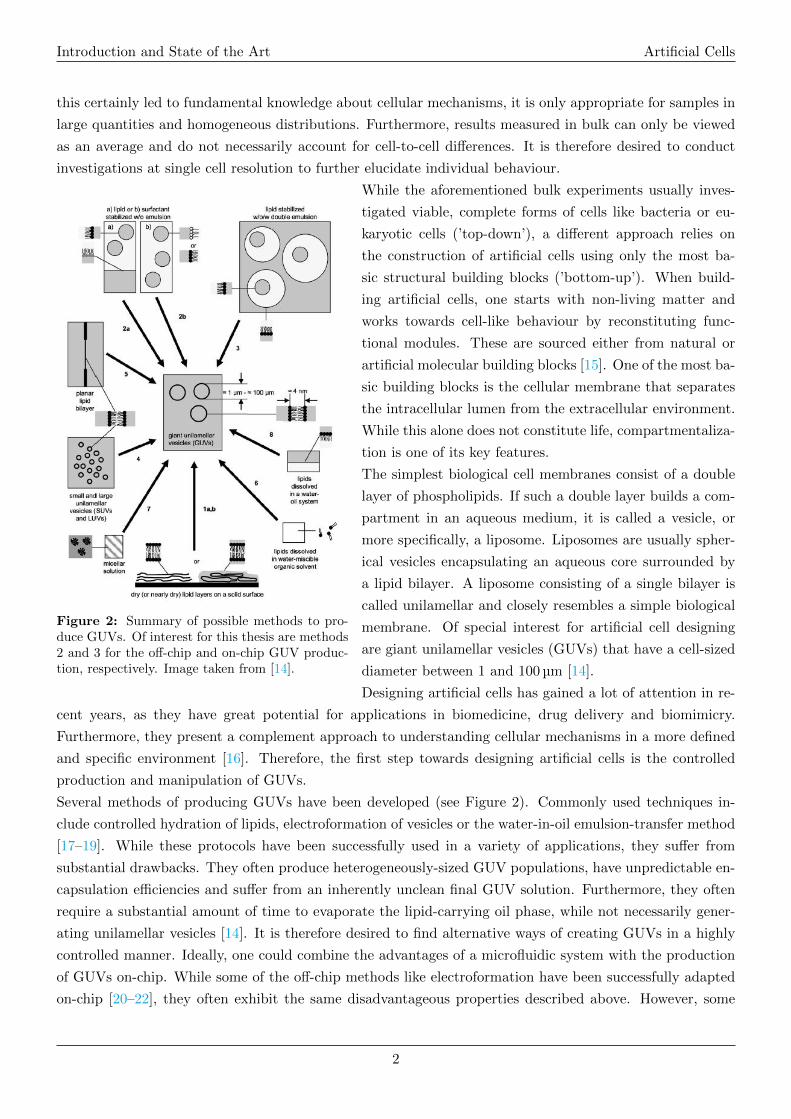
Figure 2: Summary of possible methods to pro-duce GUVs. Of interest for this thesis are methods2 and 3 for the off-chip and on-chip GUV produc-tion, respectively. Image taken from [14].
While the aforementioned bulk experiments usually inves-
tigated viable, complete forms of cells like bacteria or eu-
karyotic cells (’top-down’), a different approach relies on
the construction of artificial cells using only the most ba-
sic structural building blocks (’bottom-up’). When build-
ing artificial cells, one starts with non-living matter and
works towards cell-like behaviour by reconstituting func-
tional modules. These are sourced either from natural or
artificial molecular building blocks [15]. One of the most ba-
sic building blocks is the cellular membrane that separates
the intracellular lumen from the extracellular environment.
While this alone does not constitute life, compartmentaliza-
tion is one of its key features.
The simplest biological cell membranes consist of a double
layer of phospholipids. If such a double layer builds a com-
partment in an aqueous medium, it is called a vesicle, or
more specifically, a liposome. Liposomes are usually spher-
ical vesicles encapsulating an aqueous core surrounded by
a lipid bilayer. A liposome consisting of a single bilayer is
called unilamellar and closely resembles a simple biological
membrane. Of special interest for artificial cell designing
are giant unilamellar vesicles (GUVs) that have a cell-sized
diameter between 1 and 100 µm [14].
Designing artificial cells has gained a lot of attention in re-
cent years, as they have great potential for applications in biomedicine, drug delivery and biomimicry.
Furthermore, they present a complement approach to understanding cellular mechanisms in a more defined
and specific environment [16]. Therefore, the first step towards designing artificial cells is the controlled
production and manipulation of GUVs.
Several methods of producing GUVs have been developed (see Figure 2). Commonly used techniques in-
clude controlled hydration of lipids, electroformation of vesicles or the water-in-oil emulsion-transfer method
[17–19]. While these protocols have been successfully used in a variety of applications, they suffer from
substantial drawbacks. They often produce heterogeneously-sized GUV populations, have unpredictable en-
capsulation efficiencies and suffer from an inherently unclean final GUV solution. Furthermore, they often
require a substantial amount of time to evaporate the lipid-carrying oil phase, while not necessarily gener-
ating unilamellar vesicles [14]. It is therefore desired to find alternative ways of creating GUVs in a highly
controlled manner. Ideally, one could combine the advantages of a microfluidic system with the production
of GUVs on-chip. While some of the off-chip methods like electroformation have been successfully adapted
on-chip [20–22], they often exhibit the same disadvantageous properties described above. However, some
2
Introduction and State of the Art Octanol-assisted Liposome Assembly
of the key advantages of producing GUVs on-chip are the high control through laminar flow, the mostly
homogeneously sized population and its high encapsulation efficiency [23]. Microfluidics is therefore worth
investigating, especially as one can not only produce, but also observe and manipulate GUVs in a single
device. One of the most promising approaches of recent years is the octanol-assisted liposome assembly
on-chip, discussed in the following section.
1.3 Octanol-assisted Liposome Assembly
Octanol-assisted liposome assembly, abbreviated OLA, is a method developed in 2016 by Deshpande et al.
[24]. The main goal of the research group was to reduce the necessary time for the production of solvent-
free, mature unilamellar vesicles. As mentioned before, the most time-consuming step in many liposome
production methods is the evaporation of the lipid-carrying oil phase that can take up to multiple hours and
might leave residual oil within the membrane. To solve this issue, Deshpande et al. investigated different
suitable oil phases for their compatibility with a microfluidic-based liposome production. Using a microfluidic
platfrom also guaranteed a homogeneously sized vesicle population and minimal reagent consumption, as
described in subsection 1.1.
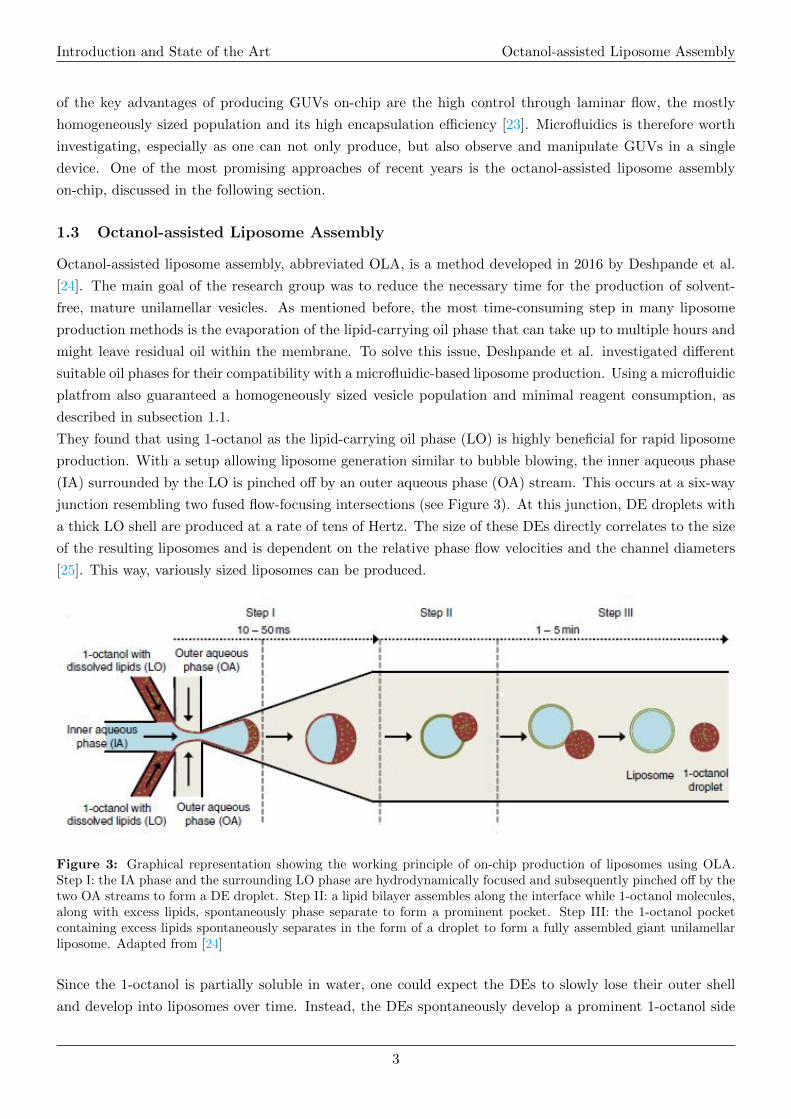
They found that using 1-octanol as the lipid-carrying oil phase (LO) is highly beneficial for rapid liposome
production. With a setup allowing liposome generation similar to bubble blowing, the inner aqueous phase
(IA) surrounded by the LO is pinched off by an outer aqueous phase (OA) stream. This occurs at a six-way
junction resembling two fused flow-focusing intersections (see Figure 3). At this junction, DE droplets with
a thick LO shell are produced at a rate of tens of Hertz. The size of these DEs directly correlates to the size
of the resulting liposomes and is dependent on the relative phase flow velocities and the channel diameters
[25]. This way, variously sized liposomes can be produced.
Figure 3: Graphical representation showing the working principle of on-chip production of liposomes using OLA.Step I: the IA phase and the surrounding LO phase are hydrodynamically focused and subsequently pinched off by thetwo OA streams to form a DE droplet. Step II: a lipid bilayer assembles along the interface while 1-octanol molecules,along with excess lipids, spontaneously phase separate to form a prominent pocket. Step III: the 1-octanol pocketcontaining excess lipids spontaneously separates in the form of a droplet to form a fully assembled giant unilamellarliposome. Adapted from [24]
Since the 1-octanol is partially soluble in water, one could expect the DEs to slowly lose their outer shell
and develop into liposomes over time. Instead, the DEs spontaneously develop a prominent 1-octanol side
3
Introduction and State of the Art Octanol-assisted Liposome Assembly
pocket towards the direction of the flow. Due to interfacial energy minimization, this side pocket eventually
separates to yield fully assembled vesicles. The whole process occurs within minutes, yielding homogeneous,
solvent-free, unilamellar liposomes [24].
The process is facilitated by the incorporation of the Pluronic® (poly)oxyethylene-(poly)oxypropylene block
copolymer surfactant (called F-68 from here on) in the aqueous phases that stabilises both the interfaces
and the separation process. Furthermore, the addition of glycerol optimises the viscosity of the OA for an
ideal pinching-off at the junction. While the glycerol can be excluded if needed, DE production is extremely
challenging without the surfactant. However, recent insights suggest advances in this area and need to be
investigated further [26].
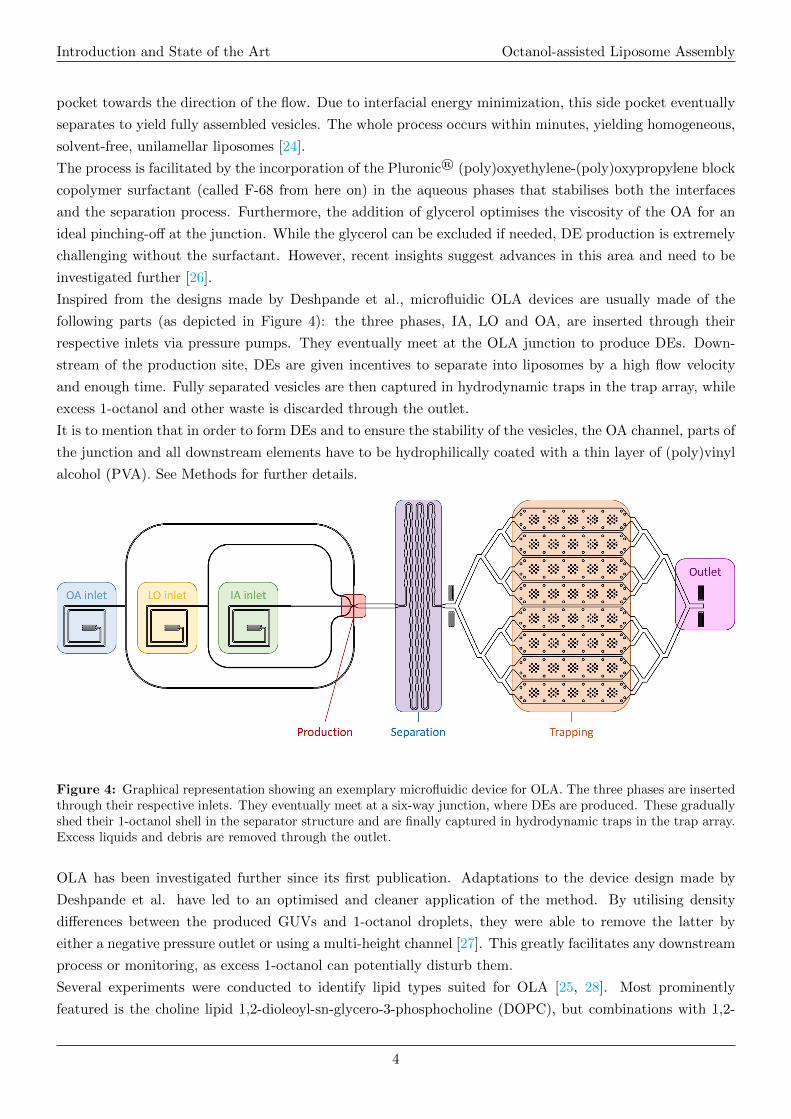
Inspired from the designs made by Deshpande et al., microfluidic OLA devices are usually made of the
following parts (as depicted in Figure 4): the three phases, IA, LO and OA, are inserted through their
respective inlets via pressure pumps. They eventually meet at the OLA junction to produce DEs. Down-
stream of the production site, DEs are given incentives to separate into liposomes by a high flow velocity
and enough time. Fully separated vesicles are then captured in hydrodynamic traps in the trap array, while
excess 1-octanol and other waste is discarded through the outlet.
It is to mention that in order to form DEs and to ensure the stability of the vesicles, the OA channel, parts of
the junction and all downstream elements have to be hydrophilically coated with a thin layer of (poly)vinyl
alcohol (PVA). See Methods for further details.
Figure 4: Graphical representation showing an exemplary microfluidic device for OLA. The three phases are insertedthrough their respective inlets. They eventually meet at a six-way junction, where DEs are produced. These graduallyshed their 1-octanol shell in the separator structure and are finally captured in hydrodynamic traps in the trap array.Excess liquids and debris are removed through the outlet.
OLA has been investigated further since its first publication. Adaptations to the device design made by
Deshpande et al. have led to an optimised and cleaner application of the method. By utilising density
differences between the produced GUVs and 1-octanol droplets, they were able to remove the latter by
either a negative pressure outlet or using a multi-height channel [27]. This greatly facilitates any downstream
process or monitoring, as excess 1-octanol can potentially disturb them.
Several experiments were conducted to identify lipid types suited for OLA [25, 28]. Most prominently
featured is the choline lipid 1,2-dioleoyl-sn-glycero-3-phosphocholine (DOPC), but combinations with 1,2-
4
Introduction and State of the Art Membrane Permeation Assays
dioleoyl-sn-glycero-3-phospho-(1’-rac-glycerol) (DOPG) and 1,2-dioleoyl-sn-glycero-3-phosphoethanolamine
(DOPE) were thoroughly investigated as well [28]. However, this list is not extensive as other lipid types,
including charged species, may also be compatible with OLA.
While OLA remains a relatively new tool, it has been used for further investigations involving liposomes. For
example, Schaich et al. used OLA-generated GUVs to quantify passive drug permeation across a liposomal
membrane [29]. By combining complex microfluidic devices with the OLA production, vesicles were also
fused [30] or split [31] downstream of the junction, giving further insights into the liposomes’ properties.
The junction design for DE production has also been adapted to produce polymer GUVs (polymersomes).
In this case, the lipids were replaced by amphiphilic diblock copolymers [32]. Despite these examples, other
research groups have been slow to adopt OLA, which might indicate a lack of know-how and experience
to solve unexpected hurdles. The absence of a large quantity of publications involving this seemingly
revolutionary method might moreover indicate a low practicality.
1.4 Membrane Permeation Assays
One of the most crucial cellular mechanism is the translocation of chemicals across its phospholipid mem-
brane. Translocation is used for a variety of processes, like the supply of the cell with necessary nutrients,
the removal of waste products and as a communication channel [33]. Apart from passive diffusion of small
molecules, the lipid bilayer of a cell acts as a semi-permeable barrier that allows for the upkeep of otherwise
impossible concentration gradients and the exclusion of larger moieties. It controls both in- and efflux via
transporter molecules or membrane channel proteins [12, 13].
Ions are especially important regarding cellular transport. As charged species they are generally unable to
cross the phospholipid membrane and require entry via facilitated diffusion or ion channels. Maintaining
appropriate ion concentrations is essential for e.g. cellular communication, maintaining homeostasis or en-
ergy production [34]. In particular, maintaining a strong Ca2+ gradient across the cell membrane of neurons
is required for all neuronal functions in humans [35].
Working towards artificial cells, it is therefore desired to integrate some sort of translocation mechanism as
a basic function. As mentioned before, transmembrane transport of otherwise impassable chemicals can be
achieved by either facilitated diffusion or channel structures. The former requires a suited carrier moiety
capable of crossing the liposomal membrane with its cargo. On the other hand, a channel needs to be stably
inserted into the membrane and open a pore that allows for the diffusion of the investigated chemicals.
As calcium translocation is an abundant process in nature, we decided to investigate it in a liposomal
system. For this, the calcium-sensitive fluorescent dye Fluo-4 (F4) was encapsulated in liposomes. The
fluorescence of F4 strongly increases when it binds to a Ca2+ ion and can therefore be used to observe
any influx of calcium [36]. Calcium transport could either be initiated by an ionophore like ionomycin [37],
or an ion channel like α-hemolysin (see Figure 5). α-hemolysin is a pore-forming toxin that spontaneously
assembles in single bilayer phospholipid membranes [38]. As the length of the pore only allows insertions
into single phospholipid bilayers, it has also been extensively used to prove the unilamellarity of vesicle
membranes, including OLA-generated liposomes [24, 39–41]. However, as a toxin, it is more likely to disrupt
the membranes’ integrity. We therefore decided to first investigate the facilitated diffusion of calcium using
ionomycin.
5

Introduction and State of the Art Goals of the Thesis
Figure 5: Graphical representation showing the proposed chemical assays involving GUVs. The calcium-sensitivefluorescent dye Fluo-4 is encapsulated inside the GUVs. Calcium is transported across the liposomal membrane eithervia an ionophore (ionomycin) or through pores (α-hemolysin). The calcium translocation is monitored through thefluorescence intensity increase of F4.
1.5 Goals of the Thesis
In this thesis, we aimed to develop a robust and reliable method of producing, manipulating and observing
GUVs on-chip. We aimed to adapt and optimise the method of octanol-assisted liposome assembly, in order
to be able to potentially apply it to various biological and chemical assays. To achieve these goals, the
following tasks were identified:
• Development of a robust method for OLA chip fabrication. This requires the production of (double-
layered) microfluidic devices with patterned hydrophilic coating.
• Optimisation of the on-chip production of GUVs using OLA. This requires investigations into suitable
lipid types, oil and aqueous phases, chip designs, as well as procedural changes.
• Development of straightforward assays investigating GUVs. This requires preparatory (off-chip) ex-
periments to find suitable concentration ranges and identify potential challenges.
• Adaptation of said assays into OLA. This requires the insights and results gathered from all previous
experiments.
Ideally, the work of this thesis leads to a deeper understanding of the OLA method in all its aspects and allows
for educated decisions with regards to its potential application in future research involving the production
of GUVs on-chip.
6
Methods
2 Methods
All machinery, softwares and chemicals used during the thesis are listed in the appendix. As many of
the experiments conducted were actively investigating potential changes in the procedures, only the most
common and most successful protocols are described in this section. Deviations from these are specifically
highlighted when required.
2.1 Microfluidic Device Production
2.1.1 Master Mold Fabrication
A microfluidic network of channels comprising either a fluid or a pressure layer was designed using AutoCAD
software. The resulting chip design was then printed at high resolution on a film photomask by the company
Selba S.A. Usually, each photomask contained multiple copies of identical designs to allow parallel production
of microfluidic devices. From this, a master mold was fabricated using standard soft lithography techniques
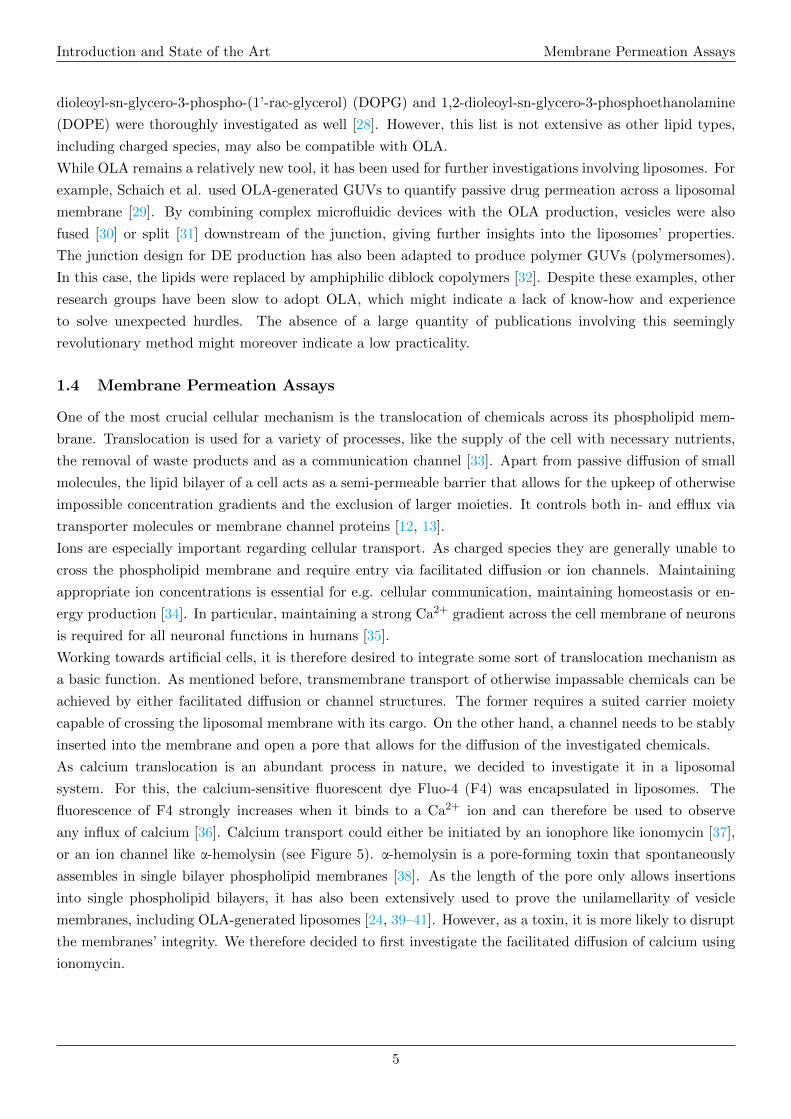
in a cleanroom environment. Illustrations to the described procedure can be found in Figure 6. In detail,
a 4-inch silicon wafer was cleaned sequentially with acetone, isopropanol and deionised (DI) water and
subsequently dehydrated at 180 ○C for 15 min. The wafer was subjected to oxygen plasma for 5 min. SU-8
3010 negative photoresist was spin-coated to a final thickness of ∼11 µm (3’000 rpm) for fluid layer master
molds. SU-8 3025 resist (∼20 µm, 2000 rpm) was used for pressure layer and trap chip master molds. The
coated wafer was baked on a hotplate at 65 ○C for 1 min and at 95 ○C for 5 min and finally at 65 ○C for 1
min. The wafer was aligned and vacuum-sealed to the photomask and subsequently exposed to UV light, at
a dose of 250 mJ/cm2. An i-line filter was used to eliminate UV radiation below 350 nm. The exposed wafer
was baked on a hotplate at 65 ○C for 1 min, at 95 ○C for 3 min. Finally, the wafer was submerged in the
mr-Dev 600 PGMEA developer solution for 5 min to wash off non-crosslinked SU-8 and then hard baked at
200 ○C for 2 h. To protect the master mold and make it PDMS-compatible, it was then silanized by vapour
depositing 1H,1H,2H,2H -Perfluorodecyltrichlorosilane under low pressure (100 mbar) for at least 1 h.
Figure 6: Graphical representation showing the microfabrication of a silicon master mold. A layer of SU-8 negativephotoresist (orange) is spun onto a silicon wafer (black). The photoresist is exposed to UV light through a photomask(grey). As a result, the exposed SU-8 crosslinks (red), making it chemically resistant to the developer solution, whichwashes away non-crosslinked SU-8. The master mold is then protected from PDMS and mechanical damage with athin silane layer (green). Layers are not to scale.
2.1.2 Cast Molding
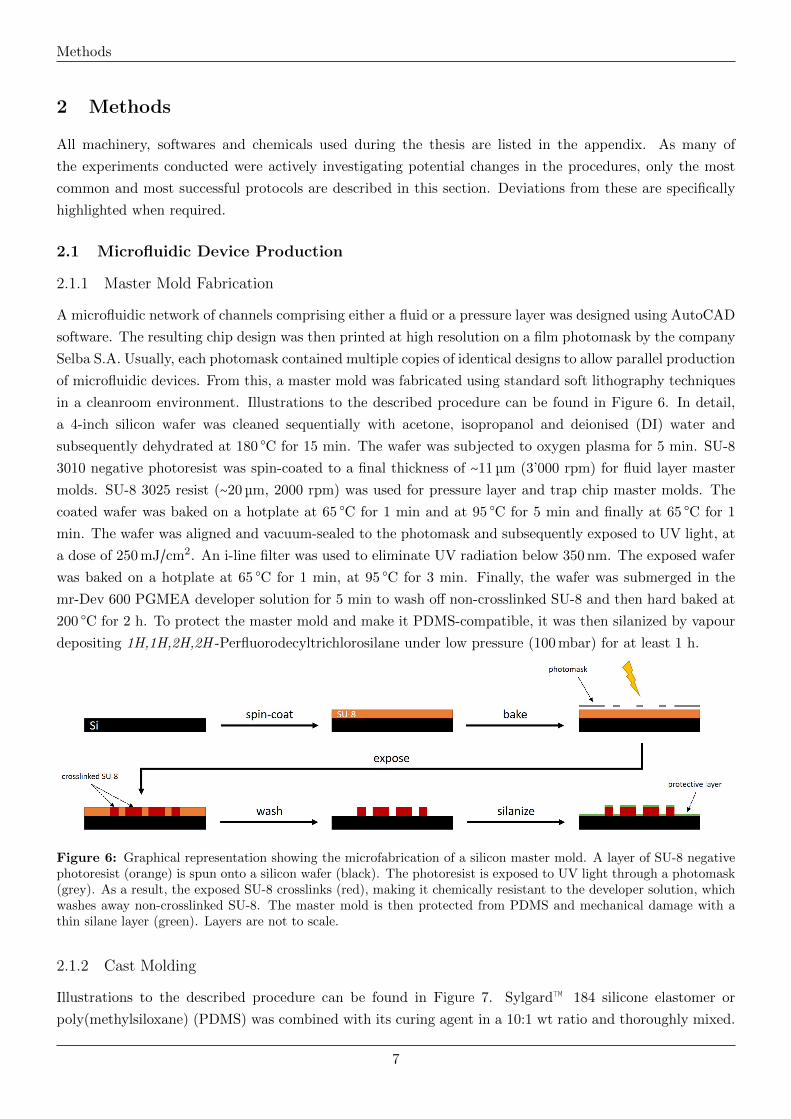
Illustrations to the described procedure can be found in Figure 7. Sylgard™ 184 silicone elastomer or
poly(methylsiloxane) (PDMS) was combined with its curing agent in a 10:1 wt ratio and thoroughly mixed.
7
Methods Microfluidic Device Production
The PDMS was then degassed under vacuum for 30 min. For devices made of a single fluid layer, the mixture
was subsequently poured over the master mold, which was cleaned under a stream of nitrogen beforehand.
After pouring, the whole mold was degassed again for 30 min and finally cured at 80 ○C for a minimum of
5 h.
Afterwards, the cured PDMS was carefully peeled off the wafer and placed in a cleanbench with the channel
structures facing upward. A lateral light source was used to illuminate the microstructures for more accurate
processing. Individual chips were separated using a razor blade. Access holes to in- and outlets were punched
using biopsy punchers. The size of the holes is dependent on the desired downstream function: OLA chips
have in- and outlet holes of 0.5 mm diameter to fit the metal pin connectors. On the other hand, trap chips
and pressure layers require holes that are of similar size to pipette tips that function as reservoirs (either 1
or 1.5 mm diameter). Generally, the chip surfaces were regularly cleaned under a nitrogen stream and with
scotch tape to remove dust and other particles. Covered with scotch tape, PDMS chips can be stored in a
closed petri dish for weeks.
Figure 7: Graphical representation showing the PDMS replication from a master mold. A mixture of PDMS andcuring agent (blue) is poured onto the master mold (black/red). The PDMS is degassed and cured in an oven. ThePDMS slab is carefully peeled off and microfluidic chips are cut out individually. Access ports are punched with abiopsy puncher, and the resulting chip is plasma bonded to a PDMS-coated glass slide (grey), sealing the channels(white). The device is then rendered hydrophilic by coating it with a thin layer of PVA (violet). Bonding and coatingprocedures are described later in this section. Layers are not to scale.
2.1.3 Double-Layered Devices
Devices containing two layers consist of a bottom fluid layer and a top pressure layer, also called control
layer. The bottom layer contains the fluid channels and arrays of chambers with hydrodynamic traps (as in
the single layer devices). The top layer contains channels, which upon pressure-induced actuation serve as a
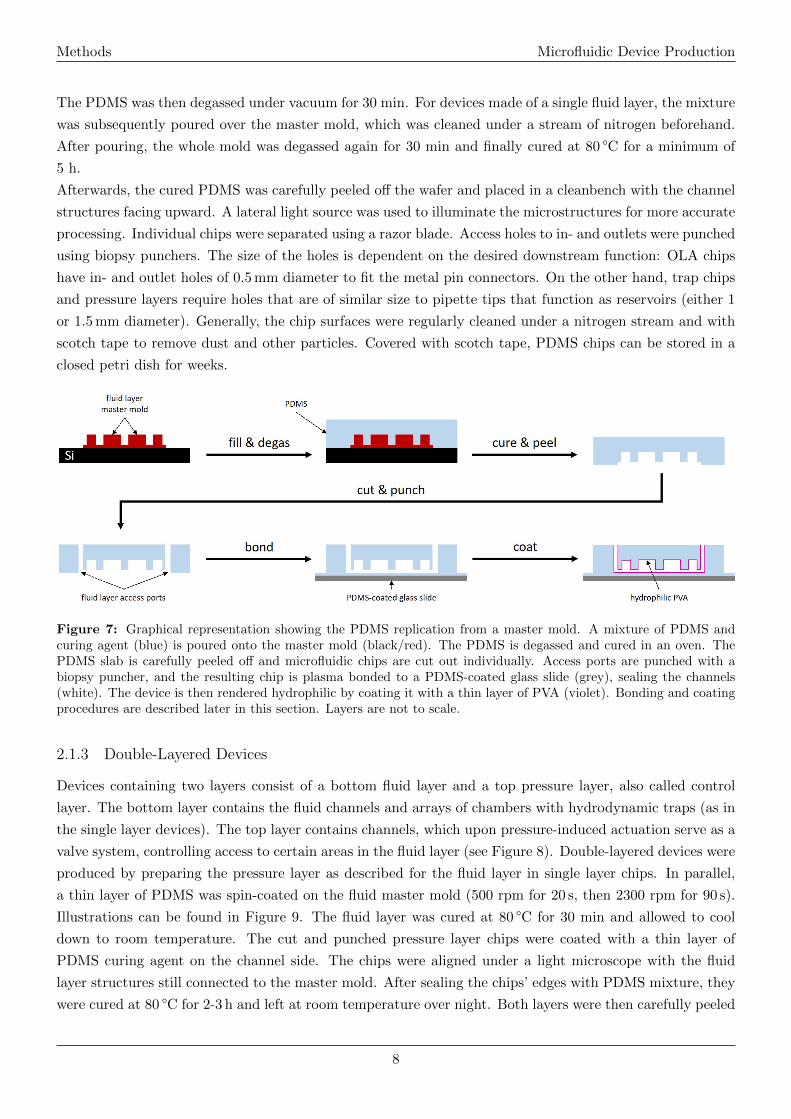
valve system, controlling access to certain areas in the fluid layer (see Figure 8). Double-layered devices were
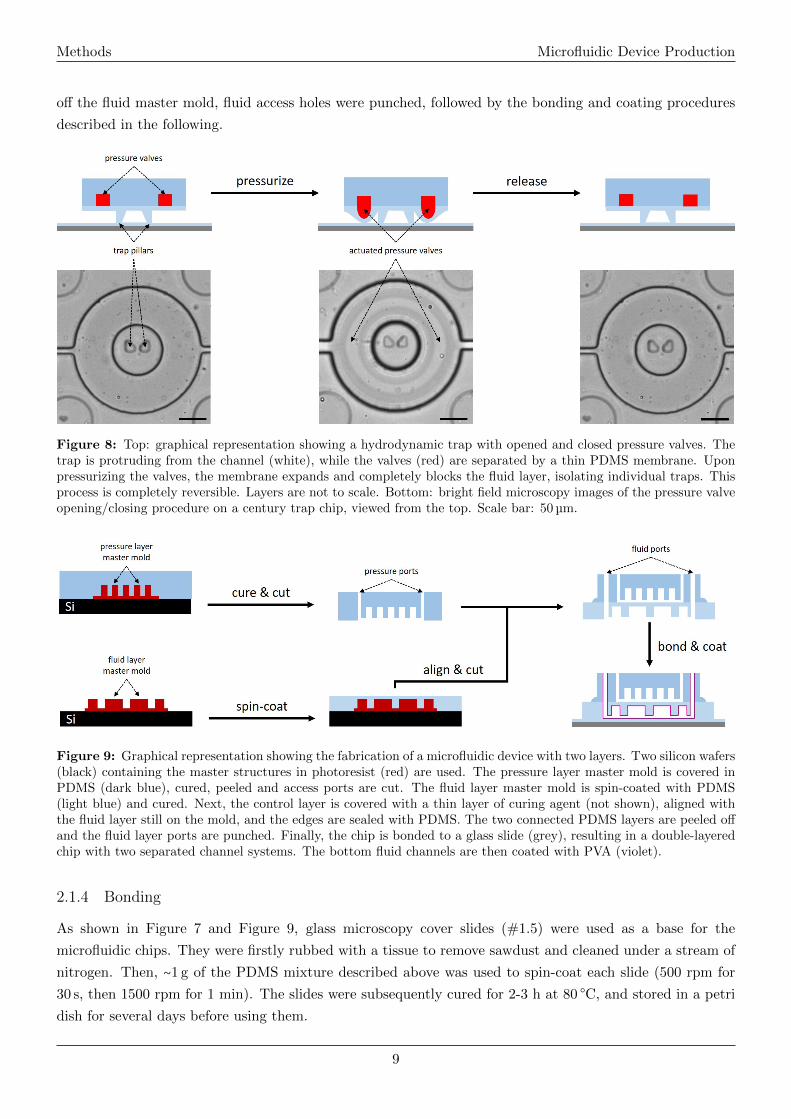
produced by preparing the pressure layer as described for the fluid layer in single layer chips. In parallel,
a thin layer of PDMS was spin-coated on the fluid master mold (500 rpm for 20 s, then 2300 rpm for 90 s).
Illustrations can be found in Figure 9. The fluid layer was cured at 80 ○C for 30 min and allowed to cool
down to room temperature. The cut and punched pressure layer chips were coated with a thin layer of
PDMS curing agent on the channel side. The chips were aligned under a light microscope with the fluid
layer structures still connected to the master mold. After sealing the chips’ edges with PDMS mixture, they
were cured at 80 ○C for 2-3 h and left at room temperature over night. Both layers were then carefully peeled
8
Methods Microfluidic Device Production
off the fluid master mold, fluid access holes were punched, followed by the bonding and coating procedures
described in the following.
Figure 8: Top: graphical representation showing a hydrodynamic trap with opened and closed pressure valves. Thetrap is protruding from the channel (white), while the valves (red) are separated by a thin PDMS membrane. Uponpressurizing the valves, the membrane expands and completely blocks the fluid layer, isolating individual traps. Thisprocess is completely reversible. Layers are not to scale. Bottom: bright field microscopy images of the pressure valveopening/closing procedure on a century trap chip, viewed from the top. Scale bar: 50 µm.
Figure 9: Graphical representation showing the fabrication of a microfluidic device with two layers. Two silicon wafers(black) containing the master structures in photoresist (red) are used. The pressure layer master mold is covered inPDMS (dark blue), cured, peeled and access ports are cut. The fluid layer master mold is spin-coated with PDMS(light blue) and cured. Next, the control layer is covered with a thin layer of curing agent (not shown), aligned withthe fluid layer still on the mold, and the edges are sealed with PDMS. The two connected PDMS layers are peeled offand the fluid layer ports are punched. Finally, the chip is bonded to a glass slide (grey), resulting in a double-layeredchip with two separated channel systems. The bottom fluid channels are then coated with PVA (violet).
2.1.4 Bonding
As shown in Figure 7 and Figure 9, glass microscopy cover slides (#1.5) were used as a base for the
microfluidic chips. They were firstly rubbed with a tissue to remove sawdust and cleaned under a stream of
nitrogen. Then, ∼1 g of the PDMS mixture described above was used to spin-coat each slide (500 rpm for
30 s, then 1500 rpm for 1 min). The slides were subsequently cured for 2-3 h at 80 ○C, and stored in a petri
dish for several days before using them.
9
Methods Microfluidic Device Production
Both PDMS chips and coated glass slides were placed pairwise in a plasma cleaner and plasma activated
(45 s at 18 W and 0.7-0.75 mbar O2 pressure). PDMS chips and glass slides were then bonded by placing
the chip on the slide with the channel structures facing down and applying gentle pressure. Afterwards, the
devices were again cured at 80 ○C for 15 min.
2.1.5 Coating
A thin hydrophilic layer of 2.5 wt% PVA was applied to all necessary fluid channels for the following reasons.
Firstly, the coating of the OA channel and the junction in OLA devices is crucial for the successful production
of vesicles on-chip. It enables the production of water-in-oil-in-water double emulsions (DEs). Secondly, all
downstream structures like the trap array were coated to ensure the integrity of the liposomes inside the
microfluidic device. Without the coating, vesicles would quickly adhere to the channel walls and break.
OLA chips were usually coated at the latest the next day after bonding. An ideal time window is 4-6 h after
bonding, as there is an optimal balance between the hydrophobicity of the PDMS and the hydrophilicity
induced by the plasma treatment [24].
Similarly, all channels in trap chips were coated by inserting the PVA solution into the channels using a
syringe. The chips were left to incubate at room temperature for 5 min and subsequently washed with 500 µl
of DI water. Then the chips were incubated at 120 ○C for 30 min and stored at room temperature overnight
before use.
Since OLA devices require patterned hydrophilic coating, parts of the channels, namely the IA and LO
channels, needed to remain hydrophobic. In order to achieve this, they were protected by a constant
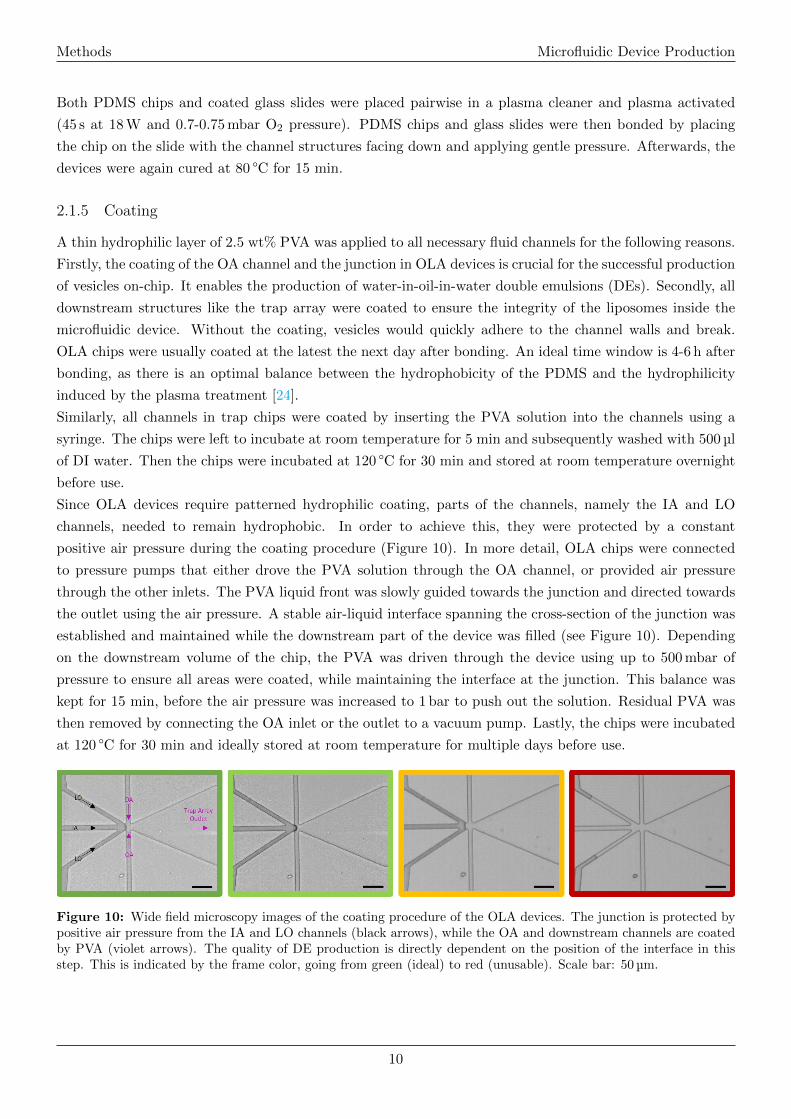
positive air pressure during the coating procedure (Figure 10). In more detail, OLA chips were connected
to pressure pumps that either drove the PVA solution through the OA channel, or provided air pressure
through the other inlets. The PVA liquid front was slowly guided towards the junction and directed towards
the outlet using the air pressure. A stable air-liquid interface spanning the cross-section of the junction was
established and maintained while the downstream part of the device was filled (see Figure 10). Depending
on the downstream volume of the chip, the PVA was driven through the device using up to 500 mbar of
pressure to ensure all areas were coated, while maintaining the interface at the junction. This balance was
kept for 15 min, before the air pressure was increased to 1 bar to push out the solution. Residual PVA was
then removed by connecting the OA inlet or the outlet to a vacuum pump. Lastly, the chips were incubated
at 120 ○C for 30 min and ideally stored at room temperature for multiple days before use.
Figure 10: Wide field microscopy images of the coating procedure of the OLA devices. The junction is protected bypositive air pressure from the IA and LO channels (black arrows), while the OA and downstream channels are coatedby PVA (violet arrows). The quality of DE production is directly dependent on the position of the interface in thisstep. This is indicated by the frame color, going from green (ideal) to red (unusable). Scale bar: 50 µm.
10
Methods Off-Chip GUV Formation
Faulty chips (e.g. blocked channels, dirty PDMS or delaminating slides) were discarded. Suboptimally
coated OLA chips, particularly in the case of the PVA entering the IA or LO channel, were discarded as
well, as they do not allow vesicle production on-chip.
2.2 Off-Chip GUV Formation
2.2.1 Mineral Oil Solutions
The water-in-oil emulsion transfer method (see next subsection) requires lipids in a light oil solution, as a
stable interface between two layers needs to be established. Mineral oil is an ideal candidate, as it is a good
solvent for lipids, and is lighter than the aqueous phases used in the experiments.
Lipid mineral oil solutions were prepared in a pointed glass flask. The flask was cleaned with a H2O : EtOH
: Isopropanol (1:1:1) mixture by sonicating the filled flask for 30 min. After discarding the solvents, the
beaker was again extensively flushed with isopropanol and chloroform. Then, appropriate amounts of lipid
stock solution in chloroform was added. The following formula was used:
Vreq =cdes ∗ Vdes ∗Mw
cstock∗ Pdes
where Vreq is the volume of stock solution required, cdes is the desired final lipid concentration, Vdes is the
desired final mineral oil solution volume, Mw is the molar weight of the lipid, cstock is the concentration of the
lipid chloroform stock solution and Pdes is the desired percentage of different lipid types in the case of mixed
solutions. Generally, mineral oil solutions were prepared at a concentration of 200 µM and a quantity of
25 ml. The rhodamine-labelled lipid 1,2-dioleoyl-sn-glycero-3-phosphoethanolamine-N-(lissamine rhodamine
B sulfonyl) (Rho-PE) was added in a molar ratio of 0.1 mol% when needed for fluorescence imaging.
After addition of the lipids, the flask was fixed in a rotating evaporator at an angle of maximum liquid-
to-glass surface contact. The chloroform was evaporated under slow rotation (200 mbar for 15 min, then
<1 mbar for 1 h). Ideally, a homogeneous lipid film formed along the glass surface. Otherwise, the lipids
were redissolved in chloroform and the process was restarted. The lipid film was dissolved in appropriate
amounts of mineral oil, the beaker was thoroughly agitated, sonicated for 1 h and left at room temperature
over night. Mineral oil solutions were stored at −20 ○C and slowly warmed up to room temperature before
use.
2.2.2 Water-in-Oil Emulsion-Transfer
The water-in-oil emulsion-transfer method was used for rapid GUV production off-chip [19]. Illustrations
to the described procedure can be found in Figure 11. For all aqueous phases, either Dulbecco’s Phosphate
Buffered Saline (DPBS) or DI water was used as a base. Firstly, a stable lipid interface between the OA and
the LO was established. For this, 200 µl of LO were carefully layered on top of 500 µl of OA in an Eppendorf
tube using a repeater pipette. The tube was then covered and left at room temperature for at least 5 h,
ideally however over night, for the lipids to align at the water-oil interface. In a second Eppendorf tube,
500 µl of LO were layered on top of 50 µl of IA. Here, the IA is required to be slightly denser than the OA,
in order to later pellet the vesicles with a centrifugation step and allow the exchange of the OA buffer. For
this reason, 2.5 µl (5 vol%) of Optiprep™ Density Gradient Medium was added to the IA. Optiprep™ solely
affects the density of the IA. Furthermore, the osmolarity difference between OA and IA should not exceed
50 mOsm/kg, as this likely disrupts the GUVs’ integrity. Typically used phase compositions can be found
11

Methods Off-Chip GUV Formation
in Table 1.
The tube containing the IA was scratched 5-8 times over a tube rack to create the water-in-oil emulsion.
500 µl of the emulsion mixture was carefully transferred to the LO layer of the first tube without disturbing
the interface. This tube was then centrifuged (1500 x g for 2 min), the supernatant was carefully aspirated
and the pellet resuspended in 300 µl of OA and centrifuged again. The GUVs were washed in this manner
three times, before being resuspended in 200 µl of OA and stored in the fridge for up to a week.
Table 1: Phase composition summary of initial off-chip GUV production. Experiments were conducted using aqueousphases based on either calcium-free DPBS or DI water. Various lipid types and certain indicated mixtures were testedas well. The LO also always contained 0.1 mol% of the fluorescently labelled lipid Rho-PE for liposomal membranemonitoring.
Lipid-carrying oil phase (LO)Inner aqueous phase (IA)
200 µM lipids in mineral oilOuter aqueous phase (OA)
DOPCDPBS (-Ca) + 5 vol% Optiprep™
POPCDPBS (-Ca)
80 mol% POPC, 20 mol% CholDI water + 5 vol% Optiprep™
80 mol% POPC, 20 mol% POPSDI water
Figure 11: Graphical representation showing the off-chip fabrication method, based on the water-in-oil emulsiontransfer method [19]. A lipid interface between the OA (blue) and the LO (yellow) is established. In parallel, IA(green) emulsions are produced by agitating an Eppendorf tube with IA and LO. These emulsions are then transferredand centrifuged through the interface, resulting in polydispersed GUVs.
12
Methods On-Chip GUV Formation
2.3 On-Chip GUV Formation
The octanol-assisted liposome assembly (OLA) method was used for production of GUVs on-chip. For this,
a microfluidic device consisting of three inlets (IA, LO and OA), an OLA junction, a downstream trap array
and an outlet is required (see Figure 12). Optionally, the device can contain a pressure layer to control
access to the hydrodynamic traps.
2.3.1 Phase Compositions
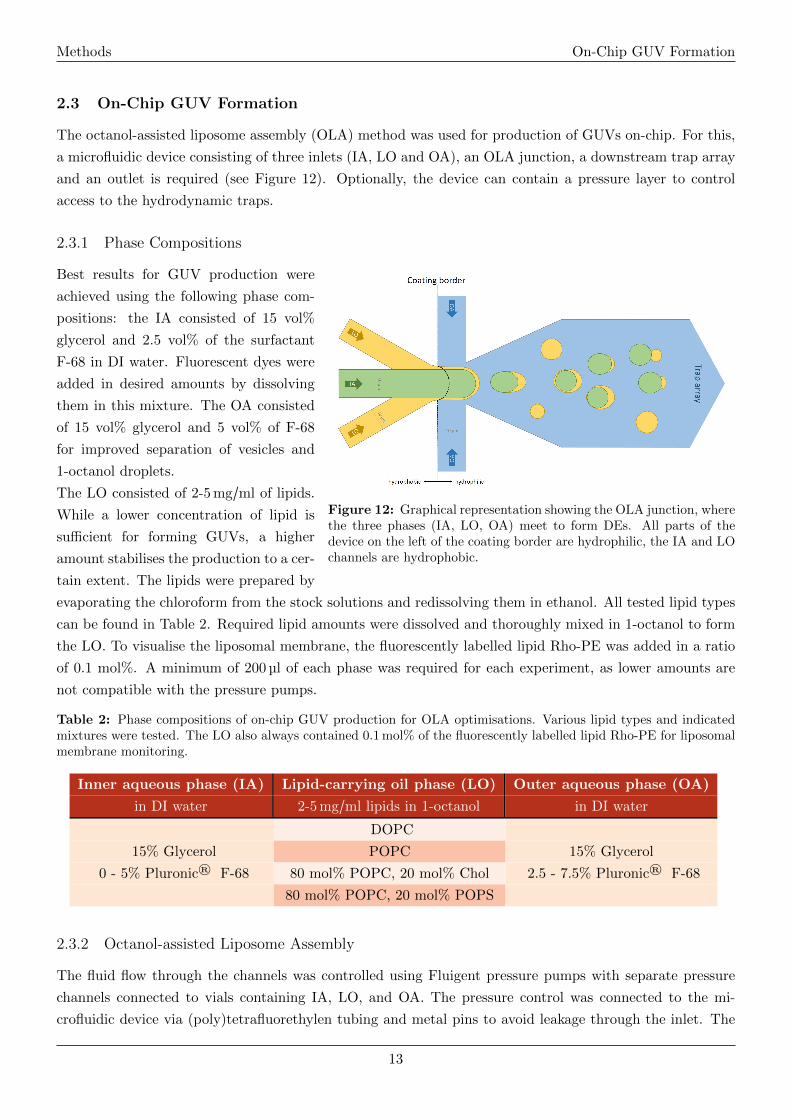
Figure 12: Graphical representation showing the OLA junction, wherethe three phases (IA, LO, OA) meet to form DEs. All parts of thedevice on the left of the coating border are hydrophilic, the IA and LOchannels are hydrophobic.
Best results for GUV production were
achieved using the following phase com-
positions: the IA consisted of 15 vol%
glycerol and 2.5 vol% of the surfactant
F-68 in DI water. Fluorescent dyes were
added in desired amounts by dissolving
them in this mixture. The OA consisted
of 15 vol% glycerol and 5 vol% of F-68
for improved separation of vesicles and
1-octanol droplets.
The LO consisted of 2-5 mg/ml of lipids.
While a lower concentration of lipid is
sufficient for forming GUVs, a higher
amount stabilises the production to a cer-
tain extent. The lipids were prepared by
evaporating the chloroform from the stock solutions and redissolving them in ethanol. All tested lipid types
can be found in Table 2. Required lipid amounts were dissolved and thoroughly mixed in 1-octanol to form
the LO. To visualise the liposomal membrane, the fluorescently labelled lipid Rho-PE was added in a ratio
of 0.1 mol%. A minimum of 200 µl of each phase was required for each experiment, as lower amounts are
not compatible with the pressure pumps.
Table 2: Phase compositions of on-chip GUV production for OLA optimisations. Various lipid types and indicatedmixtures were tested. The LO also always contained 0.1 mol% of the fluorescently labelled lipid Rho-PE for liposomalmembrane monitoring.
Inner aqueous phase (IA) Lipid-carrying oil phase (LO) Outer aqueous phase (OA)
in DI water 2-5 mg/ml lipids in 1-octanol in DI water
DOPC
15% Glycerol POPC 15% Glycerol
0 - 5% Pluronic® F-68 80 mol% POPC, 20 mol% Chol 2.5 - 7.5% Pluronic® F-68
80 mol% POPC, 20 mol% POPS
2.3.2 Octanol-assisted Liposome Assembly
The fluid flow through the channels was controlled using Fluigent pressure pumps with separate pressure
channels connected to vials containing IA, LO, and OA. The pressure control was connected to the mi-
crofluidic device via (poly)tetrafluorethylen tubing and metal pins to avoid leakage through the inlet. The
13
Methods Calcium Permeation Assays
three phases were slowly guided through their respective channels towards the junction. Ideally, the order of
arrival at the junction is OA, then IA, then LO, to not disrupt the PVA coating. Furthermore, the creation
of air pockets within the channels was avoided as much as possible.
After all phases were connected at the junction, the pressures were adjusted to establish a stable DE pro-
duction and continuously monitored for possible fluctuations. Generally, ∼25 mbar for IA, ∼50 mbar for LO
and 80-120 mbar for OA led to satisfying results. However, this is entirely dependent on the design of the
channels, the individual chips and the potential additives to the phases (e.g. fluorescent dyes in the IA, or
the lipid composition in the LO).
On-chip GUV production was monitored with a high-speed camera to allow for close observation of the pro-
cess. Generally, bright field pictures were taken at 10 µs exposure time, videos at 10 000 fps. Fluorescence
images were taken at an exposure time of 41 ms, videos at 24 fps.
2.4 Calcium Permeation Assays
2.4.1 Assay Preparations
Preparatory experiments were performed to determine optimal concentrations of the fluorescent dye F4, the
investigated ionophore and the calcium content, respectively the ratio of these three. For this reason, a
variety of bulk experiments were done off-chip.
Firstly, plate reader assays were used to test the optimal ratio of F4 to calcium. In a 96-well plate, 1 µM of
F4 was mixed with CaCl2 solutions of 10 nM to 1 M, with a dilution step of 10 between wells.
Additionally, a plate reader experiment was performed to find an optimal concentration of egtazic acid
(EGTA). EGTA strongly binds calcium and is used to suppress initial F4 fluorescence induced by residual
calcium in the phases. Solutions of 10 µM F4, together with various concentrations of EGTA were measured
in a Fluotrac 200 microtiter well plate, with 1 mM EGTA giving desired results. Due to conflicting results,
a compromise was found by using a concentration of 50 µM F4 as the inner aqueous phase, while using a
CaCl2 concentration of 1 mM and various ionomycin concentrations to observe the fluorescence intensity
increase upon calcium addition.
Osmolarity measurements of potential inner and outer aqueous phases were performed using an Osmometer.
15 µl of the investigated solutions were tested three times each. If the discrepancy between IA and OA
osmolarities is too high (generally >50 mOsm/kg), prolonged integrity of the vesicles is not guaranteed.
2.4.2 Translocation Assay
Off-chip GUVs were produced as previously described. For the calcium translocation assay, the IA addi-
tionally contained 50 µM of F4 in DI water, while the OA during production (OA1) was pure DI water. The
vesicles were made of POPC and stored in 150 µl of OA1 (see Table 3 for all phase compositions).
The trap chips were prepared in the following way: appropriately sized pipette tips were inserted in the in-
and outlet, acting as liquid reservoirs. In the case of double-layered chips, pipette tips were also inserted in
the pressure layer ports. These tips were then filled with 20-100 µl of OA1 for the fluid layer and water for
the pressure layer. The trap chip was centrifuged (600 x g for 3 min), and the channel filling was verified
under a light microscope. Incompletely filled chips were centrifuged again, until all channels were flushed.
The trap chip was taped to the microscope floor and the pressure tubing was inserted in the pressure ports
14
Methods Calcium Permeation Assays
after removing the pipette tips. The pressure layer was controlled by a pressure control box that could fully
actuate individual ports. The outlet pipette tip was removed and the outlet connected to a syringe filled
with OA1 without allowing bubbles to form. This syringe was connected to a syringe pump that flushed the
trap chip with OA1 at 2 µl/min for 2 min.
During the flushing time, the pressure valves were tested. Using the microscope at 10x magnification in
bright field mode, the valves were pressurised slowly. Complete closure was confirmed when a white ring
formed inside the valve, indicating contact with the fluid channel floor (see Figure 8). For each chip, the
pressure required for closure is different (2-3 bar), and was noted for the continuation of the experiment.
The valves were opened again and the flow was reversed to −1 µl/min. The solution in the inlet reservoir
was exchanged to the vesicle suspension. Vesicles were flushed through the trap chip and immobilised in
the hydrodynamic traps. After a majority of traps were filled, the suspension was exchanged back to OA1
and the chip was flushed for 3 min. The flow rate was then reduced to −0.5 µl/min. Appropriate positions
were marked for the fluorescence measurement, based on the size and amount of vesicles in the vicinity of
the trap (12-14 positions). Generally, larger, isolated vesicles were selected. After selecting the positions,
the flow was reduced to −0.2 µl/min, the valves were closed and the measurement was started. Images were
taken every minute for 5 min, then the liquid was exchanged to 1 mM CaCl2 and various concentrations
of ionophore (OA2) during a one minute intermission. Imaging was restarted, with a picture taken every
minute. During the second one minute intermission, the pressure was slowly released to partially open the
valves (1.5-2 bar). Images were taken every minute for 20 min, and then every three minutes for 30 min.
Hence, vesicles were monitored over the course of 1 h. Each ionomycin concentration was tested three times.
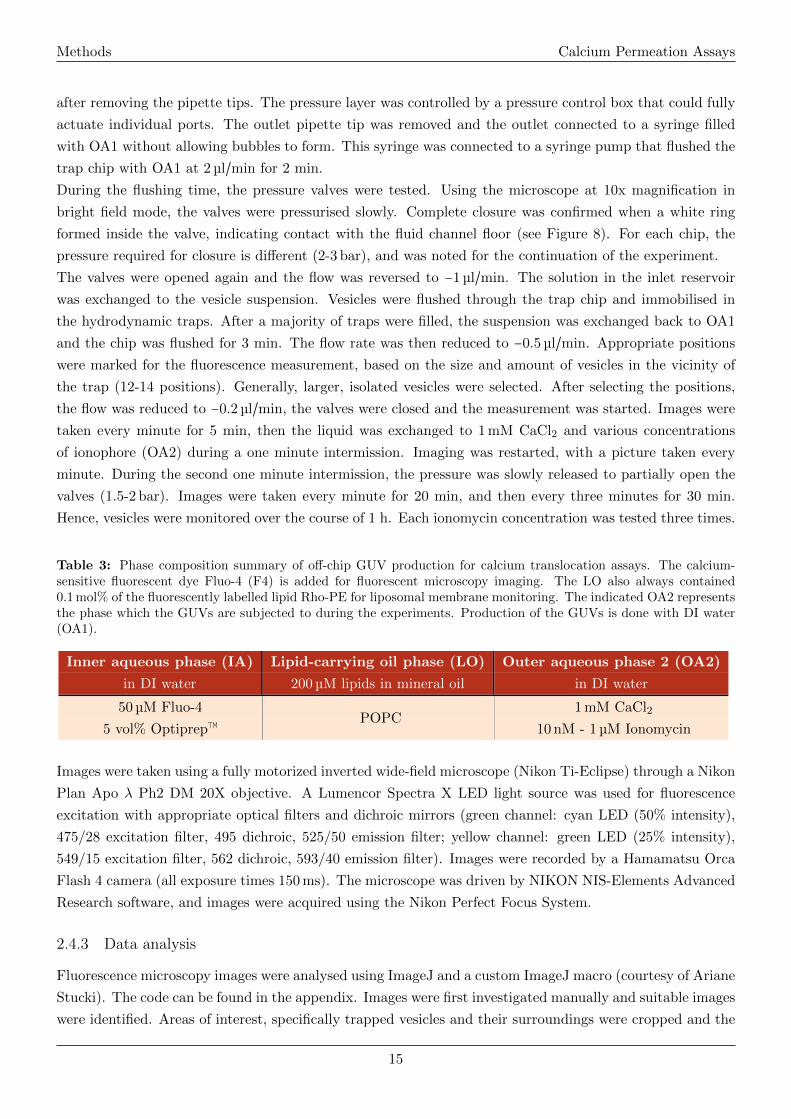
Table 3: Phase composition summary of off-chip GUV production for calcium translocation assays. The calcium-sensitive fluorescent dye Fluo-4 (F4) is added for fluorescent microscopy imaging. The LO also always contained0.1 mol% of the fluorescently labelled lipid Rho-PE for liposomal membrane monitoring. The indicated OA2 representsthe phase which the GUVs are subjected to during the experiments. Production of the GUVs is done with DI water(OA1).
Inner aqueous phase (IA) Lipid-carrying oil phase (LO) Outer aqueous phase 2 (OA2)
in DI water 200 µM lipids in mineral oil in DI water
50 µM Fluo-4 1 mM CaCl2
5 vol% Optiprep™POPC
10 nM - 1 µM Ionomycin
Images were taken using a fully motorized inverted wide-field microscope (Nikon Ti-Eclipse) through a Nikon
Plan Apo λ Ph2 DM 20X objective. A Lumencor Spectra X LED light source was used for fluorescence
excitation with appropriate optical filters and dichroic mirrors (green channel: cyan LED (50% intensity),
475/28 excitation filter, 495 dichroic, 525/50 emission filter; yellow channel: green LED (25% intensity),
549/15 excitation filter, 562 dichroic, 593/40 emission filter). Images were recorded by a Hamamatsu Orca
Flash 4 camera (all exposure times 150 ms). The microscope was driven by NIKON NIS-Elements Advanced
Research software, and images were acquired using the Nikon Perfect Focus System.
2.4.3 Data analysis
Fluorescence microscopy images were analysed using ImageJ and a custom ImageJ macro (courtesy of Ariane
Stucki). The code can be found in the appendix. Images were first investigated manually and suitable images
were identified. Areas of interest, specifically trapped vesicles and their surroundings were cropped and the
15
Methods Calcium Permeation Assays
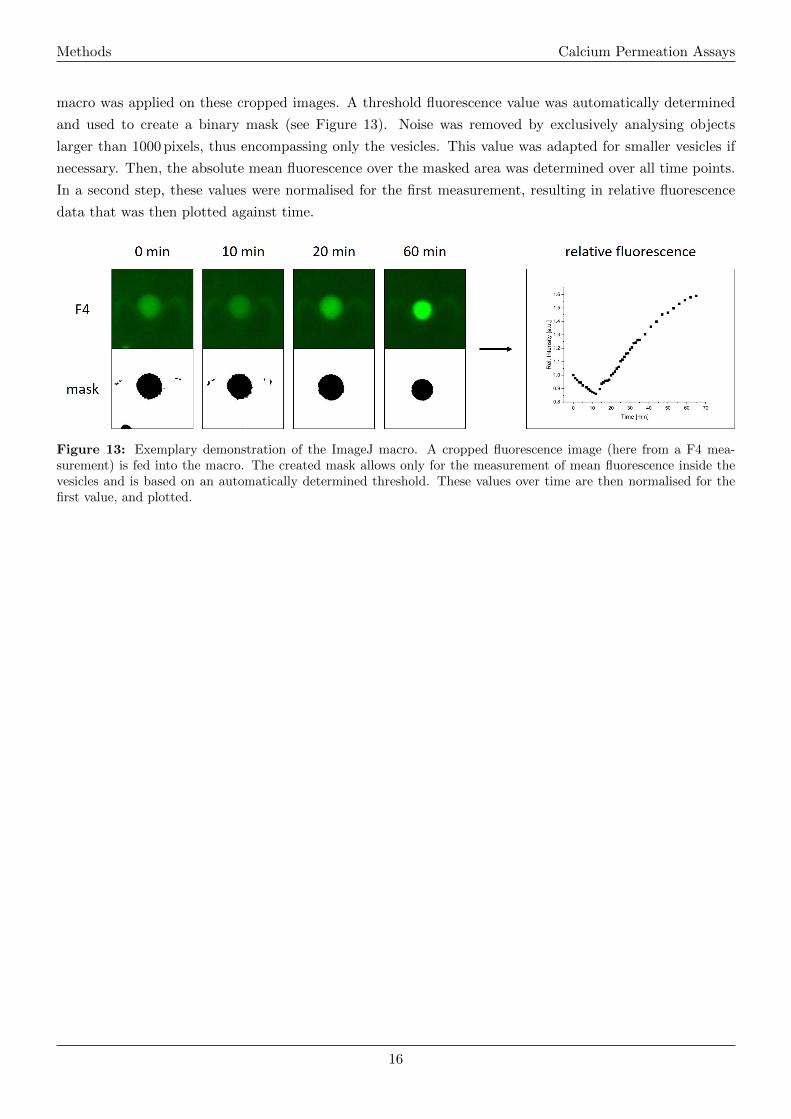
macro was applied on these cropped images. A threshold fluorescence value was automatically determined
and used to create a binary mask (see Figure 13). Noise was removed by exclusively analysing objects
larger than 1000 pixels, thus encompassing only the vesicles. This value was adapted for smaller vesicles if
necessary. Then, the absolute mean fluorescence over the masked area was determined over all time points.
In a second step, these values were normalised for the first measurement, resulting in relative fluorescence
data that was then plotted against time.
Figure 13: Exemplary demonstration of the ImageJ macro. A cropped fluorescence image (here from a F4 mea-surement) is fed into the macro. The created mask allows only for the measurement of mean fluorescence inside thevesicles and is based on an automatically determined threshold. These values over time are then normalised for thefirst value, and plotted.
16
Results and Discussion
3 Results and Discussion
3.1 OLA Optimisations
While the OLA method has been successfully used in a variety of experiments, it is still a relatively new and
undeveloped process that requires thorough preparation and a detailed protocol to access its full potential.
Small details and inaccuracies at any stage of the process have potentially undesired consequences. For
this reason, both the fabrication and the actual application of microfluidic OLA devices were thoroughly
investigated in order to gain a deeper understanding of the method.
3.1.1 Microfabrication Process
While the fabrication of microfluidic devices in general is an established process, specific applications usually
require substantial adaptations of the production in order to enable the desired properties of the device. In
this case, the most crucial step in production and the most prominent feature of the chip is the patterned
hydrophilic coating necessary to produce DEs.
Rendering certain parts of a microfluidic device hydrophilic is often required when using PDMS-based
devices. The normally hydrophobic polymer is often detrimental for biological assays, as it strongly and
non-specifically binds proteins [42]. To circumvent this limiting factor, a number of ways to render the
PDMS surface hydrophilic have been proposed and successfully applied. They solve this issue by employing
techniques like gas phase processing, wet chemical methods or a combination of the two [43]. For example,
PDMS can be temporarily made hydrophilic by plasma treatment [44], a method that is already used in the
chip production at an earlier stage. Alternatively, one or multiple thin layers of a hydrophilic material can
be deposited on the PDMS. These include other polymers, surfactants and even certain proteins like bovine
serum albumin [45]. Unfortunately, many of these methods either require an elaborate setup or often only
have a temporary and weak effect on the PDMS hydrophilicity. Furthermore, some of these methods are
not able to induce a patterned hydrophilicity within the device, but are effective in treating larger areas.
To produce DEs and GUVs in microfluidic devices, the surface treatment process ideally meets the following
demands:
• It should render the PDMS surface hydrophilic in a sufficiently strong, long lasting and irreversible
manner when in contact with both aqueous and oil phases.
• It should be robust enough to enable the use of weak surfactants like lipids, while treated surfaces
should not be interfering with the integrity of the produced GUVs.
• It should be a simple and practical patterning technique with low cost and little time consumption.
A method that balances the mentioned points well is the wet surface deposition of the block copolymer
(poly)vinyl alcohol (PVA) [46]. By flushing desired areas of the device with a 2.5 wt% PVA solution, the
PDMS surface is rendered hydrophilic. This method only requires a relatively simple setup, is long lasting
and uses easily accessible materials. However, while this step in the device production has been extensively
discussed in the original OLA publication [24], it nonetheless remains the most difficult process to correctly
and reproducibly perform. A good amount of skill and training is required to coat OLA devices sufficiently
well for any experiments involving on-chip GUV production. For this reason, alternatives and possibly im-
proving modifications of the standard protocol were investigated.
17
Results and Discussion OLA Optimisations
The base protocol includes the following steps (for more details, see Methods): after sealing the microflu-
idic device with a glass slide through plasma bonding, it is left at room temperature for 4-6 h to allow the
hydrophilicity originating from the plasma treatment to decrease. Then, the desired parts (OA channel,
channels downstream of the junction) of the device are flushed with the PVA solution, while the other
regions of the chip are protected by positive air pressure. After a few minutes of incubation, the solution is
sucked out and residues are evaporated in an oven. As discussed before, the critical and most challenging
part of the coating is the establishing of the interface at the junction where IA, LO and OA channels meet.
A correct PVA flow velocity, as well as a balanced air pressure with little margin for error is required. With-
out extensive training, on average, about half of the produced chips are rendered useless for on-chip GUV
production, and another quarter are suboptimally coated. While the percentage of well coated chips can
be substantially increased with extensive training, an optimised protocol might improve the process even
further.
There are two areas to investigate in terms of coating quality. Firstly, the coating process itself and how
changes to the protocol affect the difficulty and time consumption of it. Secondly, and more importantly,
how the changes might affect the GUV production on-chip. Adapting the process towards a simpler coating
procedure that renders the GUV production impossible is undesired.
Regarding the procedure itself, we explored several changes. First of all, we investigated the 4-6 h time
window for coating after the bonding step. Such a relatively narrow time window potentially limits the
production efficiency. Originally, this window was chosen because during these two hours, the properties
of the PDMS were ideal for coating. In our case, we found that this highly fluctuates from chip to chip.
Some devices were easily coated after 2 h, while others remained too hydrophilic for over 12 h, disrupting
the establishment of the interface at the junction. The reason for these differences is unknown, but likely
depends on minor changes during the microfabrication. On the other hand, successfully coated chips at
any time point after the bonding procedure performed equally well during GUV production. While this
allows for a certain flexibility during production, it also makes the crucial coating step highly unpredictable.
Generally however, the coating procedure was more successful when chips lost most of their hydrophilicity.
Therefore, the devices were ideally coated at least 6 h after bonding, or even on the next day.
Secondly, we investigated the coating procedure itself. Normally, the PVA solution is driven through the
device from the OA inlet towards the outlet. Trials of a reverse flow were unsuccessful: when inserting
the PVA solution through the outlet, the air-liquid interface was extremely challenging to control. Often,
the liquid phase would reach the junction and quickly expand in all channels, rendering the device useless.
Furthermore, we observed a ‘ballooning‘ effect in the larger downstream structures: the PVA was pushed
along the sides of the trap array, leading to large air pockets being trapped. While these can be removed by
pushing them through the gas-permeable PDMS, it requires too much time to do so. On the other hand, we
tried multiple coatings of the same device. For this, a successfully coated chip was left at room temperature
over night, before a second coating was attempted. However, this led to the same problem as when trying
to coat a chip too early after bonding: the PVA solution was flowing rapidly through the now hydrophilic
OA channel and often overshot at the junction. Therefore, we concluded that an ideal coating needed to be
established in a single step.
Lastly, we investigated the incubation time of the PVA solution. Since the coating is a wet chemical depo-
sition, prolonged contact might improve the quality of the coating. This is especially true for larger channel
18
Results and Discussion OLA Optimisations
structures downstream of the junction, as they present a large surface area to coat. For this reason, we
coated devices for either 2, 5, 10, 15, 20 or 30 min. The timer was started as soon as the PVA solution
reached the junction.
Surprisingly, the DE production at the OLA junction is largely independent of the incubation time during
coating. It is entirely possible to produce DEs with chips that were exposed to short or long coating periods.
Both cases showed similar stability in production and a homogeneous population of DEs. However, the dif-
ferences became evident when looking at the downstream structures. In devices with longer coating periods,
the DEs survive interactions with the channel walls for a longer period of time, while they are disrupted
easily in shortly coated chips. The produced DEs tend to ‘stick‘ or crawl along the channel walls in the
latter case and are more likely to burst in the process. Furthermore, after prolonged continuous usage of the
OLA devices, the quality of production tends to decrease. This is also likely due to the coating being slowly
eroded over time or being covered by other molecules. Naturally, these are undesired behaviours and can be
partially mitigated by a longer coating period. However, since the coating is by far the most labour-intensive
and time-consuming step of the chip manufacturing, a compromise is required. By coating the OLA devices
for 15 min, a sufficiently strong coating is achieved, while not too much time is spent in the process.
3.1.2 Lipid-carrying Oil Phase Composition
While an optimised fabrication of microfluidic devices certainly provides the base for consistent and pre-
dictable experimentation, one of the greatest impacts on GUV production stems from the three phases used
in the OLA method. While the aqueous phases are discussed in the next section, the lipid-carrying oil phase
(LO) is equally important for successful application of OLA devices.
As indicated in the OLA name, 1-octanol is used as the running phase in the LO. The method is only
viable when using 1-octanol, as it presents the necessary properties that lead to rapid separation of excess
oil from DEs, resulting in the formation of oil-free GUVs. However, a broad spectrum of different lipids
can be investigated for their compatibility with OLA. We tested two different choline lipids (DOPC and
POPC), as well as their mixtures with other lipid types. Furthermore, we investigated the effects of a lipid
concentration increase to 5 mg per ml of 1-octanol. It proved to be entirely possible to produce DEs at the
lower concentration of 2 mg/ml. However, since lipids are weak stabilising surfactants, a higher lipid content
improves the stability of the water-oil interface and thus of the GUVs themselves. This becomes evident in
a more stable DE production at the junction, and an increased separation efficiency downstream. For this
reason, a concentration of 5 mg/ml lipids was used unless otherwise indicated.
1,2-Dioleoyl-sn-glycero-3-phosphocholine (DOPC):
DOPC was used in the original publication by Deshpande et al. [24] and used here as a starting point. We
were able to replicate and improve DE production by using the aforementioned increased lipid concentration
of 5 mg/ml. However, due to the higher lipid concentration, the 1-octanol phase tended to be more viscous
and sticky, which slightly hindered initial production. On the other hand, once a suitable configuration
was established, the production of DEs was robust and homogeneous. This led to a higher production rate
and more stable DEs. Nevertheless, the amount of unseparated DEs was still extremely high, with only a
small percentage losing their excess 1-octanol and forming GUVs. The few fully separated GUVs, as well
as all DEs, appeared to be flexible enough to squeeze through hydrodynamic traps even at large diameters,
19
Results and Discussion OLA Optimisations
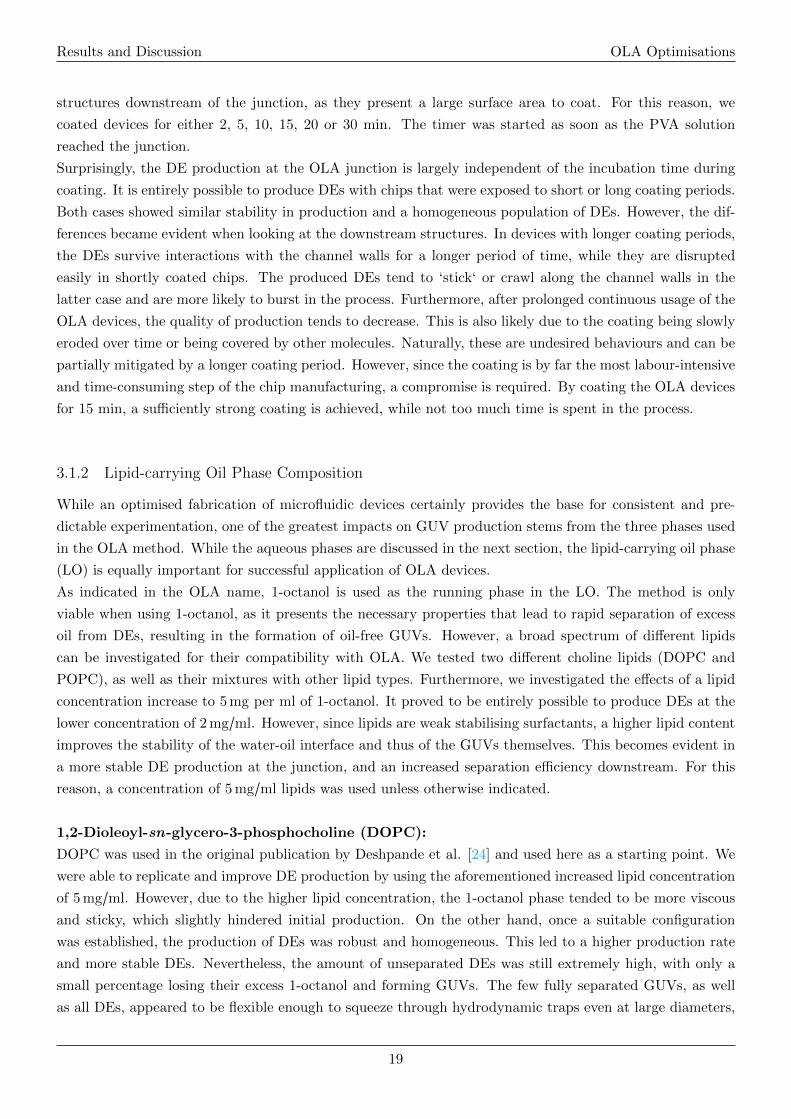
a phenomenon commonly observed (see Figure 14).
While DOPC can be successfully used as a staple for most of the on-chip optimisation experiments, it
is unfortunately not compatible with the off-chip emulsion-transfer GUV production. Therefore, to fully
compare the two methods, an alternative lipid has to be used for assay experiments.
Figure 14: Top: molecular structure of the lipid DOPC. Bottom: bright field and fluorescence microscopy imagesof the production of GUVs made of DOPC. The production of DEs (left) is extremely stable and robust. However,the DEs are often not able to fully separate into GUVs, as they are rarely shedding their excess oil (middle). Hence,no adequate amounts of fully separated GUVs were observed in the trap array, instead all DEs ended up squeezingthrough the hydrodynamic traps (right, black arrow). Scale bars: 50 µm.
2-Oleoyl-1-palmitoyl-sn-glycero-3-phosphocholine (POPC):
As another choline lipid, POPC exhibited similar behaviour as DOPC. However, POPC is compatible with
the off-chip GUV production, and therefore an ideal candidate for the proposed assays. Using POPC at
5 mg/ml, we were able to produce DE with a stability and homogeneity equal or better compared to DOPC.
We also observed a higher separation efficiency (see Figure 15). This likely originated from the more promi-
nent formation of an asymmetric 1-octanol pocket at the side of the DEs and was an enormous improvement,
compared to the usually observed all-encompassing 1-octanol shell. Fully separated GUVs were stable long-
term and present at a reasonable percentage. For these reasons, POPC was chosen to be the main lipid type
used in on-chip assay experiments.
Cholesterol ovine (Chol):
Cholesterol, a fundamentally different lipid compared to choline lipids, can be used to solidify and stabilise
lipid membranes under certain circumstances [47]. In the case of liposomes, this might be necessary, as they
appear to be inherently flexible. While not unexpected, as they consist of a single lipid bilayer, this poses a
problem as they are hard to capture. For this reason, we tried adding Chol at a concentration of either 10
or 20 mol%, while the rest consisted of POPC. Not surprisingly, even at 10 mol% Chol content, the on-chip
production is greatly affected. While DE production at the junction can be achieved, it is not comparable
to choline phospholipids in stability and homogeneity.
20
Results and Discussion OLA Optimisations
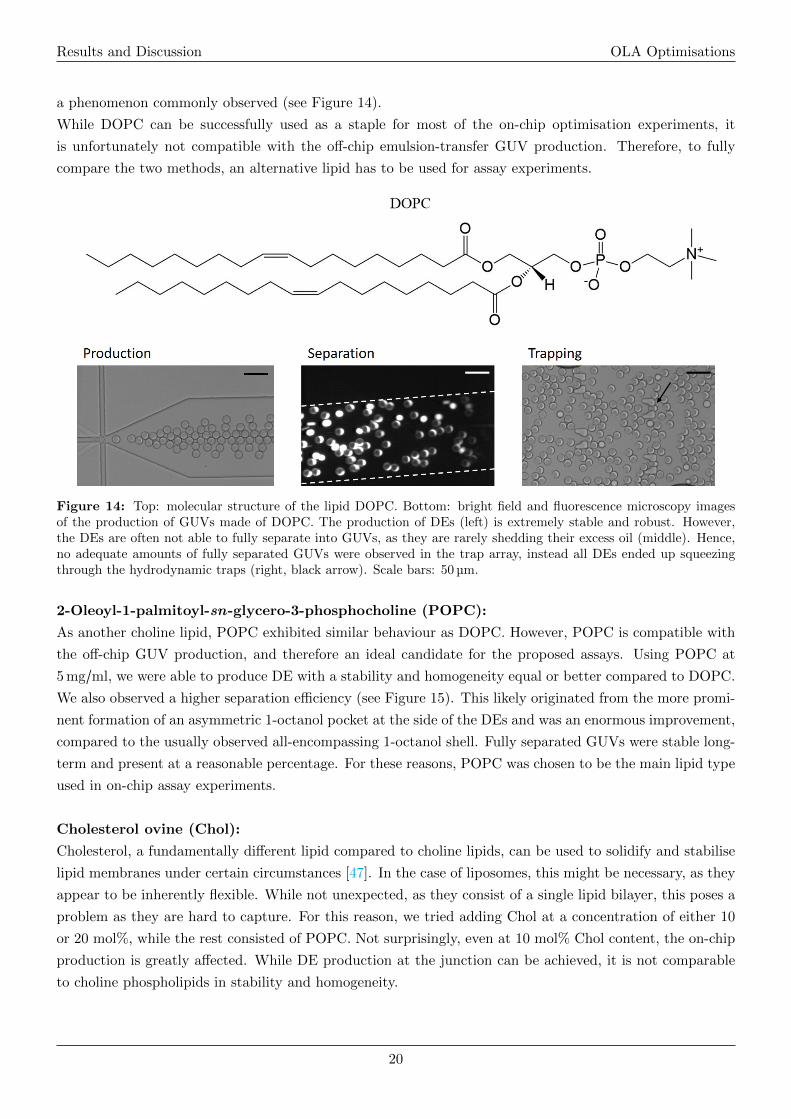
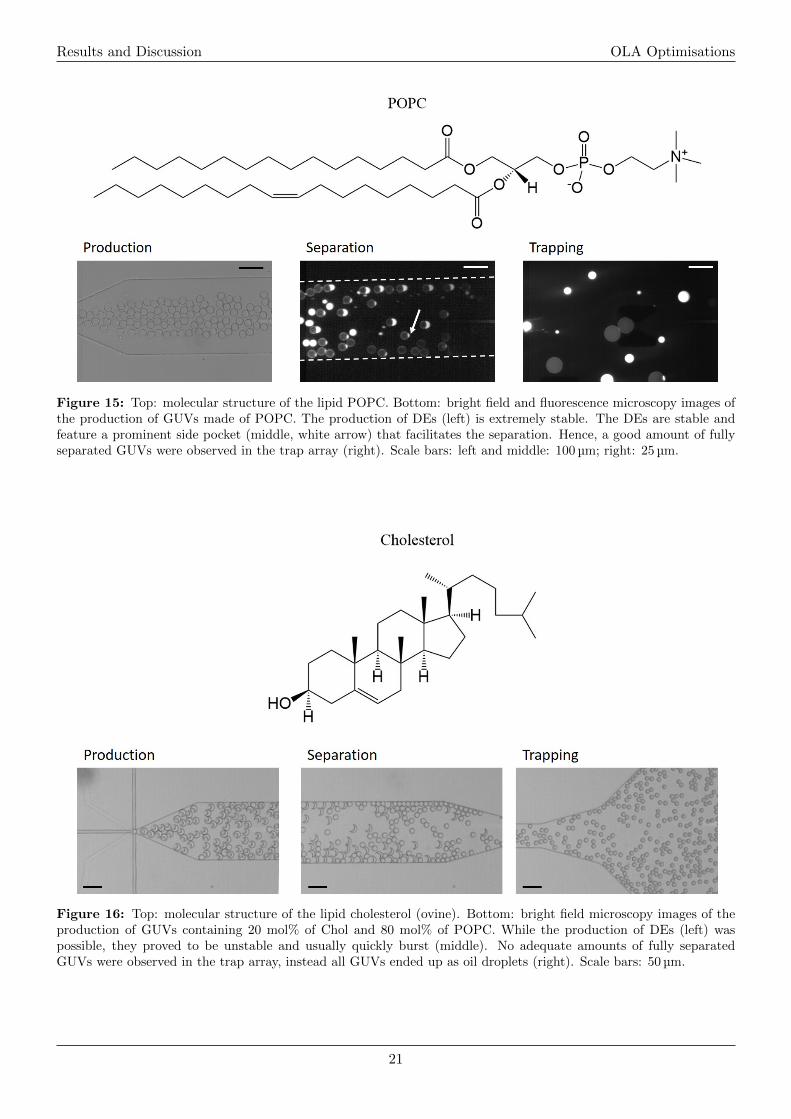
Figure 15: Top: molecular structure of the lipid POPC. Bottom: bright field and fluorescence microscopy images ofthe production of GUVs made of POPC. The production of DEs (left) is extremely stable. The DEs are stable andfeature a prominent side pocket (middle, white arrow) that facilitates the separation. Hence, a good amount of fullyseparated GUVs were observed in the trap array (right). Scale bars: left and middle: 100 µm; right: 25 µm.
Figure 16: Top: molecular structure of the lipid cholesterol (ovine). Bottom: bright field microscopy images of theproduction of GUVs containing 20 mol% of Chol and 80 mol% of POPC. While the production of DEs (left) waspossible, they proved to be unstable and usually quickly burst (middle). No adequate amounts of fully separatedGUVs were observed in the trap array, instead all GUVs ended up as oil droplets (right). Scale bars: 50 µm.
21
Results and Discussion OLA Optimisations
Frequently, we observed double DE encapsulations and most DEs tended to accumulate at the channel walls.
Most DEs rapidly burst, while a very low percentage separated into GUVs. These were generally smaller
in diameter as the DEs produced and broke just as easily. These limitations were even more pronounced
at a higher Chol level (see Figure 16). While the reasons for this has not been thoroughly investigated,
they likely stem from the lipids’ unusual structure. While Chol may be able to bring structural order into a
membrane system, it also seems to interfere with the creation of the water-oil interface at the junction, which
is required to be instantly established and highly stable. Therefore, Chol at a concentration of ∼10 mol%
might be used if necessary, but proved impractical in our setup. It would require extensive investigations to
optimise OLA for GUVs that contain Chol in substantial amounts.
2-Oleoyl-1-palmitoyl-sn-glycero-3-phospho-L-serine (POPS):
POPS is the most abundant negatively charged phospholipid in complex biological membrane systems and
a key player in many binding interactions [48]. In certain assays, POPS can be used to label the liposomal
membrane by inducing the binding of a fluorescently labelled moiety. However, the negative charge might
also interfere with the formation of GUVs on-chip, especially when present in large amounts. To investigate
this effect, we tried to produce GUVs containing either 10 or 20 mol% of POPS, while the rest was POPC.
POPS seems to be largely compatible with the OLA method, as we were able to produce DEs with appro-
priate size and stability, as well as a robust integrity (see Figure 17). While the separation efficiency is not
as high as in GUVs purely made of choline lipids, separation is reasonably prevalent. However, especially at
20 mol% POPS, we observed an increase in aggregation and fractionation into smaller liposomes after some
time. This is not entirely unexpected when POPS is present, but might interfere in downstream protocols
that require prolonged usage or storage of the liposomes. An optimised protocol for on-chip GUV produc-
tion that contain POPS likely involves the incorporation of ionic species in the aqueous phases. It has been
shown that specific cations greatly alter the membrane structure of POPS-containing bilayers in ways that
might be beneficial [49].
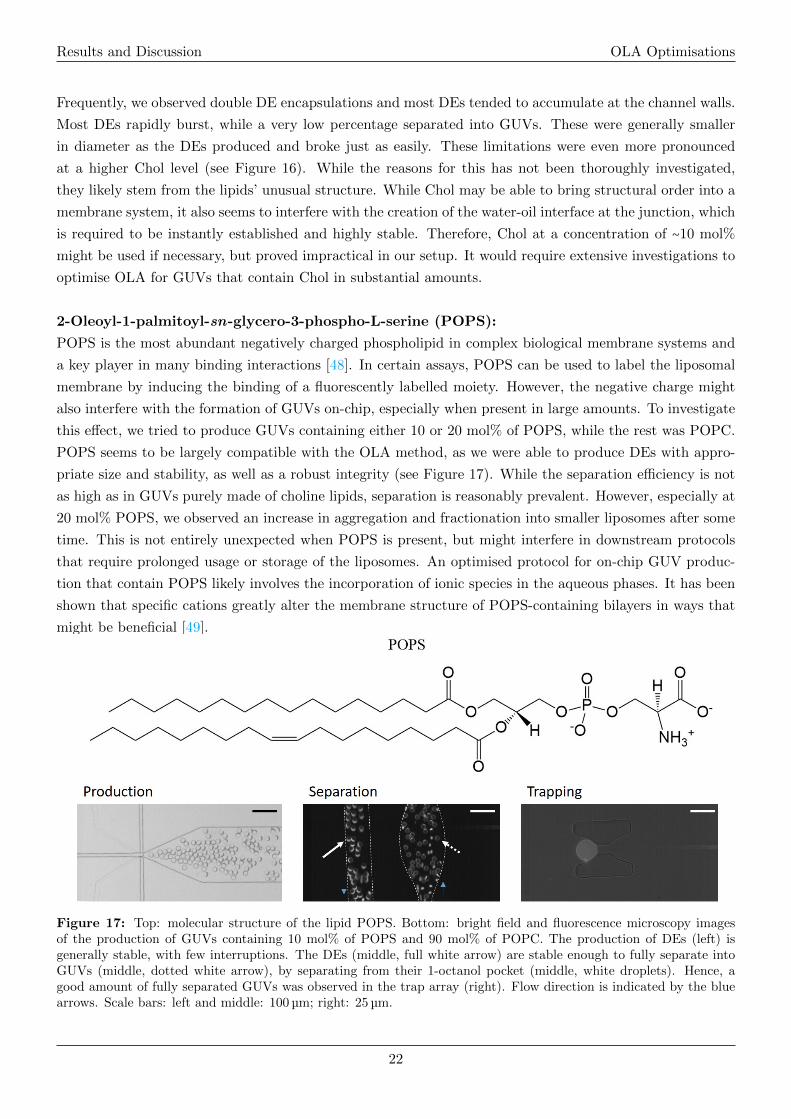
Figure 17: Top: molecular structure of the lipid POPS. Bottom: bright field and fluorescence microscopy imagesof the production of GUVs containing 10 mol% of POPS and 90 mol% of POPC. The production of DEs (left) isgenerally stable, with few interruptions. The DEs (middle, full white arrow) are stable enough to fully separate intoGUVs (middle, dotted white arrow), by separating from their 1-octanol pocket (middle, white droplets). Hence, agood amount of fully separated GUVs was observed in the trap array (right). Flow direction is indicated by the bluearrows. Scale bars: left and middle: 100 µm; right: 25 µm.
22
Results and Discussion OLA Optimisations
In summary, a variety of lipid types could be incorporated within OLA. While choline lipids seem to be the
most compatible, similar lipids like POPS can be included to a certain extent as well. However, they certainly
require some fine-tuning of other parameters to be fully optimised. On the other hand, completely different
lipids like Chol seem to be a lot more difficult to include in the method, at least in our experiments. While
this is not surprising, it might require a completely new approach to accomplish a successful incorporation
of Chol. This was beyond the scope of this thesis. Nevertheless, OLA proved to be versatile enough to
include different lipid types, which is also represented in recent literature [28]. If desired, OLA likely allows
for the incorporation of most lipids to a certain percentage.
3.1.3 Aqueous Phase Composition
While the choice of lipid type is of great importance, the LO gives limited opportunities for optimising the
OLA method. As discussed above, a slight improvement was achieved by increasing the lipid concentration.
However, further improvements either need to come from changes in the chip design or from the aqueous
phase composition.
Here, Deshpande et al. clearly state a few limitations [24, 50]: firstly, a minimum of 15 vol% of glycerol is
needed in all aqueous phases. While it is theoretically possible to produce GUVs in the absence of glycerol,
it is very difficult. Glycerol greatly improves the pinching-off process of the DEs at the junction and sta-
bilises them. Secondly, since lipids are weak surfactants, an additional surfactant present in at least the OA
greatly facilitates the production by stabilising the interface. A surfactant may or may not be biocompatible
and might have unexpected consequences in any experiment. Furthermore, any additives like ionic species
or fluorescent dyes likely have effects on the system that might be undesired and need to be dealt with
accordingly.
We tried to optimise the OLA method by investigating different surfactants at varying concentrations. We
also experimented with the surfactant ratio between the IA and OA, as well as using DPBS to prepare the
phases.
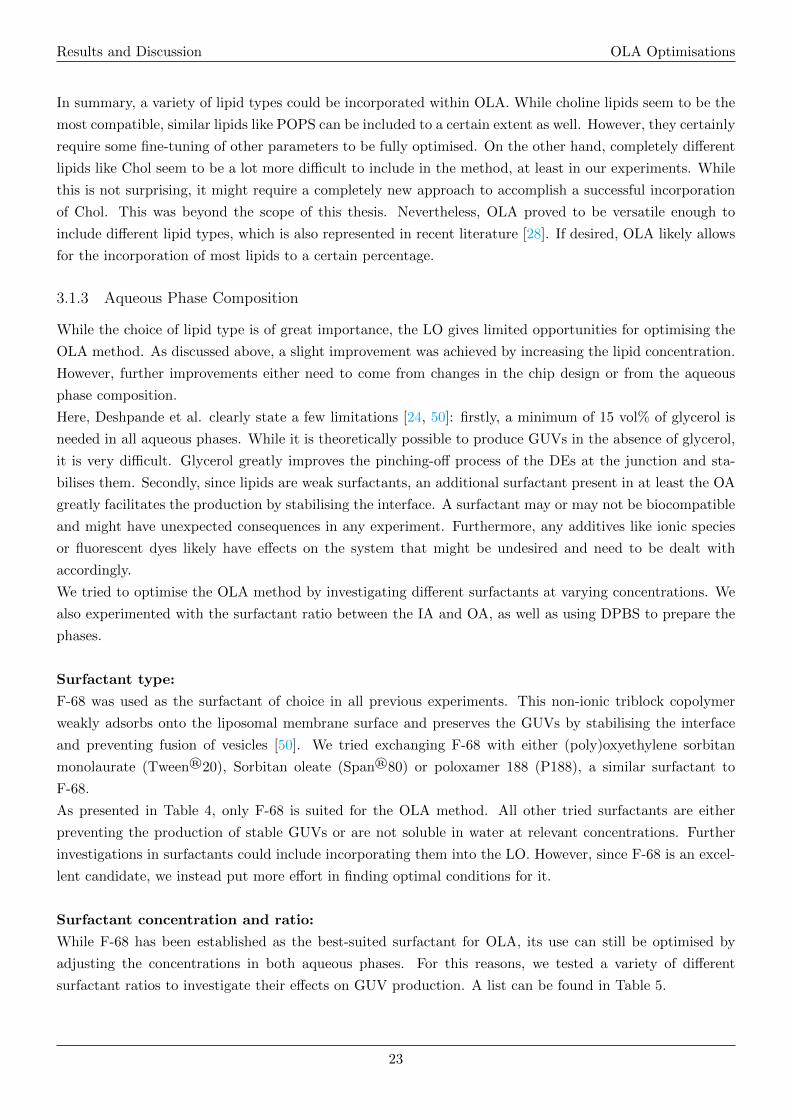
Surfactant type:
F-68 was used as the surfactant of choice in all previous experiments. This non-ionic triblock copolymer
weakly adsorbs onto the liposomal membrane surface and preserves the GUVs by stabilising the interface
and preventing fusion of vesicles [50]. We tried exchanging F-68 with either (poly)oxyethylene sorbitan
monolaurate (Tween®20), Sorbitan oleate (Span®80) or poloxamer 188 (P188), a similar surfactant to
F-68.
As presented in Table 4, only F-68 is suited for the OLA method. All other tried surfactants are either
preventing the production of stable GUVs or are not soluble in water at relevant concentrations. Further
investigations in surfactants could include incorporating them into the LO. However, since F-68 is an excel-
lent candidate, we instead put more effort in finding optimal conditions for it.
Surfactant concentration and ratio:
While F-68 has been established as the best-suited surfactant for OLA, its use can still be optimised by
adjusting the concentrations in both aqueous phases. For this reasons, we tested a variety of different
surfactant ratios to investigate their effects on GUV production. A list can be found in Table 5.
23
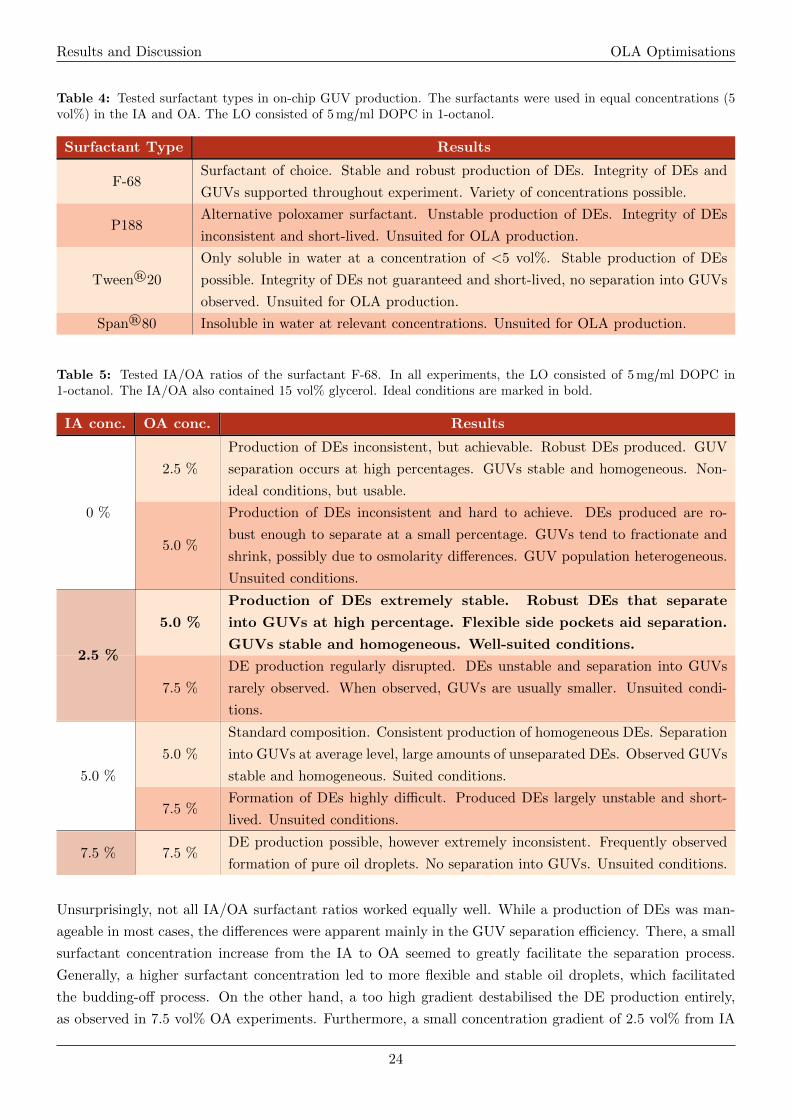
Results and Discussion OLA Optimisations
Table 4: Tested surfactant types in on-chip GUV production. The surfactants were used in equal concentrations (5vol%) in the IA and OA. The LO consisted of 5 mg/ml DOPC in 1-octanol.
Surfactant Type Results
F-68Surfactant of choice. Stable and robust production of DEs. Integrity of DEs and
GUVs supported throughout experiment. Variety of concentrations possible.
P188Alternative poloxamer surfactant. Unstable production of DEs. Integrity of DEs
inconsistent and short-lived. Unsuited for OLA production.
Tween®20
Only soluble in water at a concentration of <5 vol%. Stable production of DEs
possible. Integrity of DEs not guaranteed and short-lived, no separation into GUVs
observed. Unsuited for OLA production.
Span®80 Insoluble in water at relevant concentrations. Unsuited for OLA production.
Table 5: Tested IA/OA ratios of the surfactant F-68. In all experiments, the LO consisted of 5 mg/ml DOPC in1-octanol. The IA/OA also contained 15 vol% glycerol. Ideal conditions are marked in bold.
IA conc. OA conc. Results
0 %
2.5 %
Production of DEs inconsistent, but achievable. Robust DEs produced. GUV
separation occurs at high percentages. GUVs stable and homogeneous. Non-
ideal conditions, but usable.
5.0 %
Production of DEs inconsistent and hard to achieve. DEs produced are ro-
bust enough to separate at a small percentage. GUVs tend to fractionate and
shrink, possibly due to osmolarity differences. GUV population heterogeneous.
Unsuited conditions.
5.0 %
Production of DEs extremely stable. Robust DEs that separate
into GUVs at high percentage. Flexible side pockets aid separation.
GUVs stable and homogeneous. Well-suited conditions.2.5 %
7.5 %
DE production regularly disrupted. DEs unstable and separation into GUVs
rarely observed. When observed, GUVs are usually smaller. Unsuited condi-
tions.
5.0 %
5.0 %
Standard composition. Consistent production of homogeneous DEs. Separation
into GUVs at average level, large amounts of unseparated DEs. Observed GUVs
stable and homogeneous. Suited conditions.
7.5 %Formation of DEs highly difficult. Produced DEs largely unstable and short-
lived. Unsuited conditions.
7.5 % 7.5 %DE production possible, however extremely inconsistent. Frequently observed
formation of pure oil droplets. No separation into GUVs. Unsuited conditions.
Unsurprisingly, not all IA/OA surfactant ratios worked equally well. While a production of DEs was man-
ageable in most cases, the differences were apparent mainly in the GUV separation efficiency. There, a small
surfactant concentration increase from the IA to OA seemed to greatly facilitate the separation process.
Generally, a higher surfactant concentration led to more flexible and stable oil droplets, which facilitated
the budding-off process. On the other hand, a too high gradient destabilised the DE production entirely,
as observed in 7.5 vol% OA experiments. Furthermore, a small concentration gradient of 2.5 vol% from IA
24
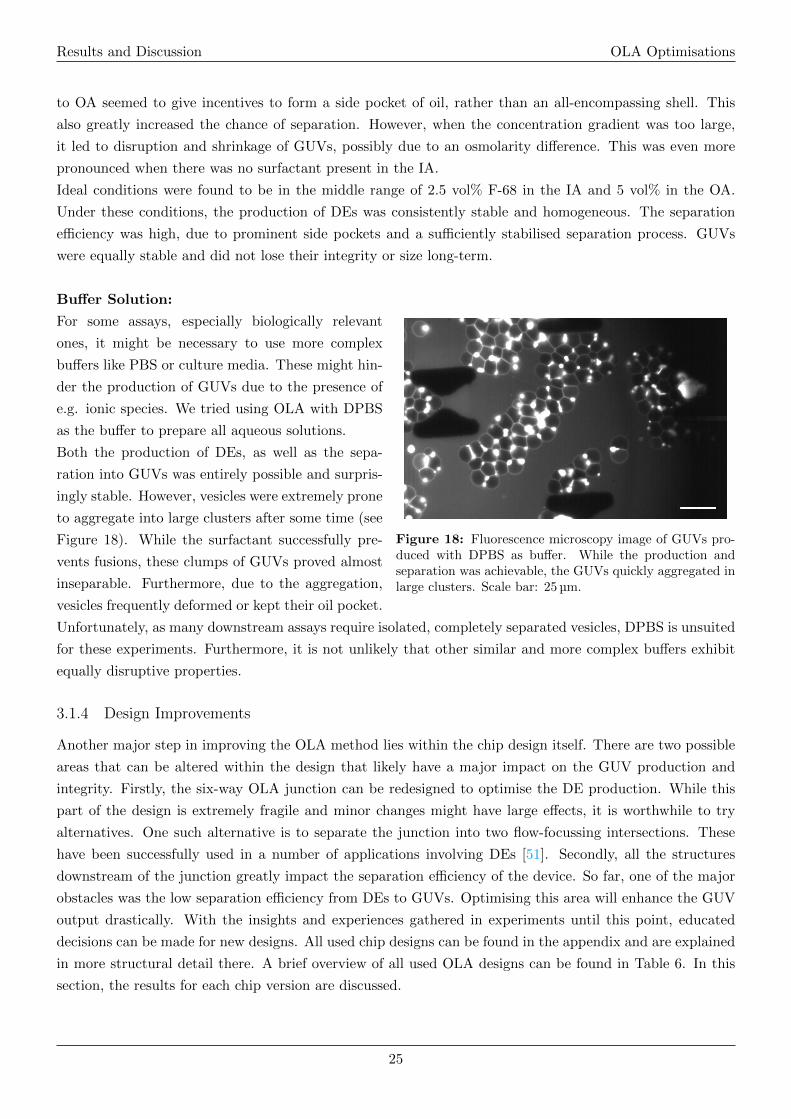
Results and Discussion OLA Optimisations
to OA seemed to give incentives to form a side pocket of oil, rather than an all-encompassing shell. This
also greatly increased the chance of separation. However, when the concentration gradient was too large,
it led to disruption and shrinkage of GUVs, possibly due to an osmolarity difference. This was even more
pronounced when there was no surfactant present in the IA.
Ideal conditions were found to be in the middle range of 2.5 vol% F-68 in the IA and 5 vol% in the OA.
Under these conditions, the production of DEs was consistently stable and homogeneous. The separation
efficiency was high, due to prominent side pockets and a sufficiently stabilised separation process. GUVs
were equally stable and did not lose their integrity or size long-term.
Buffer Solution:
Figure 18: Fluorescence microscopy image of GUVs pro-duced with DPBS as buffer. While the production andseparation was achievable, the GUVs quickly aggregated inlarge clusters. Scale bar: 25 µm.
For some assays, especially biologically relevant
ones, it might be necessary to use more complex
buffers like PBS or culture media. These might hin-
der the production of GUVs due to the presence of
e.g. ionic species. We tried using OLA with DPBS
as the buffer to prepare all aqueous solutions.
Both the production of DEs, as well as the sepa-
ration into GUVs was entirely possible and surpris-
ingly stable. However, vesicles were extremely prone
to aggregate into large clusters after some time (see
Figure 18). While the surfactant successfully pre-
vents fusions, these clumps of GUVs proved almost
inseparable. Furthermore, due to the aggregation,
vesicles frequently deformed or kept their oil pocket.
Unfortunately, as many downstream assays require isolated, completely separated vesicles, DPBS is unsuited
for these experiments. Furthermore, it is not unlikely that other similar and more complex buffers exhibit
equally disruptive properties.
3.1.4 Design Improvements
Another major step in improving the OLA method lies within the chip design itself. There are two possible
areas that can be altered within the design that likely have a major impact on the GUV production and
integrity. Firstly, the six-way OLA junction can be redesigned to optimise the DE production. While this
part of the design is extremely fragile and minor changes might have large effects, it is worthwhile to try
alternatives. One such alternative is to separate the junction into two flow-focussing intersections. These
have been successfully used in a number of applications involving DEs [51]. Secondly, all the structures
downstream of the junction greatly impact the separation efficiency of the device. So far, one of the major
obstacles was the low separation efficiency from DEs to GUVs. Optimising this area will enhance the GUV
output drastically. With the insights and experiences gathered in experiments until this point, educated
decisions can be made for new designs. All used chip designs can be found in the appendix and are explained
in more structural detail there. A brief overview of all used OLA designs can be found in Table 6. In this
section, the results for each chip version are discussed.
25
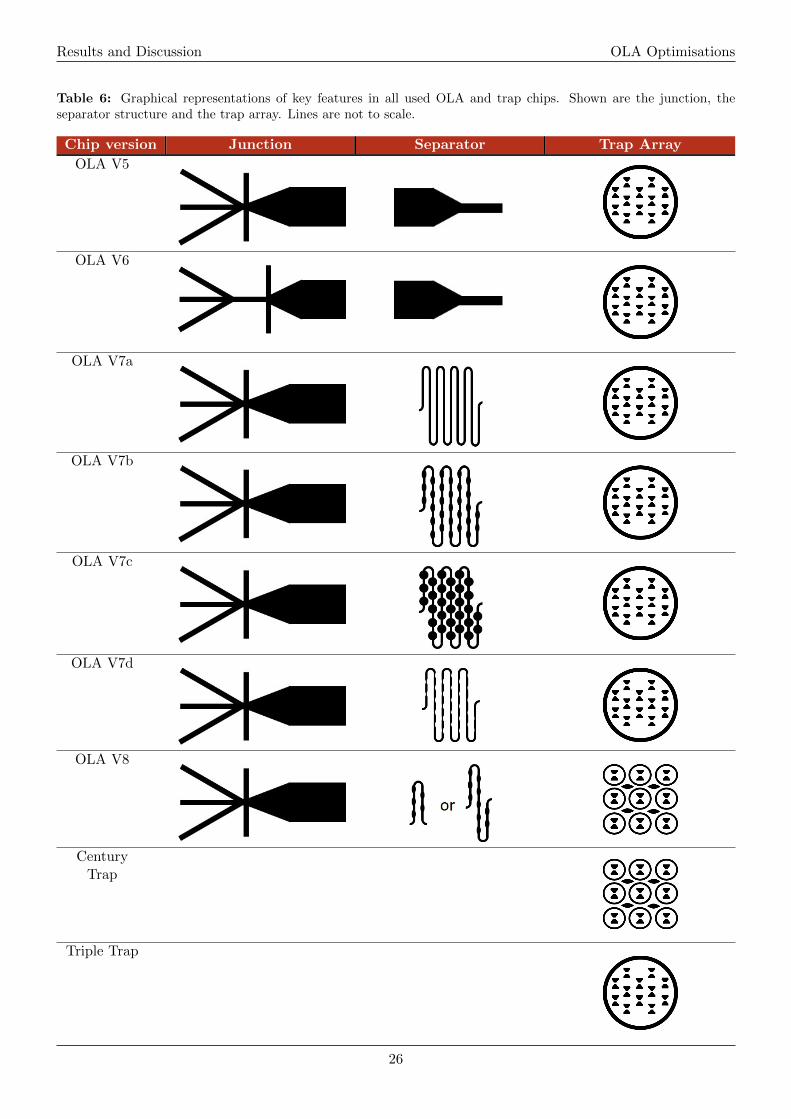
Results and Discussion OLA Optimisations
Table 6: Graphical representations of key features in all used OLA and trap chips. Shown are the junction, theseparator structure and the trap array. Lines are not to scale.
Chip version Junction Separator Trap Array
OLA V5
OLA V6
OLA V7a
OLA V7b
OLA V7c
OLA V7d
OLA V8
CenturyTrap
Triple Trap
26
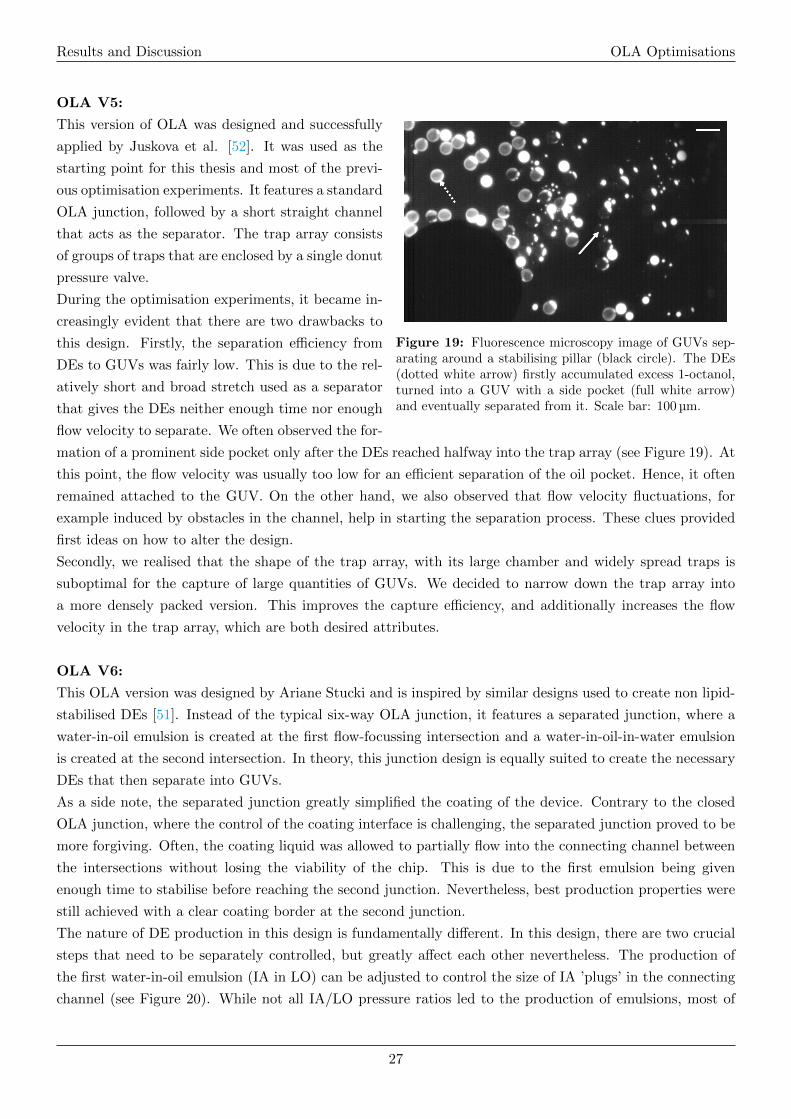
Results and Discussion OLA Optimisations
OLA V5:
Figure 19: Fluorescence microscopy image of GUVs sep-arating around a stabilising pillar (black circle). The DEs(dotted white arrow) firstly accumulated excess 1-octanol,turned into a GUV with a side pocket (full white arrow)and eventually separated from it. Scale bar: 100 µm.
This version of OLA was designed and successfully
applied by Juskova et al. [52]. It was used as the
starting point for this thesis and most of the previ-
ous optimisation experiments. It features a standard
OLA junction, followed by a short straight channel
that acts as the separator. The trap array consists
of groups of traps that are enclosed by a single donut
pressure valve.
During the optimisation experiments, it became in-
creasingly evident that there are two drawbacks to
this design. Firstly, the separation efficiency from
DEs to GUVs was fairly low. This is due to the rel-
atively short and broad stretch used as a separator
that gives the DEs neither enough time nor enough
flow velocity to separate. We often observed the for-
mation of a prominent side pocket only after the DEs reached halfway into the trap array (see Figure 19). At
this point, the flow velocity was usually too low for an efficient separation of the oil pocket. Hence, it often
remained attached to the GUV. On the other hand, we also observed that flow velocity fluctuations, for
example induced by obstacles in the channel, help in starting the separation process. These clues provided
first ideas on how to alter the design.
Secondly, we realised that the shape of the trap array, with its large chamber and widely spread traps is
suboptimal for the capture of large quantities of GUVs. We decided to narrow down the trap array into
a more densely packed version. This improves the capture efficiency, and additionally increases the flow
velocity in the trap array, which are both desired attributes.
OLA V6:
This OLA version was designed by Ariane Stucki and is inspired by similar designs used to create non lipid-
stabilised DEs [51]. Instead of the typical six-way OLA junction, it features a separated junction, where a
water-in-oil emulsion is created at the first flow-focussing intersection and a water-in-oil-in-water emulsion
is created at the second intersection. In theory, this junction design is equally suited to create the necessary
DEs that then separate into GUVs.
As a side note, the separated junction greatly simplified the coating of the device. Contrary to the closed
OLA junction, where the control of the coating interface is challenging, the separated junction proved to be
more forgiving. Often, the coating liquid was allowed to partially flow into the connecting channel between
the intersections without losing the viability of the chip. This is due to the first emulsion being given
enough time to stabilise before reaching the second junction. Nevertheless, best production properties were
still achieved with a clear coating border at the second junction.
The nature of DE production in this design is fundamentally different. In this design, there are two crucial
steps that need to be separately controlled, but greatly affect each other nevertheless. The production of
the first water-in-oil emulsion (IA in LO) can be adjusted to control the size of IA ’plugs’ in the connecting
channel (see Figure 20). While not all IA/LO pressure ratios led to the production of emulsions, most of
27
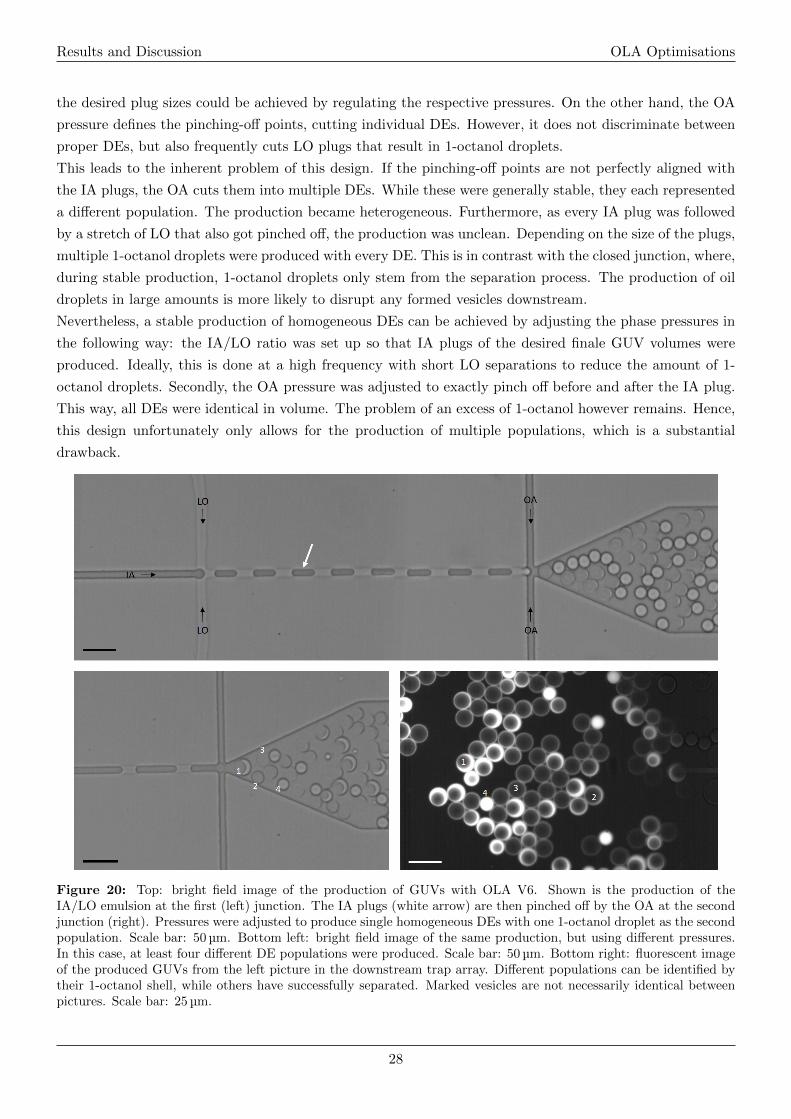
Results and Discussion OLA Optimisations
the desired plug sizes could be achieved by regulating the respective pressures. On the other hand, the OA
pressure defines the pinching-off points, cutting individual DEs. However, it does not discriminate between
proper DEs, but also frequently cuts LO plugs that result in 1-octanol droplets.
This leads to the inherent problem of this design. If the pinching-off points are not perfectly aligned with
the IA plugs, the OA cuts them into multiple DEs. While these were generally stable, they each represented
a different population. The production became heterogeneous. Furthermore, as every IA plug was followed
by a stretch of LO that also got pinched off, the production was unclean. Depending on the size of the plugs,
multiple 1-octanol droplets were produced with every DE. This is in contrast with the closed junction, where,
during stable production, 1-octanol droplets only stem from the separation process. The production of oil
droplets in large amounts is more likely to disrupt any formed vesicles downstream.
Nevertheless, a stable production of homogeneous DEs can be achieved by adjusting the phase pressures in
the following way: the IA/LO ratio was set up so that IA plugs of the desired finale GUV volumes were
produced. Ideally, this is done at a high frequency with short LO separations to reduce the amount of 1-
octanol droplets. Secondly, the OA pressure was adjusted to exactly pinch off before and after the IA plug.
This way, all DEs were identical in volume. The problem of an excess of 1-octanol however remains. Hence,
this design unfortunately only allows for the production of multiple populations, which is a substantial
drawback.
Figure 20: Top: bright field image of the production of GUVs with OLA V6. Shown is the production of theIA/LO emulsion at the first (left) junction. The IA plugs (white arrow) are then pinched off by the OA at the secondjunction (right). Pressures were adjusted to produce single homogeneous DEs with one 1-octanol droplet as the secondpopulation. Scale bar: 50 µm. Bottom left: bright field image of the same production, but using different pressures.In this case, at least four different DE populations were produced. Scale bar: 50 µm. Bottom right: fluorescent imageof the produced GUVs from the left picture in the downstream trap array. Different populations can be identified bytheir 1-octanol shell, while others have successfully separated. Marked vesicles are not necessarily identical betweenpictures. Scale bar: 25 µm.
28
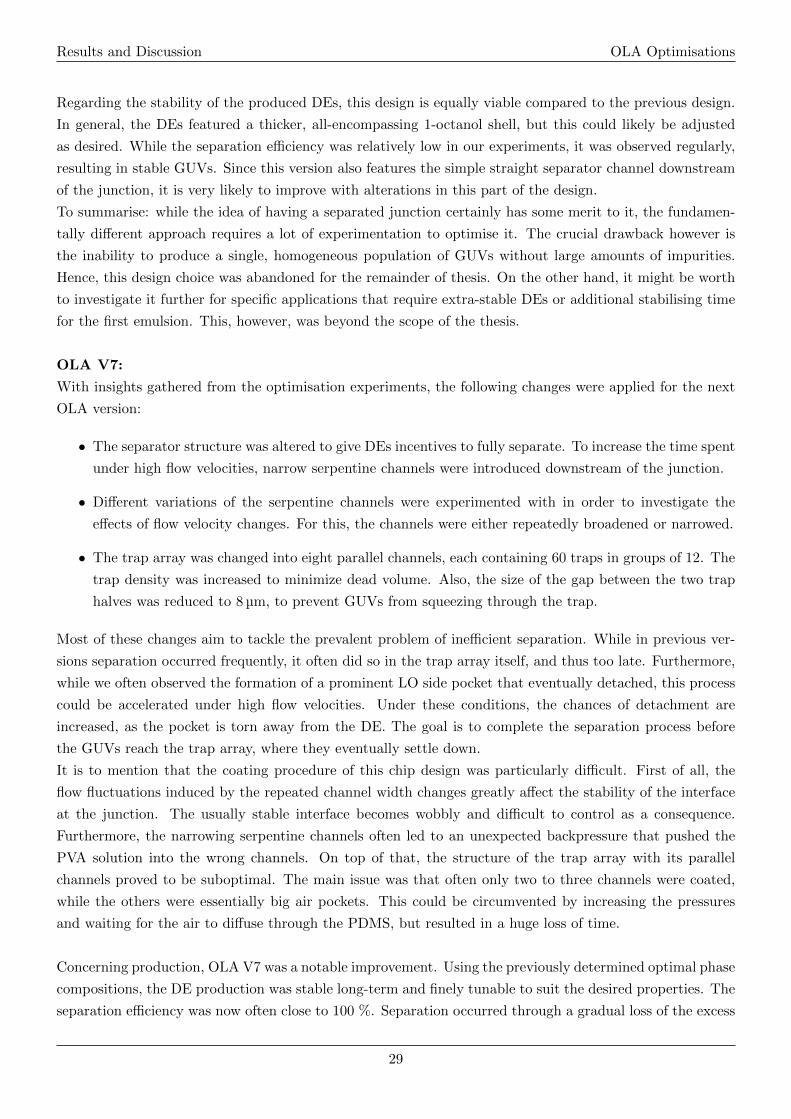
Results and Discussion OLA Optimisations
Regarding the stability of the produced DEs, this design is equally viable compared to the previous design.
In general, the DEs featured a thicker, all-encompassing 1-octanol shell, but this could likely be adjusted
as desired. While the separation efficiency was relatively low in our experiments, it was observed regularly,
resulting in stable GUVs. Since this version also features the simple straight separator channel downstream
of the junction, it is very likely to improve with alterations in this part of the design.
To summarise: while the idea of having a separated junction certainly has some merit to it, the fundamen-
tally different approach requires a lot of experimentation to optimise it. The crucial drawback however is
the inability to produce a single, homogeneous population of GUVs without large amounts of impurities.
Hence, this design choice was abandoned for the remainder of thesis. On the other hand, it might be worth
to investigate it further for specific applications that require extra-stable DEs or additional stabilising time
for the first emulsion. This, however, was beyond the scope of the thesis.
OLA V7:
With insights gathered from the optimisation experiments, the following changes were applied for the next
OLA version:
• The separator structure was altered to give DEs incentives to fully separate. To increase the time spent
under high flow velocities, narrow serpentine channels were introduced downstream of the junction.
• Different variations of the serpentine channels were experimented with in order to investigate the
effects of flow velocity changes. For this, the channels were either repeatedly broadened or narrowed.
• The trap array was changed into eight parallel channels, each containing 60 traps in groups of 12. The
trap density was increased to minimize dead volume. Also, the size of the gap between the two trap
halves was reduced to 8 µm, to prevent GUVs from squeezing through the trap.
Most of these changes aim to tackle the prevalent problem of inefficient separation. While in previous ver-
sions separation occurred frequently, it often did so in the trap array itself, and thus too late. Furthermore,
while we often observed the formation of a prominent LO side pocket that eventually detached, this process
could be accelerated under high flow velocities. Under these conditions, the chances of detachment are
increased, as the pocket is torn away from the DE. The goal is to complete the separation process before
the GUVs reach the trap array, where they eventually settle down.
It is to mention that the coating procedure of this chip design was particularly difficult. First of all, the
flow fluctuations induced by the repeated channel width changes greatly affect the stability of the interface
at the junction. The usually stable interface becomes wobbly and difficult to control as a consequence.
Furthermore, the narrowing serpentine channels often led to an unexpected backpressure that pushed the
PVA solution into the wrong channels. On top of that, the structure of the trap array with its parallel
channels proved to be suboptimal. The main issue was that often only two to three channels were coated,
while the others were essentially big air pockets. This could be circumvented by increasing the pressures
and waiting for the air to diffuse through the PDMS, but resulted in a huge loss of time.
Concerning production, OLA V7 was a notable improvement. Using the previously determined optimal phase
compositions, the DE production was stable long-term and finely tunable to suit the desired properties. The
separation efficiency was now often close to 100 %. Separation occurred through a gradual loss of the excess
29
Results and Discussion OLA Optimisations
1-octanol, which eventually led to thin-shelled DEs. At some point, this thin shell went through a process
we called ’misting’ that gathered the remaining 1-octanol in small pockets all around the surface of the
DE. These pockets were then driven towards the front and eventually detached as a 1-octanol droplet (see
Figure 21). Depending on the flow velocities and separator structure, this process took place within the
first one to three serpentine loops and was observed in all separator variants tested. Hence, we concluded
that the end result is independent of channel width. Likely, the process is induced by the continuous loss of
1-octanol over time and is further promoted by high flow velocities that are crucial for the final detachment.
In previous versions, this was not given due to the relatively short straight separator channel and the low
flow velocity in the trap array.
Figure 21: Fluorescent microscopy images of the GUV separation process (misting). Within a time span of lessthan two seconds, the excess 1-octanol in the thin LO shell separates and gathers at the front of the GUV. If the flowvelocity is high enough, this pocket eventually detaches from the solvent-free GUV. Scale bar: 20 µm.
There was however an unforeseeable consequence to this improvement. Since the separation was now so
efficient and accomplished within the first few separator loops, the resulting GUVs still needed to flow
through the remaining structures to reach the trap array, which usually took ∼5 min of travel time. During
this time, most, if not all vesicles, got disrupted, fractioned or damaged to some extent. This was more
pronounced if there were large differences in channel width i.e. in flow velocities. Nevertheless, in all cases,
the disruption not only led to the loss of a large percentage of GUVs, but also to an increasing amount of
vesicle debris that further blocked the channels. Surviving GUVs were often gathered in large nets of debris
and LO that accumulated with the duration of the experiments (see Figure 22). While some isolated vesicles
could be observed, they were all of different size and often too small to get trapped.
This problem was easily solved: with the crucial knowledge of the separator structure working as intended,
it could simply be shortened in the following design versions. Ideally, the entire separation process including
the detachment of the 1-octanol pocket is completed immediately before the GUVs reach the trap array
and settle down. This way, disruption is reduced to the absolute minimum, and vesicles retain their original
shape and size.
Another insight is given by the trap array. While barely any vesicles could be successfully captured due to the
aforementioned reasons, some undesired properties were still observed. As mentioned before, having eight
parallel channels is suboptimal for multiple reasons in both coating and GUV production. The disadvantages
of very low flow velocity and a lot of dead volume remain in this version. The density of traps is still not
high enough to capture large quantities of vesicles, and needs to be increased in the next version.
30
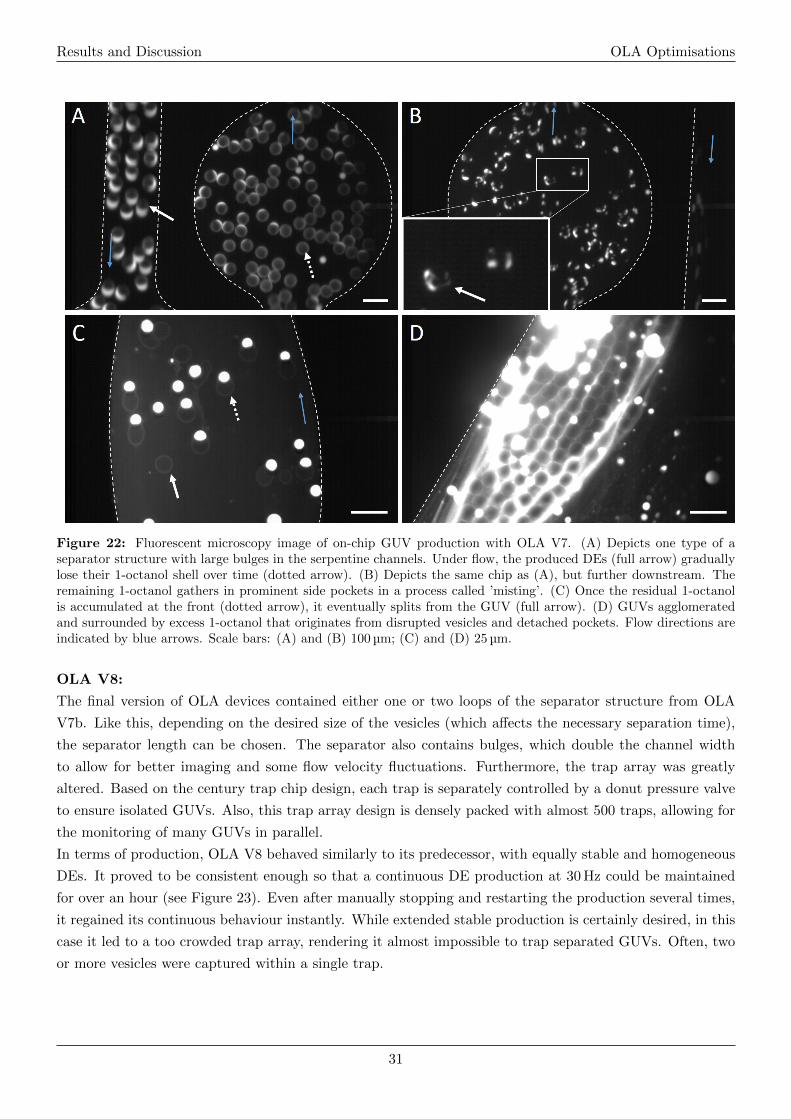
Results and Discussion OLA Optimisations
Figure 22: Fluorescent microscopy image of on-chip GUV production with OLA V7. (A) Depicts one type of aseparator structure with large bulges in the serpentine channels. Under flow, the produced DEs (full arrow) graduallylose their 1-octanol shell over time (dotted arrow). (B) Depicts the same chip as (A), but further downstream. Theremaining 1-octanol gathers in prominent side pockets in a process called ’misting’. (C) Once the residual 1-octanolis accumulated at the front (dotted arrow), it eventually splits from the GUV (full arrow). (D) GUVs agglomeratedand surrounded by excess 1-octanol that originates from disrupted vesicles and detached pockets. Flow directions areindicated by blue arrows. Scale bars: (A) and (B) 100 µm; (C) and (D) 25 µm.
OLA V8:
The final version of OLA devices contained either one or two loops of the separator structure from OLA
V7b. Like this, depending on the desired size of the vesicles (which affects the necessary separation time),
the separator length can be chosen. The separator also contains bulges, which double the channel width
to allow for better imaging and some flow velocity fluctuations. Furthermore, the trap array was greatly
altered. Based on the century trap chip design, each trap is separately controlled by a donut pressure valve
to ensure isolated GUVs. Also, this trap array design is densely packed with almost 500 traps, allowing for
the monitoring of many GUVs in parallel.
In terms of production, OLA V8 behaved similarly to its predecessor, with equally stable and homogeneous
DEs. It proved to be consistent enough so that a continuous DE production at 30 Hz could be maintained
for over an hour (see Figure 23). Even after manually stopping and restarting the production several times,
it regained its continuous behaviour instantly. While extended stable production is certainly desired, in this
case it led to a too crowded trap array, rendering it almost impossible to trap separated GUVs. Often, two
or more vesicles were captured within a single trap.
31
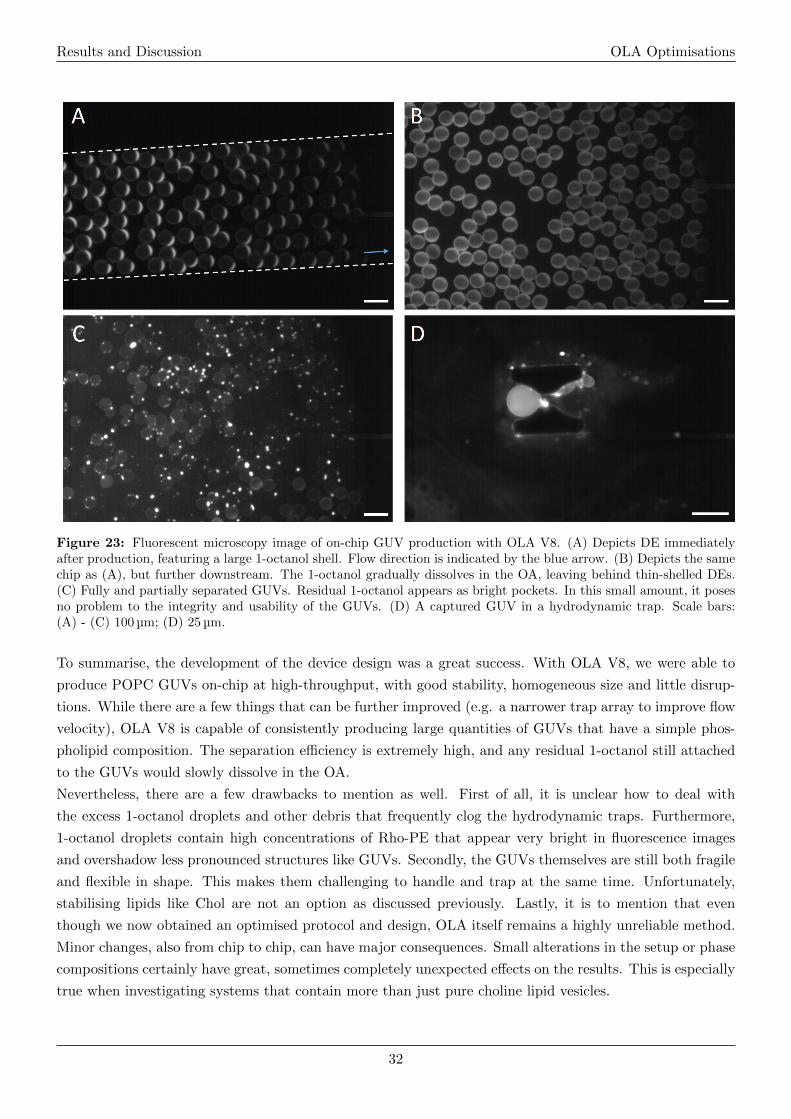
Results and Discussion OLA Optimisations
Figure 23: Fluorescent microscopy image of on-chip GUV production with OLA V8. (A) Depicts DE immediatelyafter production, featuring a large 1-octanol shell. Flow direction is indicated by the blue arrow. (B) Depicts the samechip as (A), but further downstream. The 1-octanol gradually dissolves in the OA, leaving behind thin-shelled DEs.(C) Fully and partially separated GUVs. Residual 1-octanol appears as bright pockets. In this small amount, it posesno problem to the integrity and usability of the GUVs. (D) A captured GUV in a hydrodynamic trap. Scale bars:(A) - (C) 100 µm; (D) 25 µm.
To summarise, the development of the device design was a great success. With OLA V8, we were able to
produce POPC GUVs on-chip at high-throughput, with good stability, homogeneous size and little disrup-
tions. While there are a few things that can be further improved (e.g. a narrower trap array to improve flow
velocity), OLA V8 is capable of consistently producing large quantities of GUVs that have a simple phos-
pholipid composition. The separation efficiency is extremely high, and any residual 1-octanol still attached
to the GUVs would slowly dissolve in the OA.
Nevertheless, there are a few drawbacks to mention as well. First of all, it is unclear how to deal with
the excess 1-octanol droplets and other debris that frequently clog the hydrodynamic traps. Furthermore,
1-octanol droplets contain high concentrations of Rho-PE that appear very bright in fluorescence images
and overshadow less pronounced structures like GUVs. Secondly, the GUVs themselves are still both fragile
and flexible in shape. This makes them challenging to handle and trap at the same time. Unfortunately,
stabilising lipids like Chol are not an option as discussed previously. Lastly, it is to mention that even
though we now obtained an optimised protocol and design, OLA itself remains a highly unreliable method.
Minor changes, also from chip to chip, can have major consequences. Small alterations in the setup or phase
compositions certainly have great, sometimes completely unexpected effects on the results. This is especially
true when investigating systems that contain more than just pure choline lipid vesicles.
32
Results and Discussion Calcium Permeation Assay
3.2 Calcium Permeation Assay
The substantial improvements in the OLA method can now be applied to a simple chemical assay using lipid
vesicles. While there are countless possibilities, one of the most crucial processes involving lipid membranes
is the transport across this otherwise largely impassable barrier. An example is the transport of calcium
ions, either by the formation of a pore or using transporting moieties called ionophores that can cross the
membrane. By employing a calcium-sensitive fluorescent dye like Fluo-4 (F4) inside GUVs, Ca2+ transport
across the membrane can be monitored.
3.2.1 Assay Preparation
A few preparatory experiments were needed for the characterisation of the assay, before being able to trans-
fer every step of the experiment on-chip. For this reason, the bulk experiments described in the following
were conducted.
Firstly, the fluorophore F4 was investigated, respectively its behaviour in the presence of calcium. We iden-
tified a suitable concentration ratio for ideal fluorescence increase upon calcium addition. For this, a plate
reader experiment was conducted: an increasing calcium concentration from 10 nM to 1 M was added to
wells containing 1 µM of F4. A peak of fluorescence intensity was reached when using mid-range calcium
concentrations as the fluorescence is quenched at high concentration (see Figure 24) [53]. The optimal range
seemed to be around 100 µM of Ca2+, which corresponds to a 100-fold excess calcium compared to F4. How-
ever, even though this represents the maximum fluorescence increase reached in bulk, it is nowhere close
to the 100-fold increase advertised by the manufacturer [36]. Instead, only a ∼5-fold increase was observed.
Furthermore, while a general ratio range was determined, it might need to be adapted for GUVs, as they
contain a much smaller volume. This was confirmed by a trial experiment, where F4 was encapsulated
in GUVs prepared off-chip by the emulsion-transfer method. No significant fluorescence was measured by
neither the plate reader nor a fluorescence microscope, even in the presence of calcium. Hence, we concluded
that an increased concentration of F4 is needed for any assay that investigates GUVs.
These findings confronted us with a few challenges. Firstly, while a 5-fold increase is significant, it might
not be directly transferable from bulk to intracellular experiments. This is especially true when expect-
ing a non-optimal transport efficiency that does not equilibrate the extracellular and intracellular calcium
concentration. Hence, an excess of calcium might be needed. Another option to achieve a larger intensity
difference is to suppress the base fluorescence signal of F4. Potentially present residual calcium could be
removed by employing the chelating agent egtazic acid (EGTA). EGTA would bind any residual calcium
present and suppress the base fluorescence of F4. We observed that a concentration of 1 mM of EGTA
almost completely suppresses the fluorescent signal of a 10 µM F4 solution in bulk (see Figure 24). However,
using EGTA would also necessitate the use of an increased calcium concentration for the assay to firstly
saturate the chelating agent. Since the binding ratio of EGTA:Ca2+ is 1:1, calcium concentrations of 10 mM
or more might be needed to compensate, as well as to increase the F4 fluorescence. This in turn leads to
challenges regarding the osmolarity difference between intracellular and extracellular phases. If the difference
is too high (>50 mOsm/kg), the likelihood of vesicle rupture or deterioration increases. Unfortunately, the
osmolarity of the CaCl2 solutions starts to drastically increase after 1 mM, especially in combination with
the ionophore. The osmolarity of a 10 mM calcium solution containing 1 µM of the ionophore ionomycin is
55 mOsm/kg, while the proposed inner aqueous phase containing 10 µM of F4 and 1 mM of EGTA has an
osmolarity of only 25 mOsm/kg. While this is a manageable difference, it will likely lead to major disrup-
33
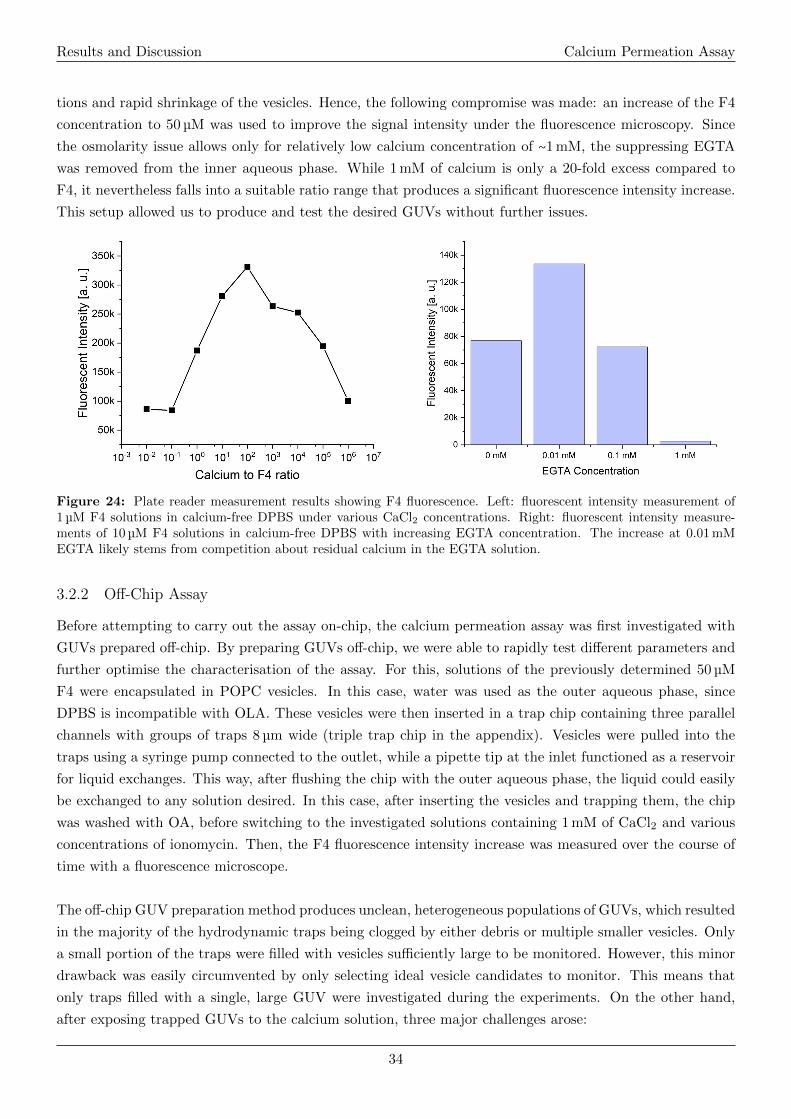
Results and Discussion Calcium Permeation Assay
tions and rapid shrinkage of the vesicles. Hence, the following compromise was made: an increase of the F4
concentration to 50 µM was used to improve the signal intensity under the fluorescence microscopy. Since
the osmolarity issue allows only for relatively low calcium concentration of ∼1 mM, the suppressing EGTA
was removed from the inner aqueous phase. While 1 mM of calcium is only a 20-fold excess compared to
F4, it nevertheless falls into a suitable ratio range that produces a significant fluorescence intensity increase.
This setup allowed us to produce and test the desired GUVs without further issues.
Figure 24: Plate reader measurement results showing F4 fluorescence. Left: fluorescent intensity measurement of1 µM F4 solutions in calcium-free DPBS under various CaCl2 concentrations. Right: fluorescent intensity measure-ments of 10 µM F4 solutions in calcium-free DPBS with increasing EGTA concentration. The increase at 0.01 mMEGTA likely stems from competition about residual calcium in the EGTA solution.
3.2.2 Off-Chip Assay
Before attempting to carry out the assay on-chip, the calcium permeation assay was first investigated with
GUVs prepared off-chip. By preparing GUVs off-chip, we were able to rapidly test different parameters and
further optimise the characterisation of the assay. For this, solutions of the previously determined 50 µM
F4 were encapsulated in POPC vesicles. In this case, water was used as the outer aqueous phase, since
DPBS is incompatible with OLA. These vesicles were then inserted in a trap chip containing three parallel
channels with groups of traps 8 µm wide (triple trap chip in the appendix). Vesicles were pulled into the
traps using a syringe pump connected to the outlet, while a pipette tip at the inlet functioned as a reservoir
for liquid exchanges. This way, after flushing the chip with the outer aqueous phase, the liquid could easily
be exchanged to any solution desired. In this case, after inserting the vesicles and trapping them, the chip
was washed with OA, before switching to the investigated solutions containing 1 mM of CaCl2 and various
concentrations of ionomycin. Then, the F4 fluorescence intensity increase was measured over the course of
time with a fluorescence microscope.
The off-chip GUV preparation method produces unclean, heterogeneous populations of GUVs, which resulted
in the majority of the hydrodynamic traps being clogged by either debris or multiple smaller vesicles. Only
a small portion of the traps were filled with vesicles sufficiently large to be monitored. However, this minor
drawback was easily circumvented by only selecting ideal vesicle candidates to monitor. This means that
only traps filled with a single, large GUV were investigated during the experiments. On the other hand,
after exposing trapped GUVs to the calcium solution, three major challenges arose:
34
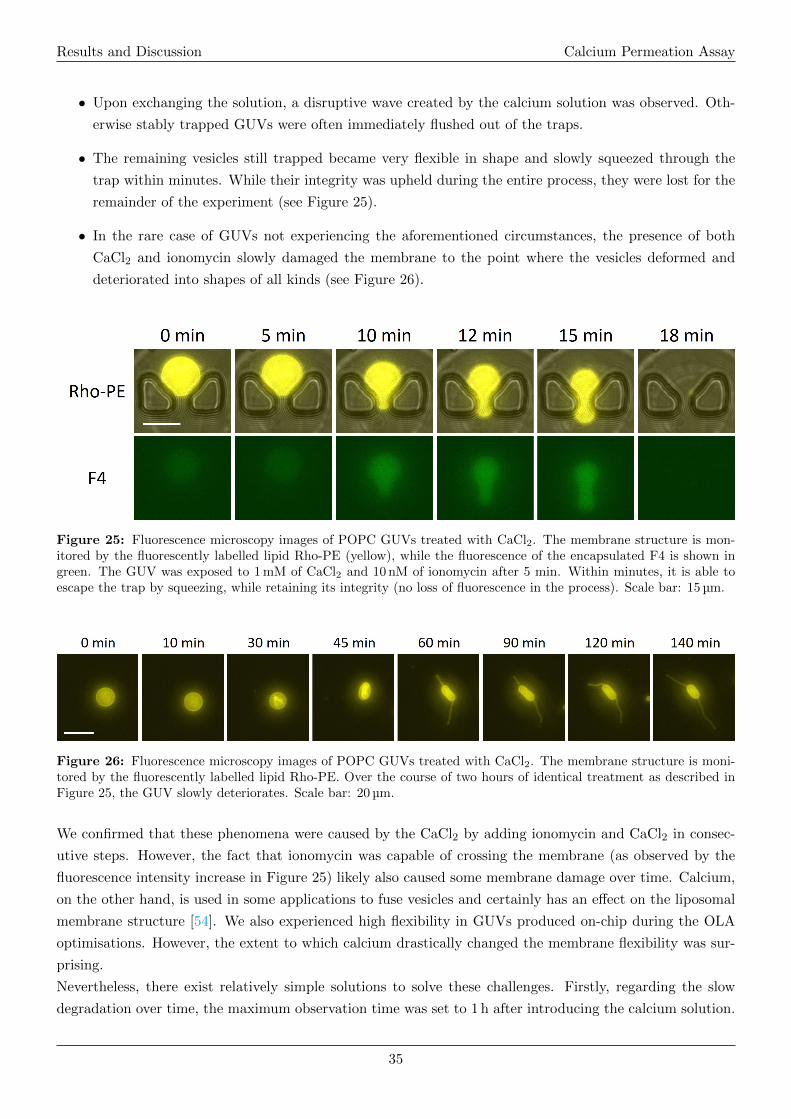
Results and Discussion Calcium Permeation Assay
• Upon exchanging the solution, a disruptive wave created by the calcium solution was observed. Oth-
erwise stably trapped GUVs were often immediately flushed out of the traps.
• The remaining vesicles still trapped became very flexible in shape and slowly squeezed through the
trap within minutes. While their integrity was upheld during the entire process, they were lost for the
remainder of the experiment (see Figure 25).
• In the rare case of GUVs not experiencing the aforementioned circumstances, the presence of both
CaCl2 and ionomycin slowly damaged the membrane to the point where the vesicles deformed and
deteriorated into shapes of all kinds (see Figure 26).
Figure 25: Fluorescence microscopy images of POPC GUVs treated with CaCl2. The membrane structure is mon-itored by the fluorescently labelled lipid Rho-PE (yellow), while the fluorescence of the encapsulated F4 is shown ingreen. The GUV was exposed to 1 mM of CaCl2 and 10 nM of ionomycin after 5 min. Within minutes, it is able toescape the trap by squeezing, while retaining its integrity (no loss of fluorescence in the process). Scale bar: 15 µm.
Figure 26: Fluorescence microscopy images of POPC GUVs treated with CaCl2. The membrane structure is moni-tored by the fluorescently labelled lipid Rho-PE. Over the course of two hours of identical treatment as described inFigure 25, the GUV slowly deteriorates. Scale bar: 20 µm.
We confirmed that these phenomena were caused by the CaCl2 by adding ionomycin and CaCl2 in consec-
utive steps. However, the fact that ionomycin was capable of crossing the membrane (as observed by the
fluorescence intensity increase in Figure 25) likely also caused some membrane damage over time. Calcium,
on the other hand, is used in some applications to fuse vesicles and certainly has an effect on the liposomal
membrane structure [54]. We also experienced high flexibility in GUVs produced on-chip during the OLA
optimisations. However, the extent to which calcium drastically changed the membrane flexibility was sur-
prising.
Nevertheless, there exist relatively simple solutions to solve these challenges. Firstly, regarding the slow
degradation over time, the maximum observation time was set to 1 h after introducing the calcium solution.
35
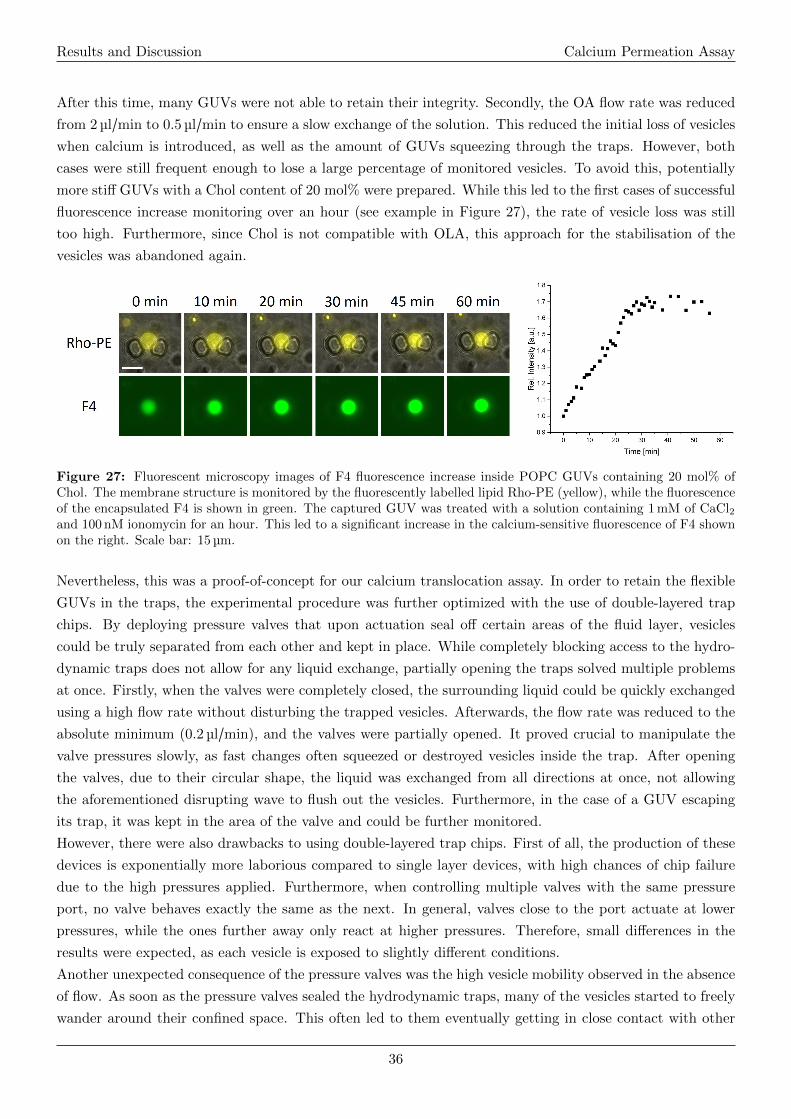
Results and Discussion Calcium Permeation Assay
After this time, many GUVs were not able to retain their integrity. Secondly, the OA flow rate was reduced
from 2 µl/min to 0.5 µl/min to ensure a slow exchange of the solution. This reduced the initial loss of vesicles
when calcium is introduced, as well as the amount of GUVs squeezing through the traps. However, both
cases were still frequent enough to lose a large percentage of monitored vesicles. To avoid this, potentially
more stiff GUVs with a Chol content of 20 mol% were prepared. While this led to the first cases of successful
fluorescence increase monitoring over an hour (see example in Figure 27), the rate of vesicle loss was still
too high. Furthermore, since Chol is not compatible with OLA, this approach for the stabilisation of the
vesicles was abandoned again.
Figure 27: Fluorescent microscopy images of F4 fluorescence increase inside POPC GUVs containing 20 mol% ofChol. The membrane structure is monitored by the fluorescently labelled lipid Rho-PE (yellow), while the fluorescenceof the encapsulated F4 is shown in green. The captured GUV was treated with a solution containing 1 mM of CaCl2and 100 nM ionomycin for an hour. This led to a significant increase in the calcium-sensitive fluorescence of F4 shownon the right. Scale bar: 15 µm.
Nevertheless, this was a proof-of-concept for our calcium translocation assay. In order to retain the flexible
GUVs in the traps, the experimental procedure was further optimized with the use of double-layered trap
chips. By deploying pressure valves that upon actuation seal off certain areas of the fluid layer, vesicles
could be truly separated from each other and kept in place. While completely blocking access to the hydro-
dynamic traps does not allow for any liquid exchange, partially opening the traps solved multiple problems
at once. Firstly, when the valves were completely closed, the surrounding liquid could be quickly exchanged
using a high flow rate without disturbing the trapped vesicles. Afterwards, the flow rate was reduced to the
absolute minimum (0.2 µl/min), and the valves were partially opened. It proved crucial to manipulate the
valve pressures slowly, as fast changes often squeezed or destroyed vesicles inside the trap. After opening
the valves, due to their circular shape, the liquid was exchanged from all directions at once, not allowing
the aforementioned disrupting wave to flush out the vesicles. Furthermore, in the case of a GUV escaping
its trap, it was kept in the area of the valve and could be further monitored.
However, there were also drawbacks to using double-layered trap chips. First of all, the production of these
devices is exponentially more laborious compared to single layer devices, with high chances of chip failure
due to the high pressures applied. Furthermore, when controlling multiple valves with the same pressure
port, no valve behaves exactly the same as the next. In general, valves close to the port actuate at lower
pressures, while the ones further away only react at higher pressures. Therefore, small differences in the
results were expected, as each vesicle is exposed to slightly different conditions.
Another unexpected consequence of the pressure valves was the high vesicle mobility observed in the absence
of flow. As soon as the pressure valves sealed the hydrodynamic traps, many of the vesicles started to freely
wander around their confined space. This often led to them eventually getting in close contact with other
36
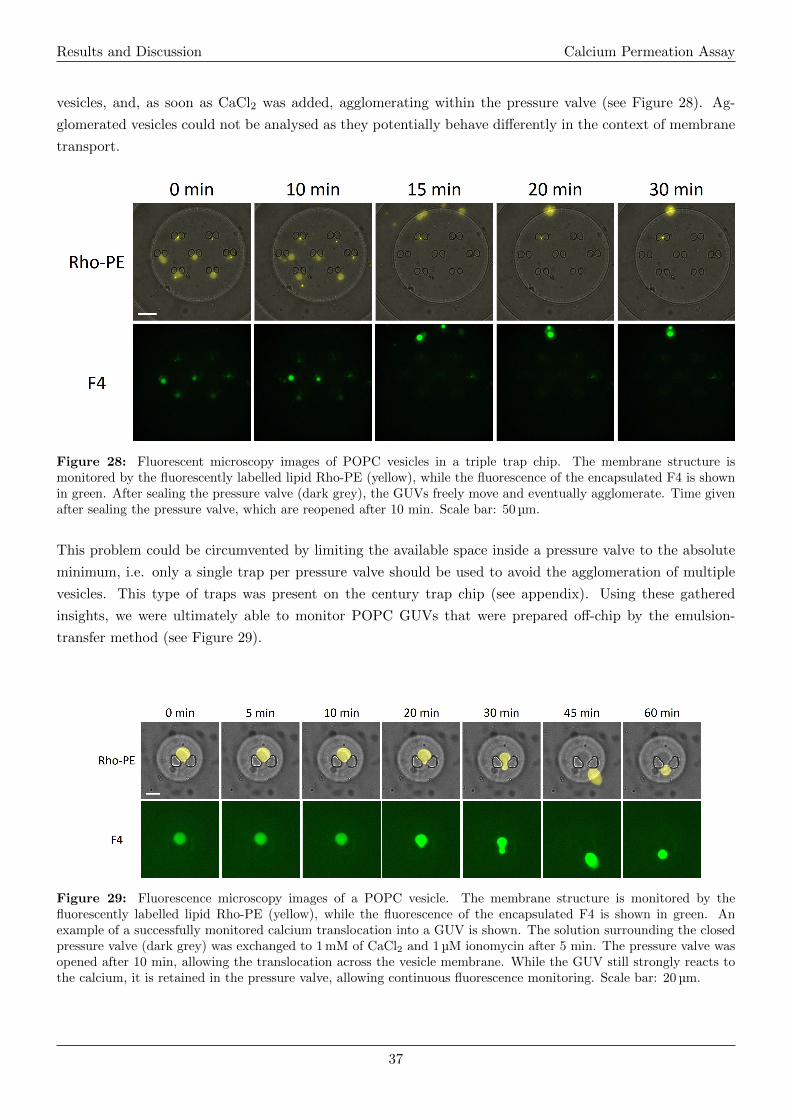
Results and Discussion Calcium Permeation Assay
vesicles, and, as soon as CaCl2 was added, agglomerating within the pressure valve (see Figure 28). Ag-
glomerated vesicles could not be analysed as they potentially behave differently in the context of membrane
transport.
Figure 28: Fluorescent microscopy images of POPC vesicles in a triple trap chip. The membrane structure ismonitored by the fluorescently labelled lipid Rho-PE (yellow), while the fluorescence of the encapsulated F4 is shownin green. After sealing the pressure valve (dark grey), the GUVs freely move and eventually agglomerate. Time givenafter sealing the pressure valve, which are reopened after 10 min. Scale bar: 50 µm.
This problem could be circumvented by limiting the available space inside a pressure valve to the absolute
minimum, i.e. only a single trap per pressure valve should be used to avoid the agglomeration of multiple
vesicles. This type of traps was present on the century trap chip (see appendix). Using these gathered
insights, we were ultimately able to monitor POPC GUVs that were prepared off-chip by the emulsion-
transfer method (see Figure 29).
Figure 29: Fluorescence microscopy images of a POPC vesicle. The membrane structure is monitored by thefluorescently labelled lipid Rho-PE (yellow), while the fluorescence of the encapsulated F4 is shown in green. Anexample of a successfully monitored calcium translocation into a GUV is shown. The solution surrounding the closedpressure valve (dark grey) was exchanged to 1 mM of CaCl2 and 1 µM ionomycin after 5 min. The pressure valve wasopened after 10 min, allowing the translocation across the vesicle membrane. While the GUV still strongly reacts tothe calcium, it is retained in the pressure valve, allowing continuous fluorescence monitoring. Scale bar: 20 µm.
37
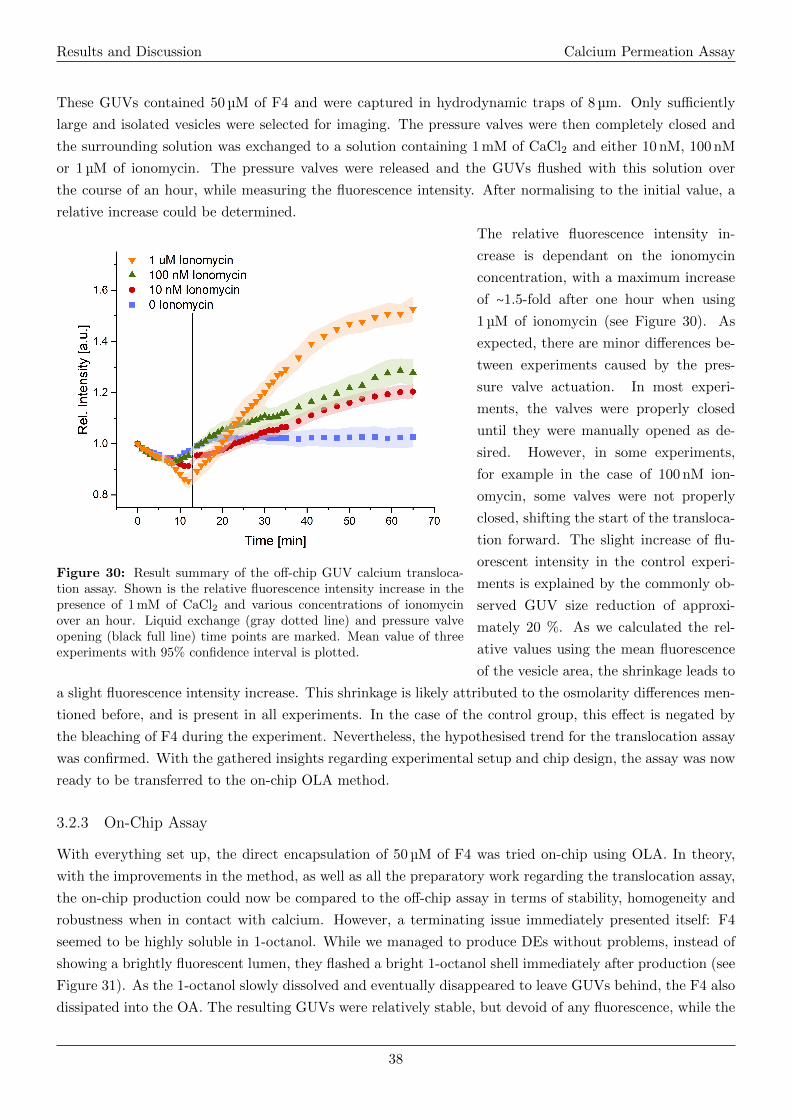
Results and Discussion Calcium Permeation Assay
These GUVs contained 50 µM of F4 and were captured in hydrodynamic traps of 8 µm. Only sufficiently
large and isolated vesicles were selected for imaging. The pressure valves were then completely closed and
the surrounding solution was exchanged to a solution containing 1 mM of CaCl2 and either 10 nM, 100 nM
or 1 µM of ionomycin. The pressure valves were released and the GUVs flushed with this solution over
the course of an hour, while measuring the fluorescence intensity. After normalising to the initial value, a
relative increase could be determined.
Figure 30: Result summary of the off-chip GUV calcium transloca-tion assay. Shown is the relative fluorescence intensity increase in thepresence of 1 mM of CaCl2 and various concentrations of ionomycinover an hour. Liquid exchange (gray dotted line) and pressure valveopening (black full line) time points are marked. Mean value of threeexperiments with 95% confidence interval is plotted.
The relative fluorescence intensity in-
crease is dependant on the ionomycin
concentration, with a maximum increase
of ∼1.5-fold after one hour when using
1 µM of ionomycin (see Figure 30). As
expected, there are minor differences be-
tween experiments caused by the pres-
sure valve actuation. In most experi-
ments, the valves were properly closed
until they were manually opened as de-
sired. However, in some experiments,
for example in the case of 100 nM ion-
omycin, some valves were not properly
closed, shifting the start of the transloca-
tion forward. The slight increase of flu-
orescent intensity in the control experi-
ments is explained by the commonly ob-
served GUV size reduction of approxi-
mately 20 %. As we calculated the rel-
ative values using the mean fluorescence
of the vesicle area, the shrinkage leads to
a slight fluorescence intensity increase. This shrinkage is likely attributed to the osmolarity differences men-
tioned before, and is present in all experiments. In the case of the control group, this effect is negated by
the bleaching of F4 during the experiment. Nevertheless, the hypothesised trend for the translocation assay
was confirmed. With the gathered insights regarding experimental setup and chip design, the assay was now
ready to be transferred to the on-chip OLA method.
3.2.3 On-Chip Assay
With everything set up, the direct encapsulation of 50 µM of F4 was tried on-chip using OLA. In theory,
with the improvements in the method, as well as all the preparatory work regarding the translocation assay,
the on-chip production could now be compared to the off-chip assay in terms of stability, homogeneity and
robustness when in contact with calcium. However, a terminating issue immediately presented itself: F4
seemed to be highly soluble in 1-octanol. While we managed to produce DEs without problems, instead of
showing a brightly fluorescent lumen, they flashed a bright 1-octanol shell immediately after production (see
Figure 31). As the 1-octanol slowly dissolved and eventually disappeared to leave GUVs behind, the F4 also
dissipated into the OA. The resulting GUVs were relatively stable, but devoid of any fluorescence, while the
38
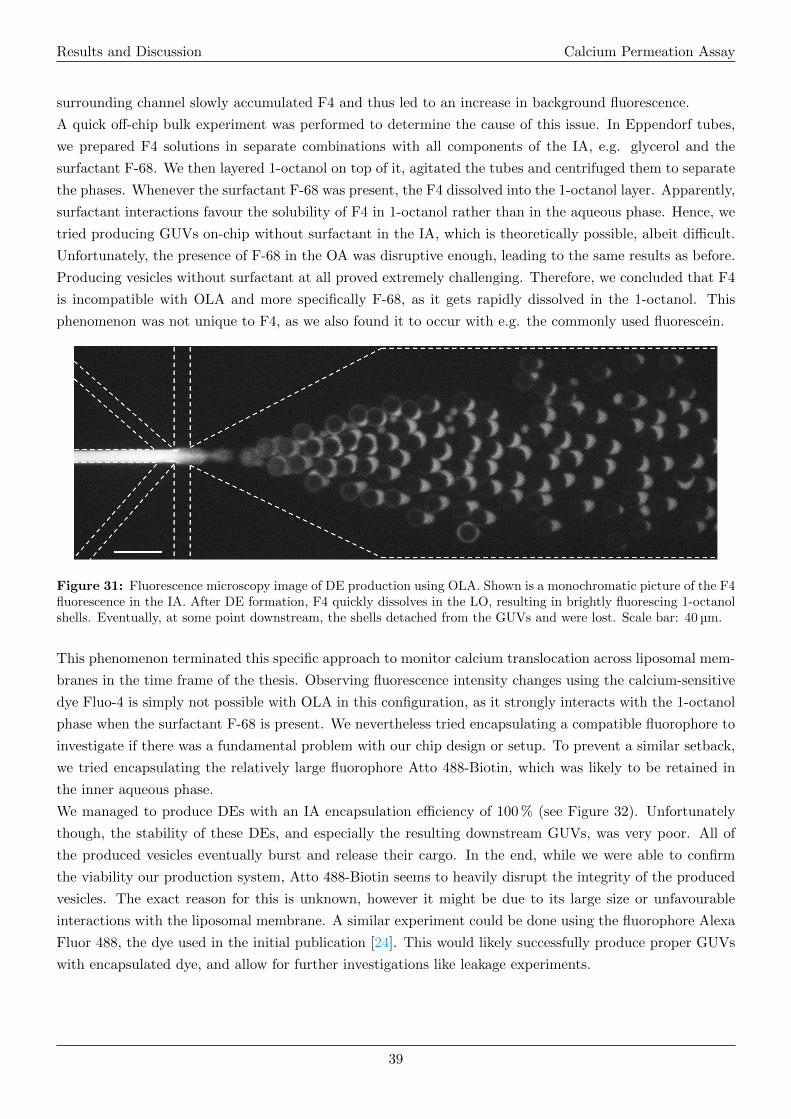
Results and Discussion Calcium Permeation Assay
surrounding channel slowly accumulated F4 and thus led to an increase in background fluorescence.
A quick off-chip bulk experiment was performed to determine the cause of this issue. In Eppendorf tubes,
we prepared F4 solutions in separate combinations with all components of the IA, e.g. glycerol and the
surfactant F-68. We then layered 1-octanol on top of it, agitated the tubes and centrifuged them to separate
the phases. Whenever the surfactant F-68 was present, the F4 dissolved into the 1-octanol layer. Apparently,
surfactant interactions favour the solubility of F4 in 1-octanol rather than in the aqueous phase. Hence, we
tried producing GUVs on-chip without surfactant in the IA, which is theoretically possible, albeit difficult.
Unfortunately, the presence of F-68 in the OA was disruptive enough, leading to the same results as before.
Producing vesicles without surfactant at all proved extremely challenging. Therefore, we concluded that F4
is incompatible with OLA and more specifically F-68, as it gets rapidly dissolved in the 1-octanol. This
phenomenon was not unique to F4, as we also found it to occur with e.g. the commonly used fluorescein.
Figure 31: Fluorescence microscopy image of DE production using OLA. Shown is a monochromatic picture of the F4fluorescence in the IA. After DE formation, F4 quickly dissolves in the LO, resulting in brightly fluorescing 1-octanolshells. Eventually, at some point downstream, the shells detached from the GUVs and were lost. Scale bar: 40 µm.
This phenomenon terminated this specific approach to monitor calcium translocation across liposomal mem-
branes in the time frame of the thesis. Observing fluorescence intensity changes using the calcium-sensitive
dye Fluo-4 is simply not possible with OLA in this configuration, as it strongly interacts with the 1-octanol
phase when the surfactant F-68 is present. We nevertheless tried encapsulating a compatible fluorophore to
investigate if there was a fundamental problem with our chip design or setup. To prevent a similar setback,
we tried encapsulating the relatively large fluorophore Atto 488-Biotin, which was likely to be retained in
the inner aqueous phase.
We managed to produce DEs with an IA encapsulation efficiency of 100 % (see Figure 32). Unfortunately
though, the stability of these DEs, and especially the resulting downstream GUVs, was very poor. All of
the produced vesicles eventually burst and release their cargo. In the end, while we were able to confirm
the viability our production system, Atto 488-Biotin seems to heavily disrupt the integrity of the produced
vesicles. The exact reason for this is unknown, however it might be due to its large size or unfavourable
interactions with the liposomal membrane. A similar experiment could be done using the fluorophore Alexa
Fluor 488, the dye used in the initial publication [24]. This would likely successfully produce proper GUVs
with encapsulated dye, and allow for further investigations like leakage experiments.
39
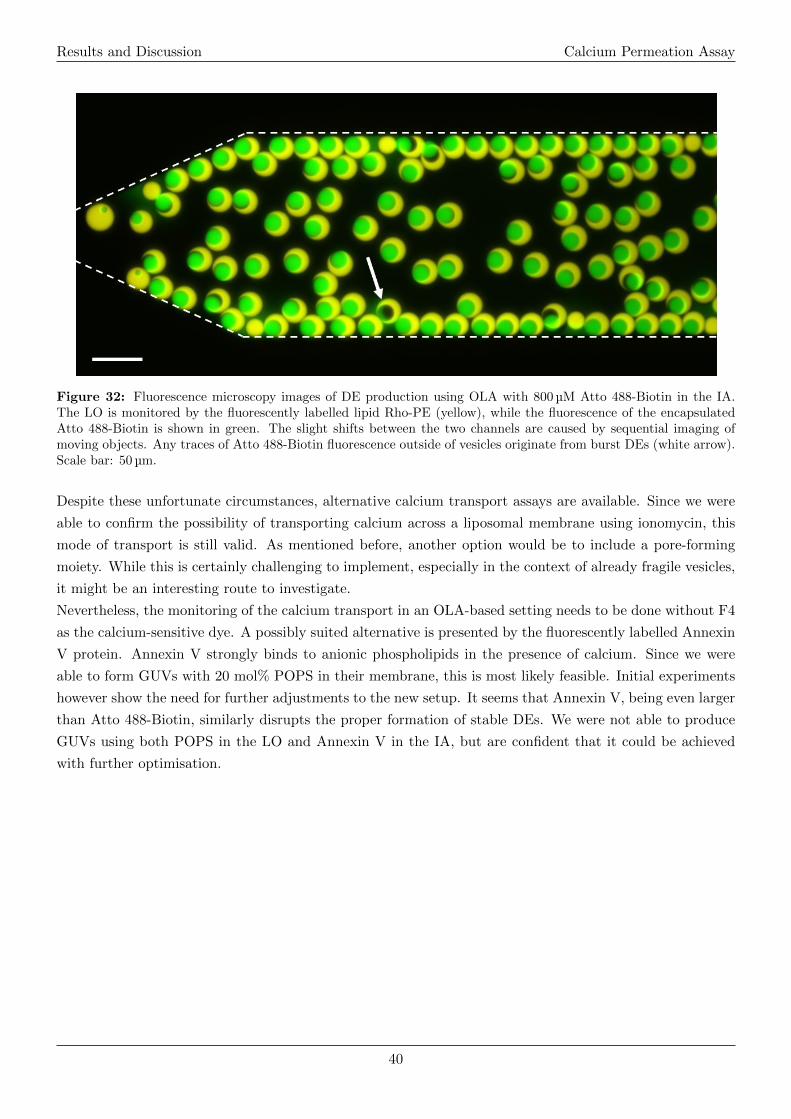
Results and Discussion Calcium Permeation Assay
Figure 32: Fluorescence microscopy images of DE production using OLA with 800 µM Atto 488-Biotin in the IA.The LO is monitored by the fluorescently labelled lipid Rho-PE (yellow), while the fluorescence of the encapsulatedAtto 488-Biotin is shown in green. The slight shifts between the two channels are caused by sequential imaging ofmoving objects. Any traces of Atto 488-Biotin fluorescence outside of vesicles originate from burst DEs (white arrow).Scale bar: 50 µm.
Despite these unfortunate circumstances, alternative calcium transport assays are available. Since we were
able to confirm the possibility of transporting calcium across a liposomal membrane using ionomycin, this
mode of transport is still valid. As mentioned before, another option would be to include a pore-forming
moiety. While this is certainly challenging to implement, especially in the context of already fragile vesicles,
it might be an interesting route to investigate.
Nevertheless, the monitoring of the calcium transport in an OLA-based setting needs to be done without F4
as the calcium-sensitive dye. A possibly suited alternative is presented by the fluorescently labelled Annexin
V protein. Annexin V strongly binds to anionic phospholipids in the presence of calcium. Since we were
able to form GUVs with 20 mol% POPS in their membrane, this is most likely feasible. Initial experiments
however show the need for further adjustments to the new setup. It seems that Annexin V, being even larger
than Atto 488-Biotin, similarly disrupts the proper formation of stable DEs. We were not able to produce
GUVs using both POPS in the LO and Annexin V in the IA, but are confident that it could be achieved
with further optimisation.
40
Conclusion and Outlook
4 Conclusion and Outlook
There were two main goals to achieve during this thesis: a substantial improvement in on-chip production
of GUVs using OLA and the successful development and application of a simple chemical assay involving
said GUVs.
We adapted and optimised the OLA method by investigating various aspects ranging from the microfab-
rication process to the used aqueous and oil phases. We found a high flexibility in the fabrication timing,
including the crucial coating step, by investigating different incubation times with the PVA solution used for
coating. An ideal compromise between consumed time during fabrication and suitable hydrophilic properties
for on-chip GUV production was found to be a 15 min coating period.
We also identified suitable lipid types for the OLA method. We found that choline phospholipids like DOPC
or POPC were suited best. Other phospholipids like POPS could be incorporated at low molar percentages
(up to ∼20 mol%). Structurally uncommon lipids like Chol however were largely incompatible with OLA
in our experiments. Nevertheless, literature suggests the possibility of various other lipid compositions,
allowing for a diverse population of GUVs produced with OLA [28].
We further investigated the aqueous phase compositions, namely both the surfactant type and concentration,
as well as the ratio between the IA and OA. We found that OLA requires the use of the surfactant Pluronic®
F-68 and is incompatible with all other tested surfactants. We also determined a ratio of 2.5 to 5 vol% from
IA to OA as the ideal composition. This ratio led to a robust production of homogeneously-sized DEs that
separate into stable GUVs at a large percentage. We further identified frequent clustering of GUVs when
using more complex aqueous buffers like DPBS, which strongly limits the phase compositions necessary for
OLA production.
The biggest improvements were achieved by optimising the chip design for OLA production. We investigated
the effects of a separated OLA junction and found it applicable, but challenging. Through the inclusion of
prolonged separator structures downstream of the junction, we managed to further increase the separation
efficiency from DEs to GUVs to almost 100 %. By applying serpentine structures that allow for longer expo-
sure to high flow velocities, the separation was completed just as the GUVs enter the trap array. The trap
array was also optimised to contain a high density area of hydrodynamic traps, each separately controlled
by a pressure valve.
Regarding the second goal, we successfully developed a straightforward permeation assay involving the Ca2+
translocation through the liposomal membrane using the ionophore ionomycin. The translocation was mon-
itored by the calcium-sensitive fluorescent dye F4 that upon binding of Ca2+ exhibits a fluorescent intensity
increase. By performing preparatory bulk experiments we were able to identify a suitable concentration of
50 µM F4 in combination with a solution of 1 mM CaCl2 and various concentrations of ionomycin (10 nM,
100 nM and 1 µM). These concentrations allowed for a significant fluorescence intensity increase, as well as
a straightforward production of investigated GUVs off-chip.
We successfully observed the calcium translocation into GUVs by exposing captured vesicles in a trap chip
to the calcium/ionomycin solution for an hour. We observed a surprisingly strong reaction to the solution,
greatly increasing the GUVs’ flexibility in shape and a slow degradation of their integrity over time. Further-
more, vesicle agglomeration induced by the presence of ionic species was frequent. By using double-layered
trap chips with pressure valves that completely isolate separated vesicles and confine them to a certain area,
we were able to conduct the proposed assay successfully using off-chip produced GUVs.
41
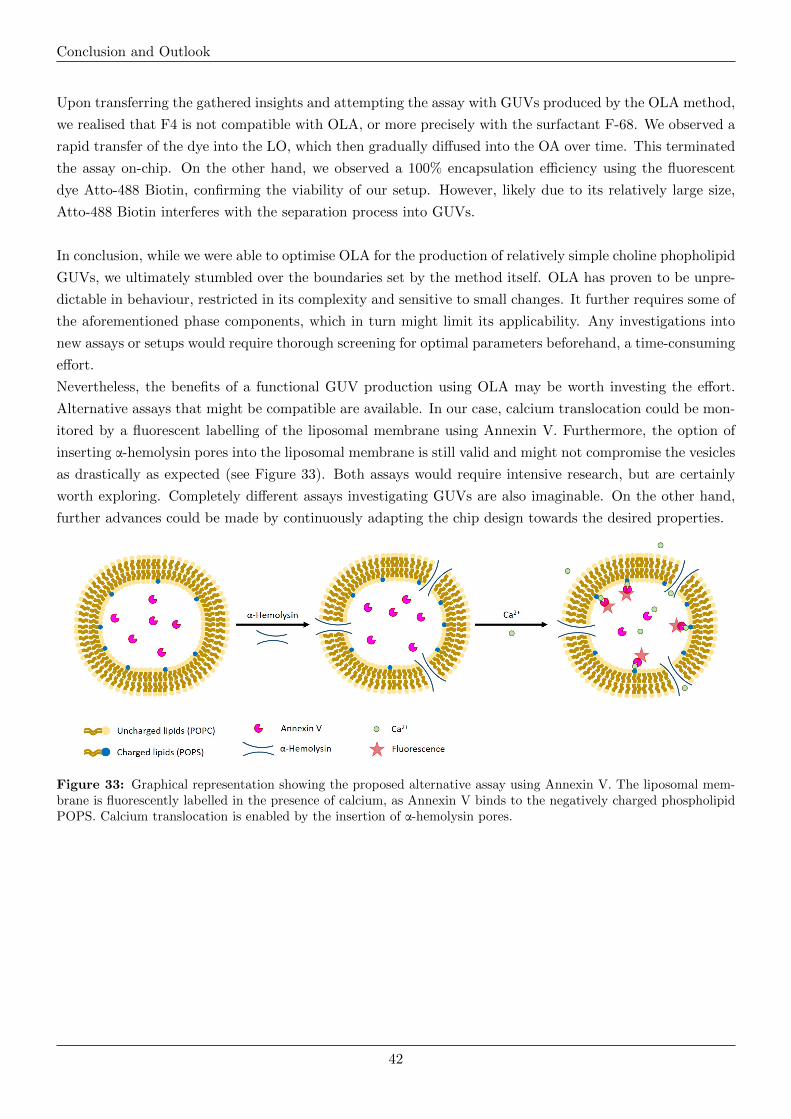
Conclusion and Outlook
Upon transferring the gathered insights and attempting the assay with GUVs produced by the OLA method,
we realised that F4 is not compatible with OLA, or more precisely with the surfactant F-68. We observed a
rapid transfer of the dye into the LO, which then gradually diffused into the OA over time. This terminated
the assay on-chip. On the other hand, we observed a 100% encapsulation efficiency using the fluorescent
dye Atto-488 Biotin, confirming the viability of our setup. However, likely due to its relatively large size,
Atto-488 Biotin interferes with the separation process into GUVs.
In conclusion, while we were able to optimise OLA for the production of relatively simple choline phopholipid
GUVs, we ultimately stumbled over the boundaries set by the method itself. OLA has proven to be unpre-
dictable in behaviour, restricted in its complexity and sensitive to small changes. It further requires some of
the aforementioned phase components, which in turn might limit its applicability. Any investigations into
new assays or setups would require thorough screening for optimal parameters beforehand, a time-consuming
effort.
Nevertheless, the benefits of a functional GUV production using OLA may be worth investing the effort.
Alternative assays that might be compatible are available. In our case, calcium translocation could be mon-
itored by a fluorescent labelling of the liposomal membrane using Annexin V. Furthermore, the option of
inserting α-hemolysin pores into the liposomal membrane is still valid and might not compromise the vesicles
as drastically as expected (see Figure 33). Both assays would require intensive research, but are certainly
worth exploring. Completely different assays investigating GUVs are also imaginable. On the other hand,
further advances could be made by continuously adapting the chip design towards the desired properties.
Figure 33: Graphical representation showing the proposed alternative assay using Annexin V. The liposomal mem-brane is fluorescently labelled in the presence of calcium, as Annexin V binds to the negatively charged phospholipidPOPS. Calcium translocation is enabled by the insertion of α-hemolysin pores.
42
Acknowledgements
Acknowledgements
I thank Prof. Dr. Petra S. Dittrich for enabling me to conduct this thesis and opening her lab space to me.
I greatly appreciate the opportunity of exploring the fascinating world of microfluidics, a field previously
unknown to me. Furthermore, I thank Prof. Dr. Wolfgang P. Meier for having kindly accepted to co-assess
this thesis. Thank you for taking the time to read and evaluate it.
I warmly thank Ariane Stucki for excellent supervision and guidance throughout this Master thesis, both
in the lab and during writing. I am particularly grateful for her positivity, her kind advise in academic
matters, her trust in my work and the pleasant working atmosphere. Thank you for giving me a memorable
experience! This naturally extends to all members of the Bioanalytics group, who welcomed me and made
me part of the family immediately.
I thank Patricia Kindlimann for her continuous emotional support and for patiently listening to me in
frustrating situations during these months. You provided the balance that I often needed, and for that I am
grateful.
43
Appendix
Appendix
Machinery
Microfabrication
• Plasma cleaner PDC-32G (Harrick Plasma, USA)
• Spin Coater WS-400-6nPP-LITE (Laurell Technologies, USA)
• Vacuum pump V-500/V-503 (Buchi Labortechnik AG, Switzerland)
• Halogen cold point light source KL 1500 compact (Schott, USA)
• Oven Memmert UNE-200 (Huber, Switzerland)
• Oven Binder E28 (Binder GmbH, Germany)
• Zoom light microscope OZL-456 (Kern GmbH, Germany)
• Biopsy punchers, 0.5/1/1.5 mm (Miltex Inc., USA)
High-Speed Imaging
• Olympus IX71 microscope (Olympus Life Sciences, Japan)
– U Plan FLN 4x objective, 0.13 NA
– U Plan FL 10x objective, 0.30 NA
– LC Plan FL 20x objective, 0.40 NA
– U Plan FLN 40x objective, 0.75 NA
• Olympus TH4-200 Halogen Lamp (Olympus Life Sciences, Japan)
• TANGO Desktop Stage controller (Marzhauser Wetzlar, Germany)
• Phantom Miro M110 high-speed camera (Vision Research Inc., USA)
• Spectra X light engine (Lumencor Inc., USA)
– 432/515/595/730 HC Quadband Filter (Semrock Inc, USA)
• MFCS-8C pressure pump controller (Fluigent, France)
Fluorescence Microscopy
• Fully automated inverted microscope Eclipse Ti2 (Nikon Corp. Japan)
– Plan Fluor PhL DL 4x objective, 0.1 NA
– Plan Fluor Ph1 DLL 10x objective, 0.3 NA
– S Plan Fluor ELWD Ph1 ADM 20x objective, 0.5 NA
44
Appendix
– S Plan FLuor ELWD Ph2 ADM 40x objective, 0.6 NA
– Plan Apo λ Ph2 DM 20X objective, 0.8 NA
• Orca flash 4.0 camera (Hamamatsu, Japan)
• Spectra X LED system (Lumencor Inc., USA)
– GFP Filter set. Excitation range: 466 ±40 nm. Emission range: 525 ± 50 nm. (AHF Analysen-
technik)
– Cy3 Filter set. Excitation range: 431 ±40 nm. Emission range: 593 ± 50 nm. (AHF Analysen-
technik)
• Pressure control unit (custom made)
• MFCS-8C pressure pump controller (Fluigent, France)
• NanoJet syringe pump (Chemyx Inc., USA)
• neMESYS 290N low-pressure syringe pump (Cetoni GmbH, Germany)
Various
• Barnstead™ GenPure water purification system (ThermoScientific, USA)
• Rotovapor R-200 (Buchi Labortechnik AG, Switzerland)
– Vacuum Pump V-503
– Vacuum Controller V-800/V-720
• Mettler P1210 scale (Mettler Toledo, USA)
• Mettler AE240 scale (Mettler Toledo, USA)
• KB 10000-1N scale (Kern GmbH, Germany)
• Emmi-40HC sonicator (EMAG Technologies Inc., USA)
• MiniSpin centrifuge (Eppendorf, Germany)
• Sigma 3-19KS centrifuge (Sigma Laborzentrifugen GmbH, Germany)
Software
• MAESFLO pressure pump software version 3.2 (Fluigent, France)
• Phantom Camera Control (PCC) version 3.5 (Vision Research Inc., USA)
• NIS Elements AR version 5.11.01, Build 1267 (Nikon, Japan)
• neMESYS UserInterface version 3.1.1 (Cetoni, Germany)
45
Appendix
• ImageJ version 1.8 (NIH, USA)
• AutoCAD version 23.1 (Autodesk Softwares Inc., USA)
• Microsoft Office 2013 (Microsoft, USA)
• Origin 2020 (OriginLab Corp., USA)
Materials
Unless otherwise marked, chemicals were purchased either from Sigma-Aldrich or ThermoFisher Scientific
(USA). All lipids were purchased from Avanti Polar Lipids Inc. (USA).
Common Chemicals
• Polydimethylsiloxane (PDMS), Sylgard 184 (Dow Corning, USA)
• Trichloro(1H,1H,2H,2H-perfluorooctyl)silane 97%
• PTFE Teflon AF
• Glyerol 99%
• 1-octanol (for HPCL) 99%
• Triethyleneglycoldiaminetetraacetic acid (EGTA) 99%
• Calcium chloride anhydrous (CaCl2) 97%
• Bovine Serum Albumin (BSA), heat-shock fraction 98%
• Optiprep™ density gradient medium
• Dulbecco’s phosphate buffer saline (DPBS) without CaCl2 and MgCl2
• Ionomycin calcium salt (Streptomyces conglobatus)
Lipids
• 1,2-Dioleoyl-sn-glycero-3-phosphocholine (DOPC)
• 2-Oleoyl-1-palmitoyl-sn-glycero-3-phosphocholine (POPC)
• 1,2-Dioleoyl-sn-glycero-3-phosphoethanolamine-N-(lissamine rhodamine B sulfonyl)(ammonium salt)
(Rho-PE)
• 2-Oleoyl-1-palmitoyl-sn-glycero-3-phospho-L-serine (sodium salt) (POPS)
• Cholesterol ovine (Chol)
46
Appendix
Fluorescent Dyes
• Fluo-4 (pentapotassium salt, cell impermeant)
• Atto-488 Biotin
• Fluorescein
Surfactants
• (poly)oxyethylene-(poly)oxypropylene block copolymer (Pluronic® F-68, 10% solution)
• Poloxamer 188 (10% solution)
• Sorbitane monooleate (Span®80)
• (poly)ethylen glyol sorbitan monolaurate (Tween®20)
• (poly)vinyl alcohol (PVA)
47
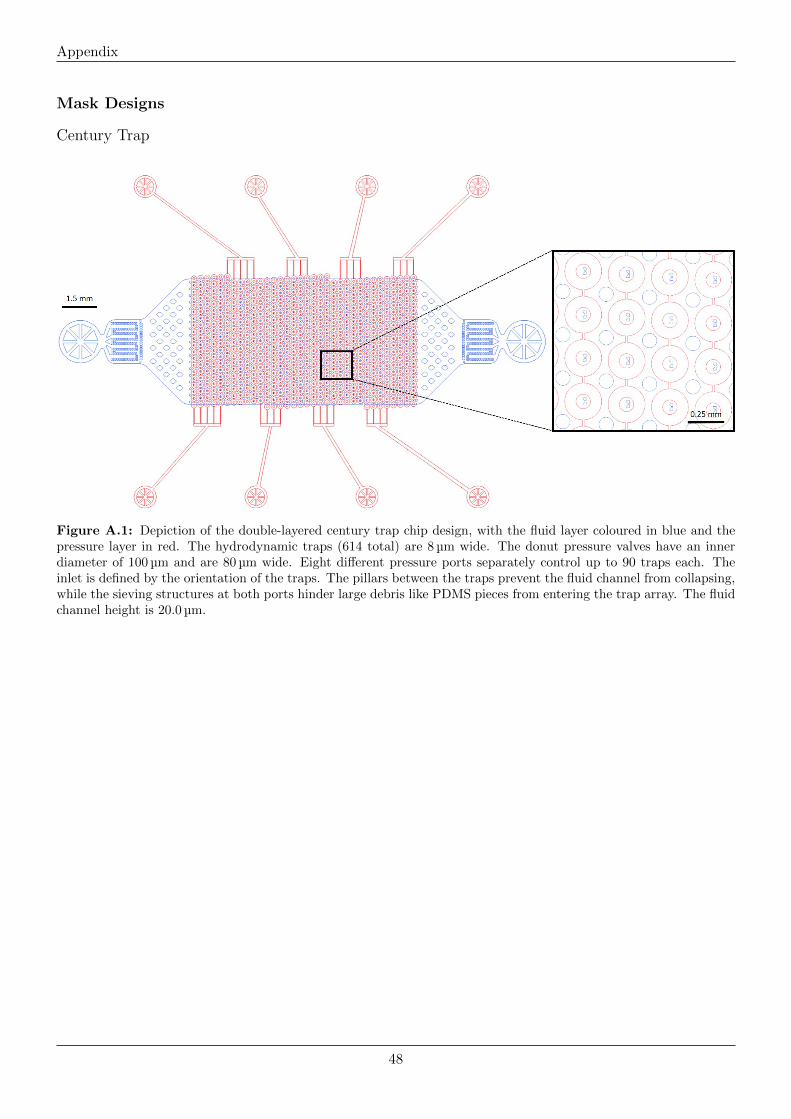
Appendix
Mask Designs
Century Trap
Figure A.1: Depiction of the double-layered century trap chip design, with the fluid layer coloured in blue and thepressure layer in red. The hydrodynamic traps (614 total) are 8 µm wide. The donut pressure valves have an innerdiameter of 100 µm and are 80 µm wide. Eight different pressure ports separately control up to 90 traps each. Theinlet is defined by the orientation of the traps. The pillars between the traps prevent the fluid channel from collapsing,while the sieving structures at both ports hinder large debris like PDMS pieces from entering the trap array. The fluidchannel height is 20.0 µm.
48
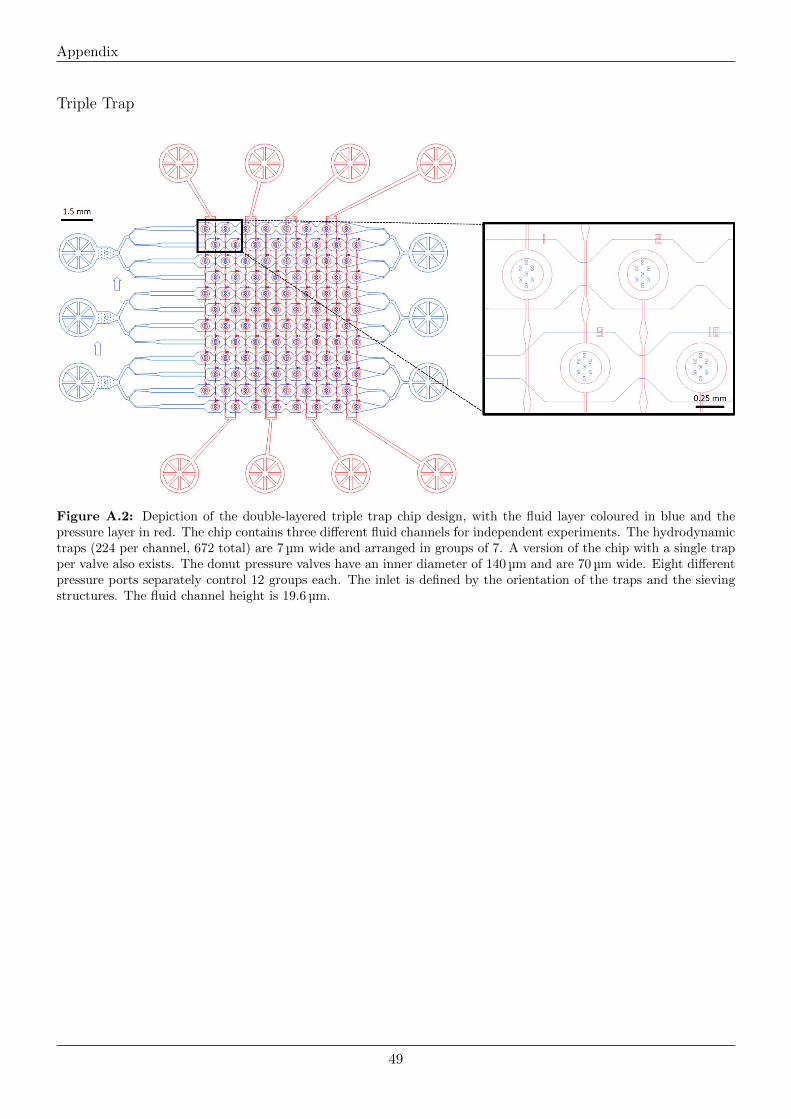
Appendix
Triple Trap
Figure A.2: Depiction of the double-layered triple trap chip design, with the fluid layer coloured in blue and thepressure layer in red. The chip contains three different fluid channels for independent experiments. The hydrodynamictraps (224 per channel, 672 total) are 7 µm wide and arranged in groups of 7. A version of the chip with a single trapper valve also exists. The donut pressure valves have an inner diameter of 140 µm and are 70 µm wide. Eight differentpressure ports separately control 12 groups each. The inlet is defined by the orientation of the traps and the sievingstructures. The fluid channel height is 19.6 µm.
49
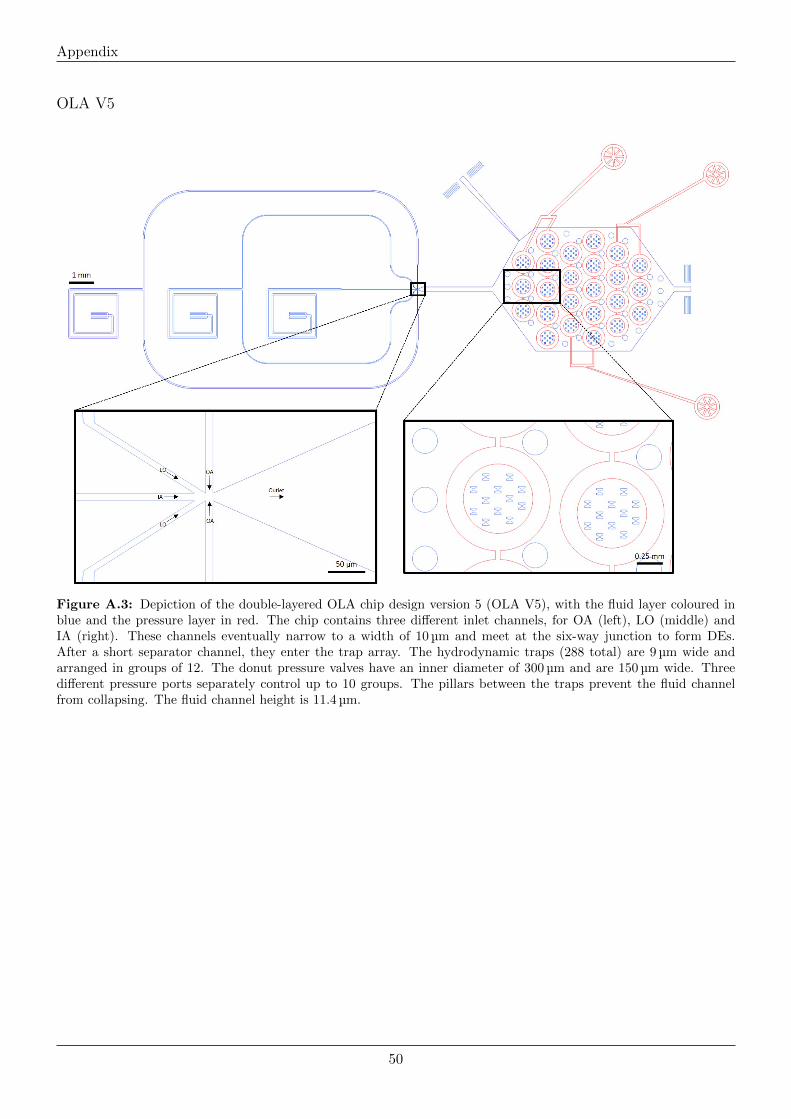
Appendix
OLA V5
Figure A.3: Depiction of the double-layered OLA chip design version 5 (OLA V5), with the fluid layer coloured inblue and the pressure layer in red. The chip contains three different inlet channels, for OA (left), LO (middle) andIA (right). These channels eventually narrow to a width of 10 µm and meet at the six-way junction to form DEs.After a short separator channel, they enter the trap array. The hydrodynamic traps (288 total) are 9 µm wide andarranged in groups of 12. The donut pressure valves have an inner diameter of 300 µm and are 150 µm wide. Threedifferent pressure ports separately control up to 10 groups. The pillars between the traps prevent the fluid channelfrom collapsing. The fluid channel height is 11.4 µm.
50
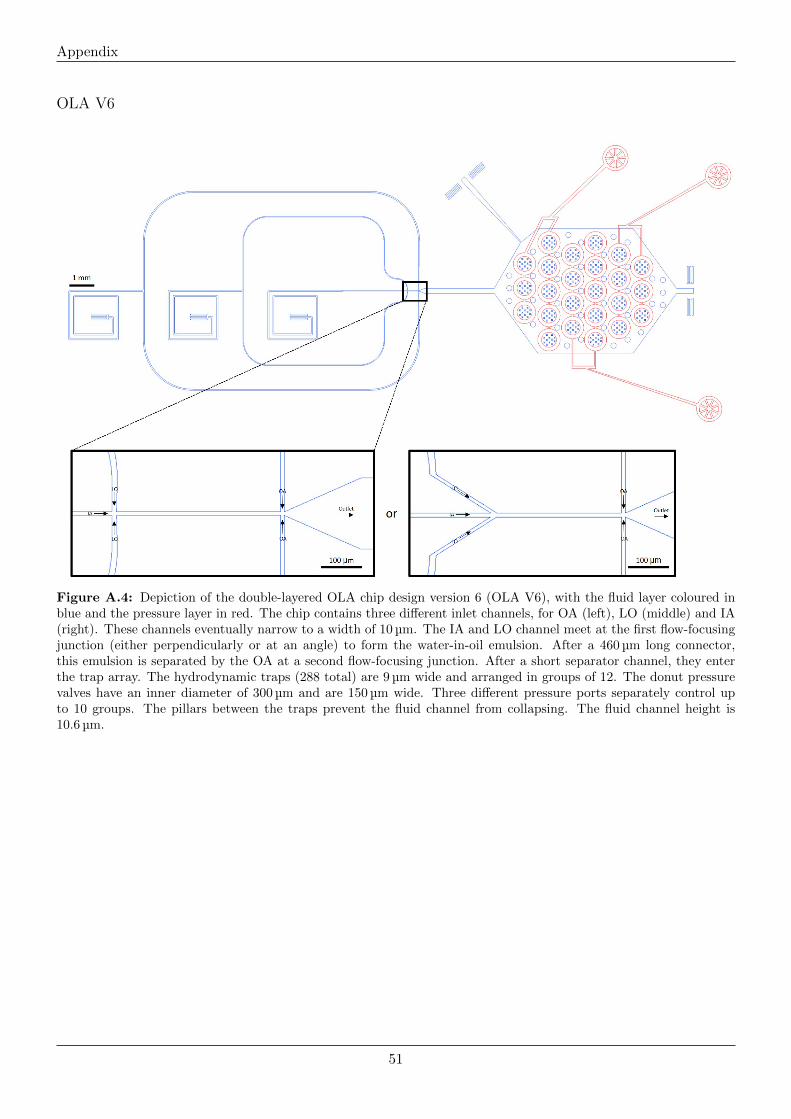
Appendix
OLA V6
Figure A.4: Depiction of the double-layered OLA chip design version 6 (OLA V6), with the fluid layer coloured inblue and the pressure layer in red. The chip contains three different inlet channels, for OA (left), LO (middle) and IA(right). These channels eventually narrow to a width of 10 µm. The IA and LO channel meet at the first flow-focusingjunction (either perpendicularly or at an angle) to form the water-in-oil emulsion. After a 460 µm long connector,this emulsion is separated by the OA at a second flow-focusing junction. After a short separator channel, they enterthe trap array. The hydrodynamic traps (288 total) are 9 µm wide and arranged in groups of 12. The donut pressurevalves have an inner diameter of 300 µm and are 150 µm wide. Three different pressure ports separately control upto 10 groups. The pillars between the traps prevent the fluid channel from collapsing. The fluid channel height is10.6 µm.
51
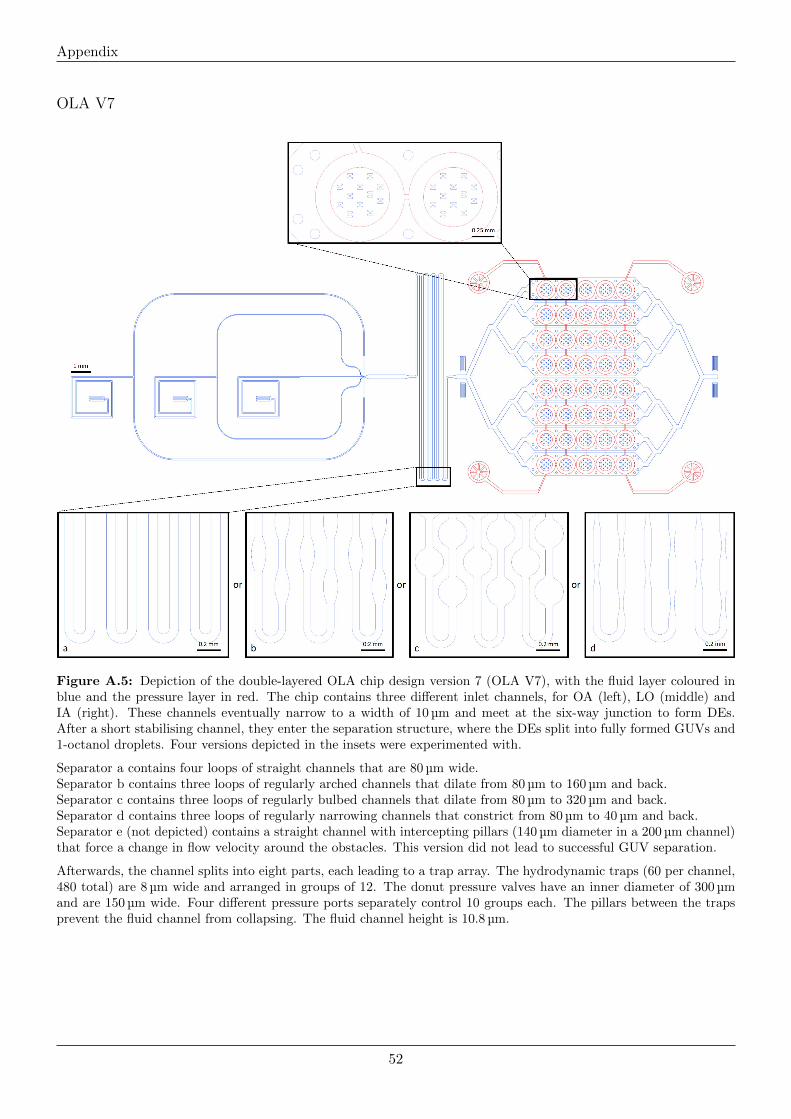
Appendix
OLA V7
Figure A.5: Depiction of the double-layered OLA chip design version 7 (OLA V7), with the fluid layer coloured inblue and the pressure layer in red. The chip contains three different inlet channels, for OA (left), LO (middle) andIA (right). These channels eventually narrow to a width of 10 µm and meet at the six-way junction to form DEs.After a short stabilising channel, they enter the separation structure, where the DEs split into fully formed GUVs and1-octanol droplets. Four versions depicted in the insets were experimented with.
Separator a contains four loops of straight channels that are 80 µm wide.Separator b contains three loops of regularly arched channels that dilate from 80 µm to 160 µm and back.Separator c contains three loops of regularly bulbed channels that dilate from 80 µm to 320 µm and back.Separator d contains three loops of regularly narrowing channels that constrict from 80 µm to 40 µm and back.Separator e (not depicted) contains a straight channel with intercepting pillars (140 µm diameter in a 200 µm channel)that force a change in flow velocity around the obstacles. This version did not lead to successful GUV separation.
Afterwards, the channel splits into eight parts, each leading to a trap array. The hydrodynamic traps (60 per channel,480 total) are 8 µm wide and arranged in groups of 12. The donut pressure valves have an inner diameter of 300 µmand are 150 µm wide. Four different pressure ports separately control 10 groups each. The pillars between the trapsprevent the fluid channel from collapsing. The fluid channel height is 10.8 µm.
52
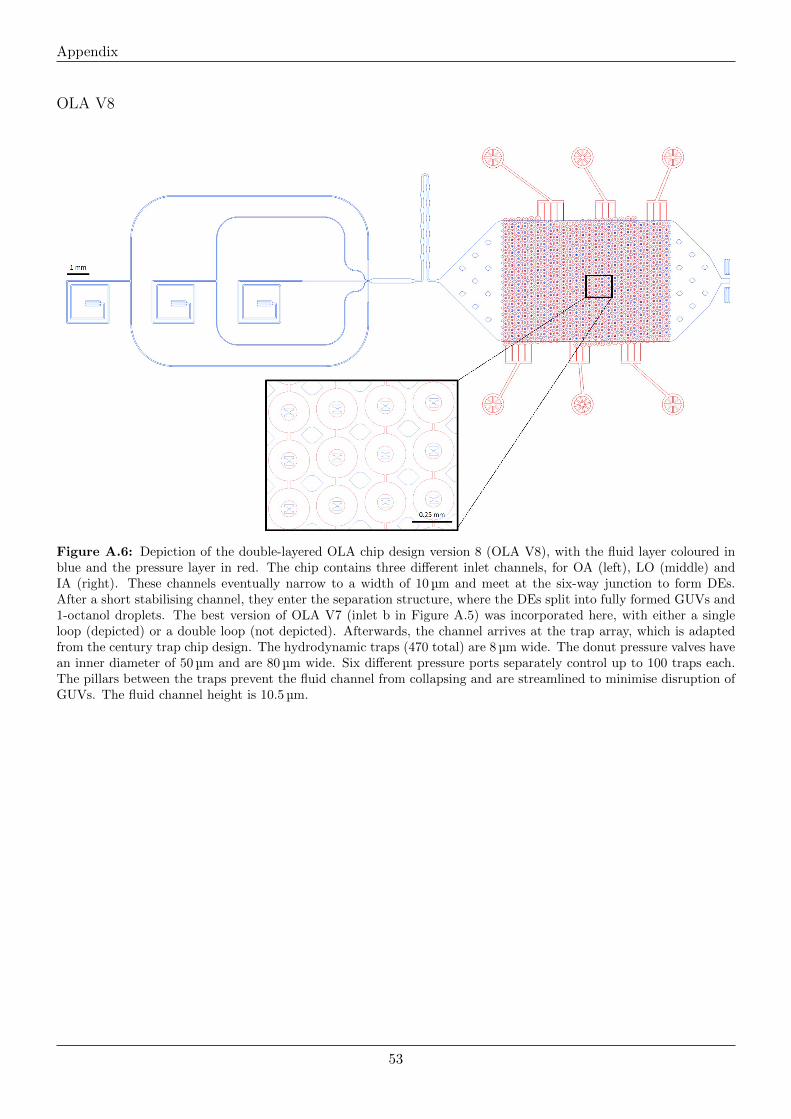
Appendix
OLA V8
Figure A.6: Depiction of the double-layered OLA chip design version 8 (OLA V8), with the fluid layer coloured inblue and the pressure layer in red. The chip contains three different inlet channels, for OA (left), LO (middle) andIA (right). These channels eventually narrow to a width of 10 µm and meet at the six-way junction to form DEs.After a short stabilising channel, they enter the separation structure, where the DEs split into fully formed GUVs and1-octanol droplets. The best version of OLA V7 (inlet b in Figure A.5) was incorporated here, with either a singleloop (depicted) or a double loop (not depicted). Afterwards, the channel arrives at the trap array, which is adaptedfrom the century trap chip design. The hydrodynamic traps (470 total) are 8 µm wide. The donut pressure valves havean inner diameter of 50 µm and are 80 µm wide. Six different pressure ports separately control up to 100 traps each.The pillars between the traps prevent the fluid channel from collapsing and are streamlined to minimise disruption ofGUVs. The fluid channel height is 10.5 µm.
53

Appendix
ImageJ Macro
54
List of Figures
List of Figures
1 Graphical representations showing two commonly used junction types in droplet microfluidics 1
2 Summary of methods to produce GUVs . . . . . . . . . . . . . . . . . . . . . . . . . . . . . . . . 2
3 Graphical representation showing the working principle of on-chip production of liposomes
using OLA . . . . . . . . . . . . . . . . . . . . . . . . . . . . . . . . . . . . . . . . . . . . . . . . . . 3
4 Graphical representation showing an exemplary microfluidic device for OLA . . . . . . . . . . 4
5 Graphical representation showing the proposed chemical assays involving GUVs . . . . . . . . 6
6 Graphical representation showing the microfabrication of a silicon master mold . . . . . . . . 7
7 Graphical representation showing the PDMS replication from a master mold . . . . . . . . . . 8
8 Graphical representation showing a hydrodynamic trap with opened and closed pressure valves 9
9 Graphical representation showing the fabrication of a microfluidic device with two layers . . 9
10 Wide field microscopy images of the coating procedure of the OLA device . . . . . . . . . . . 10
11 Graphical representation showing the off-chip fabrication method, based on the water-in-oil
emulsion transfer method . . . . . . . . . . . . . . . . . . . . . . . . . . . . . . . . . . . . . . . . . 12
12 Graphical representation showing the OLA junction . . . . . . . . . . . . . . . . . . . . . . . . . 13
13 Exemplary demonstration of the ImageJ macro . . . . . . . . . . . . . . . . . . . . . . . . . . . . 16
14 On-chip GUV production using DOPC . . . . . . . . . . . . . . . . . . . . . . . . . . . . . . . . . 20
15 On-chip GUV production using POPC . . . . . . . . . . . . . . . . . . . . . . . . . . . . . . . . . 21
16 On-chip GUV production with cholesterol . . . . . . . . . . . . . . . . . . . . . . . . . . . . . . . 21
17 On-chip GUV production with POPS . . . . . . . . . . . . . . . . . . . . . . . . . . . . . . . . . 22
18 On-chip GUV production in DPBS . . . . . . . . . . . . . . . . . . . . . . . . . . . . . . . . . . . 25
19 Fluorescent microscopy images of on-chip GUVs separating around a stabilising pillar . . . . 27
20 Fluorescent microscopy images of on-chip GUV production with OLAV6 . . . . . . . . . . . . 28
21 Fluorescent microscopy images of the GUV separation process (misting) . . . . . . . . . . . . 30
22 Fluorescent microscopy images of on-chip GUV production with OLA V7 . . . . . . . . . . . . 31
23 Fluorescent microscopy images of on-chip GUV production with OLA V8 . . . . . . . . . . . . 32
24 Plate reader measurement results showing F4 fluorescence . . . . . . . . . . . . . . . . . . . . . 34
25 Fluorescence microscopy images of the squeezing effect of CaCl2 on GUVs . . . . . . . . . . . 35
26 Fluorescence microscopy images of the deformation effect of CaCl2 on GUVs . . . . . . . . . . 35
27 Successful F4 fluorescence increase monitoring using GUVs containing cholesterol . . . . . . . 36
28 Fluorescence microscopy images of agglomerating GUVs inside a pressure valve . . . . . . . . 37
29 Successfully trapped and monitored GUV inside a century trap chip . . . . . . . . . . . . . . . 37
30 Result summary of the off-chip GUV calcium translocation assay . . . . . . . . . . . . . . . . . 38
31 Fluorescence microscopy image of DE production using OLA with F4 in the IA . . . . . . . . 39
32 Fluorescence microscopy images of DE production using OLA with Atto 488-Biotin in the IA 40
33 Graphical representation showing the proposed alternative assay using Annexin V . . . . . . 42
A.1 Depiction of the double-layered century trap chip design . . . . . . . . . . . . . . . . . . . . . . 48
A.2 Depiction of the double-layered triple trap chip design . . . . . . . . . . . . . . . . . . . . . . . 49
A.3 Depiction of the double-layered OLA chip design version 5 (OLA V5) . . . . . . . . . . . . . . 50
A.4 Depiction of the double-layered OLA chip design version 6 (OLA V6) . . . . . . . . . . . . . . 51
A.5 Depiction of the double-layered OLA chip design version 7 (OLA V7) . . . . . . . . . . . . . . 52
A.6 Depiction of the double-layered OLA chip design version 8 (OLA V8) . . . . . . . . . . . . . . 53
55
List of Tables
List of Tables
1 Phase composition summary of initial off-chip GUV production . . . . . . . . . . . . . . . . . . 12
2 Phase composition summary of on-chip GUV production for OLA optimisations . . . . . . . . 13
3 Phase composition summary of off-chip GUV production for calcium translocation assays . . 15
4 Tested surfactant types in on-chip GUV production . . . . . . . . . . . . . . . . . . . . . . . . . 24
5 Tested IA/OA ratios of the surfactant F-68 . . . . . . . . . . . . . . . . . . . . . . . . . . . . . . 24
6 Graphical representations showing key features in all used microfluidic devices . . . . . . . . . 26
56
References
References
(1) Whitesides, G. M. Nature 2006, 442, 368–373.
(2) Dittrich, P. S.; Manz, A. Nature Reviews Drug Discovery Mar. 2006, 5, 210–218, DOI: 10.1038/
nrd1985.
(3) Squires, T. M.; Quake, S. R. Reviews of Modern Physics Oct. 6, 2005, 77, 977–1026, DOI: 10.1103/
RevModPhys.77.977.
(4) Xia, Y.; Whitesides, G. M. Angewandte Chemie International Edition 1998, 37, DOI: https://doi.
org/10.1002/(SICI)1521-3773(19980316)37:5<550::AID-ANIE550>3.0.CO;2-G.
(5) McDonald, J. C.; Duffy, D. C.; Anderson, J. R.; Chiu, D. T.; Wu, H.; Schueller, O. J. A.; Whitesides,
G. M. ELECTROPHORESIS 2000, 21, 27–40, DOI: 10.1002/(SICI)1522-2683(20000101)21:
1<27::AID-ELPS27>3.0.CO;2-C.
(6) M, K. R.; Chakraborty, S. Journal of Applied Polymer Science 2020, 137, 48958, DOI: 10.1002/
app.48958.
(7) Casadevall i Solvas, X.; Niu, X.; Leeper, K.; Cho, S.; Chang, S.-I.; Edel, J. B.; deMello, A. J. Journal
of Visualized Experiments : JoVE Dec. 10, 2011, DOI: 10.3791/3437.
(8) Purcell, E. M. American Journal of Physics Jan. 1, 1977, 45, 3–11, DOI: 10.1119/1.10903.
(9) Shang, L.; Cheng, Y.; Zhao, Y. Chemical Reviews June 28, 2017, 117, 7964–8040, DOI: 10.1021/
acs.chemrev.6b00848.
(10) Ganan-Calvo, A. M.; Gordillo, J. M. Physical Review Letters Dec. 11, 2001, 87, 274501, DOI:
10.1103/PhysRevLett.87.274501.
(11) Liu, Z.-M.; Yang, Y.; Du, Y.; Pang, Y. Chinese Journal of Analytical Chemistry Feb. 1, 2017, 45,
282–296, DOI: 10.1016/S1872-2040(17)60994-0.
(12) Alberts, B.; Bray, D.; Hopkin, K.; Johnson, A. D.; Lewis, J.; Raff, M.; Roberts, K.; Walter, P., Essential
Cell Biology ; Garland Science: Jan. 1, 2015; 863 pp.
(13) Marth, J. D. Nature Cell Biology Sept. 2008, 10, 1015–1015, DOI: 10.1038/ncb0908-1015.
(14) Walde, P.; Cosentino, K.; Engel, H.; Stano, P. ChemBioChem May 3, 2010, 11, 848–865, DOI:
10.1002/cbic.201000010.
(15) Gopfrich, K.; Platzman, I.; Spatz, J. P. Trends in Biotechnology Sept. 1, 2018, 36, 938–951, DOI:
10.1016/j.tibtech.2018.03.008.
(16) Godoy-Gallardo, M.; York-Duran, M. J.; Hosta-Rigau, L. Advanced Healthcare Materials 2018, 7,
1700917, DOI: https://doi.org/10.1002/adhm.201700917.
(17) Shohda, K.; Takahashi, K.; Suyama, A. Biochemistry and Biophysics Reports Sept. 1, 2015, 3, 76–
82, DOI: 10.1016/j.bbrep.2015.07.005.
(18) Montes, L. R.; Alonso, A.; Goni, F. M.; Bagatolli, L. A. Biophysical Journal Nov. 15, 2007, 93,
3548–3554, DOI: 10.1529/biophysj.107.116228.
(19) Tsuji, G.; Sunami, T.; Ichihashi, N. Journal of Bioscience and Bioengineering Oct. 1, 2018, 126,
540–545, DOI: 10.1016/j.jbiosc.2018.04.019.
57
References
(20) Arriaga, L. R.; Datta, S. S.; Kim, S.-H.; Amstad, E.; Kodger, T. E.; Monroy, F.; Weitz, D. A. Small
Mar. 1, 2014, 10, 950–956, DOI: 10.1002/smll.201301904.
(21) Kuribayashi, K.; Tresset, G.; Coquet, P.; Fujita, H.; Takeuchi, S. Measurement Science and Technology
Oct. 2006, 17, 3121–3126, DOI: 10.1088/0957-0233/17/12/S01.
(22) Jahn, A.; Vreeland, W. N.; Gaitan, M.; Locascio, L. E. Journal of the American Chemical Society
Mar. 1, 2004, 126, 2674–2675, DOI: 10.1021/ja0318030.
(23) Swaay, D. v.; deMello, A. Lab on a Chip Feb. 5, 2013, 13, 752–767, DOI: 10.1039/C2LC41121K.
(24) Deshpande, S.; Caspi, Y.; Meijering, A. E. C.; Dekker, C. Nature Communications Jan. 22, 2016,
7, 1–9, DOI: 10.1038/ncomms10447.
(25) Nahas, K. A.; Cama, J.; Schaich, M.; Hammond, K.; Deshpande, S.; Dekker, C.; G. Ryadnov, M.;
F. Keyser, U. Lab on a Chip 2019, 19, 837–844, DOI: 10.1039/C8LC00932E.
(26) Yandrapalli, N.; Petit, J.; Baumchen, O.; Robinson, T. bioRxiv Oct. 23, 2020, 2020.10.23.346932,
DOI: 10.1101/2020.10.23.346932.
(27) Deshpande, S.; Birnie, A.; Dekker, C. Biomicrofluidics, 11, 034106, DOI: 10.1063/1.4983174.
(28) Schaich, M.; Sobota, D.; Sleath, H.; Cama, J.; Keyser, U. F. Biochimica et Biophysica Acta (BBA) -
Biomembranes Sept. 1, 2020, 1862, 183359, DOI: 10.1016/j.bbamem.2020.183359.
(29) Schaich, M.; Cama, J.; Al Nahas, K.; Sobota, D.; Sleath, H.; Jahnke, K.; Deshpande, S.; Dekker,
C.; Keyser, U. F. Molecular Pharmaceutics June 3, 2019, 16, 2494–2501, DOI: 10.1021/acs.
molpharmaceut.9b00086.
(30) Deshpande, S.; Wunnava, S.; Hueting, D.; Dekker, C. Small 2019, 15, 1902898, DOI: https://doi.
org/10.1002/smll.201902898.
(31) Deshpande, S.; Spoelstra, W. K.; van Doorn, M.; Kerssemakers, J.; Dekker, C. ACS Nano Mar. 27,
2018, 12, 2560–2568, DOI: 10.1021/acsnano.7b08411.
(32) Santos, E. C. d.; Belluati, A.; Necula, D.; Scherrer, D.; Meyer, C. E.; Wehr, R. P.; Lortscher, E.;
Palivan, C. G.; Meier, W. Advanced Materials 2020, 32, 2004804, DOI: https://doi.org/10.1002/
adma.202004804.
(33) Petty, H. R. In Molecular Biology of Membranes: Structure and Function, Petty, H. R., Ed.; Springer
US: Boston, MA, 1993, pp 1–5, DOI: 10.1007/978-1-4899-1146-9_1.
(34) Maffeo, C.; Bhattacharya, S.; Yoo, J.; Wells, D.; Aksimentiev, A. Chemical Reviews Dec. 12, 2012,
112, 6250–6284, DOI: 10.1021/cr3002609.
(35) Simons, T. J. B. Neurosurgical Review June 1, 1988, 11, 119–129, DOI: 10.1007/BF01794675.
(36) Gee, K. R.; Brown, K. A.; Chen, W.-N. U.; Bishop-Stewart, J.; Gray, D.; Johnson, I. Cell Calcium
Feb. 1, 2000, 27, 97–106, DOI: 10.1054/ceca.1999.0095.
(37) Morgan, A. J.; Jacob, R Biochemical Journal June 15, 1994, 300, 665–672.
(38) Watanabe, M.; Tomita, T.; Yasuda, T. Biochimica et Biophysica Acta (BBA) - Biomembranes Apr. 23,
1987, 898, 257–265, DOI: 10.1016/0005-2736(87)90065-4.
58
References
(39) Stachowiak, J. C.; Richmond, D. L.; Li, T. H.; Liu, A. P.; Parekh, S. H.; Fletcher, D. A. Proceedings of
the National Academy of Sciences of the United States of America Mar. 25, 2008, 105, 4697–4702,
DOI: 10.1073/pnas.0710875105.
(40) Noireaux, V.; Libchaber, A. Proceedings of the National Academy of Sciences of the United States of
America Dec. 21, 2004, 101, 17669–17674, DOI: 10.1073/pnas.0408236101.
(41) Bhakdi, S.; Weller, U.; Walev, I.; Martin, E.; Jonas, D.; Palmer, M. Medical Microbiology and Im-
munology Sept. 1, 1993, 182, 167–175, DOI: 10.1007/BF00219946.
(42) Chumbimuni-Torres, K. Y.; Coronado, R. E.; Mfuh, A. M.; Castro-Guerrero, C.; Silva, M. F.; Ne-
grete, G. R.; Bizios, R.; Garcia, C. D. RSC advances Sept. 21, 2011, 1, 706–714, DOI: 10.1039/
C1RA00198A.
(43) Tu, Q.; Wang, J.-C.; Zhang, Y.; Liu, R.; Liu, W.; Ren, L.; Shen, S.; Xu, J.; Zhao, L.; Wang, J. Reviews
in Analytical Chemistry Nov. 1, 2012, 31, 177–192, DOI: 10.1515/revac-2012-0016.
(44) Tan, S. H.; Nguyen, N.-T.; Chua, Y. C.; Kang, T. G. Biomicrofluidics Sept. 30, 2010, 4, DOI:
10.1063/1.3466882.
(45) Schrott, W.; Slouka, Z.; Cervenka, P.; Ston, J.; Nebyla, M.; Pribyl, M.; Snita, D. Biomicrofluidics
Oct. 12, 2009, 3, DOI: 10.1063/1.3243913.
(46) Trantidou, T.; Elani, Y.; Parsons, E.; Ces, O. Microsystems & Nanoengineering Apr. 24, 2017, 3,
1–9, DOI: 10.1038/micronano.2016.91.
(47) Kotoucek, J.; Hubatka, F.; Masek, J.; Kulich, P.; Velınska, K.; Bezdekova, J.; Fojtıkova, M.; Bartheldy-
ova, E.; Tomeckova, A.; Straska, J.; Hrebık, D.; Macaulay, S.; Kratochvılova, I.; Raska, M.; Turanek,
J. Scientific Reports Mar. 27, 2020, 10, 5595, DOI: 10.1038/s41598-020-62500-2.
(48) Leventis, P. A.; Grinstein, S. Annual Review of Biophysics 2010, 39, 407–427, DOI: 10.1146/
annurev.biophys.093008.131234.
(49) Jurkiewicz, P.; Cwiklik, L.; Vojtıskova, A.; Jungwirth, P.; Hof, M. Biochimica et Biophysica Acta
(BBA) - Biomembranes Mar. 1, 2012, 1818, 609–616, DOI: 10.1016/j.bbamem.2011.11.033.
(50) Deshpande, S; Dekker, C Nature Protocols Mar. 29, 2018, 13, 856–874, DOI: 10.1038/nprot.2017.
160.
(51) Yan, J.; Bauer, W.-A. C.; Fischlechner, M.; Hollfelder, F.; Kaminski, C. F.; Huck, W. T. S. Micro-
machines Dec. 2013, 4, 402–413, DOI: 10.3390/mi4040402.
(52) Juskova, P.; Schmid, Y. R. F.; Stucki, A.; Schmitt, S.; Held, M.; Dittrich, P. S. ACS applied materials
& interfaces Sept. 25, 2019, 11, 34698–34706, DOI: 10.1021/acsami.9b12169.
(53) Molecular Probes, I. Product Information 2011.
(54) Kyoung, M.; Zhang, Y.; Diao, J.; Chu, S.; Brunger, A. T. Nature Protocols Jan. 2013, 8, 1–16, DOI:
10.1038/nprot.2012.134.
59
April 2018
Declaration on Scientific Integrity (including a Declaration on Plagiarism and Fraud)
Title of Thesis (Please print in capital letters):
_______________________________________________________________________
_______________________________________________________________________
_______________________________________________________________________
First Name, Surname: _________________________________________________(Please print in capital letters)
Matriculation No.: _________________________________________________
With my signature I declare that this submission is my own work and that I have fully acknowledged the assistance received in completing this work and that it contains no material that has not been formally acknowledged.
I have mentioned all source materials used and have cited these in accordance with recognised scientific rules.
In addition to this declaration, I am submitting a separate agreement regarding the publication of or public access to this work.
Yes No
Place, Date: _________________________________________________
Signature: _________________________________________________
Please enclose a completed and signed copy of this declaration in your Bachelor’s or Master’s thesis .