towards an integrated physiological … an integrated physiological theory of microbial growth: from...
TRANSCRIPT

MATHEMATICAL BIOSCIENCES http://www.mbejournal.org/AND ENGINEERINGVolume 2, Number 1, January 2005 pp. 173–210
TOWARDS AN INTEGRATED PHYSIOLOGICAL THEORY OFMICROBIAL GROWTH: FROM SUBCELLULAR VARIABLES TO
POPULATION DYNAMICS
Atul Narang
Department of Chemical Engineering, University of Florida, Gainesville, FL 32611-6005
Sergei S. Pilyugin
Department of Mathematics, University of Florida, Gainesville, FL 32611-8105
(Communicated by Yang Kuang)
Abstract. The dynamics of microbial growth is a problem of fundamentalinterest in microbiology, microbial ecology, and biotechnology. The pioneer-ing work of Jacob Monod, served as a starting point for developing a wealthof mathematical models that address different aspects of microbial growth inbatch and continuous cultures. A number of phenomenological models haveappeared in the literature over the last half century. These models can cap-ture the steady-state behavior of pure and mixed cultures, but fall short ofexplaining most of the complex dynamic phenomena. This is because the on-set of these complex dynamics is invariably driven by one or more intracellularvariables not accounted for by phenomenological models.
In this paper, we provide an overview of the experimental data, and intro-duce a different class of mathematical models that can be used to understandmicrobial growth dynamics. In addition to the standard variables such as thecell and substrate concentrations, these models explicitly include the dynamicsof the physiological variables responsible for adaptation of the cells to envi-ronmental variations. We present these physiological models in the order ofincreasing complexity. Thus, we begin with models of single-species growth inenvironments containing a single growth-limiting substrate, then advance tomodels of single-species growth in mixed-substrate media, and conclude withmodels of multiple-species growth in mixed-substrate environments. Through-out the paper, we discuss both the analytical and simulation techniques toillustrate how these models capture and explain various experimental phe-nomena. Finally, we also present open questions and possible directions forfuture research that would integrate these models into a global physiologicaltheory of microbial growth.
1. Introduction. The growth of microbial species in media containing one or sev-eral growth-limiting substrates is of immense importance in ecology and bioengi-neering. For example, microbes play a vital role in the global carbon cycle. Eachyear, approximately 50 × 109 tons of carbon is fixed into biomass by autotrophicbacteria in the upper 10 m of the ocean. Some 30% of this fixed carbon entersthe grazing food chain that consists of zooplankton and fish. But 50% is rapidly
2000 Mathematics Subject Classification. 92D25, 92D37, 92D45.Key words and phrases. Microbial growth, phenomenological and physiological models, tran-
sient dynamics, chemostat, mixed microbial cultures, peripheral enzymes, ribosomes, RNA.
173

174 A. NARANG AND S. S. PILYUGIN
consumed by the microbial loop within the upper layers, and another 20% sinks 10–1000 m below sea level where it is slowly remineralized by heterotrophic bacteria.This “biological pump” is responsible for reducing the atmospheric CO2 concentra-tion by an estimated 400 ppm [63]. Our ability to understand and combat globalwarming therefore hinges upon detailed knowledge of the mechanisms that medi-ate the carbon flux through bacteria. Microbes play an equally important role inbioengineering. Examples of particular interest include
1. Bioethanol fermentation: The feedstocks used for bioethanol fermentationtypically consist of a mixture of hexoses (primarily glucose) and pentoses(primarily xylose). Bioethanol is the by-product obtained when microbesconsume this mixture of hexoses and pentoses.
2. Bioremediation: Gasoline and chemical spills generally yield a complex mix-ture of water-soluble organic compounds. In gasoline spills, for instance, thefour compounds of concern are benzene, toluenne, ethylbenzene, and xylene.Bioremediation of gasoline spills involves the consumption of this mixture bymicroorganisms.
3. Biopolymer synthesis: Biopolymers, such as polyhydroxybutyrate, are syn-thesized by exposing microbes to nitrogen-limited conditions.
Evidently, a deeper understanding of microbial growth has diverse and profoundimplications.
There is a vast body of work on mathematical models of microbial growth, dom-inated almost entirely by phenomenological models of growth. These models con-sider only the substrate and cell concentrations as state variables, and completelyignore the role of intracellular variables. However, in most instances, the microbialresponse to environmental variations is intimately linked to adaptive changes withinthe cell. Consider, for instance, the growth of a microbial culture limited by a singlesubstrate. When such a culture is suddenly exposed to substrate-excess conditions,the specific growth rate does not increase immediately. Instead, there is a slowadaptive response, because the cells must first synthesize the enzymes required tometabolize the additional substrate available in the environment. Phenomenolog-ical models, such as the Monod model or its many variants, cannot capture thesedynamics, since intracellular enzymes are not a part of the description of the model.Not surprisingly, the phenomenological models predict instantaneous recovery in theface of environmental perturbations, whereas the experiments show long recoverytimes. Another example revealing the inadequacy of phenomenological models isthe growth of a microbial species on a mixture of two substitutable substrates, i.e.substrates that fulfil the same nutrient requirements, such as two carbon sourcesor two nitrogen sources. Given these two alternative sources of the same nutrient,microbes often display anthropomorphic choice. They preferentially consume thenutrient source that supports a higher growth rate. It is only after exhaustion ofthe “preferred” substrate that they begin consuming the “less preferred” substrate.To capture this behavior, the phenomenological models generally assume that the“preferred substrate” somehow inhibits growth on the “less preferred” substrate.But this hypothesis sheds no light on the mechanism by which the inhibition isexerted. It is well known from molecular biology, dating back to the pioneeringstudies of Monod and his coworkers in the early 60’s, that the uptake of the “lesspreferred” substrate is abolished precisely because the enzymes that catalyze theuptake of this substrate cannot be synthesized in the presence of the “preferred”substrate. Models that ignore the dynamics of these transport enzymes may fit the

TOWARDS INTEGRATED PHYSIOLOGICAL THEORY OF MICROBIAL GROWTH 175
P
P
CO
E
M C
E
R
P
+ +
+
s
x
2
m
−
C
XS
(a)
+
+
CO2
CO2
−
S X PE
CR
CXSE
C
(b)
Figure 1. (a) General model of microbial growth on a singlegrowth-limiting carbon source. (b) Special cases of the generalmodel used to study the role of peripheral enzymes (top) and ri-bosomes (bottom). In all the figures, S denotes the carbon andenergy source; E denotes the coordinately controlled peripheralenzymes that catalyze the transport and peripheral catabolismof S; X denotes the internalized form of the substrate that inducesthe synthesis of E; P denotes the pool of precursors produced bycatabolism of X; Ps denotes internally stored compounds; Px de-notes excreted metabolites; Em denotes the biosynthetic enzymesGDH, GOGAT. M is the pool of amino acid monomers; R de-notes the ribosomes (or ribosomal RNA); C− denotes proteins;and C denotes the total biomass of the cells.
data, but they cannot address the central biological question (why is the synthesisof these enzymes inhibited?) without first admitting the transport enzymes as statevariables. There is growing recognition among both biologists and mathematiciansof the need for physiological models. In a recent commentary [2], it was observedthat
“Because microbes influence ecosystems through molecular interactions,for example, involving cell surface receptors, permeases, or enzymes, . . .microbes’ ecosystem activities, whether they involve carbon cycling orpathogenesis toward marine animals, should be modeled as molecularevents.”
We have worked toward this goal for several years. Our modeling efforts havespanned the entire spectrum from dynamics of single-species, single-substrate lim-ited growth to multiple-species, multiple-substrate limited growth. This paper is asummary of our results.
The main obstacle standing in the way of physiological model formulation isidentification of the variables. Even the seemingly simple bacterial cell containsseveral hundred metabolites and enzymes. Which of these variables are importantfor describing the dynamic response of the system? Our main modeling hypothesis

176 A. NARANG AND S. S. PILYUGIN
is that despite the complexity of the metabolic pathways, the dynamics of micro-bial growth and substrate consumption are governed by a few key intracellularvariables, namely, peripheral enzymes, biosynthetic enzymes, ribosomes, and nu-cleotide phosphates. This hypothesis is based on the belief that only a handful ofvariables are relevant on the time scale of interest (hours to days) - the “fast” vari-ables rapidly attain quasi steady-state, and the “very slow” variables do not changeat all. Indeed, in what follows, we frequently reduce the complexity of the modelby appealing to the separation of time scales. But in the final analysis, the mostcompelling argument supporting our hypothesis is the good agreement between themodel simulations and the experimental data.
We begin by considering the simplest case of single-species, single-substrate cul-tures (section 2). We have used this simple setting to identify the variables by aniterative process involving model formulation and comparison with experiments.The variables thus identified form the foundation upon which we have built modelsof mixed-substrate and mixed-culture growth (sections 3 and 4). Our models rep-resent only the beginning of an attempt to create a unified physiological theory. Insection 5, we discuss several outstanding problems that appear to be ripe for attackby rigorous mathematical approaches.
2. Single-species, single-substrate cultures. In the literature, the most popu-lar abstraction of single-substrate growth is the Monod model [32]. It is well known,however, that this model fails to describe the transient response to abrupt changesin the environment [35, 26, 50]. The failure of the model stems from the assump-tion that the substrate uptake and growth rates instantly adjust to variations ofthe substrate concentration. In reality, the substrate uptake and growth rates donot adjust until certain “slow” intracellular variables have adapted to the new en-vironment. Thus, a key question for understanding the dynamics of single-species,single-substrate cultures is
What are the “slow” intracellular variables that prevent the substrate up-take and growth rates from adjusting instantly, and why is their responseso slow?
Based on a careful analysis of the experimental literature, we have identified threeintracellular variables as potential sources of the slow response - the peripheralenzymes, the biosynthetic enzymes, and the ribosomes. Figure 1a, which shows afairly general abstraction of metabolism, illustrates the role of these variables in themost well-studied example - aerobic growth on a single growth-limiting carbon andenergy source S (such as glucose or galactose). The peripheral enzymes (E), whichcatalyze the peripheral catabolism of the substrate, yield the inducer (X), thatinduces (stimulates) the synthesis of the peripheral enzymes.1 Catabolism of X bythe central metabolic pathways yields the pool of metabolites or precursors (P ).The biosynthetic enzymes (Em) catalyze the synthesis of amino acid monomers
1Peripheral catabolism refers to the transport of the substrate into the cell, and its subsequentchemical modifications before entry into the so-called central metabolic pathways, such as gly-colysis or the citric acid cycle. Although it often entails multiple reactions, all the enzymes ofperipheral catabolism are, in general, coordinately controlled, i.e., their synthesis rates are coupledbecause they are transcribed in tandem. Thus, we find it appropriate to “lump” all the peripheralenzymes into a single variable.
TOWARDS INTEGRATED PHYSIOLOGICAL THEORY OF MICROBIAL GROWTH 177
(M) from the precursors, and the ribosomes (R) catalyze the synthesis of proteins(C−) from the monomers. 2
Our goal is to unravel the relative roles of the three “slow” variables E, Em,and R. To achieve this goal, we have proceeded by systematically increasing thecomplexity of the model. Thus far, we have investigated the role of peripheralenzymes [57] and ribosomes [24] by considering the simpler abstractions shown inFigure 1b. These results are summarized below. The future work, which concernsthe role of biosynthetic enzymes and energy, is described in Section 5.1.
2.1. The role of peripheral enzymes. In some instances, the substrate uptakeand growth rates respond slowly because the prevailing peripheral enzyme levelsare so small that almost no substrate is transported into the cell, even though theexogenous substrate concentration is very high. This is dramatically illustrated byexposing steady-state chemostat cultures to a substrate switch. For example, whenthe growth-limiting carbon source of a C. heintzii culture is switched from glucoseto nitrilotriacetic acid (NTA), there is almost no substrate uptake, and hence, nogrowth for 20 hours (see Figs. 2a,b). The inability of the cells to import NTA canbe traced to the virtual absence of NTA-monooxygenase, a peripheral enzyme forNTA (Fig. 2c). This raises the questions
Why is the initial peripheral enzyme so low and why does it take thecells so long to build up the peripheral enzyme level?
In [57], we argued that the answer to both questions is related to the fact thatperipheral enzyme synthesis is inducible – it is stimulated only when the cells areexposed to the corresponding substrate in the environment. The molecular mech-anism underlying this parsimonious behavior is implicit in Figure 1a. When thesubstrate appears in the environment, the peripheral enzymes facilitate the up-take of the substrate. The intracellular form of the substrate, X, then inducesthe synthesis of more peripheral enzyme. It follows that the initial level of NTA-monoxygenase is low because the cells have not been exposed to NTA prior to theswitch from glucose to NTA. Furthermore, it takes a long time to build up theperipheral enzyme level because its synthesis is autocatalytic. This is evident fromthe kinetic scheme – the higher the peripheral enzyme level, the larger the inducerconcentration and the peripheral enzyme synthesis rate. Since the initial peripheralenzyme level is low, so is its synthesis rate, and this state of affairs persists untilthe concentration of the enzyme is built up to sufficiently high levels.
To quantify the foregoing argument, we studied the kinetic scheme shown inFigure 1b (top), which focuses on the inducible nature of peripheral enzyme syn-thesis. The corresponding mass-balance equations for enzyme-limited growth in a
2Although there are many biosynthetic enzymes involved in amino acid synthesis, only one ofthem, namely, glutamate dehydrogenase, provides the large majority (80%) of the amino acids forprotein synthesis. Thus, to a first degree of approximation, it is permissible once again to replacethe multitude of biosynthetic enzymes by a single enzyme, Em.

178 A. NARANG AND S. S. PILYUGIN
0 20 40 60 80 100 120 140t (hr)
0
0.5
1
1.5
2
s (g/
L)
(a)
0 20 40 60 80 100 120 140t (hr)
0
0.2
0.4
0.6
0.8
c (g
/L)
(b)
0 20 40 60 80 100 120 140t (hr)
0
0.2
0.4
0.6
0.8
1e
(c)
Figure 2. Transient response of a C. heintzii culture to a switchin the identity of the growth-limiting substrate from glucose tonitrilotriacetic acid (NTA) (data from [4]). The dashed lines in (a)and (b) show the substrate concentrations and cell densities thatwould be obtained in the absence of any substrate consumptionand growth, i.e., s = D(sf −s) and c = −Dc. The close agreementbetween the dashed curves and the experimental data implies thatthere is no perceptible substrate consumption and growth for thefirst 20 hours. The full lines show the simulations of our model [57].(a) Concentration of NTA. (b) Cell density. (c) Activity of NTA-monooxygenase scaled such that the maximum activity is 1.
chemostat are
s = D(sf − s)− rsc, rs ≡ Vses
Ks + s, (1)
e = r+e − r−e − rge, r+
e ≡ Ve1 + K1x + K2x
2
K3 + K1x + K2x2, r−e ≡ k−e e, (2)
x = rs − rx − rgx, rx = kxx, (3)
c− = Y rx − rgc−, (4)
c = (rg −D)c, (5)
where D and sf denote the dilution rate and the substrate concentration in thefeed. 3 In equations (1–5), it is assumed that
3The variables e, x, and c− represent the mass-fractions of the peripheral enzymes, inducermolecules, and the rest of the cell biomass so that e + x + c− = 1. For instance, the totalconcentration of peripheral enzymes in the chemostat is given by ec, et cetera. Hence, the specificgrowth rate rg in (2–4) corresponds to the rate at which these mass-fractions are “diluted” due tocell growth. The dilution rate D does not appear in (2–4) because the washout of entire cells hasno effect on the internal cell composition.

TOWARDS INTEGRATED PHYSIOLOGICAL THEORY OF MICROBIAL GROWTH 179
(a) The specific substrate uptake rate, rs, is jointly proportional to the peripheralenzyme level and the extent to which it is saturated with the substrate;(b) The specific peripheral enzyme synthesis rate, r+
e , is a saturable function of theinducer concentration,4 and the specific enzyme degradation rate, r−e , is propor-tional to the enzyme level;(c) The cell biomass growth rate is proportional to the catabolic rate, rx, with aconstant of proportionality, Y , which corresponds to the yield of biomass on thesubstrate;(d) The specific catabolic rate, kx >> rg is so rapid that the inducer rapidly attainsa quasi-steady state. At such quasi-steady state, x = rs
kx+rg≈ rs
kx, or equivalently,
rs ≈ rx.
The quasi-steady state assumption allows to reduce equations (1–5) as follows.Since e + x + c− = 1, we have
0 = e + x + c− = Y rx − rx + rs − rg,
hence the specific growth rate rg can be expressed as rg = Y rx − rx + rs ≈ Y rs =Y Vse
sKs+s . The reduced model then takes the following form
s = D(sf − s)− Vses
Ks + sc, (6)
e = r+e − k−e e− rge, r+
e ≡ Ve1 + K1x + K2x
2
K3 + K1x + K2x2, (7)
x =Vse s
kx(Ks + s), (8)
c =(Y Vse
s
Ks + s−D
)c. (9)
As shown in Figure 2, simulations of the model are in quantitative agreement withthe experimental data. At the heart of this agreement is the fact that peripheralenzyme synthesis is autocatalytic. An intuitive argument supporting this claim wasgiven above. It is manifested much more clearly in the model. Indeed, substituting(8) in the expression for r+
e yields
r+e = Ve
1 + K ′1e + K ′
2e2
K3 + K ′1e + K ′
2e2, K ′
1 ≡ K1
(Vs
kx
s
Ks + s
), K ′
2 ≡ K2
(Vs
kx
s
Ks + s
)2
,
which shows that the peripheral enzyme synthesis rate is indeed an increasing func-tion of the enzyme level. In the next section, we show that the autocatalytic kineticsof peripheral enzyme synthesis also plays a crucial role in mixed-substrate cultures.
We presented a detailed bifurcation and stability analysis of the model (6–9)in [57]. It is worth mentioning here that the dynamics of (6–9) is essentially two-dimensional due to a conservation law resulting from the constancy of the yieldcoefficient. Indeed, letting z = Y s+c, it is easily seen that z = D(Y sf −z). Hence,
4These kinetics are based on the molecular mechanism of induction in the lac operon. Thecoefficients K1 and K2 denote the equilibrium constants for binding of one and two inducermolecules to the repressor, and K3 denotes the equilibrium constant for binding of the repressorto the operator. Note that the enzyme is synthesized at a small rate even in the absence of the
inducer ( r+e
∣∣∣x=0
= Ve/K3 > 0). This rate corresponds to the constitutive enzyme synthesis.
180 A. NARANG AND S. S. PILYUGIN
s
gr (= D)
f
f
fhigh s
low s
intermediate s
(a)
f
Hopf
D D D D1 2 3h
E E E1 2 3s
r (= D)g
s
(b)
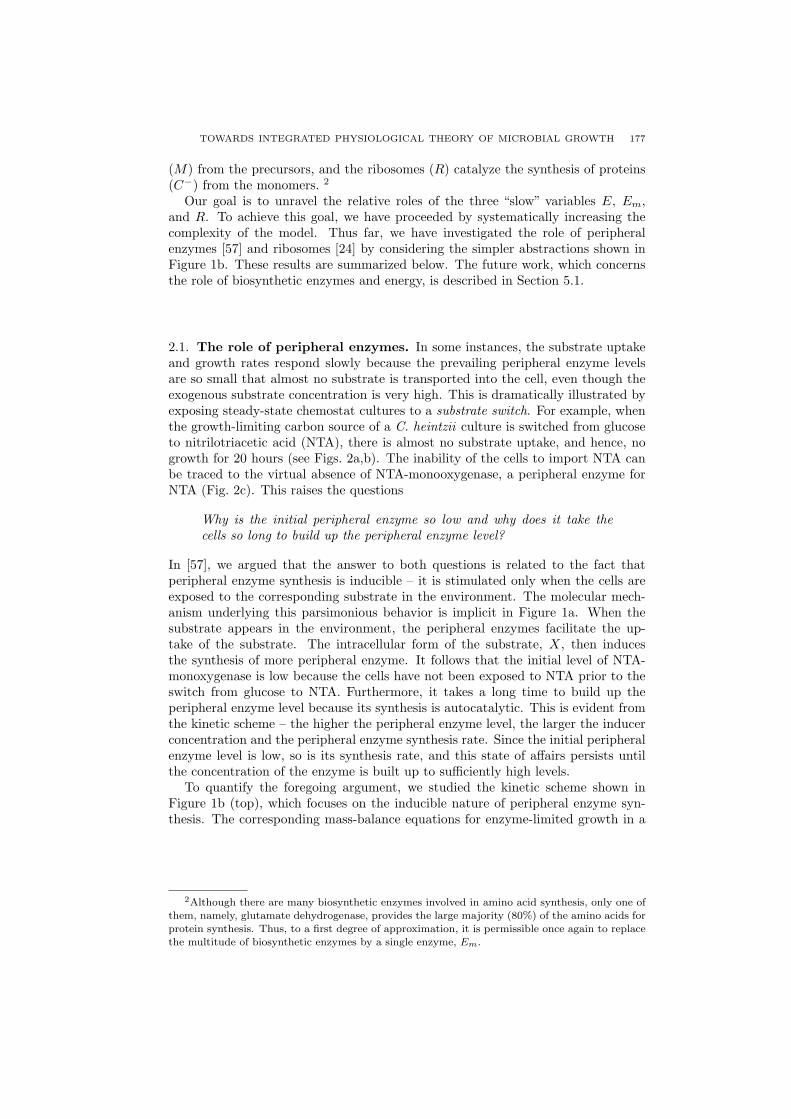
Figure 3. (a) Variation of the steady state substrate concen-tration with respect to the dilution rate (equivalently, the growthrate). The solid line corresponds to the model (6–9). For compar-ison, the dashed line shows the same graph for the Monod model.The variation of the washout equilibria with respect to sf can betraced graphically by moving the line s = sf up or down. Forinstance, for high or low values of sf , the washout equilibriumis unique. For intermediate values of sf , the model admits threewashout equilibria. (b) The bifurcation diagram of (6–9) for in-termediate values of sf corresponds to the part of (a) that liesbelow s = sf . The washout occurs at both high (D = D3) andlow (D = D2) values of the dilution rate. The Hopf bifurcation atD = Dh indicates the onset of sustained oscillations. We shouldpoint out that the middle washout steady-state E2 is always un-stable, while the stability of E1 and E3 changes with D. We pointout that this bifurcation diagram can be equivalently replotted interms of c = Y (sf − s).
(6–9) can be further reduced to the limiting system
s = (sf − s)(D − rg), rg ≡ Y Vses
Ks + s(10)
e = r+e − (k−e + rg)e, r+
e ≡ Ve1 + K1x + K2x
2
K3 + K1x + K2x2, x ≡ rg
Y kx. (11)
Note that the line s = sf is an invariant set of (10–11) that corresponds to themicrobial washout (c = 0). At the persistence steady state, we have s < sf andrg = D. Substituting e = 0 into (11), we can express the steady-state values e =e(D) and s = s(D) as functions of the dilution rate D. Figure 3a shows the graph ofs = s(D) for the biologically reasonable range of parameters (for details, see [57]).The part of the graph that lies above the line s = sf corresponds to the microbialwashout and each intersection s(D) = sf corresponds to a transcritical bifurcationof a washout equilibrium. For intermediate values of the feed concentration sf ,there are three intersections and thus three distinct washout equilibria E1, E2, E3
as shown in Figure 3b. One particularly important property of the model (6–9) isthe existence of a minimal growth rate (shown as D2 in Fig. 3b). Specifically, forintermediate values of sf , the washout occurs at both high and low dilution rates.Interestingly, this feature is commonly observed in the experimental literature.

TOWARDS INTEGRATED PHYSIOLOGICAL THEORY OF MICROBIAL GROWTH 181
If we treat the dilution rate D as a bifurcation parameter, then Figure 3b canbe interpreted as the bifurcation diagram of (10–11). Transcritical bifurcationscorresponding to the washout occur at three values D = Di, i = 1, 2, 3. Thepersistence steady state exists for D ∈ (0, D1)
⋃(D2, D3). The stability of the
persistence steady state is determined by the variational matrix J with
trJ =∂r+
e
∂e− 2D − k−e − (sf − s)
∂rg
∂s, det J = (sf − s)
∂rg
∂s(D + k−e ).
In [57], we demonstrated that trJ is positive at D = D2 and negative at D = D3,whereas detJ remains positive for all D2 < D < D3. Due to continuity, trJchanges sign at some intermediate value Dh ∈ (D2, D3) corresponding to a Hopfbifurcation. The persistence steady-state is stable for D > Dh and unstable forD < Dh. We also showed that a Hopf bifurcation may occur even if E2 does notexist (for details, see [57]) hence, the existence of E2 is sufficient but not necessaryfor a Hopf bifurcation.
2.2. The role of ribosomes. The peripheral enzymes, which form the basis of themodel discussed above, are not the sole source of the slow physiological response tosubstrate-excess conditions. This is evident from experiments in which a chemostatis subjected to dilution rate shift-ups. Figure 4 (upper panel) shows that whena glucose-limited culture of E. coli is subjected to a dilution rate shift-up fromD0 = 0.2 1/hr to D = 0.6 1/hr, the substrate concentration attains supersaturatinglevels within 30 minutes (Fig. 4a), but the specific growth rate does not attainits final value of 0.6 1/hr until 5 hours have elapsed (Fig. 4c). This is similarto the transient shown in Figure 2. However, the slow response here is due toa limitation in the RNA/protein synthesis rate rather than the substrate uptakerate. This is forcefully revealed by the initial response to continuous-to-batch shifts.In these experiments, cells maintained at steady state in a chemostat are abruptlyexposed to excess substrate concentrations, and the initial rates of various processesare measured within 10–15 minutes of the exposure. The experiments show thatthe specific substrate uptake rate rapidly increases to the maximal levels obtainednear the washout dilution rate (Fig. 5a). However, the specific rate of RNA andprotein synthesis increases only partially if the culture has been growing at lowdilution rates, and does not increase at all if the culture has been growing at highdilution rates (Fig. 5b). It follows that when cells growing at steady state in achemostat are exposed to substrate-excess conditions, the substrate enters the cellat near-maximal rates, but the catabolic products derived from it are, at best,only partially channeled into RNA and protein synthesis. The excess substrate,which accumulates within the cell in the form of precursors, is instantly eliminatedby rapidly increasing the rates of respiration (Fig. 5c), excretion (Fig. 5d), andstorage [28, 59].
The initial response of continuous-to-batch shifts reveals the identity of the pro-cesses that prevent the growth rate from increasing instantly, but sheds no light onthe reason for their slow response. We gain some insight into the mechanism of theslow response by examining the entire response of glutamate dehydrogenase (GDH)and ribosome levels in continuous-to-batch shifts (Figs. 5e,f). These transients sug-gest that synthesis of GDH and ribosomes is autocatalytic. Their synthesis ratesare small initially, accelerate subsequently, and subside finally after passing throughan inflection point. It is conceivable that these autocatalytic kinetics occur becauseof the positive feedback loop shown in Figure 1a. An increase in the activity of

182 A. NARANG AND S. S. PILYUGIN
0 5 10 15 20t (hrs)
0
0.5
1
1.5
2
s (g/
L), c
(gdw
/L)
sc
(a)
0 5 10 15 20t (hrs)
0.2
0.25
0.3
0.35
0.4
r (g/
gdw
)
(b)
0 5 10 15 20t (hr)
0
0.5
1
1.5
2
r s (g
/gdw
-hr)
rs
0
0.2
0.4
0.6
0.8
1
r g (g
/gdw
-hr)
rg
(c)
0 2.5 5 7.5 10 12.5 15 17.5 20t (hr)0
0.25
0.5
0.75
1
1.25
1.5
1.75
s, c (g/L)
(d)
0 2.5 5 7.5 10 12.5 15 17.5 20t (hr)
0
0.05
0.1
0.15
0.2
0.25
r (g/gdw)
(e)
0 2.5 5 7.5 10 12.5 15 17.5 20t (hr)0
0.5
1
1.5
2
2.5
r (g/gdw-hr) s
(f)
Figure 4. Transient response to dilution rate shifts . The upperpanel shows the response of a glucose-limited culture of E. coli K12to a shift-up from D0 = 0.2 1/hr to D = 0.6 1/hr (from [65]). Thelower panel shows a simulation of the response to a shift-up fromD0 = 0.2 1/hr to D = 0.8 1/hr (from [24]). The figures showthe evolution of (a,d) the cell density and substrate concentration,(b,e) the RNA level, and (c,f) the specific growth and substrateuptake rates.
GDH results in elevated amino acid levels. Amino acids stimulate the synthesis ofribosomal RNA and ribosomes [8, 33, 67], which, in turn, stimulates the synthesisof even more GDH.
To capture these dynamics, we assumed as a starting point that the biosyn-thetic enzyme, Em, is in excess so that protein synthesis is limited by ribosomes,and synthesis of ribosomes is autocatalytic [Figure 1b (bottom)]. This led to the

TOWARDS INTEGRATED PHYSIOLOGICAL THEORY OF MICROBIAL GROWTH 183
s
0
0.5
1
1.5
2
2.5
0 0.1 0.2 0.3 0.4 0.5 0.6 0.7 0.8 0.9
r (g
/gdw
−hr)
D (/hr)
(a) Substrate uptake (from [51])
init
g
0
0.1
0.2
0.3
0.4
0.5
0.6
0 0.1 0.2 0.3 0.4 0.5 0.6
r (
gdw
/g−
hr)
D (/hr)
(b) RNA/protein synthesis (from [28])
0 0.1 0.2 0.3 0.4 0.5 0.6 0.7 0.8 0.9D (/hr)
0
5
10
15
Qo 2
(mm
ol/g
-hr)
(c) Respiration (from [49])
0
0.1
0.2
0.3
0 0.1 0.2 0.3 0.4 0.5 0.6 0.7 0.8
Ace
tic
acid
(g/g
dw
−hr)
D (/hr)
(d) Acetate excretion (from [12, 51])
3
4
5
6
0 60 120 180
GD
H a
ctiv
ity (
10*u
nits
/gdw
)
Time (min)
(e) Evolution of GDH (from [28])
− 0.10 /hr+ − 0.15 /hr
− 0.2 /hr
0.07
0.09
0.11
0.13
0.15
0 1 2 3 4 5 6
RN
A (
g/g
dw
)
t (hr)
0.05
(f) Evolution of RNA (from [43])
Figure 5. (a,b,c,d) Initial response of glucose-limited steady-state continuous cultures to saturating concentrations of glucose.The dashed line shows the rate of a process when the culture is insteady state at a particular dilution rate. The full line shows therate of the same process immediately after the steady-state culturehas been exposed to saturating concentrations of glucose. The datain (b) was obtained with glycogenless mutants of E. coli B at 30℃.All other data was obtained with wild-type K. aerogenes at 37℃.(e,f) The dynamic response of GDH and RNA in glucose-limitedcultures subjected to continuous-to-batch shifts: The evolution ofboth GDH activity and RNA levels has a sigmoidal profile. Thethree curves in (f) correspond to three different dilution rates.
equations [24]
s = D(sf − s)− rsc, rs ≡ Vses
Ks + s, (12)
c = (rg −D)c, rg ≡ rs − rco2 , rco2 ≡ kco2p, (13)˙c− = r+
c − r−c − rgc−, r+
c ≡ Vcrp
Kc + p, r−c ≡ k−c c−, (14)
e = r+e − r−e − rge, r+
e ≡ Ver
Ke + r
1 + K1x + K2x2
K3 + K1x + K2x2, r−e ≡ k−e e, (15)
r = r+r − r−r − rgr, r+
r ≡ k+r rp , r−r ≡ k−r r, (16)
x = rs − rx − rgx, rx ≡ kxx, (17)
p = rx − rco2 − (r+c − r−c )− (r+
e − r−e )− (r+r − r−r )− rgp, (18)

184 A. NARANG AND S. S. PILYUGIN
where we assumed that(a) The expression for r+
e reflects the fact that the specific enzyme synthesis ratedepends not only on the concentration of the inducer (which stimulates the tran-scription of the gene into the mRNA corresponding to the enzyme), but also on theconcentration of ribosomes (which translate the mRNA produced by transcriptioninto the string of amino acids corresponding to the enzyme);(b) The specific protein synthesis rate, r+
c , is jointly proportional to the catalyst(ribosome) level and the availability of “raw materials” (p) required for synthesizingprotein;(c) The specific RNA synthesis rate, r+
r , is proportional to p and r, where thedependence on r reflects our assumption that RNA synthesis is autocatalytic;(d) Degradation of proteins and RNA is a first-order process.
In Appendix A, we reduce equations (12–18) assuming that both inducer andprecursor rapidly achieve a quasi-steady state and that the the cell biomass consistsalmost entirely of ribosomes and proteins (e, x, p ¿ 1 and r+c− ≈ 1). The reducedsystem is
s = D(sf − s)− rsc, (19)
e = r+e − r−e − rge, (20)
r = r+r − r−r − rgr, (21)
c = (rg −D) c, (22)0 ≈ rs − rx, (23)
rg ≈ rx − rco2 , (24)
rg ≈ (r+r − r−r ) + (r+
c − r−c ). (25)
Equation (25) shows that the specific growth rate of the cells effectively equals thenet rate of synthesis of the major macromolecules in the cell, namely, RNA andproteins.
In [24], we have demonstrated that simulations of the model (19–25) capturethe dynamics observed in response to a wide variety of perturbations includingcontinuous-to-batch shifts, dilution rate shifts, and substrate switches (see, for in-stance, Fig. 4). Here, it will suffice to explain the slow response to dilution rateshift-ups in terms of the model. In dilution rate shift-up, the cells are alreadygrowing on the growth-limiting substrate in question, so that the peripheral en-zyme level is relatively high. Consequently, immediately after the shift-up, thespecific substrate uptake rate jumps to maximal levels, resulting in the accumula-tion of precursors. This saturates the protein synthesis rate (r+
c ≈ Vcr), so thatthe protein synthesis cannot increase until the ribosomes are built up to sufficientlyhigh levels. Since synthesis of ribosomes is autocatalytic, it takes a few hours for theRNA and protein synthesis rates (and, hence, the specific growth rate) to increaseto the higher level consistent with the new dilution rate.
At first glance, it may seem that the large number of variables in (19–25) pre-cludes the possibility of useful mathematical analysis. Upon closer inspection,however, it becomes clear that further reduction of the equations is feasible, andthat this simplification yields deeper insights into the transients. This reduction isobtained by observing that the saturation constant (Ks) is quite small (∼0.001–0.01 g/L), but the substrate supply rate (Dsf ) and the substrate consumption rate(rsc) are both on the order of 0.1–1 g/L-hr. Hence, the substrate concentrationswitches from saturating levels (s À Ks) to subsaturating levels (s ¿ Ks) on a

TOWARDS INTEGRATED PHYSIOLOGICAL THEORY OF MICROBIAL GROWTH 185
0.0002 0.0004 0.0006 0.0008e (g/gdw)
0.05
0.1
0.15
0.2
0.25
0.3
0.35
r (g/gdw)
(a)
0.5 1 1.5 2 2.5 3c (gdw/L)
0.05
0.1
0.15
0.2
r (g/gdw)
(b)
Figure 6. The orbits of the slow motions corresponding to a sub-strate switch at D = 0.2 1/hr [24]. (a) The slow motion towardsbalanced growth during substrate-excess conditions (s À Ks). Theline with short dashes shows the nullcline for e; the line with longdashes shows the nullcline for r; the intersection of the two null-clines represents the concentration of e and r at balanced growth;the full line shows the approach of e and r toward the state ofbalanced growth. (b) The slow motion during substrate-deficientconditions (s ¿ Ks). The line with short dashes shows the null-cline for c; the line with long dashes shows the nullcline for r; theintersection of the two nullclines represents the steady-state con-centrations of c and r at D = 0.2 1/hr; and the full line shows themotion of c and r from balanced growth toward the final steadystate.
fast time scale of seconds to minutes. Since the transients typically occur on a timescale of hours, we may say that during a transient, the substrate is either satu-rating or subsaturating, and the nearly discontinuous transition between these twoconditions can be neglected without much loss of accuracy. This is vividly revealedby the data in Figure 2. The substrate concentration almost instantly increases tosupersaturating levels, then remains so for the next 70 hrs, at which point it almostinstantly switches to subsaturating levels. Thus, a transient can be decomposedinto separate time intervals during which the substrate concentration is either sat-urating or subsaturating. As we show below, the motion during these two limitingconditions can be studied by examining a reduced system of equations.
If the substrate concentration is saturating (s À Ks), the interior of the cells“sees”a constant environment even if the substrate concentration is changing. Giventhis quasi-constant environment, the physiological variables move toward a sta-tionary state. Now, the “fast” physiological variables, x and p, are always in aquasi-steady state. The dynamics under substrate-excess conditions is thereforedetermined by the “slow” motion of e and r toward their stationary state. Thisslow motion can be analyzed by studying the two-dimensional system of equationsobtained by solving (23–24) for x and p under the constraint s/(Ks + s) ≈ 1, andsubstituting these quasi-steady concentrations in (20–21). We refer to this motionas substrate-excess batch dynamics, since this is precisely the motion exhibited by

186 A. NARANG AND S. S. PILYUGIN
an inoculum introduced into a batch reactor containing a high substrate concen-tration. In the face of the quasi steady environment corresponding to the highsubstrate concentration, the physiological variables of the inoculum move towarda steady state. The attainment of this physiological steady state marks the begin-ning of exponential or balanced growth. Figure 6a shows that during the approachto balanced growth, the orbit intersects the nullcline for E before intersecting thenullcline for R. It follows that e reaches a maximum before r.
If the substrate concentration is subsaturating (s ¿ Ks), the substrate concen-tration is so small that all the substrate entering the reactor is consumed as soonas it enters the reactor. Hence,
0 = D(sf − s)− rsc ⇒ rs ≈ Dsf
c,
i.e., the specific substrate uptake rate is independent of the enzyme level. Now, pfeels the effect of the peripheral enzyme level through the specific substrate uptakerate [see equations (23–24)]. Since rs is independent of the enzyme level, so is thequasi-steady state precursor level, p. It follows that the dynamics are governed bythe motion of the “slow” variables, r and c, while x and s are in quasi-steady state.Figure 6b shows the slow motion from balanced growth to the ultimate steady state.The orbit intersects the nullcline for C before intersecting the nullcline for R. Itfollows that c reaches a maximum before r reaches a minimum.
3. Single-species, multiple-substrate cultures. In this section, we considerthe growth of a microbial species on mixtures of substrates. The simplest caseof this formidable problem is the growth on a mixture of two growth-limiting sub-strates. But even binary mixtures display 4 distinct types of behavior depending onthe nutrient requirements satisfied by the two substrates [6]. The two most commoncases found in the modeling literature are the pairs of substitutable and comple-mentary substrates.5 Our extensive studies of growth on binary mixtures havebeen primarily concerned with mixtures of two substitutable substrates. Althoughwe have drawn examples from the literature on mixtures of substitutable carbonsources, the phenomena described below have been observed in binary mixtures ofnitrogen, phosphorus, and sulfur sources (see [21] for a comprehensive review). Thetheory described below therefore applies to a broad class of experiments.
To study growth on binary mixtures of substitutable substrates, we extended themodel shown in Figure 1b (top) by introducing two substitutable substrates, S1 andS2, together with their corresponding peripheral enzymes, E1 and E2 (Fig. 7). Thisresults in the equations [47, 45]
sj = D(sfj − sj)− rs,jc, rs,j ≡ Vs,jej
sj
Ks,j + sj, j = 1, 2, (26)
ej = r+e,j − r−e,j − rgej , r+
e,j ≡ Ve,j
1 + K1,jxj + K2,jx2j
K3,j + K1,jxj + K2,jx2j
, r−e,j ≡ k−e,jej ,(27)
c = (rg −D)c, rg ≡∑
k
Ykrs,k =∑
k
YkVs,keksk
Ks,k + sk, (28)
5The substrates in a binary mixture are said to be complementary (or essential) if these sub-strates satisfy entirely distinct nutrient requirements.

TOWARDS INTEGRATED PHYSIOLOGICAL THEORY OF MICROBIAL GROWTH 187
S
S
E
X
X
E
2
1
2
C
C
2
1
1
−
Figure 7. Kinetic scheme for mixed-substrate growth. Here, Ej
denotes the transport enzyme catalyzing the uptake of substrateSj , Xj denotes the inducer for Ej , and C− denotes all intracellularcomponents other than Ej and Xj .
where we assume that xj ≈ rs,j/kx,j , that is, the inducers rapidly attain their quasi-steady state values. We show below that this simple model successfully capturesmost of the observed growth patterns in both batch and continuous cultures.
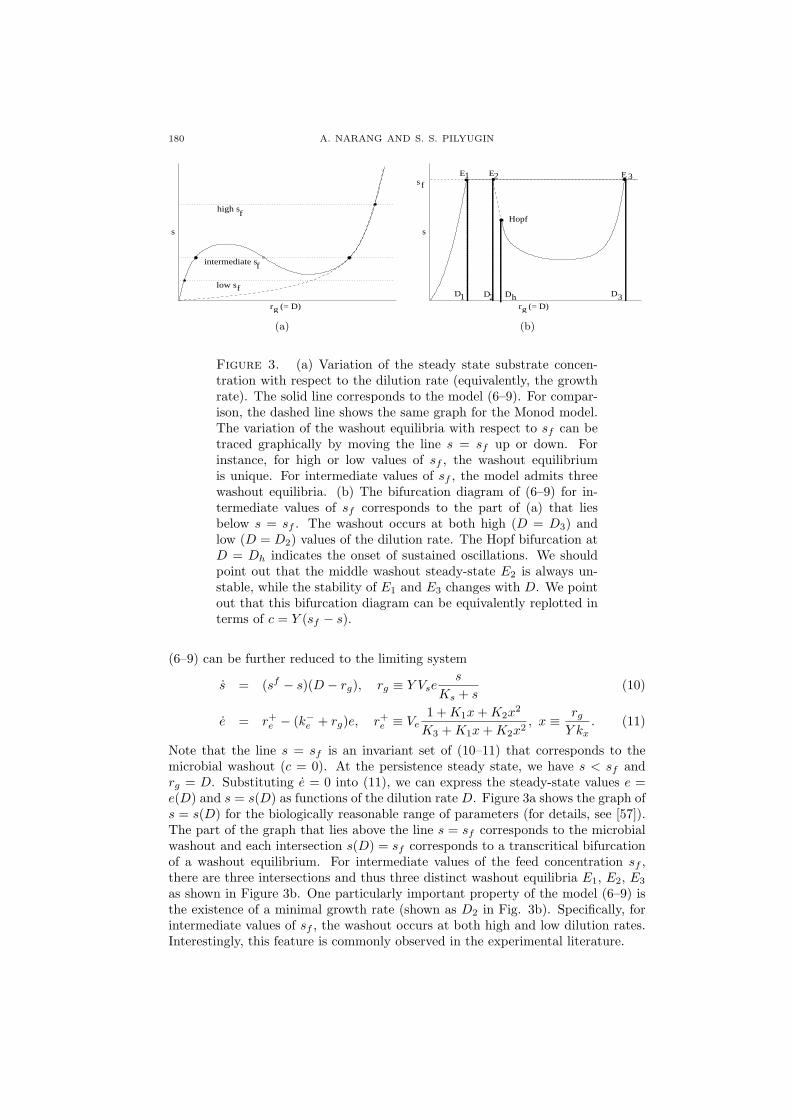
3.1. Dynamics of batch cultures. When microbes are grown in a batch reac-tor containing a surplus of two substitutable substrates, one of the substrates istypically exhausted before the other, leading to the appearance of two successiveexponential growth phases. During the first exponential growth phase, when bothsubstrates are present in the medium, the cells consume either one or both thesubstrates. For instance, when E. coli K12 is grown on a mixture of fumarate andglucose, only glucose is consumed during the first phase (Figure 8a). This is calledthe diauxie or the preferential substrate utilization pattern, and the substrates con-sumed during the first and second phases are referred to as the “preferred” and“less preferred” substrates, respectively.6 However, when E. coli K12 is grown on amixture of fumarate and pyruvate, both substrates are consumed during the firstphase (Fig. 8b). This is called the simultaneous substrate utilization pattern.
Studies in molecular biology have shown that the existence of different substrateutilization patterns is a manifestation of the dynamics of the peripheral enzymes forthe growth-limiting substrates [7]. It is known, for instance, that the preferentialsubstrate utilization pattern occurs because synthesis of the peripheral enzymesfor the “less preferred” substrate is abolished in the presence of the “preferred”substrate. This inhibition is partly mediated by specific molecular mechanismssuch as cAMP activation and inducer exclusion [48]. However, two lines of evidencesuggest that the specific growth rates supported by the growth-limiting substratesplay a crucial role. Egli notes that, in general [21],
1. The preferential substrate utilization pattern is observed whenever one of thetwo substrates supports a high specific growth rate. Moreover, this “rich” sub-strate is invariably the “preferred” substrate. However, if the initial concen-tration of the “preferred” substrate is decreased sufficiently, thus diminishingits ability to support growth, the two substrates are utilized simultaneously.
6Since glucose is consumed before fumarate, one observes two exponential growth phases sep-arated by a stationary phase lasting a few hours. This led Monod to name the phenomenon thediauxie or “double growth.”
188 A. NARANG AND S. S. PILYUGIN
1 2 3 4 5 6t (hr)
0.2
0.4
0.6
0.8
1
1.2
c, GLU, FUM (g/L)
FUM
GLU
c
(a)
2 4 6 8t (hr)
0.5
1
1.5
2
c, FUM, PYR (g/L)
PYR
FUM
c
(b)
0 1 2 3 4 5 6 7t (hr)
0.02
0.05
0.1
0.2
0.5
1
c (g
dw/L
)
GLU
PYR
PYR
(c)
0.2 0.4 0.6 0.8 1.
0.1
0.2
0.3
0.4
e (mg/gdw)
2
e (mg/gdw) 1
(d)
0.2 0.4 0.6 0.8 1.
0.5
1.
1.5
2.
2.5
e (mg/gdw)
2
e (mg/gdw) 1
(e)
0.2 0.4 0.6 0.8 1. 1.2
0.2
0.4
0.6
0.8
1.
1.2
1.4
e (mg/gdw)
2
e (mg/gdw) 1
(f)
Figure 8. Substrate utilization patterns during batch growth onmixtures of two carbon sources. The upper panel shows the exper-imental data for growth of E. coli K12 (from [44]). (a) Sequentialutilization of glucose and fumarate. (b) Simultaneous utilization offumarate and pyruvate. (c) Initial condition dependent substrateutilization. The plots (e–f) show the global dynamics of the periph-eral enzymes corresponding to these substrate utilization patterns(from [47]).
2. The simultaneous substrate utilization pattern is observed if both substrates,by themselves, support low to medium growth rates.
The model (26–28) accounts for enzyme induction and the effect of the specificgrowth rates (exerted through the enzyme dilution term). It ignores molecularmechanisms such as catabolite repression and inducer exclusion. However, we have
TOWARDS INTEGRATED PHYSIOLOGICAL THEORY OF MICROBIAL GROWTH 189
shown that although inclusion of these molecular mechanisms changes the quanti-tative behavior of the model, the qualitative properties remain unchanged [45, 47].
The preferential and simultaneous substrate utilization patterns are not simplydetermined by the nature of the two substrates in the substrate-excess batch en-vironment. For instance, the actual substrate utilization pattern can depend onthe history of the inoculum used in the experiment [11]. Figure 8c shows that ifE. coli K12 is pregrown on glucose before exposure to a mixture of glucose andpyruvate, only glucose is consumed initially, and the specific growth rate is thesame as that observed during growth on glucose alone (0.74/hr). However, if theinoculum is grown on pyruvate before exposure to a mixture of glucose and pyru-vate, both substrates are consumed, and the observed specific growth rate (0.53/hr)lies between the specific growth rates on glucose (0.74/hr) and pyruvate (0.30/hr).
The foregoing substrate utilization patterns are successfully captured by themodel [45, 47]. We show below that analysis of the model yields simple explanationsof these seemingly complex dynamics. To this end, we note that the entire transientof batch growth is obtained by integrating differential equations (26–28) with D =0. But the evolution of the peripheral enzyme levels during the first exponentialgrowth phase can be described by only two equations. To see this, it suffices toobserve that during the first exponential growth phase, the concentrations of bothsubstrates are at supersaturating levels, that is, sj À Ks,j and sj/(Ks,j + sj) ≈ 1.Under these conditions, the specific growth rate and inducer concentration(s) areapproximated by the relations, rg ≡
∑k Ykrs,k ≈
∑k YkVs,kek, xj = rs,j/kx,j ≈
Vs,jej/kx,j . Moreover, constitutive enzyme synthesis is typically negligibly small(1 ¿ K1,jxj , K2,jx
2j ), and the degradation rates of the peripheral enzymes are also
negligible compared to their dilution due to biomass growth k−e,j ¿ rg. Hence,equations (27) are closely approximated by equations
ej = Ve,jK1,jej+K2,je2
j
K3,j+K1,jej+K2,je2j− (
∑k YkVs,kek) ej ,
K1,j ≡ K1,j
(Vs,j
kx,j
), K2,j ≡ K2,j
(Vs,j
kx,j
)2
.(29)
These equations, which describe the evolution of the peripheral enzyme levels dur-ing the first exponential growth phase, clearly illustrate the competition betweenenzymes specific to different substrates. In fact, there exists a direct analogy be-tween the dynamics exhibited by (29) and the dynamics of the Lotka-Volterra modelfor competing species [42],
Nj = ajNj −(∑
k
bjkNk
)Nj , j = 1, 2, (30)
where ajNj denotes the unrestricted specific growth rate of the jth species, andbjk are parameters that characterize the intensity of intraspecific and interspecificcompetition. The only difference between (29) and (30) is the nonlinear dependenceof the specific enzyme synthesis rate r+
e,j on ej . Since both systems (29) and (30) aretwo-dimensional and strongly competitive, all of their solutions converge to someequilibria. In addition, the presence of positive inter- and intraspecific competitionterms ensures that all nonnegative solutions are bounded so that both systems(29) and (30) are dissipative. Therefore, the global phase portrait in each case is
190 A. NARANG AND S. S. PILYUGIN
determined exclusively by the relative location and stability of equilibria.7 In thesimpler Lotka-Volterra case, at most one interior equilibrium can exist, and it iswell known that
1. If aj and bjk are such that a stable interior equilibrium exists, then the globaldynamics of (30) corresponds to coexistence of the species. The case wherethe interior equilibrium is unstable (a saddle) corresponds to bistable phaseportrait of (30). The outcome of competition depends on the initial condi-tions.
2. If aj and bjk are such that no stable interior equilibrium exists, then the globaldynamics of (30) corresponds to extinction of one of the species.
It is therefore not surprising that equations (29) can produce similar dynamics forsuitable parameter values. The latter case (Fig. 8d), which shows “extinction” ofE1 during the first exponential growth phase, reflects the preferential utilization ofS2. The former case (Fig. 8e), in which both peripheral enzymes “coexist”, mirrorsthe dynamics of simultaneous substrate utilization. The global dynamics shown inFigure 8f corresponds to preferential consumption of S1 if the culture is pregrownon S1 (resulting in high initial levels of E1), and simultaneous utilization of bothS1 and S2 if the culture is pregrown on S2 (resulting in high initial levels of E2).This is precisely what transpires during growth of E. coli on a mixture of glucoseand pyruvate.
Theoretically, equations (29) may yield more complicated phase portraits due tothe nonlinearity of r+
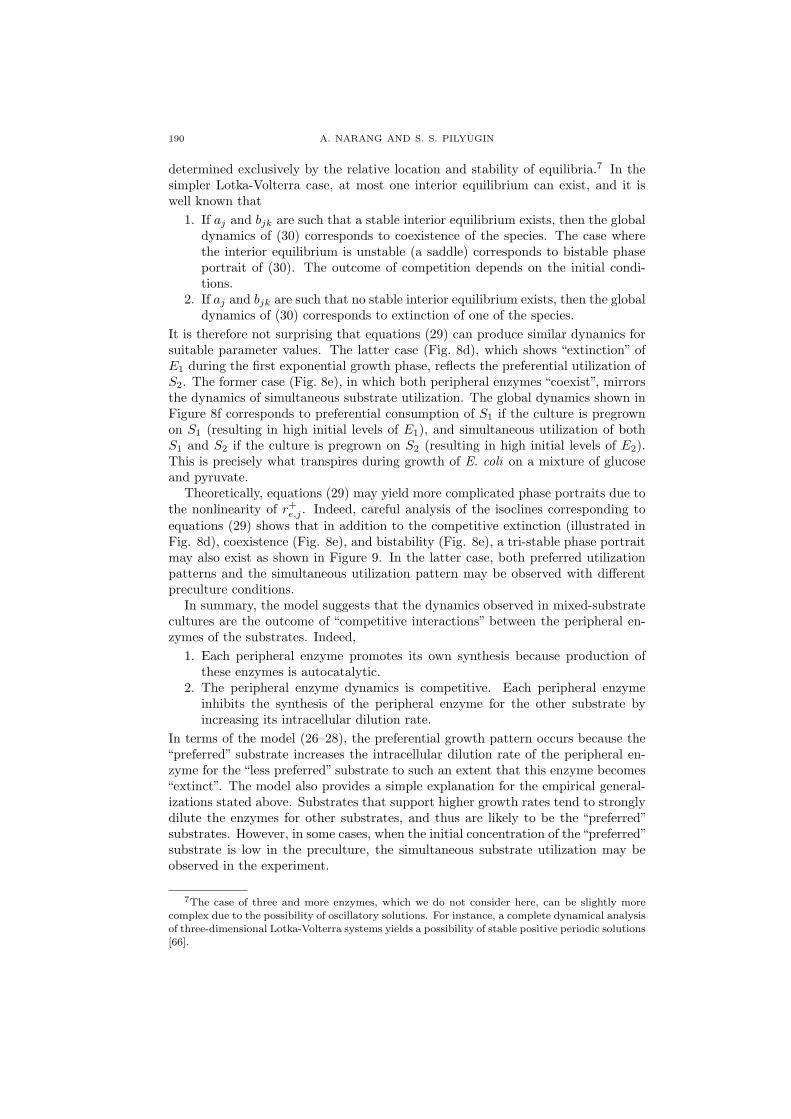
e,j . Indeed, careful analysis of the isoclines corresponding toequations (29) shows that in addition to the competitive extinction (illustrated inFig. 8d), coexistence (Fig. 8e), and bistability (Fig. 8e), a tri-stable phase portraitmay also exist as shown in Figure 9. In the latter case, both preferred utilizationpatterns and the simultaneous utilization pattern may be observed with differentpreculture conditions.
In summary, the model suggests that the dynamics observed in mixed-substratecultures are the outcome of “competitive interactions” between the peripheral en-zymes of the substrates. Indeed,
1. Each peripheral enzyme promotes its own synthesis because production ofthese enzymes is autocatalytic.
2. The peripheral enzyme dynamics is competitive. Each peripheral enzymeinhibits the synthesis of the peripheral enzyme for the other substrate byincreasing its intracellular dilution rate.
In terms of the model (26–28), the preferential growth pattern occurs because the“preferred” substrate increases the intracellular dilution rate of the peripheral en-zyme for the “less preferred” substrate to such an extent that this enzyme becomes“extinct”. The model also provides a simple explanation for the empirical general-izations stated above. Substrates that support higher growth rates tend to stronglydilute the enzymes for other substrates, and thus are likely to be the “preferred”substrates. However, in some cases, when the initial concentration of the“preferred”substrate is low in the preculture, the simultaneous substrate utilization may beobserved in the experiment.
7The case of three and more enzymes, which we do not consider here, can be slightly morecomplex due to the possibility of oscillatory solutions. For instance, a complete dynamical analysisof three-dimensional Lotka-Volterra systems yields a possibility of stable positive periodic solutions[66].
TOWARDS INTEGRATED PHYSIOLOGICAL THEORY OF MICROBIAL GROWTH 191
e
e1
2
simultaneous utilizationS
pre
ferr
ed2
S preferred1
2
e‘ =01
e‘ =0
Figure 9. A tri-stable phase portrait of (29). The nullclines forboth enzymes are shown by punctured curves. The open dots rep-resent unstable equilibria, the filled dots represent stable equilibria.Three basins of attraction are shown for preferential utilization ofS1, simultaneous utilization of S1 and S2, and preferential utiliza-tion of S2 respectively.
3.2. Steady states of continuous cultures. The most comprehensive study ofmixed continuous cultures was reported by Egli and coworkers, who studied thegrowth of the methylotrophic yeasts, H. polymorpha and Kloeckera sp. 2201, onmixtures of glucose and methanol [18, 20]. In substrate-excess batch cultures, thesemicrobes typically prefer to consume glucose before methanol. When the dilutionrate was changed at fixed feed concentrations in continuous cultures, Egli et al.observed that
1. Both substrates are almost completely consumed at low dilution rates, butonly glucose is consumed at high dilution rates. At such dilution rates, theresidual concentration of methanol approaches its concentration in the feedwhich clearly indicates the lack of consumption (Fig. 10b). The dilutionrate at which the pattern switches from the simultaneous to the preferentialsubstrate utilization pattern is called the transition dilution rate.
2. The onset of the transition dilution rate is marked by a pronounced reductionin the activity of alcohol oxidase, a peripheral enzyme for methanol (Fig. 10c).
3. The transition dilution rate is higher than the washout dilution rate corre-sponding to single-substrate growth on methanol. In other words, consump-tion of methanol in the mixed-substrate culture persists at dilution rates wellabove the dilution rate at which the microbes are washed out of the reactorwhile growing on methanol alone.
Figure 10 (right panel) shows that all three phenomena can be explained withinthe framework of the model (26–28). We begin by explaining why the transitiondilution rate exists. Before doing so, it is useful to understand the existence ofthe washout dilution rate since the onset of the transition dilution occurs for verysimilar reasons. To this end, observe that at steady state, the mass balance for thecell density yields
0 = (rg −D)c =⇒ rg = D or c = 0,
At low dilution rates, the steady-state satisfies the relation, rg = D. As D increases,so does the specific growth rate until the cells reach the maximum specific growthrate consistent with the feed concentration. If D is increased any further, the

192 A. NARANG AND S. S. PILYUGIN
0.1 0.2 0.3 0.4 0.5D (1/hr)
0.5
1
1.5
2
2.5
c (gdw/L)
100%
61%
23%
0%
(a)
0
0.5
1
1.5
2
0 0.2 0.4 0.6 0.8
c (
gd
w/L
)
D (hr-1)
(b)
0.1 0.2 0.3 0.4 0.5D (1/hr)
1
2
3
4
5
MET (g/L)
61%
23%
0%
(c)
0.0001
0.001
0.01
0.1
1
10
0 0.2 0.4 0.6 0.8
s2 (
g/L
)D (hr-1)
(d)
0.1 0.2 0.3 0.4 0.5D (1/hr)
1
2
3
4
5
Activity of AO
(e)
012345678
0 0.2 0.4 0.6 0.8
e2 (
mg
/gd
w)
D (hr-1)
(f)
Figure 10. Variations of the steady-state concentrations withrespect to the dilution rate at fixed feed concentrations. Leftpanel: Experimental data for growth of H. polymorpha on sev-eral mixtures of glucose and methanol (from [18, 20]). The totalfeed concentration of glucose and methanol was fixed at 5 g/L, butthe proportion of glucose in the feed was varied from 0% glucose(pure methanol) to 100% glucose. (a) Cell density. (c) Methanolconcentration. (e) Peripheral enzyme (alcohol oxidase) level for61% glucose in the feed. Right panel: Simulations of our model(from [47]). (b) Cell density. (d) Concentration of ”less preferred”substrate, S2. (f) Peripheral enzyme level for the ”less preferred”substrate. The arrows in the figures point in the direction of in-creasing proportion of the “preferred” substrate, S1, in the feed.
relation rg = D can no longer be satisfied, and the cell concentration switches tothe washout steady state c = 0 via a transcritical bifurcation. The washout dilutionrate is the critical value of D that corresponds to this transcritical bifurcation. Theexistence of the transition dilution rate follows from a similar argument. Indeed,

TOWARDS INTEGRATED PHYSIOLOGICAL THEORY OF MICROBIAL GROWTH 193
20 40 60 80 100% MET in feed
1
2
3
4
5
6
7
MET (mg/L)
(a)
20 40 60 80 100% MET in feed
0.2
0.4
0.6
0.8
1
1.2
1.4
Activity (mmols/(g-min)
(b)
20 40 60 80 100% GAL in feed
10
20
30
40
6
GLU, GAL (10 g/L)
GAL
GLU
(c)
Figure 11. Variations of the steady-state concentrations with re-spect to the feed composition at a fixed dilution rate. Variation of(a) the concentration of methanol and (b) the activity of alcoholoxidase, a peripheral enzyme for methanol during growth of Kloeck-era sp. 2201 on a mixture of glucose and methanol (from [19]).(c) Variation of the substrate concentrations during growth ofE. coli ML308 on a mixture of glucose and galactose (from [39]).
at steady state, equation (29), the mass balance for peripheral enzymes, reads
Ve,j
K1,jej + K2,je2j
K3,j + K1,jej + K2,je2j
= Dej ⇒ Ve,jK1,j + K2,jej
K3,j + K1,jej + K2,je2j
= D or ej = 0,
At sufficiently high D, the first relation cannot be satisfied, and the cells switch to adifferent physiological steady state with ej = 0 via a transcritical bifurcation. Thetransition dilution rate is the value of D corresponding to such bifurcation. It isalso clear that the transition dilution rate must be higher than the washout dilutionrate: If the peripheral enzyme level becomes zero, then so does the correspondingsubstrate consumption rate, and the cells are washed out of the reactor becausetheir specific growth rate is zero.
When the feed composition is changed at a fixed dilution rate, it is observed that(Fig. 11)
1. The peripheral enzyme levels and the residual substrate concentrations in-crease monotonically with the fraction of the substrate in the feed.
2. When the peripheral enzyme levels increase, the substrate concentration isconstant. When the peripheral enzyme levels saturate, the substrate concen-tration increases.
These steady-state profiles are also predicted by the model (26–28). To understandthese variations in terms of the model, we begin by observing that the steady stateswere obtained at dilution rates so small that nearly all of the substrate enteringthe chemostat is consumed (sj ¿ sf
j ). Under these conditions, (26) and (28) imply

194 A. NARANG AND S. S. PILYUGIN
thatc = Y1(s
f1 − s1) + Y2(s
f2 − s2) ≈ Y1s
f1 + Y2s
f2 ,
Then it follows from (26) that rs,j = D(sfj − sj)/c ≈ Dsf
j /c, and thus
rs,j ≈Dsf
j
Y1sf1 + Y2s
f2
=(
D
Yj
)γj , where γj ≡
Yjsfj
Y1sf1 + Y2s
f2
. (31)
Therefore, the specific substrate uptake rate of Sj is proportional to γj that rep-resents the fraction of cells produced from Sj .8 Now, since xj ≈ rs,j/kx,j ≈Dγj/(kx,jYj), equation (27) implies that the steady-state peripheral enzyme levelsare given by
ej =r+
e,j
D+k−e,j
= Ve,j
D+k−e,j
1+K1,jγj+K2,jγ2j
K3,j+K1,jγj+K2,jγ2j
,
K1,j ≡ K1,j
(D
kx,jYj
), K2,j ≡ K2,j
(D
kx,jYj
)2
.(32)
Since typically K3,j À 1, the steady-state peripheral enzyme levels are increas-ing functions of γj . It follows from (31) that when ej increases linearly with γj ,the substrate concentration is constant. When ej saturates at large γj , the ratio,sj/(Ks,j + sj), and hence sj , increases with γj .
4. Multiple-species, multiple-substrate cultures. One of the most importantquestions in microbial ecology is that of the coexistence of mixed microbial commu-nities supplied with mixtures of various nutritional resources. A major theoreticalresult based on simple phenomenological models of continuous culture is the princi-ple of competitive exclusion stating that at most one microbial species can survivein a chemostat containing a single growth-limiting substrate [29, 30, 55, 64]. Thistheory extends to a very general set of functions modeling the growth response ofmicrobes at different substrate concentrations. If the experimental growth curvesfor each individual species are known, the theory predicts that the species thatsurvives at any given dilution rate and feed concentration must have the lowestbreak-even concentration [1, 58]. These theoretical conclusions have been con-firmed by experiments [25]. To study competition for multiple substrates, a seriesof phenomenological models have been introduced that recognize the existence ofdistinct resources, and the different types of interactions between the resources[5, 10, 40, 61]. For instance, Leon and Tumpson [40] assumed that the resourcesare non-interacting, that is, none of the resources affect the uptake of any otherresource. A model in which two substitutable resources may inhibit each others’uptake has been studied by Ballyk and Wolkowicz [5]. In their work, Ballyk andWolkowicz presented a very detailed analysis of the model, including both localand global stability analysis. They provided important theoretical insights into theglobal behavior of mixed microbial cultures but formulated the results in a way thatcannot be easily related to the experimental data. An important step towards rec-onciling theoretical predictions and experimental observations was made by Tilman,
8The experimental data is generally shown as a function of σj , the fraction of Sj in the feed.However, since γj is an increasing function of σj ,
γj =Yjσj
Y1σ1 + Y2σ2, σj ≡
sfj
sf1 + sf
2
,
the general trends (increasing or decreasing) are the same regardless of the parameter used to plotthe data.

TOWARDS INTEGRATED PHYSIOLOGICAL THEORY OF MICROBIAL GROWTH 195
who developed an elegant graphical theory of two-species growth on arbitrary mix-tures of substrates [61, 62]. Specifically, Tilman demonstrated that the existenceand stability of coexistence equilibria corresponding to a given combination of thefeed concentrations and the dilution rate can be deduced from single-species data.In light of the above theoretical findings and given our goal of developing a unifyingphysiological theory of microbial growth, we were naturally led to ask the questions,
Given the experimental data on the mixed-substrate growth of individualspecies, can we predict the outcome of an experiment in which all thesespecies are inoculated in the chemostat? How do these predictions relateto the underlying physiological principles governing microbial growth?
As a starting point, we considered the growth of two species on a mixture of twosubstitutable substrates. In [52, 53], we showed that if the interaction between thetwo species is purely competitive, all the key properties of the mixed-culture steadystates can indeed be predicted from the single-species data.
The foregoing question was motivated by the desire to predict mixed-culturegrowth from the experimental data for single-species growth on mixtures of sub-strates. However, as shown above, the single-species model (26–28) successfullycaptures the experimental data. Thus, it seems pertinent to ask whether the modelitself can be used to study mixed-culture behavior. To this end, we studied thecompetition between two species, each of which consumes the same pair of substi-tutable substrates in accordance with the kinetic scheme shown in Figure 7. Weasked the question,
Under what operating conditions can two species coexist in a chemostatlimited by two substrates?
In [56], we constructed an operating diagram that shows all the dilution rates andfeed concentrations at which two species can coexist.
4.1. Deducing mixed-culture dynamics from single-species data. To demon-strate that mixed-culture growth can be predicted from single-species data, webegan by considering a simple phenomenological model of mixed growth [52].
The phenomenological model has the form
sj = D(sfj − sj)− c1r
s1j(s1, s2)− c2r
s2j(s1, s2), j = 1, 2, (33)
ci = ci
(rgi (s1, s2)−D
), i = 1, 2, (34)
where rgi denotes the specific growth rate of the ith species and rs
ij denotes thespecific substrate uptake of the jth substrate by the ith species. We assumed that thetwo substrates are substitutable, so that rg
i (s1, s2) = Yi1rsi1(s1, s2) + Yi2r
si2(s1, s2).
Here, the coefficients Yij , i, j = 1, 2 denote the growth yields of the ith species onthe jth substrate respectively, and we assume that all these yields are constant. Inaddition, we assume that each substrate stimulates its own uptake
∂rsi1
∂s1(s1, s2) ≥ 0,
∂rsi2
∂s2(s1, s2) ≥ 0, (35)
but inhibits the uptake of the other substrate∂rs
i1
∂s2(s1, s2) ≤ 0,
∂rsi2
∂s1(s1, s2) ≤ 0. (36)
This property of mutual inhibiton was inherent in the physiological model (26–28)for two substitutable substrates: Substrate Si inhibited the uptake of substrate

196 A. NARANG AND S. S. PILYUGIN
10 20 30 40 6GLU (10 g/L)
5
10
15
20
25
30
35
6
GAL (10 g/L)
(a)
0 0.05 0.1 0.15 0.2GLU (g/L)
0
0.5
1
1.5
2
MET (g/L)
(b)
11φ
01
10
φ
φ
1
2
21ff(s ,s )2
s
s
G
G
Φ
Φ
1
2
1
(c)
Figure 12. (a) The growth isocline for E. coli ML308 growing ona mixture of glucose and galactose at D = 0.3 1/hr. The curve wasderived from the data shown in Figure 11c. (b) The consumptioncurve for H. polymorpha growing on a mixture of 61% glucose and39% methanol. The curve was derived from the data shown in Fig-ure 10b. (c) Determination of the existence, uniqueness, and stabil-ity of the steady-states from the growth isoclines and consumptioncurves for the two species. The growth isoclines for species 1 and 2are labeled G1 and G2, respectively. The consumption curves forspecies 1 and 2 are labeled Φ1 and Φ2, respectively. The semitriv-ial steady-state, c1 > 0, c2 = 0 is denoted by the point φ10; thesemitrivial steady-state, c2 > 0, c1 = 0 is denoted by the pointφ01; and the nontrivial (coexistence) steady-state, c1 > 0, c2 > 0 isdenoted by the point φ11. Coexistence is stable for the dispositionof the curves shown in the figure.
Sj , j 6= i by enhancing the intracellular dilution rate of Ej . In the phenomeno-logical model (33 –34), we simply assume the mutual inhibition property withoutprescribing a mechanism for it.9
The phenomenological model (33–34) admits three types of steady states: Trivial(c1 = c2 = 0), semitrivial (c1 > 0, c2 = 0 and c1 = 0, c2 > 0), and nontrivial(c1, c2 > 0). Our main result was that the existence, uniqueness, and stability of
9Although equations (33–34) are algebraically identical to the model studied by Ballyk andWolkowicz [5], we analyzed the model under a less restrictive set of assumptions and used adifferent analytic approach.

TOWARDS INTEGRATED PHYSIOLOGICAL THEORY OF MICROBIAL GROWTH 197
these steady-states can be inferred from two curves, that are completely determinedby the experimentally observed steady-states of single-species growth on S1 and S2.These curves are defined as follows
1. The growth isocline of the ith species, denoted Gi, is the locus of all steady-state substrate concentrations, (s1, s2), obtained when this species alone isgrown on a mixture of S1 and S2 at a fixed dilution rate, but varying feedconcentrations (Fig. 12a). For the phenomenological model, Gi is given bythe relation
rgi (s1, s2) = D, (37)
which follows from (34).2. The consumption curve of the ith species, denoted Φi, is the locus of all steady
state substrate concentrations, (s1, s2), obtained when this species alone isgrown on a mixture of S1 and S2 at fixed feed concentrations, but varyingdilution rates (Fig. 12b). For the unstructured model, Φi is given by therelation
sf1 − s1
rsi1(s1, s2)
=sf2 − s2
rsi2(s1, s2)
≥ 0, (38)
which follows from (33) with cj = 0, j 6= i. Given the assumptions (35–36) regarding the specific substrate uptake rates, it can be shown that theconsumption curve is a monotonically increasing function passing throughthe points, (0, 0) and (sf
1 , sf2 ).
Using the definitions of these curves, it is easy to see that1. The projection of any semitrivial steady-state (ci > 0, cj = 0, j 6= i) onto the
(s1, s2) plane lies at the intersection of the corresponding growth isocline, Gi,and the consumption curve, Φi.
2. The nontrivial (coexistence) steady state(s), c1, c2 > 0, exist if and only if thetwo growth isoclines intersect within the envelope of coexistence, defined asthe region in the (s1, s2) plane enclosed by the two consumption curves. If an(s1, s2)-projection of a nontrivial steady-state falls outside of the envelope ofcoexistence, at least one of the resulting two cell densities is negative.
3. The dynamics of both single-species cultures are completely determined bythe intersections of the corresponding growth isocline and the consumptioncurve. Indeed, suppose for a moment that c2 ≡ 0. Then the model (33–34)reduces to three equations
s1 = D(sf1 − s1)− c1r
s11(s1, s2),
s2 = D(sf2 − s2)− c1r
s12(s1, s2),
c1 = c1
(Y11r
s11(s1, s2) + Y12r
s12(s1, s2)−D
).
Letting z = Y11s1 + Y12s2 + c1, we find that z = D(Y11sf1 + Y12s
f2 − z), thus
the above equations enjoy the asymptotic consevration law z = Y11sf1 +Y12s
f2 .
Hence, the above system can be effectively reduced to two equations
s1 = D(sf1 − s1)−
{Y11(s
f1 − s1) + Y12(s
f2 − s2)
}rs11(s1, s2), (39)
s2 = D(sf2 − s2)−
{Y11(s
f1 − s1) + Y12(s
f2 − s2)
}rs12(s1, s2). (40)
It is easy to see that the system (39–40) is strictly cooperative for 0 < sj ≤ sfj .
Therefore, all positive solutions converge to some equilibria whose stability

198 A. NARANG AND S. S. PILYUGIN
is determined by the intersections of G1 and Φ1. Imortantly, a single-speciesculture cannot exhibit any type of oscillatory behavior.10
The existence and uniqueness of the mixed-culture steady states is also completelydetermined by the growth isoclines and consumption curves for the two species.It is interesting that the stability of the steady states is also determined by thesecurves. To this end, it is useful to classify the interaction between the substratesfor a given species. Specifically, the substrates are said to be locally synergistic(resp. locally antagonistic) for the ith species if increasing both substrate levelsalong the consumption curve Φi increases (resp. decreases) the specific growth ratergi . Stability analysis of the equations (33–34) shows that
1. The semitrivial steady states are stable if and only if the substrates are locallysynergistic and the other competitor cannot invade the chemostat.
2. The nontrivial steady states are stable only if the following inequality is sat-isfied at the steady state[
−∂rg1/∂s2
∂rg1/∂s1
−(−∂rg
2/∂s2
∂rg2/∂s1
)]·[rs11
rs12
− rs21
rs22
]> 0. (41)
The first term is the difference between the slopes of the two growth isoclinesat the nontrivial steady state. The second term is positive if and only if Φ1
lies above Φ2. If the latter is true, (41) says that coexistence is stable only ifthe difference between the slopes of the growth isoclines is positive (Fig. 12).
It turns out that inequality (41) is necessary but not sufficient for the stability of anontrivial equilibrium. In [52], we have demonstrated that Hopf bifurcations mayoccur in the region where (41) holds, provided that the substrates S1 and S2 arelocally synergistic for one species and locally antagonistic for the other.
The foregoing results concerning the existence, uniqueness, and stability of thesteady states are preserved even if additional physiological structure is added tothe model. In [53], we extended the phenomenological model (33–34) by explicitlyconsidering the physiological structure for each of the microbial species as shownin Figure 7. The equations of this physiological model are
sj = D(sfj − sj)− c1r
s1j − c2r
s2j , j = 1, 2, (42)
eij = reij(sj , eij)− eijr
gi (s1, s2, ei1, ei2), (43)
ci = (rgi (s1, s2, ei1, ei2)−D) ci, i = 1, 2, (44)
where rgi ≡ Yi1r
si1 + Yi2r
si2 = Yi1ei1σi1 + Yi2ei2σi2, i = 1, 2. In [53], we presented
the local stability analysis of (42–44) based on the following assumptions,(H1): The functions re
ij(sj , eij) are such that
∂reij(sj , eij)
∂sj> 0,
∂
∂eij
(reij(sj , eij)
eij
)< 0.
For any sj > 0,lim
eij→0reij(sj , eij) = e∗ij(sj) > 0,
and there exists a unique value e0ij(sj) > 0 such that re
ij(sj , e0ij(sj)) = 0.
(H2): The functions rsij are given by eijσij(sj), where σij(s) are such that
σij(0) = 0, σ′ij(s) > 0, lims→∞
σij(s) < +∞.
10This proof was originally presented in [5] for the case when the semitrivial steady-state isunique.

TOWARDS INTEGRATED PHYSIOLOGICAL THEORY OF MICROBIAL GROWTH 199
Using hypotheses (H1) and (H2), we obtained the following results1. Under steady-state growth conditions, the substrate concentrations uniquely
determine the physiological state of the cell, including the mass fractions ofthe peripheral (transport) enzymes and the inducer molecules. Specifically, weshowed that for all combinations (s1, s2) of the substrate concentrations, theperipheral enzyme levels eij exhibit a unique positive steady state. Denotingthis physiological steady state by eij = eij(s1, s2), we redefined the notionsof the growth isocline and the consumption curve. For instance, the growthisocline Gi for the ith species is the locus of all substrate concentrations suchthat
Yi1ei1(s1, s2)σ1(s1) + Yi2ei2(s1, s2)σ2(s2) = D.
2. The growth isocline, Gi, is a graph of a decreasing function in the (s1, s2)plane, while the consumption curve Φi is a graph of an increasing function inthe (s1, s2) plane connecting the origin to the point (sf
1 , sf2 ).
3. There exists at most one semitrivial steady state for a given i, and it lies at theintersection of the corresponding growth isocline and the consumption curve.The stability of the semitrivial steady state is determined by the ability ofthe resident species to defend the chemostat against occupation by the otherspecies.
4. The nontrivial (coexistence) steady-state is represented by an intersection oftwo growth isoclines if and only if it occurs within the envelope of coexistence,that is, the region between the two consumption curves. We also showed thatthe necessary condition for the stability of the nontrivial equilibrium of (42–44) is identical to (41). Finally, we demonstrated that model (42–44) mayadmit multiple nontrivial equilibria.
These conclusions were heavily based on hypothesis (H1) which essentially war-ranted the uniqueness of the physiological steady-state. If the assumption (H1) isnot valid, for instance, when one of the functions re
ij(sj ,eij)
eijis no longer monotoni-
cally decreasing in the corresponding eij , then multiple physiological steady statesmay exist. We have already discussed this possibility in section 3.1. This caserequires an extensive additional analysis which we are currently conducting.
4.2. The operating diagram for coexistence of species. In [56], we deter-mined the operating diagram of the model (42–44), and presented a computationalprocedure that allows to explicitly compute the dilution rates and feed concentra-tions at which two species, C1 and C2, coexist in the chemostat supplied with twosubstitutable substrates S1 and S2. At a coexistence steady-state, the algebraicsystem
rs11c1 + rs
21c2 = D(sf1 − s1),
rs12c1 + rs
22c2 = D(sf2 − s2),
must admit a positive solution (c1, c2). Moreover, the residual substrate concen-trations are negligibly small compared to the feed concentrations (sj ¿ sf
j ) at allbut the highest dilution rates and/or the smallest feed concentrations. Under theseconditions, the coexistence steady-state satisfies the vectorial relation
c1rs1 + c2rs
2 = Dsf , where rsi = (rs
i1, rsi2)
T , sf = (sf1 , sf
2 )T ,
with ci > 0. Hence, the vector sf must lie in the positive cone spanned by thevectors rs
1 and rs2. In [56], we chose the parameter values such that C1 prefers S1,

200 A. NARANG AND S. S. PILYUGIN
0
0.2
0.4
0.6
0.8
1
0 0.1 0.2 0.3 0.4 0.5 0.6 0.7 0.8
c 2 [g / L
]
D [1 / hr]
φ01 (unstable)
φ11 (stable)
(a)
0
0.02
0.04
0.06
0.08
0.1
0 0.1 0.2 0.3 0.4 0.5 0.6
c 2 [g / L
]
D [1 / hr]
s2f = 0.5 g / L
0.3 g / L
0.2 g / L
(b)
0
20
40
60
80
100
0 0.1 0.2 0.3 0.4 0.5 0.6
θ 1,
θ 2
D [g / L]
Extinction of Species 1
Extinction of Species 2
θ2
θ1
(c)
Figure 13. (a) Species 2 vanishes at sufficiently small dilutionrates. (b) The smaller the feed concentration, sf
2 , the smaller theinterval of coexistence. (c) Operating diagram showing the feedconcentration ratios at which the two species can coexist. At anygiven dilution rate, species 1 cannot exist, if sf
2 is so high comparedto sf
1 that arctan(sf2/sf
1 ) lies above the curve θ1. Likewise, species 2cannot exist, if sf
2 is so low compared to sf1 that arctan(sf
2/sf1 ) lies
below the curve θ2. Coexistence is feasible only if sf2/sf
1 is suchthat arctan(sf
2/sf1 ) lies between the curves θ1 and θ2.
and C2 prefers S2 (e.g. rs11 > rs
21, and rs12 < rs
22). Then we suggested a conciseway of depicting the operating diagram: Let θi(D) and θs denote the angles formedby rs
i and sf with the sf1 -axis. It is easy to see that the above choice of substrate
preference corresponds to the inequality θ1(D) < θ2(D). Therefore, the operatingdiagram can be represented by a region in the (D, θ)-plane defined by the inequalityθ1(D) < θs < θ2(D).
The simulations showed that when both species are grown in the reactor, C2
vanishes at a sufficiently low dilution rate. Thus, both species coexist only if thedilution rate lies within a certain interval (Fig. 13a). The smaller the feed concen-tration of S2, the preferred substrate for C2, the smaller the width of the interval.At sufficiently small sf
2 , the width of the interval vanishes, so that C2 cannot existat any dilution rate (Figure 13b). Similar behavior is observed if the feed concen-tration of S1 is decreased. At sufficiently small sf
1 , C1 cannot exist at any dilutionrate. Thus, the operating diagram has the form shown in Figure 13c. If sf
1 À sf2 ,
species 2 cannot exist at any dilution rate; likewise, if sf1 ¿ sf
2 , species 1 cannotexist at any dilution rate. Coexistence is feasible for some range of dilution ratesonly if the ratio of the feed concentration lies within a certain range.
5. Discussion. Although the above models provide a useful starting point, muchremains to be done. In this section, we describe some of the outstanding problemsthat must be resolved to develop a truly comprehensive physiological theory ofmicrobial growth.
5.1. Single-species, single-substrate cultures.
5.1.1. The role of energy. Figure 1a shows that the precursor pool, P , has severalpossible fates - RNA/protein synthesis, respiration, storage and excretion. Thequestion then arises

TOWARDS INTEGRATED PHYSIOLOGICAL THEORY OF MICROBIAL GROWTH 201
What determines the relative rates of RNA/protein synthesis, respira-tion, storage, and excretion?
This question is important in its own right. Moreover, as we show below, the char-acteristics of mixed-substrate growth rest crucially upon a proper understanding ofthis question.
The experimental evidence suggests that microbial cells control and regulatethese metabolic processes in a seemingly rational manner. Under starvation condi-tions, cells increase the respiration rate relative to the growth rate. Under carbon-excess conditions, they synthesize carbohydrates at the expense of RNA and pro-teins. It is believed that nucleotide phosphates such as ATP and ADP, the “energycurrency” of the cell, play a supervisory role in organizing these reactions. Thenucleotide phosphates are global variables, inasmuch as they are involved in vir-tually all the intracellular reactions. To study the role of energy conversions inorganizing cell growth, one could modify the kinetic scheme shown in Figure 1a bycoupling all the processes to ATP synthesis or consumption. For instance, periph-eral catabolism of the substrate, and synthesis of RNA, proteins, and carbohydratesare energy-consuming processes coupled to the conversion of ATP to ADP. On theother hand, respiration, excretion, and the generation of P from X and Ps areenergy-releasing processes coupled to the conversion of ADP to ATP. Since ATP isa “fast” variable, the rate of energy synthesis and consumption are approximatelyequal on the time scale of interest. This “energy balance” imposes a constraint onthe relative rates of the key processes. It is conceivable that additional constraints,such as “redox balances”, may be necessary to obtain full agreement with the data.Such an extended model could yield the relative rates of biosynthesis, respiration,storage, and excretion.
5.2. Single-species, multiple-substrate cultures. We have shown above thata simple model of growth on mixtures of substitutable substrates captures the dy-namics of batch cultures and the steady states of continuous cultures. However,there are open questions regarding the dynamics of continuous cultures. Insofar asmixtures of complementary substrates are concerned, there are hardly any physio-logical models.
5.2.1. Mixtures of substitutable substrates. Two types of experiments have beenperformed to study the dynamics of mixed-substrate growth in a chemostat. Weshow below that the first type of transient can be understood in terms of our existingmodel, but the second reveals a deficiency of the model.
We begin by describing the transients that fall within the scope of our existingmodel. Harte and Webb studied the response of glucose-limited cells of K. aerogenesto substrate switches [3, 27]. The cells were allowed to reach steady state in achemostat at a feed concentration of 100 mg/L. After steady state was reached,the feed was changed to a mixture of glucose (100 mg/L) and maltose (100 mg/L).Since the feed concentration was increased, the cell density is expected to increase.However, it turns out that the rate of increase depends on the dilution rate at whichthe experiment is performed (Fig. 14a). At low dilution rates, uptake of maltosecommences immediately after the shift, and the cell density increases without anylag. At intermediate dilution rates, there is a lag before maltose uptake and growth.At high dilution rates, there is neither maltose uptake nor growth. This data canbe understood in terms of our existing model. During steady-state growth onglucose, the concentration of the inducer for maltose is zero. Hence, (27) implies

202 A. NARANG AND S. S. PILYUGIN
20 40 60 80 100t (hr)
0.125
0.15
0.175
0.2
0.225
0.25
0.275
OD
D=1.03
D=0.38
(a)
10 20 30 40 50t (hr)
2.5
5
7.5
10
12.5
15
NTA activity 90%
50%
0%
(b)
20 40 60 80% GLU in feed
5
10
15
20
Induction time (hr)
(c)
Figure 14. Dynamics of growth on mixtures of substitutablesubstrates. (a) Transient response of glucose-limited cultures ofK. aerogenes to feed switches from glucose (100 mg/L) to glucose(100 mg/L) plus maltose (100 mg/L). The data shows that thelarger the dilution rate at which the feed is switched, the longerthe lag before the OD increases. (b) Induction of NTA metabolismin C. heintzii growing in continuous culture after switching thefeed from a medium containing glucose as the sole carbon sourceto a medium containing glucose and NTA. The data shows thatthe higher the percentage of glucose in the feed, the smaller thetime required to induce NTA metabolism. (c) Induction times cor-responding to various proportions of glucose in the feed.
that immediately after the substrate switch, the activity of the peripheral enzymefor maltose is
eMAL =Ve,MAL
K3,MAL
(D + k−e,MAL
) .
According to this expression, the higher the dilution rate, the smaller the activityof the peripheral enzymes for maltose. It follows that the higher the dilution rate atwhich the feed is switched from pure glucose to a mixture of glucose and maltose,the longer it takes to accumulate the peripheral enzymes for maltose. At dilutionrates exceeding the transition dilution rate for maltose, the peripheral enzyme levelsare so small that there is no observable uptake of maltose.
Bally and Egli [4] studied another type of substrate switch resulting in dynamicsthat are beyond the scope of our current model. They allowed glucose-limited cells

TOWARDS INTEGRATED PHYSIOLOGICAL THEORY OF MICROBIAL GROWTH 203
of C. heintzii to reach steady state, after which the feed was abruptly switched to amixture of glucose and nitrotriacetic acid (NTA). Since the cells have not seen NTAuntil after the switch, one expects a lag before the peripheral enzymes for NTA areinduced. Furthermore, intuition suggests that the larger the concentration of glu-cose in the feed, the larger the induction time. The experiments show precisely theopposite result (Fig. 14b). When the feed is switched to pure NTA, the inductiontime is 20 hours. When the feed is switched to 50% glucose and 50% NTA, theinduction time drops dramatically to 4 hours, and with 90% glucose, there is noinduction lag at all. This data shows that under these conditions, glucose supports,rather than inhibits, the induction of the peripheral enzymes for NTA. To under-stand this counterintuitive result, recall that when the feed is switched from pureglucose to pure NTA, the uptake of NTA is negligibly small (see Fig. 2), so that thecells are presumably in a “starvation” state. However, when the feed is switchedfrom pure glucose to a mixture of glucose and NTA, uptake of NTA is vanishinglysmall, but glucose is consumed significantly. It is conceivable that the energy andprecursors derived from catabolism of glucose mitigate the starvation state, and ei-ther stimulate the synthesis, or inhibit the degradation, of the peripheral enzymesfor NTA. It turns out that this is indeed the case. Bally and Egli showed that if thefeed is switched from NTA to a medium containing no carbon source, thus deprivingthe cells of energy and precursors, the degradation rate of the peripheral enzymesfor NTA is 0.3-0.9 1/hr. However, when the feed is switched from pure NTA topure glucose, the degradation rate of the peripheral enzymes for NTA is only 5%per hour. The foregoing results cannot be reconciled with our current model sinceit does not even consider the energy levels as variables. To capture these results, itis necessary to incorporate the energy levels in the manner described above. Thedegradation rates of the enzymes can then be defined in terms of the energy statusof the cells. These modifications could lead to agreement with the data.
5.2.2. Mixtures of complementary substrates. In most experiments with comple-mentary mixtures, the growth-limiting substrates are the carbon and nitrogensources. It is intuitively obvious that a culture is carbon limited if the carbon-to-nitrogen (C:N) ratio in the medium is small, and nitrogen limited if the C:Nratio is large. The central question that then arises is
What physiological changes do the cells undergo as the medium is changedfrom carbon- to nitrogen-limited conditions and vice versa?
In the modeling literature, growth on complementary substrates is commonly de-scribed by phenomenological models that assume the mixed-substrate specific growthrate of the form
rg(s1, s2) = min {rg1(s1), rg
2(s2)} ,
where rgi (sj) are increasing functions of sj describing the specific growth rate under
Sj-limited conditions [40, 61, 31]. These phenomenological models have been subse-quently generalized using the cell-quota formulation originally due to Droop [14, 15]partially decoupling the processes of substrate uptake and growth [34, 38, 13]. Allof the above models have the property that at steady state the cells are either car-bon limited or nitrogen limited unless rg
1(s1) = rg2(s2). This curve describes a sharp
interface between the regimes of different substrate limitations. As we show below,this contradicts the experimental data.
Durner and Egli determined the steady-states in a chemostat when the feed con-centration of the nitrogen source (ammonia) and the dilution rate are held fixed,
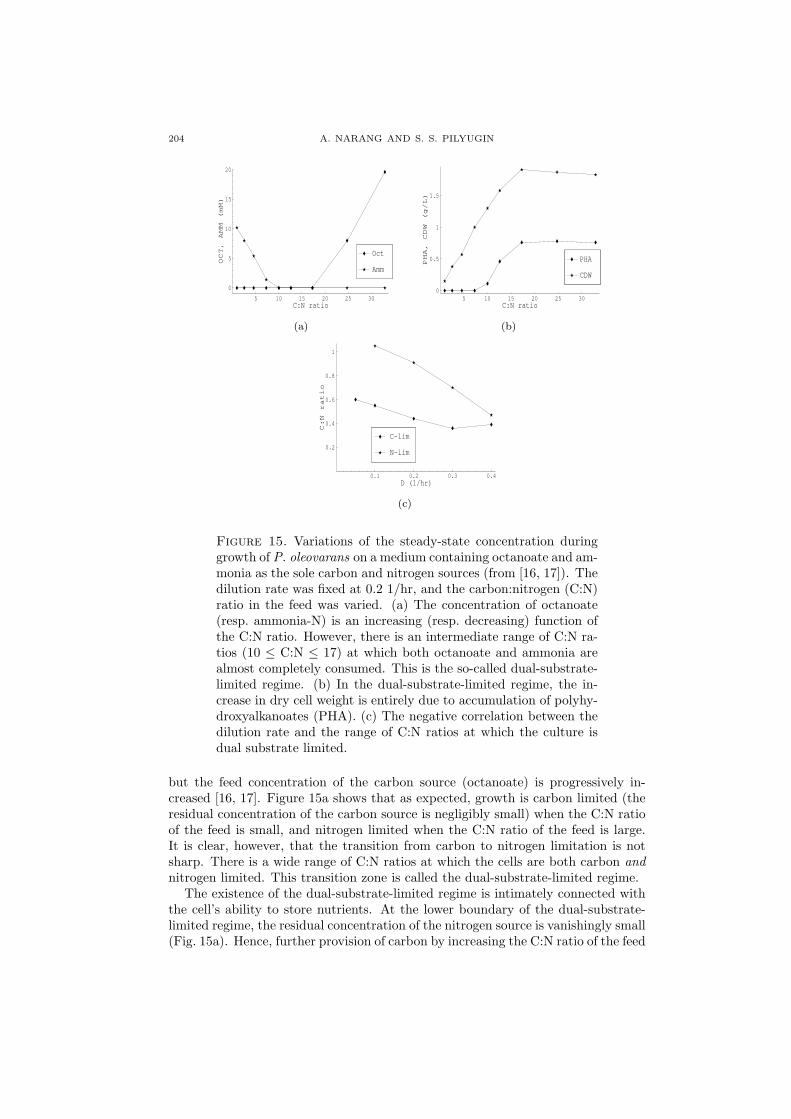
204 A. NARANG AND S. S. PILYUGIN
5 10 15 20 25 30C:N ratio
0
5
10
15
20
OCT, AMM (mM)
Amm
Oct
(a)
5 10 15 20 25 30C:N ratio
0
0.5
1
1.5
PHA, CDW (g/L)
CDW
PHA
(b)
0.1 0.2 0.3 0.4D (1/hr)
0.2
0.4
0.6
0.8
1
C:N ratio
N-lim
C-lim
(c)
Figure 15. Variations of the steady-state concentration duringgrowth of P. oleovarans on a medium containing octanoate and am-monia as the sole carbon and nitrogen sources (from [16, 17]). Thedilution rate was fixed at 0.2 1/hr, and the carbon:nitrogen (C:N)ratio in the feed was varied. (a) The concentration of octanoate(resp. ammonia-N) is an increasing (resp. decreasing) function ofthe C:N ratio. However, there is an intermediate range of C:N ra-tios (10 ≤ C:N ≤ 17) at which both octanoate and ammonia arealmost completely consumed. This is the so-called dual-substrate-limited regime. (b) In the dual-substrate-limited regime, the in-crease in dry cell weight is entirely due to accumulation of polyhy-droxyalkanoates (PHA). (c) The negative correlation between thedilution rate and the range of C:N ratios at which the culture isdual substrate limited.
but the feed concentration of the carbon source (octanoate) is progressively in-creased [16, 17]. Figure 15a shows that as expected, growth is carbon limited (theresidual concentration of the carbon source is negligibly small) when the C:N ratioof the feed is small, and nitrogen limited when the C:N ratio of the feed is large.It is clear, however, that the transition from carbon to nitrogen limitation is notsharp. There is a wide range of C:N ratios at which the cells are both carbon andnitrogen limited. This transition zone is called the dual-substrate-limited regime.
The existence of the dual-substrate-limited regime is intimately connected withthe cell’s ability to store nutrients. At the lower boundary of the dual-substrate-limited regime, the residual concentration of the nitrogen source is vanishingly small(Fig. 15a). Hence, further provision of carbon by increasing the C:N ratio of the feed
TOWARDS INTEGRATED PHYSIOLOGICAL THEORY OF MICROBIAL GROWTH 205
cannot support additional RNA and protein synthesis. Yet Figure 15a shows thatthe cells still consume the additional carbon since the residual concentration of thecarbon source remains negligibly small. Moreover, the additional carbon consumedmust result in the synthesis of some component of biomass because the cell densitycontinues to increase (Fig. 15b). It turns out that the additional carbon consumedis completely channeled into the storage component, polyhydroxyalkanoates (PHA).Synthesis of PHA persists until the cell’s capacity for storing PHA is saturated, atwhich point cells are unable to consume additional carbon in the feed, and it simplypasses through the reactor. Thus, storage provides a kind of “buffer” that smoothesthe transition from carbon to nitrogen limited growth.
Interestingly, the width of the dual-substrate-limited regime depends on the di-lution rate at which the experiment is performed. The larger the dilution rate, thesmaller the width of the transition zone (Fig. 15c). As the dilution rate approachesthe maximum specific growth rate, the width becomes zero.
The behavior can be captured by a slight modification of the kinetic schemeshown in Figure 1a. It turns out the ammonia is required for synthesis of aminoacids (M), which in turn are required for synthesis of proteins (C−) and RNA(R). Now, under nitrogen-limiting conditions, the exogenous ammonia levels arelow, the synthesis rates of amino acid, proteins, and RNA synthesis are necessarilysmall. Since the exogenous carbon is in excess, the cells respond by channelingthe excess carbon into carbohydrate (Ps). Now, the primary goal of a model isto predict Figure 15c, that is, the operating diagram that describes the regime ofdual substrate limitation in terms of the dilution rate and feed concentrations. Itseems to us that the achievement of this goal hinges upon the ability to predictthe relative rates of storage and RNA/protein synthesis. As mentioned above,energetics certainly plays a critical role in determining the relative rates of theseprocesses under carbon-limited conditions. The crux of the problem here is toascertain whether the energetic constraints also determine the relative rates of theseprocesses under nitrogen and dual-substrate-limited conditions.
5.3. Multiple species, multiple-substrate cultures. In [52, 53], we studiedmodels of pure competition. The pure competition models assume that differ-ent microbial species interact only by consuming and utilizing the substrates thusmaking these substrates unavailable to other competitors. In reality, interactionsbetween distinct species can be more complicated. A particularly interesting typeof interaction is commensalism in which one of the competing species excretes ametabolite that supports the growth of the other species. It is also conceivable thatthe interaction is amensalistic - one species excretes a toxic product that inhibitsthe growth of the other species.
The effects of such nonpure competition on the dynamics of mixed cultures canbe studied by modifying equations (42–44). For example, suppose that in the model(42–44), species C1 excretes a product S3 that supports the growth of species C2.We can include this new feature in the model by considering two additional massbalance equations for S3 and the corresponding peripheral enzyme E23 of the form
s3 = εrg1c1 −Ds3 − rs
23c2, rs23 = e23σ23, (45)
e23 = R23(s1, s2, s3, e21, e22, e23), (46)
and change the specific growth rate rg2 to
rg2 = Y21r
s21 + Y22r
s22 + Y23r
s23,

206 A. NARANG AND S. S. PILYUGIN
where the last term represents the increment in the specific growth of species 2 dueto consumption of S3. In [56], we studied this modification of the model numerically,but it lends itself equally well to analytical methods. Observe that if ε = 0, thenew model has the same behavior as (42–44), which we have already studied inconsiderable detail. The new model with small ε > 0 could be analyzed by usinglocal perturbation techniques, and then appealing to continuation arguments toextend the analysis to a broader parameter region.
Acknowledgment. The authors are grateful to Profs. Yang Kuang and Hal Smithfor their valuable comments. A part of this work was completed while S. S. P. wasvisiting the Mathematical Biosciences Institute at The Ohio State University.
Appendix A. Derivation of the reduced equations (19–25). Defining thedimensionless variables in (12–18) as
s ≡ s
sr, c ≡ c
sr, x ≡ x
xr, e ≡ e
er, r ≡ r
rr, p ≡ p
pr, c− ≡ c−
c−rt ≡ t
tr,
where
sr = sf , cr = sf , xr =√
VsVe
kx, er =
√Ve
Vs,
rr =√
VsVe
Vc, pr =
√VsVe
kco2, c−r = 1, tr = 1√
VsVe,
we obtain the dimensionless equations,
ds
dt= D(1− s)− rsc, (47)
dc
dt=
(rg − D
)c, (48)
de
dt= r+
e − r−e − rg e, (49)
dr
dt= r+
r − r−r − rg r, (50)
τxdx
dt= rs − rx − τxrgx, (51)
τpdp
dt= rx − rco2 −
(r+c − r−c
)− rr
(r+r − r−r
)− er
(r+e − r−e
)− τprg p, (52)
c− = 1− rr r − er e− xrx− prp, (53)
with dimensionless rates
rs ≡ e sKs+s
11+p/Ki
, r+e ≡ r
Ke+r
1+K2x2
K3+K2x2 , r−e = k−e e, r+r ≡ k+
r pr,
r−r = k−r r, rx ≡ x, rco2 ≡ p, r+c ≡ r p
Kc+p,
r−c ≡ k−c c−, rg ≡ rs − rco2 ,
and dimensionless parameters
D ≡ Dtr, Ks ≡ Ks
sr, Ki ≡ Ki
pr, Ke ≡ Ke
rr, K2 ≡ K2x
2r, k−e ≡ k−e tr,
k+r ≡ k+
r
kco2, k−r ≡ k−r tr, τx ≡ 1
kxtr, τp ≡ 1
kco2 tr, Kc ≡ Kc
pr, k−c ≡ k−c tr.

TOWARDS INTEGRATED PHYSIOLOGICAL THEORY OF MICROBIAL GROWTH 207
The quasi-steady-state assumption implies that τx, τp, er, xr, pr ¿ 1. Hence, equa-tions (51–53) can be approximated with
0 ≈ rs − rx,
0 ≈ rx − rco2 −(r+c − r−c
)− rr
(r+r − r−r
),
1 ≈ c− + rrr.
It follows from the first two equations that
rg ≡ rs − rco2 ≈(r+c − r−c
)+ rr
(r+r − r−r
).
In other words, X and P rapidly achieve quasi-steady state, and the specific growthrate during the subsequent motion is effectively the sum of the net specific proteinand RNA synthesis rates. Thus, we arrive at the equations
ds
dt= D(1− s)− rsc,
dc
dt=
(rg − D
)c,
de
dt= r+
e − r−e − rg e,
dr
dt= r+
r − r−r − rg r,
0 ≈ rs − rx,
0 ≈ rx − rco2 − rg,
c− ≈ 1− rr r.
The reduced equations (19–25) are obtained from these equations by reverting to theoriginal (dimensional) variables. This quasi-steady state is well defined, because theapproximate“slow”manifold is unique and globally attracting. To see this, considerthe approximate “fast” equations
x =Vse σ(s)1 + p
Ki
− kxx, (54)
p = kxx− kco2p− Vcrp
Kc + p− k+
r rp + k−r r + k−c c−, (55)
and treat the variables s, e, r, c− > 0 as (slowly varying) parameters. Then itfollows that
1. If x = 0 and p ≥ 0, then x > 0 due to (54). If p = 0 and x ≥ 0, then p > 0due to (55). Hence both x and p remain strictly positive at all times.
2. If p ≥ 0 and x becomes too large, namely, if x > Vseσkx
, then x < 0 dueto (54). Hence, x remains bounded at all times. Since x remains bounded,equation (55) implies that p also remains bounded.
3. For any combination s, e, r, c− > 0, the Jacobian of (54–55) has the form
J =∂(x, p)∂(x, p)
=( − −
+ −)
. (56)
This observation implies that(a) Since the divergence of (54–55) (equivalently, the trace of J) is negative
for all x, p ≥ 0, the system (54–55) cannot have periodic solutions. Sinceall positive solutions are bounded, every positive solution must converge

208 A. NARANG AND S. S. PILYUGIN
to a steady state. In addition, the signs of the off-diagonal entries of Jare such that the orbits in the (x, p) plane rotate counterclockwise.
(b) At any steady state of (54–55), we have that tr J < 0 and det J > 0.Thus all steady states must be stable. Therefore, only one positive steadystate of (54–55) must exist.
We conclude that for any combination s, e, r, c− > 0, the fast system (54–55)admits a unique globally attracting quasi-steady state (x, p). Hence, the QSSA iswell defined for all s, e, r, c− > 0.
REFERENCES
[1] R. Aris and A. E. Humphrey (1977), Dynamics of a chemostat in which two organismscompete for a common substrate, Biotechnol. Bioeng. 19, 1375–1386.
[2] F. Azam and A. Z. Worden (2004), Microbes, molecules, and marine ecosystems, Science 303,pp. 1622–1624.
[3] T. K. N. Baidya, F. C. Webb, and M. D. Lilly (1967), Utilization of mixed sugars in continuousfermentation. I., Biotechnol. Bioeng. 9, 195–204.
[4] M. Bally and T. Egli (1996), Dynamics of substrate consumption and enzyme synthesisin Chelatobacter heintzii during growth in carbon-limited continuous culture with differentmixtures of glucose and nitrilotriacetic acid (NTA), Appl. Environ. Microbiol. 62, 133–140.
[5] M. M. Ballyk and G. S. K. Wolkowicz (1993), Exploitative competition in the chemostat fortwo perfectly substitutable resources, Math. Biosci. 118, 127–180.
[6] B. C. Baltzis and A. G. Frederickson (1988), Limitation of growth rate by two complementarynutrients, Biotechnol. Bioeng. 31, 75–86.
[7] J. R. Beckwith and D. Zipser, The Lactose Operon, Cold Spring Harbor Laboratory, 1970.[8] H. Bremer and P. P. Dennis (1975), Transition period following a nutritional shift-up in
the bacterium Escherichia coli B/r: Stable RNA and protein synthesis, J. Theor. Biol. 52,365–382.
[9] U. Brinkmann and W. Babel (1992), Simultaneous utilization of heterotrophic substrates byHansenula polymorpha MH30 results in enhanced growth rates, App. Microbiol. Biotechnol.37, 98–103.
[10] G. J. Butler and G. S. K. Wolkowicz (1985), Exploitative competition in a chemostat for twocomplementary, and possibly inhibitory, resources, Math. Biosci. 83, 1–48.
[11] M. Cohn and K. Horibata (1959), Inhibition by glucose of the induced synthesis of the β-galactoside-enzyme system of Escherichia coli. Analysis of maintenance, J. Bacteriol. 78,601–602.
[12] C. L. Cooney, D. I. C. Wang, and R. I. Mateles (1976), Growth of Aerobacter aerogenes in achemostat with double nutrient limitations, Appl. Environ. Micorbiol. 31, 91–98.
[13] P. De Leenheer, S. A. Levin, E. D. Sontag, and C. A. Klausmeier (2003), Global stability ina chemostat with multiple nutrients, DIMACS technical report 2003-40.
[14] M. R. Droop (1974), The nutrient status of lagal cells in continuous culture, J. Mar. Biol.Assoc. UK 48, 689–733.
[15] M. R. Droop (1983), Twenty-five years of algal growth kinetics, a personal view, Botan. Mar.26, 99–112.
[16] R. Durner, B. Witholt, and T. Egli (2000), Accumulation of poly[(R)-3-hydroxyalkanoates]in Pseudomonas oleovarans during growth with octanoate in continuous culture at differentdilution rates, Appl. Env. Microbiol. 66, 3408–3414.
[17] R. Durner, M. Zihn, B. Witholt, and T. Egli (2001), Accumulation of poly[(R)-3-hydroxyalkanoates] in Pseudomonas oleovarans during growth in batch and continuous cul-ture with different carbon sources, Biotechnol. Bioeng. 72, 278–288.
[18] T. Egli, O. Kappeli, and A. Fiechter (1982), Mixed substrate growth of methylotrophic yeastsin chemostat culture: Influence of dilution rate on the utilization of a mixture of methanoland glucose, Arch. Microbiol. 131, 8–13.
[19] T. Egli, N. D. Lindley, and J. R. Quayle (1983), Regulation of enzyme synthesis and variationof residual methanol concentration during carbon-limited growth of Kloeckera sp. on mixturesof methanol and glucose, J. Gen. Microbiol. 129, 1269–1281.

TOWARDS INTEGRATED PHYSIOLOGICAL THEORY OF MICROBIAL GROWTH 209
[20] T. Egli, C. Bosshard, and G. Hamer (1986), Simultaneous utilization of methanol-glucosemixtures by Hansenula polymorpha in chemostat: Influence of dilution rate and mixturecomposition on utilization pattern, Biotechn. Bioeng. 28, 1735–1741.
[21] T. Egli (1995), The ecological and physiological significance of the growth of heterotrophicmicroorganisms with mixtures of substrates, Adv. Microbiol. Ecol. 14, 305–386.
[22] A. G. Frederickson and G. Stephanopoulos (1981), Microbial competition, Science 213, 972–979.
[23] M. E. Gilpin and K. E. Justice (1972), Nature 236, 273.[24] S. Gupta, S. S. Pilyugin, and A. Narang, Dynamics of single-substrate cultures: The role of
ribosomes, J. Theor. Biol., in press.[25] S. R. Hansen and S. P. Hubbell (1980), Single nutrient competiton: agreement between
experimental and theoretical forecast outcomes, Science 207, 1491–1493.[26] D. E. F. Harrison and H. H. Topiwala (1974), Transient and oscillatory states of continuous
culture, Adv. Biochem. Eng. 3, 167–219.[27] M. J. Harte and F. C. Webb (1967), Utilization of mixed sugars in continuous fermentation.
II., Biotechnol. Bioeng. 9, pp. 205-221.[28] R. J. Harvey (1970), Metabolic regulation in glucose-limited chemostat cultures of Escherichia
coli, J. Bacteriol. 104, 698–706.[29] S. B. Hsu, S. P. Hubbell, and P. Waltman (1977), A mathematical theory for single nutrient
competition in continuous cultures of micro-organisms, SIAM J. Appl. Math. 32, 366–383.[30] S. B. Hsu (1978), Limiting behavior for competing species, SIAM J. Appl. Math. 34, 760–763.[31] S. B. Hsu, K. S. Cheng, and S. P. Hubbell (1981), Exploitative competition of microorganism
for two complementary nutrients in continuous culture, SIAM J. Appl. Math. 41, 422–444.[32] D. Herbert, R. Elsworth, and R. C. Telling (1956), The continuous culture of bacteria: A
theoretical and experimental study, J. Gen. Microbiol. 14, 601–622.[33] K. F. Jensen and S. Pedersen (1990), Metanolic growth rate control in Escherichia coli may be
a consequence of subsaturation of the macromolecular biosynthetic apparatus with substratesand catalytic components, Microbiol. Rev. 54, 89–100.
[34] C. A. Klausmeier, E. Litchman, and S. A. Levin, Phytoplankton growth and stoichiometryunder multiple nutrient limitation. Limnol. Ocean., in press.
[35] S. Koga and A. E. Humphrey (1967), Study of the dynamic behavior of the chemostat system,Biotechnol. Bioeng. 9, 375–386.
[36] K. Kovarova, A. Kach, V. Chaloupka, and T. Egli (1996), Cultivation of Escherichia coli withmixtures of 3-phenylpropionic acid and glucose, Biodegradation, 7, 445–453.
[37] K. Kovarova-Kovar and T. Egli (1998), Growth kinetics of suspended microbial cells: Fromsingle substrate-controlled growth to mixed-substrate kinetics, Microbiol. Mol. Biol. Rev. 62(3), 646–666.
[38] T. Legovic and A. Cruzado (1997), A model of phytoplankton growth on multiple nutrientsbased on the Michaelis-Menten-Monod uptake, Droop’s growth and Liebig’s law, Ecol. Model.99, 19–31.
[39] U. Lendenmann, M. Snozzi, and T. Egli (1992), Simultaneous utilization of diauxic sugarmixtures by Escherichia coli, 6th International Symposium on Microbial Ecology, Abstracts,p. 254.
[40] J. A. Leon and D. B. Tumpson (1975), Competition between two species for two complemen-tary or substitutable substrates, J. Theor. Biol. 50, 185–201.
[41] J. Monod (1942), Recherches sur la croissance des cultures bacteriennes, Actualites Scien-tifique et Industrielles 911, p. 1-215.
[42] J. D. Murray, Mathematical Biology, Biomethematics Texts, Springer-Verlag, New York,1989.
[43] S. Nagai, Y. Nishizawa, I. Endo, and S. Aiba (1968), Response of a chemostatic culture ofAzotobacter vinelandii to a delta type pulse of glucose, J. Gen. Appl. Microbiol. 14, 121–134.
[44] A. Narang, A. Konopka, and D. Ramkrishna (1997), The dynamics of microbial growth onmixtures of substrates in batch reactors, J. Theor. Biol. 184, 301–317.
[45] A. Narang, A. E. Konopka, D. Ramkrishna (1997), New patterns of mixed-substrate utiliza-tion during batch growth of Escherichia coli K12. Biotech. Bioeng. 55, 747–757.
[46] A. Narang (1998), The dynamical analogy between microbial growth on mixtures of substi-tutable substrates and population growth of competing species, Biotech. Bioeng. 59, 116–121.
[47] A. Narang (1998), The steady states of microbial growth on mixtures of substitutable sub-strates in a chemostat, J. Theor. Biol. 190, 241–261.

210 A. NARANG AND S. S. PILYUGIN
[48] F. C. Neidhardt, J. L. Ingraham, and M. Schaechter, Physiology of the Bacterial Cell: AMolecular Approach, Frank Sinauer Associates, Sunderland, Massachusetts, 1990.
[49] O. M. Neijssel, S. Hueting, and D. W. Tempest (1977), Glucose transport capacity is not therate-limiting step in the growth of some wild-type strains of Escherichia coli and Klebsiellaaerogenes in chemostat culture, FEMS Microbiol. Lett. 2, 1–3.
[50] J. Nielsen and J. Villadsen (1992), Modeling of microbial kinetics, Chem. Eng. Sci. 47, pp.4225–4270.
[51] R. W. O’Brien, O. M. Neijssel, and D. W. Tempest (1980), Glucose phosphoenolpyruvatephosphotransferase activity and glucose uptake rate of Klebsiella aerogenes growing in achemostat culture, J. Gen. Microbiol. 116, 305–314.
[52] S. S. Pilyugin, G. T. Reeves, and A. Narang, Predicting stability of mixed microbial culturesfrom single species experiments: 1. Phenomenological model, in press.
[53] S. S. Pilyugin, G. T. Reeves, and A. Narang, Predicting stability of mixed microbial culturesfrom single species experiments: 2. Physiological model, in press.
[54] S. S. Pilyugin and P. Waltman (2003), Multiple limit cycles in the chemostat with variableyield, Math. Biosci. 182, 151–166.
[55] E. O. Powell (1958), Criteria for growth of contaminants and mutants in continuous culture,J. Gen. Microbiol. 18, 259–268.
[56] G. T. Reeves, A. Narang, and S. S. Pilyugin (2004), Growth of mixed cultures on mixturesof substitutable substrates: The operating diagram for a structured model, J. Theor. Biol.226, 143–157.
[57] J. Shoemaker, G. T. Reeves, S. Gupta, S. S. Pilyugin, T. Egli, and A. Narang (2003), Thedynamics of single-substrate continuous cultures: The role of transport enzymes, J. Theor.Biol. 222, 307–322.
[58] H. L. Smith and P. Waltman, The Theory of the Chemostat, Cambridge University Press,Cambridge, UK, 1995.
[59] D. W. Tempest, D. Herbert, and P. J. Phipps, Studies on the growth of Aerobacter aerogenesat low dilution rates in a chemostat, In Microbial Physiology and Continuous Culture, pp.240–253, HMSO, London, 1967.
[60] H. R. Thieme (1994), Asymptotically autonomous differential equations in the plane, RockyMount. J. Math. 24, 351–380.
[61] D. Tilman (1980), Resources: a graphical-mechanistic approach to competition and predation,Am. Nat. 116 (3), 362–393.
[62] D. Tilman, Resource Competition and Community Structure, Princeton University Press,1982.
[63] A. J. Watson and J. C. Orr, Carbon dioxide fluxes in the ocean. In: Ocean biogeochemistry(M. J. R. Fasham, Ed.), Chapter 5, pp. 123-141, Springer-New York, 2003.
[64] G. S. Wolkowicz and Z. Lu (1992), Global dynamics of a mathematical model of competitionin the chemostat: General response functions and differential death rates, SIAM J. Appl.Math. 52, 222–233.
[65] H. S. Yun, J. Hong, and H. C. Lim (1996), Regulation of ribosome synthesis in Escherichiacoli: Effects of temperature and dilution rate changes, Biotechnol. Bioeng. 52, 615–624.
[66] M. L. Zeeman (1993), Hopf bifurcations in competitive three-dimensional Lotka-Volterrasystems, Dyn. Stab. Sys. 8(3), 189–217.
[67] X. Zhang, P. Dennis, M. Ehrneberg, and H. Bremer (2002), Kinetic properties of rrn prop-moters in Escherichia coli, Biochimie 84, 981–996.
Received on Sept. 2, 2004. Revised on Oct. 21, 2004.
E-mail address: [email protected]
E-mail address: [email protected]