towards an ideal store
TRANSCRIPT
Towards an Ideal Store
Searching for Consumer-Inspired Structures in Product Networks
Kate Li, ISOM, Sawyer Business SchoolZhen Zhu, Marketing, Sawyer Business School
Dmitry Zinoviev, Mathematics and Computer Science, College of Arts and Sciences
Suffolk University, Boston MA
05/29/2015 2
Directions of Research
● “Product Sets”– Identify product sets*—short-term consumer-
inspired purchase patterns
● “Ideal Store”– Rearrange store departments based on the
consumer purchasing behavior
● “Consumer Projects”– Identify consumer projects—long-term consumer-
inspired purchase patterns
*Formerly known as “tiles”
05/29/2015 3
Directions of Research
● “Product Sets”– Identify product sets*—short-term consumer-
inspired purchase patterns
● “Ideal Store”– Rearrange store departments based on the
consumer purchasing behavior
● “Consumer Projects”– Identify consumer projects—long-term consumer-
inspired purchase patterns
*Formerly known as “tiles”

05/29/2015 4
Product Network
● Pairs of products frequently purchased together– “Together”—within a 4-week window
– “Frequently”—statistically more often than by pure chance
● Arrange the products in a product network– 16,000 products (1.4% of all Store products)
– 142,412 connections
05/29/2015 5
Core Products
● Core Products: Products that are frequently purchased together with too many other, seemingly unrelated, products
● Such as: sodas, buckets, wood studs, paint trays, top soil
● Core products are also staples: they are the most frequently purchased products
● The core products pollute the network– Remove the products with 210 connections or
more from the network!
05/29/2015 6
Product Sets
● Identify retailing-related geometric patterns in the product network—product sets
● The product sets are represented as new nodes in the product network—the synthetic nodes (synodes)
● Synthetic nodes represent consumers' purchasing choices!
05/29/2015 7
Cliques
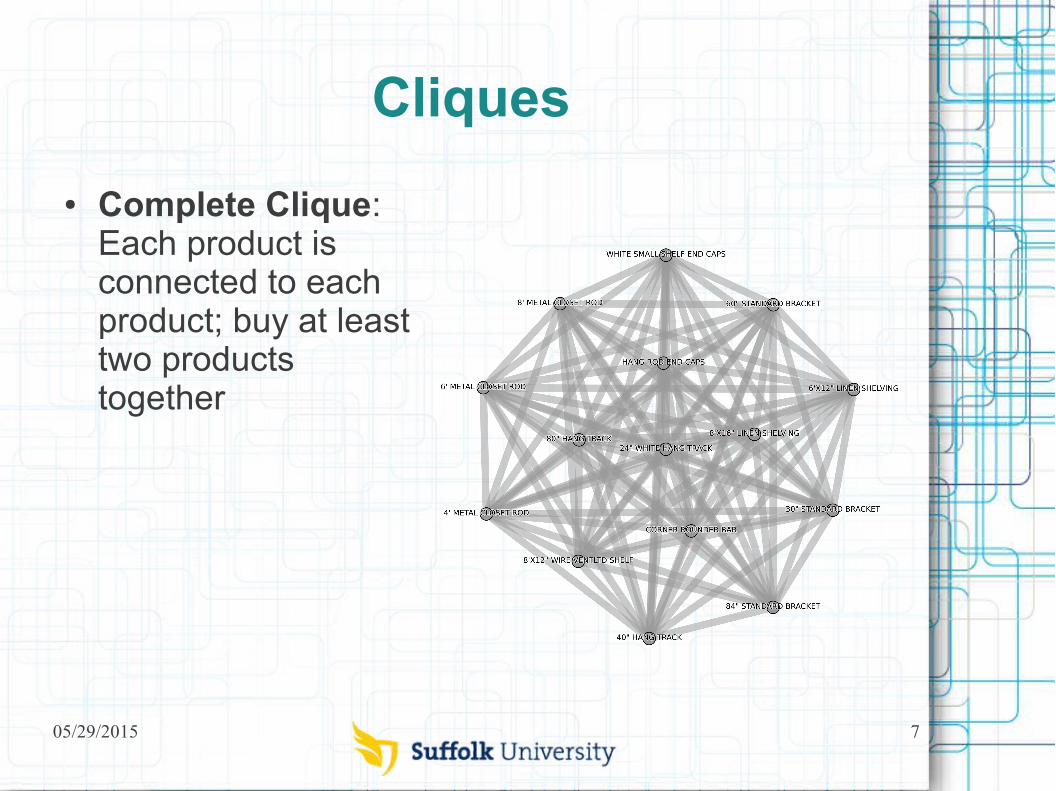
● Complete Clique: Each product is connected to each product; buy at least two products together

05/29/2015 8
Stars
● Star: The hub is connected to each leaf; all leaves disconnected; buy the hub and exactly one leaf
● Substitutable products!
05/29/2015 9
Pendants and Chains
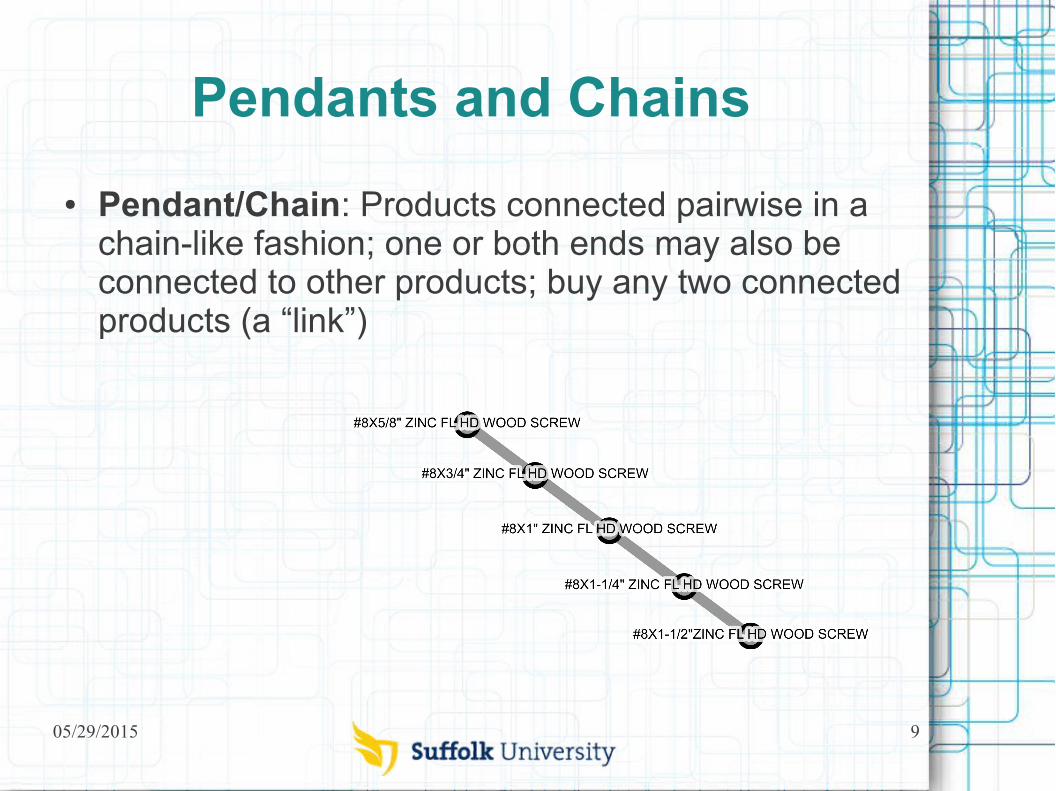
● Pendant/Chain: Products connected pairwise in a chain-like fashion; one or both ends may also be connected to other products; buy any two connected products (a “link”)
05/29/2015 10
Wheels
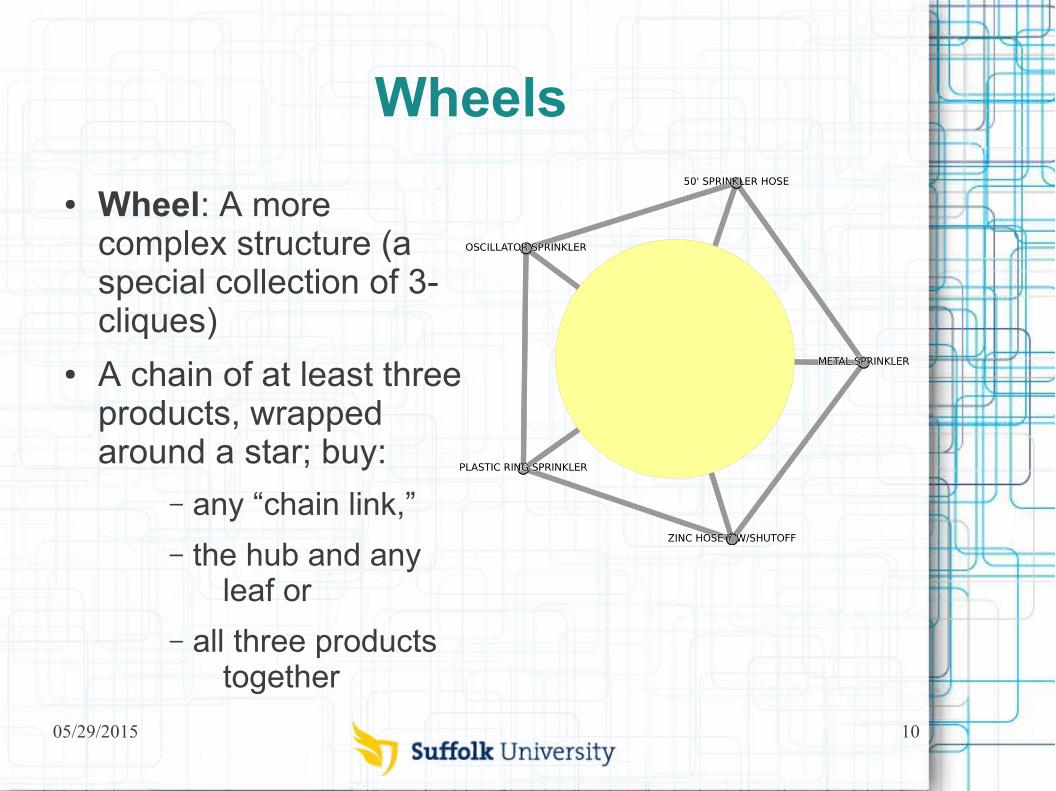
● Wheel: A more complex structure (a special collection of 3-cliques)
● A chain of at least three products, wrapped around a star; buy:
– any “chain link,”
– the hub and any leaf or
– all three products together

05/29/2015 11
Hierarchical Synodes
● Replace the original products with the product sets (synodes) and repeat the discovery process until no more synodes are found
● Get wheels of chains, chains of cliques, stars of stars, etc.
● New product network:– 9,765 products (was: 16,000)
– 27,698 connections (was: 142,412)
● Inspired by consumer purchasing behavior● Easier to analyze (smaller, more modular)
05/29/2015 12
Directions of Research
● “Product Sets”– Identify product sets*—short-term consumer-
inspired purchase patterns
● “Ideal Store”– Rearrange store departments based on the
consumer purchasing behavior
● “Consumer Projects”– Identify consumer projects—long-term consumer-
inspired purchase patterns
*Formerly known as “tiles”
05/29/2015 13
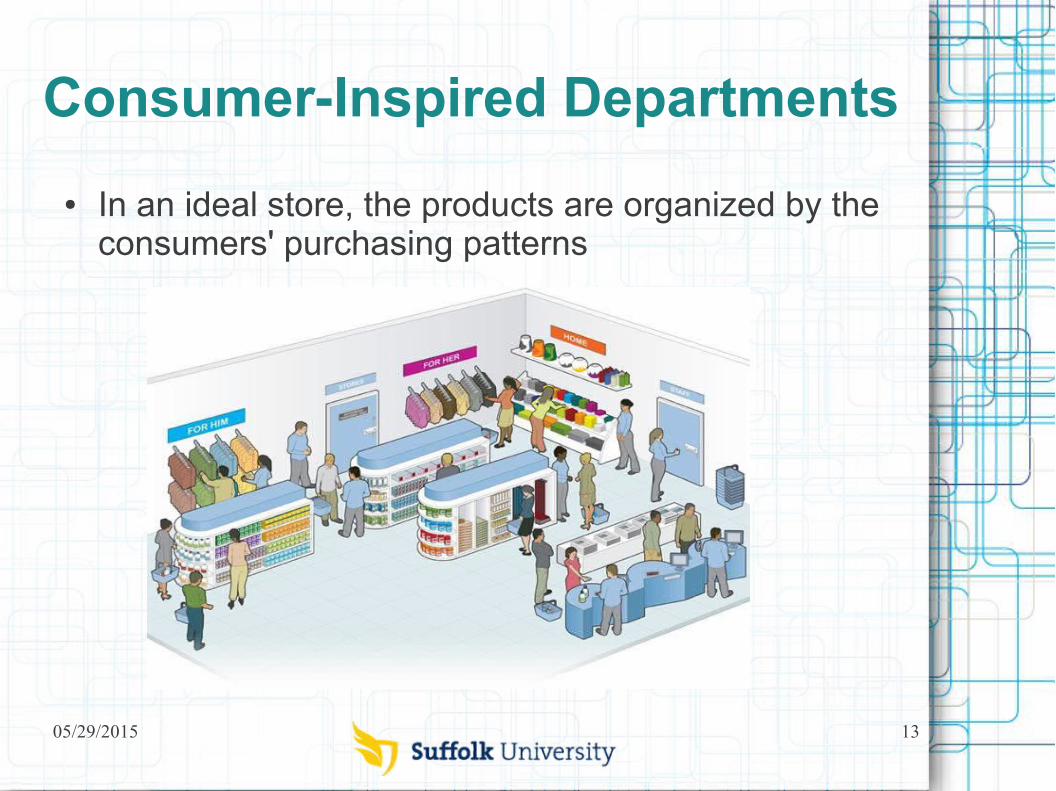
Consumer-Inspired Departments
● In an ideal store, the products are organized by the consumers' purchasing patterns

05/29/2015 14
Ideal Store Construction
● Start with the product network● Replace frequently purchased products with product
sets (synodes)● Detect communities in the new product network
– If two products belong to the same product set, they are represented by one synode and are guaranteed to be in the same community
● Rearrange products based on the community structure
05/29/2015 15
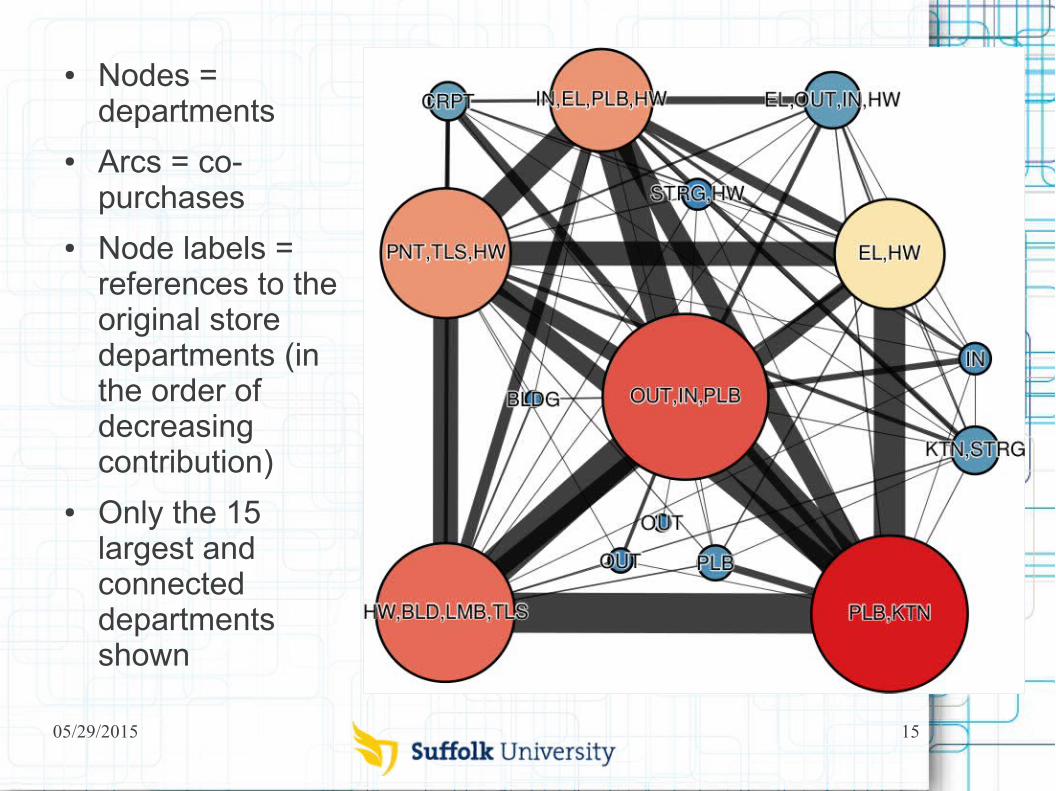
● Nodes = departments
● Arcs = co-purchases
● Node labels = references to the original store departments (in the order of decreasing contribution)
● Only the 15 largest and connected departments shown

05/29/2015 16
How Ideal Is “Ideal”?● Compare the performance of
the “ideal” store and the brick-and-mortar (B&M) store:
― Use purchasing data
― Count the number of visited departments, based on the products (real or synthetic) in each of the 491,511 baskets that has at least one item sold in the “ideal” store

05/29/2015 17
“Real” ≠ “Ideal”!
● The “ideal” store performs almost twice better than the B&M store!
– The average basket contains the products from the same number of department
– However, an “ideal” department is smaller than a B&M department
“Ideal” store B&M storeDepartments per basket (absolute)
1.42 1.41
Departments per basket (relative)
0.04 (4%) 0.08 (8%)
05/29/2015 18
Directions of Research
● “Product Sets”– Identify product sets*—short-term consumer-
inspired purchase patterns
● “Ideal Store”– Rearrange store departments based on the
consumer purchasing behavior
● “Consumer Projects”– Identify consumer projects—long-term consumer-
inspired purchase patterns
*Formerly known as “tiles”

05/29/2015 19
This part is exploratory so far!
05/29/2015 20
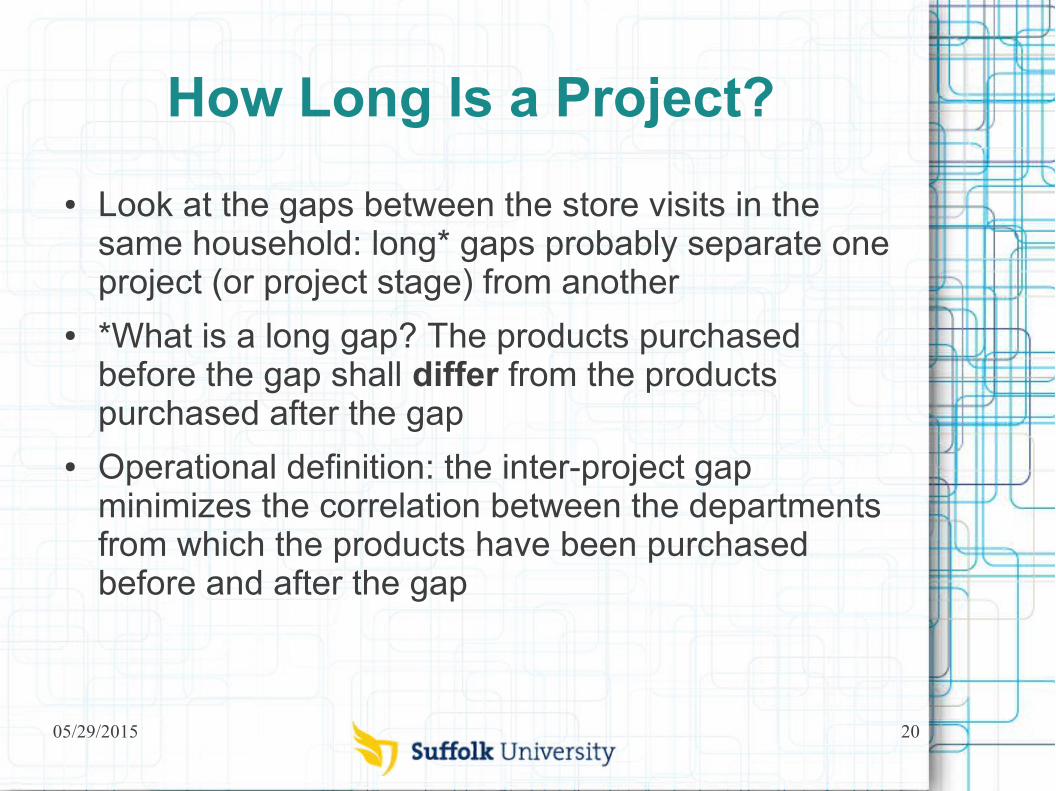
How Long Is a Project?
● Look at the gaps between the store visits in the same household: long* gaps probably separate one project (or project stage) from another
● *What is a long gap? The products purchased before the gap shall differ from the products purchased after the gap
● Operational definition: the inter-project gap minimizes the correlation between the departments from which the products have been purchased before and after the gap

05/29/2015 21
Correlation between Projects
0 7 14 21 28 35 42 490.22
0.23
0.24
0.25
0.26
0.27
0.28
0.29
0.30
0.31
0.32
Real store “Ideal” store
Minimal gap between projects, days
Co
rre
latio
n b
etw
ee
n p
roje
cts
Smallest correlation
area
05/29/2015 22
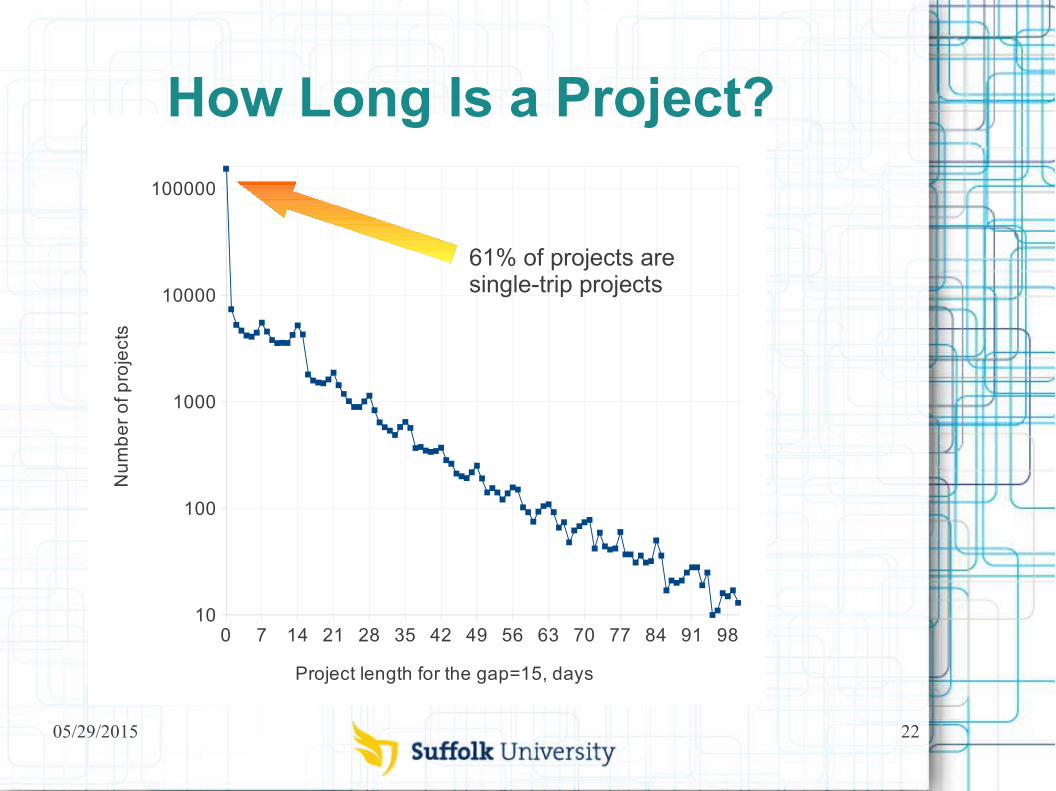
0 7 14 21 28 35 42 49 56 63 70 77 84 91 9810
100
1000
10000
100000
Project length for the gap=15, days
Nu
mb
er
of p
roje
cts
How Long Is a Project?
61% of projects are single-trip projects
05/29/2015 23
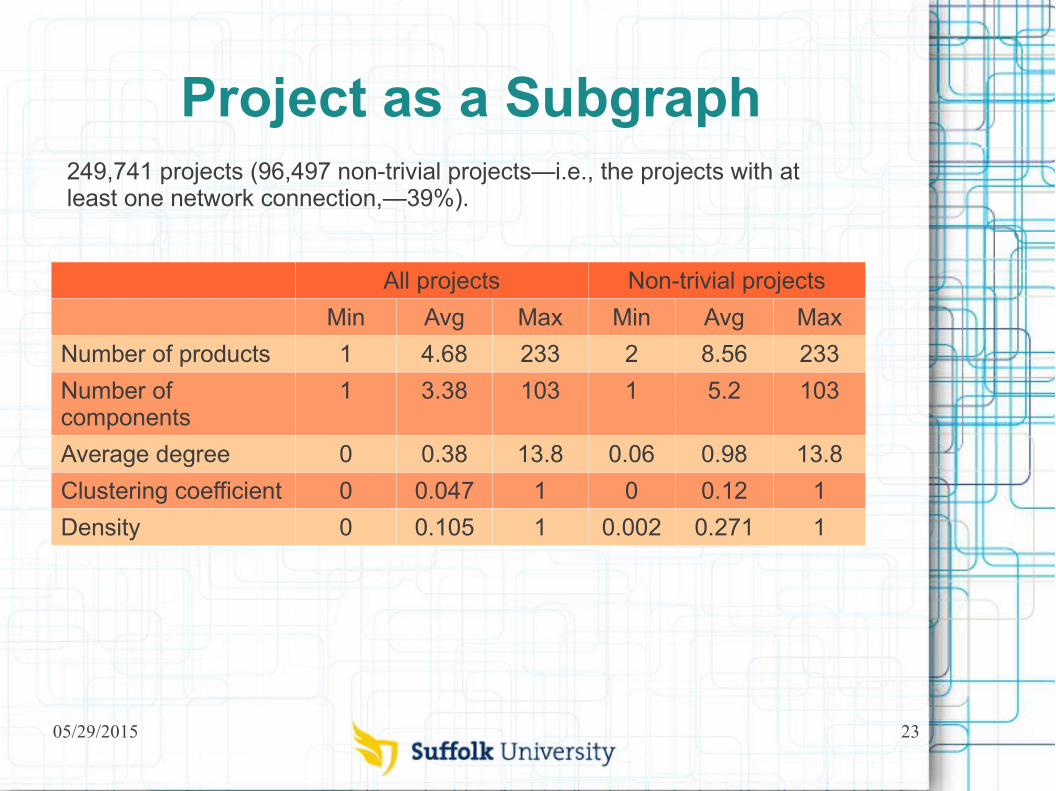
Project as a Subgraph
All projects Non-trivial projects
Min Avg Max Min Avg Max
Number of products 1 4.68 233 2 8.56 233
Number of components
1 3.38 103 1 5.2 103
Average degree 0 0.38 13.8 0.06 0.98 13.8
Clustering coefficient 0 0.047 1 0 0.12 1
Density 0 0.105 1 0.002 0.271 1
249,741 projects (96,497 non-trivial projects—i.e., the projects with at least one network connection,—39%).
05/29/2015 24
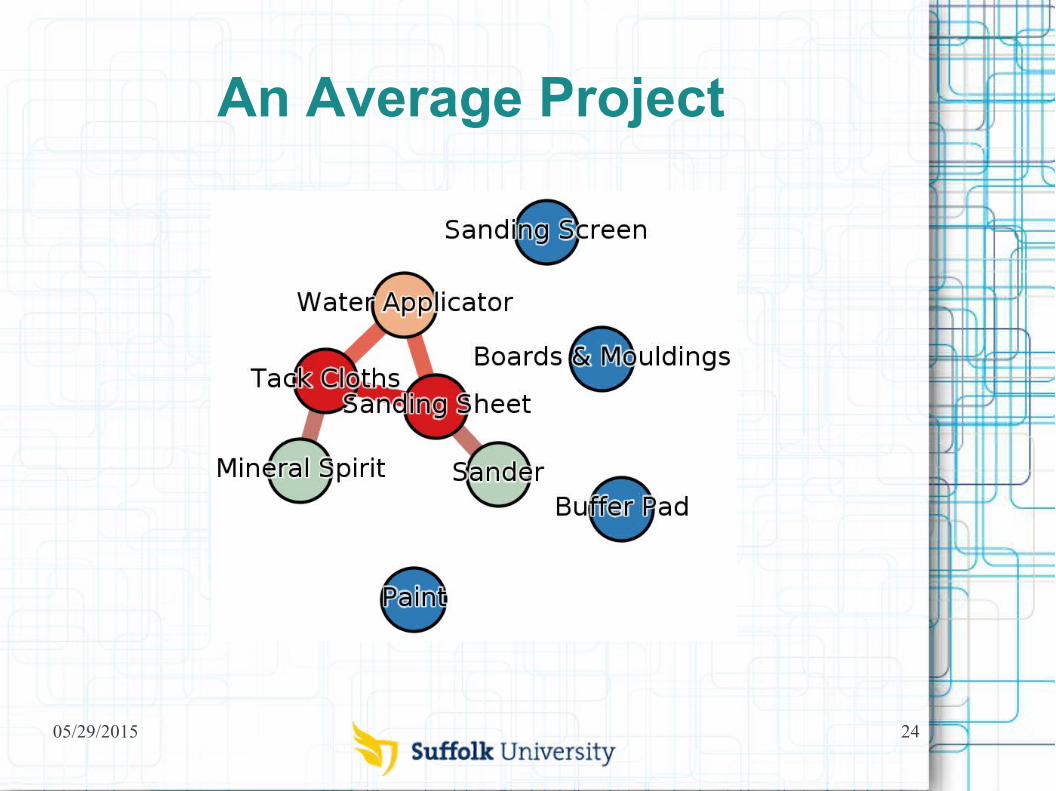
An Average Project

05/29/2015 25
We just started working on this. Next stage: Unification and Classification of the extracted
projects.