towards an effective segmentation framework for the
TRANSCRIPT

Towards an Effective Segmentation Framework for the KwaZulu-Natal
International Market (Eighth Edition)
Volume 1
Original Author: James Seymour 8th Edition updates compiled by: Karen Kohler Date: September 2014

Towards an effective Segmentation Approach for the KwaZulu-Natal International Tourism Market (8th Edition) Volume 1
2
TABLE OF CONTENTS Page 1. Introduction 3
2. South African Tourism’s Approach to the Segmentatio n of the South
African International Tourism Market
6
3. The Nature and Extent of the KwaZulu -Natal Foreign Tourism Market 11 3.1 Size of the market and country of residence 3.2 Purpose of visit 3.3 Destinations visited 3.4 Length of Stay 3.5 Value of this market 3.6 Core activities 3.7 Seasonal flow
4. Tourism KwaZulu -Natal’s Current Broad Segmentation and Targeting Approach
14
5. Segmenting the British Market 16 5.1 Introduction 5.2 Regional Distribution 5.3 Importance of the UK travellers to South Africa 5.4 South African Tourism’s Segmentation of the British (UK) Market 5.5 British Tour Operators
6. Segmenting the German Market 33 6.1 Introduction 6.2 Regional Distribution of the German Market 6.3 6.4
Importance of German Travellers to South Africa South African Tourism’s Segmentation of the German Market
6.5 German Tour Operators
7. Segmenting the USA Market 39 7.1 Introduction 7.2 Regional Distribution of the South African USA Market 7.3 South African Tourism’s Segmentation of the USA Market 7.4 USA Tour Operators
8. Special Focus on the Bric Market
47
9. Conclusions and Recommendations
48
Appendices Appendix A - Descriptions: Next Stop South Africa (NSSA) and the Wanderlusters Appendix B - Descriptions: SAT’s Focus Segments - UK Market Appendix C - Descriptions: SAT’s Focus Segments - German Market Appendix D - Descriptions: SAT’s Focus Segments - USA Market

Towards an effective Segmentation Approach for the KwaZulu-Natal International Tourism Market (8th Edition) Volume 1
3
Towards an Effective Segmentation Framework for the KwaZulu-Natal International Tourism Market (Eighth Edition) Volume 1 1. INTRODUCTION This eighth edition of the segmentation framework is based on the seven previous editions which were developed by Mr James Seymour. This report is thus the continuation of the series and was compiled using updated information, where possible. The purpose of this report is to put forward a broad segmentation framework or approach for the KwaZulu-Natal (KZN) International Tourism Market, and a more specific framework for this province’s primary foreign tourism markets, namely the United Kingdom and Germany, as well as the key US market which has shown signs of significant growth over the past seven years. This approach will be refined over time as more relevant data regarding the South African and KZN international tourism market becomes available. This report is intended to guide the international segmentation and targeting decisions of the management team of Tourism KwaZulu-Natal (TKZN). One of the core aspects of the framework on which TKZN’s Tourism Strategy 2008 – 2012 is based is an effective understanding of the KZN tourism market and the careful selection of attractive segments within that market. The approach as contained in the most recent strategy document, Strategy 2014-2019, varies little from that. Segmentation is one of the most important elements of a marketing strategy. This concept can be defined as the process of apportioning markets into segments of potential customers with similar characteristics who are likely to exhibit similar purchasing or travel behaviour. Market segmentation is based on assumptions regarding the behaviour of population subgroups. The key assumption is that not all groups will behave in the same way towards products since these groups have different needs, motivations, spending power and the like. Businesses can therefore be more effective if they concentrate their marketing efforts on the most likely buyer groups, these being the markets whose needs can be satisfied by the products or services offered by those specific businesses. Segmentation leads to more effective resource allocation since it usually leads to the targeting of fewer people and thus less marketing communication spend for each individual likely to purchase a particular product or service. Market segmentation is part of a three-step process that involves:
- Studying the demand preferences of buyers;
- Forecasting how many people will be likely to use a particular product or service; and
- Breaking the overall population into groups of people with similar needs.

Towards an effective Segmentation Approach for the KwaZulu-Natal International Tourism Market (8th Edition) Volume 1
4
Some of the key conditions or characteristics that each segment should portray are the following – they should be:
- Measurable – size of the segment, how many buy certain products and services etc.
- Accessible – must be able to reach them by advertising, sales promotions etc.
- Substantial – must be large enough to provide a viable level of business.
- Sustainable – must last for a reasonable period of time.
- Actionable – must be possible to influence them. There are a number of methods that can be utilised to segment a tourism market:
- Purpose of visit – holiday/leisure, business or visiting friends and relatives
- Geographic location – place of residence
- Socio-economic / demographic – age group, gender, income etc.
- Channel of distribution – whether or not they use travel agents or tour operators to book a tourism trip.
- Product-related – type of tourism experience or product that appeals to tourists.
- User frequency / seasonality – how often they travel.
- Psychographic – values, attitudes, preferred and actual tourism activities.
Segmentation is the first step required to develop a targeting and positioning strategy for a particular tourism destination. Targeting is the process of selecting the most attractive segment or segments to achieve desired objectives. A product’s position is the way the product is defined by consumers according to important attributes – the place the product occupies in consumer’s minds relative to competing products. There are a number of factors that can be used to position a tourism product or service:
• Specific product attributes such as price and product features. There are two choices – cheap or providing right attractions. For example, the Hilton uses the reliability their brand provides to attract business customers.
• Needs that products fill or the benefits they offer. Psychographic segmentation is
useful when a product can appeal to a specific need. A restaurant can be positioned as a fun place, for example.
• Certain classes of users. People, especially the right people, can be used to attract
other people. By studying reference groups and identifying a product or service with them in a believable way, the right users can be attracted.

Towards an effective Segmentation Approach for the KwaZulu-Natal International Tourism Market (8th Edition) Volume 1
5
• Against existing competitors. Advertising the competitive advantages of a product
against those of its competitors. What should also be kept in mind is the enormous potential for growth:
Figure 1: Present travel intensity

Towards an effective Segmentation Approach for the KwaZulu-Natal International Tourism Market (8th Edition) Volume 1
6
2. SOUTH AFRICAN TOURISM’S APPROACH TO THE SEGMENTATIO N OF THE SOUTH AFRICAN INTERNATIONAL TOURISM MARKET
The mandate of South African Tourism (SAT) is three-fold i.e. sustainable GDP growth, sustainable job creation and redistribution and transformation. This is undertaken through key objectives which relate to increases in:
• Tourist volume • Tourist spend • Length of stay • Geographic spread • Transformation • Decreased seasonality
Figure 2: SAT’s Mandate and Strategic Objectives (SAT, 2013) On this basis, SAT has been able to identify a portfolio of markets on which to focus its marketing efforts. This is illustrated in Figure 3, which is based on the focus period of 2014-2016.

Towards an effective Segmentation Approach for the KwaZulu-Natal International Tourism Market (8th Edition) Volume 1
7
Copyright © 2012 SA Tourism0
SA Tourism portfolio 2014 – 2016: The domestic market is a core market that
forms the base on which the tourism growth is built
AFRICA AMERICAS & the UK ASIA & AUSTRALASIA EUROPE & the UK
CORE MARKETS Angola
Domestic
Kenya
Mozambique
Nigeria
Tanzania
USA
Brazil
Australia
India
South Korea
France
Germany
Netherlands
UK
INVESTMENT MARKETS
DRC
Lesotho
Zimbabwe
Uganda
Canada China (incl. Hong Kong)
Japan
Italy
TACTICAL
MARKETS
Botswana
Ghana
Namibia
Zambia
Egypt
Singapore Switzerland
WATCH-LIST
MARKETS
Swaziland
Malawi
Tunisia
Canada Austria
Belgium
Denmark
Norway
Sweden
Turkey
STRATEGIC
IMPORTANCE
Israel Argentina
STRATEGIC LINKS/HUBS
Saudi Arabia Taiwan Russia
Countr
y M
anager
Port
folio M
anag
er
Stakehold
er
Manager
Glo
bal
Channel
Manage
r
Responsibility
Figure 3: SAT’s Portfolio of Markets (SAT, 2014) In addition to selecting the portfolio of markets, SAT has also developed a consumer segmentation model for the following reasons:
1. To understand how the market is structured at a consumer level 2. To understand the relative size and value in the market as well as objectively show
the relative contribution of the segments 3. Allow SAT to identify the levers in the market that need to be pulled to activate the
segment The key focus segments for SAT are illustrated in Figure 4 and they are the ‘Wanderluster’ and the ‘Next Stop South Africa’ (NSSA) segments. A brief description of the segments follows: a) The Wanderlusters This segment consists of young couples or single people between the ages of 25-40. They are professionals with higher income and have a considerable amount of travel experience. b) The NSSAs The NSSAs are wealthier and experienced travellers. They are between the ages of 40-60 and prefer to be in a small group of travellers. For a detailed description of these segments, please refer to Appendix A .

Towards an effective Segmentation Approach for the KwaZulu-Natal International Tourism Market (8th Edition) Volume 1
8
Figure 4: Focus Segments (SAT, 2010) These two segments are briefly outlined thus:

Towards an effective Segmentation Approach for the KwaZulu-Natal International Tourism Market (8th Edition) Volume 1
9
Figure 5: Wanderlusters and NSSAs There is growth in potential target markets as illustrated in Figure 6 which shows the size of consumers in 11 markets relative to the international arrivals to South Africa in 2009. What this suggests is that there is potential for growth if South Africa was to apply the segmentation and targeting approach effectively.

Towards an effective Segmentation Approach for the KwaZulu-Natal International Tourism Market (8th Edition) Volume 1
10
Figure 6: Growth Potential: SAT’s Target Market (SAT, 2010)

Towards an effective Segmentation Approach for the KwaZulu-Natal International Tourism Market (8th Edition) Volume 1
11
3. THE NATURE AND EXTENT OF THE KWAZULU-NATAL FOREIGN TOURISM MARKET
3.1 Size of the market and country of residence In 2010, it was estimated that 956,550 million foreign tourists visited KZN. KZN’s long haul foreign tourists tend to be residents of the following regions: Table 1: KZN’s Top Long Haul Source Markets :
(TKZN 2014) The province’s ‘land departure tourists’ mainly originate from:
• Swaziland • Lesotho • Zimbabwe • Mozambique • Botswana
3.2 Purpose of Visit The majority of foreign visitors that departed South Africa by air visited KZN mainly for holiday purposes. This is reflected in Table 2 below. Table 2: Purpose of Visit to KZN – Overseas and Afr ican Air Departures
Purpose % Holiday 57.5% Business 18.6% VFR 18.8% Other 5.1%
(TKZN, 2013) In 2012, almost 58% of foreign visitors to KZN that departed South Africa through the border posts visited the province for holiday reasons. However, in that same year, the majority of land departures (37.6%) visited KZN for business purposes (see Table 3 ), giving an indication of the difference in behavior patterns between air and land arrivals to the province.
2013 2012 2011 2010 2009 1. USA 1. UK 1. UK 1. UK 1. UK 2. UK 2. USA 2. USA 2. USA 2. USA 3. Germany 3. Germany 3. Germany 3. Germany 3. France 4. India 4. India 4. France 4. France 4. Germany 5. Australia 5. Netherlands 5. Netherlands 5. Australia 5. Netherlands 6. France 6. Australia 6. Australia 6. Netherlands 6. Australia

Towards an effective Segmentation Approach for the KwaZulu-Natal International Tourism Market (8th Edition) Volume 1
12
Table 3: Purpose of Visit to KZN – Land Departures Purpose %
Holiday 32.7% Business 37.6% VFR 23.8% Other 3%
(TKZN, 2013) 3.3 Destinations Visited The majority of foreign visitors to KZN that departed South Africa either by air or land visited the Durban Metro. The second most visited destination in the province was the Elephant Coast. Many foreign tourists, however, visit more than one destination as they tend to move through the province rather than stay in one place. Table 4: Destinations Visited in KZN by Overseas an d African Air Departures in 2011
Destination *% Durban 70.3% Pietermaritzburg 8.4% Zululand 14.5% Drakensberg 15.8% Elephant Coast 22.3% North Coast 13.6% South Coast 8.1% Battlefields 3.3%
(TKZN, 2012) *The above figures do not add up to 100% because people tend to visited more than one destination. 3.4 Length of Stay KZN’s foreign tourists stayed for an average of 8.5 nights in 2013, an increase over the 6.9 nights of the previous year. 3.5 Value of this Market In 2013, the KZN foreign tourism market was estimated to be worth at least R6.1 billion. It was also estimated that the average spend of a foreign tourists was in the order of ±R7 201 per person per trip. 3.6 Core Activities The core activities that were undertaken in KZN by foreign visitors who departed South Africa by air were as follows:

Towards an effective Segmentation Approach for the KwaZulu-Natal International Tourism Market (8th Edition) Volume 1
13
Table 5: Some Activities Undertaken in KZN – Africa n Air Departure and Overseas Visitors 2012 Land Africa Air Rest of World Nightlife 48.7% 49.2% 65.4% Shopping 81.6% 64.8% 62.8% Visiting natural attractions 9.3% 24.7% 47.9% Beach 43.0% 56.3% 51.6% Wildlife 5.0% 14.7% 38.3% Cultural, historical and heritage 11.4% 18.2% 26.1% Social 49.8% 27.7% 26.3% Business 6.6% 31.8% 24.0% Theme parks 8.4% 22.5% 21.3% Adventure 0.0% 9.7% 17.7% Visited a Casino 5.1% 19.6% 11.5% Sporting - spectator 0.0% 0.0% 2.6% Education 2.5% 7.2% 3.3% Sporting - competed 0.0% 0.0% 1.8% Hunting 0.0% 0.0% 1.2% Medical 0.0% 0.0% .7% Health 3.2% 9.7% 5.7% Trading 6.8% 5.2% 2.3% (TKZN, 2013) 3.7 Seasonal Flow The main period for foreign tourism flow in KZN, especially overseas flow, is the period of October to April, as illustrated below in Figure 6. In 2009-2010, KZN experienced a lower number of foreign visitors during February, March and April compared to the previous years. As regards 2009, it is possible that the country was still affected by the economic downturn during that time. With regards to 2010, it is possible that foreign visitors postponed their visit to coincide with the 2010 FIFA World Cup which took place in June-July 2010. The world cup effect is clearly visible with the significant peak in overseas arrivals during June of 2010. Subsequently, the overseas arrival pattern reverted to what it had been prior to the 2010 World Cup.

Towards an effective Segmentation Approach for the KwaZulu-Natal International Tourism Market (8th Edition) Volume 1
14
Figure 7: Seasonal Flow of Overseas and African Air Arrival Tourists (TKZN, 2014) 4. TOURISM KWAZULU-NATAL’S CURRENT BROAD SEGMENTATION AND
TARGETING APPROACH TKZN stipulated in its tourism strategy for the period 2008 – 2012 that its international marketing strategy would be closely aligned behind the marketing efforts of SAT, the organisation which has the primary responsibility for marketing South Africa internationally. In the latest edition of the TKZN strategy, this aim remains largely unchanged. In this regard TKZN has attempted to ensure that its marketing efforts are focused upon the core markets and market segments within them as identified by SAT. In addition to that, TKZN has divided the world into 3 regions on which to focus its activities. There have been some changes in what make up these three segments, and the latest groupings are as follows:
• Asia, Australia and the Americas • Europe • Africa (including the SADC regions and domestic)
TKZN currently primarily focuses its international marketing efforts on the core segments in the United Kingdom, Germany and the USA. TKZN also maintains a presence by working with partner organizations and SA embassies in all other important markets including: - France; - Belgium; - Netherlands; - Italy; and - The Middle East. The newly emergent BRIC markets have not been forgotten either. TKZN has worked with SAT, the tourism trade and other industry partners to penetrate the Indian and Chinese markets in order to attempt to ensure a significant flow of arrivals from these new markets.
0
20000
40000
60000
80000
100000
120000
J F M A M J J A S O N D
2009
2010
2011
2012
2013

Towards an effective Segmentation Approach for the KwaZulu-Natal International Tourism Market (8th Edition) Volume 1
15
TKZN has partnered with SAT in focusing its efforts on the African market, especially promoting arrivals from Southern Africa, as well as new markets outside of the Southern African region, particularly Kenya, Tanzania and Nigeria. TKZN intends to continue to investigate ways of securing arrivals from the BRIC countries, such the Brazilian, Russian and other East European markets, so as to act as a possible hub into the Durban-located King Shaka International Airport. Pioneering work has also been done in the Spanish and Scandinavian markets. TKZN’s market focus over the period 2014 – 2019 will be as follows: Market Geographic Scope Target
Segments Core Experiences
Domestic • KZN • Gauteng • Western Cape • Eastern Cape • Free State
• New Horizon families
• High-life enthusiasts
• Well-to-do Mzansi families
• Spontaneous budget explorers
• Seasoned leisure seekers
• Beaches • Natural beauty • Nightlife • Shopping • Heritage • Culture
SADC Rest of Africa
• Swaziland • Lesotho • Botswana • Mozambique • Zambia • Zimbabwe • Kenya • Nigeria • Angola
• Business professionals
• Traders
• Shopping • Big cities • Beaches (not coastal markets)
• Wildlife • Heritage
Europe Americas Asia
Core Opportunity Investments Strategic Hub
• United Kingdom
• USA • Germany
• France • Netherlands • Australia
• India • China • Brazil • Sweden • Eastern
Europe (Russia)
• Middle East (GCC countries)
• NSSA, Wanderlusters
• Family explorers
• New beach lovers
• Natural beauty • Wildlife • Culture • Visiting mountains
• Beach • Adventure (USA wanderluster)
Figure 8: TKZN’s Market Segments

Towards an effective Segmentation Approach for the KwaZulu-Natal International Tourism Market (8th Edition) Volume 1
16
5. SEGMENTING THE BRITISH TOURISM MARKET 5.1 Introduction The British market is one of the world’s most significant generators of foreign tourism and it is also South Africa’s and KZN’s most important overseas market. The United Kingdom (UK) consists of Great Britain and Northern Ireland. The former includes England, Scotland and Wales. This may well change in the future if Scotland votes to separate from the UK and become an independent country. It is also a significant contributor to foreign long haul tourism. This is a result of the fact that the British economy is very robust and its currency strong. British citizens tend to have high levels of disposable income. They are also fortunate to have long average periods of annual leave. The British tend to be highly experienced tourists and many of them have travelled long haul. Britain is one of the world’s top twenty generators of long haul tourists as indicated in Figure 8 below.
Figure 9: UK Travel Patterns However, by 2013, the picture had changed somewhat:

Towards an effective Segmentation Approach for the KwaZulu-Natal International Tourism Market (8th Edition) Volume 1
17
Figure 10: Top 10 countries for Outbound Tourists (Statista, 2014) The UK, although still a major source of outbound tourists, fell to third place by 2013. UK outbound tourism has also remained fairly static over the past years, since the high of 2008, as the following graph indicates:
Figure 11: Recent UK Outbound Travel 2008-2012
58158352
51784747 51592317.86
52778907.9752323996
48000000
50000000
52000000
54000000
56000000
58000000
60000000
2008 2009 2010 2011 2012

Towards an effective Segmentation Approach for the KwaZulu-Natal International Tourism Market (8th Edition) Volume 1
18
Besides that, although visits abroad by UK residents are up 5% over the last twelve months their expenditure decreased 3% in the same period (UK Office of National Statistics, 2014). South African Tourism has been able to determine that the following are the core needs of a British holiday-maker: • good weather • sun and beach • touring holidays – interesting sights, enjoyable scenery, visiting cities • spontaneity The English Tourist Board identified four types of British travellers: Adventurers: Pioneering nature, free spirited and broad minded. Dream about places to visit and are young, or young at heart. Do not want package holidays and usually purchase the bare minimum in advance, i.e. flight component. Controllers: Usually want to plan and organise itinerary. Independent travellers; only consider a package holiday allowing flexibility and independence. Captives: Constrained in their choice of destination by circumstances; limited by finances or family needs. Sometimes young or sometimes with elderly relations and may want to remain close to home. Traditionalists: Opposed to adventures; desire comfort in the form of security and familiarity. Prefer travel agent or tour operator to organise. Tourism Intelligence International has stressed that: • British tourists still tend to book their holidays through intermediaries but there is an
increasing use of the internet/WWW. • The British are mature, demanding and experienced travellers with an enormous
appetite for travel. The British market is very experienced in foreign travel and increasingly inclined to seek out new, unexplored destinations.
• The British market will undoubtedly continue to grow. Continued investment in this
market is thus very likely to pay off.

Towards an effective Segmentation Approach for the KwaZulu-Natal International Tourism Market (8th Edition) Volume 1
19
Figure 12: Great Britain
5.2 Regional Distribution According to SAT (2010), the population of the UK in 2008 was 61.3 million. SAT also reported that more than a quarter of the population lives in the South East or London where the gross disposable household income per head is higher, compared to other parts of the UK. This is illustrated in Figure 13.

Towards an effective Segmentation Approach for the KwaZulu-Natal International Tourism Market (8th Edition) Volume 1
20
Figure 13: Regional Characteristics of the UK (SAT, 2010) In terms of economic information, the GDP of the UK at current prices in 2008 stood at £1,446 billion. SAT (2010) reported that the UK is one of the largest economies in the world in terms of the GDP (PPP) as shown in Table 6 below. Its wealth is derived mainly from service-based industries.

Towards an effective Segmentation Approach for the KwaZulu-Natal International Tourism Market (8th Edition) Volume 1
21
Table 6: Top 20 Countries by GDP, 2008 Rank Country GDP (at PPP, GBP Billion) 1 United States £7,869 2 China £4,320
3 Japan £2,374
4 India £1,797
5 Germany £1,590
6 Russia £1,234
7 United Kingdom £1,214
8 France £1,161
9 Brazil £1,081
10 Italy £991
11 Mexico £845
12 Spain £760
13 Korea £733
14 Canada £708
15 Turkey £499
16 Indonesia £496
17 Iran2 £439
18 Australia £435
19 Taiwan £388
20 Netherlands £369
Source: SAT (2010) Not too much had changed by 2014, as is indicated in the graph below. The UK was in 6th place:

Towards an effective Segmentation Approach for the KwaZulu-Natal International Tourism Market (8th Edition) Volume 1
22
Figure 14: Countries with the largest GDP 2014 (Statista, 2014)

Towards an effective Segmentation Approach for the KwaZulu-Natal International Tourism Market (8th Edition) Volume 1
23
The most important regional generators of adult foreign tourism in 2004 were as follows: Table 7: British Regional Generators of Foreign Tou rism Region Holiday Abroad % South East 43 North West 43 London 41 North East 40 East Midlands 39 Yorkshire and Humberside 38 West Midlands 36 South West 32 East 29 Britain 38 Scotland 35 Wales 34
(Tourism Intelligence International, 2005) Tourism Intelligence International developed the following ranking in terms of the most lucrative British regions for foreign tourism, by utilising the following variables:
• GVA Per capita income • Weekly earnings • Travel intensity • Number of travellers • Level of unemployment
On the basis of this analysis Tourism Intelligence International has been able to rank the following regions in terms of their tourism significance in 2005: Table 8: Ranking of the British Regions in terms of foreign tourism generation significance Region Rank South East 1 London 2 North West & Merseyside 3 South West 4 East Midlands 5 Yorkshire & Humberside 6 East 7 Scotland 8 West Midlands 9 Wales 10 Northern Ireland 11 North East 12
(Tourism Intelligence International, 2005) South African Tourism’s departure surveys have revealed that London and Manchester are the most important urban generators of UK travel to South Africa.

Towards an effective Segmentation Approach for the KwaZulu-Natal International Tourism Market (8th Edition) Volume 1
24
SAT (2010) reported that the majority of the UK population (over 60%) go on holiday with approximately 36% of them undertaking international trips. This is further illustrated in Figure 10.
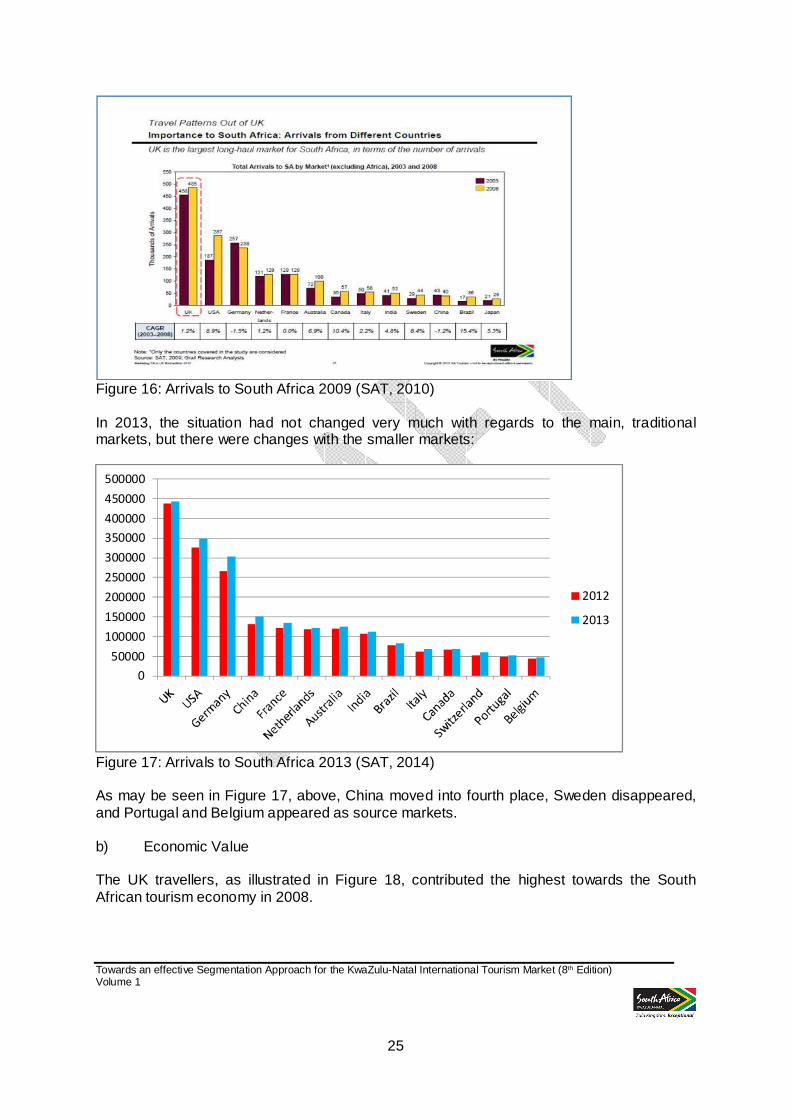
Figure 15: Domestic and International Holidays Undertaken (SAT, 2010) 5.3 Importance of the UK travellers to South Africa a) Arrivals As illustrated in Figure 16, the UK is the largest long-haul market for South Africa. Although, there was a 7.2% decline in the number of UK arrivals to South Africa between 2010 and 2011, the region is still the largest market for South Africa (SAT, 2011). This position was retained up to and including 2013, although in that year there was only a 1% increase over 2012 (SAT, 2014).
Towards an effective Segmentation Approach for the KwaZulu-Natal International Tourism Market (8th Edition) Volume 1
25
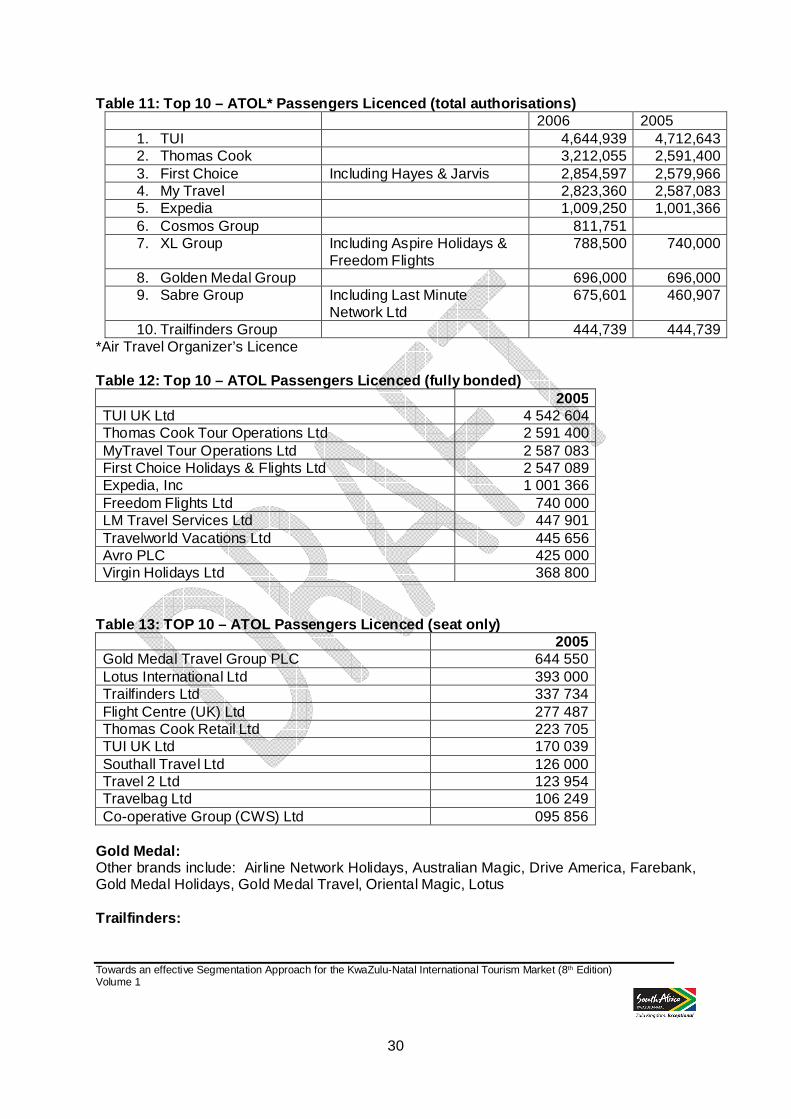
Figure 16: Arrivals to South Africa 2009 (SAT, 2010) In 2013, the situation had not changed very much with regards to the main, traditional markets, but there were changes with the smaller markets:
Figure 17: Arrivals to South Africa 2013 (SAT, 2014) As may be seen in Figure 17, above, China moved into fourth place, Sweden disappeared, and Portugal and Belgium appeared as source markets. b) Economic Value The UK travellers, as illustrated in Figure 18, contributed the highest towards the South African tourism economy in 2008.
0
50000
100000
150000
200000
250000
300000
350000
400000
450000
500000
2012
2013

Towards an effective Segmentation Approach for the KwaZulu-Natal International Tourism Market (8th Edition) Volume 1
26
Figure 18: Economic Contribution of UK Travellers However, according to the information from SAT, in 2012, the situation was somewhat different: Table 9: South Africa’s Top Average Spending Markets per Trip 2013 1 China R21 300 2 Australia R17 700 3 USA R16 000 4 Angola R13 700 5 Netherlands R13 400 (SAT, 2014) Despite these recent changes, the UK market remains vitally important on the basis of the large numbers it delivers, both to South Africa and to KZN. 5.4 South African Tourism’s Segmentation of the British (UK) Market South African Tourism has segmented the British market on the basis of short or long haul travel, age and life stage and travel preferences. There are five core segments on which South African tourism is focusing, namely:
- The Wanderlusters

Towards an effective Segmentation Approach for the KwaZulu-Natal International Tourism Market (8th Edition) Volume 1
27
- The Experienced Wanderlusters - The Positive Convertible Couples - The Next Stop South Africa segment (NSSAs) - The Been Theres
The descriptions of these segments are attached as Appendix B . 5.5 British Tour Operators There are two main tour-operating groups which currently control approximately 55% of the British trade in terms of organised air travel. My Travel and Thomas Cook merged at the beginning of 2007 to form Thomas Cook Group plc (see http://www.tuitravelplc.com/tui/pages/brands). TUI and First Choice also merged in 2007(see http://www.tuitravelplc.com). Table 10: The Brands of Thomas Cook and TUI UK THOMAS COOK plc 26% (Including My Travel Brands
TUI UK 29% (Including First Choice Brands)
Thomas Cook Signature American Holidays (NI) Thomas Cook Austravel Tours Latitude Budget Cruise Big Reunion Budget Flights Club 18-30 Budget Holidays Club18-30.com flythomascook.com Budget Travel Ibiza Hospitality ibizahospitality.com Crystal Cities JMC Crystal Croatia JMC Holidays Crystal France Jmc.com Neilson Neilson.com neilsonschools.com
Crystal Holidays
Sunset American Holidays (NI) Sunset Holidays Austravel Sunset-holidays.com thebigreunion.co.uk Budget Cruise

Towards an effective Segmentation Approach for the KwaZulu-Natal International Tourism Market (8th Edition) Volume 1
28
JMC Crystal International Academy JMC Holidays Crystal Italy Crystal Lakes & Mountains Thomas Cook Airfares Crystal Schools Up Hospitality uphospitality.com Crystal Ski Amsterdam Travel Service Belgian Travel Service Bridge City Breaks
Crystal Sport - Train & Play
Bridge Travel Service Flights Warehouse Thomas Cook Airfares Fly 061 Cresta Holidays Freefone Flights Paris Travel Service Freestyle Swiss Travel Service Tradewinds Headwater Holidays Airtours Crystal International Academy Airtours Holidays Impulse Holidays Aspro Jetsave Aspro Holidays Jetsave Canada Cruise Store Holidays Direct Jetsave Florida Direct Greece Jetsave Touring Direct Holidays Just Escapades Latedeals.com Manos Magic Connoisseurs Manos Holidays MyTravelLite Magic of Italy Panorama Magic of Portugal Panorama Holidays Magic of Spain Magic Travel Magic Winter Escapes Manchester Flights OSL Packagedeals Portland Portland Direct Portland Holidays Direct Real Holidays Simply Corsica Simply Crete Simply Ionian Simply Morocco Simply Portugal Simply Sardinia Simply Ski Simply Spain Simply Travel Simply Travel's Greece Simply Turkey Simply Tuscany & Umbria Simply Winter Sun Skideals.com Skydeals Skytours Small & Friendly Something Special Holidays Spanish
Harbour Holidays

Towards an effective Segmentation Approach for the KwaZulu-Natal International Tourism Market (8th Edition) Volume 1
29
Step Into Africa Skytours Tall Stories The International Academy The Magic Collection THG Holidays Thomson Thomson A La Carte Thomson Australia & New Zealand Thomson Breakaway Thomson Cities Thomson Direct Thomson Disney Thomson Flight Shop Thomson Freestyle Thomson Gold Thomson Holidays Thomson Lakes & Mountains Thomson Paris
& Amsterdam Thomson Platinum Thomson Ski & Snowboarding Thomson
Skis & Lakes Thomson Small & Friendly Thomson Thomson Holidays Thomson Lakes & Mountains Thomson Paris
& Amsterdam Thomson Platinum Superfamily Thomson Worldwide Thomson Young at Heart Thomsonfly thomsonfly.com Tropical Places 2wentys Eclipse Falcon First Choice Flexi Conference & Incentives JWT Sovereign Meon villaso Hayes & Jarvis Citaliao Trips Worldwide Sunstart Unijet (Civil Aviation Authority, 2005, p.3 - 4 and 2004 p.3 - 4) (Ethos Marketing) The above companies control the vast majority of holidays booked in the UK, but only some of the brands feature Africa. The majority of their business is short-haul and America (mass market).
Towards an effective Segmentation Approach for the KwaZulu-Natal International Tourism Market (8th Edition) Volume 1
30
Table 11: Top 10 – ATOL* Passengers Licenced (total authorisations) 2006 2005
1. TUI 4,644,939 4,712,643 2. Thomas Cook 3,212,055 2,591,400 3. First Choice Including Hayes & Jarvis 2,854,597 2,579,966 4. My Travel 2,823,360 2,587,083 5. Expedia 1,009,250 1,001,366 6. Cosmos Group 811,751 7. XL Group Including Aspire Holidays &
Freedom Flights 788,500 740,000
8. Golden Medal Group 696,000 696,000 9. Sabre Group Including Last Minute
Network Ltd 675,601 460,907
10. Trailfinders Group 444,739 444,739 *Air Travel Organizer’s Licence Table 12: Top 10 – ATOL Passengers Licenced (fully bonded) 2005 TUI UK Ltd 4 542 604 Thomas Cook Tour Operations Ltd 2 591 400 MyTravel Tour Operations Ltd 2 587 083 First Choice Holidays & Flights Ltd 2 547 089 Expedia, Inc 1 001 366 Freedom Flights Ltd 740 000 LM Travel Services Ltd 447 901 Travelworld Vacations Ltd 445 656 Avro PLC 425 000 Virgin Holidays Ltd 368 800
Table 13: TOP 10 – ATOL Passengers Licenced (seat o nly) 2005 Gold Medal Travel Group PLC 644 550 Lotus International Ltd 393 000 Trailfinders Ltd 337 734 Flight Centre (UK) Ltd 277 487 Thomas Cook Retail Ltd 223 705 TUI UK Ltd 170 039 Southall Travel Ltd 126 000 Travel 2 Ltd 123 954 Travelbag Ltd 106 249 Co-operative Group (CWS) Ltd 095 856
Gold Medal: Other brands include: Airline Network Holidays, Australian Magic, Drive America, Farebank, Gold Medal Holidays, Gold Medal Travel, Oriental Magic, Lotus Trailfinders:

Towards an effective Segmentation Approach for the KwaZulu-Natal International Tourism Market (8th Edition) Volume 1
31
27 travel centres Flight Centre: 1,500 stores around the globe in the UK, Australia, New Zealand, South Africa, the USA and Canada. Southall Travel: Privately owned independent travel company Travel 2: Other brands / affiliates: Ebookers, Travelbag, Octopus Travel Travelbag: Other brands/affiliates include: Ebookers, Flightbookers, Octopus Travel, Needahotel.com, Away.com, Trip.com, Travel 2 Co-operative Group: Brands include: Flexibreaks, Flightdesk, Global Cities, Global Flightline, Global Vacations, Go Travel, Hello Holidays, Just Flights, Magic Breaks, Medinland, Melhart Travel, MFC Travel, MU Travel, Search Travel Online, Searchtravelonline, Suntours, Travel with Imagination, Travelcare, Vacation Florida. LARGEST ATOL HOLDERS:
- TUI UK Ltd - Thomas Cook Tour Operations Ltd - MyTravel Tour Operations Ltd - First Choice Holidays & Flights Ltd - Expedia Inc - Freedom Flights Ltd - Gold Medal Travel Group plc - LMTravel Services Ltd - Travelworld Vacations Ltd - Trailfinders Ltd - Avro plc - Thomas Cook Retail Ltd - Lotus International Ltd - Virgin Holidays Ltd - Cosmos Holidays plc - Flight Centre (UK) Ltd - The Globespan Group plc - The Really Great Holiday Company plc - Kuoni Travel Ltd - Carnival plc - Libra Holidays Ltd - Kosmar Villa Holidays plc - BCT Travel Group Limited - Co-operative Group (CWS) Ltd - Hotelplan Ltd
Towards an effective Segmentation Approach for the KwaZulu-Natal International Tourism Market (8th Edition) Volume 1
32
- Saga Holidays Ltd - Air Miles Travel Promotions Ltd - Thomas Cook Signature Ltd - Southall Travel Ltd - Travel 2 Ltd - Flightbookers Ltd - Travelbag Ltd - The Airline Seat Company Ltd - Travelcoast Ltd - Balkan Holidays Ltd - Future Travel Ltd - RCI Europe Jetair (UK) Ltd - James Villa Holidays Ltd - Travelpack Marketing & Leisure Services Ltd - Argo Holidays Ltd
SAA TOP 20 (to Southern Africa 2006): - Trailfinders - The Focus Group (corporate) - Expedia - Flightcentre - Flightbookers - Gold Medal Travel - Lastminute.com (includes Travelocity, HolidayAutos and Travel4Less) - Thomas Cook - Travel 2 - Opodo - Benz Travel (corporate) - Travelbag - Saga Holidays - FCM Travel (corporate - part of Flight Centre) - Portman Travel (corporate) - ATP International (corporate) - STA Travel - Fleet Street Travel (corporate) - Travelcare - Wexas International TKZN has detailed market maps which provide an indication of the UK and Irish tour operators that sell South African and KwaZulu-Natal itineraries. Please contact this organisation’s marketing division for this information.
Towards an effective Segmentation Approach for the KwaZulu-Natal International Tourism Market (8th Edition) Volume 1
33
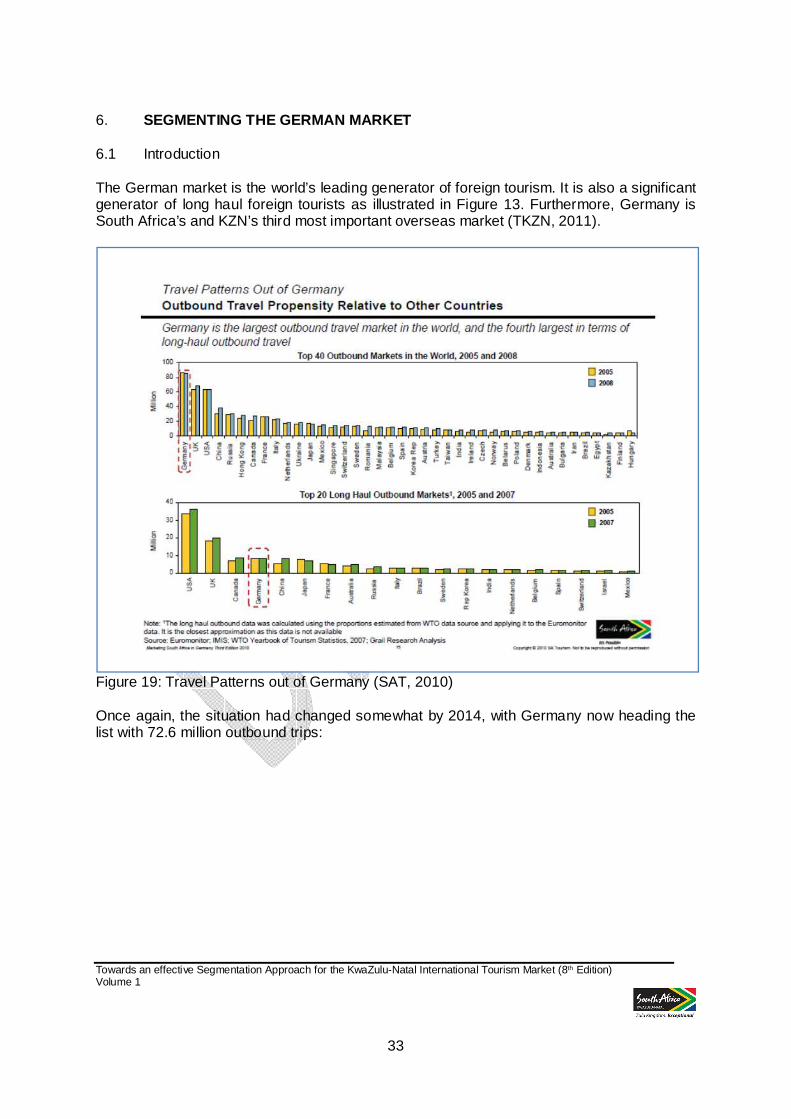
6. SEGMENTING THE GERMAN MARKET 6.1 Introduction The German market is the world’s leading generator of foreign tourism. It is also a significant generator of long haul foreign tourists as illustrated in Figure 13. Furthermore, Germany is South Africa’s and KZN’s third most important overseas market (TKZN, 2011).
Figure 19: Travel Patterns out of Germany (SAT, 2010) Once again, the situation had changed somewhat by 2014, with Germany now heading the list with 72.6 million outbound trips:

Towards an effective Segmentation Approach for the KwaZulu-Natal International Tourism Market (8th Edition) Volume 1
34
Figure 20: Top 10 countries for Outbound Tourists (Statista, 2014) According to Tourism Intelligence (2008), the five most important activities of German travellers are:
• Eating typical specialities of the countries they visit • Trip and excursions • Swimming in the sea • Resting/relaxing • Shopping/window shopping
For their future holiday, Tourism Intelligence (2008) states that the Germans wish for:
- Clean and beautiful nature and environment, and - Sun, sand and sea
In 2007-2009, beach holidays had the highest market potential with approximately 57 million holidaymakers. The beach and relaxation will continue in future to be of interest to Germans travelling abroad. Tourism Intelligence (2008) also reports that there are special interest markets with are significant for the German market and these are:
• Cruises • Golf • Health and Wellness
Towards an effective Segmentation Approach for the KwaZulu-Natal International Tourism Market (8th Edition) Volume 1
35
• Sailing, and • Diving
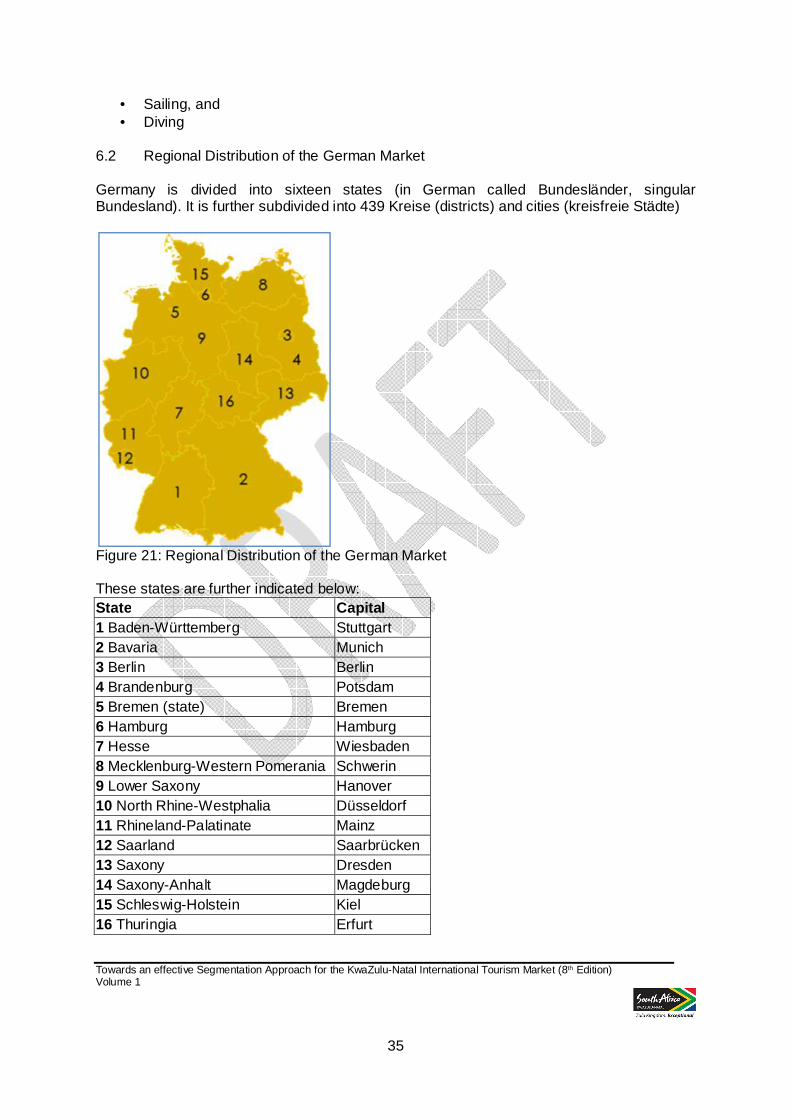
6.2 Regional Distribution of the German Market Germany is divided into sixteen states (in German called Bundesländer, singular Bundesland). It is further subdivided into 439 Kreise (districts) and cities (kreisfreie Städte)
Figure 21: Regional Distribution of the German Market These states are further indicated below: State Capital 1 Baden-Württemberg Stuttgart 2 Bavaria Munich 3 Berlin Berlin 4 Brandenburg Potsdam 5 Bremen (state) Bremen 6 Hamburg Hamburg 7 Hesse Wiesbaden 8 Mecklenburg-Western Pomerania Schwerin 9 Lower Saxony Hanover 10 North Rhine-Westphalia Düsseldorf 11 Rhineland-Palatinate Mainz 12 Saarland Saarbrücken 13 Saxony Dresden 14 Saxony-Anhalt Magdeburg 15 Schleswig-Holstein Kiel 16 Thuringia Erfurt

Towards an effective Segmentation Approach for the KwaZulu-Natal International Tourism Market (8th Edition) Volume 1
36
Tourism Intelligence International (2008) The travel intensity of various German states is a follows: Table 14: Regional Distribution of the German Popul ation
Federal State Travel Intensity (% of total pop.)
No. of Travellers (000,000)
North Rhine Westphalia 72.4 13.009 Bavaria (Bayern) 66.4 8.012 Baden- Württemberg 68.8 7.161 Lower Saxony 72.4 5.685 Hesse 65.8 3.969 Saxony 74.8 3.371 Berlin 79.3 2.710 Rhineland-Palatinate 64.3 2.584 Schleswig-Holstein 69.3 1.913 Thuringia 64.5 1.593 Brandenburg 62.9 1.623 Saxony-Anhalt 52.2 1.404 Mecklenburg-Western Pomerania
65.9 1.188
Hamburg *67.6 1.155 Saarland *67.6 0.728 Bremen *67.6 0.454
Source (Tourism Intelligence International, 2008) The Travel Intensity describes the % of the total population that travels. *Estimated based on the average of all the other states.
The above table shows that Berlin has the highest travel intensity but North Rhine-Westphalia generates the highest number of travellers (Tourism Intelligence International, 2008: 20). Furthermore, Tourism Intelligence International has ranked the German states in terms of their travel market potential. The states are characterised by:
- the highest per capita income - the highest rates of economic growth - highest travel propensities - the largest number of travellers - the lowest unemployment levels, and - the highest population size
Table 15: Ranking of German States in Terms of Trav el Potential Federal State Overall Rank Baden-Württemberg 1 Bavaria 2 North Rhine-Westphalia 3 Lower Saxony 4 Saxony 5 Hesse 6
Towards an effective Segmentation Approach for the KwaZulu-Natal International Tourism Market (8th Edition) Volume 1
37
Hamburg 7 Rhineland-Palatinate 8 Schleswig-Holstein 9 Berlin 10 Bremen 11 Saarland 12 Thuringia 13 Saxony-Anhalt 14 Brandenburg 15 Mecklenburg-Western Pomerania 16
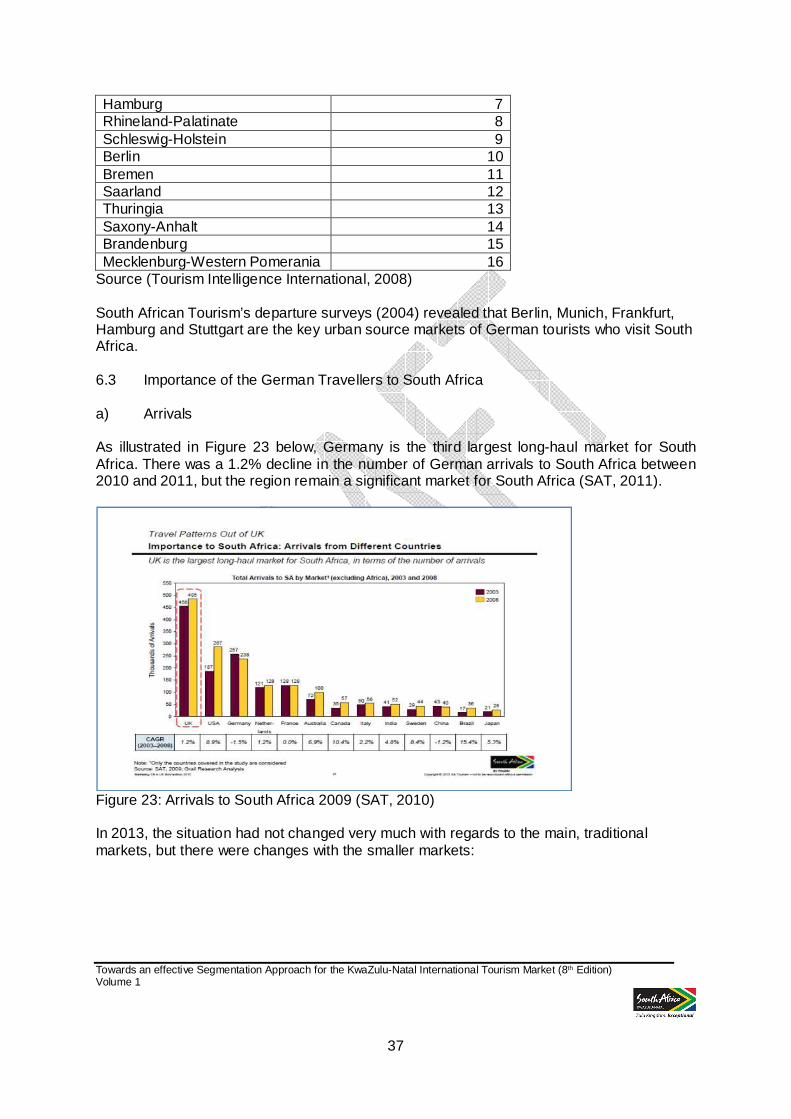
Source (Tourism Intelligence International, 2008) South African Tourism’s departure surveys (2004) revealed that Berlin, Munich, Frankfurt, Hamburg and Stuttgart are the key urban source markets of German tourists who visit South Africa. 6.3 Importance of the German Travellers to South Africa a) Arrivals As illustrated in Figure 23 below, Germany is the third largest long-haul market for South Africa. There was a 1.2% decline in the number of German arrivals to South Africa between 2010 and 2011, but the region remain a significant market for South Africa (SAT, 2011).
Figure 23: Arrivals to South Africa 2009 (SAT, 2010) In 2013, the situation had not changed very much with regards to the main, traditional markets, but there were changes with the smaller markets:

Towards an effective Segmentation Approach for the KwaZulu-Natal International Tourism Market (8th Edition) Volume 1
38
Figure 24: Arrivals to South Africa 2013 (SAT, 2014) As may be seen in Figure 17, above, Germany remained in third place, and also showed an increase in terms of overall arrival numbers. b) Economic Value German travellers, as illustrated in Figure 18, contributed the third highest amount towards the South African tourism economy in 2008.
0
50000
100000
150000
200000
250000
300000
350000
400000
450000
500000
2012
2013

Towards an effective Segmentation Approach for the KwaZulu-Natal International Tourism Market (8th Edition) Volume 1
39
Figure 25: Economic Contribution of German Travellers However, according to the information from SAT, in 2013, the situation was somewhat different: Table 16: South Africa’s Top Average Spending Markets per Trip 2013 1 China R21 300 2 Australia R17 700 3 USA R16 000 4 Angola R13 700 5 Netherlands R13 400 Despite these recent changes, the German market remains vitally important on the basis of the large numbers it delivers, both to South Africa and to KZN. 6.4 South African Tourism’s Segmentation of the German Market South African Tourism has segmented the German market on the basis short or long haul travel, age and life stage and travel preferences. South African Tourism’s target market comprises of approximately 14% of the German population. This equates to approximately 12.8 million German travellers. There are three core segments in the German market, which South African tourism is targeting namely:

Towards an effective Segmentation Approach for the KwaZulu-Natal International Tourism Market (8th Edition) Volume 1
40
- The German Wanderluster - The Next Stop South Africa segment (NSSA) - Senior Explorers The descriptions of these segments are attached as Appendix C . 6.5 German Tour Operators Germany’s travel trade is dominated or controlled by 3 major tour operating/travel groups: TUI Deutschland:
• According to Tourism Intelligence International (2008), TUI Deutschland is a subsidiary of TUI plc.
• TUI owns 9 tour operator brands,5 travel agency chains and Hapag Lloyd, the second largest charter airlinei n Germany (owned by TUI AG)
• For more information on TUI Travel and its brands please visit http://www.tuitravelplc.com/tui/pages/brands.
Thomas Cook:
• Thomas Cook is the third largest tourism group in the world and the second largest in Europe and Germany
• Thomas Cook Germany owns 7 tour operators,2 travel agency chains and the largest charter airline(once known as Condor) in the German market.
• For more information on Thomas Cook and its brands please visit http://www.thomascook.com
Rewe Group:
• Rewe Touristik is the third largest tourism group in Germany with 4 tour operator brands and 3 travel agency chains
• Rewe recently acquired a 40% stake in LTU, the third largest charter airline in Germany
(SAT, 2008; TUI Travel, 2008; Thomas Cook, 2008) Tourism Intelligence International has indicated that about 58% of all German travellers use a tour operator to arrange their holiday when travelling abroad. Intermediaries have become more and more important in the organisation of German holiday travel as a result of tough German laws and guarantees, such as the TUI’s "money back guarantee". TKZN has detailed market maps which provide an indication of the German tour operators that sell South African and KwaZulu-Natal itineraries. Please contact this organisation’s marketing division for this information.

Towards an effective Segmentation Approach for the KwaZulu-Natal International Tourism Market (8th Edition) Volume 1
41
7. SEGMENTING THE USA TOURISM MARKET 7.1 Introduction The USA market is the world’s third leading generator of foreign tourism. It is also a significant generator of long haul foreign tourists as shown in Figure 22 below. According to Tourism Intelligence International (2002):
- Americans are the highest spenders of outbound travel in the world; - The US has a population in excess of 281 million, the 3rd largest in the world; - The US market has enormous potential for long haul travel; - Americans are experienced travellers with a number of special interests such as
adventure and cruise travel. Since that report, however, later information indicates that the USA has been ousted from first place in the spending category. The UNWTO (2013) provides the information that the USA is now third in terms of the top global tourism spenders, after China and Germany, but ahead of the UK. China overtook the USA in 2012, retaining first place in terms of spend, since then. Furthermore, the gap between China, and the next two countries in terms of spend, the USA and Germany, has continued to widen. Since the 2002 report, the population of the USA has increased to 316 million (2013). Expenditure per capita, however, has dropped in terms of ranking, so that the USA is now in about 7th place (UNWTO, 2014). Nevertheless, the USA still commands a 7.4% of the global tourism market share, the same as that of Germany, but less than the 11.1% share attributed to China.

Towards an effective Segmentation Approach for the KwaZulu-Natal International Tourism Market (8th Edition) Volume 1
42
Figure 23: USA Travel Patterns

Towards an effective Segmentation Approach for the KwaZulu-Natal International Tourism Market (8th Edition) Volume 1
43
Figure 24: USA Outbound Trips 2013 (Statista, 2014) The USA market is currently (2013) South Africa’s and KZN’s second most important overseas market.
Figure 25: The USA

Towards an effective Segmentation Approach for the KwaZulu-Natal International Tourism Market (8th Edition) Volume 1
44
Tourism Intelligence International indicated that the following are the 5 most lucrative states to target in the US:
- California; - New Jersey; - Massachusetts, - New York; and - Maryland
Other key states are the District of Columbia and Illinois. This analysis was based on the following variables:
- population size; - travel intensity; - per capita personal income; - unemployment rate; - % population 18 or over; - % of population with a Bachelor’s degree or higher
The best performing states in terms of these criteria in 2002, were as follows: Table 17: Key US States from a Foreign Tourism Gene ration Perspective State Popula-
tion (mn)
Average Income
Per Capita Personal Income
Unemploy-ment Rate (%)
% with B-Degree or higher
% 18 years or older
Travel Intensity %
California 34 $46,499 $32,275 4.9 27.5 72.7 18 New York 19 $43,640 $34,547 4.6 28.2 75.3 27.4 New Jersey 8.4 $54,226 $36,983 3.8 24.5 75.2 20.6 Florida 16 $37,346 $28,145 3.6 23.2 77.2 13.4 Massachusetts 6.3 $49,505 $37,992 2.6 34.9 76.4 23.6 Pennsylvania 12.2 $39,562 $29,539 4.2 23.0 76.2 13.8 Texas 21 $29,120 $27,871 4.2 23.5 71.8 7.8 Illinois 12.4 $45,606 $32,259 4.4 27.0 73.9 10.4 Virginia 7 $46,693 $31,162 2.2 30.2 75.4 18.2 Maryland 5.3 $52,436 $33,872 3.9 31.5 74.4 16.0 Washington DC 0.6 $41,047 $37,383 5.8 41.1 79.9 47.5 USA 281.4 $41,343 $29,676 4.0 25.1 74.3 12.1 (Source: Tourism Intelligence International, 2002) In terms of the distribution of the US Population, SAT’s latest US Market Report, published in 2010, suggests that the distribution of the US population is according to Figure 24 which differs slightly from Tourism Intelligence International.

Towards an effective Segmentation Approach for the KwaZulu-Natal International Tourism Market (8th Edition) Volume 1
45
Figure 26: Distribution of US Population (SAT, 2010) According to SAT (2010), the USA is the world’s largest economy in terms of the GDP (PPP) – please see Table 16. The country derives its wealth primarily from service-based industries such as real estate, rental and leasing, government and manufacturing. Table 18: Top 20 Countries by GDP, 2008 Rank Country GDP (at PPP, $ Billion)
1 United States $14,441 2 China $7,927 3 Japan $4,356 4 India $3,298 5 Germany $2,918 6 Russia $2,265 7 United Kingdom $2,228 8 France $2,130 9 Brazil $1,984 10 Italy $1,818 11 Mexico $1,551 12 Spain $1,395 13 Korea $1,345 14 Canada $1,300
15 Turkey $915
16 Indonesia $910
17 Iran2 $805

Towards an effective Segmentation Approach for the KwaZulu-Natal International Tourism Market (8th Edition) Volume 1
46
18 Australia $799
19 Taiwan $712
20 Netherlands $677
2Estimated Value. Source: SAT (2010) By 2013, the picture had changed to the following: Table 19: Top 20 Countries by GDP - 2013 Gross domestic product 2013 Ranking Economy (millions of US dollars) 1 United States 16 800 000 2 China 9 240 270 3 Japan 4 901 530 4 Germany 3 634 823 5 France 2 734 949 6 United Kingdom 2 522 261 7 Brazil 2 245 673 8 Russian Federation 2 096 777 9 Italy 2 071 307 10 India 1 876 797 11 Canada 1 825 096 12 Australia 1 560 597 13 Spain 1 358 263 14 Korea, Rep. 1 304 554 15 Mexico 1 260 915 16 Indonesia 868 346 17 Turkey 820 207 18 Netherlands 800 173 19 Saudi Arabia 745 273 20 Switzerland 650 782 Source: World Bank, 2014 Although the top three countries remained largely unchanged in terms of ranking, India had slipped from 4th down to 10th position. 7.2 Regional Distribution of the South African US market SAT has segmented US market in terms of SA’s primary and secondary sources or potential sources of US tourists.

Towards an effective Segmentation Approach for the KwaZulu-Natal International Tourism Market (8th Edition) Volume 1
47
Figure 27: Key US Regions for RSA US Tourists (SAT) 7.3 South African Tourism’s Segmentation of the USA Market South African Tourism has segmented the USA market on the basis short or long haul travel, age and life stage and travel preferences. SAT reports that there are five segments which are positive about SA and they contain approximately 19 million people. However, there are two core segments in the US market, which SAT is targeting, namely: - The Wanderluster - The Next Stop South Africa (NSSA) segment These two focus segments together contain approximately 6.3 million people. The descriptions of these segments are contained in the report attached as Appendix D .

Towards an effective Segmentation Approach for the KwaZulu-Natal International Tourism Market (8th Edition) Volume 1
48
Other core segments which SAT is of the view that SA should focus on are: - The African-American Market - The MICE market 7.4 US Tour Operators According to SAT, the number of travel retail outlets including the tour operators decreased annually during 2003-2008. This, according to SAT, could be attributed to the economic slowdown as well as the growing prevalence of online channel.
Figure 27: Number of US Travel Retail Outlets (SAT, 2010) According to Tourism Intelligence International (2000), the US tour operators are represented by two associations, namely, United States Tour Operator Association (USTOA) and the National Tour Association (NTA). The USTOA has a significant number of active members. The members of the NTA represent more than 40 countries with 1,500 tour operators, 600 destinations and 1,500 tour suppliers. For more information on these associations, kindly visit http://www.ustoa.com/2009/index.cfm and http://www.ntaonline.com/, respectively.

Towards an effective Segmentation Approach for the KwaZulu-Natal International Tourism Market (8th Edition) Volume 1
49
8. Special Focus on the BRIC Market South Africa was recently incorporated into the BRIC countries, namely, Brazil, Russia, India and China. As illustrated in Figure 21, there seems to be a noticeable growth in arrivals from three of the BRIC countries such as India, China and Brazil.
Figure 28: International Markets to KZN When comparing the South African arrival figures for January to December 2011 and 2010, the number of arrivals from these countries increased as follows: Table 18: A comparison of the arrival figures from the BRIC countries Country % Difference Between Jan-Dec 2011
and 2010 Brazil 0.8% India 26.2% China (incl Hong Kong) 24.3%
SAT (2012) When the arrivals to KZN up until the end of 2012 are recorded, the following changes may be noted:
Towards an effective Segmentation Approach for the KwaZulu-Natal International Tourism Market (8th Edition) Volume 1
50
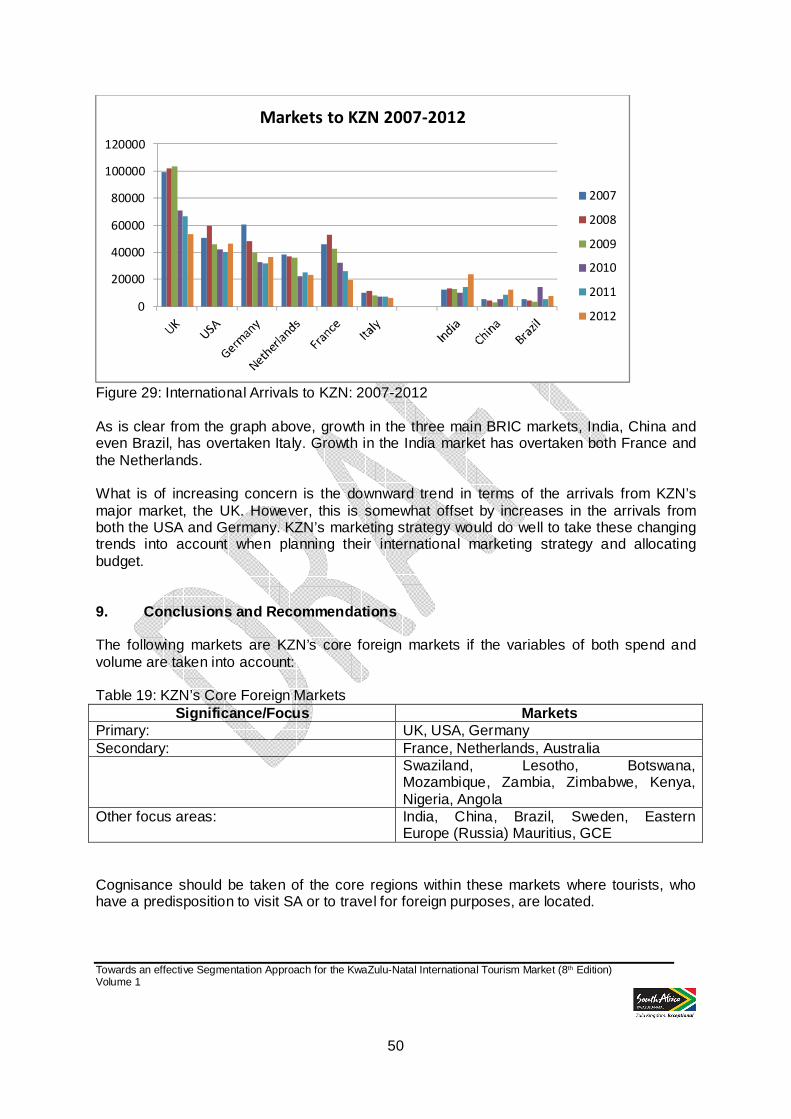
Figure 29: International Arrivals to KZN: 2007-2012 As is clear from the graph above, growth in the three main BRIC markets, India, China and even Brazil, has overtaken Italy. Growth in the India market has overtaken both France and the Netherlands. What is of increasing concern is the downward trend in terms of the arrivals from KZN’s major market, the UK. However, this is somewhat offset by increases in the arrivals from both the USA and Germany. KZN’s marketing strategy would do well to take these changing trends into account when planning their international marketing strategy and allocating budget. 9. Conclusions and Recommendations The following markets are KZN’s core foreign markets if the variables of both spend and volume are taken into account: Table 19: KZN’s Core Foreign Markets
Significance/Focus Markets Primary: UK, USA, Germany Secondary: France, Netherlands, Australia Swaziland, Lesotho, Botswana,
Mozambique, Zambia, Zimbabwe, Kenya, Nigeria, Angola
Other focus areas: India, China, Brazil, Sweden, Eastern Europe (Russia) Mauritius, GCE
Cognisance should be taken of the core regions within these markets where tourists, who have a predisposition to visit SA or to travel for foreign purposes, are located.
0
20000
40000
60000
80000
100000
120000
Markets to KZN 2007-2012
2007
2008
2009
2010
2011
2012

Towards an effective Segmentation Approach for the KwaZulu-Natal International Tourism Market (8th Edition) Volume 1
51
KZN’s primary, secondary and pioneering markets need to be segmented from both a trade and a consumer perspective. TKZN needs constantly to identify and target SA’s core inbound operators as well as outbound operators who sell the KZN product or who will be willing to do so. Relationships need to be forged with these operators through the mobilisation of an effective Customer Relationship Marketing programme.

Towards an effective Segmentation Approach for the KwaZulu-Natal International Tourism Market (8th Edition) Volume 1
52
REFERENCES National Tour Association. (2011). What is NTA? [online]. United States: The National Tour Association. Available from: ˂ http://www.ntaonline.com/join-nta/about-nta/ ˃ [Accessed 11 April 2012] Office for National Statistics. (2014). Overseas Travel and Tourism, Provisional Results for June 2014 – UK coverage. Office of National Statistics: UK. South African Tourism. (2004). Global Competitiveness Project Summary of Key Findings of Phase 1. Johannesburg: South African Tourism. South African Tourism. (2007). Tourism Growth Strategy 2008 – 2010. Johannesburg: South African Tourism. South African Tourism. (2006). Marketing South Africa in Germany. Johannesburg: South African Tourism. South African Tourism. (2006). Marketing South Africa in the United States. Johannesburg: South African Tourism. South African Tourism. (2006). Marketing South Africa in the United Kingdom. Johannesburg: South African Tourism. South African Tourism. (2006). Marketing South Africa in the United Kingdom.
Johannesburg: South African Tourism. South African Tourism. (2007). Indaba Fact Sheet. Johannesburg: South African Tourism. South African Tourism. (2007). Results from Foreign Departure Surveys for 2006 & 2007. Johannesburg: South African Tourism. South African Tourism. (2010). The marketing tourism growth strategy for South Africa 2011- 2013. Johannesburg: South African Tourism. South African Tourism. (2010). Marketing South Africa in Germany. 3rd ed. Johannesburg: South Africa. South African Tourism. (2010). Marketing South Africa in the UK. 3rd ed. Johannesburg: South Africa. South African Tourism. (2010). Marketing South Africa in the USA. 3rd ed. Johannesburg: South Africa. South African Tourism. (2011). Table A – Dec 2011. Johannesburg: South Africa. Statista. (2014). Countries with the largest GDP, available from
http://www.statista.com/statistics/268173/countries-with-the-largest-gross-domestic-product-gdp/ [Accessed on 8 September 2014].

Towards an effective Segmentation Approach for the KwaZulu-Natal International Tourism Market (8th Edition) Volume 1
53
Tourism KwaZulu-Natal. (2007). Tourism Strategy 2008 – 2012. Durban: Tourism KwaZulu- Natal. Tourism KwaZulu-Natal. (2014). Tourism Strategy 2014 – 2018. Durban: Tourism KwaZulu- Natal. Tourism KwaZulu-Natal. (2011). Statistics of our tourism sector. Durban: Tourism KwaZulu- Natal. Tourism KwaZulu-Natal. (2012). Statistics of our tourism sector. Durban: Tourism KwaZulu- Natal. Tourism KwaZulu-Natal. (2013). Statistics of our tourism sector. Durban: Tourism KwaZulu- Natal. Tourism KwaZulu-Natal. (2013). Tourism KwaZulu-Natal Tourism Strategy 2013-2019. Durban: Tourism KwaZulu-Natal. Tourism Intelligence International. (2000). How the Germans Will Travel. Bielefeld: Tourism Intelligence International. Tourism Intelligence International. (2002). How the Americans Will Travel. Bielefeld: Tourism Intelligence International. Tourism Intelligence International. (2002). How the Americans will travel 2007. Germany: Tourism Intelligence International. Tourism Intelligence International. (2005). How the British Will Travel. Bielefeld: Tourism Intelligence International. Tourism Intelligence International. (2008). How Germans will travel 2010. Germany: Tourism Intelligence International. Tourism Intelligence International. (2005. How the British will travel 2005. Germany: Tourism Intelligence International. United States Tour Operator Association. No date. About USTOA [online]. United States: The United States Tour Operator Association. Available from: ˂ http://www.ustoa.com/2009/index.cfm ˃ [Accessed 11 April 2012]. United Nations World Tourism Organization. (2013). UNWTO Factbook. Available from
http://www2.unwto.org/ [Accessed on 8 September 2014]. World Bank. (2014). Table of Countries by GDP Ranking 2013. Available from
http://data.worldbank.org/data-catalog/GDP-ranking-table [Accessed 10 September 2014].

Towards an effective Segmentation Approach for the KwaZulu-Natal International Tourism Market (8th Edition) Volume 1
54