towards a viscoelastic mechanical characterization of asphalt materials by ultrasonic measurements
TRANSCRIPT
ORIGINAL ARTICLE
Towards a viscoelastic mechanical characterizationof asphalt materials by ultrasonic measurements
Nicolas Larcher • Mokhfi Takarli •
Nicolas Angellier • Christophe Petit •
Hamidou Sebbah
Received: 11 April 2013 / Accepted: 12 December 2013
� RILEM 2014
Abstract This study focuses on the use of P-wave
propagation measurements in order to evaluate the
complex modulus, more specifically for the reversible
and dissipated parts of asphalt materials. Both the
wave velocity and attenuation factor have been
measured by means of an ultrasonic transmission test,
at frequencies between 200 and 300 kHz and temper-
atures ranging from -20 to 40 �C. Based on this wave
velocity and attenuation factor, the high-frequency
complex modulus and its components are computed
by considering a 2D propagation of waves in an
isotropic viscoelastic medium. Results are plotted with
respect to the master curve, Cole–Cole and Black
spaces. The ultrasonic test results agree with results
obtained by complex modulus test and then fitted by
the 2S2P1D rheological model. This paper shows in
Cole–Cole space that ultrasonic data can facilitate the
determination of important rheological parameters as
one of the two parabolic dashpots (k) and the glassy
modulus E0. The phase angle, which is also a key
viscoelastic identification parameter, can be deter-
mined at high frequency in a Black space
representation.
Keywords Asphalt concrete � Complex
modulus � Ultrasonic wave propagation �Velocity � Attenuation
1 Introduction
In the field of civil engineering, non-destructive
testing (NDT) and in particular wave propagation
methods provide a valuable tool for structural diag-
nostics (whether in-service, in situ or field NDT) as
well as for materials characterization (laboratory
NDT).
When applied in the laboratory, these techniques
allow studying several aspects of asphalt concrete
characterization, namely: microstructural characteriza-
tion (e.g. density, air voids, bitumen content, asphalt
viscosity, gradation and filler content, aggregate segre-
gation, anisotropy) [1–4]; analysis of fatigue behavior
[5, 6]; moisture damage investigation [7]; acoustic
properties (impedance, absorption and damping) for
assessing noise reduction performance [8–10]; and
determination of mechanical properties (complex mod-
ulus, high-frequency or dynamic modulus) [11–19];
N. Larcher � M. Takarli � N. Angellier �C. Petit (&) � H. Sebbah
Laboratoire GEMH-GCD, Universite de Limoges, 17
Boulevard Jacques Derche, 19300 Egletons, France
e-mail: [email protected]
N. Larcher
e-mail: [email protected]
M. Takarli
e-mail: [email protected]
N. Angellier
e-mail: [email protected]
H. Sebbah
e-mail: [email protected]
Materials and Structures
DOI 10.1617/s11527-013-0240-0

This paper focuses on determining complex mod-
ulus, more specifically in the reversible and dissipated
parts, since this is a key parameter in pavement design.
In order to measure this mechanical property for
asphalt concrete, the viscoelastic approach for wave
propagation is considered. An ultrasonic P-wave
propagation technique will be used to determine the
wave propagation parameters (i.e. wave velocity and
attenuation factor). Asphalt concrete is a heteroge-
neous material with viscoelastic behavior, thus mak-
ing ultrasonic parameters a source of frequency and
temperature dependence. To highlight this depen-
dence, measurements were performed for tempera-
tures of between -20 to 40 �C, with the frequency
bandwidth of analysis ranging from 200 to 300 kHz.
The complex modulus, its real and imaginary parts and
the phase angle are all computed using experimental
ultrasonic data. It has been demonstrated that atten-
uation is the most difficult parameter to analyze and
identify given that the many complex mechanisms
created by various sources are responsible for a wave
amplitude decrease. Moreover, the major interest of
this study lies in its use of a viscoelastic approach for
wave propagation analysis. Based on this approach,
both real and imaginary parts of the complex modulus
in addition to the phase angle can be determined with
ultrasonic parameters (velocity and attenuation fac-
tor). These results are plotted respectively in Cole–
Cole and Black spaces, and a good fit with mechanical
and rheological data can be observed. This comparison
shows the potential of an ultrasonic test to achieve
separation of the reversible modulus from the dissi-
pated modulus (E1 and E2 or E* and phase angle). In
focusing exclusively on the Cole–Cole space, it thus
becomes obvious that the ultrasonic results allow
determining rheological parameters (k and E0). This
constitutes the first step towards identifying the
rheological parameters of a viscoelastic model, such
as the well-known 2S2P1D model, which proves very
effective for asphalt materials [20].
2 Background
The potential of an ultrasonic laboratory test to
measure complex modulus at high frequencies
(10–200 kHz) has been clearly demonstrated in the
literature review. An impulse echo method, developed
by Dos Reis et al. [11], allows estimating the complex
modulus according to an energy approach. Hochuli
et al. [12] generated a flexural wave in asphalt concrete
and measured the complex modulus at various
frequencies. Another method introduced in [13–15]
is the free resonant technique; these authors investi-
gated the resonant frequency and damping ratio in
order to derive the dynamic modulus value. The high-
frequency modulus has been accurately determined by
Barnes et al. [16] using both a spectral analysis of
surface waves and a multichannel analysis of surface
waves. Compression wave propagation has also been
employed in considering different hypotheses. Nor-
ambuena-Contreras et al. [17] applied an elastic
hypothesis and computed dynamic modulus at high
frequency simply with wave velocity at the test
temperature of 22 �C. More recently, several authors
have considered the viscoelastic behavior of asphalt
concrete by incorporating into the computation of
complex modulus either the phase angle or attenuation
factor. Mounier et al. [15] and Di Benedetto et al. [18]
associated the P-wave velocity derived from ultra-
sonic testing with the phase angle output by the
2S2P1D rheological model. Van Velsor et al. [19]
determined two wave propagation parameters for
compression, i.e. wave velocity and attenuation factor,
for introducing viscoelastic behavior. In these last
studies, test temperatures ranged roughly from -20 to
40 �C. The authors observed a significant difference
between the ultrasonic prediction and the complex
modulus test data. They explain this difference by the
wave scattering from air voids and aggregates.
Through this literature review, it was shown that
different types of waves can be used in the evaluation
of the complex modulus (Structural waves, surface
waves, compression and shear waves). However it
should be noted that group velocity and elastic wave
propagation hypotheses are most often adopted. The
viscoelastic approach is employed less frequently and
requires either combination with a rheological model
to identify viscous parameters, such as phase angle, or
an experimentally measured ultrasonic attenuation.
3 Materials and methods
3.1 Materials
The asphalt concrete specimen is prepared in accor-
dance with requirement of French Standard NF P 98-
Materials and Structures

250-(1&2), with a size of 70 9 395 9 595 mm3
(depth 9 width 9 length). The design gradation is
presented in Table 1. The binder selected is a 35–50
penetration degree asphalt binder and the mixture
density is 2.533 kg/m3.
3.2 Viscoelastic behavior
3.2.1 Principle of viscoelastic behavior
The complex modulus E* is a complex number
defined as the ratio between the complex amplitude
of the sinusoidal stress of pulsation x applied to the
materials, r tð Þ ¼ r0 sin xtð Þ, and the complex ampli-
tude of the sinusoidal strain resulting in a steady state
[21]. Due to the viscoelastic nature of the material, the
strain lags behind stress, as reflected by a phase angle
u between the two signals, e tð Þ ¼ e0 sin xt � uð Þ.Given this definition, the complex modulus is not a
function of time but instead depends on the pulsation
x for a fixed temperature (Eq. 3).
r tð Þ ¼ Im r� tð Þ½ � with r� tð Þ ¼ r0 � expixt ð1Þ
e tð Þ ¼ Im e� tð Þ½ � with e� tð Þ ¼ e0 � expiðxt�uÞ ð2Þ
E� xð Þ ¼ r0 � expixt
e0 � expiðxt�uÞ ¼ E�j jexpiu ð3Þ
In these expressions, i is the imaginary number, |E*|
is the norm of the complex modulus, x the pulsation
and u is the phase angle. The complex modulus can
also be written, E�j j ¼ffiffiffiffiffiffiffiffiffiffiffiffiffiffiffiffi
E21 þ E2
2
p
, where E1 is the
instantaneous or elastic response and E2 is the deferred
or viscous response. The complex modulus depends
on both temperature and frequency.
3.2.2 Complex modulus test
The complex modulus is obtained through mechanical
cyclic tests, which can be divided into two categories
[22]: homogeneous tests (tension/compression, shear
test, constant-height shear test, coaxial shear test); and
non-homogeneous tests (2, 3 and 4-point bending
tests, indirect tensile test). To thoroughly evaluate the
temperature and frequency dependence of the stiffness
modulus, a minimum temperature and frequency
range must be applied. Such cyclic tests allow
computing the real and imaginary parts of the complex
modulus (E1, E2) or else the complex modulus |E*| and
phase angle u. Several representations of these results
are possible as isochronous and isotherm curves,
Cole–Cole and Black spaces. In this study, the
complex mechanical modulus tests have been per-
formed by introducing sinusoidal bending on trape-
zoidal samples (250 mm high, 56 mm large base,
25 mm small base, and 25 mm thick) at the LRPC
(Laboratoire Regional des Ponts et Chaussees,
France).Various frequencies were applied (1, 3, 10,
25, 30 and 40 Hz) for temperatures ranging from -20
to 40 �C. The isotherm curves of the complex modulus
are plotted in Fig 1a.
3.2.3 Master curve
The master curve, for the reference temperature of
15 �C used in French pavement design, has been
plotted in Fig. 1a by applying a mathematical-based
procedure [23]. The method is based on the Kramers-
Kronig relations linking modulus and phase angle of a
complex function. It seems to be suitable for binders
and mixtures as soon as their behavior is in agreement
with Time–Temperature Superposition Principle
(TTSP). This principle is based on the premise that
any given modulus value on the isotherm curve can be
obtained by different pairings of frequency and
temperature. TTSP yields the expression of E*(x,T)
as E*(x,f(T)). The master curve was derived by a
translation operation using a shift factor called aT,
which is computed by either a type of Arrhenius
equation or the WLF formula (which has been chosen
herein [23]). The WLF formula requires determining
two coefficients (C1 and C2) for the reference
temperature. In this case, the C1 and C2 values for a
reference temperature of 15 �C are respectively equal
to 19 and 130.
Table 1 Aggregate gradation and % of binder by mass
Sieve size (mm) Pass. aggregate (%)
0.08 10.4
0.2 17.1
0.4 21.8
1 42.1
2 62.3
4 70.8
6.3 98.4
8 100
Binder (by mass of aggregate) 6.85
Air voids 4.4
Materials and Structures

3.2.4 2S2P1D model
Once the master curve has been determined by the
mathematical-based procedure, a rheological model
can be fitted and then used to predict the complex
modulus at frequencies not reached by the experi-
mental master curve. Various rheological models are
available in the literature, yet those with a continuous
spectrum are more interesting in viscoelastic analyses
of asphalt concretes. These models allow the simula-
tion of their mechanical behavior for a great frequen-
cies range. Let’s cite, for example, Huet, Huet-Sayegh
and 2S2P1D (two springs, two parabolic dashpots, and
one linear dashpot, respectively) (Fig. 1b). The Huet-
Sayegh set-up offers an improvement over the Huet
model reported by Sayegh in that it has added in
parallel a spring with low stiffness. This spring
represents the static modulus of asphalt concrete and
moreover predicts the complex modulus at low
frequency or high temperature. More recently, Olard
et al. [20] added a linear dashpot in tandem with the
two springs (h and k) as well as the stiffening spring
(E0 - E00). This new rheological model, called
2S2P1D, is able to more accurately predict the
complex modulus than any other rheological model
at low frequency or high temperature. In this study, we
have introduced the 2S2P1D model, which in turn has
yielded the complex modulus via Eq. 4. The fitting
parameters are given in Fig. 1b.
E�j j ¼ E00 þE0 � E00
1þ d ixsð Þ�kþ ixsð Þ�hþ ixbsð Þ�1ð4Þ
In this equation, i is the complex number defined by
i2 ¼ �1, x is the pulsation with x ¼ 2pf where f is the
frequency, k and h are exponents such that 0 \ k \h \ 1, d is a dimensionless constant, E00 is the static
modulus when xs! 0, E0 is the glassy modulus when
xs!1, s is a characteristic time dependent only on
temperature, b is a dimensionless constant, g is the
Newtonian viscosity, and g ¼ ðE0 � E00Þbs when
Real part E1
Imag
inar
ypa
rt E
2
h /2 k /2
h k
E00 E0
E00
(b)
1.E-02
1.E-01
1.E+00
1.E+01
1.E+02
1.E-04 1.E-01 1.E+02 1.E+05 1.E+08 1.E+11
Nor
m o
f th
e co
mpl
ex m
odul
us I
E*I
(G
Pa)
Equivalent frequency f.aT (Hz)
Experimental isotherms
Experimental master curve
2S2P1D model
-20°C-10°C
0°C10°C15°C
20°C
30°C
40°C
(a)
Fig. 1 a Standard dynamic tests plotted in terms of isotherms and master curves b Schematic diagram of the 2S2P1D rheological
model used to construct the theoretical master curve
Materials and Structures

xs! 0 then E � ixsð Þ ! E0 þ ix E0 � E00ð Þbs. It
must be notified that the fitting of this rheological
model required extrapolating the mechanical results in
order to determine a number of calibration parameters,
such as E0, E00, h and k.
3.3 Ultrasonic test
The aim of our ultrasonic test is to measure the wave
propagation parameters (velocity and attenuation),
thus making it possible to determine the complex
modulus by considering 2D wave propagation in an
isotropic viscoelastic medium.
3.3.1 Theoretical background
By adopting the hypothesis of a 2D P-wave propaga-
tion in isotropic viscoelastic material [24] (Eq. 5), the
phase velocity V/;p and attenuation factor ap of P-
wave can be given by using the Poisson’s ratio m, the
pulsation x, the complex modulus E�j j and the phase
angle u (Eqs. 6 and 7).
u x; tð Þ ¼ u0 exp �apxð Þ exp i xt�kxð Þð Þ ð5Þ
V/;p ¼1
cos u2
� �
ffiffiffiffiffiffiffiffiffiffiffiffiffiffiffiffiffiffiffiffiffiffiffiffiffiffiffiffiffiffiffiffiffiffi
E�j j 1� mð Þq 1þ mð Þ 1� 2mð Þ
s
ð6Þ
ap ¼ x sinu2
� �
ffiffiffiffiffiffiffiffiffiffiffiffiffiffiffiffiffiffiffiffiffiffiffiffiffiffiffiffiffiffiffiffiffiffi
q 1þ mð Þ 1� 2mð ÞE�j j 1� mð Þ
s
ð7Þ
In these equations, k is the wave number and q is the
density (kg/m3). By combining Eq. 6 and 7, both the
complex modulus (Eq. 8) and phase angle can indeed
be determined (Eq. 9).
E�j j ¼qV2
/;px2 1þ mð Þ 1� 2mð Þ
x2 þ a2pV2
/;p
� �
1� mð Þð8Þ
u ¼ tan�1 2apV/;px
x2 � a2pV2
/;p
� �
0
@
1
A ð9Þ
3.3.2 Principle of the ultrasonic test
The ultrasonic test device is composed of: an arbitrary
waveform generation card (e.g. sinus, dirac, sweep)
with frequency modulation; piezoelectric compression
transducers with resonant frequencies of 100 to
500 kHz; a 40 dB analog pre-amplifier; a 40 Ms/s
acquisition and sampling card; and an appropriate
software for waveform processing and analysis. For
this study, the sinus waveform was chosen with a
300 kHz frequency. The sampling rate was set at
10 Ms/s.
In bituminous materials, transmission is a more
appropriate mode than reflection since attenuation is
very high and increases with temperature and fre-
quency. In this study, velocity and wave attenuation
have been computed with signals obtained for two
distinct propagation distances. Two samples with two
different lengths (L1 and L2) were subjected to the
same temperature variation with a simultaneous
occurrence (Fig. 2). Length L2 is considered less
advantageous, as regards attenuation measurement,
for signal acquisition at the highest temperature
(40 �C). Length L1, which is less than L2, is assumed
to satisfy the far-field criterion or Fraunhofer field
[25]. Here, lengths L1 and L2 are equal to 44 and
93 mm, respectively, and the cross-section of these
specimens is 70 9 70 mm2. The test temperature
ranges from -20 to 40 �C, with a 10 �C incremental
step from -20 to 0 �C and a 5 �C step from 0 to 40 �C.
For the wave velocity measurement, many calcula-
tion methods are available in the literature. Using
temporal analysis (Fig. 3a, b), the group velocity can
be determined according to several methods: (i) the
temporal difference into the first zero crossing for two
different signals can potentially be used, though this
method is highly dependent on the signal-to-noise ratio
[26]; (ii) the temporal difference between the maxi-
mum amplitudes of signal envelopes obtained by
applying the Hilbert Transform; and iii) the temporal
difference between the peaks (positive or negative). In
frequency analysis (Fig. 3c, d), the phase velocity can
be determined [27] by the following equation (Eq. 10):
V/;p ¼xDL
D/¼ 2pf DL
D/ð10Þ
In this expression, f is the frequency, DL the travel
difference between two signals, and D/ the phase shift
between the two signals (Fig. 3d). To identify the
frequency value, a cross-spectrum (Fig. 3c) is pro-
duced from the Fast Fourier Transform (FFT) of each
signal.
Like for wave velocity, wave attenuation factor
aUS;p (which is experimentally determined by consid-
ering ultrasonic P-wave propagation and expressed in
Np/m), can be measured in terms of several
Materials and Structures
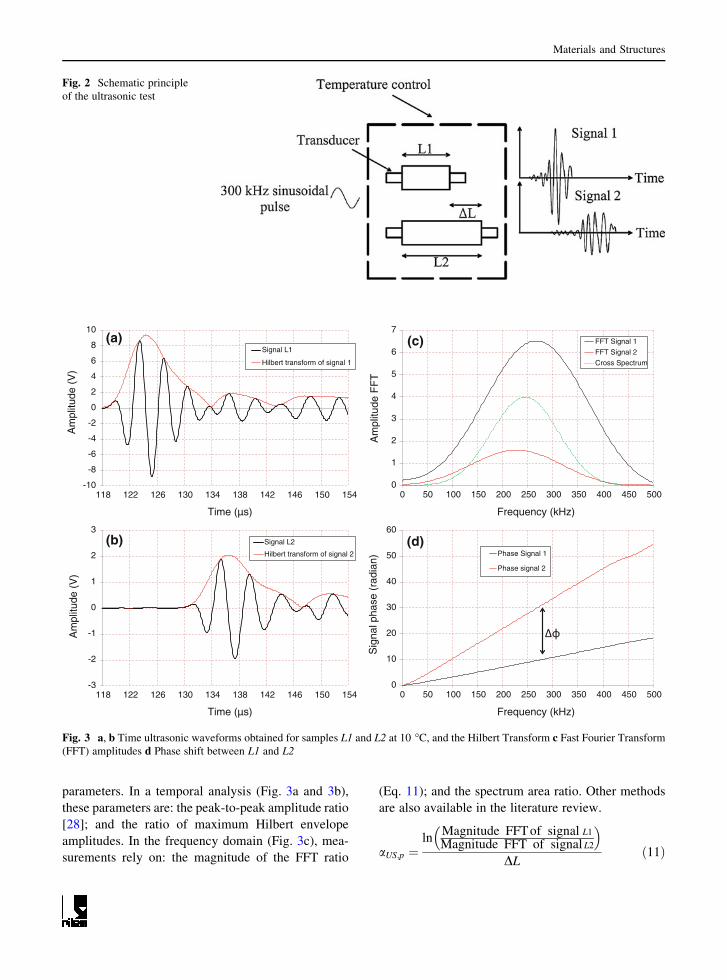
parameters. In a temporal analysis (Fig. 3a and 3b),
these parameters are: the peak-to-peak amplitude ratio
[28]; and the ratio of maximum Hilbert envelope
amplitudes. In the frequency domain (Fig. 3c), mea-
surements rely on: the magnitude of the FFT ratio
(Eq. 11); and the spectrum area ratio. Other methods
are also available in the literature review.
aUS;p ¼ln
Magnitude FFTof signal L1
Magnitude FFT of signal L2
� �
DLð11Þ
Fig. 2 Schematic principle
of the ultrasonic test
0
1
2
3
4
5
6
7
0 50 100 150 200 250 300 350 400 450 500
Am
plitu
de F
FT
Frequency (kHz)
FFT Signal 1
FFT Signal 2
Cross Spectrum
0
10
20
30
40
50
60
0 50 100 150 200 250 300 350 400 450 500
Sig
nal p
hase
(ra
dian
)
Frequency (kHz)
Phase Signal 1
Phase signal 2
-3
-2
-1
0
1
2
3
118 122 126 130 134 138 142 146 150 154
Am
plitu
de (
V)
Time (µs)
Signal L2
Hilbert transform of signal 2
(b)
(c)
(d)
-10
-8
-6
-4
-2
0
2
4
6
8
10
118 122 126 130 134 138 142 146 150 154
Am
plitu
de (
V)
Time (µs)
Signal L1
Hilbert transform of signal 1
(a)
Fig. 3 a, b Time ultrasonic waveforms obtained for samples L1 and L2 at 10 �C, and the Hilbert Transform c Fast Fourier Transform
(FFT) amplitudes d Phase shift between L1 and L2
Materials and Structures
4 Results and discussion
Laboratory measurements of P-wave propagation
parameters are performed at temperatures ranging
from -20 to ?40 �C. The results output of velocity
and attenuation are the averages of ten measurements
at each test temperature. These wave propagation
parameters are used to calculate the high-frequency
modulus by using Eq. 8. Literature review shows that
Poisson’s ratio of asphalt concrete can ranges between
0.2 to 0.5 according the temperature and frequency
[21, 29]. In this study, we consider that the Poisson’s
ratio is constant (0.36) by taking into account mean
value of the variation. This value was also used in
several studies based on ultrasonic wave propagation
methods for mechanical characterization of asphalt
concrete [16, 17]. The real and the imaginary parts of
the high-frequency modulus are computed by the
combination of Eqs. 8 and 9.
The 2S2P1D model allows fitting the master curve
and predicting the complex modulus at high frequen-
cies. Thus, for each experimental ultrasonic fre-
quency, theoretical values of phase velocity and
attenuation factor can be expressed by using Eqs. 6
and 7.
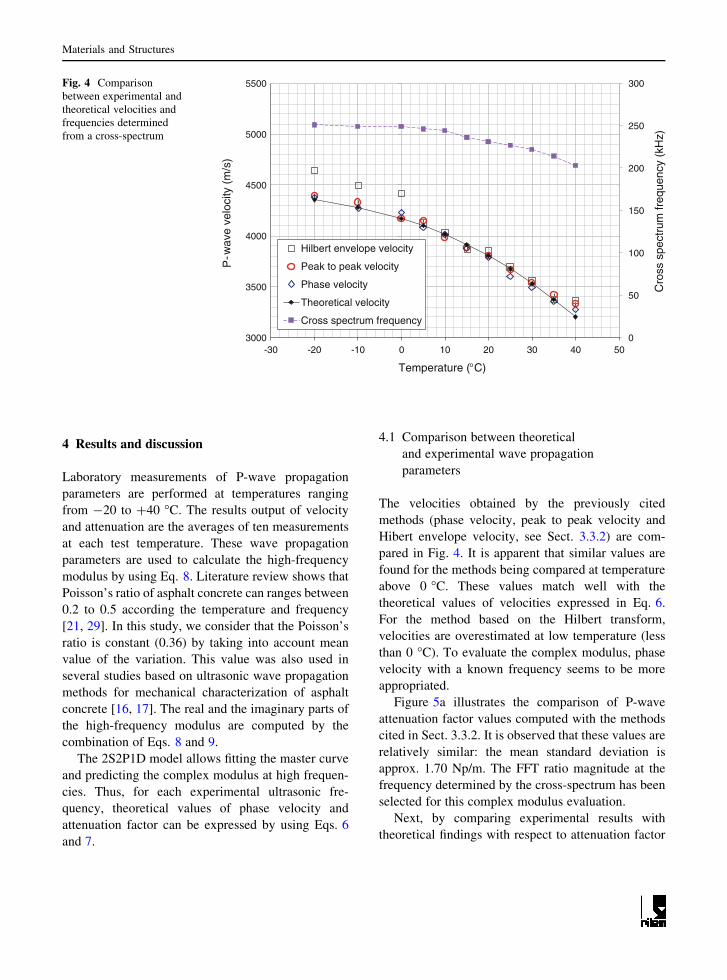
4.1 Comparison between theoretical
and experimental wave propagation
parameters
The velocities obtained by the previously cited
methods (phase velocity, peak to peak velocity and
Hibert envelope velocity, see Sect. 3.3.2) are com-
pared in Fig. 4. It is apparent that similar values are
found for the methods being compared at temperature
above 0 �C. These values match well with the
theoretical values of velocities expressed in Eq. 6.
For the method based on the Hilbert transform,
velocities are overestimated at low temperature (less
than 0 �C). To evaluate the complex modulus, phase
velocity with a known frequency seems to be more
appropriated.
Figure 5a illustrates the comparison of P-wave
attenuation factor values computed with the methods
cited in Sect. 3.3.2. It is observed that these values are
relatively similar: the mean standard deviation is
approx. 1.70 Np/m. The FFT ratio magnitude at the
frequency determined by the cross-spectrum has been
selected for this complex modulus evaluation.
Next, by comparing experimental results with
theoretical findings with respect to attenuation factor
0
50
100
150
200
250
300
3000
3500
4000
4500
5000
5500
-30 -20 -10 0 10 20 30 40 50
Cro
ss s
pect
rum
freq
uenc
y (k
Hz)
P-w
ave
velo
city
(m
/s)
Temperature (°C)
Hilbert envelope velocity
Peak to peak velocity
Phase velocity
Theoretical velocity
Cross spectrum frequency
Fig. 4 Comparison
between experimental and
theoretical velocities and
frequencies determined
from a cross-spectrum
Materials and Structures

parameters (Fig. 5b), a number of observations can be
drawn. For starters, a similar overall shape is noted in
the attenuation factor increase with temperature gains.
This attenuation factor increase becomes more signif-
icant above 0 �C. Moreover, a constant difference
between experimental and theoretical values of about
21.55 Np/m (with a standard deviation of 1.57 Np/m)
is systematically displayed. The attenuation overesti-
mation can be explained by several factors: (i) first, the
additional attenuation sources (geometric spreading
and scattering) are not taken into account by the
rheological model; (ii) secondly, Poisson’s ratio
required for computing the attenuation factor is
supposed constant despite it possible variation
between 0.2 and 0.5 as shown in the literature review
[21, 29]. Usually, the minimum value of m (0.2) is
obtained at low temperature of –20 �C. Thus, the
relative error which can be caused by assuming
m = 0.36 at this temperature is negligible (about
–0.46 Np/m) compared to the observed constant
difference between experimental and theoretical val-
ues (about ?21.55 Np/m). However, when m value is
0
10
20
30
40
50
60
0 10 20 30 40 50
Atte
nuat
ion
(Np/
m)
Temperature (°C)
Maximum amplitude of Hilbert envelopes ratio
Magnitude FFT ratio
Peak to peak amplitude ratio
Spectrum area ratio
0
5
10
15
20
25
30
0
10
20
30
40
50
60
-30 -20 -10
-30 -20 -10
0 10 20 30 40 50W
avel
engh
t (m
m)
Atte
nuat
ion
(Np/
m)
Temperature (°C)
Magnitude FFT ratio
Theoretical attenuation
Wavelenght
(a)
(b)
Fig. 5 a Experimental
attenuation factor according
to two different temporal
and frequency analyses
b Comparison between the
theoretical attenuation
factor and the experimental
attenuation factor; the
experimental wavelength
Materials and Structures

increased above 0.36 at temperature of 40 �C the
difference between theory and experimentation
becomes more larger. In conclusion, the systematic
overestimation of attenuation factor can’t be totally
explained by the value of Poisson’s ratio which is
adopted as constant (0.36) for all temperatures and
frequencies; (iii) thirdly, hypothesis of isotropy in
asphalt concrete needs to be inspected by ultrasonic
measurements. For all computations therefore, each
experimental attenuation value is corrected by this
constant value. Moreover, without this correction,
results will not be in agreement with mechanical data,
and the complex modulus will be underestimated
while the phase angle will be overestimated (as shown
in [20]).
4.2 Determination of high-frequency modulus
The results reported in the previous sections have
indicated that wave propagation parameters (velocity
and attenuation factor) are consistent with the
mechanical results fitted by the 2S2P1D rheological
model. A viscoelastic hypothesis for wave propaga-
tion was necessary to determine both the theoretical
velocity and attenuation factor from the rheological
model.
The values for the norm of the complex modulus, as
obtained from wave propagation parameters (P-wave
velocity and attenuation factor, Eq. 8), are plotted in
Fig. 6. It can be observed that the ultrasonic
frequencies range from 200 to 300 kHz and the
complex modulus from 15 to 30 GPa. The ultrasonic
moduli were translated by applying the TTSP and by
introducing the shift factor aT derived from the
mechanical tests. Thus, the ultrasonic master curve
was also plotted, and Fig. 6 illustrates its agreement
with both the experimental master curve and 2S2P1D
model, as previously shown in several studies [11–19].
At the reference temperature of 15 �C, this ultrasonic
modulus translation yields frequencies of approxi-
mately 200 Hz.
The modulus at this frequency cannot be used in
pavement design because the required frequency has
been set at 10 Hz. However, with new measurements
at temperatures above 40 �C, the frequency needed for
pavement design can ultimately be reached. However,
the ultrasonic modulus at a given temperature can
serve as an indicator of material degradation under
mechanical and/or physicochemical loading.
4.3 Contribution to the viscoelastic approach
The characterization and modeling of asphalt concrete
behavior requires a complex representation called the
Cole–Cole space (Fig. 1b). According to this set-up,
the imaginary part is plotted vs. the real part, which
respectively represent the viscous and elastic parts
of the complex modulus. Such a representation
allows determining several parameters, e.g. h, k, E0
and E00, used in rheological modeling by means of
1.E-02
1.E-01
1.E+00
1.E+01
1.E+02
1.E-04 1.E-01 1.E+02 1.E+05 1.E+08 1.E+11
Nor
m o
f the
com
plex
mod
ulus
IE*I
(G
Pa)
Equivalent frequency f.aT (Hz)
Experimental master curve
2S2P1D model
US modulus
US equivalent modulus
TTSP
TTSPFig. 6 Mechanical master
curve fitted by the 2S2P1D
rheological model, the
ultrasonic modulus, and the
ultrasonic equivalent
modulus obtained by the
TTSP (feq = f.aT)
Materials and Structures

extrapolating mechanical data. The extrapolation
needed to determine the k and E0 parameters may be
simplified by an ultrasonic test that employs the
viscoelastic approach. With this approach, both the
real and imaginary parts of the complex modulus can
in fact be expressed by wave propagation parameters,
and especially the attenuation factor, representing the
viscous material behavior. In Fig. 7, the real and
imaginary parts of the complex modulus obtained by
the ultrasonic test are shown in a Cole–Cole space.
First of all, it can be observed that the ultrasonic test
gives some values outside the range of the mechanical
test results. Moreover, these results are in good
agreement with the mechanical test as well as the
rheological model.
Secondly, the tangent to the mechanical data is
plotted to enable determining the k parameter used to
fit the 2S2P1D rheological model for this material
(k = 0.145). It is important to underscore that this
tangent passes through the ultrasonic data, which
0
1
2
3
0 5 10 15 20 25 30 35
Imag
inar
y pa
rt o
f com
plex
mod
ulus
E2(G
Pa)
Real part of complex modulus E1 (GPa)
Mechanical data2S2P1D modeUS dataTangent
kπ/2
E0
Fig. 7 Representation of
ultrasonic results in a Cole–
Cole space: determination of
k and the glassy modulus E0
0
5
10
15
20
25
30
2 7 12 17 22 27 32
Pha
se a
ngle
(
)
Norm of the complex modulus IE*I (GPa)
Mechanical data
2S2P1D model
US data
Fig. 8 Representation of
ultrasonic results in a Black
space
Materials and Structures
complete the dataset generated by mechanical tests.
Otherwise, the glassy modulus, which is a key
parameter in identifying the compaction performance
of the aggregate skeleton, could only be estimated
with ultrasonic data.
The representation of these results can be also
plotted using Eqs. 8 and 9 in a Black space, which
presents the viscous behavior of asphalt concrete in
terms of phase angle and complex modulus (Fig. 8).
This representation also yields good agreement
between the mechanical, rheological and ultrasonic
results. It must be highlighted that the phase angle is
key parameter to determine the shift factor introduced
in the WLF formula [23].
5 Conclusion
In this study, three approaches to characterizing the
complex modulus of asphalt concrete have been
compared: complex modulus test, 2S2P1D rheological
model, and ultrasonic measurements. The test tem-
perature has ranged from -20 to ?40 �C. The results
of these various approaches have been presented on a
master curve (obtained using TTSP), as well as on
Cole–Cole and Black spaces and then compared.
The measured wave propagation parameters (phase
velocity and attenuation factor) associated with 2D
wave propagation in an isotropic viscoelastic medium
have allowed computing the complex modulus values
at high frequencies in the 200–300 kHz range. As
expected, these values reported on the master curve by
the use of equivalent frequencies show good agree-
ment with the standard dynamic test and the modeling
data. This agreement has been verified for a wide
range of equivalent frequencies (200 Hz to 50 GHz).
A comparison of results in the Cole–Cole space
indicates that ultrasonic results yield values in terms of
both the real E1 and imaginary E2 parts of the complex
modulus not reached by mechanical tests (Fig. 7), and
which usually require an extrapolation with rheolog-
ical model. The potential of an ultrasonic test to
estimate rheological parameters has been clearly
demonstrated. As a matter of fact, k and the glassy
modulus E0, which respectively represent one of the
two parabolic creep elements in the rheological model
and the aggregate skeleton mixes, can only be
estimated using the ultrasonic test. Moreover, the
phase angle, a key parameter in viscoelastic behavior,
is also determined with the ultrasonic test.
In conclusion, the proposed ultrasonic test offers an
attractive method for the laboratory characterization
of bituminous materials.
The ability of ultrasonic testing to evaluate the
complex modulus is however primarily based on a
combination of the wave velocity and the wave
attenuation factor. A better determination of this
experimental attenuation factor would require quan-
tifying the attenuation caused by other sources. In
addition, the literature review has shown that Pois-
son’s ratio for asphalt concrete can range between 0.2
and 0.5 depending on temperature and frequency [21],
which demonstrates the necessity of shear wave
propagation measurements.
References
1. In CW, Kim JY, Kurtis KE, Jacobs LJ (2009) Character-
ization of ultrasonic Rayleigh surface waves in asphaltic
concrete. NDT&E Int 42:610–617
2. Rojas J, Nazarian S, Tandon V, Yuan D (1999) Quality
management of asphalt-concrete layers using wave propa-
gation techniques. Center for Highway Materials Research,
University of Texas, Research Report 1735-2
3. Jiang ZY, Ponniah J, Casante G (2006) Improved Ultrasonic
pulse velocity technique for bituminous material charac-
terization. Annual Conference of the Transportation of
Canada, Charlottetown, Canada, 17–20 September
4. Arabani M, Kheiry PT, Ferdosi B (2009) Laboratory eval-
uation of the effect of HMA mixt parameters on ultrasonics
pulse wave velocities. Int J Road Mater Pavement Des
10:223–232
5. Tigdemir M, Kalyoncuoglu SF, Kalyoncuoglu UY (2004)
Application of ultrasonic method in asphalt concrete testing
for fatigue life estimation. NDT&E Int 37:597–602
6. Houel A, Arnaud L (2009) Damage characterization of
asphalt in laboratory by ultrasonic wave propagation. Non
Destructive Testing in Civil Engineering, June 30th–July
3rd, Nantes, France
7. Birgisson B, Roque R, Page GC (2003) Ultrasonic pulse
wave velocity test for monitoring changes on Hot Mix
Asphalt integrity from exposure to moisture. Transp Res
Rec 1832:173–181
8. Tiwari V, Shukla A, Bose A (2004) Acoustic properties of
cenosphere reinforced cement and asphalt concrete. Appl
Acoust 65:263–275
9. Biligiri KP, Kaloush KE (2009) Prediction of pavement
materials’ impedance using ultrasonic pulse velocity. Int.
J. Road Mater Pavement Des 10:767–787
10. Mun S (2010) Sound absorption characteristics of porous
asphalt concrete pavements. Can J Civ Eng 37:273–278
Materials and Structures

11. Dos Reis HLM, Habboub AK, Carpentier SH (1999) Non-
destructive evaluation of complex moduli in asphalt concrete
with an energy approach. Transp Res Rec 1681:170–178
12. Hochuli AS, Sayir MB, Poulikakos LD, Partl MN (2001)
Measuring the complex modulus of asphalt mixtures by
structural wave propagation. 26th Annual meeting of the
association of asphalt paving cracking technologists AAPT,
March 19–21, Clearwater Beach Florida, USA
13. Ryden N (2009) Determining the asphalt master curve from
free-free resonant testing on cylindrical samples. Non
Destructive Testing in Civil Engineering, June 30th–July
3rd, Nantes, France
14. Gudmarsson A, Ryden N, Birgisson B (2012) Application of
resonant spectroscopy to asphalt concrete beams for deter-
mination of the dynamic modulus. Mater Struct 45:
1903–1913
15. Mounier D, Di Benedetto H, Sauzeat C (2012) Determina-
tion of bituminous mixtures linear properties using ultra-
sonic wave propagation. Constr Build Mater 36:638–647
16. Barnes CL, Trottier JF (2009) Evaluating High-Frequency
viscoelastic moduli in asphalt concrete. Res Nondestr Eval
20:116–130
17. Norambuena-Contreras J, Castro-Fresno D, Vega-Zaman-
illo A, Celaya M, Lombillo-Vozmediano I (2010) Dynamic
modulus of asphalt mixture by ultrasonic direct test.
NDT&E Int 43:629–634
18. Di Benedetto H, Sauzeat C, Sohm J (2009) Stiffness of
bituminous mixtures using ultrasonic wave propagation. Int
J Road Mater Pavement Des 10:789–814
19. Van Velsor JK, Premkumar L, Chehab G, Rose JL (2011)
Measuring the complex modulus of asphalt concrete using
ultrasonic testing. J Eng Sci Technol Rev 4:160–168
20. Olard F, Di Benedetto H (2003) General 2S2P1D model and
relation between the linear viscoelastic behaviours of bitu-
minous binders and mixes. Road Mater Pavement Des
4:1985–2224
21. Di Benedetto H, Partl MN, Franckeen L, La Roche De, Saint
Andre C (2001) Stiffness testing for bituminous mixtures.
Mater Struct 34:66–70
22. Di Benedetto H, Corte JF (2005) Materiaux routiers bitu-
mineux 2. Hermes Lavoisier editions
23. Chailleux E, Ramond G, Such C, de la Roche C (2006) A
mathematical-based master-curve construction method
applied to complex modulus of bituminous materials. Road
Mater Pavement Des, EATA 2006:75–92
24. Zinszner B, Bourbie T, Coussy O (1967) Acoustique des
milieux poreux. Editions Technip, Paris
25. Hendee WR, Ritenour ER (2002) Medical imaging physics.
Editions Wiley-Lies inc, New York
26. Le Huerou JY, Gindre M, Amarene A, Urbach W, Waks M
(2003) Compressibility of nano inclusions in complex fluids
by ultrasound velocity measurements. IEEE Trans Ultrason
Ferroelectr Freq Control 50:1595–1600
27. Peters F, Petit L (2003) A broad band spectroscopy method
for ultrasound wave velocity and attenuation measurement
in dispersive media. Ultrasonics 41:357–363
28. Jiang ZY, Ponniah J, Cascante G. (2008) Field condition
assessment of longitudinal joints in asphalt pavements using
seismic wave technology. Annual Conference of the trans-
portation Association of Canada Toronto, September
21–24, Ontario
29. Graziani A, Bocci M, Canestrari F (2013) Complex Pois-
son’s ratio of bituminous mixtures: measurement and
modeling. Mater Struct. doi:10.1617/s11527-013-0117-2
Materials and Structures