toward the seismic performance assessment of lifelines
TRANSCRIPT
Keywords: lifelines, RiskScape, multi-hazards, exposure analysis, fragility functions.
ABSTRACT Current scientific and engineering knowledge about natural hazards risk analysis has been combined in New Zealand to develop a multi-hazard risk/loss modeling system, RiskScape, for use within New Zealand. A summary of the main features and of the framework characterizing the RiskScape model is shortly provided as an introductory part of the paper. The results of an international review targeting the analysis of potential methods and tools to be included in the RiskScape platform for the assessment of lifelines systems performance when subjected to earthquake ground shaking are, secondly, discussed. The feasibility of implementing the models under consideration for the seismic performance assessment of lifelines in New Zealand is then discussed with reference to a study-case and three lifelines systems, namely: transportation networks, electric power systems and potable water systems. The study presented in the paper is part of a broaden reserch promoted to provide the Regional RiskScape program in New Zealand with an engineering basis upon which the losses incurred by selected geographically distributed lifeline systems can be assessed under the action of the different natural hazards and where alternative strategies for enhancing the lifelines resilience to natural hazards can be assessed and compared.
1 THE REGIONAL RISKSCAPE MODEL
In June 2004 the New Zealand Foundation for Research, Science and Technology, FRST, http://www.frst.govt.nz/ being the research funding agency for central government, provided funding for the development of a Regional RiskScape Model, a multi-hazard risk/loss modelling system for use within New Zealand. The Regional RiskScape Model, has been developed as a joint 50:50 venture between the Institute of Geological and Nuclear Sciences, GNS Science (GNS PI Andrew King), and the National Institute of Water and Atmospheric Research, NIWA, and has involved the collaboration of many others national and international organisations, including University of Canterbury and Massey University in New Zealand and GeoScience Australia. The first phase of RiskScape (2004-2008) has been successfully completed, demonstrating several scientific significant progresses in the
representation and analysis of multi-hazards impacts (King et al. 2005; Bell and King 2006; Reese et al. 2007, Cousin et al. 2007) and showing that is of great significance for New Zealand having an operational, nationally consistent, multi-hazard loss modelling tool. The success of the first phase of the project, has secured another eight years of FRST funding (2008-2016) for the further development and improvement of the RiskScape tool http://riskscape.org.nz/.
1.1 RiskScape unique features The main goal in conceiving and modelling
Riskscape in the Phase I of the project, has been to develop and implement a decision-support tool able to readily compares the likely consequences of multiple hazards on a region and to provide the results in a readily usable and end-user oriented consistent form. To this aim, RiskScape allows the quantification of a range of consequences (including direct damage, replacement costs, casualties, number of people that may need
Toward the Seismic Performance Assessment of Lifelines within the Regional RiskScape Model in New Zealand
Sonia Giovinazzi Civil and Natural Resources Engineering Department - University of Canterbury, Private Bag 4800, New Zealand.
Andrew King GNS Science -1 Fairway Drive, Avalon, 5040 Lower Hutt, New Zealand.
ANID
IS20
09BO
LOGN
A
evacuation or medical assistance and indirect effects such as disruption on transport and tourism) across the same portfolio of communities and associated assets (buildings and infrastructure), and the comparison of the resulting impacts and losses in a common platform across several hazards. At the present stage RiskScape focuses on five of the major natural hazards that can affect New Zealand, namely: river floods; earthquakes; volcano eruptions (ashfall); tsunami (local, regional and remote sources); and, wind storms. Snow, landslides (both rainfall and earthquake triggered), storm surges, pyroclastic flows and lahars, climate change effects, will be included as part of the phase II of the project.
The final goal of RiskScape is to provide end-users (e.g. local authorities, administrators, civil defence managers, decision makers, urban planners, etc) with specific information able to support the: a) prioritizing of risk-reduction and mitigation measures; b) assessment of the best use of risk-reduction investment; c) effectively managing emergencies; d) planning for land use; e) improvement of building codes and design; 5) identification and quantification of risk in their region/town; f) planning for evacuation & contingency; g) raising of risk awareness in the local authorities and in the public; h) creating realistic scenarios for exercises.
The concept on the basis of Riskscape system has been developed taking into consideration, on one hand, the lessons learned from the international reserch experiences and existing tools (e.g. HAZUS-MH; PerilAus; Minerva) and, on the other hand, the perceived local end-user requirements.
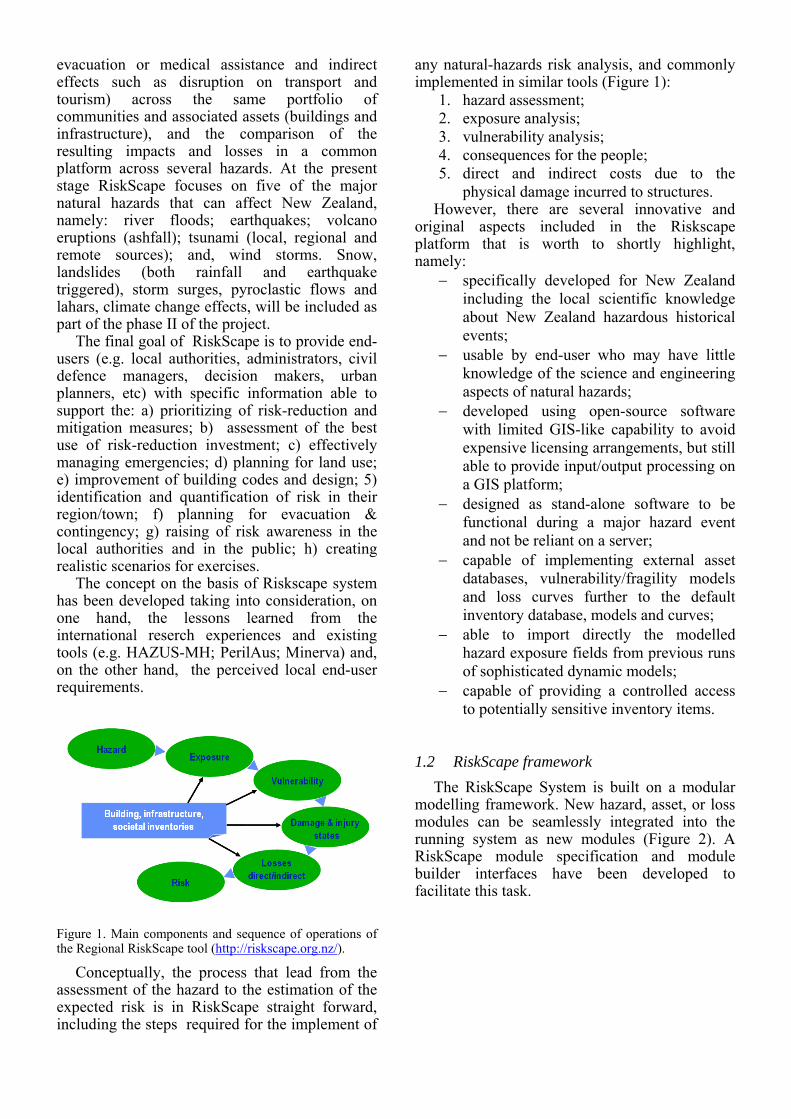
Figure 1. Main components and sequence of operations of the Regional RiskScape tool (http://riskscape.org.nz/).
Conceptually, the process that lead from the assessment of the hazard to the estimation of the expected risk is in RiskScape straight forward, including the steps required for the implement of
any natural-hazards risk analysis, and commonly implemented in similar tools (Figure 1):
1. hazard assessment; 2. exposure analysis; 3. vulnerability analysis; 4. consequences for the people; 5. direct and indirect costs due to the
physical damage incurred to structures. However, there are several innovative and
original aspects included in the Riskscape platform that is worth to shortly highlight, namely:
− specifically developed for New Zealand including the local scientific knowledge about New Zealand hazardous historical events;
− usable by end-user who may have little knowledge of the science and engineering aspects of natural hazards;
− developed using open-source software with limited GIS-like capability to avoid expensive licensing arrangements, but still able to provide input/output processing on a GIS platform;
− designed as stand-alone software to be functional during a major hazard event and not be reliant on a server;
− capable of implementing external asset databases, vulnerability/fragility models and loss curves further to the default inventory database, models and curves;
− able to import directly the modelled hazard exposure fields from previous runs of sophisticated dynamic models;
− capable of providing a controlled access to potentially sensitive inventory items.
1.2 RiskScape framework The RiskScape System is built on a modular
modelling framework. New hazard, asset, or loss modules can be seamlessly integrated into the running system as new modules (Figure 2). A RiskScape module specification and module builder interfaces have been developed to facilitate this task.
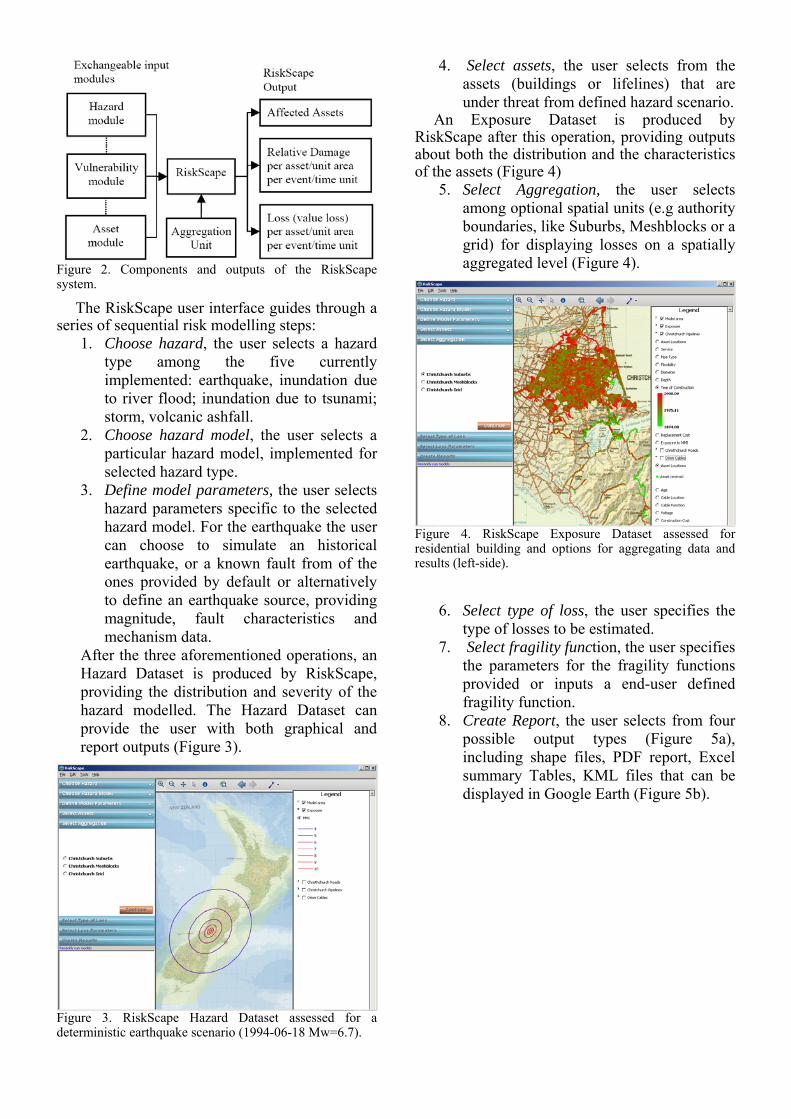
Figure 2. Components and outputs of the RiskScape system.
The RiskScape user interface guides through a series of sequential risk modelling steps:
1. Choose hazard, the user selects a hazard type among the five currently implemented: earthquake, inundation due to river flood; inundation due to tsunami; storm, volcanic ashfall.
2. Choose hazard model, the user selects a particular hazard model, implemented for selected hazard type.
3. Define model parameters, the user selects hazard parameters specific to the selected hazard model. For the earthquake the user can choose to simulate an historical earthquake, or a known fault from of the ones provided by default or alternatively to define an earthquake source, providing magnitude, fault characteristics and mechanism data.
After the three aforementioned operations, an Hazard Dataset is produced by RiskScape, providing the distribution and severity of the hazard modelled. The Hazard Dataset can provide the user with both graphical and report outputs (Figure 3).
Figure 3. RiskScape Hazard Dataset assessed for a deterministic earthquake scenario (1994-06-18 Mw=6.7).
4. Select assets, the user selects from the assets (buildings or lifelines) that are under threat from defined hazard scenario.
An Exposure Dataset is produced by RiskScape after this operation, providing outputs about both the distribution and the characteristics of the assets (Figure 4)
5. Select Aggregation, the user selects among optional spatial units (e.g authority boundaries, like Suburbs, Meshblocks or a grid) for displaying losses on a spatially aggregated level (Figure 4).
Figure 4. RiskScape Exposure Dataset assessed for residential building and options for aggregating data and results (left-side).
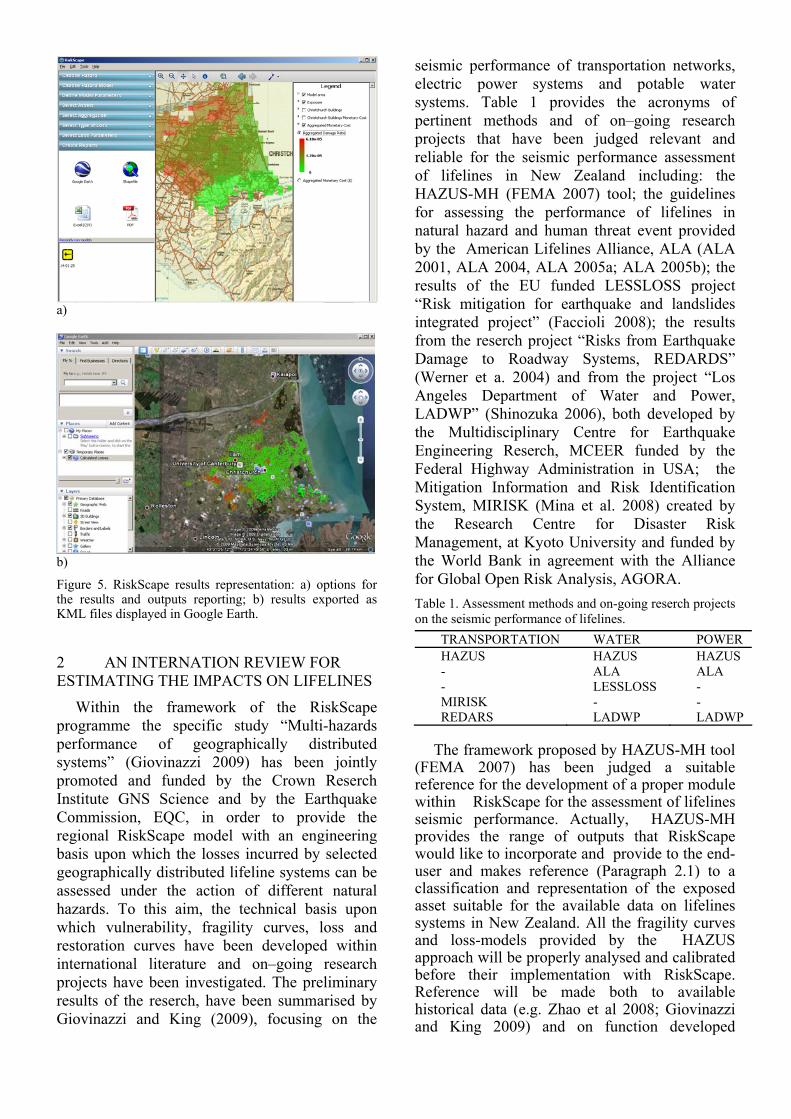
6. Select type of loss, the user specifies the type of losses to be estimated.
7. Select fragility function, the user specifies the parameters for the fragility functions provided or inputs a end-user defined fragility function.
8. Create Report, the user selects from four possible output types (Figure 5a), including shape files, PDF report, Excel summary Tables, KML files that can be displayed in Google Earth (Figure 5b).
a)
b)
Figure 5. RiskScape results representation: a) options for the results and outputs reporting; b) results exported as KML files displayed in Google Earth.
2 AN INTERNATION REVIEW FOR ESTIMATING THE IMPACTS ON LIFELINES
Within the framework of the RiskScape programme the specific study “Multi-hazards performance of geographically distributed systems” (Giovinazzi 2009) has been jointly promoted and funded by the Crown Reserch Institute GNS Science and by the Earthquake Commission, EQC, in order to provide the regional RiskScape model with an engineering basis upon which the losses incurred by selected geographically distributed lifeline systems can be assessed under the action of different natural hazards. To this aim, the technical basis upon which vulnerability, fragility curves, loss and restoration curves have been developed within international literature and on–going research projects have been investigated. The preliminary results of the reserch, have been summarised by Giovinazzi and King (2009), focusing on the
seismic performance of transportation networks, electric power systems and potable water systems. Table 1 provides the acronyms of pertinent methods and of on–going research projects that have been judged relevant and reliable for the seismic performance assessment of lifelines in New Zealand including: the HAZUS-MH (FEMA 2007) tool; the guidelines for assessing the performance of lifelines in natural hazard and human threat event provided by the American Lifelines Alliance, ALA (ALA 2001, ALA 2004, ALA 2005a; ALA 2005b); the results of the EU funded LESSLOSS project “Risk mitigation for earthquake and landslides integrated project” (Faccioli 2008); the results from the reserch project “Risks from Earthquake Damage to Roadway Systems, REDARDS” (Werner et a. 2004) and from the project “Los Angeles Department of Water and Power, LADWP” (Shinozuka 2006), both developed by the Multidisciplinary Centre for Earthquake Engineering Reserch, MCEER funded by the Federal Highway Administration in USA; the Mitigation Information and Risk Identification System, MIRISK (Mina et al. 2008) created by the Research Centre for Disaster Risk Management, at Kyoto University and funded by the World Bank in agreement with the Alliance for Global Open Risk Analysis, AGORA. Table 1. Assessment methods and on-going reserch projects on the seismic performance of lifelines.
TRANSPORTATION WATER POWER HAZUS HAZUS HAZUS - ALA ALA - LESSLOSS - MIRISK - - REDARS LADWP LADWP
The framework proposed by HAZUS-MH tool
(FEMA 2007) has been judged a suitable reference for the development of a proper module within RiskScape for the assessment of lifelines seismic performance. Actually, HAZUS-MH provides the range of outputs that RiskScape would like to incorporate and provide to the end-user and makes reference (Paragraph 2.1) to a classification and representation of the exposed asset suitable for the available data on lifelines systems in New Zealand. All the fragility curves and loss-models provided by the HAZUS approach will be properly analysed and calibrated before their implementation with RiskScape. Reference will be made both to available historical data (e.g. Zhao et al 2008; Giovinazzi and King 2009) and on function developed
implementing on mechanical and analytical approaches (Bradley et al. 2009). Reference will be made undoubtedly to the relevant work of comparison and calibration of existing models for the assessment of seismic performance of pipelines system (Faccioli 2008).
Reference to the tools, REDARS and LADWP developed by the MCEER, will be made in order to include in RiskScape network analyses that could allow the assessment of the residual flow capacity and functionality of lifelines system after hazardous events and the investigation of the interdependencies between different lifelines systems. Finally some features of the MIRISK platform regarding the specific representation and dissemination of the results for policy and decision-makers will be considered.
2.1 Relevant features from HAZUS-MH to be included in Riskscape
The HAZUS-MH Earthquake Model (FEMA 2007) provides estimates of damage and loss to essential facilities, including transportation networks, electric power systems and potable water systems. HAZUS-MH model allows the evaluation of the expected physical damage, in terms of fragility curves and damage ratio, to lifeline components and sub-components. Based on the estimation of the physical damage, the economic losses and the restoration times (component functionality) are inferred. HAZUS-MH (FEMA 2007) is coupled with the latest Geographic Information Systems, GIS, technology allowing the representation of seismic-related damage scenarios before, or after, an earthquake occurs.
A feasibility study has been conducted in order to understand the limits and potentialities for the implementation of HAZUS-MH fragility models in New Zealand (Giovinazzi 2009). Definition of hazard parameters, asset attributes and level of spatial data aggregation form that study, aiming to the implementation of HAZUS-MH models within RiskScape for the specific case of seismic events, have been summarised in Giovinazzi and King (2009).
Regarding the GIS representation, HAZUS-MH aggregates and models spatial data as points, lines and polygons. Making reference to water systems, for example, the distribution pipelines are represented as linear components, with splits operated in occurrence of attribute changes, the reservoirs as polygon components and the storage tanks as point components.
The inventory data required by HAZUS-MH for the representation and the analysis of lifelines
subjected to earthquakes include the: 1) geographical location (Latitude and Longitude of the GIS model component); 2) classification of components and sub-components; 3) components and sub-components replacement costs.
According to the specific components’ vulnerability, different ground motion parameters are considered for the hazard representation, including: peak ground velocity, PGV; peak ground acceleration, PGA; permanent ground deformation, PGD; spectral acceleration for different fundamental period, Sa[T].
HAZUS-MH allows the assessment of different outputs, including: 1) the probability for the components of being in a certain damage state ; 2) damage ratio; 3) economic losses [$]; and 4) restoration time [days]. All the outputs resulting from the implementation of HAZUS-MH can be displayed as GIS maps.
3 CRITICAL ANALYSIS OF LIFELINES EXISTING DATA IN NEW ZEALAND
Network, components and critical link attributes for three geographically distributed systems (namely, road system, electric power system, potable water system) have been collected and their geo-spatial representation has been performed for a pilot area identified within Christchurch City. The existing databases have been critically examined, in order to identify if the information available would allow the seismic performance assessment of the three lifelines under the impact of earthquake ground shaking, and the representation of the results in term of GIS maps (Giovinazzi 2009).
The data processing has involved the following steps:
1. Identifying the basic components of the lifeline systems and their function in the overall system operation;
2. Clarifying which components are accounted for within existing loss estimation methods, and which ones are not, assuming that either they are not potentially vulnerable or that they are not critical to the overall system operation;
3. Reviewing the inventory of the data available for the pilot region, clarifying which components are represented, which information are associated to each component, the level of detail of the information, the model adopted for the geo-spatial representation of each component.
Some of the results from the aforementioned study are summarised and provided in the following.
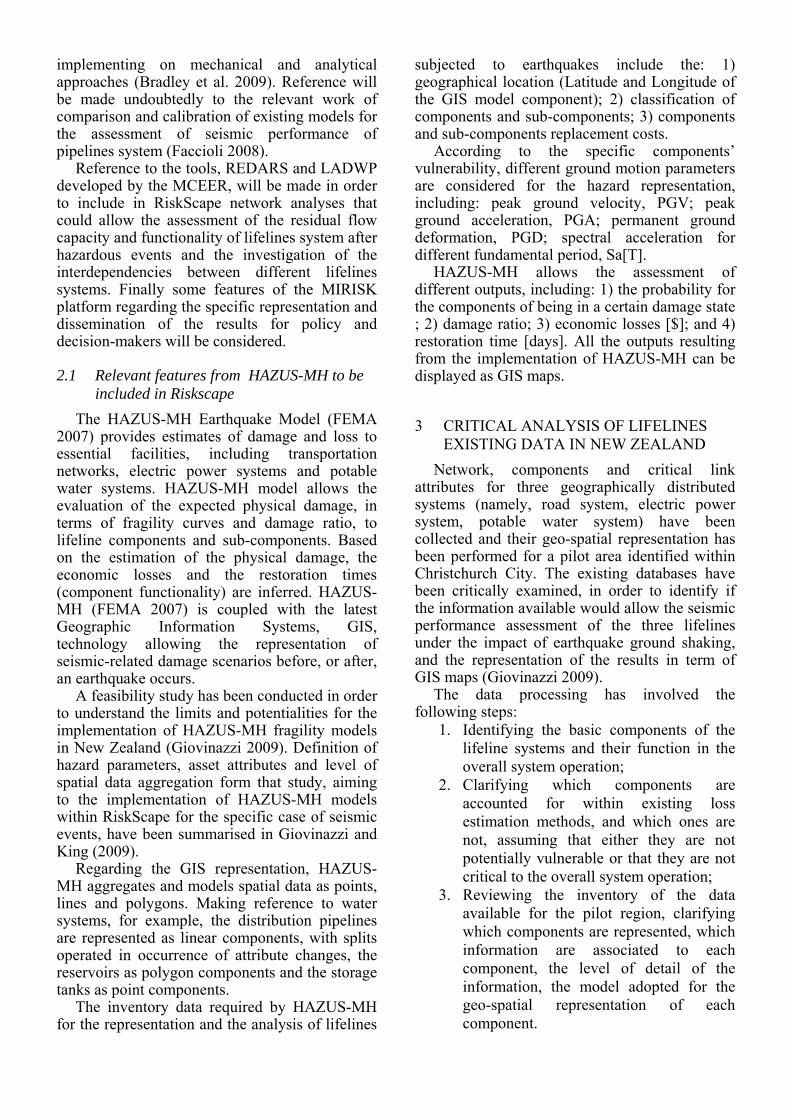
3.1 Power Distribution Network Data for the power distribution network of
Christchurch City and Banks Peninsula, were provided by Orion New Zealand LTD. The dataset consisted of 12 layers, corresponding to different components of the system (Figure 6). The data contained information on distribution circuits operated either via underground cables or overhead lines at different voltages, viz. 11kV distribution, 11kV network, 33kV system, and 66kV system. Additionally, there were three levels of substations: a) zone substations that on average supply about 6000 households; b) district substations for roughly 600 households; and c) distribution substations for 120 households. Substations that were located in basements were provided in a separate file. The data were delivered with several associated attributes, some of them unclear of their meaning, and others highly relevant for the risk assessment such as the size and the material of the cables and substations, the voltages, the year of installation, the relationship with the other components of the grid and the typology. Information on replacement costs and vulnerability were also provided during personal conversations with Orion personnel.
a)
b)
Figure 6. Electric Power system of Christchurch city and Banks Peninsula digital maps for the different components represented on a scale of : a) 1 to 1000; b) 1 to 250.
The data was provided in a GIS format as either lines or points. The linear components covered primarily the distribution circuits (either overhead lines or underground cables), while the nodal components included features associated with the substations. Splits occurred in the simple linear geometric shapes used for the representation of distribution circuits where there were attribute changes (e.g. construction year/month, replacement year).
The items identified within the ORION database and the associated information have been compared with the input requirements for the implementation of HAZUS-MH approach (Table 4). It has been observed, for instance, that, on one hand, the ORION database allows to distinguish between elevated crossing (overhead lines) and buried crossing (underground cables) distribution circuits, as required for HAZUS-MH. On the other hand, the presence of seismic design components or anchored components within distribution circuits required assumption of some inferences (Table 2). The inferences were established after analysis of the standards and codes used during the year of construction or during the year of replacement of the distribution circuit components. Similarly, inferences were established to allow identification of the transmission voltage for substations. In conclusion, the information and spatial data in the ORION database are adequate and suitable for the implementation of a simplified loss estimation approach as for HAZUS-MH. Furthermore the geo-spatial representation of the ORION components is definitely appropriate for the implementation of GIS analysis and for the result representation in terms of GIS maps (Figure 6). It
is worth highlighting that further information for the characterisations of electric power system components, additional to those required for the HAZUS-MH approach, are available within ORION database (e.g. information about the size and the material of the cables and lines). Table 2. Inferences (↔) between HAZUS-MH input requirements and ORION data.
HAZUS classification
ORION database
Possible Inferences
V LOW = 115 KV
V MEDIUM = 230 KV
V HIGH =500KV
incoming supply feeder voltage (11kv or 66kv)
V LOW ↔ incoming supply feeder 11kv
V MEDIUM ↔ incoming supply feeder 66kv
anchored components
no anchored components
Installation Year IY,
Replacement year RY
anchored component ↔ IY or RY≥2000
no anchored component ↔IY or RY<2000
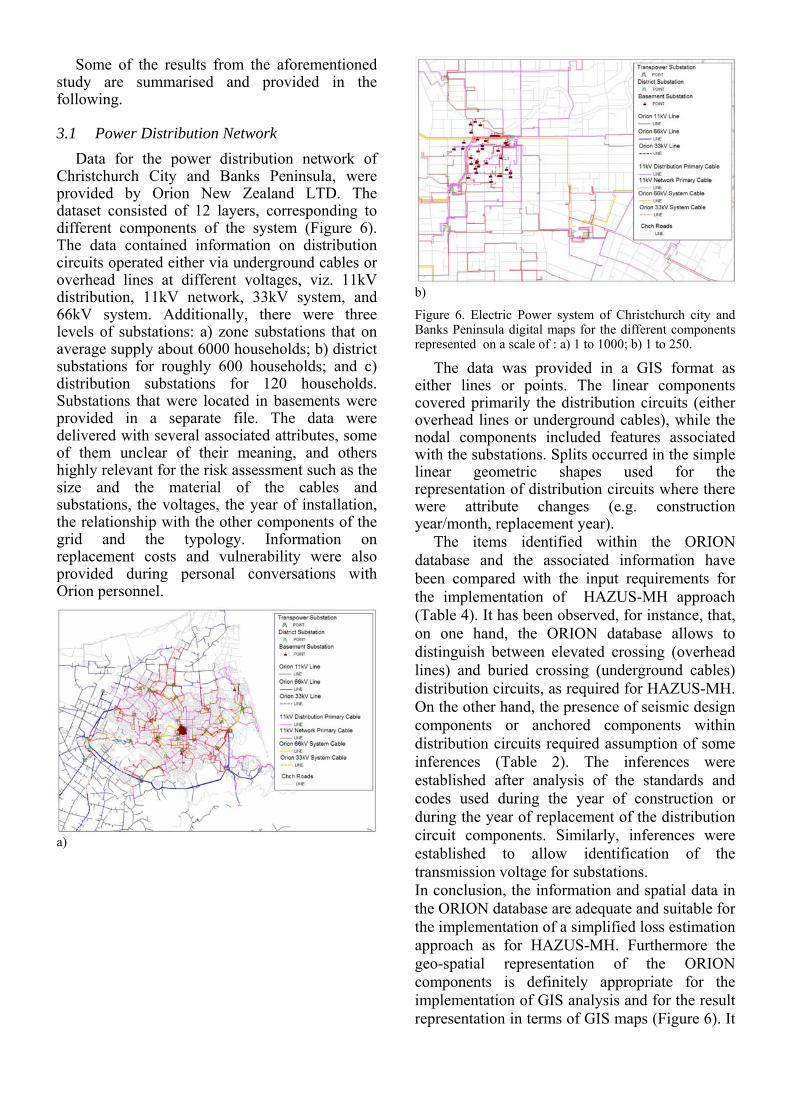
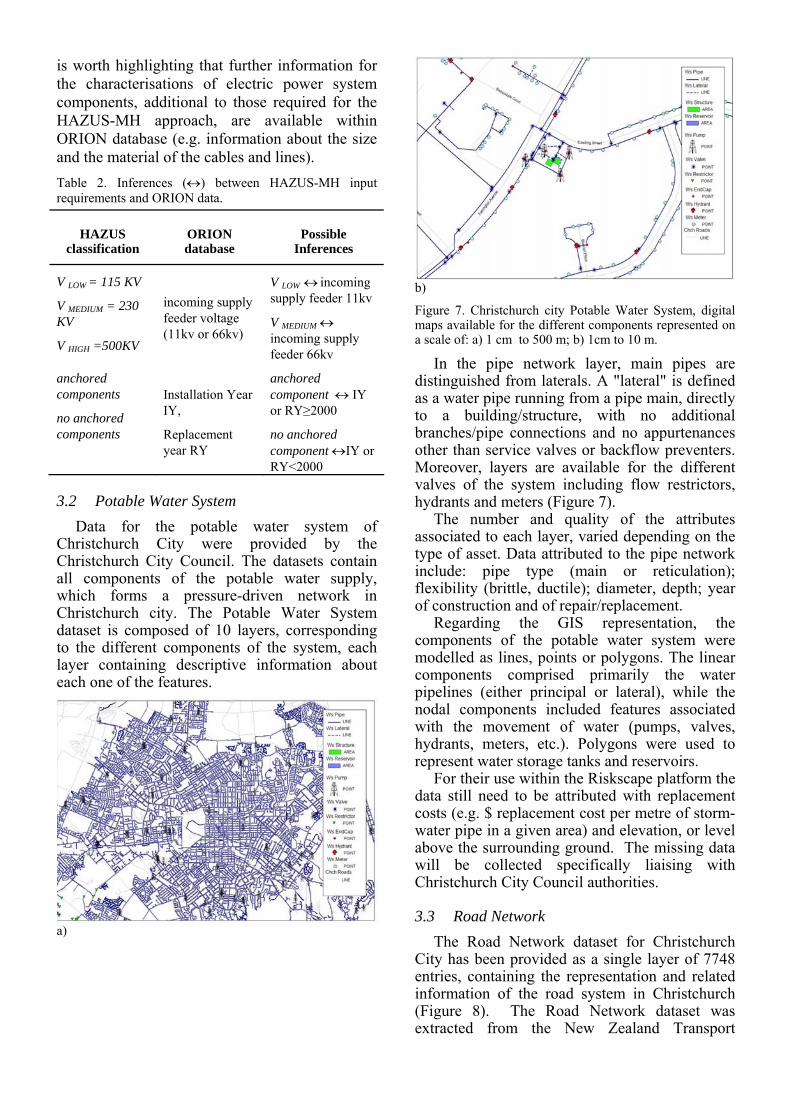
3.2 Potable Water System Data for the potable water system of
Christchurch City were provided by the Christchurch City Council. The datasets contain all components of the potable water supply, which forms a pressure-driven network in Christchurch city. The Potable Water System dataset is composed of 10 layers, corresponding to the different components of the system, each layer containing descriptive information about each one of the features.
a)
b)
Figure 7. Christchurch city Potable Water System, digital maps available for the different components represented on a scale of: a) 1 cm to 500 m; b) 1cm to 10 m.
In the pipe network layer, main pipes are distinguished from laterals. A "lateral" is defined as a water pipe running from a pipe main, directly to a building/structure, with no additional branches/pipe connections and no appurtenances other than service valves or backflow preventers. Moreover, layers are available for the different valves of the system including flow restrictors, hydrants and meters (Figure 7).
The number and quality of the attributes associated to each layer, varied depending on the type of asset. Data attributed to the pipe network include: pipe type (main or reticulation); flexibility (brittle, ductile); diameter, depth; year of construction and of repair/replacement.
Regarding the GIS representation, the components of the potable water system were modelled as lines, points or polygons. The linear components comprised primarily the water pipelines (either principal or lateral), while the nodal components included features associated with the movement of water (pumps, valves, hydrants, meters, etc.). Polygons were used to represent water storage tanks and reservoirs.
For their use within the Riskscape platform the data still need to be attributed with replacement costs (e.g. $ replacement cost per metre of storm-water pipe in a given area) and elevation, or level above the surrounding ground. The missing data will be collected specifically liaising with Christchurch City Council authorities.
3.3 Road Network The Road Network dataset for Christchurch
City has been provided as a single layer of 7748 entries, containing the representation and related information of the road system in Christchurch (Figure 8). The Road Network dataset was extracted from the New Zealand Transport
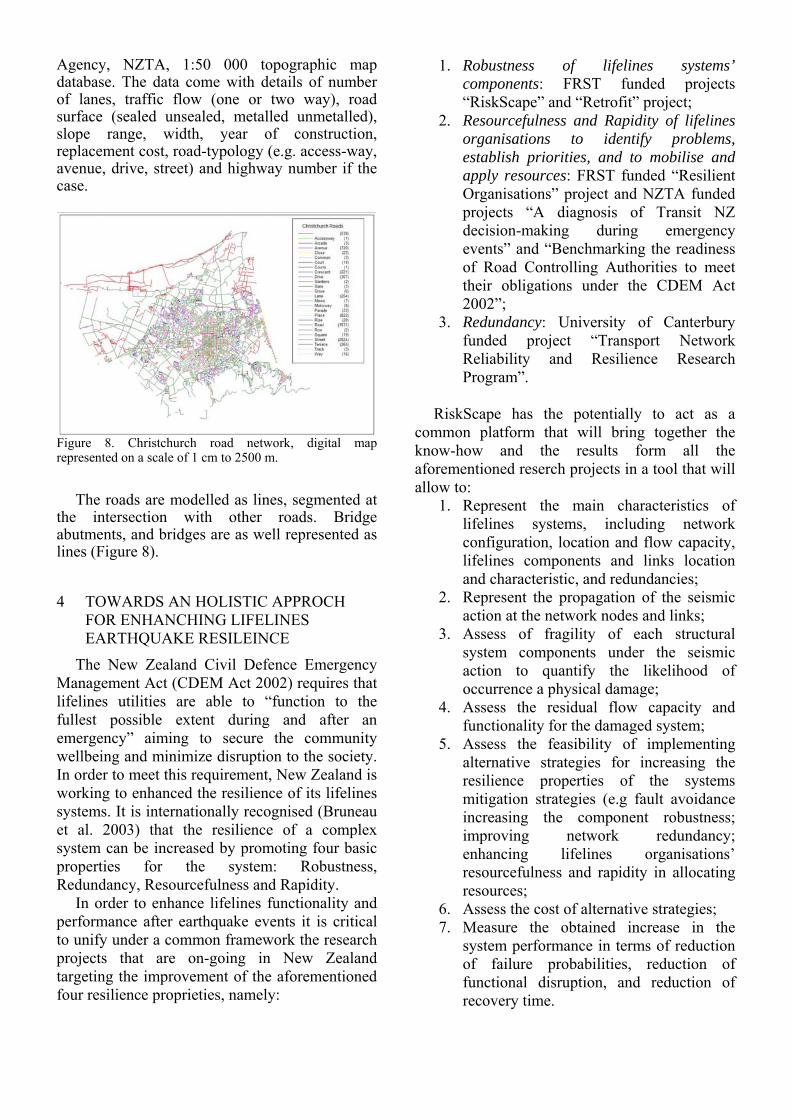
Agency, NZTA, 1:50 000 topographic map database. The data come with details of number of lanes, traffic flow (one or two way), road surface (sealed unsealed, metalled unmetalled), slope range, width, year of construction, replacement cost, road-typology (e.g. access-way, avenue, drive, street) and highway number if the case.
Figure 8. Christchurch road network, digital map represented on a scale of 1 cm to 2500 m.
The roads are modelled as lines, segmented at
the intersection with other roads. Bridge abutments, and bridges are as well represented as lines (Figure 8).
4 TOWARDS AN HOLISTIC APPROCH FOR ENHANCHING LIFELINES EARTHQUAKE RESILEINCE
The New Zealand Civil Defence Emergency Management Act (CDEM Act 2002) requires that lifelines utilities are able to “function to the fullest possible extent during and after an emergency” aiming to secure the community wellbeing and minimize disruption to the society. In order to meet this requirement, New Zealand is working to enhanced the resilience of its lifelines systems. It is internationally recognised (Bruneau et al. 2003) that the resilience of a complex system can be increased by promoting four basic properties for the system: Robustness, Redundancy, Resourcefulness and Rapidity.
In order to enhance lifelines functionality and performance after earthquake events it is critical to unify under a common framework the research projects that are on-going in New Zealand targeting the improvement of the aforementioned four resilience proprieties, namely:
1. Robustness of lifelines systems’ components: FRST funded projects “RiskScape” and “Retrofit” project;
2. Resourcefulness and Rapidity of lifelines organisations to identify problems, establish priorities, and to mobilise and apply resources: FRST funded “Resilient Organisations” project and NZTA funded projects “A diagnosis of Transit NZ decision-making during emergency events” and “Benchmarking the readiness of Road Controlling Authorities to meet their obligations under the CDEM Act 2002”;
3. Redundancy: University of Canterbury funded project “Transport Network Reliability and Resilience Research Program”.
RiskScape has the potentially to act as a
common platform that will bring together the know-how and the results form all the aforementioned reserch projects in a tool that will allow to:
1. Represent the main characteristics of lifelines systems, including network configuration, location and flow capacity, lifelines components and links location and characteristic, and redundancies;
2. Represent the propagation of the seismic action at the network nodes and links;
3. Assess of fragility of each structural system components under the seismic action to quantify the likelihood of occurrence a physical damage;
4. Assess the residual flow capacity and functionality for the damaged system;
5. Assess the feasibility of implementing alternative strategies for increasing the resilience properties of the systems mitigation strategies (e.g fault avoidance increasing the component robustness; improving network redundancy; enhancing lifelines organisations’ resourcefulness and rapidity in allocating resources;
6. Assess the cost of alternative strategies; 7. Measure the obtained increase in the
system performance in terms of reduction of failure probabilities, reduction of functional disruption, and reduction of recovery time.
5 CONCLUSION In this contribution, a short introduction about
the features and framework of the regional RiskScape Model, a multi-hazard loss modelling tool for New Zealand is provided. The results from an international review on methods and computational tools that could provide potentially suitable references for assessing the seismic performance of lifelines systems within RiskScape have been moreover discussed. Moreover the analysis of attributes and spatial data available for three geographically distributed systems, road network, electric power system, potable water system in Christchurch City has been presented. It has been possible to conclude that exhaustive, well documented and scientifically supported literature exists for the analysis of seismic lifelines performance at territorial scale and that existing data about lifelines systems in New Zealand would allow the implementation within the RiskScape platform of existing vulnerability and fragility methods. A final discussion has highlighted the potentialities for Riskscape of being further developed as a supporting tool for the assessment and analysis of alternative strategies for enhancing the lifelines resilience to natural hazards.
6 ACKNOWLEDGMENTS The financial support provided by the NZ
Foundation of Science and Technology through the FRST- Research Program “The Regional Riskscape model” and the financial support provided by the Earthquake Commission EQC for this specific research is gratefully acknowledged. Our thanks go to Christchurch City Council & Environment Canterbury and to Orion New Zealand Limited for their kind collaboration. Many thanks to Jim Cousin, Peter Wood and Stefan Reese for the useful comments provided.
REFERENCES ALA (2005a). Guideline for assessing the performance of
Electric Power System in Natural Hazard and Human Threat Events. American Lifelines Alliance. FEMA & National Institute of Building Sciences.
ALA (2005b). Guidelines for Implementing Performance Assessment of Water System. American Lifelines Alliance. FEMA & National Institute of Building Sciences.
ALA (2004). Waterwaste System Performance Assessment Guidelines. American Lifelines Alliance. FEMA & National Institute of Building Sciences.
ALA (2001). Seismic fragility formulations for water systems, Part 1-Guideline. American Lifelines
Alliance. FEMA & National Institute of Building Sciences.
Bell, R.G.; King, A. (2006). Regional RiskScape: A multi-hazard loss modelling tool. In: Ammann, W.J; Haig, J.; Huovinen, C.; Stocker, M. (Eds.), Proceedings of the International Disaster Reduction Conference 2006, Davos, Switzerland, 28 Aug – 1 Sep 2006.
Bradley B.A., Cubrinovski M., Dhakal R.P. and MacRae G.A. (2009). Probabilistic Seismic Performance Assessment of a Bridge-Foundation-Soil System. Proc. of NZSEE 09 Conference. New Zealand.
Cousin J. W., Johnston D. M., Smith W. D., (2007). Earthquake and Volcanic Risks to Assets of the Taupo District Council. GNS Science Consultancy Report 2007/80. May 2007.
FEMA (2007). HAZUS-MH Multi-hazard loss estimation methodology, Earthquake Model - Technical Manual. Federal Emergency Management Agency. Department of Homeland Security, Washington D.C.
Giovinazzi and King (2009). Estimating seismic impacts on lifelines: an international review for RiskScape. Proc. of NZSEE 09 Conference. New Zealand.
Giovinazzi (2009). Multi-hazards performance of geographically distributed systems. GNS Technical Report.
King, A.; Cousins, J.; Bell, R. (2005). Riskscape New Zealand: A multihazard loss modelling tool. Paper presented at International Conference on Earthquake Engineering “Earthquake Engineering in the 21st Century – IZIIS 40 EE-21C”,Skopje/Ohrid, Macedonia, 27 Aug to 1 Sept 2005.
Mina C., Kobayashi K., Scawthorn C. and Porter K. (2008). Open Risk Analysis Software: Data and Methodologies. Journal of Applied Computing in Civil Engineering.
Reese, S.; Bell, R.G.; King, A.B. 2007. RiskScape—A new tool for comparing risk from natural hazards. Water & Atmosphere, 15 (3): 24-25.
Shinozuka M., Chang S. E., Cheng T. C., Feng M., O’Rourke T. D., Saadeghvaziri M. A., Dong X., Jin X., Wang Y., Shi P., (2006). Resilience of Integrated Power and Water Systems. Multidisciplinary Centre for Earthquake Engineering MCEER Research Progress and Accomplishments Report 2006. Pp. 65-86.
Werner S. D., Lavoie J.P., Eitzel C., Cho S., Huyck C., Ghosh S., Eguchi R. T., Taylor C. E. & Moore J. E., (2004). REDARS 1: Demonstration Software for Seismic Risk Analysis of Highway Systems. Multidisciplinary Centre for Earthquake Engineering MCEER Research Progress and Accomplishments Report 2001-2003. Pp. 17-34.
Zhao J. X., Cousins J., Lukovic B., and Smith W. (2008). Critical factors for restoration of water supply pipelines in the Hutt City, New Zealand after a magnitude 7.5 earthquake from the Wellington fault. Proc. of the 14th World Conference on Earthquake Engineering.