toward real-time sleep monitoring using combined wearable
TRANSCRIPT

TOWARD REAL-TIME SLEEP MONITORING USING
COMBINED WEARABLE-AMBIENT SENSORS
BY
LERIT NUKSAWN
A THESIS SUBMITTED IN PARTIAL FULFILLMENT OF
THE REQUIREMENTS FOR THE DEGREE OF MASTER OF
ENGINEERING (INFORMATION AND COMMUNICATION
TECHNOLOGY FOR EMBEDDED SYSTEMS)
SIRINDHORN INTERNATIONAL INSTITUTE OF TECHNOLOGY
THAMMASAT UNIVERSITY
ACADEMIC YEAR 2014


ii
Acknowledgements
My sincerest gratitude goes to my supervisors, Dr. Ekawit Nantajeewarawat and Dr.
Surapa Thiemjarus, for their supervision and constructive comments along the progress.
Moreover, I would like to express my genuine appreciation relating to the kind
assistance they provided during the time I suffered from depression. Without their
guidance and support, this thesis will not be completed as it is.
I also would like to express my gratitude to Dr. Chusak Thanawattano and Dr.
Prakobkiat Hirunwiwatkul for providing the device and data for my experiment as well
as their comments and advices in the process of the research.
I addition, I would like to express my gratitude to Prof. Manabu Okumura for his
constructive comments and advices on the research.
Furthermore, I would like to thanks Natthapon Pannurat and Tanatorn Tanantong for
their help and corroboration during the progress.
This research is financially supported by Thailand Advanced Institute of Science and
Technology (TAIST), National Science and Technology Development Agency
(NSTDA), Tokyo Institute of Technology, Sirindhorn International Institute of
Technology (SIIT), Thammasat University (TU) and the National Research University
Project of Thailand Office of Higher Education Commission. The BSN toolkits used in
this study are supported by the Telecommunication Research and Industrial
Development Institute (TRIDI).

iii
Abstract
[TOWARD REAL-TIME SLEEP MONITORING USING COMBINED
WEARABLE-AMBIENT SENSORS]
by
LERIT NUKSAWN
Computer Science: Bachelor of Science, Sirindhorn International Institute of
Technology, Thammasat University, 2010
The main focus of this thesis is to develop a continuous monitoring of sleep postures
using a tri-axial accelerometer attached to the subject’s chest and a camera. Two studies
on methods for sleep posture classification were conducted. The first study employed
supervised clustering as the classification model. The postures are classified into five
classes according to body position, namely, sitting, lying backward, lying on the left,
lying forward, and lying on the right. System validation has been compared to the
actigraph system used at the hospital. An average accuracy of 95.78 percent has been
achieved. The second study used different feature selection and classification
algorithms. Five postures as in the first study are classified, with an addition two more
activities, namely standing and walking. Two feature selection algorithms and seven
classification algorithms were investigated. By using four features according to the rank
obtained from Relief-F, and a multi-layer perceptron classifier, an average accuracy of
85.68 percent has been achieved. Based on the selected model, a real-time logging
system of sleeping images triggered by changes in sleep posture detected using a
wireless sensor node has been developed.
Keywords: sleep monitoring, posture recognition, tri-axial accelerometer, feature
selection, body sensor network

iv
Table of Contents
Chapter Title Page
Signature Page.............................................................................................. i
Acknowledgements ..................................................................................... ii
Abstract ..................................................................................................... iii
Table of Contents ....................................................................................... iv
List of Figures ............................................................................................ vi
List of Tables .......................................................................................... viii
1 Introduction ................................................................................................. 1
2 Literature Review ........................................................................................ 5
2.1 Wearable Sensors for Health Monitoring ............................................ 5
2.2 The Use of Behavioral Profiles ............................................................ 6
2.3 Existing Behavioral Profiling Systems ................................................ 7
2.3.1 Network Behavior Profiling Systems ......................................... 7
2.3.2 Human Behavioral Profiling in Cyber-environment .................. 9
2.3.3 Human Activity Behavioral Profiling ...................................... 10
2.4 Activity Recognition Algorithms ....................................................... 11
2.5 Sleep Monitoring ............................................................................... 13
2.5.1 Sleep Behavioral Profile ........................................................... 14
2.5.2 Sleep Position Recognition....................................................... 14
2.6 Classification Algorithms .................................................................. 16
2.6.1 Bayesian Network .................................................................... 16
2.6.2 Naïve Bayesian Network .......................................................... 18
2.6.3 Support Vector Machine........................................................... 19
2.6.4 Decision Tree............................................................................ 21
2.6.5 Instance-based Learning ........................................................... 22
2.6.6 Multi-Layered Perceptron ........................................................ 23
2.7 Feature Selection ................................................................................ 24
2.7.1 Relief ........................................................................................ 25
2.7.2 Support Vector Machine Recursive Feature Elimination ......... 25
2.8 Development Technology .................................................................. 26
3 Offline Classification of Sleep Positions .................................................. 28

v
3.1 Sensing Device and Experimental Setup ........................................... 28
3.2 Data Description ................................................................................ 29
3.3 Data Analysis ..................................................................................... 31
3.4 Implementation and Evaluation ......................................................... 32
4 Real-Time Sleep Posture Classification .................................................... 35
4.1 Data Collection .................................................................................. 35
4.2 Data Analysis ..................................................................................... 36
4.3 Experimental Results ......................................................................... 38
5 A Real-Time Sleep Monitoring System .................................................... 41
5.1 Java-based Client Application ........................................................... 41
5.2 Web-based Real-Time Sleep Monitoring System.............................. 42
6 Conclusions and Future Work................................................................... 45
References ................................................................................................. 47

vi
List of Figures
Figure Title Page
Figure 1. Different elements of the algorithm proposed by Sharafuddin et al: (a)
a client-centered BPRM (b) a client-centered subspace representation
(c) visual representation of subspace distance matrix (d) 3-D
embedding and K-means clustering (From [11]). ...................................... 8
Figure 2. The distribution of relative uncertainty on free dimensions for a
selected source’s IP cluster (From [26]) .................................................... 9
Figure 3. An overview of the personal life log system architecture (From [24]). ... 10
Figure 4. The concept model of state and situation (From [23]) ............................. 11
Figure 5. A real-time rule-based activity classification framework (From [30]). ... 12
Figure 6. A context domain specification (From [30]). ........................................... 13
Figure 7. Most common sleeping postures for classification (From [36]). ............. 15
Figure 8. An example of a belief-network structure................................................ 17
Figure 9. A common form of a naive Baysian classifier depicted as a Bayesian
network (From [44])................................................................................. 19
Figure 10. An example of a SVM problem in finding a maximum margin
hyperplane between two given classes (picture From [46]). ................... 20
Figure 11. A two-hidden-layer MLP with D inputs, K processing elements in
hidden layer #1, L processing elements in hidden layer #2 and M
outputs (From [52]). ................................................................................. 24
Figure 12. Pictures of experimental device from NECTEC. (a) device with its tri-
axial accelerometer coordinate system, (b) storage card slot position
of the device, and (c) status indicator LED of the device. ....................... 28
Figure 13. Device placement location and orientation (a) chest belt, (b) device
installation orientation, and (c) device location. ...................................... 29
Figure 14. Five activities for prediction. ................................................................... 29
Figure 15. A plot of the 3D acceleration signals in a training data routine during
the five different sleep postures. .............................................................. 30
Figure 16. Plots of signal and an input dialog for labeling data. ............................... 31

vii
Figure 17. A plot of sum of squared differences magnitude for the signal shown
in Figure 15. ............................................................................................. 32
Figure 18. Class-specific plots of acceleration mean features of all subjects on
the x-y , y-z, and x-z planes, respectively. ............................................... 32
Figure 19. Time series plots of (a) the acceleration signals (b) the corresponding
results from the activity classification algorithm and (c) the sum of
squared differences magnitude. ................................................................ 33
Figure 20. BSN development kit v3 (From [72]) ...................................................... 35
Figure 21. A BSN node equipped with a tri-axial accelerometer (a), and its
coordinate system with respect to subject’s body (b). ............................. 36
Figure 22. A subject while performing seven activities (C1 - C7). ........................... 37
Figure 23. The graphs show the overall accuracy of different classifiers when
applied on datasets with varying numbers of features according to the
feature rank obtained from Relief-F. ........................................................ 39
Figure 24. The graphs show the overall accuracy of different classifiers when
applied on datasets with varying numbers of features according to the
feature rank obtained from SVM-RFE. .................................................... 40
Figure 25. Overall architecture of the real-time sleep monitoring system. ............... 41
Figure 26. A screenshot of the client application while processing and classifying
acceleration signals received from a BSN node. ...................................... 42
Figure 27. A screenshot of the web application displaying basic user information
and summarized information of user’s records. ....................................... 43
Figure 28. (a) Screenshots from the web application displaying a sleeping
positions plot and a snapshot, and (b) snapshots of sleep positions
during one night. ...................................................................................... 44

viii
List of Tables
Table Title Page
Table 1. Biosensors and biosignals (From [9]) ........................................................ 5
Table 2. Wireless communication standards (From [9]) .......................................... 6
Table 3. Pseudo code for the K2 algorithm (From[42]). ........................................ 18
Table 4. Pseudo code for the C4.5 algorithm (From [49]). .................................... 22
Table 5. The pseudo code for k-nearest neighbor algorithm (From [49]). ............ 23
Table 6. Accuracy and computational time for posture classification with and
without using the SSD measure. .............................................................. 34
Table 7. Feature descriptions. ................................................................................ 37
Table 8. Feature rank results from Relief-F and SVM-RFE feature selection
algorithms................................................................................................. 39
Table 9. The confusion matrix of NN classifier with four features according to
the feature rank obtained from Relief-F. .................................................. 40

1
Chapter 1
1 Introduction
The healthcare cost as well as the ageing population in the world are increasing, hence,
there has been an increasing demand for a monitoring system that can monitor patients’
health status in their home environment [1]. Therefore, activity recognition system
using wearable wireless sensor for health monitoring has attracted several research
interests.
In addition, it is well-known that the quality of sleep has a relevant impact on daytime
mood and performance of an individual [2]. Poor sleep quality can lead to other health
issues, such as diabetes [1], dementia [2], and a decrease in accuracy of emotional
memory recognition [3]. On the other hand, sleeping posture can affect your health as
well as quality of sleep. A poor sleep posture can cause a serious problem to a person’s
spine, as well as stress on muscles, hips and shoulders. Maintaining a proper posture
while sleeping, therefore, is essential. Most people, however, are unaware of having
problems with their own sleep and sleep postures.
Sleep monitoring could play an important role in preventing health issues, detecting
symptoms, and evaluating the quality of sleep. Users who will benefit from a sleep
monitoring system are such as those with sleep apnea and those with pressure ulcers.
Obstructive sleep apnea, which is a common type of sleep apnea, is a potentially serious
sleep disorder in which breathing repeatedly stops and starts while sleeping. It is
characterized by recurrent episodes of complete obstruction (apnea) or partial
obstruction (hypopnea) of the upper airway [4]. Obstructive sleep apnea patients would
be suggested to sleep on their side instead of on their back in order to loosen obstruction
of patients’ airway [5].

2
Pressure ulcers, or bedsores, are injuries that often occur in people who have problems
repositioning their bodies. The cause of bedsores is prolonged pressure on bony
prominences, which cut off blood circulation to skin tissues. Lack of blood flow to skin
tissues for more than a few hours will lead to tissue death and an ulcer or a sore [6]. As
we are entering the aging society era, there exist more and more elderly and bedridden
patients who require a special care. For bedridden patients, it is recommended for
caretakers to reposition the patient’s body every 2 hours [7, 8].
Polysomnography (PSG), or sleep study, could be conducted for diagnosis of sleep
apnea and various sleep disorders. PSG conducted at a hospital deploys various sensors
to monitor biological changes that occur during sleep. The biological changes monitored
during sleep are such as heart rhythm, blood pressure, respiration rate, eye movements,
electrical activities in the brain, electrical activities produced by skeletal muscles, and
body positions. Those biological changes are monitored by various signals such as
electroencephalogram (EEG), electrooculogram (EOG), electrocardiogram (ECG),
electromyogram (EMG), pressure on patient’s bed, and acceleration of attached device
[9]. However, numerous sensors utilized in PSG, plus hospital environment, might
obstruct patients from revealing their true sleep behavior, which could result in an
ineffective diagnoses.
The advances in wearable sensors, wearable computing and wireless technologies,
enabled the design and development of various activity monitoring platforms.
Behavioral profile, i.e. activity records, of a person is useful for hospital and healthcare
services, because it allows physicians to analyze daily behavior of a person in order
early detect symptoms, or give suitable advises, such as arrange an exercise schedule.
Furthermore, behavioral profile can be used as a reference of normal activity for an
emergency warning system.
Currently, wearable systems for health monitoring may comprise various types of
sensors, wearable, or even implantable [9]. The system recognition system with
multiple sensor nodes should be able to give higher accuracy, because of more
information obtained from different kinds of sensors.

3
This research presents the design of a behavioral profiling (i.e. activity recording),
system, focusing on sleeping behavior. The system will utilize a tri-axial accelerometer
wireless sensor node and a camera for data collection. Activities of a user can be
classified from acceleration signals received from a tri-axial accelerometer attached
onto the user’s body. However, there are symptoms (e.g. heartburn, back pain and stiff
neck) caused by poor sleep postures that cannot be captured using positions classified
using an accelerometer alone, but can be analyzed using video footages. Nevertheless,
storing video footages consume a significant amount of storage space. This causes the
process of analyzing sleep behaviors from video footages to be extremely time and
resource consuming. Since lying is a static activity, most of the time there will be no
movement in the footages. Therefore, instead of recording a video footage of sleep
postures during the whole night, the system was designed to keep snapshots of sleep
postures when the user changes his/her activity. Snapshots of sleep postures together
with a graph that summarizes sleep positions allow physicians to analyze sleep
behaviors in a short period of time. The goal of our research is to develop a real-time
sleep posture monitoring system with a web application as user interface for physicians
or caretakers.
The structure of this thesis is as follows. Chapter 2 provides a brief overview of existing
projects and studies related to behavioral profiling, wearable sensors for health
monitoring, activity recognition algorithm, sleeping posture classification,
classification algorithms, feature selection, and web development technology utilized
in this research. Chapter 3 presents an offline method for sleep posture monitoring using
an experimental sensing device, without wireless capability, made by NECTEC.
Chapter 4 presents an online method for sleep posture monitoring using a wireless Body
Sensor Network (BSN) [10] node equipped with a tri-axial accelerometer. Chapter 5
presents a real-time sleep monitoring system, capable of taking snapshots of sleep
postures. The final chapter concludes this thesis.

4
Most parts of this thesis have been published in or submitted to the following peer-
reviewed conferences:
1. L. Nuksawn, S. Thiemjarus, E. Nantajeewarawat, C. Thanawattano, and K.
Hirota., "An Accelerometry-based Continuous Sleep Monitoring System,"
presented at the International Conference on Information and Communication
Technology for Embedded Systems (ICICTES2012), Bangkok, Thailand, 2012.
2. L. Nuksawn, S. Thiemjarus, and E. Nantajeewarawat., “Real-Time Sensor- and
Camera-based Logging of Sleep Postures,” submitted to the nineteenth
International Computer Science and Engineering Conference (ICSEC2015),
Chiang Mai, Thailand, 2015.

5
Chapter 2
2 Literature Review
2.1 Wearable Sensors for Health Monitoring
The design and development of wearable sensors for health monitoring has garnered
lots of attention in the scientific community and the industry because of increasing
healthcare costs and advances in miniaturized bio-sensing sensors, smart textiles,
micro-electronics, and wireless communications technology [9]. A health monitoring
system may utilized various types of sensors. Table 1 provides a list of several
commonly used sensing technology, and Table 2 shows commonly used wireless
communication standards.
Table 1. Biosensors and biosignals (From [9])
Type of Bio-signal Type of Sensor
Electrocardiogram (ECG) Skin/Chest electrodes
Blood pressure Arm cuff-based monitor
Body/Skin temperature Temperature probe / skin patch
Respiration rate Piezoelectric / Piezoresistive sensor
Oxygen saturation Pulse oximeter
Heart rate Pulse oximeter /skin electrodes
Perspiration Galvanic skin response
Heart sounds Phonocardiograph
Blood glucose Strip-based glucose meters
Electromyogram (EMG) Skin electrodes
Electroencephalogram (EEG) Scalp-placed electrodes
Body movements Accelerometer

6
Table 2. Wireless communication standards (From [9])
Range Data Rate
(Maximum)
Power
Consumption
ZigBee 10-75m 20/40/250kbps 30mW
Bluetooth 10-100m 1-3Mbps 2.5-100mW
Infrared 1m 16Mbps N/A
MICS 2m 500kbps 25μW
802.11g 200m 54Mbps 1W
2.2 The Use of Behavioral Profiles
The use of behavioral profiles has been investigated in many application domains.
Research studies in network behavioral profiling have been conducted for different
network levels. The profile can be utilized for categorizing types of network and its sub-
networks, adjusting firewall, and detecting anomalies in the network [11, 12]. A TV
watcher behavioral profile can be generated by monitoring watching behavior of a user.
Together with a record of his/her preferences and information, the generated profile is
used for recommending a limited list of ranked TV contents to the user [13, 14]. In a
cyber-environment, behavioral profiles have been used for user identification [15, 16]
and cyber-criminal detection [17]. There are also attempts to infer user information such
as age, gender and interest from the online behavior, since those information is useful
for website and product recommendation [18, 19].
Activity profile of an individual, in particular, is useful for hospital and healthcare
services. It allows physicians to analyze daily behavior of a person in order to early
detect symptoms, or give suitable advices such as arranging an exercise schedule. Many
studies on the topic of behavioral recording and profiling are conducted under the
concepts of actigraphy and LifeLog. Actigraphy is a long-term non-invasive method for
continuous motion measurement using an embedded recorder. It has been used in sleep
monitoring, activity recording and movement recording [20-22]. An actigraph device
usually employs a piezoelectric accelerometer for measuring motion and internal

7
memory for recording data. In some implementation, however, the data could be
transmitted on the fly. LifeLog is a set of data comprising daily activities of an individual
collected in one or multiple media forms [23]. Various kinds of data recorded by a
LifeLoging system include body acceleration, heart rate, locations, and images.
Research studies on LifeLog have been focused on activity classification, data
segmentation, and ontology exploitation [23-25].
2.3 Existing Behavioral Profiling Systems
This section presents a number of research studies related to behavioral profiling in
various fields. Depending on the field of the study, data processing, classification
techniques, features used, and data collection methods can be different. Research
studies related to sleep behavioral profile are described Section 2.5.1.
2.3.1 Network Behavior Profiling Systems
Sharafuddin et al [11] proposed a methodology for block-level network traffic behavior
profiling and tracking. Pairs of source and destination port are used as feature to analyze
traffic of the network. Ports used in network connections can give rough information
on types of user’s activities. By constructing activity matrix of source and destination
ports within a block (i.e., IP address block), constructing subspace representation of
behavior of blocks, computing a subspace distance matrix, and applying spectral
clustering, clusters of blocks with the similar behavior are obtained. The behavioral
profile of network users can provide a better knowledge of normal activities, and
changes over time in a network, as well as provide information for detecting abnormal
activities and attacks.
The algorithm starts by constructing a “block-wise port activity matrix” (BPAM) to
records the activities of each host within the block on source and destination ports, as
shown in Figure 1(a). After that, “Singular Value Decomposition” method is applied to
each BPRM to obtain subspace representations of each block, as shown in Figure 1(b).
Pairwise subspace distances between every pair of blocks are then computed, as shown
in Figure 1(c). Finally, spectral clustering is applied to the subspace distance matrix to

8
obtain clusters of blocks with similar behavior. Finally, K-means clustering algorithm
is applied to each cluster. The clusters which represented by “o” means they are loosely
clustered, where as “+” means tightly clustered, as shown in Figure 1(d).
Figure 1. Different elements of the algorithm proposed by Sharafuddin et al: (a) a
client-centered BPRM (b) a client-centered subspace representation (c) visual
representation of subspace distance matrix (d) 3-D embedding and K-means
clustering (From [11]).
Xu et al [12, 26, 27] also conducted several studies on the field of network behavioral
profile. The methodology utilizes five features for behavioral profiling, namely, IP,
port, and protocol of source and destination node collected in a time interval. However,
the protocol is not focused in the study. Since it is not practical to examine all hosts and
destinations, the system therefore extracts significant clusters of interest, with number
of connections exceeds a calculated threshold in order to reduce number of data for
analysis. Based on a selected source IP cluster, the algorithm calculates relative
uncertainty of feature distributions on three other dimensions as shown in Figure 2. The
clustered points indicate similarity between them. The behavioral classifier, using the
(a) (b)
(c) (d)

9
clustered points as a model together with dominant state analysis technique, is able to
classify source IP cluster to behavior classes. The behavioral profile can be used to find
various common or anomalous events.
Figure 2. The distribution of relative uncertainty on free dimensions for a selected
source’s IP cluster (From [26])
2.3.2 Human Behavioral Profiling in Cyber-environment
Ali et al [18] proposed an agent-based user-profiling model for behavior monitoring. A
model of an Agent Framework for monitoring activities of Internet users, in online
social community, for building users’ personality profile was proposed. The system
utilized a dummy social community website, a Honeypot website, which will capture
information of user that enters or leaves a monitored area. Each Honeypot website is
linked with an agent framework. The activities of each registered user is recorded and
used to generate personality profile.
Forte et al [19] presented an attempt to investigates the possibility to determine the
profile of an online shopper solely based on outside observation. The actions performed
while each subject shops for gifts for a fictitious person, with various traits and hobbies,
are recorded. Recorded data includes type of action, sequence of actions, time between
actions, and confidence ratings. The method of analysis is significance testing using
two-sample t-tests and one-way ANOVA analysis techniques. The result indicated that
utilizing statistical methods on recorded actions and time spent on each decision could
allow the researcher to extract information about shoppers, and infer connections
between the shoppers and the gift recipients.

10
2.3.3 Human Activity Behavioral Profiling
Lee et al [24] presented a single tri-axial accelerometer-based real-time personal life
log system capable of activity classification and exercise information generation. The
sensor was placed on the center of subject’s chest. A sampling frequency of 50Hz was
used. The system utilized a hierarchical artificial neural network classifier for
classifying seven activities, namely lying, sitting, standing, driving, going upstairs,
going down stairs, and walking. Exercise information was computed based on the
activity recognition result. The system achieved an average recognition rate of 84.8%.
The database was created using Microsoft Office Access. Figure 3 depicts an overview
of the system architecture.
Figure 3. An overview of the personal life log system architecture (From [24]).
Takata et al [23] proposed a technique to classify daily activities of a person from
Lifelog data recorded from multiple sensors, i.e., a wearable camera, a tri-axial
accelerometer attached to subject foot, a GPS signal receiver, and a watch-type heart
rate sensor. Contexts captured are divided into two types, i.e., individual contexts
(actions), and surrounding contexts. A space-oriented model is used to map surrounding
contexts to a spatial state based on two features, i.e., geographical location (e.g. shops
or gas stations) and site attributes (e.g. dangerous or safe for kids). Another action-

11
oriented model is used for mapping individual contexts to an action state based on three
features, i.e., motion data, heart rate and related attributes (e.g. normal workout or over-
training). An individual activity situation is achieved from combining both spatial state
and action state as shown in Figure 4. A flow of context-based analysis for a
representation image for an individual activity situation is also presented. Four
application prototypes were developed from the proposed technique, two of which are
related to behavioral profiling, namely, outdoor kid’s safety care and outdoor running
workout assistance.
Figure 4. The concept model of state and situation (From [23])
2.4 Activity Recognition Algorithms
Baek et al [28] proposed an activity recognition method using a tri-axial accelerometer.
The method classifies activities from various features extracted from the accelerometer
data, including mean, standard variation, skewness, kurtosis, and eccentricity. Using a
neural network classifier, the system can classify various activities such as standing,
sitting, lying, walking, running and walking up/down stairs. Pirttikangas presented
activity recognition system based on data collected using a tri-axial accelerometer and
a heart-rate sensor. Calculated features were selected with a forward-backward
sequential search algorithm. Multilayer perceptron and instance based learning (k-NN)
were applied for activity recognition. In the experiment, k-NN gave better results than
multilayer perceptron.

12
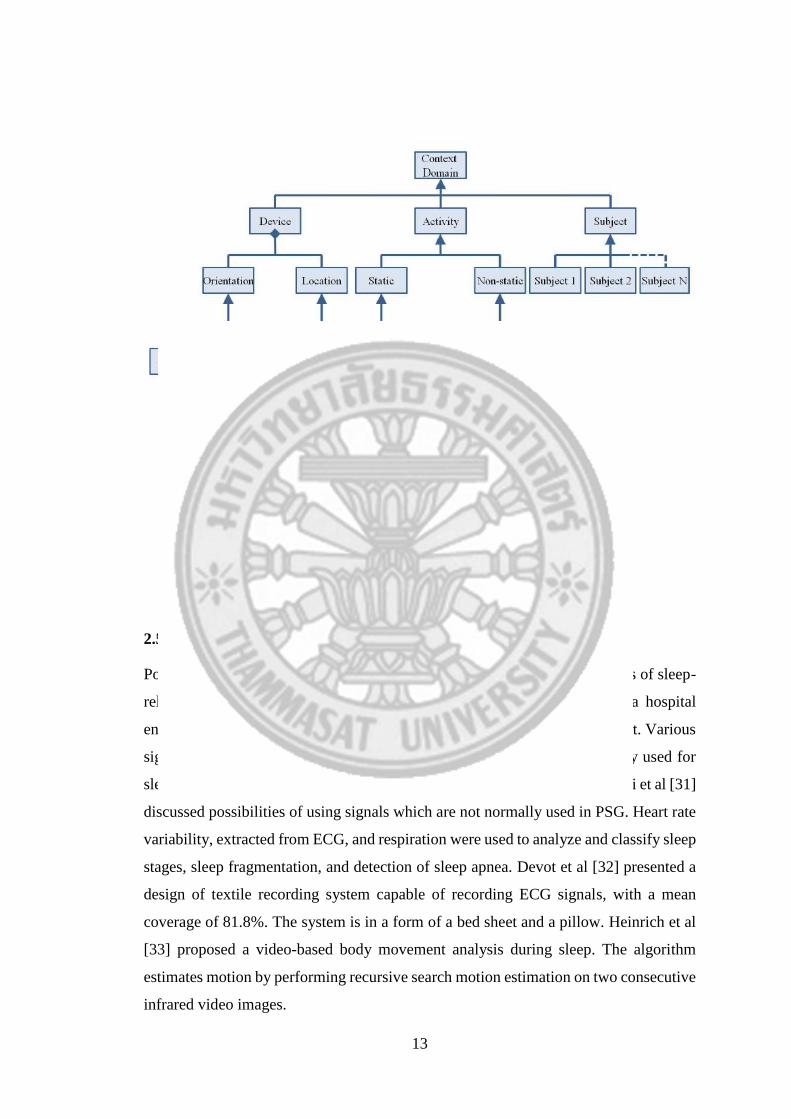
Theekakul et al [29, 30] proposed A real-time activity recognition framework using a
rule-based approach. A single tri-axial accelerometer placed on a belt-clip Pulse
Oximetry (SpO2) sensor, an integrated sensing device developed by Imperial College,
was employed at a sampling rate of 50 Hz. The means, standard deviation, and overall
deviation magnitude values were used as features for activity classification. A fixed
window size of 1 second and a shifted window size of 0.5 second were used. In the rule
learning part, domain specific knowledge is used for selecting appropriate features for
construction of classification rules. The framework is capable of device orientation
detection and location detection. The system achieves overall accuracy of 78.93%. The
proposed rule-based classification framework is shown in Figure 5. Figure 6 depicts the
context domain specification.
Figure 5. A real-time rule-based activity classification framework (From [30]).
13
Figure 6. A context domain specification (From [30]).
2.5 Sleep Monitoring
Polysomnography (PSG), or sleep study is a common approach for diagnosis of sleep-
related health issues. However, due to numerous wired sensors used in a hospital
environment, the recorded data may not reveal the real problem of the patient. Various
signals, either selected from what are used in PSG or which are not usually used for
sleep evaluation are evaluated in many research studies. For example, Bianchi et al [31]
discussed possibilities of using signals which are not normally used in PSG. Heart rate
variability, extracted from ECG, and respiration were used to analyze and classify sleep
stages, sleep fragmentation, and detection of sleep apnea. Devot et al [32] presented a
design of textile recording system capable of recording ECG signals, with a mean
coverage of 81.8%. The system is in a form of a bed sheet and a pillow. Heinrich et al
[33] proposed a video-based body movement analysis during sleep. The algorithm
estimates motion by performing recursive search motion estimation on two consecutive
infrared video images.

14
2.5.1 Sleep Behavioral Profile
Sleep behavioral profile is useful in various applications especially on diagnosis of
problems caused by bad sleep behaviors. Liang, et al [20] proposed an actigraph system
for sleep-wake identification in order to monitor insomnia patients. A wrist-watch
actigraph recorder with a tri-axial accelerometer was used as the sensing device. A
sleep-wake scoring algorithm was developed to analyze accelerometer signals for
sleep-index. Selected features for scoring were peak, maximum magnitude and
movement density of accelerometer signals. The features calculated on adaptive
window size together with k-mean clustering were used to construct the sleep-wake
staging algorithm.
Nikamalfard et al [34] proposed a system that provides visual tool for caretakers and
physicians to view the sleep profiles and analyze sleep patterns of early dementia
patients, based on algorithm proposed by Wang et al [35]. Sensors used in the system
were bed occupancy sensors, and passive infrared sensors, door contact sensors, and
kitchen appliance sensors. The system basically detected and recorded user’s
movement around the house. Measurement variables for the study were quality of sleep,
quantity of sleep and rhythm of sleep.
2.5.2 Sleep Position Recognition
Since a poor sleep posture can cause a serious problem to people’s health, maintaining
a proper posture while sleeping is therefore essential. However, most people are
unaware of having problems with their own sleep and sleep posture. Commonly used
sensors in sleep posture recognition include accelerometers, ECG sensors, pulse
oximeters, pressure sensors, and cameras.
Huang et al [36] proposed a multimodal approach to sleeping posture classification.
The system is capable of classifying 9 common sleeping postures. The system utilized
pressure sensor array and video camera as complementary modalities for feature
extraction and classification. Features extracted for classification were weight
distribution of triggered pressure sensors, color saliency and edge saliency of captured

15
images. A multi-class SVM was employed for posture classification. The system
achieved an overall accuracy of 94.05%. Figure 7 shows most common sleeping posture
for classification–from left to right are: 1. left-foetus, 2. left-yearner, 3. left-log, 7.
soldier, 8. freefaller, and 9.starfish. Posture four to six that are right-lying postures of
posture one to three were omitted,
Figure 7. Most common sleeping postures for classification (From [36]).
Lee et al [37] proposed a body posture on bed estimation system based on ECG signal.
Twelve ECG sensors were placed on subject’s bed with conductive textile sheet as a
reference electrode. Four lying body positions can be classified, namely, supine posture
(lying backward), prone posture (lying forward), right lateral posture (lying on the
right), and left lateral posture (lying on the left). Three different classifiers were tested
and compared, namely, linear discrimination analysis, support vector machine (SVM),
and artificial neural network. The results showed that the SVM yielded the highest
performance.
Adami et al [38] presented an approach of using load cells under the bed to analyze in-
bed and out-of-bed events, and estimation of bed time and wake up time. The system
was also capable of classifying three sleep positions, namely, lying backward, lying on
the left, and lying on the right, plus sitting on the bed side. Wai et al [39] proposed a
pressure sensing bed based system for sleeping pattern observation. Information from
pressure sensors were interpreted into four topics, including lying posture, body
position, body orientation and movement. By combining the four topics, nine
directional lying postures, namely, free-fall, soldier, star-fish, left foetus, right foetus,
left log, right log, left yearner, and right yearner, can be classified with an average
accuracy around 80%.

16
Accelerometers can also be utilized in the field of sleep position classification since it
is commonly used in PSG. Kishimoto et al [40] proposed an approach for sleep posture
estimation a wearable tri-axial accelerometer attached on the subject chest. The
algorithm could be able to classify four lying body positions plus sitting, Yao et al [41]
presented a real-time accelerometer-based sleep position monitoring system which
recorded both body positions and head positions. The system utilized two tri-axial
accelerometers, one was placed on the subject’s forehead, and another one was placed
on the subject’s chest. Using two sensing module, the system could also indicate the tilt
angle of the subject’s head with respect to the subject’s body.
2.6 Classification Algorithms
Classification in machine learning is a problem of categorizing an instance to a category
(class). Various supervised learning algorithms, so called classifiers, were developed
and utilized in various kinds of applications. This section describes seven classification
algorithms used in this study.
2.6.1 Bayesian Network
A Bayesian network (BN) [42, 43], also called belief network, is a classifier that utilized
a probabilistic network constructed based on the Bayesian method. A belief network is
a probabilistic acyclic graphical model that represents various variables (node) and
probabilistic dependencies between them (directed links). An example of a basic belief-
network structure is shown in Figure 8. The probability distribution P and the graph of
a Bayesian network are connected by the Markov condition property, for example,
𝑃(𝑥2 = 𝑝𝑟𝑒𝑠𝑒𝑛𝑡|𝑥1 = 𝑝𝑟𝑒𝑠𝑒𝑛𝑡) = 0.8. The key feature of a belief network is the
representation of the conditional independence and dependence among events. The
joint probability of any particular instance i of all n variables in a belief network can be
calculated as follows:
𝑃(𝑋1, … , 𝑋𝑛) = ∏ 𝑃(𝑋𝑖|𝜋𝑖)𝑛𝑖=1 (1)
where 𝑋𝑖 represents the instantiation of variable 𝑥𝑖 and 𝜋𝑖 represents the instantiation
of the set of parents of 𝑥𝑖.

17
A Bayesian network classifier can be represented by a Bayesian network
(𝑥1, 𝑥2, 𝑥3, … , 𝑥𝑛 , 𝐶), where C represents the class variable. Hence, given a Bayesian
network B, an instance can be classified by finding the maximum probabilistic
distribution for each variable as follows:
arg max𝐶
𝑃𝐵(𝐶|𝑋1, … , 𝑋𝑛) (2)
Figure 8. An example of a belief-network structure.
Consider the problem of finding a best belief-network structure 𝐵𝑠, there might be more
than one 𝐵𝑠 which can maximize 𝑃(𝐵𝑠|𝑋1, … , 𝑋𝑛). Cooper et al [42] proposed a
heuristic-search method called K2 for maximizing 𝑃(𝐵𝑠|𝑋1, … , 𝑋𝑛). The algorithm
begins by assuming that a node has no parent, and then add a parent that causes the
most increase in the probability until the probability cannot be increased. The following
function is used in the greedy-search scheme of K2 in order to increase the probability
of a node.
𝑔(𝑖, 𝜋𝑖) = ∏(𝑟𝑖−1)!
(𝑁𝑖𝑗+𝑟𝑖−1)!∏ 𝑁𝑖𝑗𝑘
𝑟𝑖𝑘=1
𝑞𝑖𝑗=1 (3)
where 𝑟𝑖 represent possible value assignments of a variable 𝑥𝑖. 𝑞𝑖 is a unique
instantiation in which 𝑤𝑖𝑗 is the jth unique instantiation of 𝜋𝑖 relative to {𝑋1, … , 𝑋𝑛}.
𝑁𝑖𝑗𝑘 is the number of classes in {𝑋1, … , 𝑋𝑛} in which 𝑥𝑖 has the value 𝑣𝑗𝑘, and 𝜋𝑖 is
instantiated as 𝑤𝑖𝑗.
Assume that Pred(𝑥𝑖) returns a set of nodes preceding 𝑥𝑖 in the node ordering, the
pseudo code for the K2 algorithm is described in Table 3.
𝑥2
𝑥3
𝑥1
𝑥4
𝑥5

18
Table 3. Pseudo code for the K2 algorithm (From[42]).
Input A set of n node {𝑥1, … , 𝑥𝑛}, an ordering of the nodes, an upper bound u
on the number of parents a node can have, and set a of classes
(1) for i =1 to n
(2) set 𝜋𝑖 = ∅ (no parent for this node)
(3) calculate 𝑃𝑜𝑙𝑑 = 𝑔(𝑖, 𝜋𝑖) (from Equation 3)
(4) while proceed is true
(5) let z be a set of nodes in Pred(𝑥𝑖) – 𝜋𝑖 that maximizes 𝑔(𝑖, 𝜋𝑖 ∪ {𝑧})
(6) 𝑃𝑛𝑒𝑤 = 𝑔(𝑖, 𝜋𝑖 ∪ {𝑧})
(7) if 𝑃𝑛𝑒𝑤 > 𝑃𝑜𝑙𝑑then
(8) 𝑃𝑜𝑙𝑑 = 𝑃𝑛𝑒𝑤
(9) 𝜋𝑖 = 𝜋𝑖 ∪ {𝑧}
(10) else proceed = false (end the algorithm)
(11) end while
(12) end for
Output Sets of parents {𝜋1, … , 𝜋𝑛} for each node in {𝑥1, … , 𝑥𝑛}
2.6.2 Naïve Bayesian Network
The naïve Bayesian classifier [44, 45], also called naïve Bayes, is an approximation to
the Bayesian classifier which assumption that all variables (features) are conditionally
independent given the value of the class. Probabilistic independence means given node
𝑥1 and 𝑥2, 𝑥1 is independent of 𝑥2 given a class C when 𝑃(𝑥1|𝑥2𝐶) = 𝑃(𝑥1|𝐶) for all
possible values of variables and classes. Moreover, the algorithm assumes that there is
no hidden or latent attribute influence the prediction process. Several studies [44, 45]
indicated that the performance of naïve Bayes is surprisingly high, even though
variables in usually not independent in many situations. A graph of a naïve Bayesian
classifier thus has the form similar to the graph in Figure 9.

19
Figure 9. A common form of a naive Baysian classifier depicted as a Bayesian
network (From [44]).
Let C be the class variable, X be the vector of random variables, c be a particular class
label, and x be an instance. Given an instance x to classify, then an ordinary Bayesian
network classifier will compute the probability of each class as follows:
𝑃(𝐶 = 𝑐|𝑋 = 𝑥) = 𝑃(𝐶=𝑐)𝑃(𝑋=𝑥|𝐶=𝑐)
𝑃(𝑋=𝑥) (4)
However, a naïve Bayesian network classifier assumes that all variables are
conditionally independent. Therefore,
𝑃(𝑋 = 𝑥|𝐶 = 𝑐) = ∏ 𝑃(𝑋𝑖 = 𝑥𝑖|𝐶 = 𝑐)𝑖 (5)
Since the normalizing factor 𝑃(𝑋 = 𝑥) is a constant, it can be ignored, and normalizing
the sum of 𝑃(𝐶 = 𝑐|𝑋 = 𝑥) for all classes to be equal to one instead. A naïve Bayesian
network classifiers can then classify an instance by finding maximum probabilistic
distribution for each variable as follows:
arg max𝑐
𝑃 (𝐶 = 𝑐) ∏ 𝑃(𝑋𝑖 = 𝑥𝑖|𝐶 = 𝑐)𝑖 (6)
2.6.3 Support Vector Machine
The Support Vector Machine (SVM) is a supervised learning algorithm for
classification and regression. An interesting characteristic of SVM is that it tries to
minimize the empirical classification error and maximize the geometric margin. Figure
10 depicts a problem of linear SVM in finding a hyperplane which maximizes margin
between two given classes. Figure 10(a) depicts three hyperplanes while H1 does not
separate the two classes, H2 separates the classes but with a small margin, and H3
separates classes with a maximum margin.
𝑥𝑛 𝑥3 𝑥2 𝑥1
C

20
(a) (b)
Figure 10. An example of a SVM problem in finding a maximum margin
hyperplane between two given classes (picture From [46]).
The basic idea of SVM training is to categorize a data set into two classes 1 or -1, and
compute for a maximum-margin hyperplane which divides the points in class 𝑐 = 1
from the points in class 𝑐 = −1. A hyperplane can be written as a set of points x
satisfying:
𝑤 ∙ 𝑥 − 𝑏 = 0 (7)
where w is a vector perpendicular to the hyperplane, and b determines the distance of
the hyperplane from the perpendicular point on w. As shown in Figure 10(b), the
algorithm tries to determine w and b that maximize the margin between the two parallel
hyperplanes (also called support vectors).
𝑤 ∙ 𝑥 − 𝑏 = 1 (8)
𝑤 ∙ 𝑥 − 𝑏 = −1 (9)
Therefore, the problem can be derived as a problem of:
determining w and b that minimize ‖𝑤‖ (10)
subject to 𝑐(𝑤 ∙ 𝑥𝑖 − 𝑏) ≥ 1 for all 1 ≤ 𝑖 ≤ 𝑛

21
Altering the Equation (10) by substituting ‖𝑤‖ with 1
2‖𝑤‖2 without changing w and b,
a problem of quadratic programming (QP) is derived as follows:
arg min𝑤,𝑏
1
2‖𝑤‖2 (11)
Platt [47] proposed a modification to the SVM algorithm, called Sequential Minimal
Optimization (SMO). SMO replaces the QP utilized in SVM with an analytic QP step.
The SMO algorithm tries to solve the smallest possible optimization problem at every
step by choosing a pair of Lagrange multipliers, finding the optimal values of the pair,
and updating the SVM to reflect the new optimal values.
Firstly, the algorithm picks a Lagrange multiplier 𝛼1 which violate the Karush-Kuhn-
Tucker condition below:
𝛼𝑖 = 0 ⇒ 𝑦𝑖ƒ(�⃗�𝑖) ≥ 1,
0 < 𝛼𝑖 < 𝐶 ⇒ 𝑦𝑖ƒ(�⃗�𝑖) = 1, (12)
𝛼𝑖 = 𝐶 ⇒ 𝑦𝑖ƒ(�⃗�𝑖) ≤ 1
It then picks the second 𝛼2 which maximizes the size of the step taken during joint
optimization, and then optimizes (𝛼1, 𝛼2). Finally, it goes back to the first step until no
𝛼𝑖 violate the Karush-Kuhn-Tucker condition and 𝑄𝑖𝑗 = 𝑦𝑖𝑦𝑗𝑘(�⃗�𝑖, �⃗�𝑗) is positive semi-
definite.
2.6.4 Decision Tree
Decision tree is a tree-like model of decisions and possible consequences (nodes),
including probability of outcome, cost, and utility (links). Decision tree learning utilize
a decision tree as a predictive model. Pruning is a machine learning technique for
constructing decision trees by removing sub-trees that give less power for classifying
instances.
Quinlan [48] proposed a recursive technique for generating a decision tree called C4.5.
C4.5 can be also classified as a pruning decision tree since the algorithm performs
pruning on the generated decision tree after it generated. The pseudo code for C4.5 is
as follows:

22
Table 4. Pseudo code for the C4.5 algorithm (From [49]).
Input An attribute-value dataset D
(1) let 𝑇𝑟𝑒𝑒 = ∅
(2) check for base case (termination criteria)
(3) for all attribute a in D
(4) compute normalize information gain ratio when split on a
(5) end for
(6) find 𝑎𝑏𝑒𝑠𝑡 that yields the highest information gain
(7) Tree = create new decision node that tests 𝑎𝑏𝑒𝑠𝑡 in the root
(8) let 𝐷𝑣 be induced sub-dataset from D based on 𝑎𝑏𝑒𝑠𝑡
(9) for all 𝐷𝑣
(10) 𝑇𝑟𝑒𝑒𝑣 = 𝐶4.5(𝐷𝑣)
(11) attach 𝑇𝑟𝑒𝑒𝑣to the corresponding branch of Tree
(12) end for
Output Tree
2.6.5 Instance-based Learning
Instance-based learning [50] is a type of lazy learning algorithm in machine learning.
It categorizes a new instance by comparing the instance with instances in the training
set, rather than creating an explicit generalized model. Since it does not require any
computational for training process, the training time of the algorithm is fast. However,
the classifying process could be slow, depending on size of the training set as it
constructs hypotheses directly from the training instances.
Instance-based learning with k neighbors (IBk), or known as k-nearest neighbor
algorithm (kNN), is a variation of instance-based learning which classifies a new
instance by majority voting of k nearest neighbors. That is, a new instance will be
predicted to be a member of majority class among k-nearest neighbors (instances) in

23
the training set. To avoid the tied votes, k is usually an odd number. Let v be a class
label, x be data of a training instance, y be the class of the training instance, z be a test
instance, 𝐱′ be data of a test instance, and 𝑦′ be the class of the test instance. A function
𝐼(𝑣 = 𝑦′) returns value 1 if 𝑣 = 𝑦′ and 0, otherwise. Once a list of k-nearest neighbor
is obtained, the test instance is classified based on the majority voting class of its k-
nearest neighbors:
Majority voting: 𝑦′ = arg max𝑣
∑ 𝐼(𝑣 = 𝑦′)(𝑥𝑖,𝑦𝑖)⊆𝐷𝑧 (13)
A pseudo code for k-nearest algorithm is as follows:
Table 5. The pseudo code for k-nearest neighbor algorithm (From [49]).
Input The training dataset D, the number of nearest neighbor for classification
k, and the test instance 𝑧 = (𝐱′, 𝑦′)
(1) for all instances in the training set, (𝐱, 𝑦) ∈ 𝐷
(2) compute 𝑑(𝐱′, 𝐱), the distance between z and the instance (𝐱, 𝑦) ∈ 𝐷
(3) end for
(4) select 𝐷𝑧 ⊆ 𝐷, the set of k closest instances to z
Output 𝑦′ = arg max𝑣
∑ 𝐼(𝑣 = 𝑦′)
(𝑥𝑖,𝑦𝑖)⊆𝐷𝑧
Basically, the function 𝑑(𝑥′, 𝐱) in line (2) of Table 5 is calculated using the squared
Euclidean distance. Let p and q be two points, or instances (e.g. 𝐱′ and x in our case),
in the Euclidian space. Assume p and q have n features, i.e. 𝐩 = (𝑝1, 𝑝2, 𝑝3, … , 𝑝𝑛) and
𝐪 = (𝑞1, 𝑞2, 𝑞3, … , 𝑞𝑛), its squared Euclidian distance can be calculated as follows:
𝑑2(𝑝, 𝑞) = (𝑝1 − 𝑞1)2 + (𝑝2 − 𝑞2)2 + (𝑝3 − 𝑞3)2 + ⋯ + (𝑝𝑛 − 𝑞𝑛)2 (14)
2.6.6 Multi-Layered Perceptron
A multilayer perceptron [51] (MLP) is a feedforward artificial neural network model.
It consists of multiple layers of neurons (nodes for decision making) and directed links

24
(possible decisions of each neuron), where each layer is fully connected to the next
layer. It is a finite acyclic graph consisting of three types of neurons, namely, input
neurons (input node), output neurons (classification result), and hidden neurons
(neurons in layers between input and output neurons). Figure 10 depicts an example of
an MLP with two hidden layers.
Figure 11. A two-hidden-layer MLP with D inputs, K processing elements in
hidden layer #1, L processing elements in hidden layer #2 and M outputs (From
[52]).
MLP utilizes a supervised learning technique called backpropagation for training the
network. Basically, two activation functions (decisions) that are commonly used are as
follows:
𝑦(𝑣𝑖) = 𝑡𝑎𝑛ℎ(𝑣𝑖) (15)
𝑦(𝑣𝑖) = (1 + 𝑒−𝑣𝑖)−1 (16)
where Equation (15) is a hyperbolic tangent function in which the output ranges
between -1 and 1, and Equation (16) is a logistic function in which output ranges
between 0 and 1. 𝑦𝑖 is the output of the ith neuron and 𝑣𝑖 is the weighted sum of the
input synapses.
2.7 Feature Selection
Feature selection is a process of choosing a relevant subset of features for model
construction. Since the number of features used in classification algorithms can affect

25
both classification accuracy and time complexity [53-55], feature selection is used in
many research studies to reduce number of irrelevant features [53, 56-58]. In [59], Li et
al. investigated the use of several feature selection algorithms, on the hydrocarbon
reservoir prediction performance. The results showed that Relief-F and SVM-RFE could
improve prediction performance more than other feature selection algorithms.
2.7.1 Relief
Relief [55] is a ranker-based feature selection algorithm which uses a statistical method
and avoids heuristic search. It is noise-tolerant and unaffected by feature interaction. It
ranks individual features according to a feature relevance score, W[A], that approximates
the difference between probabilities conditioned on the nearest instance from a different
class (near-miss) and the nearest instance from the same class (near-hit):
𝑊[𝐴] = 𝑃(A|nearmiss) − 𝑃(A|nearhit) (17)
Relief-F [60] is an extended version of Relief. While the Relief-F still finds one near-hit
H from a randomly selected instance, R, instead of finding one near-miss M from a
different class, it finds one near-miss M(C) for each different class, and averages their
contributions for updating W[A], i.e.,
𝑊[𝐴] = 𝑊[𝐴] −∆(𝐴,𝑅,𝐻)
𝑚+ ∑
[𝑃(𝐶)×∆(𝐴,𝑅,𝑀(𝐶))]
𝑚𝐶≠𝑐𝑙𝑎𝑠𝑠(𝑅) (18)
where m is the number of instances used for approximating the probabilities. The
algorithm will also be repeated m times. Relief-F has been proved to be more effective
and was widely utilized in many areas such as gene selection for cancer classification
[61, 62], gene selection for tumor classification [62, 63], and feature selection for the
characterization of ultrasonic images of placenta [64].
2.7.2 Support Vector Machine Recursive Feature Elimination
Support Vector Machine Recursive Feature Elimination (SVM-RFE) [53] is another
widely-used feature selection algorithm. It uses weight magnitude of Support Vector
Machines (SVM), described in Section 2.6.3, as the ranking criterion and eliminates
subsets of features with smallest ranking criterion in a recursive manner. Assume a

26
training set of n features, the algorithm first trains an SVM on the training set of instance-
labeled pairs (𝑥𝑖 , 𝑦𝑖), for all i = 1, 2, 3,…, n, in order to find the Lagrange multipliers
vector α. By introducing α and applying a quadratic programming technique to Equation
(11), the training problem of minimizing 𝛼𝑘 for a subset of surviving features s in the
training set can be written as,
Minimize: 𝐽 = 1
2∑ 𝑦ℎ𝑦𝑘𝛼ℎ𝛼𝑘(𝑥ℎ ∙ 𝑥𝑘 + 𝜆𝛿ℎ𝑘) − ∑ 𝛼𝑘𝑘ℎ𝑘 (19)
subject to: 0 ≤ 𝛼𝑘 ≤ 𝐶 and ∑ 𝛼𝑘𝑦𝑘𝑘 = 0
The weight vector of dimensional length s is then computed by:
𝑤 = ∑ α𝑘𝑦𝑘𝑥𝑘𝑘 (20)
The ranking criteria is computed by:
𝐶𝑖 = (𝑤𝑖)2, for all 𝑖 (21)
Finally, the algorithm finds the feature with the lowest ranking criterion, eliminates the
feature from the surviving list s, and updates the ranked list. SVM-RFE was utilized in
many application domains such as gene selection for cancer classification [53, 61],
feature selection of material corrosion data [65], and feature selection for detecting scalp
spectral dynamics of interest on EEG signals [66].
2.8 Development Technology
This section describes technologies and tools used in studies in Chapter 3 and Chapter
4, and in the development of a real-time monitoring system in Chapter 5.
MATLAB (matrix laboratory) is a numerical computing environment and a high-level
programming language developed by MathWorks. It provides numerous mathematical
functions, such as functions for linear algebra, statistics, filtering, and solving
differential equations. It is also capable of visualizing data and plotting graphs.
MATLAB and Statistics Toolbox Release 2011a were used in this study.

27
Weka 3 [67] is an open source software written in Java that contains a collection of
machine learning algorithms for data mining tasks. Beside the graphical user interfaces
for utilizing various functions, such as data pre-processing, classification, regression,
clustering, association rules, and visualization, Weka also provides a Java library that
can be integrated into Java codes.
Java is an object-oriented programming language. It is designed to allow any complied
Java code to be able to run on all platforms that support Java without the need for
recompilation. Two Java libraries that have been used for the development of the real-
time sleep monitoring system are webcam-capture and JChart2D. Webcam-capture
[68], an open source Java-based webcam API written by Firyn, is a library that provides
functions for using webcams or network cameras directly from a Java program. The
library is used for taking snapshots of sleeping postures with a camera. JChart2D is a
Java-based real-time chart plotting library. The library is used for displaying
acceleration signals received from a BSN node.
A graphical user interface for a sleep monitoring system is presented in Section 5.2 as
a web application. The application was developed using standard web development
technologies such as HTML language, CSS style sheet language, PHP server-side script
language, and MySQL database. jQuery [69], is a JavaScript library that provides
numerous functions for handling client-side tasks such as event handling and
animations. Flot [70] is an open source JavaScript library that provides functions for
plotting graphs and charts.

28
Chapter 3
3 Offline Classification of Sleep Positions
We propose an offline classification technique of sleep position from acceleration
signals collected using a tri-axial accelerometer attached to subject chest. An
experimental device from the National Electronics and Computer Technology Center
(NECTEC), Thailand, is used to predict four lying positions (i.e., lying left, lying right,
lying face up, and lying face down), together with upright positions (i.e., sitting and
standing).
3. vvv
3.1 Sensing Device and Experimental Setup
A sensing device developed by the National Electronics and Computer Technology
Center (NECTEC), Thailand, is used in this experiment. The device is integrated with
a tri-axial accelerometer (SEN-00252). A rechargeable battery is included in the
package. The measured acceleration data is stored on a Micro SD card. There is a status
indicator LED at the top part of the device. The LED is blinking while the device is
recording. Green LED indicates device ready status, whereas, red LED indicates no
storage card.
(a) (b) (c)
Figure 12. Pictures of experimental device from NECTEC. (a) device with its tri-
axial accelerometer coordinate system, (b) storage card slot position of the device,
and (c) status indicator LED of the device.
X
Y
Z Micro SD
card slot

29
The device is attached on a strap and placed in front of the user’s chest. The orientation
of device installation on the chest belt is shown in Figure 13.
(a)
(c)
(b)
Figure 13. Device placement location and orientation (a) chest belt, (b) device
installation orientation, and (c) device location.
3.2 Data Description
The datasets used in this study were acquired from the tri-axial accelerometer at a
sampling rate of 50 Hz. Eleven subjects, aged between 20-28 years, were asked to wear
the sensing device while performing a routine consisting of five activities, namely,
sitting (C1), lying backward (C2), lying on the left (C3), lying forward (C4), and lying
on the right (C5), as shown in Figure 14. To construct the training dataset, each subject
was asked to perform the routine twice.
Figure 14. Five activities for prediction.
Up
C1 C2 C3
C4 C5

30
A signal plot of a training routine performed by a specific subject is shown in Figure
15. A total of 22 data records were obtained, each of which contains approximately 10
seconds for each activity.
Figure 15. A plot of the 3D acceleration signals in a training data routine during
the five different sleep postures.
The collected data was processed by a program written in MATLAB language as shown
in Figure 16. Since the device did not have a transmission module, the data collected
had to be annotated manually after collection. A MATLAB code is written to help the
labeling process. Because the sequence of activity performed during data collection is
fixed. The MATLAB code simply asked user to input the starting point and ending
point for each activity for each recorded signal. Finally, the metadata of activities for
each signal was stored to a csv file.
A test dataset was acquired from data collection at a hospital in Bangkok, Thailand. An
actigraph system, a sub-module of polysomnography system, was used at the hospital
for body position recording. Ten subjects, aged between 7-64 years, were asked to wear
the sensing device while attending polysomnography at the hospital. The average sleep
period was 8.03 hours per user, totalling approximately 80 hours of test dataset. The
reports generated by the actigraph system were used for validation of the proposed
system.

31
Figure 16. Plots of signal and an input dialog for labeling data.
3.3 Data Analysis
An instance based learning, k-nearest neighbor with k=1 (1-NN) was employed as the
algorithm for activity classification. Typically, a number of training examples are stored
for the nearest neighbor algorithm. However, the number of training examples directly
affected the classification time of the algorithm. Thus, only centroids of acceleration
means for each activity across all eleven subjects were calculated and used for model
construction.
Furthermore, in order to reduce the number of classification performed, activity
classification was performed only when there was a body movement. Hence, a sum of
squared differences (SSD) of adjacent data in the signal was calculated.
SSDt= (xt+1 - xt)2 + (yt+1 - yt)
2 + (zt+1 - zt)2 (22)
where xt, yt, and zt indicate the acceleration values at time t along x-, y- and z- axes,
respectively. When SSDt was higher than a specified threshold, the activity
classification process was performed, otherwise the previous predicted activity was

32
assumed. Figure 17 illustrates a plot of SSDt calculated over the acceleration signals
shown in Figure 15.
Figure 17. A plot of sum of squared differences magnitude for the signal shown in
Figure 15.
3.4 Implementation and Evaluation
Two-dimensional plots of acceleration means for each activity across all subjects in the
training dataset are shown in Figure 18. The centroids of activity-specific acceleration
means were used to construct the classification model. An acceleration signal was
classified using 1-NN classifier only when SSD of the data points exceeded the
specified threshold. To enhance system accuracy, the classification results must remain
the same for 5 consecutive data points, otherwise the classification results will be
ignored. To further reduce the effect of noises from sensor, both acceleration signals
and predicted activities were smoothed by median filtering. Figure 19 illustrates the
time series plots of the acceleration signals in the test dataset, along with the
corresponding classification results and SSD measures, respectively.
Figure 18. Class-specific plots of acceleration mean features of all subjects on the
x-y , y-z, and x-z planes, respectively.

33
Figure 19. Time series plots of (a) the acceleration signals (b) the corresponding
results from the activity classification algorithm and (c) the sum of squared
differences magnitude.
The classification was performed using MATLAB R2011a running on a MacBook Pro
with 2.4GHz dual-core Intel Core i5 processor with 3MB shared L3 cache, 4GB of
1333MHz DDR3 memory, and 5400-rpm SATA hard drive. Each test data record was
classified three times, with and without using the calculated SSD to reduce the number
of 1-NN classification performed. The classification accuracy and the average
classification time of the test dataset acquired from the ten subjects are shown in Table
6. The proposed system achieves an overall accuracy of 95.78 percent, compared to the
report from the hospital actigraph system. The results illustrate that by using the
calculated SSD to control the classification process, the classification time can be
reduced by 53.55 percent, from approximately 285 to 132 seconds in average.

34
Table 6. Accuracy and computational time for posture classification with and
without using the SSD measure.
Subject
No
Duration
(hours) Accuracy
Classification
time without
SSD (seconds)
Classification
time with SSD
(seconds)
1 8.24 96.03% 295.37 141.25
2 8.57 92.55% 340.35 165.07
3 7.26 97.76% 237.16 100.82
4 8.26 88.14% 298.65 141.43
5 8.28 95.27% 302.00 142.48
6 8.16 99.40% 285.92 132.65
7 8.48 95.65% 323.40 153.72
8 9.01 98.89% 328.91 165.77
9 6.02 94.48% 163.11 57.77
10 8.05 99.59% 273.07 121.84
Average 8.03 95.78% 284.80 132.28

35
Chapter 4
4 Real-Time Sleep Posture Classification
We improved the data analysis method of sleep posture monitoring with feature
extraction and different combinations of classification algorithms described in Section
2.6 and feature selection algorithms described in Section 2.7. The classification
algorithm and set of features which yield the highest performance will be used in
development of the system presented in Chapter 5.
4. vvv
4.1 Data Collection
Body Sensor Network [71, 72] (BSN) v3 toolkit was used in this experiment. It is a
variation of BSN devices developed by Imperial College London. It consists of a USB
programming board, a sensor board, a battery board, a prototype board and a pair of the
BSN v3 nodes. The BSN node consists of an ultra-low power processor and radio
transceiver (TI CC2420). The sensor board is bundled with a tri-axial accelerometer and
a temperature sensor. The prototype board provides interface for integrating different
types of sensors for the BSN node. It has been utilized in various kind of research, such
as fingerspelling gesture recognition for the deaf [73], gesture-based control of
intelligent home [74], post-operative patients monitoring [75] and activity recognition
[29, 30].
Figure 20. BSN development kit v3 (From [72])
The BSN node used in this experiment was equipped with a sensor board, and a battery
board. The node was attached on a strap and placed in the front, below the subject’s
chest. Figure 21 depicts the BSN node and the device coordinate system. The use of a

36
compact wearable device such as BSN empowered continuous sleep monitoring at
home, which allowed patients to be monitored in their natural state.
(a) (b)
Figure 21. A BSN node equipped with a tri-axial accelerometer (a), and its
coordinate system with respect to subject’s body (b).
The data collection involved twenty subjects, 10 males and 10 females, aged between
22-47 years, with an average of 34.8 years. Each subject was asked to wear a BSN node
equipped with a tri-axial accelerometer while performing different activities, namely,
sitting (C1), lying backward (C2), lying on the left (C3), lying forward (C4), lying on
the right (C5), standing (C6), and walking (C7) (as depicted in Figure 22). A sampling
rate of 50 Hz was used.
4.2 Data Analysis
During the data pre-processing step, noise reduction was first performed by replacing
the outlier signal samples with the previous signal values, followed by median filtering
with a fixed window of size five samples. To avoid the effect of class bias, the number
of samples in each class were adjusted to be the same by truncating samples in each
class equal to the class with fewest number of samples. Fifteen features, as described
in Table 7, were then calculated along the x-, y-, and z- axes of the acceleration signals
using a fixed window of size 50 samples (1 second), and a shifting window of size 25
samples (0.5 second).
X
Y Z

37
Figure 22. A subject while performing seven activities (C1 - C7).
Table 7. Feature descriptions.
F1 – F3 Mean of the acceleration values along the x-, y-, and z- axes, respectively
F4 – F6 Standard deviation of the acceleration values along the x-, y-, and z- axes, respectively
F7 – F9 Minimum of the acceleration values along the x-, y-, and z- axes, respectively
F10 – F 12 Maximum of the acceleration values along the x-, y-, and z- axes, respectively
F13 – F15 Difference between maximum and minimum of the acceleration values along the x-, y-, and z- axes, respectively
Two ranker-based feature selection algorithms, Relief-F and SVM-RFE, were used in
this experiment. They both gave a rank for each individual feature. The smaller rank
number indicated the better feature. Based on Weka 3 Toolkit [67], seven classification
algorithms as used in [56] were evaluated, i.e.,
C1 C2 C3 C4
C5 C6 C7

38
Bayesian network (BN) [42] with conditional probability tables estimated using
simple estimator, and structure learned from the data distribution using the K2 search
algorithm and Bayesian Score.
Naïve Bayesian network (Naïve BN) [44]
SVM [47] trained using sequential minimal optimization algorithm with polynomial
kernel as support vector.
Pruned decision tree [48] (J48, a C4.5 algorithm implementation for Weka)
Instance-based learning with one neighbor (IB1) [50]
Instance-based learning with three neighbors (IB3)
Multi-layered perceptron (NN) [51] trained using back propagation.
4.3 Experimental Results
The feature selection results obtained from Relief-F and SVM-RFE are shown in Table
8. Based on five-fold cross-validation, the seven classification algorithms listed in
Section 4.2 were applied on varying numbers of features following the feature rank
obtained from Relief-F and SVM-RFE. The overall accuracy values achieved by
different classification algorithms using feature sets ranked by Relief-F and SVM-RFE
are shown in Figure 23 and Figure 24, respectively.
The aim of this experiment is to determine a small subset of features which is sufficient
for constructing an effective classification model to be used in a real-time sleep
monitoring system. Although different feature orders were returned by Relief-F and
SVM-RFE, both feature selection algorithms selected F1, F2 and F3 as the top three best
features. This shows that acceleration mean is the most important feature for the
classification problem as most activities in the dataset are static activities. From Figure
23 and Figure 24, using four features seems to be appropriate as high accuracy can be
achieved. The fourth feature selected by Relief-F and SVM-RFE are the minimum value
of y-axis (F8) and the standard deviation along x-axis (F4), respectively.

39
Table 8. Feature rank results from Relief-F and SVM-RFE feature selection
algorithms.
Feature
selection
algorithm
Feature rank
1 2 3 4 5 6 7 8 9 10 11 12 13 14 15
Relief-F F2 F3 F1 F8 F7 F11 F9 F12 F10 F5 F14 F4 F13 F6 F15
SVM-RFE F3 F2 F1 F4 F5 F7 F11 F9 F8 F14 F6 F15 F12 F13 F10
With four features, the candidate classifiers are NN with the feature rank from Relief-
F and a naïve BN using the feature rank from SVM-RFE. The accuracy values of
85.68% and 85.55% were achieved by these two models, respectively. In terms of
classification time, the NN classifier requires only 67 milliseconds, while the naive BN
requires 350 milliseconds. Even though the training time of NN is relatively high
compared to other algorithms (114,088 milliseconds compared to 156 milliseconds of
naïve BN), model construction is a one-time process, classification time is more
important in the long run and thus the model was chosen for further implementation.
Figure 23. The graphs show the overall accuracy of different classifiers when
applied on datasets with varying numbers of features according to the feature
rank obtained from Relief-F.
0%
10%
20%
30%
40%
50%
60%
70%
80%
90%
100%
1 2 3 4 5 6 7 8 9 10 11 12 13 14 15
Acc
ura
cy
Number of Features
BN Naïve BN SVM
J48 IB1 IB3
NN

40
Figure 24. The graphs show the overall accuracy of different classifiers when
applied on datasets with varying numbers of features according to the feature
rank obtained from SVM-RFE.
The confusion matrix of NN classifier with four features according to the feature rank
obtained from Relief-F is shown in Table 9. The overall classification accuracy of
85.68% has been achieved. However, the average classification accuracy of lying
positions (C2-C5) is 99.96%. The classification accuracy of walking (C7) is 84.50%.
The classifier cannot efficiently separate sitting and standing (C1 and C6). Only
accuracy values of 46.37 and 69.00%, has been achieved respectively.
Table 9. The confusion matrix of the NN classifier with four features selected by
Relief-F.
Predicted Class
C1 C2 C3 C4 C5 C6 C7
Act
ual
Cla
ss
C1 4919 0 0 203 0 5042 445
C2 0 5332 3 0 0 0 0
C3 0 0 5468 0 0 0 0
C4 0 1 0 4788 0 0 0
C5 0 0 0 0 5603 0 4
C6 1286 0 0 0 0 3574 319
C7 455 0 0 3 0 340 4351
0%
10%
20%
30%
40%
50%
60%
70%
80%
90%
100%
1 2 3 4 5 6 7 8 9 10 11 12 13 14 15
Acc
ura
cy
Number of Features
BN Naïve BN SVM
J48 IB1 IB3
NN

41
Chapter 5
5 A Real-Time Sleep Monitoring System
This section presents a real-time sleep monitoring system capable of logging sleeping
positions and sleeping images. Two applications have been developed, i.e., 1) a client
application for processing and classifying acceleration signals and 2) a web-based real-
time sleep monitoring system. Figure 25 describes the overall architecture of the system
developed.
Figure 25. Overall architecture of the real-time sleep monitoring system.
Storing video footages consume a significant amount of storage space, and lying is a
static activity which involves a small amount of movement. Therefore, instead of
recording video footages of sleep postures, the system was designed to store snapshots
of sleep postures when the user changes his or her sleep position. Snapshots of sleep
postures together with a graph that summarizes sleep positions would allow a physician
to analyze sleep behaviors in a short period of time.
5.1 Java-based Client Application
A client application written in Java was developed in order to receive and process
acceleration signals from a BSN node. It utilized the NN classifier with 4 features (i.e.,
mean of the acceleration values along the x-, y-, z- axes, and minimum of the
acceleration values along the y-axis) as derived in Section 4.3, for sleep posture
BSN node
Client
application
Server
Web
application

42
classification. It records the time that the user changes his/her activity in the database
in order to generate an activity profile of the user. In addition, while the user is lying
down, the application will take snapshots of the user when his/her lying position
changes. When the user does not change his/her lying position, the application will
record the user’s activities into the database every one minute as a keep-alive signal.
The lying position is useful for physicians to diagnose various sleep problems. A
screenshot of the client application is shown in Figure 26.
Figure 26. A screenshot of the client application while processing and classifying
acceleration signals received from a BSN node.
5.2 Web-based Real-Time Sleep Monitoring System
A web-based real-time sleep monitoring system was developed using standard
development technologies such as HTML, CSS, PHP and JavaScript. The system
utilized jQuery for better user interactions. Flot was used for displaying graphs of users’
activities in the system and graphs of collected acceleration signals. The web
application contains several pages, such as basic user information, summarized
information of user’s records (i.e., total hours of recorded activities), and a summary of
sleep hours categorized by sleep positions) as shown in Figure 27.

43
Figure 27. A screenshot of the web application displaying basic user information
and summarized information of user’s records.
Figure 28 shows screenshots from the web application displaying a plot of sleeping
positions and snapshots of sleep positions. There are two separated pages for real-time
monitoring of sleep postures and for browsing through recorded data.
In the real-time monitoring page, the sleep position plot and the list of snapshots are
periodically updated. The snapshots are sorted from newest to oldest. When the client
application adds a new record to the database, the new snapshot will automatically be
added to the top of the list. The plot of sleeping positions is set to always display the
newest activity at the right panel, in which the interval of the plot can be varied from
one minute to eight hours.
In the browsing page (i.e., history page in the system), the plot of sleep positions and
the list of snapshots will not be updated. However, date, time, and interval for
displaying the plot and snapshots can be changed.

44
(a) (b)
Figure 28. (a) Screenshots from the web application displaying a plot and a
snapshot of sleeping positions, and (b) snapshots of sleep positions during one
night.

45
Chapter 6
6 Conclusions and Future Work
In this thesis, we have presented two studies for continuous monitoring of sleep
postures using a tri-axial accelerometer attached to the subject’s chest. The first study
is an off-line method for sleep posture monitoring using a sensing device without
wireless capability. Supervised clustering is used as the classification model. The
postures are classified into five classes namely, sitting, lying backward, lying on the
left, lying forward and lying on the right. System validation has been performed on over
80 sleeping hours of ten patients. Using the report from actigraph system utilized at the
hospital as the baseline, an average accuracy of 95.78 percent has been achieved.
Moreover, by using the sum of squared difference features extracted from the
acceleration signals to control the activation of the classification process, the
computational time has been reduced by 53.55 percent.
Secondly, two feature selection algorithms (i.e., Relief-F and support vector machine
recursive feature elimination (SVM-RFE)) and seven classification algorithms (i.e.,
Bayesian network, naïve Bayesian network, support vector machine, pruned decision
tree, instance-based learning with one neighbor, instance-based learning with three
neighbors, and multi-layer perceptron) were investigated. Seven activities classified
comprise the five postures described in the first study, plus standing and walking. Based
on four features selected using Relief-F and a multi-layer perceptron classifier, an
average accuracy of 85.68 percent has been achieved.
Results from the two studies are not comparable since the number of activities classified
in each study are not equal. The second study consists of walking, which is a dynamic
activity. In addition, the accelerator attached to the subject’s chest may not be the best
position for separating sitting and standing.

46
A real-time sleep monitoring system has been developed as a client-server application.
The web application keeps a log of classified activities received from the Java client
application in the database. It is capable of logging and displaying graphs of
acceleration signals and user activities, as well as taking snapshots of user sleep
positions. While there are symptoms that are caused by poor sleep postures, which
could not be captured by sleep positions alone, the process of analyzing sleep behaviors
from video footages are extremely time consuming and require a significant amount of
storage space. Therefore, instead of recording video footages of sleep postures, the
developed system keeps snapshots of sleep postures when the user changes his or her
sleep position. Snapshots of sleep postures together with a graph that summarizes sleep
positions allow a physician to analyze sleep behaviors in a short period of time.
The developed system has capabilities in logging activities and taking snapshots of
sleep postures. It provides an ability for carers to analyze sleeping behavior of users in
an efficient manner. This could provide a foundation for further study on sleeping
behavioral profile. Additional sensing devices and improved classification algorithms
can be integrated to improve the functionalities and performance of the system. So that
pictures can be taken in the dark, an infrared camera can be used instead. This would
further enhance the system in terms of user privacy.

47
References
[1] P. Lou, P. Zhang, L. Zhang, P. Chen, G. Chang, N. Zhang, T. Li, and C. Qiao,
"Effects of sleep duration and sleep quality on prevalence of type 2 diabetes
mellitus: A 5-year follow-up study in China," Diabetes Research and Clinical
Practice, vol. 109, pp. 178-184, 2015.
[2] K. Yaffe, J. Nettiksimmons, J. Yesavage, and A. Byers, "Sleep quality and risk
of dementia among older male veterans," The American Journal of Geriatric
Psychiatry, vol. 23, pp. 651-654, 2015.
[3] D. Tempestaa, L. D. Gennarob, V. Natalec, and M. Ferrara, "Emotional memory
processing is influenced by sleep quality," Sleep Medicine, vol. 16, pp. 862-870,
2015.
[4] L. F. Drager, S. M. Togeiro, V. Y. Polotsky, and G. Lorenzi-Filho, "Obstructive
sleep apnea : A cardiometabolic risk in obesity and the metabolic syndrome,"
Journal of the American College of Cardiology, vol. 92, pp. 569-576, 2013.
[5] (July, 2012, June, 2015). Sleep apnea Lifestyle and home remedies - Mayo
Clinic. Available: http://www.mayoclinic.org/diseases-conditions/sleep-
apnea/basics/lifestyle-home-remedies/con-20020286
[6] R. Roaf, "The causation and prevention of bed sores," Journal of Tissue
Viability, vol. 16, pp. 6-8, 2006.
[7] K. L. Cooper, "Evidence-based prevention of pressure ulcers in the intensive
care unit," Critical Care Nurse, vol. 33, pp. 57-66, 2013.
[8] (Dec, 2014, June, 2015). Bedsores (pressure sores) treatments and drugs -
Mayo Clinic. Available: http://www.mayoclinic.org/diseases-
conditions/bedsores/basics/treatment/con-20030848
[9] A. Pantelopoulos and N. G. Bourbakis, "A survey on wearable sensor-based
systems for health monitoring and prognosis," IEEE Transactions on Systems,
Man, and Cybernetics - Part C: Applications and Reviews, vol. 40, pp. 1-12,
2010.
[10] G. Z. Yang, Body Sensor Networks. London: Springer-Verlag, 2006.
[11] E. Sharafuddin, N. Jiang, Y. Jin, and Z. L. Zhang, "Know your enemy, know
yourself: block-level network behavior profiling and tracking," in the Global
Telecommunications Conference, Florida, USA, 2010, pp. 1-6.
[12] K. Xu, Z. L. Zhang, and S. Bhattacharyya, "Internet traffic behavior profiling
for network security monitoring," IEEE/ACM Transactions on Networking, vol.
16, pp. 1241-1252, 2008.
[13] Y. Takama and Y. Muto, "Profile generation from TV watching behavior using
sentiment analysis," in the International Conferences on Web Intelligence and
Intelligent Agent Technology, California, USA, 2007, pp. 191-194.
[14] H. Shin, M. Lee, and E. Kim, "Personalized digital TV content recommendation
with integration of user behavior profiling and multimodal content rating,"
IEEE Transactions on Consumer Electronics, vol. 55, pp. 1417-1423 2009.
[15] Y. Yang, "Web user behavioral profiling for user identification," Decision
Support Systems and Electronic Commerce, vol. 16, pp. 261-271, 2010.
[16] J. Monroy, J. A. Becerra, F. Bellas, R. J. Duro, and F. Lopez-Pena, "Automatic
profiling and behavior prediction of computer system users," in the

48
International Workshop on Measurement Systems for Homeland Security,
Contraband Detection and Personal Safety, Virginia, USA, 2006, pp. 62-66.
[17] L. Kwan, P. Ray, and G. Stephens, "Towards a methodology for profiling cyber
criminals," in the Hawaii International Conference on System Sciences,
Waikoloa, Hawaii, 2008, pp. 1-9.
[18] G. Ali, N. A. Shaikh, and Z. A. Shaikh, "Agent-based user-profiling model for
behavior monitoring," in the International Conference on Future Networks,
Bangkok, Thailand, 2009, pp. 3-7.
[19] M. Forte, C. Hummel, N. Morris, E. Pratsch, R. Shi, J. Bao, and P. Beling,
"Learning human behavioral profiles in a cyber environment," in the IEEE
Systems and Information Engineering Design Symposium, Virginia, USA,
2010, pp. 181-186.
[20] S. F. Liang, C. P. Young, D. W. Chang, F. Z. Shaw, Y. D. Liu, Y. C. Liu, and
J. J. Chen, "Development of an actigraph system for sleep-wake identification,"
in the Instrumentation and Measurement Technology Conference Hangzhou,
China, 2011, pp. 1-6.
[21] E. J. W. Van Someren, B. F. M. Vonk, W. A. Thijssen, J. D. Speelman, P. R.
Schuurman, M. Mirmiran, and D. F. Swaab, "A new actigraph for long-term
registration of the duration and intensity of tremor and movement," IEEE
Transactions on Biomedical Engineering, vol. 45, pp. 386-395, 1998.
[22] W. Karlen, C. Mattiussi, and D. Floreano, "Improving actigraph sleep/wake
classification with cardio-respiratory signals," in the International Conference
of the IEEE Engineering in Medicine and Biology Society, British Columbia,
Canada, 2008, pp. 5262-5265.
[23] K. Takata, J. Ma, B. O. Apduhan, R. Huang, and Q. Jin, "Modeling and
analyzing individual's daily activities using lifelog," in the International
Conference on Embedded Software and Systems, Sichuan, China, 2008, pp.
503-510.
[24] M. W. Lee, A. M. Khan, J. H. Kim, Y. S. Cho, and T. S. Kim, "A single tri-
axial accelerometer-based real-time personal life log system capable of activity
classification and exercise information generation," in the International
Conference of the IEEE Engineering in Medicine and Biology Society, Buenos
Aires, Argentina, 2010, pp. 1390-1393.
[25] A. R. Doherty and A. F. Smeaton, "Automatically segmenting lifelog data into
events," in the International Workshop on Image Analysis for Multimedia
Interactive Services, Klagenfurt, Austria, 2008, pp. 20-23.
[26] K. Xu, F. Wang, S. Bhattacharyya, and Z.-L. Zhang, "Real-time behaviour
profiling for network monitoring," International Journal of Internet Protocol
Technology, vol. 5, pp. 65-80, 2010.
[27] K. Xu, F. Wang, and B. Wang, "Behavior profiling and analysis in wireless
home networks," in the seventh IEEE Consumer Communications and
Networking Conference, Las Vegas, NV, USA, 2010 pp. 1-2.
[28] J.-h. Baek, G.-h. Lee, W.-b. Park, and B.-J. Yun, "Accelerometer signal
processing for user activity detection " in the eighth International Conference
on Knowledge-Based Intelligent Information and Engineering Systems,
Wellington, New Zealand, 2004, pp. 610-617.

49
[29] P. Theekakul, S. Thiemjarus, E. Nantajeewarawat, T. Supnithi, and K. Hirota,
"A rule-based approach to activity recognition," in the International Conference
on Knowledge, Information and Creativity Support Systems, Chiang Mai,
Thailand, 2010.
[30] P. Theekakul, S. Thiemjarus, E. Nantajeewarawat, T. Supnithi, and K. Hirota,
"A real-time activity recognition framework: a rule-based approach," in the
International Conference on Information and Communication Technology for
Embedded Systems, Pattaya, Thailand, 2011.
[31] A. M. Bianchi, M. O. Mendez, and S. Cerutti, "Processing of signals recorded
through smart devices: sleep-quality assessment," IEEE Transactions on
Information Technology in Biomedicine, vol. 14, pp. 741-747, 2010.
[32] S. Devot, A. M. Bianchi, E. Naujokat, M. O. Mendez, A. Brauers, and S. Cerutti,
"Sleep monitoring through a textile recording system," in the twenty-ninth
Annual International Conference of the IEEE Engineering in Medicine and
Biology Society, Lyon, France, 2007, pp. 2560-2563.
[33] A. Heinrich, X. Aubert, and G. de Haan, "Body movement analysis during sleep
based on video motion estimation," in the fiftheen IEEE International
Conference on e-Health Networking, Applications & Services, Lisbon, Portugal,
2013, pp. 539-543.
[34] H. Nikamalfard, H. Zheng, H. Wang, M. Mulvenna, P. McCullagh, and P.
Jeffers, "A sleep pattern analysis and visualization system to support people
with early dementia," in the fifth International Conference on Pervasive
Computing Technologies for Healthcare (PervasiveHealth), Dublin, Ireland,
2011, pp. 510-513.
[35] H. Wang, H. Zheng, J. C. Augusto, S. Martin, M. Mulvenna, W. Carswell, J.
Wallace, P. Jeffers, B. Taylor, and K. McSorley, "Monitoring and analysis of
sleep pattern for people with early dementia," in the IEEE International
Conference on Bioinformatics and Biomedicine Workshops, Hong Kong, 2010,
pp. 405-410.
[36] W. Huang, A. A. P. Wai, S. F. Foo, J. Biswas, C. C. Hsia, and K. Liou,
"Multimodal sleeping posture classification," in the International Conference
on Pattern Recognition, Istanbul, Turkey, 2010, pp. 4336-4339.
[37] H. J. Lee, S. H. Hwang, S. M. Lee, Y. G. Lim, and K. S. Park, "Estimation of
body postures on bed using unconstrained ECG measurements," the IEEE
Journal of Biomedical and Health Informatics, vol. 17, pp. 985-993, 2013.
[38] A. M. Adami, T. L. Hayes, and M. Pavel, "Unobtrusive monitoring of sleep
patterns," in the International Conference of Engineering in Medicine and
Biology Society, Cancun, Mexico, 2004, pp. 1360-1363.
[39] A. A. P. Wai, K. Yuan-Wei, F. S. Fook, M. Jayachandran, J. Biswas, and J.-J.
Cabibihan, "Sleeping patterns observation for bedsores and bed-side falls
prevention," in the Annual International Conference of the IEEE Engineering
in Medicine and Biology Society, Minneapolis, Minnesota, USA, 2009, pp.
6087-6090.
[40] Y. Kishimoto, A. Akahori, and K. Oguri, "Estimation of sleeping posture for
M-Health by a wearable tri-axis accelerometer " in the International Summer
School on Medical Devices and Biosensors, Massachusetts, USA, 2006, pp. 45-
48.

50
[41] X. Yao, G. Sun, W.-Y. Lin, and W.-C. Chou, "The design of a real-time
accelerometer-based sleeping position monitoring system and its application on
obstructive sleep apnea syndrome," in the International Conference on Systems
and Informatics, Yantai, China, 2012, pp. 1061-1066.
[42] G. F. Cooper and E. Herskovits, "A Bayesian method for the induction of
probabilistic networks from data," Machine Learning, vol. 9, pp. 309-347, 1992.
[43] R. R. Bouckaert, "Bayesian network classifiers in Weka for version 3-5-7,"
University of Waikato, 2008.
[44] H. J. George and P. Langley, "Estimating continuous distributions in Bayesian
classifiers," in the eleventh Conference on Uncertainty in Artificial Intelligence,
Montreal, Quebec, Canada, 1995, pp. 338-345.
[45] N. Friedman, D. Geiger, and M. Goldszmidt, "Bayesian network classifiers "
Machine Learning, vol. 29, pp. 131-163, 1997.
[46] (2015). Support vector machine - Wikipedia, the free encyclopedia. Available:
https://en.wikipedia.org/wiki/Support_vector_machine
[47] J. Platt, "Fast training of support vector machines using sequential minimal
optimization," in Advances in Kernel Methods - Support Vector Learning, B.
Schoelkopf, C. Burges, and A. Smola, Eds., ed: MIT Press, 1999.
[48] R. Quinlan, C4.5: Programs for Machine Learning. San Mateo, CA: Morgan
Kaufmann Publishers, 1993.
[49] X. Wu and V. Kumar, Top 10 algorithms in data mining: CRC Press, 2009.
[50] D. Aha and D. Kibler, "Instance-based learning algorithms," Machine Learning,
vol. 6, pp. 37-66, 1991.
[51] S. Haykin, Neural Networks: A Comprehensive Foundation. Upper Saddle
River, NJ, USA: Prentice Hall PTR, 1998.
[52] P. J. Roebber\, S. L. Bruening, D. M. Schultz, and J. V. C. Jr., "Improving
snowfall forecasting by diagnosing snow density," Weather and Forecasting,
vol. 18, pp. 264-287, 2003.
[53] I. Guyon, J. Weston, S. Barnhill, and V. Vapnik, "Gene selection for cancer
classification using support vector machines," Machine Learning, vol. 46, pp.
389-422, 2002.
[54] A. Janecek, W. Gansterer, M. A. Demel, and G. F. Ecker, "On the relationship
between feature selection and classification accuracy," Journal of Machine
Learning Research: Workshop and Conference Proceedings, vol. 4, pp. 90-105,
2008.
[55] K. Kira and L. A. Rendell, "A practical approach to feature selection," in the
ninth International Workshop on Machine Learning, 1992, pp. 249-256.
[56] S. Thiemjarus, A. James, and G.-Z. Yang, "An eye–hand data fusion framework
for pervasive sensing of surgical activities," Pattern Recognition, vol. 45, pp.
2855-2867, 2012.
[57] J. Fairley, G. Georgoulas, and G. Vachtsevanos, "Sequential feature selection
methods for Parkinsonian human sleep analysis," in the seventeenth
Mediterranean Conference on Control and Automation, Thessaloniki, Greece,
2009, pp. 1468-1473.
[58] B. L. Koley and D. Dey, "Selection of features for detection of Obstructive
Sleep Apnea events," in the Annual IEEE India Conference, Kochi, India, 2012,
pp. 991-996.

51
[59] H. Li, H. Guo, H. Guo, and Z. Meng, "Data mining techniques for complex
formation evaluation in petroleum exploration and production: A comparison
of feature selection and classification methods," in the Pacific-Asia Workshop
on Computational Intelligence and Industrial Application, Wuhan, China, 2008,
pp. 37-43.
[60] I. Kononenko, "Estimating attributes: analysis and extensions of Relief," in the
European Conference on Machine Learning, Secaucus, NJ, USA, 1994, pp.
171-182.
[61] K.-B. Duan, J. C. Rajapakse, H. Wang, and F. Azuaje, "Multiple SVM-RFE for
gene selection in cancer classification with expression data," IEEE Transactions
on NanoBioscience, vol. 4, pp. 228-234, 2005.
[62] Y. Zhang, C. Ding, and T. Li, "A two-stage gene selection algorithm by
combining ReliefF and mRMR," in the seventh IEEE International Conference
on Bioinformatics and Bioengineering, Boston, MA, USA, 2007, pp. 164-171.
[63] J.-c. Xu, L.-j. Zhang, L. Sun, and Y.-p. Gao, "Gene selection algorithm
combining ReliefF and relative neighborhood rough set " in the IEEE
International Conference on Granular Computing, Kaohsiung, Taiwan, 2011,
pp. 745-749.
[64] P. A. Linares, P. J. McCullagh, N. D. Black, and J. Dornan, "Feature selection
for the characterization of ultrasonic images of the placenta using texture
classification," in the IEEE International Symposium on Biomedical Imaging:
Nano to Macro, Arlington, VA, USA, 2004, pp. 1147-1150.
[65] X. Qiu, D. Fu, Z. Fu, K. Riha, and R. Burget, "The method for material corrosion
modelling and feature selection with SVM-RFE " in the thirty-fourth
International Conference on Telecommunications and Signal Processing,
Budapest, Hungary, 2011, pp. 443-447
[66] A. R. Hidalgo-Muñoza, M. M. Lópezb, I. M. Santosc, A. T. Pereirac, M.
Vázquez-Marrufoa, A. Galvao-Carmonaa, and A. M. Toméd, "Application of
SVM-RFE on EEG signals for detecting the most relevant scalp regions linked
to affective valence processing," Expert Systems with Applications, vol. 40, pp.
2102-2108, 2013.
[67] M. Hall, E. Frank, G. Holmes, B. Pfahringer, P. Reutemann, and I. H. Witten,
"The WEKA data mining software: An update," SIGKDD Explorations, vol. 11,
2009.
[68] B. Firyn. (2015). Webcam Capture API sarxos/webcam-capture · GitHub.
Available: https://github.com/sarxos/webcam-capture
[69] (2015). JQuery. Available: https://jquery.com/
[70] (2015). Flot: Attractive JavaScript plotting for jQuery. Available:
http://www.flotcharts.org
[71] B. P. L. Lo, S. Thiemjarus, R. King, and G.-Z. Yang, "Body Sensor Network -
a wireless sensor platform for pervasive healthcare monitoring," in the third
International Conference on Pervasive Computing, Munich, Germany, 2005,
pp. 77-80.
[72] B. P. L. Lo. (April, 2009, June, 2015). BSN development kit v3. Available:
http://vip.doc.ic.ac.uk/bsn/a1892.html
[73] V.-r. Jaijongrak, S. Thiemjarus, P. Kayasith, and I. Kumazawa, "American sign
language fingerspelling gesture recognition: Developmental progress of a hand-

52
gesture interface for speech-impaired disabilities using body sensor networks,"
in the International Conference on Information and Communication
Technology for Embedded Systems, Thailand, 2009.
[74] V.-r. Jaijongrak, S. Chantasuban, and S. Thiemjarus, "Towards a BSN-based
gesture interface for intelligent home applications," in the ICCAS-SICE
International Joint Conference on Instrumentation, Control and Information
Technology, Fukuoka, Japan, 2009, pp. 5613-5617.
[75] D. Malan, T. Fulford-Jones, M. Welsh, and S. Moulton, "CodeBlue: an ad hoc
sensor network infrastructure for emergency," in the first International
Workshop on Wearable and Implantable Body Sensor Networks, London,
United Kingdom, 2004.