tow models keywords - ijser · transmission of phone signals by aerials over long ... tower design...
TRANSCRIPT
International Journal of Scientific Engineering and Research (IJSER) ISSN (Online): 2347-3878
Impact Factor (2018): 5.426
Volume 7 Issue 7, July 2019
www.ijser.in Licensed Under Creative Commons Attribution CC BY
Structural Analysis of Guyed Tower Considering a
Tow Models
M. Naguib 1, A. A. Ghaleb
2, A.I. Elmetwally
3
1Mohammed Naguib Mohammed Abou El-Saad, Professor of Theory of Structures,
Structural Engineering Department, Faculty of Engineering, Mansoura University, Egypt
2Ahmed Amin Ghaleb, Associate Professor of Concrete Structures
Structural Engineering Department, Faculty of Engineering, Mansoura University, Egypt
3Ahmed Ibrahim Elmetwally Elmetwally Said, Teaching Assistant of Structural Analysis and Mechanics,
Structural Engineering Department, Faculty of Engineering, Mansoura University, Egypt
Abstract: The key objective of the present work is to study the parameters affecting the static behavior of guyed towers. These towers
consist of shafter vertical shaft with three or four legs and supported by three or four cables along its height at one level or more. The
authors take into account a two different mathematical models. One of both models is modeled the shaft as line beam element with
equivalent section, and other is a three-dimension flexure element as vertical legs with horizontal and diagonal lacing. This study is
carried out for triangular and square guyed tower with deferent lacing systems. The spacing between shaft legs and number of levels of
cables along the tower height under various velocities of wind and deferent values of initial tension in cables are taken into
consideration of analyses. The obtained results are tabulated and drawn in many tables and graphs respectively. These tables explain the
percentage variation of difference between deformations for the two mathematical models for all study parameters.
Keywords: Tension structure, Cables, Guyed tower, Preliminary analysis, Different statical system
1. Introduction
During recent years a lot advanced investigations of civil
engineering structures have mainly been carried out in the
field of slender, relatively light and flexible structures. These
investigations have been carried out for many structures
such as cable and cable stayed roofs, suspension and cable
stayed bridges, membranes, pneumatic structures, towers
and guyed shafts.
The improvement of radio and TV administrations has
brought about an interest for extremely tall structures to
carry the radiating antennae· A basically monetary path for
doing this is by methods of slender shafts supported at
intermediate levels by flexible steel cables. All the more as
of late, guyed tower are used for some different purposes,
for example communications industry, wind mills,
transmission of phone signals by aerials over long
separation, for supporting collectors in sun powered vitality
applications, and for supporting tall chimney and off-shore
oil operations.
Towers may be constructed of steel, aluminum or concrete
and may be free standing or guyed. Guyed shafts consist of a
vertical continuous central shaft laterally supported at
several levels along its height by sets of inclined pre-
tensioned guys. Generally, the number of levels increases
with the shaft height. The central shaft is also often referred
to as the tower or the shaft. Such shafts often have flexible
cantilever at the tops. The shaft itself is often a triangular
lattice structure, although square lattice or cylindrical
structures are also used. The individual members may be
designed from tubular or angular steel sections. The joints
may be riveted, bolted or welded.
The shafts are usually pined or fixed at the base. The other
components of guyed shafts are the foundations, accessories
of the structure, and the equipment.
The present trend in guyed shaft construction is toward
higher, more complex configurations with more peculiar
stiffness requirements.
The guy ropes may be of various sizes and placed at
arbitrary intervals along the height of the tower for shafts
with triangular or square section respectively. Typically, the
guys will be steel strands and often with several guys
connected to a common ground connection. Guys need not
be connected to the ground at the same elevation, and each
guy is usually pre-stressed to some percentage of the
ultimate cable strength. For more clarification the European
standards EN 1993-3-1:2006 0 already give some
information about the shafts structure definition and
guidelines for internal forces and moments determination.
The essential loads on towers are due to the dead weight of
the structural members, the weight of supported equipment,
insulators, any other associated apparatus, wind , ice loads
and earthquake. Beside the ice load and earthquake, wind
load remains the main factor affecting the stability of the
shaft structure [2].
The loads due to wind are incredibly influenced by the
shape of the tower and, in the case of noncircular trussed
towers, by the orientation of the tower to the direction of the
wind, the ratio of the solid area to the total enclosed area of a
vertical face and the cross-sectional shape of the individual
members of the tower. The ice load is doubly essential
Paper ID: 8071901 15 of 30

International Journal of Scientific Engineering and Research (IJSER) ISSN (Online): 2347-3878
Impact Factor (2018): 5.426
Volume 7 Issue 7, July 2019
www.ijser.in Licensed Under Creative Commons Attribution CC BY
because it increases both the area exposed to wind and the
vertical load. The most difficult problems in the design of
guyed towers is the assessment of the effect of turbulent
wind forces on the design quantities, plus maximum guy
tensions and axial loads.
Structural analyses and experimental tests were investigated
in the past [3-13]. Baseos et al. [3] depict some critical
aspects of the analyses performed during the 38 m high steel
tower design resulting from the static, seismic and stability
analyses of the steel tower prototype. Full scale field
measurements [4] are carried out on a 50 m tall guyed lattice
shaft located on the east coast of India near Kalpakkam.
Wind load modeling and structural response of the
removable guyed shaft for mobile phone networks are
presented in [5]. Experimental tests were performed in order
to evaluate the forces and aerodynamic coefficients on a
typical cable-stayed shaft used for removable base stations.
The results were obtained using the wind tunnel facility.
In Egypt, and due to environmental conditions, the effect of
ice is not important in the design towers. Also, the effect of
temperature fluctuations is not usually severe as any
contraction or expansions of the cables are balanced by a
similar behavior of the tower. Finally, we can conclude that
in Egypt in addition to the self-weight of the structure and
the forces set up by the· tensions in the guys the wind loads
are preponderant part of the total load. [14].
2. Modeling considerations
This section will address the issue of modeling of the shaft
and cables of guyed towers. A few techniques are utilized by
modeling both the shaft and the cables. They vary in the
level of accuracy they can provide, as well as in the expense
related with their utilization. The selection by the designer of
one model versus another should be based on the available
resources and on the particular design stage. The most
common alternatives for modeling the shaft and guys and
their corresponding virtues and handicaps are presented.
2.1. Modeling of the shaft
The simplest way to model the shaft is by using an
equivalent beam with equivalent sectional properties These
expressions neglect the contributions of both the horizontal
and diagonal members of the shaft to the axial and bending
stiffness of the equivalent beam [15]. The exact way to
model the shaft is considering the shaft as three-dimension
flexure element. A Comparison between obtained results
taken into account many study parameters are proposed
2.2. Modeling of the guys
The modeling of the guys is more complex than that of the
shaft due to the inherent nonlinearity of cable structures. The
behavior of cables is presented in detail in [15-20], where
interested readers can be referred to for more information.
For example, a novel approach in which three guys
connected to the shaft at a given level are substituted by a
spring was proposed in[15]. The approach introduced in
[16],based on the concepts of force equilibrium, deformation
compatibility, and linear elastic material behavior, was
followed. Salehi Ahmad Abad et al. [19] proposed a discrete
model of cable subjected to general loads.
In this paper the author models the guys as cable element
using in sap2000.
3. Model Characteristics and Parametric
Studies
3.1. Configuration of tower shaft and cables
The study is carried out taken into consideration the
followings: both triangular and square guyed tower having a
height of 44m with one and two level of cables as shown in
Figs (1), (2), (3) and (4).
Shaft cross section tower heightand cable desistance
Figure 1: Triangular guyed tower with one cable level
Shaft cross section tower height and cable desistance
Figure 2: Square guyed tower with one cable level
Shaft cross section tower height and cable desistance
Figure 3: Triangular guyed tower with two cable level
Shaft cross section tower height and cable desistance
Figure 4: Square guyed tower with two cable level.
Paper ID: 8071901 16 of 30

International Journal of Scientific Engineering and Research (IJSER) ISSN (Online): 2347-3878
Impact Factor (2018): 5.426
Volume 7 Issue 7, July 2019
www.ijser.in Licensed Under Creative Commons Attribution CC BY
3.2. Shaft cross section
The both cross sections of triangular and square towers with
their main structural components are shown in Fig (5).
Triangular cross section Square cross section
Figure 5: Towers cross sections
3.3. System of shaft lacing
Three types of lacing system for tower shaft are shown in
Fig (6).
Figure 6: Towers lacing systems
3.4. Shaft dimensions
Four spacing between legs (from experience verified) are
considered (0.6m, 0.8m, 1.0m and1.2m)
3.5. Initial tension in cables
The initial tension in cables is taken as (10% and 20% of
breaking load)
3.6. Wind speed at 10m (U (10)).
The wind speed on the tower varies as given. U (10) equal
(10m/s,20m/s,30m/s,40m/s,50m/s and 60m/s))
4. The properties of towers sections
4.1. The properties of shaft
Table 1: Properties of shaft
Section
Main
leg
(tube)
Diagonal
Lacing
(angle)
Horizontal
Lacing
(angle)
Cross Section Area (A) cm2 14.92 3.28 3.28
Moment of inertia about x-axis (Ix) cm4 168.8 3.56 3.56
Moment of inertia about x-axis (Iy) cm4 168.8 3.56 3.56
Polar moment of inertia (IP) cm4 337.6 7.12 7.12
Modules of elasticity, E (N/Cm2) 2.1E+11
4.2. The properties of shaft for both cross sections with
referred to Fig (5)
These properties are tabulated in both the following tables
for triangular and square towers.
Table 2: Properties of sections for triangular tower Model Triangular tower
Space(s)m 0.6 0.8 1 1.2
Cross Section Area (A) cm2 44.76 44.77 44.768 44.768
Moment of inertia about x-axis
(Ix) cm4 27370 48260 75120 107950
Moment of inertia about x-axis
(Iy) cm4 27370 48260 75120 107950
Polar moment of inertia (IP) cm4 54740 96520 150240 215900
modules of elasticity, E (N/Cm2) 2.1E+11
Table 3: Properties of sections for square tower Model Square tower
Space(s)m 0.6 0.8 1 1.2
Cross Section Area (A) cm2 59.69 59.69 59.69 59.69
Moment of inertia about x-axis
(Ix) cm4 54400 96180 149900 215560
Moment of inertia about x-axis
(Iy) cm4 54400 96180 149900 215560
Polar moment of inertia (IP)
cm4 108800 192360 299800 431120
modules of elasticity, E
(N/Cm2) 2.1E+11
4.3. The cables properties
Table 4: Properties of cables
Section cable
Cross Section Area (A) cm2 14
Modules of elasticity, E (N/Cm2) 1.65E+11
Pretention force (N) 12517 & 25034
Weight per unite length (N/m) 114
5. Types of loads
Three types of loads are considered as follows:
5.1. Dead load
Owen weight of structural elements
5.2. Initial tension in cables
10% and 20% of breaking load
5.3. Wind loads
The wind load is considered as equivalent wind forces acting
at cables nodes and shaft joints. this equivalent wind forces
are calculated as follows:
The static wind forces acting at cables nodes and shaft joints
were calculated in accordance with "the recommendation for
the design and analysis of guyed shafts" by IASS [22].
The increasing of horizontal wind speed with height above
the ground can be described by "logarithmic law" that is
derived not only from empirical data, but also from
Paper ID: 8071901 17 of 30

International Journal of Scientific Engineering and Research (IJSER) ISSN (Online): 2347-3878
Impact Factor (2018): 5.426
Volume 7 Issue 7, July 2019
www.ijser.in Licensed Under Creative Commons Attribution CC BY
theoretical considerations [23].
(1)
Where:
U(h) = the wind speed at height h (m)
𝑧𝑜 = the roughness length, for which the values depended
on the type of the ground.
h = the height above the ground.
𝑢∗ = the so-called "friction velocity" which can be found
as soon as the value 𝑧𝑜 and the velocity U(10) at height 10
m above the ground are given.
The magnitude of the wind force, 𝑊𝑑 , in the main wind
direction above the ground is given in ref. [16]by:
(2)
Where
ρ = the air density (for normal condition ρ =1.25 N/m3)
𝑅𝑑 = the wind resistance in the direction of the wind.
Where
𝑅𝑑 is calculated separately for the guys and shaft as follows:
a) Calculation of 𝑹𝒅 for the Guys:
The wind resistance in the direction of the wind for any
linear component may be taken as:
(3)
𝐶𝐷 = the normal drag coefficient appropriate to the element
under consideration and varies with Reynolds number 𝑅𝑒 as
shown in Fig .7.
Figure 7: variation of Drag coefficient 𝐶𝐷 with Reynolds
number 𝑅𝑒
𝐴𝑒 = the area exposed to wind of the component = D*L
where (D diameter of cable and L length of the element)
𝛹 = the angle of wind incidence to the longitudinal axis of
any linear component
where:
α = angle of inclination of cable with horizontal plan, and
θ = angle between the plane perpendicular to the wind
direction and the element.
b) Calculation of 𝑹𝒅 for the Shaft Shaft
The total wind resistance in the direction of the wind over a
panel height of the structural components of a lattice shaft of
equivalent triangular cross section or square cross section
having equal projected areas for each face may take as
Where:
𝑘θ=1.0+𝑘1𝑘2 sin22θ for square shafts
𝑘θ = 1.0 equilateral triangular composed of circular
member 𝑘θ=1.0 - 0.1sin21.5θ Triangular composed of
flat sided members
θ = is the angle of incidence of the wind to the face, in
plan.
τ = is solidity ratio = (𝐴exposed to wind / 𝐴total )
𝐶𝐷 = values of overall normal drag coefficients.
For such shafts composed of both flat sided and circular
section members or for those composed entirely of circular
sections appropriate to high Reynolds number, 𝑅𝑒 .The
overall normal drag (pressure) coefficient may be obtained
from: -
𝐶1 = 2.25 for square towers
𝐶1 = 1.9 for triangular towers
𝐶2 = 1.5 for square towers
𝐶2 = 1.4 for triangular towers
𝐴𝐹 = area of flat parts
𝐴𝐶 = area of circular in sub critical regime
𝐴𝐶\ = area of circular in supercritical regime
6. The cases of study
Six cases are considered. these cases are:
a) Triangular tower with one level of cables with 10%
initial tension.
b) Triangular tower with one level of cables with 20%
initial tension.
c) Triangular tower with two level of cables with 10%
initial tension.
d) Square tower with one level of cables with 10% initial
tension.
e) Square tower with one level of cables with 20% initial
tension.
f) Square tower with two level of cables with 10% initial
tension.
For all these cases the important obtained results are drawn
and tabulated in the following graphs and tables
respectively.
7. Analysis and discussion
The horizontal displacement along the shaft for all study
cases are shown in the following figures with list of figures
given in the end of the paper.
Paper ID: 8071901 18 of 30

International Journal of Scientific Engineering and Research (IJSER) ISSN (Online): 2347-3878
Impact Factor (2018): 5.426
Volume 7 Issue 7, July 2019
www.ijser.in Licensed Under Creative Commons Attribution CC BY
7.1. Case (a)
It is noted that
1) The difference between the maximum displacement of
three-dimension flexure element model and equivalent
beam element model change from -6% to 15%.
2) The response of the model with lacing system IP=3 was
greater than the model with lacing systems IP=2 and
IP=1, however it is more stiff than other systems.
3) There was an increasing in the difference between the
responses in the two models with change the lacing
system. The lacing system (IP=1) had larger difference
than others.
4) In smaller loads and S=0.6 the maximum horizontal
displacement in three-dimension flexure element model
was smaller than that one in equivalent beam element
model for lacing system(IP=3).
5) There was an increasing in the difference between the
responses in the two models with increasing in the
spacing between legs. The model (S=1.2) had larger
difference than others.
6) With increasing of load intensity, the difference in
displacement increased.
With the following figures
The following symbols are used to define the mathematical
model and its lacing.
IP=1 beam element model with lacing system 1
IP=2 beam element model with lacing system 2
IP=3 beam element model with lacing system 3
3D-IP=1 three dimensional model with lacing system 1
3D-IP=2 three dimensional model with lacing system 2
3D-IP=3 three dimensional model with lacing system 3
The chartsshow only wind intensity (U(10)) of 10,30and
60m/s.
Figure 8: Variation of horizontal displacement along the
shaft with change of mathematical model and lacing system
and load intensity, S=0.6m,U(10)=10m/sec case (a).
Figure 9: Variation of horizontal displacement along the
shaft with change of mathematical model and lacing system
and load intensity, S=0.6m, U(10)=30m/sec case (a).
Figure 10: Variation of horizontal displacement along the
shaft with change of mathematical model and lacing system
and load intensity, S=0.6m, U(10)=60m/sec case (a).
Figure 11: variation of horizontal displacement along the
shaft with change of mathematical model and lacing system
and load intensity, S=0.8m, U(10)=10m/sec case (a).
Paper ID: 8071901 19 of 30

International Journal of Scientific Engineering and Research (IJSER) ISSN (Online): 2347-3878
Impact Factor (2018): 5.426
Volume 7 Issue 7, July 2019
www.ijser.in Licensed Under Creative Commons Attribution CC BY
Figure 12: Variation of horizontal displacement along the
shaft with change of mathematical model and lacing system
and load intensity, S=0.8m, U(10)=30m/sec case (a).
Figure 13: Variation of horizontal displacement along the
shaft with change of mathematical model and lacing system
and load intensity, S=0.8m, U(10)=60m/sec case (a).
Figure 14: Variation of horizontal displacement along the
shaft with change of mathematical model and lacing system
and load intensity, S=1.0m, U(10)=10m/sec case (a).
Figure 15: Variation of horizontal displacement along the
shaft with change of mathematical model and lacing system
and load intensity, S=1.0m, U(10)=30m/sec case (a).
Figure 16: Variation of horizontal displacement along the
shaft with change of mathematical model and lacing system
and load intensity, S=1.0m, U(10)=60m/sec case (a).
Figure 17: Variation of horizontal displacement along the
shaft with change of mathematical model and lacing system
and load intensity, S=1.2m, U(10)=10m/sec case (a).
Paper ID: 8071901 20 of 30

International Journal of Scientific Engineering and Research (IJSER) ISSN (Online): 2347-3878
Impact Factor (2018): 5.426
Volume 7 Issue 7, July 2019
www.ijser.in Licensed Under Creative Commons Attribution CC BY
Figure 18: Variation of horizontal displacement along the
shaft with change of mathematical model and lacing system
and load intensity, S=1.2m, U(10)=30m/sec case (a).
Figure 19: Variation of horizontal displacement along the
shaft with change of mathematical model and lacing system
and load intensity, S=1.2m, U(10)=60m/sec case (a).
Figure 20: Variation of horizontal displacement along the
shaft with change of mathematical model and spacing (S)
with U(10)=30m/s for the lacing system IP=1 case (a).
Figure 21: Variation of horizontal displacement along the
shaft with change of mathematical model and spacing (S)
with U(10)=30m/s for the lacing system IP=2 case (a).
Figure 22: Variation of horizontal displacement along the
shaft with change of mathematical model and spacing (S)
with U(10)=30m/s for the lacing system IP=3 case (a).
Figure 23: Variation of horizontal displacement along the
shaft with change of mathematical model and spacing (S)
with U(10)=60m/s for the lacing system IP=1 case (a).
Paper ID: 8071901 21 of 30
International Journal of Scientific Engineering and Research (IJSER) ISSN (Online): 2347-3878
Impact Factor (2018): 5.426
Volume 7 Issue 7, July 2019
www.ijser.in Licensed Under Creative Commons Attribution CC BY
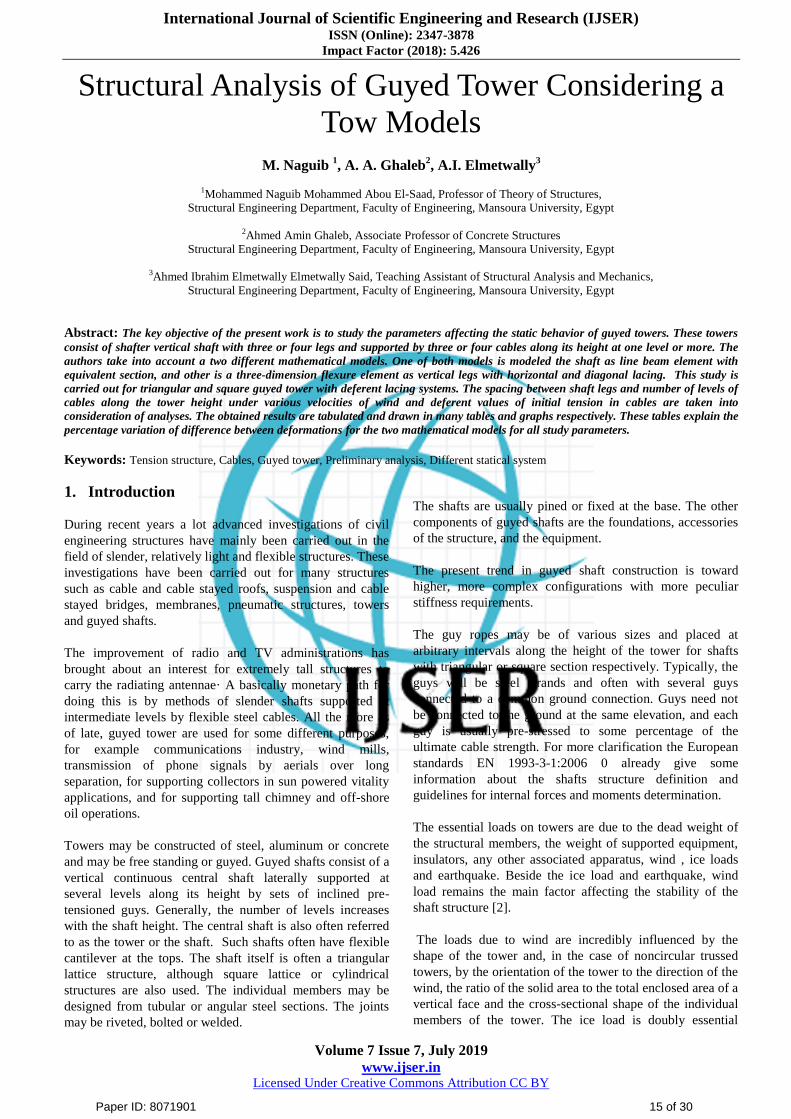
Figure 24: Variation of horizontal displacement along the
shaft with change of mathematical model and spacing (S)
with U(10)=60m/s for the lacing system IP=2 case (a).
Figure 25: Variation of horizontal displacement along the
shaft with change of mathematical model and spacing (S)
with U(10)=60m/s for the lacing system IP=1 case (a).
For more clarification the following table showed the
percentage of difference between maximum displacement in
the three-dimension flexure element model to that one in the
equivalent beam element model with all study parameters.
Table 5: The referred percentage for case (a) lacing
system
space
(m)
wind speed at height of 10 m U(10) (m/s)
10 20 30 40 50 60
IP=1 0.6 -1% -1% 4% 13% 12% 11%
0.8 -3% -3% 3% 14% 12% 12%
1 -4% -5% 3% 14% 13% 12%
1.2 -5% -5% 4% 15% 12% 11%
IP=2 0.6 -2% -2% 2% 8% 8% 7%
0.8 -2% -2% 3% 10% 9% 9%
1 -2% -2% 4% 11% 10% 9%
1.2 -1% -2% 4% 11% 9% 8%
IP=3 0.6 -5% -5% -3% 0% 0% 0%
0.8 0% 0% 2% 5% 5% 5%
1 2% 2% 5% 7% 7% 6%
1.2 9% 10% 13% 14% 13% 12%
7.2. Case (b)
It is noted that
1) The same notes in the previous model
2) There was no effective change in deformation due to
change of initial tension in low load intensity but the
difference in displacement increasesin higher load
intensity.
Table 6: The referred percentage for case (b) lacing
system
space
(m)
wind speed at height of 10 m U(10) (m/s)
10 20 30 40 50 60
IP=1 0.6 -1% -1% 4% 12% 12% 12%
0.8 -3% -3% 4% 14% 10% 9%
1 -4% -4% 4% 15% 15% 14%
1.2 -5% -6% 4% 15% 12% 11%
IP=2 0.6 -2% -2% 2% 8% 8% 8%
0.8 -1% -1% 3% 11% 11% 10%
1 -1% -1% 5% 12% 12% 10%
1.2 0% -1% 6% 13% 12% 10%
IP=3 0.6 -5% -5% -3% 0% 0% 0%
0.8 0% 0% 2% 6% 6% 5%
1 2% 2% 5% 9% 8% 7%
1.2 4% 4% 7% 10% 8% 8%
7.3 Case (C)
It is noted that
1. The same notes in the previous cases
2. The addition of level of cables decreased the
deformation significantly.
Figure 26: variation of horizontal displacement along the
shaft with change of mathematical model and lacing system
and load intensity, S=0.6m, U(10)=10m/sec case (c).
Paper ID: 8071901 22 of 30
International Journal of Scientific Engineering and Research (IJSER) ISSN (Online): 2347-3878
Impact Factor (2018): 5.426
Volume 7 Issue 7, July 2019
www.ijser.in Licensed Under Creative Commons Attribution CC BY
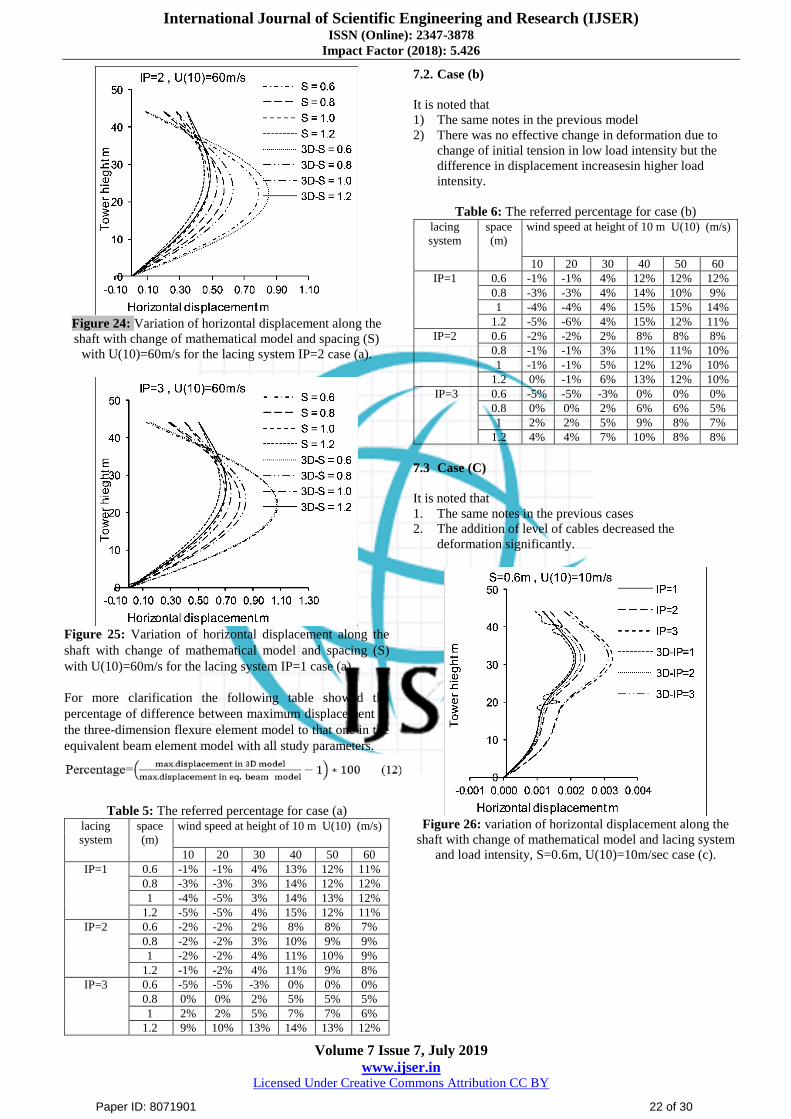
Figure 27: variation of horizontal displacement along the
shaft with change of mathematical model and lacing system
and load intensity, S=0.6m, U(10)=30m/sec case (c).
Figure 27: variation of horizontal displacement along the
shaft with change of mathematical model and lacing system
and load intensity, S=0.6m, U(10)=60m/sec case (c).
Figure 28: variation of horizontal displacement along the
shaft with change of mathematical model and lacing system
and load intensity, S=0.8m, U(10)=10m/sec case (c).
Figure 29: Variation of horizontal displacement along the
shaft with change of mathematical model and lacing system
and load intensity, S=0.8m, U(10)=30m/sec case (c).
Figure 30: Variation of horizontal displacement along the
shaft with change of mathematical model and lacing system
and load intensity, S=0.8m, U(10)=60m/sec case (c).
Figure 31: Variation of horizontal displacement along the
shaft with change of mathematical model and lacing system
and load intensity, S=1.0m, U(10)=10m/sec case (c).
Paper ID: 8071901 23 of 30

International Journal of Scientific Engineering and Research (IJSER) ISSN (Online): 2347-3878
Impact Factor (2018): 5.426
Volume 7 Issue 7, July 2019
www.ijser.in Licensed Under Creative Commons Attribution CC BY
Figure 32: Variation of horizontal displacement along the
shaft with change of mathematical model and lacing system
and load intensity, S=1.0m, U(10)=30m/sec case (c).
Figure 33: Variation of horizontal displacement along the
shaft with change of mathematical model and lacing system
and load intensity, S=1.0m, U(10)=60m/sec case (c).
Figure 34: Variation of horizontal displacement along the
shaft with change of mathematical model and lacing system
and load intensity, S=1.2m, U(10)=10m/sec case (c).
Figure 35: Variation of horizontal displacement along the
shaft with change of mathematical model and lacing system
and load intensity, S=1.2m, U(10)=30m/sec case (c).
Figure 36: Variation of horizontal displacement along the
shaft with change of mathematical model and lacing system
and load intensity, S=1.2m, U(10)=60m/sec case (c).
Figure 37: Variation of horizontal displacement along the
shaft with change of mathematical model and spacing (S)
with U(10)=30m/s for the lacing system IP=1 case (c).
Paper ID: 8071901 24 of 30
International Journal of Scientific Engineering and Research (IJSER) ISSN (Online): 2347-3878
Impact Factor (2018): 5.426
Volume 7 Issue 7, July 2019
www.ijser.in Licensed Under Creative Commons Attribution CC BY
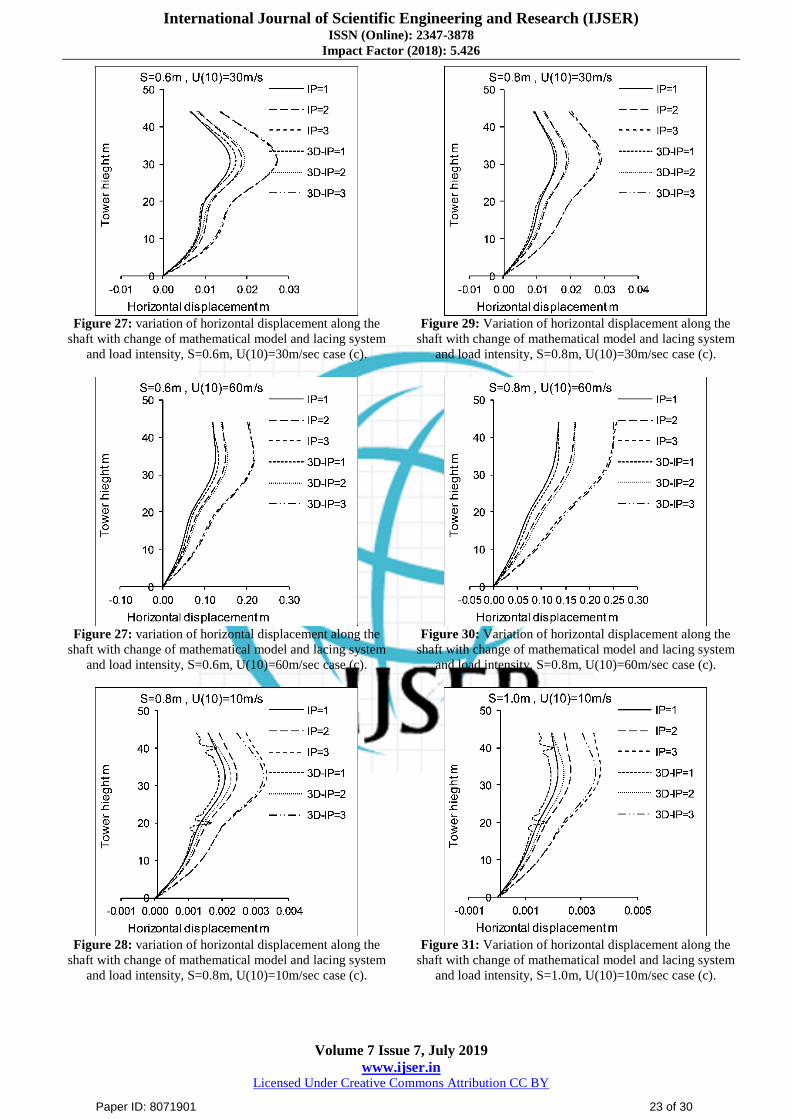
Figure 38: Variation of horizontal displacement along the
shaft with change of mathematical model and spacing (S)
with U(10)=30m/s for the lacing system IP=2 case (c).
Figure 39: Variation of horizontal displacement along the
shaft with change of mathematical model and spacing (S)
with U(10)=30m/s for the lacing system IP=3 case (c).
Figure 40: Variation of horizontal displacement along the
shaft with change of mathematical model and spacing (S)
with U(10)=60m/s for the lacing system IP=1 case (c).
Figure 41: Variation of horizontal displacement along the
shaft with change of mathematical model and spacing (S)
with U(10)=60m/s for the lacing system IP=2 case (c).
Figure 42: Variation of horizontal displacement along the
shaft with change of mathematical model and spacing (S)
with U(10)=60m/s for the lacing system IP=1 case (c).
Table 7: The referred percentage for case (c) lacing
system
space
(m)
wind speed at height of 10 m U(10) (m/s)
10 20 30 40 50 60
IP=1 0.6 -4% -5% 8% 11% 9% 6%
0.8 -9% -10% 6% 10% 6% 0%
1 -8% -13% 4% 9% -1% -1%
1.2 -6% -15% 3% 7% -1% -1%
IP=2 0.6 -5% -6% 4% 6% 5% 3%
0.8 -8% -9% 3% 5% 1% -2%
1 -10% -11% 1% 4% -3% -3%
1.2 -12% -12% 0% -2% -3% -3%
IP=3 0.6 -3% -4% 1% 2% 1% 1%
0.8 -3% -4% 2% 2% -1% -3%
1 -4% -5% 2% -3% -3% -3%
1.2 -5% -6% 1% -4% -3% -3%
7.4. Case (D)
It is noted that
The square section has some deference notes as flows:
Paper ID: 8071901 25 of 30
International Journal of Scientific Engineering and Research (IJSER) ISSN (Online): 2347-3878
Impact Factor (2018): 5.426
Volume 7 Issue 7, July 2019
www.ijser.in Licensed Under Creative Commons Attribution CC BY
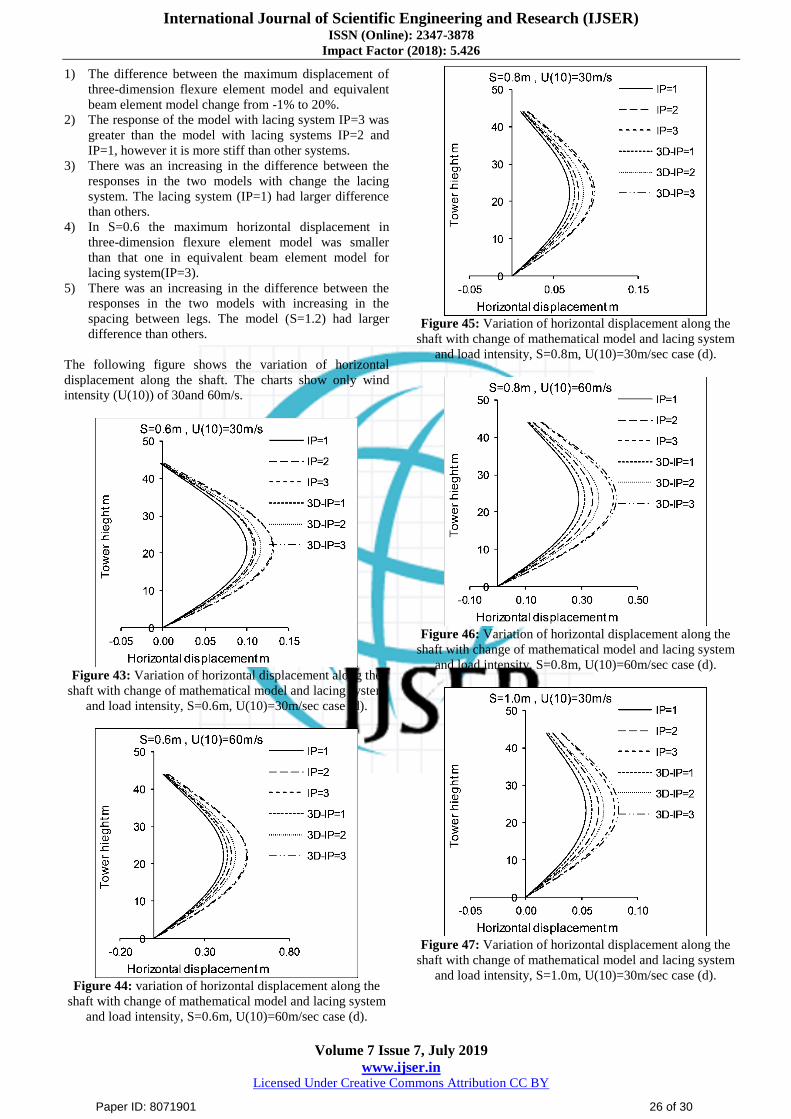
1) The difference between the maximum displacement of
three-dimension flexure element model and equivalent
beam element model change from -1% to 20%.
2) The response of the model with lacing system IP=3 was
greater than the model with lacing systems IP=2 and
IP=1, however it is more stiff than other systems.
3) There was an increasing in the difference between the
responses in the two models with change the lacing
system. The lacing system (IP=1) had larger difference
than others.
4) In S=0.6 the maximum horizontal displacement in
three-dimension flexure element model was smaller
than that one in equivalent beam element model for
lacing system(IP=3).
5) There was an increasing in the difference between the
responses in the two models with increasing in the
spacing between legs. The model (S=1.2) had larger
difference than others.
The following figure shows the variation of horizontal
displacement along the shaft. The charts show only wind
intensity (U(10)) of 30and 60m/s.
Figure 43: Variation of horizontal displacement along the
shaft with change of mathematical model and lacing system
and load intensity, S=0.6m, U(10)=30m/sec case (d).
Figure 44: variation of horizontal displacement along the
shaft with change of mathematical model and lacing system
and load intensity, S=0.6m, U(10)=60m/sec case (d).
Figure 45: Variation of horizontal displacement along the
shaft with change of mathematical model and lacing system
and load intensity, S=0.8m, U(10)=30m/sec case (d).
Figure 46: Variation of horizontal displacement along the
shaft with change of mathematical model and lacing system
and load intensity, S=0.8m, U(10)=60m/sec case (d).
Figure 47: Variation of horizontal displacement along the
shaft with change of mathematical model and lacing system
and load intensity, S=1.0m, U(10)=30m/sec case (d).
Paper ID: 8071901 26 of 30

International Journal of Scientific Engineering and Research (IJSER) ISSN (Online): 2347-3878
Impact Factor (2018): 5.426
Volume 7 Issue 7, July 2019
www.ijser.in Licensed Under Creative Commons Attribution CC BY
Figure 48: Variation of horizontal displacement along the
shaft with change of mathematical model and lacing system
and load intensity, S=1.0m, U(10)=60m/sec case (d).
Figure 49: Variation of horizontal displacement along the
shaft with change of mathematical model and lacing system
and load intensity, S=1.2m, U(10)=30m/sec case (d).
Figure 50: Variation of horizontal displacement along the
shaft with change of mathematical model and lacing system
and load intensity, S=1.2m, U(10)=60m/sec case (d).
Figure 51: Variation of horizontal displacement along the
shaft with change of mathematical model and spacing (S)
with U(10)=30m/s for the lacing system IP=1 case (d).
Figure 52: Variation of horizontal displacement along the
shaft with change of mathematical model and spacing (S)
with U(10)=30m/s for the lacing system IP=2 case (d).
Figure 53: Variation of horizontal displacement along the
shaft with change of mathematical model and spacing
(S)with U(10)=30m/s for the lacing system IP=3 case (d).
Paper ID: 8071901 27 of 30
International Journal of Scientific Engineering and Research (IJSER) ISSN (Online): 2347-3878
Impact Factor (2018): 5.426
Volume 7 Issue 7, July 2019
www.ijser.in Licensed Under Creative Commons Attribution CC BY
Table 8: The referred percentage for case (d) lacing
system
space
(m)
wind speed at height of 10 m U(10) (m/s)
10 20 30 40 50 60
IP=1 0.6 13% 9% 8% 7% 7% 7%
0.8 14% 11% 10% 9% 8% 8%
1 16% 13% 11% 10% 9% 9%
1.2 18% 15% 12% 10% 9% 8%
IP=2 0.6 5% 5% 5% 4% 4% 4%
0.8 8% 7% 7% 6% 6% 6%
1 9% 8% 8% 7% 7% 6%
1.2 10% 9% 8% 7% 6% 6%
IP=3 0.6 -1% -1% -1% -1% -1% -1%
0.8 3% 3% 3% 3% 2% 2%
1 6% 5% 5% 4% 4% 4%
1.2 7% 6% 5% 5% 4% 4%
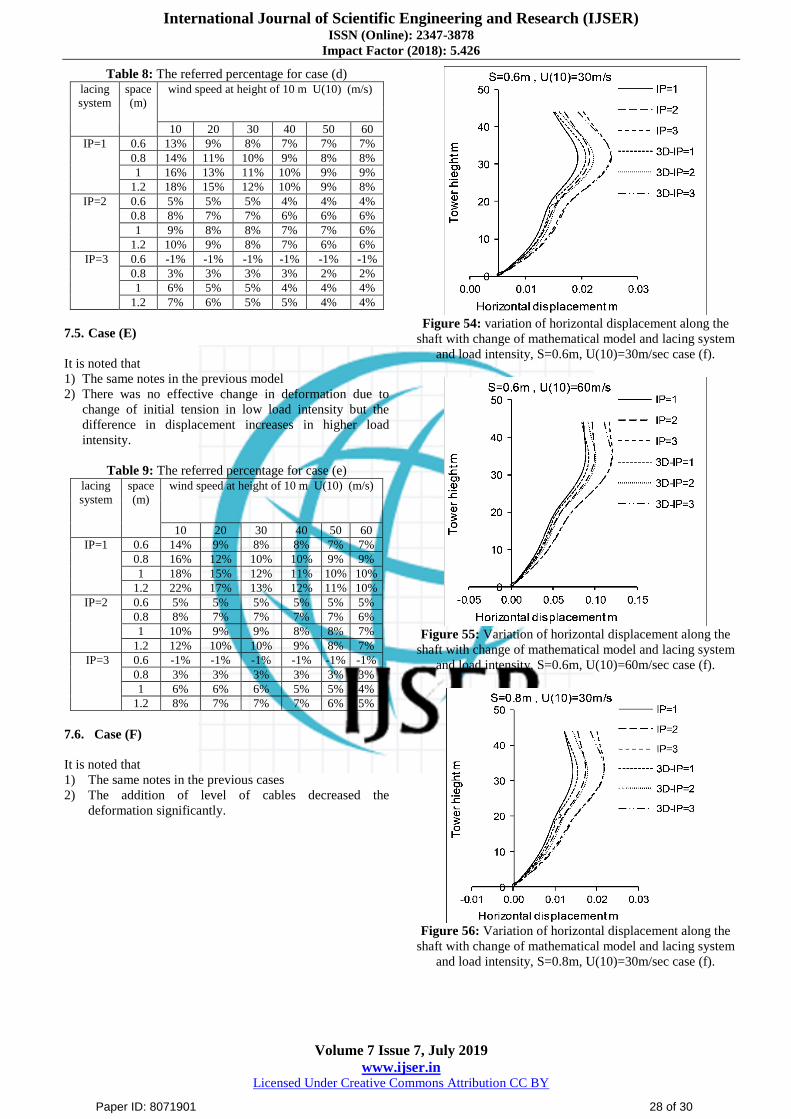
7.5. Case (E)
It is noted that
1) The same notes in the previous model
2) There was no effective change in deformation due to
change of initial tension in low load intensity but the
difference in displacement increases in higher load
intensity.
Table 9: The referred percentage for case (e) lacing
system
space
(m)
wind speed at height of 10 m U(10) (m/s)
10 20 30 40 50 60
IP=1 0.6 14% 9% 8% 8% 7% 7%
0.8 16% 12% 10% 10% 9% 9%
1 18% 15% 12% 11% 10% 10%
1.2 22% 17% 13% 12% 11% 10%
IP=2 0.6 5% 5% 5% 5% 5% 5%
0.8 8% 7% 7% 7% 7% 6%
1 10% 9% 9% 8% 8% 7%
1.2 12% 10% 10% 9% 8% 7%
IP=3 0.6 -1% -1% -1% -1% -1% -1%
0.8 3% 3% 3% 3% 3% 3%
1 6% 6% 6% 5% 5% 4%
1.2 8% 7% 7% 7% 6% 5%
7.6. Case (F)
It is noted that
1) The same notes in the previous cases
2) The addition of level of cables decreased the
deformation significantly.
Figure 54: variation of horizontal displacement along the
shaft with change of mathematical model and lacing system
and load intensity, S=0.6m, U(10)=30m/sec case (f).
Figure 55: Variation of horizontal displacement along the
shaft with change of mathematical model and lacing system
and load intensity, S=0.6m, U(10)=60m/sec case (f).
Figure 56: Variation of horizontal displacement along the
shaft with change of mathematical model and lacing system
and load intensity, S=0.8m, U(10)=30m/sec case (f).
Paper ID: 8071901 28 of 30

International Journal of Scientific Engineering and Research (IJSER) ISSN (Online): 2347-3878
Impact Factor (2018): 5.426
Volume 7 Issue 7, July 2019
www.ijser.in Licensed Under Creative Commons Attribution CC BY
Figure 57: Variation of horizontal displacement along the
shaft with change of mathematical model and lacing system
and load intensity, S=0.8m, U(10)=60m/sec case (f).
Figure 58: Variation of horizontal displacement along the
shaft with change of mathematical model and lacing system
and load intensity, S=1.2m, U(10)=30m/sec case (f).
Figure 59: Variation of horizontal displacement along the
shaft with change of mathematical model and lacing system
and load intensity, S=1.2m, U(10)=60m/sec case (f).
Figure 60: Variation of horizontal displacement along the
shaft with change of mathematical model and spacing (S)
with U(10)=30m/s for the lacing system IP=1 case (f).
Figure 61: Variation of horizontal displacement along the
shaft with change of mathematical model and spacing (S)
with U(10)=30m/s for the lacing system IP=2 case (f).
Figure 62: Variation of horizontal displacement along the
shaft with change of mathematical model and spacing (S)
with U(10)=30m/s for the lacing system IP=3 case (f).
Paper ID: 8071901 29 of 30

International Journal of Scientific Engineering and Research (IJSER) ISSN (Online): 2347-3878
Impact Factor (2018): 5.426
Volume 7 Issue 7, July 2019
www.ijser.in Licensed Under Creative Commons Attribution CC BY
Table 10: The referred percentage for case (f)
lacing
system
space
(m)
wind speed at height of 10 m U(10) (m/s)
10 20 30 40 50 60
IP=1
0.6 17% 13% 9% -4% 5% 4%
0.8 14% 11% 8% -5% 0% -3%
1 13% 10% 6% -13% -4% -4%
1.2 10% 7% 2% -19% -4% -4%
IP=2
0.6 7% 5% 4% 3% 2% 1%
0.8 6% 4% 3% 0% -4% -6%
1 4% 2% 0% -7% -7% -6%
1.2 2% -2% -5% -8% -7% -7%
IP=3
0.6 2% 1% 1% 0% 0% -1%
0.8 3% 1% 0% -1% -5% -6%
1 2% 0% -2% -7% -7% -6%
1.2 0% -5% -8% -8% -7% -7%
8. Conclusions
8.1. Analysis of the shaft of guyed tower as equivalent beam
element model gives deformation along the shaft with
accuracy about (92) % of real deformation for triangular
section and about (87) % of real deformation for square
section
8.2. Increasing of lacing stiffness makes the model
approaching to act as a one unite.
8.3. Increasing of space between legs leads to decrease of
the stiffness of the three-dimension model.
8.4. The difference in displacement is shown clearly at
higher value of load intensity.
8.5. The change of initial tensions has no effect on
deformation in small deformation but it has small effect
on deformation in larger load intensity.
8.6. The triangular section is better than square one as it acts
approximately as one unit and has smaller loads from
wind.
9. Acknowledgment
The authors wish to thank Mansoura University, Information
Technology Institute in Cairo and the Egyptian Supreme
Council of Universities for their technical and logistic
support.
References
[1] ***, EN 1993-3-1:2006, Eurocode 3 – Design of steel
structures – Part 3-1: Towers, shafts and chimneys.
[2] Pezo, M. L., et al.: Structural Analysis of Guyed Shaft
Exposed to Wind Action THERMAL SCIENCE, Year
2016, Vol. 20, Suppl. 5, pp. S1473-S1483.
[3] Bazeos, N., et al., Static, Seismic and Stability
Analyses of a Prototype Wind Turbine Steel Tower,
Engineering Structures, 24 (2002), 8, pp. 1015-1025.
[4] Harikrishna, P., et al., Full Scale Measurements of the
Structural Response of a 50 m Guyed Shaft under
Wind Loading, Engineering Structures, 25 (2003), 7,
pp. 859-867.
[5] Gioffre, M., et al., Removable Guyed Shaft for Mobile
Phone Networks: Wind Load Modeling and Structural
Response, Journal of Wind Engineering and Industrial
Aerodynamics, 92 (2004), 6, pp. 463-475.
[6] Ben Kahla, N., Dynamic Analysis of Guyed Towers,
Engineering Structures, 16 (1994), 4, pp. 293-301
[7] Ben Kahla, N., Nonlinear Dynamic Response of a
Guyed Tower to a Sudden Guy Rupture, Engineering
Structures, 19 (1997), 11, pp. 879-890
[8] Law, S. S., et al., Time-Varying Wind Load
Identification from Structural Responses, Engineering
Structures, 27 (2005), 10, pp. 1586-1598
[9] Wahba, Y. M. F., et al., Evaluation of Non-Linear
Analysis of Guyed Antenna Towers, Computers and
Structures, 68 (1998), 1, pp. 207-212.
[10] Saudi, G., Structural Assessment of a Guyed Shaft
Through Measurement of Natural frequencies,
Engineering Structures, 59 (2014), Feb., pp. 104-112.
[11] Battista, R. C. et al., Dynamic Behavior and Stability
of Transmission Line Towers under Wind Forces,
Journal of Wind Engineering and Industrial
Aerodynamics, 91 (2003), 8, pp. 1051-1067.
[12] Yan-Li, H., et al., Nonlinear Discrete Analysis Method
for Random Vibration of Guyed Shafts under Wind
Load, Journal of Wind Engineering and Industrial
Aerodynamics, 91 (2003), 4, pp. 513-525.
[13] da Silva, J. G. S., et al., Structural Assessment of
Current Steel Design Models for Transmission and
Telecommunication Towers, Journal of Constructional
Steel Research, 61 (2005), 8, pp. 1108-1134.
[14] M. Naguib "Buckling Strength and Dynamic Response
of Guyed Towers" Ph. D. Thesis, Mansoura University
(1989).
[15] C. Gantes, R. Khoury, J. J. Connor and C. Pouangare "
Modelling, Loading, and preliminary Design
Consideration for tall guyed towers" Computers &
Structures Vol. 49, No. 5, pp. 797-805, 1993.
[16] H. M. Irvine, Cable Structures. MIT Press (1981).
[17] Hobbs, R. E., Raoof, M., Behaviour of Cables under
Dynamic or Repeated Loading, J. Construct. Steel
Res., 39 (1996), 1, pp. 31-50.
[18] Desai, Y. M., Punde, S., Simple Model for Dynamic
Analysis of Cable Supported Structures, Engineering
Structures, 23 (2001), 3, pp. 271-279.
[19] Salehi, A. A. M., et al., Nonlinear Analysis of Cable
Structures under General Loadings, Finite Elements in
Analysis and Design, 73 (2013), Oct., pp. 11-19.
[20] Jayaraman, H. B., Knudsen, W. C., Curved Element for
the Analysis of Cable Structures, Computers
&Structures, 14 (1981), 3-4, pp. 325-333.
[21] J. W. Leonard, Tension Structures: Behavior and
Analysis. McGraw-Hill (1988).
[22] Iass,"recommendation for the analysis and design of
guyed shaft" London U. k. 1985.
[23] H.A. BUCHHOLDT "An Introduction to Cable Roof
Structures”, Cambridge University, Press, 1985.
Paper ID: 8071901 30 of 30