tourist’s motives and information sources affecting … · web viewfood tourism can be defined as...
TRANSCRIPT
CHAPTER 1
GENERALITIES OF THE STUDY
This study discusses Foreign Tourist Motivation and Information Source(s)
used effecting their Preference for eating out at Ethnic Restaurant in Bangkok,
Thailand. Chapter one begins with general background of the study. It consists of (1)
Introduction of the study, (2) Statement of the problem, (3) Research objectives, (4)
Scope of the research, (5) Limitations of the research, (6) Significance of the study
and (7) Definition of the terms.
1.1 Introduction of the Study
1.1.1 Food and Tourism
Food like other groups of factors such as accommodation, transport,
attractions and activities, is a basic and crucial element of the tourist product
(Reyonlds, 1994). Nowadays, food and tourism are increasingly being combined
(Anner & Magda, 2000). A variety of food is necessary for the lifecycle of tourists
and has benefit to their health directly. Tourists may not pay their money for buying
gift things but certainly they must consume food. Food in tourist marketing seems to
have increased considerably over the past few decades. It is used as appealing eye-
catchers in Brochures, Magazines, Internet as well as television programmes
(Antonioli, 1999).
Antonioli (1995) stated that food is culture. Eating a typical dish is a way of
coming into contact with the local population and participatory moment related to the
environment context concerned.
1

Moreover, food is also one of the essential elements of the tourist experience.
Tourist choices of food are not only determined by a physical need to ‘feed oneself’,
but also by the desire to eat interesting dish in suitable environments (Mennell, 1985).
Dining out is an opportunity that to relax and to relieve the cook from the drudgery of
everyday living. Combining with the element of travel, food can be the driving force
that motivates people to visit certain holiday destination and can be a window into the
identity of cultures, and a pleasurable experience, such as In France, Italy and
Scotland, tourists closely integrate experience of food and drink within their holiday
experience (Michael, 2003).
Undoubtedly, the expenditure of food is a significant component of both
government and business. In Australia, visitors from the USA spent about 18% of
their total expenditure on food and drink. People visiting for ‘other’ reasons (e.g.
education, employment and health) spent 26% of their total expenditure on food. The
largest expenditure items of business visitors were prepaid 27% of total expenditure
respectively for food and drink (Australian Bureau of statistics, 2000).
In conclusion, Food is integral to tourist experience; expressive of a regional
culture and a part of income both local government and business, growing food for
the hotel and restaurant sector can be a significant income earner and employment
opportunity (Reynolds, 1993). Therefore, Food becomes an important element in the
marketing of tourism and hospitality studies (Wood, 2000),
1.1.2 Importance of Restaurant at Tourist Destination
Most tourists view restaurants or food service as an important part of the
tourist package (Elmont, 1995). The food that a restaurant offers can have a major
impact on whether or not the establishment will attract tourists, or whether the tourists
2

are satisfied with the destination altogether (Sparks et al., 2001). Au and Law (2002)
support this, as they state that restaurant can provide the highest and lowest moments
of a vacation experience.
Additionally, the researcher Reynolds (1993) makes a point that restaurant can
be developed on tourist destination. It provides tourist with exposure to part of the
destination’s culture by providing authentic food. Regarding to the characteristic of
the dishes on the menu especially in ethnic restaurants provide the tourists with a
sense of realness of things. For instance, the mixing of different cultures has led to
increased sophistication in tastes and expectations, and has raised consumer curiosity
about different cuisines and ingredients (Long, 1998a).
In the USA, a trend has been observed where restaurants are becoming an
increasing part of tourism marketing. In order to encourage the marketing of
restaurants, in 1999 the National Restaurant Association and the Department of
Commerce teamed up and declared as 1999 ‘The Year of the Restaurant’ (Van, 1999).
The US Department of Commerce acknowledges that the restaurant industry is
important to the nation’s economy, with tourists spending more than US$ 70 billion a
year on food and shopping (Van, 1999).
Further, to view the important role of restaurant at the tourist destination, the
Table 1.1 Tourism New Zealand (2001a) indicates that most of the tourists regard
eating out as one of the important part involved in their whole holiday activities. The
Table 1.1 is presented overleaf.
3

Table 1.1 Eating out/restaurant as an activity while on holiday in New Zealand
(year ending June 2001)
Number Visiting Total % of Ranking out of
Nationality Restaurants Visitors Nationality all Activities
UK 115 558 191 044 60.5 2
Germany 29 509 49 962 59.1 2
Hong Kong 23 159 39 484 58.7 3
USA 107 734 183 774 58.6 2
South Africa 10 362 17 924 57.8 2
Taiwan 21 399 37 711 57.3 2
Canada 21 517 37 711 57.1 2
South Korea 32 297 56 577 57.1 1
Australia 286 584 522 925 54.8 1
Singapore 18 742 34 738 53.9 2
Netherlands 12 733 24 292 52.4 6
Japan 77 000 157 465 48.9 3
Total all countries 905 164 1 672 677 54.1 1
Source: Tourism New Zealand (2001a)
1.1.3 The Popularity of Ethnic Food
The process of globalization and the worldwide media have exposed people to
4

a wide variety of cuisines (Finkelstein, 1989). Nowadays, ethnic food is being
increasingly popular over the world that includes Italian, Mexican, Indian, Chinese,
Japanese, Mediterranean, Thai, Vietnamese and French etc. In the UK, the last two
decades there has been a dynamic growth in consumption of ethnic foods both in and
outside home. The total expenditure on ethnic eating, including restaurants and
takeaways, is estimated to be over 1 billion annually. There are an estimated 6,000
Chinese restaurants, 5,500 Indian restaurants and 300 Thai restaurants in the UK
(Ahmad, 1996).
Similarly, American tourists are becoming more familiar with spices and more
intense flavor profiles. Travel has played a key role in the growing acceptance of
ethnic foods, and more disposable income has also led more Americans to travel
overseas to experience the wonderful foods of other countries. The market for ethnic
restaurants and cuisines in USA grew a great deal in the 1990s, six cuisines
have enjoyed significant growth in popularity — Italian, Mexican, Japanese
(sushi), Thai, Caribbean and Middle Eastern (Restaurant USA Magazine,
2000).
1.1.4 The Nature of Restaurant
Restaurant is a type of foodservice operation that can range from cafés (with a
small, limited menu) to large, full service facilities offering sit down table service
and /or self-service, include providing food for take-out and coffee houses (Arthur &
Mitchell, 2002).
The Types of Restaurant
There are various ways to classify restaurants. Here are some shown as
5

follows:
Fast Food Restaurant
Fast food restaurant is a type of food service establishments which serves food
for which there is little or no waiting. It offers limited menus featuring food such as
hamburgers, hot dogs, French fries, chickens, sandwiches as well as Pizza which are
convenience of people to take the food home (www.allfoodbusiness.com last accessed
on 30/10/05).
Ethnic restaurants
Ethnic restaurant is a type of restaurants that usually decorated in an ethnic
manner with cultural atmosphere. They offer a cuisine and theme that combine to
provide a “get-away” experience. Their menus usually include traditional ethnic
dishes and authentic ethnic food. The popular types of ethnic restaurant include
Italian, Chinese, Mexican, Indian, Thai, English, French, German, Japanese, Korean,
and Vietnamese restaurants (Powers et al., 1999).
Specialty Restaurant
Many restaurants specialize in a certain type of food. These restaurants range
in price from moderate to expensive, depending on the type of food. Seafood is
popular, as well as steak and pizza (www.readtolearn.org last accessed on 30/10/05).
Family-style restaurants
As the name implies, these establishments are geared toward families. Their
menus offer a variety of selections to appeal to a broad range of customers (Powers, et
al, 1999). Many restaurants welcome children and have special menus and prices for
6

them. Some even provide games and toys. These restaurants are usually moderate in
price (www.readtolearn.org last accessed on 30/10/05).
Gourmet Restaurant
Some restaurants are considered to have exceptional food, a well-known chef,
excellent ambiance, excellent service, and in some cases, an excellent location. They
are very expensive (www.readtolearn.org last accessed on 30/10/05).
American-style Restaurant
These restaurants are very popular. There is a variety of food from salads and
chili to steak, chicken and barbecue. Prices are moderate (www.readtolearn.org last
accessed on 30/10/05).
1.1.5 Restaurant Business in Thailand
In Thailand, restaurant can be classified into 4 segments as follow: the first
segment is Fine Dining, which is the luxury restaurant such as the restaurant in the
hotel. Success depends on quality, food prepared to order by highly skilled chefs
(power, 2003). The second segment is casual-dining which has full service and the
waiter serves the food at table such as MK restaurant, Pizza Hut, Sizzle, Fuji, Ra-Cha,
Zen, etc. The third segment is Quick Service Restaurant (QSR), which is quick
service (not more than 10 minutes) and self-service (take food and find seat) such as
McDonald, KFC, A&W, Dunkin Donut, etc. The last segment is vendor such as the
noodle shops and street vendors.
Regarding to the current situation of Restaurant Business of Thailand, KRC
(Kasikorn Research Center) of Thailand expects that Thai domestic restaurant
7

business will likely have a turnover of approximately Baht90 Billion in 2005, and
enjoy business expansion of about 6.6 % over the year. As for the expenditures of
foreign tourists, they spend approximately 20% of their total expenditures for food &
beverage during their stay in Thailand (Domestic Restaurant Business, 2004).
At present, Restaurant Business in Thailand may be categorized in three types:
1. Fast-Food Restaurants
The market share of fast-food restaurants is projected and will stand at around
6.2 % in 2005. The business is expected to grow 7.8 %, year-on-year. Almost 90 % of
These types of restaurants are franchises. Of these, 40 % sell primarily chicken
entrees; 20 %, hamburgers; 15 %, pizza; 10%, ice-cream and 15 percent, others.
Currently, there are more than 1,000 fast-food restaurants in Thailand (Domestic
Restaurant Business, 2004).
2. Small Establishments
This category is characterized by small-business (not including food stalls and
pushcarts) owners engaging in the operation of this business on their own, including
those just venturing into the business. It should be regarded that this segment is
expected to reap 84.6 % of the entire turnover of all restaurant business in 2005, with
a respectable growth of 5.2% year-on-year (Domestic Restaurant Business, 2004).
3. Foreign Cuisine and high-end Restaurants
In 2005, the market share of high-end restaurants is expected to total 9.2 %,
and experience a projected growth of 2.0% year-on-year. Japanese-style restaurants
have exhibited outstanding growth. According to KRC's previous survey, it was found
8

that Bangkok residents who had tried foreign cuisine cited that the five most-favored
foreign cuisines were Japanese, American, Italian, Chinese and Vietnamese
dishes(Domestic Restaurant Business, 2004).
1.1.6 Ethnic Food in Bangkok
As complex and dynamic part of the restaurant industry, ethnic
restaurants often present consumers with their first impression of a particular
food (Penaloza, 1994). Whether the food is Indian or Italian, most different ethnic
restaurants adhere to the cooking traditions of a particular region. Customer will
experience a country's cuisine prepared according to tradition, though usually
somewhat modified for American (www.smartpages.com last accessed on 05/11/05).
In Bangkok, many ethnic restaurants can be found at Yaowarat Road,
Phahurat Road, Sukhumvit Road, Siam Square, Siom Road. As the research focuses
on the Centre World Plaza and Sukhumvit Road which is one of most famous
shopping area that is plenty of ethnic restaurants hidden away along Sukumvit’s many
side streets (Sois) as well as those on the main road around the hotels. There are many
kind of ethnic foods such as European, American, Italian, French, Chinese, German,
Mexican, Indian, Middle Eastern and Japanese restaurant along the road, especially
Soi Nana and Soi Thonglor (www.thaiconnections.co.uk last accessed on 05/11/05).
There are some popular ethnic foods in Bangkok listed as follows:
Thai Food
Thai food is flavorful and often spicy. Rice is the staple food with side dishes
including curries eaten as sauces. Ingredients include coconut milk, lemongrass,
garlic, ginger root, and Thai chilies. Most dishes are stir-fried or steamed. Try pad
9

Thai, which incorporates egg, chicken or shrimp, and ground peanuts in a savory
noodle dish. Many Thai restaurants can be found in Bangkok, such as Cabbages &
Condoms, Blue Elephant and more restaurants listed at appendix B
(www.bangkok.com last accessed on 05/11/05).
Chinese Food
Chinese food is divided by geographical regions, each with distinct differences
(Szechuan, Hunan, Cantonese style). As per Chinese concept, the use of food as
medicine is based on five element concept, which are water, fire, wood, metal and
earth. The Chinese categorize foods into five tastes: sourness, sweetness, bitterness,
acridness and saltiness. Chinese believe that foods and drugs with the same taste
should have the same medicinal effect. Since the Chinese community is prominent in
Bangkok, quality Chinese food can be found in most smart hotels where a
good Chinese restaurant is often patronized by local businessmen as well as visitors.
Such as Top restaurants include Bai Yun at the Westin Banyan Tree, Ming Palace at
the Indra and more restaurants listed at appendix B (www.bangkok.com last accessed
on 05/11/05).
Japanese Food
The Japanese community in Bangkok has quietly settled in over the last few
years making their mark on Bangkok's culinary map. Japanese food focuses on health
with low fat. Food variations include hand rolls, in which fish and other ingredients,
such as vegetables, are rolled into a cylindrical shape and wrapped in seaweed.
Clusters of Japanese restaurants are located around Sukhumivt soi 33 together with
hostess bars around Soi Thaniya off Patpong. When you go through any
10

shopping mall you will always find a Japanese restaurant and more listed at appendix
B (www.bangkok.com last accessed on 05/11/05).
Indian Food
This country is the spice capital of the world, and regional dishes range from
sweet and spicy (Southern) to hot and sour (Northern). Dishes from the tropical south
are very spicy and frequently include curries of chicken and pork made with coconut,
garlic and onion. For a local Indian, try the Royal India located in a little alley off
Chakraphet in Chinatown are a number of smaller local Indian restaurants near
Sukumvit (sois 11 and soi12) and more restaurants listed at appendix B
(www.bangkok.com last accessed on 05/11/05).
Italian Food
There is no shortage of good Italian places to eat in Bangkok. Around
Sukhumvit, L'Opera (Soi Prompong) and Pan Pan (Soi 33) are old established local
Italian favorites. Govinda, (Sukhumvit Soi 22) offers all the usual Italian fare, pizzas
made in bricks kilm oven, plus vegetarian dishes (www.bangkok.com last accessed
on 05/11/05).
French Food
French cuisine is also notable for its remarkable sauces (often cream-based),
sumptuous desserts, and exquisite wines. Classy establishments include places like the
well established Normandy Grill at the Oriental Hotel and more restaurants listed at
appendix B (www.bangkok.com last accessed on 05/11/05).
11

In 2004, compared to the ethnic food, the growth of fast food outlets has
decreased, mainly due to the change in consumers’ eating habits to include more
health and ethnic cuisine. Especially, Japanese foods are emerging as a popular type
of ethnic food in Thailand (www.fas.usda.gov last accessed on 30/07/05). There are
more than 300 Japanese restaurants in Thailand. Of them, 40% are standalone
restaurants, 50% are in department stores and 10% belong to hotels. Japanese
restaurants are planning to expand at least 10 branches in department stores, making
estimated turnover 3 billion baht in 2005, (www.fas.usda.gov last accessed on
30/07/05).
1.2 Statement of the Problem
Tourists at destination might have time in their hands and money to spend.
Also in most case a meal experience is more enjoyable than just eat and drink. There
have been changes in food and beverage environment. Sometimes health
consciousness leads people to change their eating and drinking habits. Sometimes,
people look for innovation and variety as well as value and quality. Even presentation
styles are changing; sometimes, as a result of fashion, sometimes as a result of
technology. However, the influence of ethnic and international cuisine is increasing.
Ethnic restaurant sector in Bangkok is strongly influenced by the development
of tourism. Tourists eating out while on holiday are increasingly looking for ethnic
restaurant and more authentic ethnic food in Bangkok. However, ethnic restaurants
are highly competitive with other restaurant (such as fast food restaurant), there is still
challenge for new investors in the restaurant business. Managers who understand
tourist’s choice and manage their response accordingly will help to develop the
business growth.
Therefore, this study is designed to find out the important motivations for
12

foreign tourists eating out at Ethnic Restaurant and to investigate the effects that two
types of information sources, printed materials and restaurant characteristics, have on
respondents’ preference of ethnic restaurant in Bangkok. Based on these purposes, the
questions in this research are:
1. What are the important motivations which effect foreign tourists prefer to eat
out at ethnic restaurants in Bangkok?
2. What information source(s) strongly influence the foreign tourists’ preference
for eating out at ethnic restaurants in Bangkok?
3. What are the differences in perception between Western and Asian foreign
tourists’ preference for eating out at ethnic restaurants in Bangkok?
1.3 Research Objectives
The objectives of this research emphasis on foreign tourists’ motivation for
eating out while on holiday, type of information source(s) used and the factors that
influence their preference for eating out at ethnic restaurant., so that the target
respondents focus on the foreign tourists who are eating out at Ethnic Restaurant in
Bangkok. Thus, the objectives of this study are as follows:
1. To investigate the important motivations that effect tourists’ preference for
eating at ethnic restaurants in Bangkok?
2. To identify which information source(s) strongly influence the foreign
tourists’ preference for eating out at ethnic restaurants in Bangkok.
3. To analyze the difference in perception between Western and Asian foreign
tourists’ preference for eating out at ethnic restaurants in Bangkok.
13

1.4 Scope of The Research
This study will design to investigate the relationship between foreign tourists’
motivations for eating out; information source(s) used which they typically rely when
they look for the ethnic restaurants while on holiday; and the significant factors that
influence their preference for the Ethnic Restaurant in Bangkok. Therefore, the
researcher will select the target group of respondents from Western and Asian foreign
tourists, and distribute the questionnaire to some of them who are going to have their
meal at Ethnic Restaurant in Bangkok.
Ethnic Restaurants can be found at many business areas in Bangkok, such as
Yaowarat, Payathai, Sukhumwit, Silom roads and Siam Centre, Ma-Boon-Krong
Centre (MBK), Centre World Plaza as well as middle/first-class hotels
(www.thaiwaysmagazine.com last accessed on 26/07/05). In this study, the researcher
focuses on 8 selected ethnic restaurants which are located on Sukhumwit Road and
Central World Plaza that are regarded as the most famous tourists and business area
and full of ethnic restaurants (Thai, Chinese, Japanese, Indian, Greek, Arabian,
Mexican, Italian, Korean, French and Vietnamese etc.)
1.5 Limitations of the Research
1. The research focuses on the selected motivations to investigate the level of
importance for foreign tourists eating out at ethnic restaurants, so it does not
cover every motivation(s) that might effect their preference for eating out at
ethnic restaurants.
2. Ethnic restaurant selection does not include ethnic restaurants inside the
hotels, cooking schools and hospitals in the Bangkok area, so the findings of
this study should not be able to explain about the situations.
14
3. According to the statistics of Tourism Authority of Thailand (TAT) in January,
2005, the majority of the foreign tourists are Western and Asian tourists about
96.73% of the Total International Tourists Arrivals to Thailand (www2.tat.or.th
last accessed on 01/10/05). So the research focuses on foreign tourists (Asian
and western) only, the outcome of this study could not be generalized for other
type of tourists.
4. The research probably focuses on Free Independent Travelers instead of all
inclusive group travelers.
5. The research emphasis on Casual – dining Ethnic Restaurants available in
Bangkok.
1.6 Significance of the Study
The research can be useful for the ethnic restaurant managers who are
interested to develop the requirement of target market group not only local people but
also foreign tourists, because the research is designed to investigate reasons why
foreign tourists prefer to eat out at ethnic restaurant and will identify the most
important motivation for them.
Moreover, the research is designed to investigate the information source(s) on
which foreign tourists typically rely when they look for the ethnic restaurant. It also
can help the restaurant managers and business investors to have more understanding
on how potential tourists make their decision, thus they can carry out marketing
communication strategies that might facilitate the selection of their potential
customers.
15

1.7 Definition of the Terms
Culture
A culture is a way of life of a group of people – the behaviors, beliefs, values,
and symbols that they accept, generally without thinking about them, and that are
passed along by communication and imitation from one generation to the next
(www.tamu.edu last accessed on 02/08/05).
Ethnic food
Ethnic food is that it represents dishes (and their ingredients) that can be
attributed to a specific ethnic group (www.deloitte.com last accessed on 04/08/05).
Ethnic Restaurant
An ethnic restaurant is one that specializes in food associated with particular
culture. Among the most common of these are Chinese, Mexican, Greek, Japanese,
German, Italian, Spanish and Indian (Michael, 2003).
Fast food restaurant
Fast food restaurant is a type of foodservice establishment which serve food
for which there is little or no waiting. It offers limited menus featuring food such as
hamburgers, hot dogs, chickens, and other items for the convenience of people on the
go (http://en.wikipedia.org last accessed on 06/08/05).
Food
Material, usually of plant or animal origin, that contains or consists of
essential body nutrients, such as fats, proteins, vitamins, or minerals, and produce
energy, stimulate growth, and maintain life (www.answers.com last accessed on
04/08/05).
Food tourism
Food tourism can be defined as visitation to primary and secondary food
16

producers, food festivals, restaurants and specific locations for which food tasting or
experiencing the attributes of specialist food production region are the primary
motivating factor for travel (Hall et al ., 2001a).
Foreigner tourists
Foreign persons admitted under tourist visas (if required) for purposes of
leisure, recreation, holiday, visits to friends or relatives, health or medical treatment,
or religious pilgrimage. They must spend at least a night in a collective or private
accommodation in the receiving country and their duration of stay must not surpass
12 months (www.wordnet.princeton.edu last accessed on 06/08/05).
Hospitality industry
Includes a wide range of business, each of which is dedicated to the service of
people away from home, business that emphasize personnel’s responsibility to be
hospitable under the direction of hosts and managers of offered services (Arthur al et.,
2002).
Restaurant
This term comes from the French word restaurant, meaning “restores of
energy”. Restaurant is defined as, ‘any public place that specializes in the sale of
prepared food for consumption on or off premise’ (Powers, 2002).
Popularity
A person, action, decision or thing becomes popular if many people like or use
that entity/object. Thus popular means both "well liked" and "common" or "mass".
(http://en.wikipedia.org last accessed on 06/05/05)
Tourism
As recommended by World Tourism Organization and adopted by United
Nations, tourism comprises the activities of persons traveling to and staying in places
17

outside their usual environment for not more than one consecutive year leisure,
business and other purpose (Paul et al,1997).
Tourist
A tourist is a person who travels to a place one hundred miles or more away
from home or who stays away from home one or more nights in paid accommodations
and who returns home within twelve months, except for those commuting to and from
work or attending school (Paul et al, 1997).
Tourist destination
A tourist destination is any geographic location, country, state, region, area,
city, town or any other, that receives appreciable numbers of visitors, regardless of the
means or transportation they use to reach the destination (Paul et al, 1997).
18

CHAPTER 2
LITERATURE REVIEW
In this chapter, the research will focus on the main theories and literature
related to independent and dependent variables in order to develop the conceptual
framework of this study. Therefore, the chapter is divided into 4 sections as follows:
2.1 Definition, Theories and Discussion of the Main Independent Variables
2.2 Definition, Theories and Discussion of the Main Dependent Variables
2.3 The Relationship between Independent and Dependent variables
2.4 Empirical Research Findings
2.1 Definition, Theories and Discussion of the Main Independent Variables
2.1.1 Motivation
Motivation can be defined as the need or desire that determines an individual’s
effort, behaviors and actions, it occurs when some people wants to satisfy their needs.
It can be something as a driving force behind behavior, and it is related with
individual’s personality. Motivation can influence an individual how to react in the
world around him or her (Mayo and Jarvis, 1984).
Iso-Ahola (1980) describes motivation as internal dispositions that trigger,
direct, and integrate a person’s behavior. Motives, together with biological needs and
situational factors are determinants of a person’s motivation.
Furthermore, the word “Motivation” is the push of the mental forces to
accomplish an action. On the biological level basic human needs of food, shelter and
survival are powerful motivators. On the psychological level people need to be
19

understood, validated and appreciated (Jackson, 1998). For instance, the tourists’
motivation were expressed on good value food, shopping, and a variety of things to
do, and their perception of good value cuisine and hotels, (Goodrich, 1978).
Motivation Theory
a) Maslow’s Hierarchy of Needs Theory
Abraham Maslow’s Theory of Hierarchy needs is one of the most reasonably
well known theories of motivation. Beyond the details of air, water, and food, he laid
out five broader layers: the physiological needs, the need for safety, the need for
acceptance, the need for esteem, and the need to actualize the self (Lewis et al, 2000).
Figure 2.1 Maslow’s Hierarch of Needs
Source: Lewis. R. C. (2000). “Marketing Leadership in Hospitality Foundation and
practices” P. 215.
20
Self -Actualization

1. The physiological needs.
These include the needs we have for oxygen, water protein, salt, sugar,
calcium, and other minerals and vitamins. Also, there are the needs to be active, to
rest, to sleep, and to avoid pain. It is most likely that the major motivation would be
the physiological needs rather than any others (Lewis et al, 2000).
2. The safety and security needs.
When the physiological needs are largely taken care of, this second layer of
needs comes into play. People will become increasingly interested in finding safe
circumstances, stability and protection. They might develop a need for structure, for
order. Therefore, in a very real sense, they no longer have any safety needs as active
motivators. Just as a sated man no longer feels hungry, a safe man no longer feels
endangered (Lewis al et, 2000).
3. The need for acceptance
Originally Maslow referred to this need as the need for belongingness and
love. When physiological needs and safety needs are, by and large, taken care of, a
third layer starts to show up. a person begin to feel the need for friends, a sweetheart,
children, affectionate relationships in general, even a sense of community. Looked at
negatively, they become increasing susceptible to loneliness and social anxieties
(Lewis et al, 2000).
4. The esteem needs.
The need for esteem includes the desire for self-respect, self-esteem, and for
the esteem of others, Maslow noted two versions of esteem needs, a lower one and a
21

higher one. The lower one is the need for the respect of others, the need for status,
fame, glory, recognition, attention, reputation, appreciation, dignity, even
dominance. The higher form involves the need for self-respect, including such
feelings as confidence, competence, achievement, mastery, independence, and
freedom (Lewis et al, 2000).
5. Self- actualization
The last level is a bit different. Maslow called it self-actualization or the being
needs. Self-actualization as Maslow uses the term refers to the kind of things we have
called higher motivations -- creativity, compassion, the appreciation of beauty, truth,
justice, and so on. Maslow once said that the being needs were the desire to "be all
that you can be!" (Lewis et al, 2000).
b) Theories of Motivation for eating/dining
The term motivation is used to describe a force that impels a person to behave in
particular ways, in terms of eating there are two types of motivational theory is shown
as follows:
1. Drive reduction theory (Bare, 1959) suggests that internal physiological
needs create motivational states called drives. This theory explains hunger in
terms of a deficit within the body.
2. Positive incentive theory suggests that we are drawn to eat in response to the
anticipated pleasure of food. External and internal stimuli can create
motivation, for example the thought or sight of attractive food can make us
feel hungry (Rolls & Rowe, 1982).
22

Drive Reduction Theory
According to drive reduction theory (Bare, 1959) food deprivation creates
a physiological state - the need for food
a psychological state - the drive for food -an unpleasant state – hunger
Operation of drive reduction theory:
Drive energizes behavior which is aimed at reducing the physiological need.
If this behavior results in eating, the hunger drive is reduced
Drive reduction (the reduction in an unpleasant state) is reinforcing
Behavior that leads to drive reduction will be reinforced
According to this theory, the hunger drive serves to maintain the body's energy
balance. In other words, hunger is due to deprivation, and the behavior is designed to
reduce deprivation (Bare & Cicala, 1960).
Positive Incentive Theory
According to positive incentive theory (Rolls & Rowe, 1982), we eat three
meals a day out of habit, or because of external stimulus such as the time of day, or
the sight and smell of food. In the absence of deprivation, eating can be elicited in
response to an external stimulus previously associated with food. This result is
consistent with the positive incentive theory and contradicts the drive reduction
theory.
Sensory-specific satiety (SSS) (Rolls & Rowe, 1982) everyone is aware of
their ability to eat more if the meal is composed of a variety of foods. For example,
23

we often consume a tasty pudding after a main course of meat and potatoes, even
though we could not eat any more meat and potatoes. Sensory-specific satiety (SSS)
refers to the decrease in the pleasantness and consumption of food after eating it to
satiety.
Much of the work in this area has been carried out by the Rolls at Oxford.
They find that it is not just the taste of food that influences SSS, color and shape also
influence consumption. Such as consumption of sandwiches was affected by the
variety of fillings:
More sandwiches were consumed when they were offered with 3 different
fillings.
More pasta was consumed when the plate contained a variety of pasta shapes.
c) Theories of Motivation for Dining out at Restaurant
A study of National Restaurant Association (1983) shows that there are 14
frequent reasons for customers to dining out, those fourteen factors are: (1) nobody
has to cook or clean up, (2) for a change of pace, (3) for a treat, (4) good way to
celebrate special occasions, (5) it’s convenient, (6) going out is a special occasion, (7)
for food not usually available at home, (8) it’s a good way to relax, (9) the whole
family enjoys themselves, (10) spouse requests to dine out, (11) to enjoy good food,
(12) it’s a good way to entertain guests, (13) restaurant prices are reasonable, and (14)
business requires it.
Moreover, According to Davis and Stone (1991), the motivation for restaurant
visitors is quite often a social event and the six motives on the top are as follows:
1. celebration of the something/somebody
2. Meeting friends (Guests seek friendly “Meeting, eating, and drinking places).
24

3. getting a break from normal routines
4. not having to cook at home
5. enjoying food and beverages not available at home
6. an innovation
Most of the motives above refer to restaurant’s role as a third place, which
practically means that the restaurant is seen as a non threat gathering spot outside of
the work and home some kind of neutral zone. These kind of informal places are
needed in order to put aside concerns of work and home and to relax and talk. Without
such place, people fail to maintain the kind of relationships and diversity of human
contact (Oldenburg, 1989).
For the tourists, the previous research of Beverley et al., (2003) in ‘restaurant
and the tourist market’ has investigated tourists’ motivations and reasons for eating
out when on holiday. Respondents rated the importance of six categories:
1. Indulgence (e.g. either fine dining or just the feeling of spoiling
yourself);
2. Relaxation and comfort (e.g. not having to cook yourself);
3. Experience (e.g. eating out is part of the overall holiday experience);
4. Social reason (e.g. the chance to mix and talk with friends and family);
5. Discovery (e.g. trying new exciting or different foods you would not
cook yourself);
6. Health (e.g. eating health food).
Indulgence
Indulgence can be describe as that makes it to visit a popular, trendy place; to
visit casinos and gamble; to experience the good life – fine cuisine, being pampered;
to experience city life (nightlife, shopping, museum)’(Michael, 2003).
25

Relaxation
An activity or situation makes that it possible for rest or enjoy oneself, such as
to rest, relax and recuperate; for intimacy and romance; to spend quality time with
family away form home (Michael, 2003).
Experience
It can be described as memorable events that engage customers in inherently
personal ways (Pine et al., 2000), occurs when a company (restaurant) intentionally
uses service (food service) as the stage, and goods (the food, the décor and
atmosphere) as props, to engage customers in a way that creates memorable event.
The meal experience emerges from a consumer’s interaction with a restaurant’s
physical surrounding, personnel and customer – related practices as well as food
(Kerin et al., 1992). A recipient, quoted in Sparks et al (2001), stated that “when you
go into a restaurant you go there for an experience, you don’t just go there for the
food. You go for the whole experience of enjoying the food, enjoying the restaurant,
the atmosphere, the service, and it’s so important”. The customers therefore are in
essence “buying “experiences (Pine et al., 1998), when they visit a restaurant.
Social reason
It can be a Socially Driven – Guests seek friendly “Meeting, eating, and
drinking places.” such as the chance to mix and talk with friends and family. These
usually include casual restaurants (Smith, 1988).
Discovery
26

Customer desires to have an opportunity to try something new, different and
exotic. Such as consumers become exposed to ethnic flavors and learn to enjoy them.
They want to discover more ethnic tastes and seek the flavor depth and variety. In
case of Thai restaurant that different spices provide in Thai cuisine. Spices are chosen
to offer variety, give balance in flavors and textures, and to provide the "hot-spicy"
food concept that is believed to create body wellness (Columbia Education, 1998).
Health
Health can be described as the general condition of body and mind.
Nowadays, people trend to more aware of their health and consumers seeking healthy
foods for either serious dietary or medical reasons, or just to live better. Many
vegetarians and vegans choose not to eat meat or animal products. Customers choose
to change their diet in this way for reasons of health. Such as many ethnic restaurants
provide the vegetarian options (e.g. Indian restaurant) and herb dish (e.g. Chinese
restaurants) (Moy, 1998).
2.1.2 Information Source(s)
Information source(s) can be defined as a single entity from which information
is retrieved, such as, a person, a book, a journal article, or an index (Minna, 2000).
Classification of Information Source(s):
1. Information Source(s) (Print Medium and Internet)
In terms of tourist, sometimes information is provided directly to them (either
for free or for a charge) but, at other times, it is distributed indirectly through the
printed medium, internet or tourists information providers (e.g. travel agent) and so on
27

(Nielsen, 2001).
a) Print Medium
In general, the term ‘print media’ is taken to mean newspapers, magazines,
brochures, guide book, journals, newsletters and direct mail (Nielsen, 2001).
Newspapers
Newspapers are a viable and good means of distribution with the advent of
improved postal services and deficient news-gathering methods (Carter, 1971).
In the travel industry, virtually every member uses newspapers. It represents
the dominant medium for travel principals – particularly for advertising. Potential
travelers have an understanding of this close relationship, and are conditioned to the
look to newspapers for travel information, such as weather transportation,
accommodation, restaurants and so on (Reilly, 1990).
Magazines
Magazines overcome some of the problems in newspapers, as a result of
increasing designer need of audiences. Color is clearer and more attractive in
magazine glossy form. They are more audience-specific, and generally have a longer
shelf-life. Readers of magazines are usually more affluent, which offers many
opportunities for advertising (Nielsen, 2001),such as a Tourists Magazine, it provide
information to tourist with all types of accommodation options, recommend
restaurants and the famous hot spots Reilly (1990).
Food guide
28

A food guide is an interactive restaurant guide that provides recommended
bars and restaurants and information about essential services. It contains both
quantitative information (including prices and number of tables) and qualitative
information (such as cuisine description). Tourists can review all restaurants and by
themselves according to food, service, price and design (www.thefreedictionary.com
last accessed on 22/08/05).
b) The Internet
The Internet can be defined as an electronic network of computers that
providing access to millions of resources worldwide and organizational computer
facilities around the world , similar to a global library with millions of books, records,
motives etc and open all day, every day of the year (www.tamu.edu last accessed on
22/08/05).
Indeed, the internet is an advertising medium of great power, more and more
restaurants are taking advantage of it. The web site can offer information about the
restaurant, location details, electronic coupon, frequent browser promotion, and an on-
line review of menu offerings.’ Providing a communications channel between a
restaurant and web surfers creates a pipeline for feedback (Powers, al et., 1999).
This type of information will naturally help tourists to plan tourist activities,
such as the planning of visiting a particular restaurant which have offered their dining
information on the internet (Murphy, 1996).
2. Information Source (s) (Restaurant Characteristics)
Information Source(s) from Restaurant Characteristics which customer can
directly see, read, and sound, smell, and touch from restaurant characteristics such as
29

attractive décor and atmosphere, display of menu in the window, evidence of wide
variety of the food on the menu, Restaurant looking busy etc as shown below:
Atmosphere
The atmosphere attribute includes restaurant’s appearance; temperature; staff
appearance, décor, and music etc. It is an important decision factor when people go
out to restaurants. Sight, sound, smell, and touch all combine to create the stage
setting for the dining experience (Marvin, 1992).
Today, Customers still desire decent service; the most important thing is
design and concept’. Ambience or a simple décor can be an enjoyable option and a
fun dinner for social people with a spirit of adventure and openness to new
experiences (Goldstein, 1998).
Specialty Food featured in the Menu
Customers particularly enjoy seeking out Specialty foods of a region.
Restaurant Chefs and Kitchen Managers work creativity as they discover specialty
foods and develop specialty menus. Specialty food menus aren’t limited to the
dinner menu, either. Consider appetizers, drinks or happy hour (which could include
drink and appetizer specials). Evidence of specialty food featured in the menu is a
wonderful way to keep customers' selections fresh and interesting (Marshall, 1995).
Display of Menu in the Window
The most obvious of display is the product itself. Restaurant would often
display the dishes of menu that they were selling in their shop window. Initially
attracting customers’ interest, as time passed the dish naturally deteriorated in
30

appearance. Therefore, putting the idea, anticipation, into the display of the menu in
the window, it can be a potential information source in the mind of the customer
which they want to seek to satisfy (Keith, 1996). For example, by placing colorful
ethnic food, fruit juices, fried chicken, dessert yoghurts and mineral waters in the
front of the restaurant window. In addition to the display of the dishes, the displaying
the skills of chefs should not ignore, part of the meal experience for the customer is an
opportunity and stimulate them to see professional staff doing a job well (Keith,
1996).
Menu variety
Wide variety of food choice should be an important element which customer
must have been considered whether eating for necessity or pleasure – as a part of the
daily grind or as a part of unique social occasion. Usually customers were encouraged
to try a greater range of menu items and consequently purchase more than intended.
Customer can have anything they want, as long as it is a burger: chicken burger, fish
burger, vegetarian burger (Keith, 1996). The menu itself needs to be produced in a
way that sends a particular message of variety items, not only the choice of food but
also the style, color and picture. All of evidence of a wide variety of food on the menu
will be the basis for customers' decision to purchase the food and drink. The menu
should be designed to entertain, menu language, a clear explanation and visible
pictures, particularly for the groups such as tourists and a business or social partners
(Fuller & Waller, 1995).
Looking busy
Many people/tourists make their choice of restaurant based on perceptions
31

they gain from actually seeing the restaurant. What tourist can directly see appears to
have the strongest influence on tourists’ restaurant choice (Keith, 1996). The results of
Beverley et al.’s ( 2003) has shown that the restaurant looking busy have highly
influence on their choice of restaurant when they are wandering around to seek out the
dining place. Most of them will likely be encouraged to go to the restaurant with the
appearance of being busy.
Related Theories of Information Source(s)
Information Search
Moutinho (1987) mentioned that information search begins when a consumer
perceives a need that might be satisfied by the purchase and consumption of a
product. Information search can be internal, external, or a combination. Internal
search is the mental activity of retrieving information that has been stored in long-
term memory and deals with products or services. External search seeks out new
information through a variety of avenues that may include market-oriented sources,
such as adverting, promotional material, and visit to stores, talk with salespeople.
Customers consult various sources prior in this way to making a purchase decision.
Information Search Behavior
Consumers search for external information before taking the initiative of
acquiring or using a service in order to compare the alternatives and make the best
decision. Therefore, to understand the influence of information source(s) in
consumers’ choice, it is necessary for understanding of the customers’ information
search behavior as shown below (Marta, 2001).
32

a) The application of ‘AIDA’ Model for Customer Information Search Behavior
Information source in influencing potential customer is most effectively
achieved by the principle of ‘AIDA’ (Getz & Sailor, 1993) stands for:
Attention: attracted to the particular tourism product (for example tourists may
pay attention to a magazines advertisement by a picture of colorful appearance
Thai Dong Yum soup).
Interest: maintaining interest in the advertisement (Thai Dong Yum soup)and
relevant image (hot and spicy taste);
Desire: influence potential buying patterns by initiating a drive to purchase the
tourism product ( Desire to try Thai Dong Yum soup )
Action: information to transform the potential customer (tourist) to an actual
Buyer (Such as: decided to go to the particular Thai restaurant by using the map or
directions which is provided in the magazine or using the phone number call them
directly).
From this Model, it is evident that information source(s) are an important
channel of communication for the service companies such as tourism firms (e.g.
hotels and restaurants). An appropriate information source(s) can given customer a
shorter decision-making paths and frequently, untested outcomes (Murphy, 1996).
b) ‘Passive’ and ‘Active’ information search model
According to Marta (2001) the potential customers can make information
search at two levels: a passive level and an active level.
The passive level implies that the individual goes into a state of increased
awareness, paying greater attention, for example, to the advertising placed by
restaurants (when choosing a restaurant, customer consider their advertising) or to the
33

conversations in their nearby surroundings that bring together experiences from
different restaurants.
The active level implies that the potential customer initiates an active
information search that involves greater effort than the passive level, for example by
visiting restaurants before choosing one, reading the door menu before choosing one,
etc. The existence of these two levels implies that not all potential customers are
prepared to carry out the same level of activity during the information search process.
2.1.3 Type of tourists
Type of tourists
The type of tourists will greatly determine their cultures and traditions which
in turn determine the food they will consume. What their expectations regarding this
food or service will be, as well as on their perceptions of the actual food and service
(Verma, 1999).
Asian Tourist
Tourist having origins in any of the original peoples of the Far East, Southeast
Asia, for example, Cambodia, China, India, Japan, Korea, Malaysia, Pakistan, the
Philippine Islands, Thailand, and Vietnam (http://wordnet.princeton.edu last accessed
on 30/09/05).
Western Tourist
Tourist lives in or comes from the western countries (http://wordnet.princeton.edu last
accessed on 30/09/05).
Western Country
34

Traditionally, western countries are the European biggies: France, Italy, the
UK, Spain and Portugal, the United States of America, Canada, Mexico and the South
American countries as well as Australia or New Zealand and the countries they
colonized (www.jref.com last accessed on 05/11/05).
The difference between Western and Asian eating habits
The way people eat in the West is very different from that of the East, to count
differences, cuisine by cuisine: forks versus chopsticks; small pieces of meat versus
large; tables versus mats; the presence or absence of table knives; the fact that all the
food is (or is not) served at the same time (Warde, 1996).
In the Western country people generally eat a lot of dairy products, fatty and
oily foods. They use too much cooking oil in preparing foods. Most of them prefer
heavy foods like pies and stews to stir fry or grilled food such as many foods in the
UK are boiled vegetables, over roasted-meat and cheesecake (Shane, 2005).
In Asia, people tend to like hot, pungent food and prefer to eat vegetables,
meat with rice. It may be fried rice containing onions, tofu, chilies, and pieces of
meat, vegetables, or anything available in the pantry, served with a spicy condiment.
However, the addition of these ingredients is not simply random. They are chosen and
added to create a balanced system of taste and texture (Warde, 2000).
2.2 Definition, Theories and Discussion of the Main Dependent Variables
In the past decade, ethnic foods have become widely available and
increasingly popular in Western food markets. Many consumers desire alternatives to
old food habits. The increase in diversity of populations within individual nations has
fueled consumer demand for more culturally diverse foods (Iqbal, 1996).
35

On Bharath et al (2004) study stated that the importance of the 15 given
characteristics when deciding to dine at an Indian restaurant. As the result the finding
show that the significant differences factors for customer eating at Indian restaurant
were taste of the food, personal preference, Appearance of the food, cultural
familiarity, aroma/smell, healthy alternative ( vegetarian choices), difficult to prepare
at home. Taken together, all of those significant factors which have been found at
ethnic restaurants can be defined as follows.
Taste of the food
Taste is a sensation that caused in the tongue by food, the same as sight, touch
and smell play important roles in one’s initial reaction to foods (Mckee, 1990). But
taste is ultimately what is important in a food product. Taste keeps on coming back (if
one likes the taste) or never tries the product again (dislike the taste), such as Thai,
Malaysian, Indian, possess the spicier and hotter flavor profiles. Consumers who want
to discover more ethnic tastes would become exposed to ethnic flavors and learn to
enjoy them (Susheela,1998).
Personal preference
Personal factors affecting perceived authenticity, according to Kuznesof et al.,
(1997) include “knowledge” and “experience” of the food. Such as some people
prefer to like hot, pungent food and have a higher tolerance for spicier food, since
they are accustomed to it (Dulen, 1999).
Appearance of the food
Appearance of the food is the nature of food as visual attributes. Before
36

selecting a food, a consumer evaluates the merits and source of the food. The
appearance of food, especially if it is unfamiliar to the customer, is therefore an
important factor in creating expectations with regard to the meal experience. It is
often said that one eats with ones eyes first. If the food looks good, we think it will
taste good, thus the appearance of a food product will determine one’s initial reaction
to the food – whether it may encourage or discourage an individual from purchasing
or selecting a food item (Mckee, 1990).
It is an important factor for consumers seeking ethnic entrees, and it is a part
of Thai, Caribbean and many ethnic cooking styles. Such as Thais "eat with their
eyes" before they enjoy the flavors. Colorful sculptured fruits, chilies and vegetables
sit on a backdrop of grilled chicken, fish, rice or noodles. In a Thai entree called
"steam boat," a boiling, flavored broth is placed in the center of the table with dishes
of sculptured vegetables and artfully presented seafood or meats for dipping
(Susheela, 1998).
Cultural familiarity
Culture familiarity is being familiar with knowledge, customs of a group of
people. For instance, in the study of Bharath et al (2004) stated that while respondents
go to the Indian restaurant for what they consider a cultural experience and probably
view the dining experience as an integral part of who they are. Their comments in the
open-ended questions reflect this: ‘I really like the element of cultural familiarity in
Indian restaurants’, ‘I really like the Indian atmosphere’, ‘availability of food
prepared in the style of my country’, ‘Nice people and feel at home’. These reflect a
cultural familiarity with reference not only to the food and its preparation, but also the
atmosphere of the restaurant. The comments of respondents of ‘other’ ethnic origin
37

mentioned that ‘it is interesting to me, since I am not a part of the culture’.
Healthy alternative
Healthy alternative can be describe as the chance to choose healthy options
between two or more possibilities, such as lower-fat items and fresh, natural,
unprocessed food (organic fruits, vegetables) — gained popularity when people began
to think more seriously about their physical well-being. Healthy alternative appeal is a
segment of customer interested, especially vegetarians (Fieldhouse, 1995).
Difficult to prepare at home
Difficult to cook at home, according to the National Restaurant Association’s
consumer study (Restaurant USA Magazine, 2000) reveals that ethnic restaurants do a
really good job of preparing authentic foods; mild, pleasant flavors and beautiful
presentations characterize of the food (such as Japanese cuisines – sushi and other
dish). Moreover, Customers believe that ethnic food as characterized hot and spicy
with unique flavors are difficult to prepare at home, such as the Thai food, Indian food
and Korean food, and to the lesser degree, Vietnamese and Chinese food.
Lots of variety
Lots of variety is number of range of different food option to select. In order to
be part of a new experience, the food types provided need to be different from those to
which consumers are accustomed, but at the same time must not be so foreign as to
discourage the customer from selecting a wide range of dishes available. Such as
Innovative and Trendy appeal is inherent in upscale Italian food, French food and
Spanish food. Those foods are perceived to be always changing as chefs invent new
38

dishes or modify traditional ones. They have a lot of variety – something for everyone
(Restaurant USA Magazine, 2000).
Authenticity of the food
Kuznesof et al (1997) stated that authenticity of the food related to the use,
recipe ingredients, methods of cooking, and means of serving or presenting the food,
which are unique to an area or population as well as the product attributes (product’s
name, its description, appearance, packaging, ingredient information etc).
The authenticity of the ethnic food can be described as the food consumed by
the population or inhabitants (natives) of a specific country, when they still had
traditional lifestyles. Stated differently, authentic food is the linkage to the traditions
and heritage or origins of a specific region and the people living there (Kuznesof et
al., 1997).
Moreover, combined with attitude about ethnic foods, the study Ethnic
Cuisines II, found that “internationalists” is one of the segment most involved with
ethnic food. Internationalists are people who seek out foreign experience. They are the
most likely to seek out authenticity (Restaurant USA Magazine, 2000). For instance,
the following suggestions are among those given for “internationalists” as Table 2.1:
Table 2.1 Suggestions of Internationalists Respondents:
39
A menu of unique tastes related to regions of the country producing the ethnic
food.
Sophisticated cultural cues in the décor and atmosphere.
Serves able to speak the language of the country producing the ethnic food.
Cues of authentic cooking.
Source: Ethnic Cuisine II, National Restaurant Association, USA 2000

2.3 The Relationship between Independent and dependent variables
a) Tourist Motivations for eating out
The previous research of Beverley et al, (2003) has shown that motivations
(indulgence, relaxation/comfort, experience, social reason, discovery and healthy) are
important factors influence the tourists’ preference of eating out at the restaurants.
Friendly, attentive service, flavorful food and a good atmosphere are just as critical to
the success of an ethnic restaurant. In terms of the motivation driver, today’s customer
desires a good overall restaurant experience. Therefore, ethnic restaurant is becoming
increase in popularity in many countries. They are perceived as good for formal or
social occasions, rich, indulgent foods and represents the “safe” core that appeals to
almost all customers (National Restaurant Association, USA, 2000)
Susheela (1998) provide and support that the growing of demands for
flavorful, healthful meals, but also want to indulge in tasty foods are encouraging
consumers to experiment with different varieties of herbs and spices ethnic food at
ethnic restaurant.
b) Information Source(s)
Internet and print media
No one questions the power of the newspaper, magazine, guidebook and
internet as a means of information dissemination. Stephen (2005) stated in his study
that tourists use information tool and it obviously influenced their preference of
restaurant at tourist destination. From the tourists’ perspective, guidebooks, magazine
and newspapers’ advertising ranked in below the internet and above only word of
mouth. The study indicated that Information source (e.g. printed media and internet)
40

was an effective tool for searching vacation destination restaurants (Stephen el at.,
2005). When eating out, tourists have to make decisions. Where to eat? What style of
restaurant? What type of cuisine? How will the meal be prepared? They may probably
search the information provided by restaurant, such as Japanese restaurant, Chinese
restaurant, Thai restaurant etc (Reynolds, 1993)
An empirical study of tourists’ use of restaurant WebPages noted that
approximately half (48%) tourists either agreed or strongly agreed with the statement
‘the internet is an effective way to search for a restaurant at home’; and 59% either
agreed of strongly agreed with the statement ‘the internet is an effective way to search
for a restaurant when on vacation’ (Stephen et al., 2005).
Restaurant Characteristics
Erik el at (2004) stated that Restaurant Characteristics have strongly
influenced in tourists eating out at restaurant, which are attractive décor and
atmosphere, display of menu in the window, evidence of wide variety of the food on
the menu, Restaurant looking busy. Such as: many Western tourists in Thailand tend
to order pat Thai (Thai fried noodles) or khao pat (fried rice) in Thai restaurants, when
they saw the menu displayed in the window (Erik el at., 2004).
2.4 Empirical Research Findings
Here we need to review the relationship between a restaurant and its
customers. Belk (1974) cite 5 elements as the customer’s decision – making factors:
physical environment (restaurant decoration and mood), social environment (to go
alone or in a group), sense of time (seasons, days, and nights), and situation (purchase
for whom), and presupposed conditions (expectation of disposable income or
purchase).
41

June & Smith (1987) analyze service attributes (such as price, service,
atmosphere, licensed liquor, and food quality) and situational effects (like intimate
dinner, birthday dinner, business lunch, family meal, or tourism) on customer
preferences for restaurant dining.
Jakasa (1997) regards the following motivation influence the customer eating
out at restaurants: a place to meet someone; hungry; for fun; for quick
meal/convenience; for enjoyment; a social occasion; because of business necessity;
family outing; for celebration (birthday or anniversary); new experience.
Beverley et al (2003) have investigated Restaurant and the tourist market by
using the 459 sample sizes. Respondents rated the importance of six categories:
Indulgence; relaxation and comfort; experience social reason; discovery; Health.
Atila and Fisen (2002) used regression analysis to investigate the factors that
effect of tourist selection of restaurant for eating out. The results revealed that there
were six factors are most considerable factors of tourists’ preference and satisfy with a
restaurant which is dining experience, value of money, food quality and hygiene,
healthy food choices, atmosphere and availability of local and interesting food.
A survey of Marta (2001) examines the customers’ motivation factors of their
external information search when they choosing a restaurant. The result referring two
information sources provide by the restaurant: information source provided through
adverting (such as adverting placed in the Magazine, internet or the windows of the
restaurant) and information provide by the establishment through their tangible
elements ( the decorations, sound, light, and the door menu ) will play a determining
or encourage role when customers selection of the restaurant.
Bharath (2004) used analysis of variance (ANOVA) on a sample size of 500
respondents to study: Restaurant characteristics and variance of food attributes. The
42

result show that the importance of various influence the respondents on dining out at
Indian restaurant which are Restaurant characteristics (authentic cuisine, menu variety
offered, value for money, atmosphere, reputation / word of mouth, cannot prepare at
home, vegetarian choices, availability of new items) and variance of food attributes
(taste of the food, spicy food, Cultural familiarity, appearance, aroma/ smell, personal
preference). The summary of the previous study show as follows - Table 2.2.
Table 2.2 Previous Studies
Author and Topic Statistics & Method Some finding
Author:
Beverley Sparks
Topic:
Restaurant and the
tourist market
Statistics:
Regression
Method :
Telephone Interview
questionnaire
The relaxation aspect, as the most
important reason for dining out.
Adverting in magazines, food
guide, and the display of a menu in
the window had the strongest
influence on tourist’s choice of
restaurant.
Author:
Jaksa
Topic: Restaurant
marketing:
selection and
segmentation in
Hong Kong
Statistics:
Regression
Method :
Self-administrative
Open - ended
questionnaire
Customers’ perceptions and their
preferences of choice variables,
varied considerably by restaurant
type, dining – out occasion.
Author:
Atila and Fisen
Statistics: Conjoint
Dining experience, value of
43

Topic:
Measurement of
tourist satisfaction
with restaurant
service: a segment–
based approach
Method:
:Self-administrative
Close- ended
questionnaire
money, food quality and hygiene,
healthy food choices, atmosphere
and availability of local and
interesting food. are the most
considerable factors of tourist
selection and satisfy with
restaurant
Author: Marta
Topic: What
information do
customer use when
choosing a restaurant
Statistics:
Multiple Regression
Method :
Self -administrative,
Close- ended
questionnaire
The advertising and the
information provide by
restaurants’ physical environment
will play a determining role when
potential customer make their
choice
Author: Bharath
Topic:
Perception of Indian
restaurant in
America
Statistics :
Factorial ANOVA R
Method :
Survey questionnaire
with open – ended
question
A movement towards trying out
new & exotic food, as well as hot,
spicy flavored cuisine with herbs
and offers many vegetarian
options.
From many previous empirical researches, it can be concluded that each
occasion has different important factors. The result showed that, Restaurant
characteristics, food attribute, information source, and customers’ motivation were the
most important considerations influencing customer eating out at restaurants
44

CHAPTER 3
RESEARCH FRAMEWORK
This chapter is divided into four sections consisting of theoretical framework,
conceptual framework, hypotheses, and operationalization of the independent and
dependent variables. The theoretical section includes the theories which have been
discussed in chapter II. This chapter also includes the conceptual framework that
shows the whole picture of the study on how foreign tourists’ motivation and
information source(s) influence their preference of eating out at ethnic restaurant.
Consequently, the research hypotheses regarding the conceptual framework determine
the relationship of each variable. Finally, this chapter covers the operationalization of
the independent and dependent variables.
3.1 Theoretical Framework:
A theoretical framework is a conceptual model of how one theorizes the
relationship among several factors that have been identified as important to the
problem. It discusses the relationship among the variables that are deemed to be
integral to the dynamics of the situation being investigated (Zikmund, 1997).
The theoretical framework includes the main literature presented in chapter II
which focus on tourists’ motivation for eating out and what information source(s)
which they typically rely when they are looking for a restaurant.
Since customer preference of a restaurant for eating out is affected by various
45

reasons, it is difficult for any restaurant to measure their best preference and identify
that how they the customers are being attracted to visit restaurant.
However, there are many researchers who have developed methods to
measure the important factors effecting customer visiting restaurants, and the one
which focus on tourists is the study of Beverle et al. (2003) which is based on the
proposition that tourists perceive restaurant as an important attribute of a tourist
destination. The findings of the study showed that the following factors are the most
significant factors effecting tourists’ preference for eating out in a restaurant:
Tourists’ motivations for eating out while on holiday
Indulgence
Relaxation and comfort
Experience
Social reason
Discovery
Health
Information source used in selecting restaurants
1. Influence of print media
Restaurant review in the region’s local newspaper;
Restaurant review in food guides;
Restaurant review in magazines;
Advertisement in newspapers, magazines or tourist food guides;
2. Influence of restaurant characteristics
The display of a menu in the window;
Evidence of a wide variety of food on the menu;
Evidence of specialty food featured in the menu;
46

The restaurant looking busy;
The restaurant having an attractive décor or atmosphere;
In this study, the research have modified from the research of Beverle et al.
(2003) and applied it to evaluate how it will turned out to be when focus on foreign
tourists particularly eating out at the Ethnic Restaurant in Bangkok.
3.2 Conceptual Framework:
A conceptual framework is any high-formalized representation of a theoretical
framework, which is usually designed through the use of symbols or other such
physical analogues (Zikmund, 1997).
Based on the theoretical framework of Beverle et al. (2003), in this section of
the study, the conceptual framework is discussed to identify the relationship among
tourist motivations for eating out, information source(s) used, type of tourists and
their preference for eating out at Ethnic Restaurant.
However, today, the internet has gained widespread acceptance as a
communications tool and information source to support informed tourist decision –
making (Stephen et al., 2005). According to Stephen et al. (2005) study, many tourists
use internet for restaurant searching before actually visiting the restaurant. The
majority having accessed internet for dining guide or checking out the websites of
restaurants recommended.
Therefore, in this study, the researcher has added the Internet and type of
tourists as the independent variables to investigate and focus on the occasion that
Foreign Free Independent Travelers selection of eating out at Ethnic Restaurant in
Bangkok. The framework is illustrated in figure 3.1 (overleaf).
Figure 3.1 Conceptual Framework
47

Source: Modified from Beverle, S. John, B. Stefanie, K. (2003). Restaurants and the
Tourist Market. International Journal of Contemporary Hospitality Management
Volume 15 Number 1 pp. 6-13.
3.3 Research Hypothesis
Foregoing on the literature review, in the section, the hypotheses were
established in order to test the relationship between each variable depicted in the
regarding to the conceptual framework. In this research, the hypotheses are divided
Tourists’ Motivations
For eating out
Indulgence
Relaxation and comfort
Experience
Discovery
Social reason
Health
Information Source (s) used in
Selecting of Restaurants
Print Medium
Internet
Restaurant characteristics
Type of Tourist
Asian tourist
Western tourist
Foreign tourists’
preference for eating out at
Ethnic Restaurant in
Bangkok
48

into 3 groups as shown below:
Group A: Foreign tourists’ Motivation Vs their Preference for eating out at
Ethnic Restaurant in Bangkok.
1. H1o: There is no relationship between foreign tourists’ motivations and their
preference for eating out at ethnic restaurant in Bangkok.
H1a: There is a relationship between foreign tourists’ motivations and their
preference for eating out at ethnic restaurant in Bangkok.
Group B: Information Source(s) Used Vs foreign tourists’ Preference for
eating out at Ethnic Restaurant in Bangkok.
2. H2o: There is no relationship between Information Source(s) (Print Media and
Internet) used and foreign tourists’ preference of eating out at ethnic restaurant in
Bangkok.
H2a: There is a relationship between Information Source(s) (Print Media and
Internet) used and foreign tourists’ preference of eating out at ethnic restaurant in
Bangkok.
3. H3o: There is no relationship between Information Source(s) (Restaurant
Characteristics) used and foreign tourists’ preference of eating out at ethnic
restaurant in Bangkok.
H3a: There is a relationship between Information Source(s) (Restaurant
Characteristics) used and foreign tourists’ preference of eating out at ethnic
restaurant in Bangkok.
Group C: Type of tourists Vs their Preference of eating out at Ethnic
Restaurant in Bangkok.
4. H4o: There is no difference in perception of preference for eating out at ethnic
restaurant in Bangkok between Western and Asian foreign tourists.
49

H4a: There is a difference in the perception for preference for eating out at ethnic
restaurant in Bangkok between Western and Asia foreign tourists.
Hypothesis 1 can test all the selected motivations there is a/on relationship with
foreign tourists’ preference for eating out at ethnic restaurant and to examine the level
of importance. Hypothesis 2 ~3 can examine the relationship whether or not
information source(s) used have influence on foreign tourists’ preference of eating out
at ethnic restaurant in Bangkok and to identify which information source(s) they
typically rely when they select ethnic restaurants. Hypothesis 4 can find out there is
a/on difference in perception of preference for eating out at ethnic restaurant between
Western an Asian foreign tourists.
3.4 Operationalization of the Independent and Dependent Variables:
Davis and Consenza (1993) stated that before operationalization take place,
concepts must be defined first. Concepts are abstract ideas generalized from particular
facts. Without concept, there can be no theory.
The operational definition specifics what must be done to measure the concept
under investigate. Once the variables of interest have been identified, a specific type
of scale must be selected. Table 3.1 and Table 3.2 describe the measure of each
variable.
Table 3.1 Independent Variables
Variable and conceptual
Definition
Operational Component Level of
Measuremen
t
Question
No.
Motivation
Indulgence
50

‘To experience the good
life – fine cuisine, being
pampered’.
have a good meal or just
the feeling of spoiling
yourself
Ordinal Scale Q1
Relaxation
An activity or situation
that makes it possible for
rest and enjoy oneself
Comfort of not having to
cook yourself
Ordinal Scale Q2
Experience
Memorable events that
engage customers in
inherently personal ways
Eating out is part of the
overall holiday experience
Ordinal Scale Q3
Social Reason
Guests seek friendly
“Meeting, eating, and
drinking places.”
The chance to mix and talk
with friends and family
Ordinal Scale Q4
Discovery
Customer desires to have
an opportunity to try
something new, different
and exotic.
Trying new/different foods
you would not cook
yourself
Ordinal Scale Q5
Health
The general condition of
body and mind
Eating healthy food Ordinal Scale Q6
Information Source (s)
Printed Medium -Restaurant review in the Ordinal Scale Q7
51

The term ‘print media’ is
taken to mean
newspapers,
magazines, brochures,
guide book etc.
newspaper
- Restaurant review in
food guides
- Restaurant review in
food magazines
-Advertisement in
newspaper, magazines or
food guides
Q8
Q9
Q10
Internet
An electronic network of
computers worldwide
Restaurant information
from Internet
Ordinal Scale Q11
Restaurant
Characteristics
Restaurant characteristics
which customer can
directly see, read, and
sound, smell, and touch.
-Display of menu in the
window
-Evidence of wide variety
of food on the menu
-Evidence of specialty
food featured in the menu
-The restaurant looking
busy
-The restaurant having an
attractive décor or
atmosphere
Ordinal Scale Q12
Q13
Q14
Q15
Q16
Type of Tourist
Asian tourist For example: Cambodia, Nominal Part III
52

Tourist having origins in
any of the original
peoples of the Far East,
Southeast Asia,
China, India, Pakistan, the
Philippine Islands,
Thailand, and Vietnam,
Japan, Korea, Malaysia
tourists.
Q6
Western Tourist
A tourist of a western
area especially the
Europe & US.
For example: Includes
North and South America
and Europe tourists as well
as Australia or New
Zealand.
Nominal Part III
Q6
Table 3.2 Dependent Variables
Variable and Definitions Operational Component Measurement Question
No.
Taste of the food
Sensation caused in the
tongue by food
I would like to taste the
ethnic food.
Ordinal Scale Q17
Personal preference
Personal factors affecting
perceived authenticity.
I have personal preference
for ethnic food
Ordinal Scale Q18
Appearance of the food:
The nature of food as
visual attributes
Appearance of ethnic food
attract me
Ordinal Scale Q19
Cultural familiarity
53

Being familiar with
knowledge, customs of a
group of people
I find culture familiarity by
choosing ethnic food
Ordinal Scale Q20
Healthy alternative
Chance to choose healthy
options between two or
more possibilities
Ethnic food provides
healthy alterative
Ordinal Scale Q21
Difficult to Prepare
difficult to cook Ethnic cuisine are difficult
to prepare by tourists
Ordinal Scale Q22
Lots of variety
Number of range of
different things
Ethnic cuisine provide lots
of variety-selecting for
everyone
Ordinal Scale Q23
Authenticity of the food
related to the use, recipe
ingredients, methods of
cooking, and means of
serving or presenting the
food as well as the product
attributes
- Sophisticated cultural
cues in the décor and
atmosphere are visible in
ethnic restaurant
- Servers able to speak the
language of producing the
ethnic cuisine
- Cues of authentic cooking
Ordinal Scale Q24
Q25
Q26
54

CHAPTER 4
RESEARCH METHODOLOGY
The researcher investigated Foreign Tourists’ Motivations and Information
Source(s) used effecting their preference for eating out at Ethnic Restaurant in
Bangkok. This chapter presents the methods and procedures used in this study, as
follows:(1) Methods of research used (2) Respondents and sampling procedures (3)
Research instruments/questionnaires (4) Data collection (5) Pretesting and (6)
Statistical Treatment of Data
4.1 Research Methods Used
The descriptive crosstabulation analysis was used in this research, it was the
transformation of raw data into a form that mad them easy to understand and interpret.
It was used to describe the characteristics of certain groups and to estimate the
proportion of people in a specified population who behave in a certain way. Moreover,
tests of the hypotheses were presented, as they were best fit for providing optimal
results that could met the research problem and objectives.
To accomplish the research objectives, survey was used in order to collect
primary data for this study. Zikmund (2003) stated that survey is the research
technique in which information is gathered from sample of people by use of
questionnaire; a method of data collection based on communication with a
representative sample of target population. The survey research allowed the researcher
to assess the accurate information quickly and in an inexpensive way
55

In this research, primary data was collected from questioning respondents to
secure the desired information with the use of questionnaires. The researcher
conducted the study by distributing the questionnaire to the respondents in which they
would indicate their opinion on 5 point scales, in order to obtain a representative
sample of the target population (Zikmund, 2003).
4.2 Respondents and Sampling Procedures
4.2.1 Respondents
Zikmund (2003) defined respondents as the persons who answer interview
questions or persons who provide answers to written question in self – administered
surveys.
Target population
Davis and Cosenza (1993) mentioned that a population is defined as the
complete set of units of analysis that are under investigation. The target population is
a specific group relevant to the research project. In this study, the research focuses
only the target population from foreign tourists who were going to have their meal at
the ethnic restaurant. A Quota sample was chosen by selecting a convenient sample of
foreign tourists who come from Asian and Western countries.
Determining Sampling Size
In order to determine the sample size, the researcher references the sample
size from many previous studies. Jakasa (1997) used 400 as the sample size in his
research on restaurant marketing: selection and segmentation in Hong Kong. The
research used 400 sample sizes. Atila and Fisen (2002) studied ‘measurement of
56

tourist satisfaction with restaurant service: a segment– based approach’, in which the
sample size was 500. Marta (2001) studied ‘What information do customers use when
choosing a restaurant’. This study used 450 as the sample size. Bharath (2004) studied
‘Perception of Indian restaurant in America’ in which the sample size was 500.
Bverley Sparks (2003) investigated ‘Restaurant and the tourist market’ using a sample
size of 459.
Therefore, the researcher has collected data from 400 respondents as sample
sizes.
4.2.2 Sampling Procedures
For this research, Non-probability sampling technique was used for selecting
samples. Zikmund (2003) mentioned that the probability of any particular member of
the population in a non-probability sampling being chosen is unknown, i.e. non-zero
probability. The researcher cannot use probability sampling because it was very
difficult to account the number of foreign tourists who have been to the ethnic
restaurants in Bangkok during their holiday. Therefore, the researcher used Non-
Probability Sampling Method.
The sample procedure of this study was designed according to the following
stages:
1. In the first stage, the researcher selected foreign tourists from 8 selected ethnic
restaurants which are located at Sukhumwit road and Centre World Plaza.
2. In the second stage, the researcher chose quota sampling method in the form of
non-probability sampling. The total sample size of 400 respondents was divided
into 2 groups equally as follows:
Asian Foreign Tourists: 200 respondents
57

Western Foreign Tourists: 200 respondents
3. In the third stage, the researcher used convenience sampling to select the
respondent randomly by choosing foreign tourists who have their meal at the
ethnic restaurant which are located at Sukhumwit road and Centre World Plaza.
Sampling plan
The way of distributing the questionnaires to respondents was face-to-face
communication. Foreign tourists coming and wandering around in front of ethnic
restaurants were asked whether they will have their meal at this ethnic restaurant.
Researcher also ensured that the respondents were tourists and not the residents before
giving questionnaire. It was used as a screening question by the researcher before the
distribution of the questionnaires. Some foreign tourists answered that they had only
taken a look but hadn’t decided to eat here. Such respondents were excluded from the
sample. Finally only the foreign tourists who had decided to enter the ethnic
restaurant were asked to complete the questionnaire. The questionnaires were handed
over to them before they went into restaurant. For the respondents who were hungry
and eager to enter the restaurant, it was natural that they took the questionnaire to the
table place. They were able to complete the questionnaire at their convenience, before
they have started their meal.
4.3 Research instruments/questionnaires
Zikmund (2003) mentioned that self-administrated questionnaire is a survey in
which the respondent takes the responsibility for reading and answering the questions.
The research used questionnaire to gather the information form the respondents. The
formation of questionnaire was conducted based on the theoretical framework and
58

previous study.
Therefore, questionnaire was used as the instrument to investigate the foreign
tourists’ Motivations and Information Source(s) used effecting their preference for
eating out at Ethnic Restaurant in Bangkok. In order to achieve the research
objectives, thus this questionnaire is divided into 3 parts as follows:
Part 1 Tourists’ Motivations for eating out while on holiday and Information
Source(s) used influence their selection of Restaurants in Bangkok.
This part consists of 16 questions and is divided into 2 different items: 1) 6
questions focus on tourists’ motivation for eating out while on holiday. 2) 10
questions focus on tourists’ information source(s) used influence their selection of
restaurants (5 questions on print media and internet, 5 questions on restaurant
characteristics). Likert scale is used to measure their opinions from the strongly agree
(5 marks) to strongly disagree (1 mark) that ranges from very positive to negative
toward the selection object. It also includes a set of instruction, which explains the
intention and gives the directions to the respondents to answer the questionnaire
properly.
Part 2 Factors that influence Foreign Tourists’ Preference for eating out at Ethnic
Restaurant
This part contains 10 questions, which are tourists’ opinions regarding to their
preference for eating out at Ethnic Restaurants. It also consists of a set of instruction,
which explains the intention and gives the directions to the respondents to answer the
questionnaire properly.
Part 3 Optional demographic contains 7 questions which the data relating to the
target population sample in terms of gender, age, education, occupation, Income per
month, nationality and preference cuisine.
59

4.4 Data collection:
There are two sources of data in this study, which are Primary data and
Secondary data.
Primary data
Primary data of this research were gathered by distributing 400 questionnaires
to foreign tourists who have their meal at 8 selected ethnic restaurants which
located at four side streets (Sois) of Sukhumvit Road and Centre World Plaza. The data
collection process listed as follows:
Step 1 (November 1 ~ 2, 2005)
To get the permission for distribute the questionnaire at ethnic restaurant
Initially, researcher designed to collect data at Sukhumvit Road. In order to get
the permission of questionnaire distribution, the researcher sent letters to 16 typical
ethnic restaurants which located at Sukhumvit Road area in Bangkok. As the result
only one restaurant (Chesa) allowed the researcher to distribute questionnaires at
there.
Step 2 Sukumvit Road: (November 3 ~12, 2005)
Reason to distribute the questionnaire at Soi 7, 20, 22, 24:
After getting the permission of questionnaire distribution at Chesa Swiss
Restaurant, the researcher found that there are some typical ethnic restaurants nearby
and it was possible to collect and hand out the questionnaires at those restaurants, so 5
ethnic restaurants were selected at those four side streets (Sois) of Sukhumwit Road.
60

1. Chesa Swiss Restaurant (November 3 ~ 4, 2005)
Address: 5 Sukhumvit Soi 20, opposite Windor Suites Hotel
Number of questionnaires distributed: 50
2. Bei Otto German Restaurant (November 5 ~ 6, 2005)
Address: 1 Sukhumvit Soi 20 (nearby Chesa Swiss Restaurant)
Number of questionnaires distributed: 50
3. New BUKHARA’S Indian Restaurant (November 7~8, 2005)
Address: Next to Soi 7 Sukhumvit Road
Number of questionnaires distributed: 50
4. Govinda Italian Vegetarian Restaurant (November 9 ~ 10, 2005)
Address: 5 – 6 Sukhumvit Soi 22
Number of questionnaires distributed: 50
5. Cosmopolitan French Restaurant (November 11 ~ 12 2005)
Address: 4-10 Sukhmvit Soi 24
Number of questionnaires distributed: 50
Step3 Centre World Plaza (November 13 ~ 15, 2005)
Reason to distribute the questionnaire at Centre World Plaza
Although the researcher have distributed 250 questionnaires at Sukhumvit area,
but most of the ethnic restaurant were opened around 11:00 am ~ 2:30 pm and 5:00
pm ~ 11: 00 pm. In the daytime there wasn’t much business. Most of guests would
visit restaurant after 6:00 pm. It wasn’t convenient for researcher to distribute
questionnaires after 9:00 pm. So the researcher went to Centre World Plaza in order to
complete data collecting quickly.
1. Fuji Japanese Restaurant (November 13, 2005)
61

Address: 7th Floor World Trade Center,
Number of questionnaires distributed: 50
2. Banana Beach Thai restaurant (November 14, 2005)
Address: 6th Floor World Trade Center,
Number of questionnaires distributed: 50
3. COCA (可口之家) Chinese restaurant (November 15, 2005)
Address: 6th Floor World Trade Center,
Number of questionnaires distributed: 50
Secondary data:
Secondary data include previous published research and statistical records
which were collected from several sources, including academic journals, articles, and
text books in library, statistical documents and Internet.
4.5 Pretesting
Zikmund (2003) stated that pretests are trial runs with a group of respondents
for the purpose of detecting problems in questionnaire instructions or design. In a
pretest, the research looks for evidence of ambiguous questions and respondent
misunderstanding, whether the questions mean that same thing to all respondents or
other considerations. Editing the questionnaires during the pretest stage can prove
very valuable. Therefore, this study is necessary to do the pretest, which is conducted
among respondents similar to those who will be used in the actual study.
The purpose of the pretest is to find out how well the respondents understand
the questionnaire. The problem found in pre-testing can be solved. Clark et al (2001)
62

mentioned that in order to conduct the pilot survey or pretest, the number of
respondents should be at least 25 samples. Therefore, the researcher examined this
questionnaire by trying out the questionnaire with 30 respondents. After pretesting the
questionnaire, some questions were reworded, some that do not provide adequate
information were eliminated and some that caused problems were revised.
The overall questionnaire was processed by SPSS program to find out the
value out the reliability. Thus, Cronbach’s Coefficient Alpha was computed to
measure the reliability for each the dimensions. The findings of the reliability of 30
respondents were shown in table 4.1:
Table 4.1 the Reliability of Research instruments
Variables Number of cases Number of items Alpha
Score
Tourist’ Motivations for eating out 30 6 .8124
Information source (s) used
(Print media and Internet) 30 5 .7366
(Restaurant Characteristics) 30 5 .8169
Selection of Ethnic Restaurant 30 12 .7696
Thus, in this pretest, the results were calculated by the Cronbach alpha scores
through the SPSS (Statistical Package for Social Science) program. The Alpha score
measured in the pilot test were between .7366 - .8169. Generally, scores above 0.60
were considered to be acceptable (Sekaran, 1992). Therefore, the questionnaire of this
study has adequate reliability to measure foreigner tourists’ selection of ethnic
63

restaurants as all alpha indices were more than .70.
4.6 Statistical Treatment of Data
Once the necessary data are collected, for this study the statistical package for
social science (SPSS) was used to interpret the data collected from the respondents.
Descriptive Crosstabulation Statistics:
For this study descriptive crosstabulation statistics summarizes data of
respondents’ demographic profile, dependent and independent variables. It was used
to describe each variable that is associated with the respondent data. The
summarization of data includes the calculation of the average, the frequency
distribution, and the percentage distribution etc (Zikmund, 2003).
Hypothesis Testing:
Setting up and testing hypotheses is an essential part of statistical inference.
Statistics will be used to do the hypotheses testing in order to measure the relationship
between independent and dependent variables based on the 5 point scale
Spearman’s Rank Correlation Test
In order to examine the Hypothesis (No.1~3), the researcher wishes to
determine the agreement, or correlation between the two groups with Ordinal data
and Random sampling which will be taken from large population. Spearman
Correlation Coefficient can be computed to accomplish this purpose.
It is computed based on the two sets of scores. If two variables are highly
64
related, a correlation coefficient near + 1 (or) – 1 will be obtained; if two variables are
bit related, a coefficient near .00 will be obtained. The coefficients reveal the
importance and direction of relationship. It tells us whether large values on one
variable are associated with large values on the other. When the values correspond
this way, the two variables have a positive relationship. Positive correlation indicates
that both variables increase or decrease together, whereas negative correlation
indicates that as one variable increases, so the other decreases, and vice versa. As one
increases, the other also increases (Zikmund, 2003).
Mann-Whitney U Test
For Hypothesis No.4, Mann-Whitney U Test will be used to determine if there
is a significant difference between the mean score of Asian and Western Foreign
Tourists. Donald and Pamela (2001) stated that this test is used with two independent
samples if the data are at least ordinal; it is an alternative to the t-test without the
latter’s limiting assumptions. When the larger of the two samples is 20 or less, there
are special tables for interpreting U; when the larger sample exceeds 20 a normal
curve approximation is used.
Where n1 and n2 are the two sample sizes and R1 is the sum of the ranks in sample 1
Mann-Whitney U Test is used to test ordinal scaled dependent variable with the
different two independent groups. The statistical method used for this research is
presented in Table 4.2
Table 4.2 Statistical Method Used for Data Analysis
Number Hypothesis Statement Statistical Test
65

H1o There is no relationship between foreign
tourists’ motivations and their preference for
eating out at ethnic restaurant in Bangkok.
Spearman
Correlation Test
H1a There is a relationship between foreign
tourists’ motivations and their preference for
eating out at ethnic restaurant in Bangkok.
Spearman
Correlation Test
H2o: There is no relationship between
Information Source(s) (Print Media and
Internet) used and foreign tourists’ preference of
eating out at ethnic restaurant in Bangkok.
Spearman
Correlation Test
H2a: There is a relationship between Information
Source(s) (Print Media and Internet) used and
foreign tourists’ preference of eating out at
ethnic restaurant in Bangkok.
Spearman
Correlation Test
H3o: There is no relationship between
Information Source(s) (Restaurant
Characteristics) used and foreign tourists’
preference of eating out at ethnic restaurant in
Bangkok.
Spearman
Correlation Test
H3a: There is a relationship between Information
Source(s) (Restaurant Characteristics) used and
foreign tourists’ preference of eating out at
ethnic restaurant in Bangkok.
Spearman
Correlation Test
H4o: There is no difference in perception of
preference for eating out at ethnic restaurant in
Mann-Whitney U
66

Bangkok between Western and Asian foreign
tourists.
Test
H4a There is a difference in perception of
preference for eating out at ethnic restaurant in
Bangkok between Western and Asian foreign
tourists.
Mann-Whitney U
Test
67

CHAPTER 5
PRESENTATION AND CRITICAL DISCUSSION OF RESULTS
This chapter presents the results from data analysis and interpretation of all
gathered data. This chapter includes two sections. Firstly, descriptive crosstabulation
statistics summarizes data of respondents’ demographic profile, dependent and
independent variables. Secondly, inferential statistic includes the procedures and
results from hypothesis testing.
5.1 Descriptive Crosstabulation Analysis
In this section, to summarize the research result, descriptive crosstabulation
statistics has been used to explain the respondent characteristics. The data
interpretation is divided into two parts
Crosstabulation analysis of respondents’ demographic characteristics:
nationality Vs respondent’s gender, age, education level, occupation,
monthly income level and food preference.
Crosstabulation analysis of respondents’ motivations, information source(s)
and their preference for eating out at Ethnic Restaurant
68

5.1.1 Crosstabulation Analysis of Respondents’ Demographic Characteristics
1. Respondents’ Gender
Table 5.1 Gender
Gender * Nationality Crosstabulation
112 73 18556.0% 36.5% 46.3%
88 127 21544.0% 63.5% 53.8%
200 200 400100.0% 100.0% 100.0%
Count% within NationalityCount% within NationalityCount% within Nationality
Female
Male
Gender
Total
Asian CountryWesternCountry
Nationality
Total
From the table 5.1, majority of the respondents were male (53.8%), the rest of
the respondents were female (46.3%). For Asian tourists, the male respondents were
44.0% and females amount to 56.0%. For Western tourists, the male respondents were
63.5% and females were 36.5%, respectively.
Figure 5.1 Graphical representation of Respondents’ Gender
A
W
Female Male
Gender
0
20
40
60
80
100
120
140
Count
Nationality A - Asian Country
W - Western Country
Bar Chart
69

2. Respondents’ Age
Table 5.2 Age
Age * Nationality Crosstabulation
8 5 134.0% 2.5% 3.3%
78 35 11339.0% 17.5% 28.3%
65 58 12332.5% 29.0% 30.8%
25 65 9012.5% 32.5% 22.5%
24 37 6112.0% 18.5% 15.3%
200 200 400100.0% 100.0% 100.0%
Count% within NationalityCount% within NationalityCount% within NationalityCount% within NationalityCount% within NationalityCount% within Nationality
under 20 years old
20~29 years old
30~39 years old
40~49 years old
aove 50 years old
Age
Total
Asian CountryWesternCountry
Nationality
Total
Age of respondents in this study was divided into 5 groups, table 5.2 shows
that the highest percentage of respondents was in the age range of between
30~39years old (30.8%), followed by the age range of between 20~29 years old
(28.3%), 40~49 years old (22.5%), and above 50 years old (15.3%), under 20 years
old (3.3%), respectively.
Moreover, most of the Asian respondents are in the age range between 20-29 years old
(39.0%), 30~39 years old (32.5%), 40~49 years old (12.5%) and above 50 years old (12.0 %),
under 20 years old (4.0%) respectively. On the contrary, most of Western respondents are in the
age range of between 40~49 years old (32.5%), 30~39 years old (29.0%), above 50 years old
(18.5%), 20~29 years old (17.5%) and lastly under 20 years old (2.5%), respectively.
70

Figure 5.2 Graphical representation of Respondents’ Age
3. Respondents’ Educational Level
Table 5.3 Education Level
Education Level * Nationality Crosstabulation
16 6 228.0% 3.0% 5.5%134 99 233
67.0% 49.5% 58.3%39 70 109
19.5% 35.0% 27.3%11 25 36
5.5% 12.5% 9.0%200 200 400
100.0% 100.0% 100.0%
Count% within NationalityCount% within NationalityCount% within NationalityCount% within NationalityCount% within Nationality
certificate/diploma
bachelor's degree
master's degree
higher thanmaster's degree
EducationLevel
Total
Asian CountryWesternCountry
Nationality
Total
Table 5.3 shows that highest education level of all respondents was Bachelor’s
degree (58.3%), the rest of the respondents hold master’s degree (27.3%) or higher
than master’s degree (9.0%) and certificate/diploma (5.5%), respectively.
A W
under 20 years old
20~29 years old
30~39 years old
40~49 years old
aove 50 years old
Age
0
20
40
60
80
Count
Nationality
A - Asian Country
W - Western Country
Bar Chart
71

For Asian respondents, the highest education level of respondents is
Bachelor’s degree (67.0%), followed by Master’s degree (19.5%), certificate/diploma
(8.0%) and higher than master’s degree (5.5%), respectively. For Western
respondents, the highest education level is Bachelor’s degree (49.5%), Master’s
degree (35.0%), higher than Master’s degree (12.5%) and certificate/diploma (3%),
respectively.
Figure 5.3 Graphical representation of Respondents’ Educational level
4. Respondents’ Occupation
Table 5.4 Occupation
A W
certificate/diplomabachelor's degree
master's degree higher than master's degree
Education Level
0
20
40
60
80
100
120
140
Count
Nationality
A - Asian Country
W - Western Country
Bar Chart
72

Occupation * Nationality Crosstabulation
7 12 193.5% 6.0% 4.8%
18 25 439.0% 12.5% 10.8%119 86 205
59.5% 43.0% 51.3%27 32 59
13.5% 16.0% 14.8%15 24 39
7.5% 12.0% 9.8%14 21 35
7.0% 10.5% 8.8%200 200 400
100.0% 100.0% 100.0%
Count% within NationalityCount% within NationalityCount% within NationalityCount% within NationalityCount% within NationalityCount% within NationalityCount% within Nationality
government officer
emplyer/manager
company employee
owning business
professional
others
Occupation
Total
Asian CountryWesternCountry
Nationality
Total
Table 5.4 shows respondent’s occupation and percentage. The largest group of
respondents is company employee (51.3%), follow by owning business (14.8%),
employer/manager (10.8%), professional (9.8%), others (8.8%) and government
officer (4.8%).
Among Asian tourists, 59.5% were company employee, 13.5% had their own
business, 9.0% were employer/manager, 7.5 % were professional, 7.0% were others
and 3.5% were government officer, respectively. For Western tourists, 43.0% were
company employee, 16.0% had their own business, and 12.5% were
employer/manager, 12.0% were professional, 10.5% were others and 6.0% were
government officer, respectively.
Figure 5.4 Graphical representation of Respondents’ Occupation
73

4. Respondents’ Monthly Personal Income
Table 5.5 Monthly Personal Income (US $)
Monthly Personal Income * Nationality Crosstabulation
15 17 327.5% 8.5% 8.0%
89 5 9444.5% 2.5% 23.5%
54 21 7527.0% 10.5% 18.8%
42 157 19921.0% 78.5% 49.8%
200 200 400100.0% 100.0% 100.0%
Count% within NationalityCount% within NationalityCount% within NationalityCount% within NationalityCount% within Nationality
less than $200
$201~$500
$501~$1000
more than $1000
MonthlyPersonalIncome
Total
Asian CountryWesternCountry
Nationality
Total
Table 5.5 shows that the largest group of respondents comes under the
A W
government officeremplyer/manager
company employeeowning business
professional others
Occupation
0
20
40
60
80
100
120
Count
NationalityA - Asian CountryW - Western Country
Bar Chart
74
category of income more than $1000 (49.8%). The rest of all respondents’ monthly
income ranged between $201~$500(23.5%), $501~$1000 (18.8%) and less than $200
(8%), respectively.
Among Asian respondents, 44.5% of the respondents had the monthly
personal income of $201~$500, 27.0% had $501~$1000, and 21.0% had more than
$1000. Only 7.5% had less than $200. On the contrary, 78.5% of Western respondents
had the monthly income rang more than $1000, 10.5% had $501~$1000, 8.5% had
less than $200. Only 2.5% of them had $201~$500.
Figure 5.5 Graphical representation of Respondents’ Monthly Personal Income
6. Respondents’ Food Preference
Table 5.6 Food Preference
A W
less than $200 $201~$500 $501~$1000 more than $1000
Monthly Personal Income
0
50
100
150
Count
NationalityA - Asian CountryW - Western Country
Bar Chart
75

Food Preference * Nationality Crosstabulation
103 73 17651.5% 36.5% 44.0%
26 7 3313.0% 3.5% 8.3%
21 31 5210.5% 15.5% 13.0%
18 40 589.0% 20.0% 14.5%
15 19 347.5% 9.5% 8.5%
7 16 233.5% 8.0% 5.8%
5 10 152.5% 5.0% 3.8%
5 4 92.5% 2.0% 2.3%200 200 400
100.0% 100.0% 100.0%
Count% within NationalityCount% within NationalityCount% within NationalityCount% within NationalityCount% within NationalityCount% within NationalityCount% within NationalityCount% within NationalityCount% within Nationality
Thai
Japanese
Chinese
Indian
Italian
Mexican
French
others
FoodPreference
Total
Asian CountryWesternCountry
Nationality
Total
Table 5.6 shows that that the majority of the respondents regarded Thai food
as the most preferred (44.0%) ethnic food in Bangkok, followed by Indian food
(14.5%), Chinese food (13.0%), Italian food (8.5%), Japanese food (8.3 %), Mexican
food (5.8%), French food (3.8%) and others (2.3 %).
Among the Asian respondents, the majority of them regarded Thai food as
their most preferred (51.5%) ethnic food in Bangkok, then, Japanese food (13.0%),
Chinese food (10.50%), Indian food (9.0%), Italian food (7.5%), Mexican food
(3.5%), French food (2.5%) and others (2.5%). Interestingly, researcher found that
Asian tourists prefer to eat Japanese food which has acceptable taste, health with low
fat but also the atmosphere and nice décor (such as Fuji restaurant surround with
bamboo). In contrast, for the Western respondents, the majority of respondents’ food
preferences are Thai food (36.5%), Indian food (20.0%), Chinese food (15.5%),
Italian food (9.5%), Mexican food (8.0%), French food (5.0%), and Japanese food
(3.5%) and others (2.0%). Some of the Western respondents stated that they prefer to
eat Thai food rather than other ethnic food in Bangkok because it is cooked quickly –
76

the ingredients retain freshness, nutrients and low fat. For Indian food, they
appreciated for the exotic taste and nutrients of food as well as vegetarian options.
They may also feel that the taste my not be quite as they want it, but is an acceptable
substitute. Some of the respondent indicated some Chinese restaurant’s menu have
high price. They preferred to eat Chinese food is not only enjoyed for the taste, but
more appreciated for its medicinal values, so Chinese food is still one of the important
choice for foreign tourists in Bangkok.
Figure 5.6 Graphical representation of Respondents’ Food Preference
5.1.2 Crosstabulation Analysis of dependent and independent vaiables
1. Respondents’ motivations for eating out while on holiday
A
W
Thai Japanese
ChineseIndian
ItalianMexican
Frenchothers
Food Preference
0
20
40
60
80
100
120
Count
Nationality
A - Asian Country
W - Western Country
Bar Chart
77

Indulgence
Table 5.7 Respondents’ perception of Indulgence
Indulgence * Nationality Crosstabulation
12 0 126.0% .0% 3.0%
56 32 8828.0% 16.0% 22.0%
89 56 14544.5% 28.0% 36.3%
43 112 15521.5% 56.0% 38.8%
200 200 400100.0% 100.0% 100.0%
Count% within NationalityCount% within NationalityCount% within NationalityCount% within NationalityCount% within Nationality
disagree
neutral
agree
strongly agree
Indulgence
Total
Asian CountryWesternCountry
Nationality
Total
Table 5.7 shows that a total of 75.1% (36.3%+38.8%) of the respondents
agreed or strongly agreed that indulgence was an important motivation for eating out
when on holiday, followed by “neutral” (22.0%). Only 3.0% the respondents disagree
that.
For the Asian respondents, 44.5% of them agreed that indulgence was
important for eating out, and 28.0% of the respondents kept neutral. Approximately
21.5% of the respondents strongly agreed to it. Only 6.0% of the respondents held
negative opinion. In contrast, for Western respondent, 56.0% of strongly agreed that
indulgence was important for eating out when on holiday, followed by ‘agree’
(28.0%) and ‘neutral’ (16.0%). Nobody showed negative opinions. It’s obvious that
the most of Western respondents more like to take ‘indulgence’ into consideration
than Asian respondents when eating out on holiday.
Relaxation
Table 5.8 Respondents’ Perception of Relaxation
78

Relaxation * Nationality Crosstabulation
9 0 94.5% .0% 2.3%
31 8 3915.5% 4.0% 9.8%
102 88 19051.0% 44.0% 47.5%
58 104 16229.0% 52.0% 40.5%
200 200 400100.0% 100.0% 100.0%
Count% within NationalityCount% within NationalityCount% within NationalityCount% within NationalityCount% within Nationality
disagree
neutral
agree
strongly agree
Relaxation
Total
Asian CountryWesternCountry
Nationality
Total
Table 5.8 shows that a total of 88% (40.5+47.5%) of the respondents agreed or
strongly agreed that relaxation was an important motivation for eating out when on
holiday. A total of 9.8% of respondents remained neutral. Only 2.3% of respondents
held negative opinion.
For Asian respondents, 51.0% of the respondents agreed that relaxation was an
important motivation for eating out, followed by ‘strongly agree’ (29.0%), ‘neutral’
(15.5%). Only 4.5% of respondents held negative opinion. In contrast, 52.0% of the
Western respondents strongly agreed that relaxation was very important for them,
when they eating out they would consider restaurant as the place to relax, and 44% of
the respondents agreed to it. Only 4.0% the respondents remained neutral opinion and
nobody showed negative opinions. It’s obvious that the majority of respondents
regarded that restaurants were the best place for eating and take rest after shopping or
sightsee.
Experience
Table 5.9 Respondents’ Perception of Experience
79

Experience * Nationality Crosstabulation
2 1 31.0% .5% .8%
10 0 105.0% .0% 2.5%
26 16 4213.0% 8.0% 10.5%
97 103 20048.5% 51.5% 50.0%
65 80 14532.5% 40.0% 36.3%
200 200 400100.0% 100.0% 100.0%
Count% within NationalityCount% within NationalityCount% within NationalityCount% within NationalityCount% within NationalityCount% within Nationality
strongly disagree
disagree
neutral
agree
strongly agree
Experience
Total
Asian CountryWesternCountry
Nationality
Total
Table 5.9 shows that a total of 86.3% (36.3+50.0%) of the respondents agreed
or strongly agreed that experience was an important motivation for eating out when
on holiday. Approximately 10.5% of respondents remained neutral. Only 3.3%
(2.5+0.8%) of the respondents held negative opinion.
For Asian respondents, the most of respondents’ perception towards
experience was agreed (48.5%), followed by ‘strongly agree’ (32.5%) and ‘neutral’
(13.0%). Only 6.0% (1.0+5.0%) of respondents held negative opinion. Similarly, for
Western respondents, the majority of respondents’ perception towards experience was
agreed (51.5%), followed by ‘strongly agree’ (40.0%) and “neutral” (8.0%). Only 1
respondent held negative opinion.
Discovery
Table 5.10 shows that a total of 88.5% (50.5+38.0%) of the respondents
agreed or strongly agreed that discovery was an important motivation for eating out
when on holiday. Approximately 8.8% of respondents remained neutral. Only 2.8%
(2.0+0.8%) of the respondents held negative opinion.
Table 5.10 Respondents’ perception of Discovery
80

Discovery * Nationality Crosstabulation
2 1 31.0% .5% .8%
4 4 82.0% 2.0% 2.0%
20 15 3510.0% 7.5% 8.8%
81 71 15240.5% 35.5% 38.0%
93 109 20246.5% 54.5% 50.5%
200 200 400100.0% 100.0% 100.0%
Count% within NationalityCount% within NationalityCount% within NationalityCount% within NationalityCount% within NationalityCount% within Nationality
strongly disagree
disagree
neutral
agree
strongly agree
Discovery
Total
Asian CountryWesternCountry
Nationality
Total
For the Asian respondents, most of respondents’ perception towards discovery
was strongly agreed (46.5%), followed by ‘agree’ (40.5%) and ‘neutral’ (10.0%).
Only 3.0% (2.0+1.0%) of respondents held negative opinion. Similarly, for Western
respondents, the majority of respondents’ perception towards discovery was strongly
agreed (54.5%), followed by ‘agree’ (35.5%) and “neutral” (8.8%). Only 2.5%
(2.0+0.5%) of the respondents held negative opinion.
Social Reason
Table 5.11 Respondents’ perception of Social Reason for Eating Out
Social Reason * Nationality Crosstabulation
0 14 14.0% 7.0% 3.5%
5 38 432.5% 19.0% 10.8%
36 70 10618.0% 35.0% 26.5%
81 52 13340.5% 26.0% 33.3%
78 26 10439.0% 13.0% 26.0%
200 200 400100.0% 100.0% 100.0%
Count% within NationalityCount% within NationalityCount% within NationalityCount% within NationalityCount% within NationalityCount% within Nationality
strongly disagree
disagree
neutral
agree
strongly agree
SocialReason
Total
Asian CountryWesternCountry
Nationality
Total
Table 5.11 shows that a total of 59.3% (26.0+33.3%) of the respondents
agreed or strongly agreed that social reason was an important motivation for eating
out when on holiday. A total of 26.5% of respondents remained neutral and 14.3%
(10.8+3.5%) of the respondents held negative opinion.
81

For the Asian respondents, most of respondents’ perception towards social
reason was agreed (40.5%), followed by ‘strongly agree’ (39.0%) and ‘neutral’
(18.0%). Only 2.5% of respondents held negative opinion. Interestingly, for Western
respondents, most of respondents’ perception towards social reason is ‘neutral’
(35.0%), followed by ‘agree’ (26.0%), “strongly agree” (13.0%). A total of 26%
(19.0+7.0%) of the respondents held negative opinion. Some of Western respondents
stated that eating out when on holiday is an opportunity to spend their own time, so
they didn’t think that it’s a chance to mix and talk with friends and family.
Healthy Food
Table 5.12 Respondents’ perception of Healthy Food
Healthy Food * Nationality Crosstabulation
3 5 81.5% 2.5% 2.0%
11 23 345.5% 11.5% 8.5%
41 27 6820.5% 13.5% 17.0%
98 87 18549.0% 43.5% 46.3%
47 58 10523.5% 29.0% 26.3%
200 200 400100.0% 100.0% 100.0%
Count% within NationalityCount% within NationalityCount% within NationalityCount% within NationalityCount% within NationalityCount% within Nationality
strongly disagree
disagree
neutral
agree
strongly agree
HealthyFood
Total
Asian CountryWesternCountry
Nationality
Total
Table 5.12 shows that a total of 72.6% (26.3+46.3%) of the respondents
agreed or strongly agreed that eating healthy food was an important motivation for
eating out when on holiday. A total of 17.0% of respondents remained neutral and
10.5% (8.5+2.0%) of the respondents held the negative opinions.
A total of 72.5% (49.0+23.5%).of the Asian respondents agreed or strongly
agreed that eating healthy food when on holiday was important for eating out, and
82

20.5% of the respondents kept neutral. Only 7.0% (5.5+1.5%) of respondents held
negative opinion. For Western respondents, 72.5% (29.0+43.5%) of the respondents
strongly agreed or agreed that eating healthy food when on holiday was important for
eating out, and 13.5% of the respondents kept neutral. A total of 14.0% (11.5 +2.5%)
of respondents held negative opinion. Although most of the Western respondent
regarded healthy food as a important factor, but some of them stated that if the food
was clean and fresh, they didn’t care so much about whether the food was healthy or
not.
Foreign tourist perceptions of importance of motivation factors
Table 5.13 Means of Motivations for Eating Out
Descriptive Statistics
400 2.00 5.00 4.1075 .84719400 2.00 5.00 4.2625 .72450400 1.00 5.00 4.1850 .77607400 1.00 5.00 4.3550 .78455400 1.00 5.00 3.6750 1.08041400 1.00 5.00 3.8625 .96744400
IndulgenceRelaxationExperienceDiscoverySocial ReasonHealthy FoodValid N (listwise)
N Minimum Maximum Mean Std. Deviation
Table 5.13 shows that 400 respondents’ perceptions about selected
motivations for eating out, which factors are more important for them while on
holiday. It’s obvious that discovery which is trying new, exciting and different food
was clearly the most important motivation for eating out when on holiday (mean =
4.3550), then, relaxation, experience and indulgence were perceived as similarly
important motivations (mean = 4.2625, 4.1850 and 4.1075 respectively). Notably,
most of the respondents reported that eating healthy food was a very important
consideration for eating out when on holiday. Finally, an interesting difference was
expressed in respondents’ perception of social reason as shown in table 5.11.
83

2. Information Source(s) used for eating out at Restaurant when on holiday
2.1 Information Source(s) – Print Media and Internet
Restaurant review in the Newspaper
Table 5.14 Restaurant Review in the Newspaper
Review - Newspaper * Nationality Crosstabulation
28 24 5214.0% 12.0% 13.0%
63 93 15631.5% 46.5% 39.0%
53 49 10226.5% 24.5% 25.5%
43 26 6921.5% 13.0% 17.3%
13 8 216.5% 4.0% 5.3%200 200 400
100.0% 100.0% 100.0%
Count% within NationalityCount% within NationalityCount% within NationalityCount% within NationalityCount% within NationalityCount% within Nationality
strongly disagree
disagree
neutral
agree
strongly agree
Review - Newspaper
Total
Asian CountryWesternCountry
Nationality
Total
Table 5.14 shows of majority of 52.0% (39.0+13.0%) of all respondents
disagreed or strongly disagreed that they were under influenced by restaurant reviews
in the newspaper. A total of 25.5% of respondents remained neutral. Only 22.6%
(17.3+5.3%) of the respondents reported themselves as being influenced by restaurant
review in the newspaper. Finally, the results obtained in table 5.14 indicated that
Asian and Western respondents have similar opinions in perception of restaurant
review in the newspaper.
Restaurant review in Food Guide
Table 5.15 shows that majority of 52.1% (19.3+32.8%) of all respondents
reported that they searched for restaurant information and were influenced by
restaurant review in food guide when on holiday. A total of 28.8% of respondents
remained neutral. Only 19.3% (13.8+5.5%) of the respondents reported that they do
84
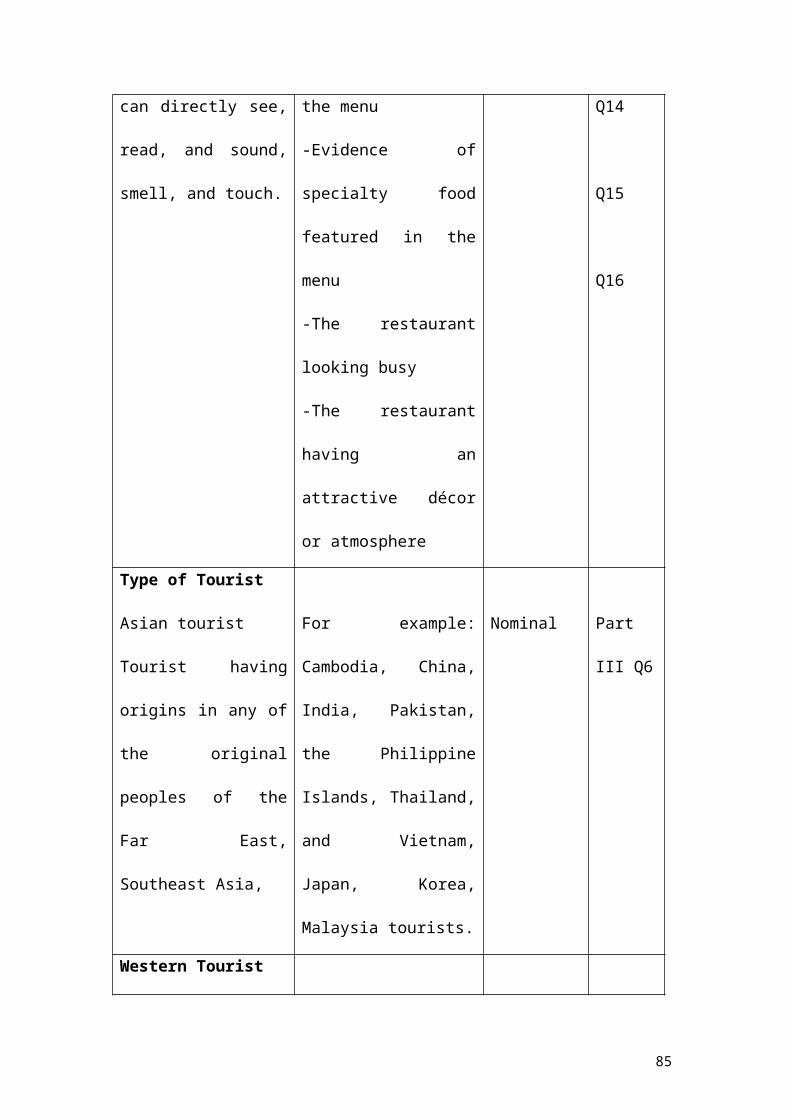
not use food guide when on holiday. Finally, the results obtained in table 5.15
indicated that Asian and Western respondents have similar opinions in perception of
restaurant review in the food guide.
Table 5.15 Restaurant Review in Food Guide
Review - Food guides * Nationality Crosstabulation
12 10 226.0% 5.0% 5.5%
28 27 5514.0% 13.5% 13.8%
68 47 11534.0% 23.5% 28.8%
55 76 13127.5% 38.0% 32.8%
37 40 7718.5% 20.0% 19.3%
200 200 400100.0% 100.0% 100.0%
Count% within NationalityCount% within NationalityCount% within NationalityCount% within NationalityCount% within NationalityCount% within Nationality
strongly disagree
disagree
neutral
agree
strongly agree
Review- Foodguides
Total
Asian CountryWesternCountry
Nationality
Total
Restaurant review in Magazines
Table 5.16 Restaurant Review in Magazines
Review - Magazines * Nationality Crosstabulation
11 14 255.5% 7.0% 6.3%
20 33 5310.0% 16.5% 13.3%
94 81 17547.0% 40.5% 43.8%
48 55 10324.0% 27.5% 25.8%
27 17 4413.5% 8.5% 11.0%
200 200 400100.0% 100.0% 100.0%
Count% within NationalityCount% within NationalityCount% within NationalityCount% within NationalityCount% within NationalityCount% within Nationality
strongly disagree
disagree
neutral
agree
strongly agree
Review -Magazines
Total
Asian CountryWesternCountry
Nationality
Total
Table 5.16 shows that 43.8% of all respondents remained neutral opinion for
restaurant review in the magazines. Some of them stated that they do not pay much
attention to the restaurant review in the magazines when on holiday. A total of 36.8%
(11.0+25. 8%) of the respondents reported that they searched restaurant information
85

from magazines and were influenced by the restaurant review in the magazines when
on holiday. Approximately, 29.6% (13.3+6.3%) of respondents held negative
opinions. The results obtained in table 5.16 indicated that Asian and Western
respondents have similar opinions in perception of restaurant review in the magazines
Advertisement
Table 5.17 Advertisement in Newspaper, magazines and food guides
Adivertisment * Nationality Crosstabulation
8 11 194.0% 5.5% 4.8%
29 25 5414.5% 12.5% 13.5%
44 49 9322.0% 24.5% 23.3%
63 72 13531.5% 36.0% 33.8%
56 43 9928.0% 21.5% 24.8%
200 200 400100.0% 100.0% 100.0%
Count% within NationalityCount% within NationalityCount% within NationalityCount% within NationalityCount% within NationalityCount% within Nationality
strongly disagree
disagree
neutral
agree
strongly agree
Adivertisment
Total
Asian CountryWesternCountry
Nationality
Total
Table 5.17 shows that majority of 58.6% of all respondents reported
themselves as being influenced by the advertisement in the newspaper, magazines,
food guides in their choice of restaurant for eating out when on holiday. A total of
23.3% of the respondents remained neutral. Only18.3% of respondents held the
negative opinion. Most of them expressed that advertisement is a useful information
communication tool. They could understand easily how a restaurant differ from others
and have strongly influenced their decision making process. The results obtained in
table 5.17 indicated that Asian and Western respondents have similar opinions in
perception of restaurant advertisement in the newspaper, magazines and food guides.
Internet
Table 5.18 Restaurant Information from Internet
86
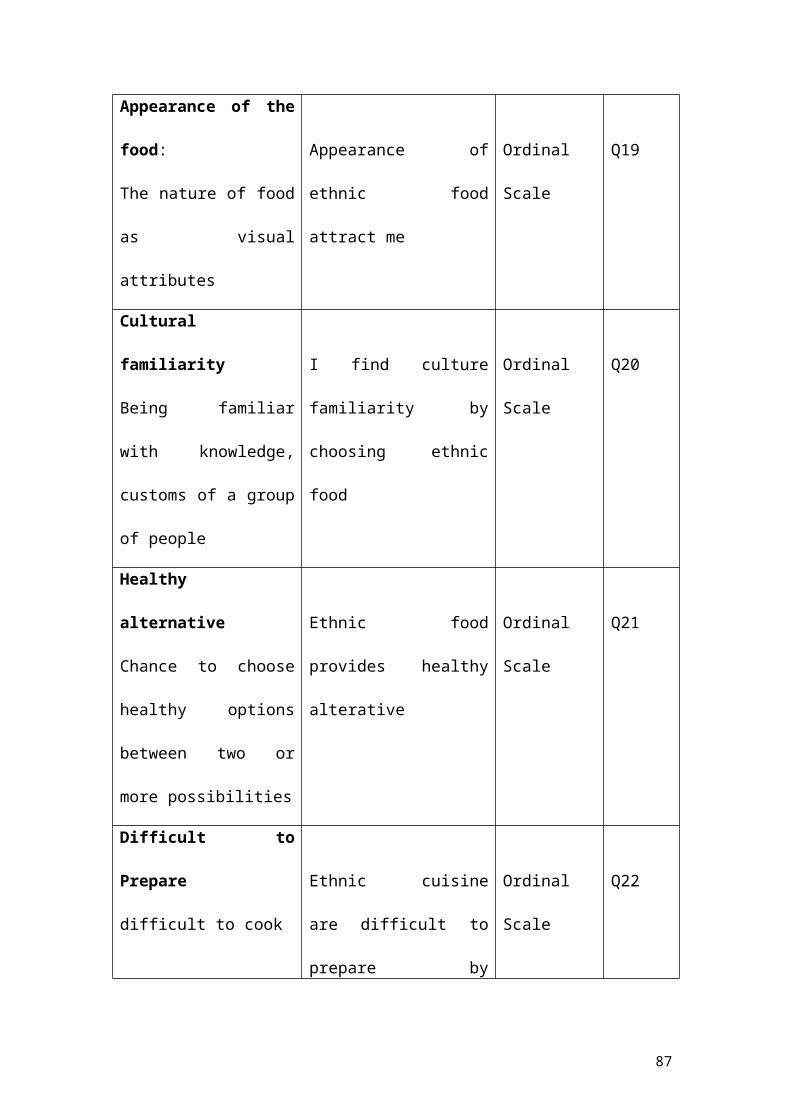
Internet * Nationality Crosstabulation
12 16 286.0% 8.0% 7.0%
24 22 4612.0% 11.0% 11.5%
120 63 18360.0% 31.5% 45.8%
25 67 9212.5% 33.5% 23.0%
19 32 519.5% 16.0% 12.8%200 200 400
100.0% 100.0% 100.0%
Count% within NationalityCount% within NationalityCount% within NationalityCount% within NationalityCount% within NationalityCount% within Nationality
strongly disagree
disagree
neutral
agree
strongly agree
Internet
Total
Asian CountryWesternCountry
Nationality
Total
Table 5.18 shows that 45.8% of all respondents remained neutral about the use
of internet to select a restaurant for eating out. Some of them stated that they may
access a restaurant’s website when making a vacation selection, but rarely visit the
restaurant when on holiday. A total of 35.8% (12.8+23.0%) of respondents towards
internet was agreed or strong agreed. Only 18.5% of respondents held the negative
opinion. The results obtained in table 5.18 indicated that Western respondents use
internet for searching restaurant information more frequently than Asian respondents
when on holiday.
Foreign tourist perceptions of information source(s) used for eating out when
on holiday
Table 5.19 Means of Information Source(s) – Print Media and Internet
Descriptive Statistics
400 1.00 5.00 2.6275 1.07547400 1.00 5.00 3.5100 1.11490400 1.00 5.00 3.2200 1.01695400 1.00 5.00 3.6025 1.13698400 1.00 5.00 3.2300 1.04154400
Reviw - NewspapersReview - Food guidesReview - MagazinesAdvertisementInternetValid N (listwise)
N Minimum Maximum Mean Std. Deviation
Table 5.19 shows that 400 respondents’ perceptions about information
source(s) (Print Media and Internet) used for eating out, which they typically rely for
87

eating out when on holiday. It’s obvious that most of respondents preferably rely on
advertisement in newspaper, magazines, and food guides (mean = 3.6025), followed
by restaurant review in food guides (mean = 3.5100), Internet (mean = 3.2300),
restaurant review in magazine and newspaper (mean = 3.2200 and 2.6275),
respectively.
2.2 Information Source(s) – Restaurant Characteristics
Display of Menu
Table 5.20 Display of Menu in the Window
Dispaly of Menu * Nationality Crosstabulation
7 5 123.5% 2.5% 3.0%
17 24 418.5% 12.0% 10.3%102 82 184
51.0% 41.0% 46.0%74 89 163
37.0% 44.5% 40.8%200 200 400
100.0% 100.0% 100.0%
Count% within NationalityCount% within NationalityCount% within NationalityCount% within NationalityCount% within Nationality
disagree
neutral
agree
strongly agree
Dispalyof Menu
Total
Asian CountryWesternCountry
Nationality
Total
Table 5.20 shows that majority of 86.8% (46.0+40.8%) of the respondents
agreed or strongly agreed that display of menu strongly influenced on their choice of
restaurant. A total of 10.3% of the respondents remained neutral. Only 3.0% of the
respondents held the negative opinion. The results obtained in table 5.20 indicated
that Asian and Western respondents have similar opinions in perception of display of
menu in the window.
Wide variety of food
Table 5.21 Wide variety of food in the Menu
88
Wide Variety of Food * Nationality Crosstabulation
5 16 212.5% 8.0% 5.3%
61 53 11430.5% 26.5% 28.5%
97 82 17948.5% 41.0% 44.8%
37 49 8618.5% 24.5% 21.5%
200 200 400100.0% 100.0% 100.0%
Count% within NationalityCount% within NationalityCount% within NationalityCount% within NationalityCount% within Nationality
disagree
neutral
agree
strongly agree
WideVarietyof Food
Total
Asian CountryWesternCountry
Nationality
Total
Table 5.21 shows that majority of 66.3% (21.5+44.8%) of the respondents
agreed or strongly agreed that wide variety of food in the menu strongly influenced on
their choice of restaurant. A total of 28.5% of the respondents remained neutral. Only
5.3% of the respondents held negative opinion. The results obtained in table 5.21
indicated that Asian and Western respondents have similar opinions in perception of
wide variety of food in the menu
Specialty Food
Table 5.22 Specialty Food Featured in the Menu
Specialty Food * Nationality Crosstabulation
0 4 4.0% 2.0% 1.0%
6 5 113.0% 2.5% 2.8%
55 39 9427.5% 19.5% 23.5%
92 109 20146.0% 54.5% 50.3%
47 43 9023.5% 21.5% 22.5%
200 200 400100.0% 100.0% 100.0%
Count% within NationalityCount% within NationalityCount% within NationalityCount% within NationalityCount% within NationalityCount% within Nationality
strongly disagree
disagree
neutral
agree
strongly agree
SpecialtyFood
Total
Asian CountryWesternCountry
Nationality
Total
Table 5.22 shows that majority of 72.8% (22.5+50.3%) of the respondents
strongly agreed or agreed that specialty food featured in the menu strongly influenced
89

on their choice of restaurant. A total of 23.5% of the respondents remained neutral.
Only 3.8% (2.8+1.0%) of the respondents held the negative opinions. The results
obtained in table 5.22 indicated that Asian and Western respondents have similar
opinions in perception of wide variety of food in the menu
Looking Busy
Table 5.23 Restaurant Looking Busy
Looking Busy * Nationality Crosstabulation
4 13 172.0% 6.5% 4.3%
9 30 394.5% 15.0% 9.8%
69 108 17734.5% 54.0% 44.3%
76 34 11038.0% 17.0% 27.5%
42 15 5721.0% 7.5% 14.3%
200 200 400100.0% 100.0% 100.0%
Count% within NationalityCount% within NationalityCount% within NationalityCount% within NationalityCount% within NationalityCount% within Nationality
strongly disagree
disagree
neutral
agree
strongly agree
Looking Busy
Total
Asian CountryWesternCountry
Nationality
Total
Table 5.23 shows that 44.3% of the respondents had a neutral opinion towards
the influencing factor of ‘of restaurant looking busy’. A total of 41.8% (14.3+27.5%)
of the respondents strongly agreed or agreed that restaurant looking busy strongly
influenced on their choice of restaurant. Only 14.1% (9.8+4.3%) of the respondents
held negative opinions. The results obtained in table 5.23 indicated that most of the
Asian respondents were more easily influenced by a restaurant looking than Western
respondents when they make their choice for eating out at the restaurant.
Atmosphere
Table 5.24 Atmosphere
90

D¨¦cor and Atmosphere * Nationality Crosstabulation
6 0 63.0% .0% 1.5%
61 27 8830.5% 13.5% 22.0%
53 63 11626.5% 31.5% 29.0%
80 110 19040.0% 55.0% 47.5%
200 200 400100.0% 100.0% 100.0%
Count% within NationalityCount% within NationalityCount% within NationalityCount% within NationalityCount% within Nationality
disagree
neutral
agree
strongly agree
D¨¦cor andAtmosphere
Total
Asian CountryWesternCountry
Nationality
Total
Table 5.24 shows that majority of 76.5% (47.5+29.0%) of the respondents
strongly agreed or agreed that atmosphere had influence on their choice of restaurant.
A total of 22.0% of the respondents remained neutral. Only 1.5% of the respondents
held the negative opinion. The results obtained in table 5.24 indicated that most of the
Western respondents were more easily influenced by restaurants’ atmosphere than
Asian respondents when they make their choice for eating out at restaurant.
Foreign tourists’ perception of restaurant characteristics for eating out at
restaurant when on holiday
Table 5.25 Means of Information Source(s) –Restaurant Characteristics
Descriptive Statistics
400 2.00 5.00 4.2450 .75591400 2.00 5.00 3.8250 .82527400 1.00 5.00 3.9050 .80784400 1.00 5.00 3.3775 .98612400 2.00 5.00 4.2250 .84032400
Dispaly of MenuWide Variety of FoodSpecialty FoodLooking BusyD¨¦cor and AtmosphereValid N (listwise)
N Minimum Maximum Mean Std. Deviation
Table 5.25 shows 400 respondents’ perceptions about information source(s)
used (restaurant Characteristics) for eating out, which are more important for them
when on holiday. It’s obvious that display of menu in the window was the most
influential characteristics by mean score of 4.2450. This visual aspect can encourage
91

and deter respondents entering restaurants, followed by atmosphere (4.2250),
specialty food featured in the menu (3.9050), wide variety of food in the menu
(3.8250), Looking Busy (3.3775).
3. Foreign Tourists’ Perception of Importance of Influential Factors in
Preference of eating out at Ethnic Restaurant.
Taste of Food
Table 5.26 Respondents’ Perception of Taste of Food
Taste of Food * Nationality Crosstabulation
1 0 1.5% .0% .3%36 92 128
18.0% 46.0% 32.0%122 80 202
61.0% 40.0% 50.5%41 28 69
20.5% 14.0% 17.3%200 200 400
100.0% 100.0% 100.0%
Count% within NationalityCount% within NationalityCount% within NationalityCount% within NationalityCount% within Nationality
Low Influence
Moderate Influence
High Influence
Very High Influence
Tasteof Food
Total
Asian CountryWesternCountry
Nationality
Total
Table 5.26 shows that majority of 67.8% (17.3+50.5%) of the respondents
were under very high or highly influenced by the taste of ethnic food when eating out
at ethnic restaurant. A total of 32.0% of the respondents considered it as moderately
influential. Only 0.3% of the respondents held negative opinion. The results obtained
in table 5.26 indicated that Asian respondents were under higher influenced by taste
of food when eating out at ethnic restaurant than Western respondents. Some of
Western respondents indicated that they would visit ethnic restaurant more often, if
the taste of food they are accustomed to.
Personal Preference
Table 5.27 Respondents’ Perception of Personal Preference for Ethnic Food
92

Personal Preference * Nationality Crosstabulation
15 45 607.5% 22.5% 15.0%
74 114 18837.0% 57.0% 47.0%
101 26 12750.5% 13.0% 31.8%
10 15 255.0% 7.5% 6.3%200 200 400
100.0% 100.0% 100.0%
Count% within NationalityCount% within NationalityCount% within NationalityCount% within NationalityCount% within Nationality
Low Influence
Moderate Influence
High Influence
Very High Influence
PersonalPreference
Total
Asian CountryWesternCountry
Nationality
Total
For the influence of personal preference, the table 5.27 shows that 47.0% of
the respondent considered it as moderately influential factor. A total of 38.1%
(6.3+31.8%) of the respondents were under very high or highly influenced by their
personal preference when eating out at ethnic restaurants. Only 15.0% of the
respondents held negative opinions. Interestingly, the results obtained in table 5.27
indicated that Asian respondents were under higher influenced by personal preference
for eating out at ethnic restaurant than Western respondents.
Appearance Table 5.28 Respondents’ Perception of Appearance of Ethnic Food
Appearence * Nationality Crosstabulation
7 0 73.5% .0% 1.8%
28 5 3314.0% 2.5% 8.3%
62 46 10831.0% 23.0% 27.0%
66 85 15133.0% 42.5% 37.8%
37 64 10118.5% 32.0% 25.3%
200 200 400100.0% 100.0% 100.0%
Count% within NationalityCount% within NationalityCount% within NationalityCount% within NationalityCount% within NationalityCount% within Nationality
Very Low Influence
Low Influence
Moderate Influence
High Influence
Very High Influence
Appearence
Total
Asian CountryWesternCountry
Nationality
Total
Table 5.28 shows that majority of 63.1% (25.3+37.8%) of the respondents
were under very high or highly influenced by appearance of ethnic food when eating
93
out at ethnic restaurant. A total of 27.0% of the respondents considered it as
moderately influential factor. Only 10.1% of the respondents held the negative
opinions. The results obtained in table 5.28 indicated that Western respondents were
under higher influenced by appearance of ethnic food when eating out at ethnic
restaurant.
Culture Familiarity
Table 5.29 Respondents’ Perception of Culture Familiarity
Culture Familiarity * Nationality Crosstabulation
11 18 295.5% 9.0% 7.3%
38 36 7419.0% 18.0% 18.5%
98 93 19149.0% 46.5% 47.8%
32 40 7216.0% 20.0% 18.0%
21 13 3410.5% 6.5% 8.5%
200 200 400100.0% 100.0% 100.0%
Count% within NationalityCount% within NationalityCount% within NationalityCount% within NationalityCount% within NationalityCount% within Nationality
Very Low Influence
Low Influence
Moderate Influence
High Influence
Very High Influence
CultureFamiliarity
Total
Asian CountryWesternCountry
Nationality
Total
Table 5.29 shows that 47.8% of the respondent considered culture familiarity as
moderately influential factor. A total of 26.5% (18.0+8.5%) of the respondents were
under very high or highly influenced by culture familiarity when eating out at ethnic
restaurants. However, there still 25.8% of the respondents held the negative opinion.
Most of them stated that their purpose of eating out at ethnic restaurant was to have a
cultural experience. On the contrary, some of the respondents stated that they prefer
the familiar cultural elements provided by ethnic restaurants, such as the food
prepared in the style of their country, nice atmosphere and feel at home. The results
94

obtained in table 5.29 indicate that Asian and Western respondents have similar
opinion in perception of culture familiarity.
Healthy Alternative
Table 5.30 Respondents’ Perception of Healthy Alternative
Healty Alternative * Nationality Crosstabulation
10 8 185.0% 4.0% 4.5%
35 18 5317.5% 9.0% 13.3%
96 75 17148.0% 37.5% 42.8%
33 81 11416.5% 40.5% 28.5%
26 18 4413.0% 9.0% 11.0%
200 200 400100.0% 100.0% 100.0%
Count% within NationalityCount% within NationalityCount% within NationalityCount% within NationalityCount% within NationalityCount% within Nationality
Very Low Influence
Low Influence
Moderate Influence
High Influence
Very High Influence
HealtyAlternative
Total
Asian CountryWesternCountry
Nationality
Total
Table 5.30 shows that 42.8% of the respondents considered healthy alternative
as moderately influential factor for eating out at ethnic restaurant when on holiday. A
total of 39.5% (11.0+28.5%) of the respondents were under very high or highly
influenced by healthy alternative provided at ethnic restaurant. Only 17.8% of the
respondents held the negative opinion.
For Asian respondents, 48.0% of the respondent considered healthy alternative
as moderately influential factor, followed by ‘very high influence’ (13.0%) and ‘high
influence’ (16.5%). A total of 22.5% of respondents held negative opinion. On the
contrary, majority of 49.5% (9.0+40.5%) of Western respondents reported themselves
were under very high or highly influenced by healthy alternatives provided at the
ethnic restaurant. The researcher found that most of the Western respondents were
interested in vegetarian choices when they read the door menu of ethnic restaurants. A
total of 37.5% of the respondents considered healthy alternative as moderately
influential factor. Only 13% (9.0+4.0%) of the respondents held the negative
95

opinions.
Difficult to Prepare
Table 5.31 Respondents’ Perception of Difficult to Prepare at Home
Difficult to Prepare * Nationality Crosstabulation
15 10 257.5% 5.0% 6.3%
76 55 13138.0% 27.5% 32.8%
68 83 15134.0% 41.5% 37.8%
41 52 9320.5% 26.0% 23.3%
200 200 400100.0% 100.0% 100.0%
Count% within NationalityCount% within NationalityCount% within NationalityCount% within NationalityCount% within Nationality
Low Influence
Moderate Influence
High Influence
Very High Influence
Difficult toPrepare
Total
Asian CountryWesternCountry
Nationality
Total
Table 5.31 shows that majority of 61.1% (23.3+37.8%) of respondents were
under very high or highly influenced by the perception what ethnic foods is difficult
prepare at home (such as Japanese food). A total of 32.8% of respondents considered
it as moderately influential factor for eating out at ethnic restaurant. Only 6.3% of the
respondents held the negative opinions. The results obtained in table 5.31 indicated
that Asian and Western respondents have similar opinions in perception of ethnic
foods are difficultly of preparing ethnic food at home,
Menu choice
Table 5.32 Respondents’ Perception of Menu Choice
Menue Choice * Nationality Crosstabulation
4 5 92.0% 2.5% 2.3%
9 12 214.5% 6.0% 5.3%
46 14 6023.0% 7.0% 15.0%
86 105 19143.0% 52.5% 47.8%
55 64 11927.5% 32.0% 29.8%
200 200 400100.0% 100.0% 100.0%
Count% within NationalityCount% within NationalityCount% within NationalityCount% within NationalityCount% within NationalityCount% within Nationality
Very Low Influence
Low Influence
Moderate Influence
High Influence
Very High Influence
MenueChoice
Total
Asian CountryWesternCountry
Nationality
Total
96

Table 5.32 shows that majority of 77.6% (29.8+47.8%) of respondents were
under very high or highly influenced by menu choice. The result indicated that
majority of the respondents preferred variety of items displayed on the menu that
offered a lot of choices. Therefore, they could seek new items, and/or something
different. A total of 15.0% of respondents considered it as a moderately influential
factor when they eating out at ethnic restaurant. Only 7.6%of the respondents held the
negative opinions. The results obtained in table 5.32 indicated that Western
respondents were under higher influenced by menu choice when eating out at ethnic
restaurant than Asian respondents.
Culture Cues
Table 5.33 Respondents’ Perception of Culture Cues in Décor and Atmosphere
Culture Cues * Nationality Crosstabulation
5 2 72.5% 1.0% 1.8%
23 30 5311.5% 15.0% 13.3%
109 86 19554.5% 43.0% 48.8%
63 82 14531.5% 41.0% 36.3%
200 200 400100.0% 100.0% 100.0%
Count% within NationalityCount% within NationalityCount% within NationalityCount% within NationalityCount% within Nationality
Low Influence
Moderate Influence
High Influence
Very High Influence
CultureCues
Total
Asian CountryWesternCountry
Nationality
Total
Table 5.33 shows that majority of 85.1% (36.3+48.8%) of respondents were
under very high or highly influenced by Culture Cues in Décor and Atmosphere. It
indicated that most of the respondents went into ethnic restaurant not only for food
and its preparation, but also to experience the cultural atmosphere. A total of 13.3% of
respondents considered it as moderately influential factor for eating out at ethnic
restaurant. Only 1.8%of the respondents held negative opinion. The results obtained
97

in table 5.33 indicated that Asian and Western respondents have similar opinions in
perception of culture cues in the décor and atmosphere.
Language
Table 5.34 Respondents’ Perception of Language
Language * Nationality Crosstabulation
4 10 142.0% 5.0% 3.5%
52 25 7726.0% 12.5% 19.3%
95 123 21847.5% 61.5% 54.5%
49 42 9124.5% 21.0% 22.8%
200 200 400100.0% 100.0% 100.0%
Count% within NationalityCount% within NationalityCount% within NationalityCount% within NationalityCount% within Nationality
Low Influence
Moderate Influence
High Influence
Very High Influence
Language
Total
Asian CountryWesternCountry
Nationality
Total
Table 5.34 shows that majority of 77.3% (22.8+54.5%) of respondents were
under very high or high influenced by language requirement. It indicated that most of
the respondents require the servers more communicative and willing to give the
information about the foods they provide. A total of 19.3% of respondents considered
it as moderately influential factor. Only 3.5%of the respondents held the negative
opinions. Table 5.34 indicated that Western respondents were under higher influenced
by language requirement for eating out at ethnic restaurant than Asian respondents.
Cues of Authentic Cooking
Table 5.35 shows that majority of 72.6% (31.3+41.3%) of respondents were
under very highly or high influenced by cues of authentic cooking. A total of 22.3%
of respondents considered it as moderately influential factor. Only 5.3% of the
respondents held the negative opinions. The result obtained in table 5.35 indicated
98

that Asian respondents were under higher influenced by cues of authentic cooking
when eating out at ethnic restaurant than Western respondents.
Table 5.35 Respondents’ Perception of Cues of Authentic Cooking
Cues of authentic cooking * Nationality Crosstabulation
4 17 212.0% 8.5% 5.3%
22 67 8911.0% 33.5% 22.3%
100 65 16550.0% 32.5% 41.3%
74 51 12537.0% 25.5% 31.3%
200 200 400100.0% 100.0% 100.0%
Count% within NationalityCount% within NationalityCount% within NationalityCount% within NationalityCount% within Nationality
Low Influence
Moderate Influence
High Influence
Very High Influence
Cues ofauthenticcooking
Total
Asian CountryWesternCountry
Nationality
Total
Factors that influence Foreign Tourists’ Preference for eating out at Ethnic
Restaurant
Table 5.36 Means of influential factors of respondents’ Preference for eating out
at Ethnic Restaurants in Bangkok
Descriptive Statistics
400 2.00 5.00 4.0075 .81493400 2.00 5.00 3.2925 .79594400 1.00 5.00 3.7650 .97835400 1.00 5.00 3.0200 .99855400 1.00 5.00 3.2825 .97984400 2.00 5.00 3.7800 .87379400 1.00 5.00 3.9750 .92819400 2.00 5.00 4.1100 .77744400 2.00 5.00 3.8425 .66241400 2.00 5.00 3.9850 .86408400
Taste of FoodPersonal PreferenceAppearenceCulture FamiliarityHealty AlternativeDifficult to PrepareMenue ChoiceCulture CuesLanguageCues of authentic cookingValid N (listwise)
N Minimum Maximum Mean Std. Deviation
Table 5.36 shows the perception of 400 respondents towards the important
influential factors effecting their preference for eating out at Ethnic Restaurants in
Bangkok. Ranking by means of each factor from the highest to the lowest mean
scores is shown as given below: Culture Cues (4.1100), Taste of Food (4.0075), Cues
99

of authentic cooking (3.9850), Menu Choice (3.9750), Language (3.8425), Difficult to
Prepare at Home (3.7800), Appearance (3.7650), Personal Preference (3.2925),
Healthy Alternative (3.2825), and Culture Familiarity (3.0200), respectively.
5.2 Hypothesis Testing
Hypothesis Group A: Foreign tourists’ Motivation Vs their Preference for eating
out at Ethnic Restaurant in Bangkok.
Hypothesis 1:
H1o: There is no relationship between foreign tourists’ motivations and their
preference for eating out at ethnic restaurant in Bangkok.
H1a: There is a relationship between foreign tourists’ motivations and their
preference for eating out at ethnic restaurant in Bangkok.
Table 5.37 Spearman’s Rank Correlation Testing Hypothesis One
Correlations
1.000 .728**. .000
400 400.728** 1.000.000 .400 400
Correlation CoefficientSig. (2-tailed)NCorrelation CoefficientSig. (2-tailed)N
Preference for eating outat Ethnic Restaurant
Motivations For Eating Out
Spearman's rho
Preferencefor eating out
at EthnicRestaurant
MotivationsFor Eating Out
Correlation is significant at the 0.01 level (2-tailed).**.
Rule of Rejection: If the significance value is greater than 0.05, then, the null
hypothesis will be accepted. Otherwise, the null hypothesis will be rejected.
Significant level (2-tailed) is 0.000, which is less than the set criteria (0.05) as shown
in table 5.37. It means that the null H1o is rejected.
Correlation coefficient
The value of correlation coefficient from the Spearman’s Rank Correlation test is
100

0.728, which means there is a strong positive relationship. The stronger the
motivations foreign tourists have for eating out, the higher the preference for them to
eat out at ethnic restaurants in Bangkok. In terms of the motivation driver, ethnic restaurants
were perceived as a good place for discovering a new/different food and to get rest in a relaxing
cultural environment from their overall dining experience by foreign tourists. Moreover, the
correlation is significant at the 0.01 level under 2-tailed test and the result will by
chance create 1% error. Therefore, it can be concluded that there is a significant
relationship between foreign tourists’ motivations and their preference for eating out
at ethnic restaurants.
Hypothesis Group B: Information Source(s) Used Vs foreign tourists’ Preference for
eating out at Ethnic Restaurant in Bangkok.
Hypothesis 2:
H2o: There is no relationship between information source(s) used (Print Media
and Internet) and foreign tourists’ preference for eating out at ethnic restaurant in
Bangkok.
H2a: There is a relationship between information source(s) (Print Media and
Internet) used and foreign tourists’ preference for eating out at ethnic restaurant in
Bangkok.
Table 5.38 Spearman’s Rank Correlation Testing Hypothesis Two
101

Correlations
1.000 .609**. .000
400 400.609** 1.000.000 .400 400
Correlation CoefficientSig. (2-tailed)NCorrelation CoefficientSig. (2-tailed)N
Preference for eating outat Ethnic Restaurant
Information Source(s)(Print Media and Internet)
Spearman's rho
Preferencefor eating out
at EthnicRestaurant
InformationSource(s)
(Print Mediaand Internet)
Correlation is significant at the 0.01 level (2-tailed).**.
Rule of Rejection: If the significance value is greater than 0.05, then, the null
Hypothesis will be accepted. Otherwise, the null hypothesis will be rejected.
Significant level (2-tailed) is 0.000, which is less than the set criteria (0.05) as shown
in table 5.38. It means that the null H2o is rejected.
Correlation coefficient
The value of correlation coefficient from the Spearman’s Rank Correlation test is
0.609, which means there is a moderate positive relationship. The stronger the
influence of information of ethnic restaurant provided in Print Media and Internet, the
higher the preference for the foreign tourists to eat out at those restaurants. When
foreign tourists make their dining decision, they probably consider the information of
ethnic restaurant what they have read in food guides, magazines, Internet or
newspapers. Moreover, the correlation is significant at the 0.01 level under 2-tailed
test and the result will by chance create 1% error. Therefore it can be concluded that
there is a significant relationship between information source(s) (Print Media and
Internet) used and foreign tourists’ preference for eating out at ethnic restaurant in
Bangkok.
Hypothesis 3:
H3o: There is no relationship between Information Source(s) used (Restaurant
102

Characteristics) and foreign tourists’ preference of eating out at ethnic restaurant
in Bangkok.
H3a: There is a relationship between Information Source(s) used (Restaurant
Characteristics) and foreign tourists’ preference of eating out at ethnic restaurant
in Bangkok.
Table 5.39 Spearman’s Rank Correlation Testing Hypothesis Three
Correlations
1.000 .656**. .000
400 400.656** 1.000.000 .400 400
Correlation CoefficientSig. (2-tailed)NCorrelation CoefficientSig. (2-tailed)N
Preference for eatingout at Ethnic Restaurant
Information Source(s)(RestaurantCharacteristics)
Spearman's rho
Preferencefor eating out
at EthnicRestaurant
InformationSource(s)
(RestaurantCharacteris
tics)
Correlation is significant at the 0.01 level (2-tailed).**.
Rule of Rejection: If the significance value is greater than 0.05, then, the null
hypothesis will be accepted. Otherwise, the null hypothesis will be rejected.
Significant level (2-tailed) is 0.000, which is less than the set criteria (0.05) as shown
in table 5.39, it means that the null H2o is rejected.
Correlation coefficient
The value of correlation coefficient from the Spearman’s Rank Correlation test is
0.656, which means there is a moderate positive relationship. The stronger the
influence of information of ethnic restaurant characteristics obtained, the higher the
preference for the foreign tourists to eat out at those restaurants. Foreign tourists
particularly view dining at ethnic restaurant as a part of cultural experience. Most of
them enjoy tasting the specialty of ethnic food that has displayed a menu in the
103

window and were being attracted by the colorful appearance of the ethnic food.
Moreover, the correlation is significant at the 0.01 level under 2-tailed test and the
result will by chance create 1% error. Therefore, it can be concluded that there is a
significant relationship between information source(s) used (Restaurant
Characteristics) and foreign tourists’ preference for eating out at ethnic restaurant in
Bangkok.
Hypothesis Group C: Type of tourists Vs Perception for eating out at Ethnic
Restaurant in Bangkok.
Hypothesis 4:
H4o: There is no difference in perception of preference for eating out at ethnic
restaurant in Bangkok between Western and Asian foreign tourists.
H4a: There is a difference in the perception of preference for eating out at ethnic
restaurant in Bangkok between Western and Asian foreign tourists.
Table 5.40 Mann – Whitney U Testing Hypothesis Four.
Test Statisticsa
17629.00037729.000
-2.064.039
Mann-Whitney UWilcoxon WZAsymp. Sig. (2-tailed)
Preferencefor eating out
at EthnicRestaurant
Grouping Variable: Nationalitya.
From the result displayed in table 5.40, the significance equaled 0.039, was less
than the significance level (0.039<0.05). This indicated that there is enough evidence
to reject the null H4o hypothesis. Therefore, the researcher accepted the alternative
hypothesis. It implied that there was a difference in perception of preference for
eating out at ethnic restaurant in Bangkok between Western and Asian foreign tourists.
104

5.3 Critical Discussion of Results
Group A: Foreign tourists’ Motivation Vs their Preference for eating out at Ethnic
Restaurant in Bangkok.
According to the results of hypothesis testing, the significant value of foreign
tourists’ motivations for eating out is 0.000, which was less than 0.05. Therefore, the
null hypothesis (H1o) was rejected. As a result, foreign tourists’ motivations for eating
out are related to their preference for eating out at ethnic restaurant in Bangkok.
Group B: Information Source(s) Used Vs foreign tourists’ Preference for eating out at
Ethnic Restaurant in Bangkok.
According to the results of hypothesis testing, the significant values of both
information sources used are 0.000, which were less than 0.05. Therefore, the null
hypothesis (H2o and H3) was rejected. It means that information sources used by
foreign tourists are associated with their preference of eating out at ethnic restaurant
in Bangkok.
Group C: Type of tourists Vs Perception preference for eating out at Ethnic
Restaurant in Bangkok.
According to the results of hypothesis testing, the significance value equaled 0.039,
which was less than the 0.05. Therefore, the null hypothesis (H4o) was rejected. It
means there was a difference in perception of preference for eating out at ethnic
restaurant in Bangkok between Western and Asian foreign tourists.
105
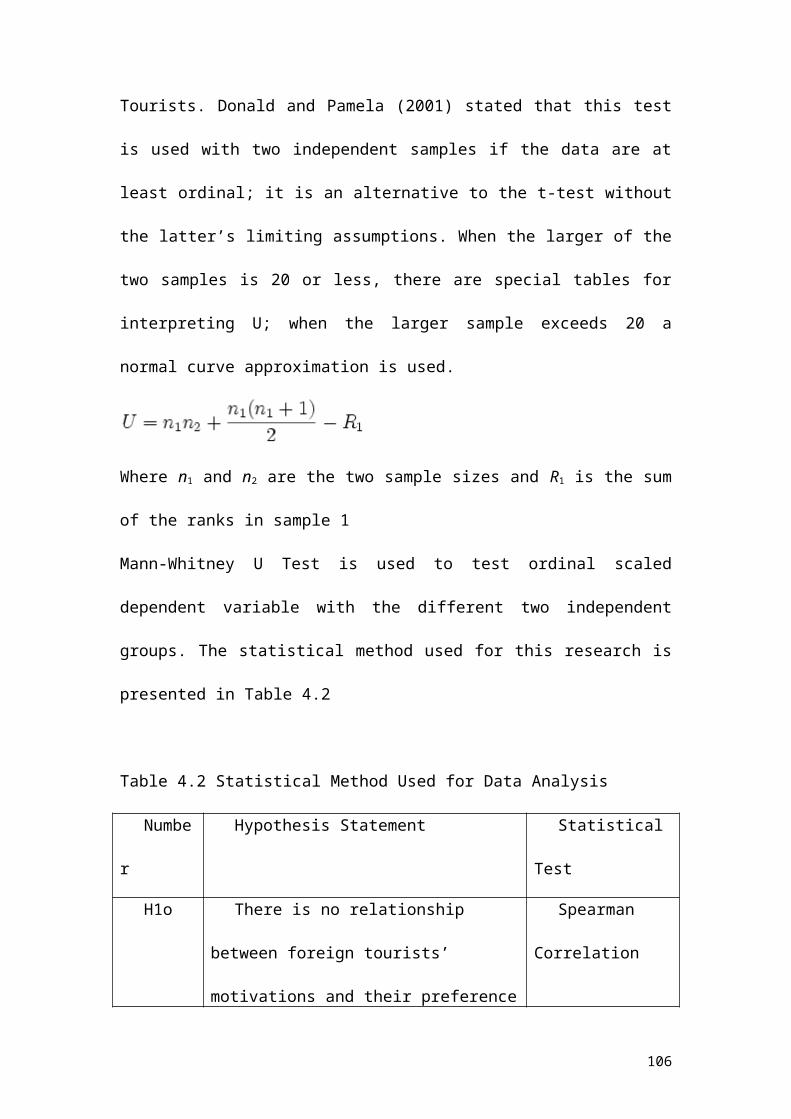
CHAPTER 6
SUMMARY FINDINGS, CONCLUSION AND
RECOMMENDATIONS
This final chapter of this study consists of three sections. In the first section,
the researcher presents a summary of findings in this study. The second section
discusses conclusions based on the important findings of the study. The third section
presents the recommendations and suggestions for further research.
6.1 Summary of Findings
6.1.1 Summary of Respondents’ Demographic Profile
Demographic factors which are related to descriptive statistics in this research
consisted of 7 factors: gender, age, education level, occupation, monthly personal
income, nationality and food preference. Table 6.1, shows the largest groups of each
variable in demographic factors.
Table 6.1 Summary of results from respondents’ demographic profile
Variable Largest Group (%)
Gender Male (53.8%)
106

Age 30~39 years old (30.8%)
Education Level Bachelor’s degree (58.3%)
Occupation Company employee (51.3%)
Monthly Personal Income More than $1000 (49.8%)
Food Preference Thai food (44.0%)
Gender
The largest group of respondents’ gender is male (53.8%), the rest of the
respondents are female (46.3%). Among Western tourists, the male respondents were
63.5% and female were at 36.5%. Among Asian tourists, the male respondents were
44.0% and females were 56.0%.
Age
The largest group of respondents’ age is between 30~39years old (30.8%). A
total of 28.3% of respondents were in the age range of between 20~29 years old,
22.5% were in 40~49 years old, 15.3% were in 50 years old above, 3.3% were under
20 years old, respectively. Among Asian respondents, 39.0% of them were in the age
range between 20-29 years old, 32.5% were in 30~39 years old, 12.5% were in 40~49
years old, 12.0 % were in 50 years old above, 4.0% were under 20 years old,
respectively. Among Western tourists 32.5% of them were in the age range of between
40~49 years old, 29.0% were in 30~39 years old, 18.5% were in 50 years old above,
17.5% were in 20~29 years old and lastly 2.5% were under 20 years old, respectively.
Education Level
The largest group of respondents’ educational level was Bachelor’s degree
107

(58.3%), the rest of the respondents had master’s degree (27.3%) or higher than
master’s degree (9.0%) and certificate/diploma (5.5%), respectively. Among Asian
respondents, the highest education level of respondents was Bachelor’s degree
(67.0%), followed by Master’s degree (19.5%), certificate/diploma (8.0%) and higher
than master’s degree (5.5%), respectively. For Western respondents, the highest
education level was Bachelor’s degree (49.5%), Master’s degree (35.0%), higher than
Master’s degree (12.5%) and certificate/diploma (3%), respectively.
Occupation
The largest group of respondents’ occupation is company employee (51.3%),
followed by owning business (14.8%), employer/manager (10.8%), professional
(9.8%), others (8.8%) and government officer (4.8%). For Asian tourists, the
occupation of the respondents were company employee (59.5%), followed by owning
business (13.50%), employer/manager (9.0%), professional (7.5 %), others (7.0%)
and government officer (3.5%). For Western tourists, the percentage of the
respondent’s occupation are company employee (43.0%), followed by owning
business (16.0%), employer/manager (12.5%), professional (12.0%), others (10.5%)
and government officer (6.0%), respectively.
Monthly Personal Income
The largest group of respondents (49.8%) had income more than $1000. The
rest of the respondents monthly income was between $201~$500 (23.5%),
$501~$1000 (18.8%) and less than $200 (8%), respectively. For Asian respondents,
most of them (44.5%) had a monthly personal income of $201~$500, then, 27.0% had
$501~$1000, 21.0% had more than $1000 and 7.5% had less than $200. On the
108

contrary, most of the Western respondents (78.5%) had the monthly income range
among more than $1000, 10.5% had $501~$1000, 8.5% had less than $200 and 2.5%
had $201~$500, respectively.
Food Preference
The largest group of respondents (44.0%) considered Thai food as the most
preferred ethnic food in Bangkok, followed by food (14.5%), Chinese food (13.0%),
Italian food (8.5%), Japanese food (8.3 %), Mexican food (5.8%), French food (3.8%)
and others (2.3 %). For Asian respondents, the majority of them (51.5%) considered
Thai food as their most preferred ethnic food in Bangkok, then, Japanese food
(13.0%), Chinese food (10.50%), Indian food (9.0%), Italian food (7.5%), Mexican
food (3.5%), French food (2.5%) and others (2.5%). Most of Western respondents’
food preferences were Thai food (36.5%), Indian food (20.0%), Chinese food
(15.5%), Italian food (9.5%), Mexican food (8.0%), French food (5.0%), and Japanese
food (3.5%) and others (2..0%).
6.1.2 Summary of Hypotheses Testing
Table 6.2 Summary of Results from Hypotheses Testing
Hypotheses Statistics
Test
Significance
Value
(2-tailed)
Correlation
Coefficient
Value
Results
H1o:
There is no relationship between
foreign tourists’ motivations and
their preference for eating out at
Spearman’
s Rank
Correlation
0.
000
0.72
8
Reject
H1o
109

ethnic restaurant in Bangkok.
H2o:
There is no relationship between
Information Source(s) used (Print
Media and Internet) and foreign
tourists’ preference for eating out
at ethnic restaurant in Bangkok.
Spearman’
s Rank
Correlation
0
.000
0.
609
Reject
H2o
H3o:
There is no relationship between
Information Source(s) used
Restaurant Characteristics) and
foreign tourists’ preference for
eating out at ethnic restaurant in
Bangkok.
Spearman’
s Rank
Correlation
0.
000
0.
656
R
eject
H3o
H4o:
There is no difference in
perception of preference for eating
out at ethnic restaurant in Bangkok
between Western and Asian foreign
tourists.
Ma
nn –
Whitney U
test
0.039
Reject
H4o
From Table 6.2 the result of testing hypotheses in this study, it can be
concluded that there was a significant relationship between independent variables
(motivations and information source(s) used for eating out) and dependent variables
(foreign tourists’ preference for eating out at ethnic restaurant in Bangkok). It was
indicated that
Firstly, foreign tourists’ motivations are the important factors effecting their
purpose of eating out at ethnic restaurant when on holiday. Secondly, Information
source(s) used from print media or Internet is very important in tourists’ determination
process of eating out when on holiday. Thirdly, information source(s) (restaurant
characteristics) which tourists obtained from directly see ethnic restaurants will
110

strongly influenced their desire to enter ethnic restaurant.
Furthermore, this research also focused on investigating the difference in
perception of preference for eating out at ethnic restaurant in Bangkok between
Western and Asian foreign tourists. Mann-Whitney U test was applied to test this
hypothesis. As the result shows in table 6.2 the null H4o is rejected.
6.2 Conclusion
The tourism industry of Thailand has been continually growing from
year to year. This trend shows a positive movement for restaurant business and
marketing. Many of the foreign tourists visit Bangkok towards trying out ethnic foods,
increasing interest in new, exotic and vegetarian items. Ethnic foods are getting more
popular with cuisine from China, Japan, Indian, Italian etc.
However, ethnic restaurants are still highly competing with other types of
restaurant in Bangkok. Therefore, this study focuses on investigating the relationship
of selected factors, which are motivations factor, information source used, foreign
tourists’ preference for eating out at ethnic restaurant in Bangkok and to measure the
relative importance level of those influential factors. 400 respondents (200 Asian
tourists and 200 Western tourists) were selected from 8 Casual – dining Ethnic
Restaurants which are located at the side streets (Sois) of Sukumvit road and Centre
World Plaza.
In conclusion, this study analyzed that there are universal preference and
differential perceptions between Asian and Western foreign tourists. Based on the
descriptive crosstabulation analysis of demographic factors, the researcher has
111

concluded the results of the hypotheses testing in order to answer the research
objectives as follows:
Demographic Factors
This study focused on foreign tourists, which led to important insight of
difference/indifference in demographic profile between Asian and Western
respondents:
The key finding of this study shows that females were the largest group of
Asian respondents. The younger the age of respondents, the higher is their tendency to
eating out at ethnic restaurants. Most of the respondents were company employees,
holding bachelor’s degree with the monthly personal incomes of $201~$500 (44.5%).
Moreover, the majority of Asian respondents still accustomed to eat Asian food in
Bangkok. They have a higher tolerance for hot spicier food. On the contrary, the
majority of Western respondents are males whose ages are between 40-49 years old,
holding bachelor’s degree, having a monthly personal income more than $1000. It
appears that most of Western guests of those Casual – dining Ethnic Restaurants had
bachelor’s degree and higher monthly personal income than Asian respondents
relatively. Most of them prefer Thai food, Indian food, Chinese food, Italian food in
Bangkok.This is not surprising, since Western people are more likely to have
experience different cuisines, traveled widely, and to be adventurous. Additionally,
because of the third objective of this study focused on ethnic difference, so
respondents were asked to identify their ethnicity with three categories of ‘Asian
country’, ‘Western country’ and ‘others’. The research uses the questionnaires of
Asian and Western respondents for the statistics analysis only.
112

Tourists perception of Importance of Motivation
To address the first objective of the study, Spearman’s Rank Correlation test
was conducted. The result of the hypothesis of Group A identified that there is a
significant relationship between foreign tourist motivations and their preference for
eating out at ethnic restaurant in Bangkok. Moreover, respondents were asked to
score, on the Likert scale, the importance of each of the 6 given motivations when
tourists decided to eat out at ethnic restaurant.
As the finding is presented in Table 5.13, discovery aspect (trying new,
exciting, and different foods) emerged as the most important motivation for eating out
when on holiday by mean score of 4.3550. Relaxation (4.2625), experience (4.1850)
and indulgence (4.1075) were perceived as similarly important motivations. Notably,
most of the respondent regard eating healthy food was very important by mean score
of 3.8625. However, a interesting difference was expressed in respondents’ perception
of social reason between Western and Asian respondent: For Asian respondent,
majority of them regarded eating out when on holiday as an excellent opportunity to
get together with friends and family. On the contrast, most of the Western
respondents’ perception toward social reason was neutral. They regarded travel alone
and eating out as an opportunity expressing themselves from daily life. Therefore,
they didn’t think that it’s a chance to mix and talk with friends or family.
Foreign tourists information source(s) used for eating out when on holiday
To address the second objective of the study, Spearman’s Rank Correlation test
was conducted. The result of the hypothesis of Group B identified that there is a
significant relationship between information source(s) used and foreign tourists’
Preference for eating out at Ethnic Restaurant in Bangkok. Moreover, respondents
113

were asked to score, on the Likert scale, the influence of each of the 10 given
information sources used for eating out when on holiday. It was divided into two
types of information sources (print media, internet and restaurant characteristics)
analyzed as follows:
Print media and Internet
To investigate the effect of print media and internet, respondents were asked
questions concerning the degree to five types of information sources which are
restaurant review in the newspaper, food guides and magazines; advertisement in
newspaper, magazines or food guides; as well as restaurant information source(s)
form Internet.
As the finding was presented in table 5.19, most of the tourists reported
themselves typically relay and are being influenced by Advertisements in newspaper,
magazines or food guides (mean = 3.6025) and restaurant review in food guides
(mean = 3.5100). Internet and restaurant review are similar in influential level by
means score of 3.2300, 3.2200, respectively. Restaurant review was rated the lowest
influence factor of all information sources.
Furthermore, table 5.18 shows that 45.8% of respondents had neutral opinion
about the use of internet to select a restaurant for eating out. It is noteworthy that
Internet has gained widespread acceptance as a communicating tool and information
source. Even restaurant information source from internet was rated as moderate
influence information source(s), but still a total of 35.8% of the respondents typically
rely on it to make choice of restaurant for eating out when on holiday. Therefore, it is
important that restaurateurs can invest to create some restaurant websites. .
Restaurant Characteristics
114

As the finding presented in table 5.25 indicated that most of the respondents
make their choice for eating out at restaurant based on perceptions they obtained from
actually seeing the restaurant. Specifically, the display of menu in the window was the
most influential characteristics of restaurant by mean score of 4.2450. This visual
aspect can encourage and deter respondents entering restaurants. Furthermore, the
other aspects were important as atmosphere, specialty food featured in the menu, wide
variety of food in the menu and restaurant 1ooking busy.
Finally, The results shown that Asian and Western respondents have similar
perception about information sources used for eating out when on holiday and the
results indicated that restaurant characteristics exerted a stronger influence on
respondents’ choice of restaurant for eating out than print media and internet.
Foreign Tourists’ Perception of Importance of Influential Factors in
Preference of eating out at Ethnic Restaurant
To address the third objective of the study, Mann – Whitney U test was
conducted. The result of the hypothesis of Group C identified that there was a
difference in perception between Western and Asian foreign tourists’ preference for
eating out at ethnic restaurant in Bangkok. Significant differences were found in
several influential factors:
Asian respondents were under higher influenced than Western respondents
for eating out at ethnic restaurant in Bangkok by the following factors: Taste
of Food, Personal Preference; Cues of Authentic Cooking
Western respondents were under higher influenced than Asian respondents
for eating out at ethnic restaurant in Bangkok on the following factors:
Appearance of ethnic food, Healthy Alternative, Language, Menu Choice.
115

Moreover, Culture Cues in the décor and atmosphere, Culture Familiarity and
ethnic food Difficult Prepare at home were three significant factors which all
respondents have expressed with similar opinions.
6.3 Recommendations
This study provides information which facilitates a better understanding of
foreign tourists and their need that can carry out the marketing strategies to improve
visitor satisfaction and information communication tools that can be implemented to
improve ethnic restaurant business. The following recommendations are suggested for
ethnic restaurants in Bangkok:
Recommendations toward Motivations for eating out at Ethnic Restaurant
According to the result of tourists’ motivations for eating out when on holiday,
the most important motivation stated was ‘discovery’ (i.e. trying new or different
foods). Managers of ethnic restaurants and their staff must be aware that tourists
toward to ethnic cuisine. Thus, the food should come with the tastes of the nation and
do something different or surprise, that foreign tourist do not feel the food does not
reflect like a common local food. ‘Relaxation’, ‘indulgence’ and ‘experience’ were
perceived as similarly important motivations, so that ethnic restaurant should know
that foreign tourists expect to get rest /relaxation from their dining experience, so
friendly and attractive services in a relaxing environment are important attributes to
provide. Particularly, attractive culture cues should be visible. Interestingly, ‘healthy
foods’ were also seen as important. It may because of a trend toward ‘natural’ and
‘farm fresh’ foods. Ethnic restaurant manager could add some healthy, low fat and
vegetarian items on the menu.
116

Recommendations toward information source(s) used for eating out at ethnic
restaurant when on holiday
Print Media and Internet
According to the results, the information source used (print media and
internet) played a main role among tourists for eating out when on holiday. Print
media, in particular, restaurant reviews in tourist food guide and advertisement in
newspaper, magazines and tourist food guide are more important information sources
for foreign tourists. It indicated that how effective is the medium for restaurant
marketing? Are tourists using those information sources, and does it influence their
restaurant choice for eating out when on holiday? Therefore, ethnic restaurant
managers should provide restaurant information and advertisement in tourist food
guide magazines which foreign tourists typically use in order to their restaurant can be
selected.
Further, from the findings of this study, approximately 35.8% of the
respondents typically rely on internet to make their choice of restaurant for eating out
when on holiday. This trend of the usage of internet indicated that it is necessary that
restaurateurs invest their restaurant websites or some online search engines.
Restaurant Characteristics
According to the results of information source used (restaurant characteristics)
for eating out when on holiday, display of menu in the window, was the most
influential restaurant characteristics. Thus ethnic restaurant managers should make
sure that the menu of specialty ethnic food is displayed in a manner that gives tourists
easy access to it before entering. Atmosphere, wide variety of food in the menu and
117

looking busy are very important for ethnic restaurants, so that managers should make
sure their restaurants have an attractive street appeal with unique ethnic culture cues.
During the business in slow period, guests should also be seated in the front of the
restaurant to give the restaurant the appearance of being busy. If conditions permit,
outside dining can also be used to draw foreign tourists’ attention to the restaurant.
Additionally, ‘word of moth recommendation from family and/ or friends’ and
recommendations from local people or business in the area’ emerged as important
information sources on which foreign tourists rely in their choice of restaurant.
Restaurant should try to manage word of mouth by encouraging guests who praise the
restaurant to tell their friend about the restaurant. Since tourists seek advice from
locals, so it is important for restaurant to gain the favour of locals. Ethnic restaurants
should invite hotel front desk clerks, hotel stuff, and operators of tourist activities to
try the restaurant free of charge, since these people can influence foreign tourists’
choice of ethnic restaurants.
Recommendation toward tourists’ preference for eating out at ethnic
restaurant in Bangkok
According to the result of tourists’ preference for eating out at ethnic
restaurant, there was a difference in perception between Western and Asian foreign
tourists’ preference for eating out at ethnic restaurant in Bangkok. Thus, the following
suggestions were divided into two parts:
Because of taste of food, personal preference, cues of authentic cooking
have higher influence on Asian respondents’ preference for eating out at
ethnic restaurants than Western respondents. Asian tourists tend to like hot,
118

pungent food, and have a higher tolerance for spicier food. Therefore, ethnic
restaurant should do a real good job to provide the authentic ethnic food in
order to satisfy their requirements. If conditions permit, native chefs should
cook the food as a visible way.
For Western respondents, appearance of ethnic food; healthy alternative;
menu choice, language, have higher influence on their preference for eating
out at ethnic restaurants than Western respondents. Therefore, ethnic
restaurants should provide many of the menu options with healthy
alternatives (low- fat items, vegetarian choice), then, preparing those types
of foods in a pleasant flavor and beautiful appearance. Additionally, it is
necessary for a menu that explains the dishes’ ingredients in understandable
English.
Furthermore, ethnic restaurant manager should also be aware the power of
‘cultural atmosphere’ and ‘cultural familiarity’, then make the restaurant in the
cultural style of their country or regions. Most of foreign tourists are interested in
those types of restaurant for both of the ‘culture experience’ and ‘culture familiarity.
Overall, ethnic restaurant owners and managers need to keep in mind that
tourists may base their travel destination choice on the variety and quality of
restaurants which a destination has to offer, so given the important role that ethnic
restaurants play in Bangkok’s attractiveness, it is important that Bangkok’s tourism
marketers and ethnic restaurant managers work together to ensure foreign tourists’
experiences at Bangkok can include a great dining experience.
6.4 Suggestion for further research
This research is to investigate the relationship of foreign tourists’ motivations,
119

information source used and their preference of eating out at ethnic restaurant in
Bangkok. It also studies the relative importance level of this two effecting factors and
identifies the difference in perception between Asian and Western tourists for eating
out at ethnic restaurant in Bangkok. Understanding of foreign tourists’ need is
beneficial to restaurant business. Therefore, the researcher has the following
recommend for further studies:
Firstly, according to the scope and limitation of this study, the researcher
studies only ethnic restaurant and does not focus specific types of ethnic restaurant.
Further research can be conducted with other types of restaurants or only one type of
ethnic restaurant, such as Thai ethnic restaurant etc. Secondly, this research studies
only foreign tourists (Western and Asian). Further study can be conducted with Thai
domestic tourists. Thirdly, this research examined only foreign free independent
tourists who have visited ethnic restaurants in Bangkok. Further research may be
extended to other areas of Thailand or focus other groups of foreign tourist, such as
business travelers. Fourthly, this researcher studies only foreign tourists’ motivation
and information source(s) used effecting their preference for eating out at ethnic
restaurant. Further study can be conducted with other types of effecting factors, such
as word of mouth, advertisement in the TV program, and the influence of restaurant
brand.
120

BIBLIOGRAPHY
Ahmad, J. L. (1996). Marketing and Strategy Section. British Food Journal Volume,
98 Number 10 pp.12-26
Anner, H. and Magda, A. C. (2000). Food for Tourists: determinants of an image. The
International Journal of Tourism Research 2: 281-293.
Antonioli C. M. (1995). Enoturismo: Caratteristiche della domanda, strategie dell’
offerta e aspetti territoriali e ambientali. Franco Angeli: Milano
Antonioli C. M. (1999). Strade del vino ed enoturisms. Distretti turistici e vie di
communicazione, Franoco Angeli: Milano.
Arthur, M. & Mitchell, E. (2002). The Complete Guide to Foodservice in Cultural
Institutions: keys to success in restaurants. New York: Dryden Press.
121
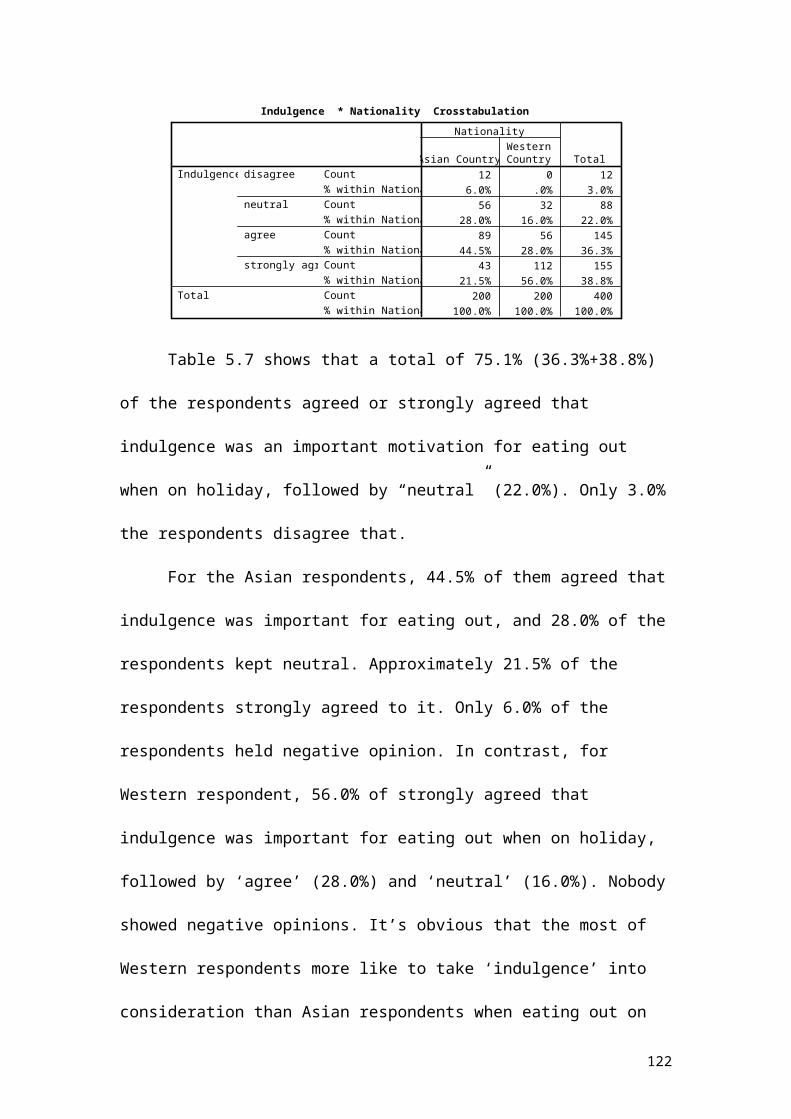
Atila, Y. & Fisen, Y. (2002). Measurement of tourist satisfaction with restaurant
service: A segment – based approach. Journal of Vacation Marketing. Londib:
Dec. Vol. 9, lss. 1; pg. 52, 17 pgs.
Au, N & Law, R. {2002}. Categorical classification of tourism dinning. Annals of
Tourism Research. 29(3): 819 – 833.
Bare. (1959). Journal of Comparative and Physiological Psychology, 52, 129-131,
Bare. & Cicala. (1960). Journal of Comparative and Physiological Psychology, 53,
151-154,
Belk, R. W. (1975), an Exploratory Assessment of Situational Effects in Buyer
Behavior. Journal of Marketing Research, 11, 156-163.
Beverley, S. & Stefanie, K. (2003). Restaurant and the Tourist Market. International
Journal of Contemporary Hospitality Management. Volume15 Number 1 pp. 6-13.
Bharath M. J. (2004). Tandoori tastes: perceptions of Indian restaurants in America.
International Journal of Contemporary Hospitality Management Volume 16
Number 1 2004 pp. 18-26
Carter, A. (1971). Mass Media, Macmillan, London.
Clark, M, Riley, M. and Wood, R. C. (1998). Researching and Writing Dissertations in
Hospitality and Tourism. Thomson International Business Press, London
Domestic Restaurant Business. (2004). Business brief: Continuous Expansion,
122

Adjusting Strategies. Bangkok: Kasikorn Research Center Co.,Ltd
Davis, B. & Stone, S. (1991). Food and Beverage Management, 2nd Ed, the Bath
Press, Avon.
Davis, D. & Consenza, R. M. (1993). Business Research for Decision Making. PWS-
Kent Publishing: Boston.
Dulen, J. {1999}. Quality control: Restaurants and Institutions. 109, 5, 38 – 41.
Elmont, S. (1995). Tourism and food service: two sides of the same coin. Comell
Hotel and Restaurant Administration Quarterly. 36(1). 57. 63
Erik, C. & Nir, A. (2004). Food in Tourism: Attraction and Impediment. Annals of
Tourism Research, Vol. 31, No. 4, pp. 755–778, Elsevier Ltd: Great Britain
Finkelstein, J. (1989). Dining Out: Sociology of Modern Manners. Polity: Oxford.
Fuller, J. and Waller, K. (1995). The Menu, Food and Profit. Allyn and Bacon:
London.
Filedhouse. P. (1995). Food and nutrition, Customer and culture. 2nd Ed. Champman
Hall: London
Goodrich, J. N. (1978,). The relationship between preferences for and perceptions of
vacation destinations: Application of a choice model. Journal of Travel Research ,
18 , 7-11.
123

Goldstein, T. (1995). “Dimensions of an attribute’. Marketing Research, Vol. 7 No. 3,
p. 19.
Hall C. M. and Mitchell, R. (2001a). Wine and food tourism. In special Interest
Tourism : Context and Cases . Douglas: Wiley.
Iqbal, S. (1996). Ethnic foods - the allure for the consumer. Foodinfo, IFIS
Newsletter, 7
Iso-Ahola, S. E. (1980). The social psychology of leisure and recreation. Wm. C.
Brown.
Jaksa, J. K. (1997). Restaurant Marketing: selection and segmentation in Hong Kong.
International Journal of Contemporary Hospitality Management. 9/3 116 – 123.
Johson, G. (1998). Wine tourism in New Zealand – a national survey of wineries.
Unpublished Diploma in Tourism dissertation, University of Otago.
June, L. P. and Smith, S. L. J. (1987). Service Attributes and Situational Effects on
Customer Preferences for Restaurant Dining. Journal of Travel Research, 24(2)
22-23.
Keith, W. (1996) Hospitality Managers’ pockets Books: Improving Food and
Beverage Performance. Butterworth-Heinemann: Oxford.
Kuznesof, S. (1997). Regional foods: a consumer perspective. British Food Journal.
124

99(6): 199-206.
Lewis, R. C. (2000). Marketing Leadership in Hospitality Foundations and Practices.
Third Edition, New York: John Wiley & Sons, Inc.
Long, L. M. (1998a). Introduction to the special issue on culinary tourism. Sourthern
Folklore. 55(3):179-180.
Marshall, D. (19985). Food Choice and the Consumer. London. Blackie Academic &
professional.
Marta, P. (2001). What Information do Customers use when choosing a Restaurant?
International Journal of Contemporary Hospitality Management. Volume 13
Number 6. pp. 316 – 318.
Marvin, B., (1992). Restaurant Basics: Why Guests don’t come back and what you
Can Do about it. John Wiley & Sons, New York, NY.
Mayo, E. J. and Jarvis, L. P. (1984). The Psychology of Leisure Travel. CBI
Publishing Co., Boston, Massachusetts.
McKee, L. M. (1990). Genetic and environmental origins of food patterns. Nutrition
Today. Sept/Oct, pp. 26-31.
Mennell, S. (1985). All Manners of Food. Eating and Taste in England and France
125

from the Middle Ages to the Present. Basil Blackwell: Oxford.
Michael H. C. (2003). Food Tourism around the World: development, management,
and markets. Butterworth-Heinemann: Oxford.
Minna, S. (2000). Library Glossary of Library Research Terms. Millikin University
Board of Trustees: Fort Lewis College, Durango, Colorad.
Moutinho, L. (1987). Consumer Behavior in Tourism. European Journal of
Marketing, 21(10), 1987, pp. 1 – 44.
Myers, R. H. (1990). Classical and Modern Regression with Applications. PWS-Kent
Publishing Company.
Murphy, J. (1996). Restaurant marketing on the worldwide web. Cornell hotel and
Restaurant Administration Quarterly, 37 (1): 61-71.
National Restaurant Association. (1983). Consumer expectations with regard to
dining
At family restaurants. Washington, DC: National Restaurant Association Research
And Information Service Department.
Nielsen, C. (2001). Tourism and the Media: tourist decision-making, information, and
communication. Hospitality Press Pty Ltd: Elsternwick VIC 3185
126

Oldenburg, R. (1989): The great good place, Addison Wesley publishing company,
New York.
Powers, T. and Barrows, C. W. (1999). The restaurant business: introduction to the
hospitality industry. pp. 64-88, New York: John Wiley & Sons.
Penaloza, L. (1994). Atravesando fronteras/border crossings: a critical ethnographic
exploration of the consumer acculturation of Mexican immigrants. Journal of
Consumer Research. 21, 289-94 .
Paul, R. D. (1997). Dimensions of the hospitality industry. Prentice-Hall. International
Editions.
Pine, B. J. (1998). Welcome to the experience economy. Harvard Business Review.
76(4): 97-105
Reynolds, P. (1993). Food and tourism: towards an understanding of sustainable
culture. Journal of Sustainable Tourism, 1(1), 48-54.
Rolls & Rowe. (1982). Physiology and Behavior, 29, 409-417.
Reilly, R. (1990). Effective Communication in the Travel Industry, Delmar Publishers
(Merton House Travel & Tourism Publishers), USA.
Sekaran, U. (1992). Research Methods for Business – A skill building approach (2nd
Ed). United States of America: John Wiley & Sons, Inc.
127

Shane M. C. (2005). How to shop in the UK: A guide for people coming to live in the.
Japan: Takamatsu.
Spark, B. A. & Bowen, J. T. (2001). Restaurant as a contributor to tourism destination
attractiveness, Australian Journal of Hospitality Management 7(2): 17 – 30.
Smith, D.L. (1988). Service: Managing the guest experience. New York: Chain Store
Publishing.
Stephen W. L. (2005). Tourists’ use of restaurant WebPages: is the internet a critical
marketing tool? Journal of Vacation Marketing. London: Apr. Vol. 11, Iss. 2; pg.
155, 7 pgs
Susheela, U. (1998). Food Product Design: New ethnic entrees. Northbrook, IL :
Weeks Publishing Co.
Van, H. B. (1999). ‘Newsline’, Restaurant Business, 98,3,21
Verma, R. (1999). Designing and positioning food service for multicultural markets.
Cornell Hotel and Restaurant Administration Quarterly. 40(6):76-87.
Wood, R. (2000). Strategic Questions in Food and Beverage Management.
Butterworth-Heinemann.
Warde, A. (1996). Consumption, Food and Taste: Culinary Antinomies and
128

Commodity Culture. London: Sage.
Warde, A. (2000) Eating out: Social Differentiation, Consumption and Pleasure.
Cambridge: Cambridge University Press.
Zikmund, W. G. (1997). Business Research Methods (4 th Ed.) New York: Dryden
press.
Zikmund, W. G. (2003). Business Research Methods (6 th Ed.). New York: Dryden
press.
Online Source
Australian Bureau of Statistics. (2000). www.abs.gov.au Last accessed on 15/07/05
Restaurant USA Magazine, (2000) www.restaurant.org last accessed on 17/07/05
Moy, A. L. (1998), http://2028.harvard.net last accessed on 20/08//05
Tourism New Zealand (2001a) www.tourisminfo.govtnz last accessed on 20/07/05
Entrepreneur (2005) cited from http://www.entrepreneur.com last access on22/07/05
Columbia Education. (1998). www.gsb.columbia.edu last accessed on 02/09/05
www.thaiwaysmagazine.com last accessed on 26/07/05
www.fas.usda.gov last accessed on 30/07/05
www.tamu.edu last accessed on 02/08/05
www.deloitte.com last accessed on 04/08/05
http://en.wikipedia.org last accessed on 04/08/05
www.answers.com last accessed on 04/08/05
http://wordnet.princeton.edu last accessed on 06/08/05
www.thefreedictionary.com last accessed on 22/08/05
129

www.readtolearn.org last accessed on 30/10/05
www.smartpages.com last accessed on 05/11/05).
www.thaiconnections.co.uk last accessed on 05/11/05
www.bangkok.com last accessed on 05/11/05
www.jref.com last accessed on 05/11/05
Appendix A มหาวทิยาลัยอัสสมัชญั
ASSUMPTIONUNIVERSITY
Questionnaire
This questionnaire is designed to study about “foreign tourists’ motivation
and information source (s) used effecting their preference of eating out at ethnic
restaurant in Bangkok”. The questionnaire is a requirement as partial fulfillment for
the Degree of MBA in Tourism Management Program Graduate School of Business
Assumption University of Thailand.
This survey will be serving as reference for educational purposes only. Your
answer will be highly appreciated. All the collected information will be kept
confidential. Thank you for your cooperation.
Part I Tourists’ motivation and information source (s) used for eating out at
restaurant while on holiday
Instruction: please tick (√) the one, which represents most in your opinion.
130

(1-5scale: where 5=strongly agree, 4=agree, 3=neutral. 2=disagree, 1=strongly
disagree)
1. Tourists’ motivations for eating out while on holiday
Question 5 4 3 2 1
1 Have a good meal or Just the feeling of spoiling yourself
2 Comfort of not having to cook by yourself
3 Eating out is part of the overall holiday experience
4 Trying new/different foods you would not cook by yourself
5 The chance to mix and talk with friends and family
6 Eating healthy food
2. Information Source (s) used for eating out at Restaurant while on holiday
Instruction: please tick (√) the one which represents most in your opinion.
(5=strongly agree, 4=agree, 3=neutral. 2=disagree, 1=strongly disagree)
Question
A Information source (s) ( Print Media and Internet) 5 4 3 2 1
7 Restaurant review in the newspaper
8 Restaurant review in food guides
9 Restaurant review in magazines
10 Advertisement in newspaper, magazines or food guides
11 Restaurant information from Internet
B Information Source(s) (restaurant characteristics) 5 4 3 2 1
12 Display of menu in the window
13 Evidence of wide variety of food in the menu
14 Evidence of specialty food featured in the menu
15 The restaurant looking busy
16 The restaurant having an attractive décor or atmosphere
Part II Factors that influence Foreign Tourists’ Preference for eating out at
Ethnic Restaurant
Instruction: please rate the degree of influence of the following items on your
131

preference for eating out at ethnic restaurants.
(5 = Very high Influence, 4 = High Influence, 3 = Moderate Influence, 2 = Low
Influence, 1 = Very Low Influence)
Question 5. 4 3 2 1
17 I would like to taste the ethnic food
18 I have personal preference for ethnic food
19 Appearance of ethnic food attract me
20 I find culture familiarity by choosing ethnic food
21 Ethnic food provides healthy alternatives
22 Ethnic food are difficult to prepare by tourists
23 Ethnic food provides lots of variety-selecting for everyone
24 Sophisticated cultural cues in the décor and atmosphere are
visible in ethnic restaurant
25 Servers able to speak the language of the country
producing the ethnic cuisine
26 Cues of authentic cooking is possible at ethnic restaurant
Part III Personal information
Instruction: please tick (√) the one which represents most in your opinion.
l. Gender
( ) female ( ) male
2. Age
( ) under 20 years old ( ) 20-29 years old ( ) 30-39 years old
( ) 40-49 years old ( ) above 50 years old
3. Education
( ) secondary/high school or lower ( ) certificate/diploma
( ) bachelor’s degree ( ) master’s degree
( ) higher than master’s degree
4. Occupation
( ) government officer ( ) Employer/Manager ( ) company employee
( ) own business ( ) professional ( ) others
5. Monthly personal income
( ) less than US$ 200 ( ) US$201 ~ US$500 ( ) US$501 ~US$800
132

( ) US$801 ~ US$1000 ( ) more than US$1000
6. Nationality: 1) Asian Country ( ) 2) Western Country ( )
3) Others (Please specify) ___________________________________
7. Food preference: What kind of ethnic food you prefer to eat most when eating out
at ethnic restaurant in Bangkok.
Instruction: please tick (√) the one which represents most in your opinion.
Thai ( ) Japanese ( ) Chinese ( ) Mexican ( ) Italian ( ) Indian ( ) American ( )
English ( ) French ( ) German ( ) Korean ( ) Mediterranean ( ) Vietnamese ( ).
Others ___________________
Thank you for your precious time!
Appendix B
List of the Ethnic Restaurant in Bangkok
RESTAURANTS WITH THAI CLASSICAL DANCES
BAAN THAI 7 Sukhumvit Soi 32, Tel.258-5403, 258-9517
COSMO 5/1 Sukhumvit Soi 62, Tel.391 -8885
MANEEYA'S LOTUS ROOM Ploenchit Road, Tel.282-6312
NOPAKAO Chao Phraya Restaurant, Arun Amarin Road, Tel.424-2389
SALA RIM NAM Opposite the Oriental Hotel, Charoen Nakhon Road,
Tel.437-9417
PIMAN 46 Sukhumvit Soi 49, Tel.258-7866
RUEN THEP Silom Village, Silom Road, Tel.233-9447
SALA SABAI Royal Orchid Sheraton Hotel, Tel.266-0139
SALA THAI Indra Regent Hotel, Ratchaprarop Road, Tel.-208-0022
SAWASDEE 66 Soi Phiphat, Sathon Road, Tel.237-6310
133

SUWANAHONG Si Ayutthaya Road, Tel.245-4448
TAM-NAK-THAI 231 Ratchadaphisek Road, Tel.274-6420-22
THAI PAVILION Holiday Inn Crowne Plaza Hotel, Silom Road, Tel.238-4300
THAI
BAN NANG THAI 91 Sukhumvit Soi 24,Tel.259-5170-1
BAN NANTHIDA 110/26 Soi Santhiniwet, Lat Phrao Road, Tel.377-6547
BAN KHUN LUANG 131/4 Khao Road, Dusit, Tel.241 -0928
BUATONG 30 Ratchadaphisek Road, Tel.245-5545
CABBAGE AND CONDOM Sukhumvit Soi 12,Tel.229-4610-28 ext.160
GREEN TAMARIND 239 Soi Thong Lo, Sukhumvit Road, Tel. 391 -8703
KUMLUANG 560 Asok-Dindaeng Road, Tel.246-3272-3
KHRUA RAKHANG THONG 256 Soi Wat Rakhang, Tel.411 -1183
KHRUA SATHON 240/4-6 Siam Square Soi 2, Tel.251 -0547
KUMPUN 59 Sukhumvit Soi 63, Tel.392-2921
KUP KHAM 208-210 Siam Square Soi 1, Tel.254-7266-7
LEMON GRASS 5/1 Sukhumvit Soi 24, Tel.258-8637
MAI MOG Phahonyothin Road, Tel. 279-4367
NATHONG Ratchadaphisek Road, Tel.246-2160-1
OAM THONG 8 Sukumvit 33, Bangkok. Tel: 279-5958.
RUAN PHAE 688/215 Charan Sanitwong Road, Tel.424-0240
TUM NAK THAI 131 Ratchadaphisek Road, Tel.274-6420-2
WICHIT 77/2 Ratchadamnoen Klang Avenue, Tel.281 -6472
BRITISH
134

BARBICAN 9/4 Soi Thaniya, Silom Road, Tel.233-4141 -2
OFFSHORE FISH AND CHIPS 7/8 Sukhumvit Soi 23, Tel.661 -7830
BURMESE
MANDALAY 23/17 Soi Ruam Rudi, Tel.255-2893
CHINESE
BANGKOK SHARK FIN 218/3-4 Siam Square Soi 1, Tel.251 -0987, 250-
0976
CHAO SUA 6th Floor World Trade Center, Tel.255-9648-52
GREAT SHANGHAI 648-52 Sukhumvit Soi 24, Tel. 258-7042, 258-8742
KUILIN 802 Asok-Din Deang Road, Tel.245-5885, 247-7070
MARINA 216/1 -6 Siam Square Soi 1, Tel.251 -1968
RINCOME Silom Road
PONG LEE 10/1 -4 Victory Monument, Tel.245-2352, 245-0040
ROYAL DRAGON 35/222 Mu 4 Bangna-trat Road, Tel. 398-0037-43
SCALA SHARK FIN 218-218/1 Siam Square Soi 1, Tel.254-1699, 252-0322
SILOM 739 Silom Road, Tel.236-4442-3
SILVER PALACE 5 Soi Phipat, Silom Road, Tel.235-5118-9
SING BEE SHARK FIN 149/9 Sap Intersection, Surawong Road, Tel.236-
7825
FRENCH
CHEZ JEAN 220/4 Sukhumvit Soi 1, Tel.252-0311
LA GRENOUILLE CHEZ ROBERTO 36 Sukhumvit Soi 18, Tel.258-1327
135

COSMOPOLITAN 4-10 Sukhumvit Soi 24, Tel.258-8640
L'HEXAGONE 4 Soi Thong Lo, Sukhumvit Soi 55, Tel.381 -2187
KANIT 68 Ti Thong Road, Tel.222-2020
LA CIGALE Chan Isara Tower, Silom, Tel.234-8016
LA PALOMA 26-2 Mahesak Road, Silom, Tel.233-3853
LE METROPOLITAIN 74 Sukhumvit Soi 63, Tel. 391 -3331
ORANGERY 48/11 Soi Ruam Rudi, Phloenchit Road, Tel.253-6941
GERMAN
BEI OTTO 1 Sukhumvit Soi 20, Tel. 262-0892, 258-1495
BIERSTUBE 569 Sukhumvit Road, between Soi 31 -33, Tel.260-4326
COTTAGE Silom Soi 2, Tel.632-7223
HAUS MUENCHEN 4 Sukhumvit Soi 15, Tel.252-5776
RASSTUBE Goethe Institute, Tel.287-2822
SINGHA BIER HOUSE Sukhumvit Soi 21, Asoke, Tel. 258-3951
INDIAN
AKBAR 1/4 Sukhumvit Soi 3, Tel.253-3479, 255-6935
BANGKOK BRINDAWAN 41/1 Silom Soi 19, Tel.233-4791
CEDAR 4/1 Sukhumvit Soi 49/9, Tel.391 -4482
DEAN 545/3 Silom Road, Tel.234-8407
MOGHUL ROOM 1/16 Sukhumvit Soi 11, Tel.253-6989, 255-4466
PETRA 75/4 Sukhumvit Soi 3/1, Nana Nua, Tel. 254-9226-7, 655-5230
ROYAL INDIA 392/1 Chak Phet Road, Tel.221 -6565-6
SABU MUSLIM 17-19 Pramuan Road, Silom, Tel.233-3047
136

SADEF 79/6 Sukhumvit Soi 3/1, Nana Nua, Tel.655-5258, 256-0103
INDONESIAN
BALI INDONESIAN 15/3 SOI Ruam Rudi, Phloenchit, Tel.250-0711
BATAVIA SATAY HOUSE 1/2 Convent Road, Tel.266-7164
ISRAELI
CHABAD HOUSE 108/1 Soi Ramb :ilri, Banglamphu, Tel.282-6388
CHOCHANA 86 Chakkraphong Road, Banglamphu, Tel.282-9948
CHOCHANA 1 st Floor, Bossotel Inn, Tel.235-8001, 233-2474
ITALIAN
IL COLOSSEO 578-580 Phloenchit Road, Tel.251 -1936
ITALIAN PAVILION 19 Soi Nana Tai, Sukhumvit Road, Tel.250-1550
L'OPERA 53 Sukhumvit Soi 39, Tel.258-5606
LA FONTANA 1 st Floor, World Trade Centre, Tel.255-9534
PAN PAN ITALIAN 45 Soi Lang Suan, Phloenchit, Tel.252-7104
RISTORANTE SORRENT 66 North Sathon Road, Tel.234-9841
SARA JANE'S 24 Convent Road,Tel.234-0913
SPAGHETTI LAND Siam Square Soi 6, Tel. 251 -0762
TOTO 217 Sukhumvit Soi 63, Tel.391 -3797
TRATTORIA DA ROBERTO Plaza Building, Patpong Soi 2, Tel. 234-5987
JAPANESE
AOYAMA 960/1 Rama 4 Road, Tel.233-4832
137

DAIDOMON Siam Square Soi 5, Tel.252-52479
DAIKICHI 113 Thong Lo, Sukhumvit Soi 55, Tel.714-9350
FUJI Central Latphrao, Tel.541 -1281
2nd Floor Central City Bangna, Tel. 361-0861
Central Plaza Pinklao , Tel.884-8140
HANAYA 683 Si Phaya Road, Bangrak, Tel.234-8095, 233-3080
JINYA U.F.M. Fuji Supermarket Sukhumvit Soi 33/1, Tel.259-0620
KOBE STEAK HOUSE 460 Siam Square Soi 7, Tel.250-1417, 250-1615
NEW KOBE Ground Floor, Trinity Complex, Soi Piphat 2, Tel.231 -5294
SHINDAIKOKU Opposite Sino Thai Building, Asok Road, Tel.254-9980-4
SUCHI TSUKIJI 62/19-20 Thaniya Road, Silom Bangrak, Tel.233-9698
TORAYA 108/9 Sukhumvit Soi 49, Tel.392-0355
UOKUNI 7th Fl.,., Mah Boonkrong Center, Tel.217-9412,217-9589
KOREAN
ARIRANG 106-8 Silom Road, Tel.234-1096
KOREA HOUSE 57/23 Wireless Road, Tel.252-2589
KOREANA 446-450 Siam Square Soi 7, Tel.252-9398
MYUNG DONG 128/4-5 Silom Soi 6, Tel.235-6208-9
NEW KOREA 41/1 Sukhumvit Soi 19, Tel.251 -5273
MEXICAN
CHARLEY BROWN'S Near the Town in Town Hotel, Latphrao Soi 94,
Tel.530-3713
EL GORDO'S Silom Soi 8, Tel.234-5470
138

SENOR PICO'S Rembrant Hotel, Sukhumvit Soi 18, Tel.261 -7100
SPANISH
OLE OLE 365/11 Soi Phayanak, Phayathai Road, Tel.216-0524
SWISS
CAFE SWISS Swiss Lodge, Convent Road, Tel.233-5345
LAGUNA FONDUE Sukhumvit Soi 38, Soi Saeng Chan, Tel.391 -1720
BODENSEE Sukhumvit Soi 19, Tel.254-5816
HEIDELBERG Sukhumvit Soi 4, Tel.252-3584
VIETNAMESE
KHUN CHERIE 593/13-14 Sukhumvit 33/1, Tel.258-5060, 258-5058
LE CAM-LY 2nd Fl, Patpong Building. Tel.234-0290
LE DALAT 47/1 Sukhumvit 23, Tel.258-4192, 206-1849
LE DANANG Central Plaza Hotel, Phahonyothin, Tel.541 -1234
SAIGON Asia Hotel, Phayathai Road, Tel.215-0808
Si Wiang Road, off Pramuan Road, Silom, Tel.234-1889, 238-3088
VIETNAM 82-84 Silom Road, (Silom Soi 4), Tel.234-6174, 235-2124
Khun Cherie on Soi 31 and Tan Dinh at Ruam Rudi Village 02 650 8986
American
BOURBON STREET, Sukhumvit Soi 22, (behind Washington Sq.) Tel.02-259
0328.
HAMITLTON’S STEAK HOUSE Dusit Thani Hotel, Tel. 02 236 0450-9
139
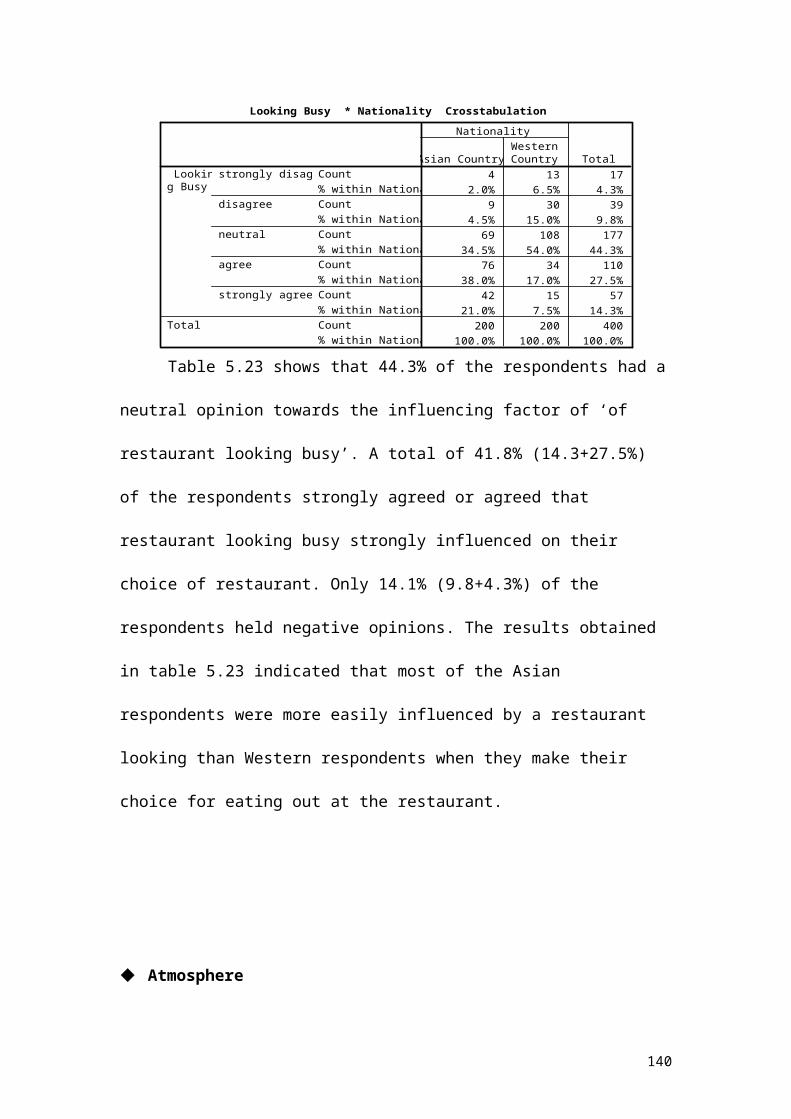
Appendix C
SPSS Output
Food Preference * Nationality Crosstabulation
103 73 17651.5% 36.5% 44.0%
26 7 3313.0% 3.5% 8.3%
21 31 5210.5% 15.5% 13.0%
18 40 589.0% 20.0% 14.5%
15 19 347.5% 9.5% 8.5%
7 16 233.5% 8.0% 5.8%
5 10 152.5% 5.0% 3.8%
5 4 92.5% 2.0% 2.3%200 200 400
100.0% 100.0% 100.0%
Count% within NationalityCount% within NationalityCount% within NationalityCount% within NationalityCount% within NationalityCount% within NationalityCount% within NationalityCount% within NationalityCount% within Nationality
Thai
Japanese
Chinese
Indian
Italian
Mexican
French
others
FoodPreference
Total
Asian CountryWesternCountry
Nationality
Total
140

Descriptive Statistics
400 2.00 5.00 4.1075 .84719400 2.00 5.00 4.2625 .72450400 1.00 5.00 4.1850 .77607400 1.00 5.00 4.3550 .78455400 1.00 5.00 3.6750 1.08041400 1.00 5.00 3.8625 .96744400
IndulgenceRelaxationExperienceDiscoverySocial ReasonHealthy FoodValid N (listwise)
N Minimum Maximum Mean Std. Deviation
Descriptive Statistics
400 1.00 5.00 2.6275 1.07547400 1.00 5.00 3.5100 1.11490400 1.00 5.00 3.2200 1.01695400 1.00 5.00 3.6025 1.13698400 1.00 5.00 3.2300 1.04154400
Reviw - NewspapersReview - Food guidesReview - MagazinesAdvertisementInternetValid N (listwise)
N Minimum Maximum Mean Std. Deviation
Descriptive Statistics
400 2.00 5.00 4.2450 .75591400 2.00 5.00 3.8250 .82527400 1.00 5.00 3.9050 .80784400 1.00 5.00 3.3775 .98612400 2.00 5.00 4.2250 .84032400
Dispaly of MenuWide Variety of FoodSpecialty FoodLooking BusyD¨¦cor and AtmosphereValid N (listwise)
N Minimum Maximum Mean Std. Deviation
141