tourism western australia library/research and... · source: tourism research australia ... year...
TRANSCRIPT

Tourism Western Australia
INTERNATIONAL MARKETS SUMMARY
YEAR ENDING JUNE 2017
Prepared by the Research Team
September 2017

Tourism Western Australia
Page 2 International Markets Summary Year Ending June 2017
ABOUT THIS REPORT
This report profiles visitors to Western Australia from key international source markets; markets Western
Australia has a marketing presence in, as well as key emerging markets. The source of the data is Tourism
Research Australia’s International Visitor Survey (more details on page 16). As with all surveys, the
visitation estimates have an associated margin of error – see notes at the foot of each page for confidence
intervals that should be applied to the visitation estimates.
To jump to the profile page of a specific market, click on the hyperlinks below. To return to this page, click
‘back to top’ in the upper right hand corner of each page.
China pg. 3
Germany pg. 4
Hong Kong pg. 5
India pg. 6
Indonesia pg. 7
Japan pg. 8
Korea pg. 9
Malaysia pg. 10
New Zealand pg. 11
Singapore pg. 12
Switzerland pg. 13
United Kingdom pg. 14
United States of America pg. 15
Sources and Definitions pg. 16

Tourism Western Australia
Page 3 International Markets Summary Year Ending June 2017
CHINA1 (Back to top)
% Change 3 Year
AAGR▲ YE Jun-16 YE Jun-17 YE Jun-17
– YE Jun-16
WA
Estimated Spend ($ Mil) $244 $263 7.9% 13.3%
Estimated Visitors 47,800 51,100 6.9% 11.2%
Estimated Nights 1,964,500 2,068,800 5.3% 0.1%
National
Estimated Spend ($ Mil) $6,078 $7,184 18.2% 22.6%
Estimated Visitors 1,059,700 1,160,600 9.5% 15.9%
Estimated Nights 41,637,000 51,463,300 23.6% 18.3%
Source: Tourism Research Australia – International Visitor Survey (visitors aged 15+ years).
Note that estimates on this page are based on survey data and need to be considered with these Confidence Intervals. China Sample Size: 252, CI Visitors +/- 13.7%, CI Nights +/- 19.4%.
▲ AAGR = Average Annual Growth Rate
2,600
3,750
4,900
6,050
7,200
147
177
207
237
267
Estimated Spend ($m)
WA Australia
9%
2%
3%
7%
99%
0% 25% 50% 75% 100%
1
Visitor Dispersal
EP
ASW
ANW
AGO
ACC
540
750
960
1,170
27.5
33.5
39.5
45.5
51.5
Estimated Visitors ('000)
WA Australia
8%
16%
14%
27%
45%
0% 25% 50%
1
Purpose of Visit
Holiday
VFR
Business
Education
Other

Tourism Western Australia
Page 4 International Markets Summary Year Ending June 2017
GERMANY2 (Back to top)
% Change 3 Year
AAGR▲ YE Jun-16 YE Jun-17 YE Jun-17
– YE Jun-16
WA
Estimated Spend ($ Mil) $85 $76 -11.1% -0.7%
Estimated Visitors 35,200 35,300 0.3% 4.4%
Estimated Nights 1,157,200 1,088,100 -6.0% -1.1%
National
Estimated Spend ($ Mil) $692 $703 1.5% 9.4%
Estimated Visitors 187,900 202,400 7.7% 5.7%
Estimated Nights 9,518,800 9,347,000 -1.8% 6.4%
Source: Tourism Research Australia – International Visitor Survey (visitors aged 15+ years).
Note that estimates on this page are based on survey data and need to be considered with these Confidence Intervals. Germany Sample Size: 239, CI Visitors +/- 16.3% CI Nights +/- 25.9%.
▲ AAGR = Average Annual Growth Rate
520
558
596
634
672
710
58
65
72
79
86
Estimated Spend ($m)
WA Australia
36%
20%
27%
22%
96%
0% 25% 50% 75% 100%
1
Visitor Dispersal
EP
ASW
ANW
AGO
ACC
150
163
176
189
202
25.5
29.0
32.5
36.0
Estimated Visitors ('000)
WA Australia
10%
2%
6%
25%
77%
0% 25% 50% 75% 100%
1
Purpose of Visit
Holiday
VFR
Business
Education
Other

Tourism Western Australia
Page 5 International Markets Summary Year Ending June 2017
HONG KONG3 (Back to top)
% Change 3 Year
AAGR▲ YE Jun-16 YE Jun-17 YE Jun-17
– YE Jun-16
WA
Estimated Spend ($ Mil) $70 $100 42.6% 6.7%
Estimated Visitors 19,800 24,000 21.2% 14.5%
Estimated Nights 768,200 730,400 -4.9% -27.0%
National
Estimated Spend ($ Mil) $835 $962 15.3% 10.8%
Estimated Visitors 216,900 237,900 9.7% 12.9%
Estimated Nights 7,576,600 7,329,900 -3.3% -1.7%
Source: Tourism Research Australia – International Visitor Survey (visitors aged 15+ years).
Note that estimates on this page are based on survey data and need to be considered with these Confidence Intervals. Hong Kong Sample Size: 138, CI Visitors +/- 19.6%, CI Nights +/- 31.0%.
▲ AAGR = Average Annual Growth Rate
535
621
707
793
879
965
53
65
77
89
101
Estimated Spend ($m)
WA Australia
12%
5%
3%
18%
98%
0% 25% 50% 75% 100%
1
Visitor Dispersal
EP
ASW
ANW
AGO
ACC
139
164
189
214
239
14
16
18
20
22
24
Estimated Visitors ('000)
WA Australia
3%
10%
5%
38%
57%
0% 25% 50% 75%
1
Purpose of Visit
Holiday
VFR
Business
Education
Other
Tourism Western Australia
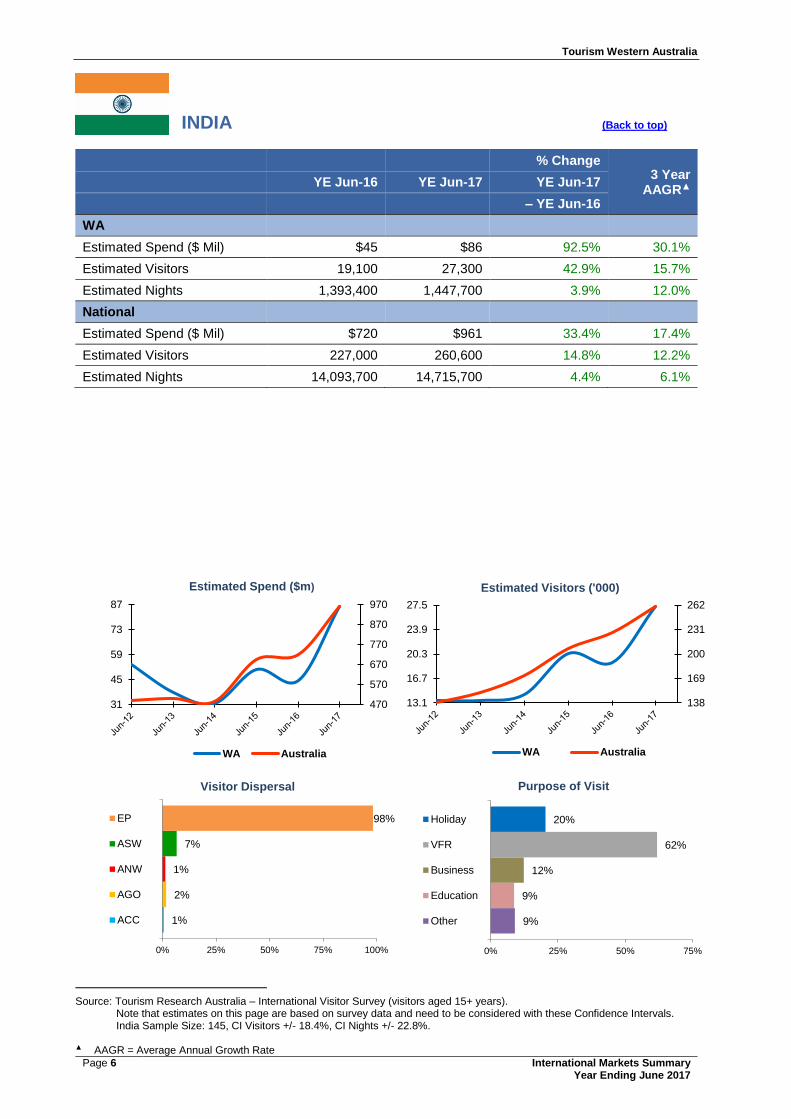
Page 6 International Markets Summary Year Ending June 2017
INDIA (Back to top)4
% Change 3 Year
AAGR▲ YE Jun-16 YE Jun-17 YE Jun-17
– YE Jun-16
WA
Estimated Spend ($ Mil) $45 $86 92.5% 30.1%
Estimated Visitors 19,100 27,300 42.9% 15.7%
Estimated Nights 1,393,400 1,447,700 3.9% 12.0%
National
Estimated Spend ($ Mil) $720 $961 33.4% 17.4%
Estimated Visitors 227,000 260,600 14.8% 12.2%
Estimated Nights 14,093,700 14,715,700 4.4% 6.1%
Source: Tourism Research Australia – International Visitor Survey (visitors aged 15+ years).
Note that estimates on this page are based on survey data and need to be considered with these Confidence Intervals. India Sample Size: 145, CI Visitors +/- 18.4%, CI Nights +/- 22.8%.
▲ AAGR = Average Annual Growth Rate
470
570
670
770
870
970
31
45
59
73
87
Estimated Spend ($m)
WA Australia
1%
2%
1%
7%
98%
0% 25% 50% 75% 100%
1
Visitor Dispersal
EP
ASW
ANW
AGO
ACC
138
169
200
231
262
13.1
16.7
20.3
23.9
27.5
Estimated Visitors ('000)
WA Australia
9%
9%
12%
62%
20%
0% 25% 50% 75%
1
Purpose of Visit
Holiday
VFR
Business
Education
Other

Tourism Western Australia
Page 7 International Markets Summary Year Ending June 2017
INDONESIA5 (Back to top)
% Change 3 Year
AAGR▲ YE Jun-16 YE Jun-17 YE Jun-17
– YE Jun-16
WA
Estimated Spend ($ Mil) $57 $66 16.4% -1.0%
Estimated Visitors 26,000 31,000 19.2% 7.2%
Estimated Nights 609,200 902,400 48.1% 12.4%
National
Estimated Spend ($ Mil) $536 $556 3.7% 12.6%
Estimated Visitors 140,800 172,800 22.7% 12.3%
Estimated Nights 4,659,600 5,076,400 8.9% 7.7%
Source: Tourism Research Australia – International Visitor Survey (visitors aged 15+ years).
Note that estimates on this page are based on survey data and need to be considered with these Confidence Intervals. Indonesia Sample Size: 196, CI Visitors +/- 17.3%, CI Nights +/-28.2%.
▲ AAGR = Average Annual Growth Rate
435
460
485
510
535
560
56
66
76
86
96
Estimated Spend ($m)
WA Australia
3%
1%
4%
11%
95%
0% 25% 50% 75% 100%
1
Visitor Dispersal
EP
ASW
ANW
AGO
ACC
119
130
141
152
163
174
25.7
27.5
29.3
31.1
Estimated Visitors ('000)
WA Australia
7%
8%
11%
45%
43%
0% 25% 50%
1
Purpose of Visit
Holiday
VFR
Business
Education
Other

Tourism Western Australia
Page 8 International Markets Summary Year Ending June 2017
JAPAN6 (Back to top)
% Change 3 Year
AAGR▲ YE Jun-16 YE Jun-17 YE Jun-17
– YE Jun-16
WA
Estimated Spend ($ Mil) $69 $53 -23.2% -10.2%
Estimated Visitors 24,700 26,200 6.1% 5.6%
Estimated Nights 826,400 697,700 -15.6% -9.7%
National
Estimated Spend ($ Mil) $783 $900 14.9% 15.3%
Estimated Visitors 347,200 391,200 12.7% 14.7%
Estimated Nights 9,057,800 9,969,200 10.1% 10.1%
Source: Tourism Research Australia – International Visitor Survey (visitors aged 15+ years).
Note that estimates on this page are based on survey data and need to be considered with these Confidence Intervals. Japan Sample Size: 175, CI Visitors +/- 18.8%, CI Nights +/- 31.6%.
▲ AAGR = Average Annual Growth Rate
670
716
762
808
854
900
53.0
59.0
65.0
71.0
Estimated Spend ($m)
WA Australia
8%
1%
4%
8%
98%
0% 25% 50% 75% 100%
1
Visitor Dispersal
EP
ASW
ANW
AGO
ACC
291
316
341
366
391
19.1
20.9
22.7
24.5
26.3
Estimated Visitors ('000)
WA Australia
4%
7%
15%
21%
56%
0% 25% 50% 75%
1
Purpose of Visit
Holiday
VFR
Business
Education
Other

Tourism Western Australia
Page 9 International Markets Summary Year Ending June 2017
KOREA7 (Back to top)
% Change 3 Year
AAGR▲ YE Jun-16 YE Jun-17 YE Jun-17
– YE Jun-16
WA
Estimated Spend ($ Mil) $50 $66 33.3% 3.3%
Estimated Visitors 13,700 15,500 13.1% 9.2%
Estimated Nights 717,000 1,165,000 62.5% 1.3%
National
Estimated Spend ($ Mil) $991 $985 -0.6% 13.0%
Estimated Visitors 239,200 268,800 12.4% 16.8%
Estimated Nights 12,777,000 11,823,100 -7.5% 8.4%
Source: Tourism Research Australia – International Visitor Survey (visitors aged 15+ years).
Note that estimates on this page are based on survey data and need to be considered with these Confidence Intervals. Korea Sample Size: 91, CI Visitors +/- 24.2%, CI Nights +/- 25.1%
▲ AAGR = Average Annual Growth Rate
730
788
846
904
962
1,020
49
55
61
67
Estimated Spend ($m)
WA Australia
7%
7%
3%
13%
96%
0% 25% 50% 75% 100%
1
Visitor Dispersal
EP
ASW
ANW
AGO
ACC
180
210
240
270
11.0
12.5
14.0
15.5
Estimated Visitors ('000)
WA Australia
11%
8%
8%
32%
58%
0% 25% 50% 75%
1
Purpose of Visit
Holiday
VFR
Business
Education
Other

Tourism Western Australia
Page 10 International Markets Summary Year Ending June 2017
MALAYSIA8 (Back to top)
% Change 3 Year
AAGR▲ YE Jun-16 YE Jun-17 YE Jun-17
– YE Jun-16
WA
Estimated Spend ($ Mil) $185 $234 26.2% 9.4%
Estimated Visitors 89,200 116,800 30.9% 24.6%
Estimated Nights 1,591,500 1,945,100 22.2% 15.1%
National
Estimated Spend ($ Mil) $907 $1,044 15.1% 12.0%
Estimated Visitors 320,700 359,300 12.0% 10.7%
Estimated Nights 7,598,400 8,650,200 13.8% 9.6%
Source: Tourism Research Australia – International Visitor Survey (visitors aged 15+ years).
Note that estimates on this page are based on survey data and need to be considered with these Confidence Intervals. Malaysia Sample Size: 607, CI Visitors +/- 9.2%, CI Nights +/- 20.0%.
▲ AAGR = Average Annual Growth Rate
715
780
845
910
975
1,040
151
172
193
214
235
Estimated Spend ($m)
WA Australia
3%
1%
0%
16%
98%
0% 25% 50% 75% 100%
1
Visitor Dispersal
EP
ASW
ANW
AGO
ACC
200
240
280
320
360
54.0
70.0
86.0
102.0
118.0
Estimated Visitors ('000)
WA Australia
3%
4%
6%
30%
67%
0% 25% 50% 75%
1
Purpose of Visit
Holiday
VFR
Business
Education
Other

Tourism Western Australia
Page 11 International Markets Summary Year Ending June 2017
NEW ZEALAND9 (Back to top)
% Change 3 Year
AAGR▲ YE Jun-16 YE Jun-17 YE Jun-17
– YE Jun-16
WA
Estimated Spend ($ Mil) $134 $97 -27.5% -18.5%
Estimated Visitors 81,500 71,700 -12.0% -4.9%
Estimated Nights 1,717,400 1,269,300 -26.1% -22.2%
National
Estimated Spend ($ Mil) $1,712 $1,684 -1.7% 1.8%
Estimated Visitors 1,202,600 1,229,400 2.2% 3.2%
Estimated Nights 15,253,000 14,396,400 -5.6% -5.0%
Source: Tourism Research Australia – International Visitor Survey (visitors aged 15+ years).
Note that estimates on this page are based on survey data and need to be considered with these Confidence Intervals. NZ Sample Size: 327, CI Visitors +/- 11.6%, CI Nights +/- 24.2%.
▲ AAGR = Average Annual Growth Rate
1,500
1,545
1,590
1,635
1,680
1,725
95
114
133
152
171
190
Estimated Spend ($m)
WA Australia
7%
10%
13%
13%
86%
0% 25% 50% 75% 100%
1
Visitor Dispersal
EP
ASW
ANW
AGO
ACC
1,060
1,094
1,128
1,162
1,196
1,230
72.0
74.0
76.0
78.0
80.0
82.0
Estimated Visitors ('000)
WA Australia
13%
2%
13%
63%
24%
0% 25% 50% 75%
1
Purpose of Visit
Holiday
VFR
Business
Education
Other

Tourism Western Australia
Page 12 International Markets Summary Year Ending June 2017
SINGAPORE (Back to top)10
% Change 3 Year
AAGR▲ YE Jun-16 YE Jun-17 YE Jun-17
– YE Jun-16
WA
Estimated Spend ($ Mil) $210 $259 23.2% 20.8%
Estimated Visitors 96,700 106,600 10.2% 13.0%
Estimated Nights 1,204,700 1,565,200 29.9% 24.1%
National
Estimated Spend ($ Mil) $1,075 $1,077 0.2% 11.4%
Estimated Visitors 373,200 384,600 3.1% 8.8%
Estimated Nights 6,287,200 6,532,800 3.9% 9.9%
Source: Tourism Research Australia – International Visitor Survey (visitors aged 15+ years).
Note that estimates on this page are based on survey data and need to be considered with these Confidence Intervals. Singapore Sample Size: 657, CI Visitors +/- 9.6%, CI Nights +/- 22.0%.
▲ AAGR = Average Annual Growth Rate
740
830
920
1,010
1,100
136
167
198
229
260
Estimated Spend ($m)
WA Australia
4%
1%
1%
24%
97%
0% 25% 50% 75% 100%
1
Visitor Dispersal
EP
ASW
ANW
AGO
ACC
240
290
340
390
56
69
82
95
108
Estimated Visitors ('000)
WA Australia
2%
4%
11%
29%
61%
0% 25% 50% 75%
1
Purpose of Visit
Holiday
VFR
Business
Education
Other

Tourism Western Australia
Page 13 International Markets Summary Year Ending June 2017
SWITZERLAND11 (Back to top)
% Change 3 Year
AAGR▲ YE Jun-16 YE Jun-17 YE Jun-17
– YE Jun-16
WA
Estimated Spend ($ Mil) $30 $31 5.7% -1.6%
Estimated Visitors 12,400 11,700 -5.6% -0.8%
Estimated Nights 251,300 252,600 0.5% -9.7%
National
Estimated Spend ($ Mil) $210 $215 2.7% 3.8%
Estimated Visitors 51,200 52,200 2.0% 1.2%
Estimated Nights 1,749,700 1,857,000 6.1% 3.2%
Source: Tourism Research Australia – International Visitor Survey (visitors aged 15+ years).
Note that estimates on this page are based on survey data and need to be considered with these Confidence Intervals. Switzerland Sample Size: 108, CI Visitors +/- 27.7%, CI Nights +/- 49.9%.
▲ AAGR = Average Annual Growth Rate
168
184
200
216
22.0
26.0
30.0
34.0
Estimated Spend ($m)
WA Australia
45%
29%
30%
39%
93%
0% 25% 50% 75% 100%
1
Visitor Dispersal
EP
ASW
ANW
AGO
ACC
42.0
45.4
48.8
52.2
9.2
10.3
11.4
12.5
Estimated Visitors ('000)
WA Australia
8%
4%
2%
23%
84%
0% 25% 50% 75% 100%
1
Purpose of Visit
Holiday
VFR
Business
Education
Other

Tourism Western Australia
Page 14 International Markets Summary Year Ending June 2017
UNITED KINGDOM (Back to top)12
% Change 3 Year
AAGR▲ YE Jun-16 YE Jun-17 YE Jun-17
– YE Jun-16
WA
Estimated Spend ($ Mil) $320 $283 -11.6% -4.8%
Estimated Visitors 147,900 148,900 0.7% 2.1%
Estimated Nights 4,314,000 4,182,600 -3.0% -1.9%
National
Estimated Spend ($ Mil) $2,040 $1,938 -5.0% 0.3%
Estimated Visitors 664,500 682,100 2.6% 4.1%
Estimated Nights 25,032,700 24,371,900 -2.6% -3.3%
Source: Tourism Research Australia – International Visitor Survey (visitors aged 15+ years).
Note that estimates on this page are based on survey data and need to be considered with these Confidence Intervals. UK Sample Size: 962, CI Visitors +/- 8.2%, CI Nights +/- 14.2%.
▲ AAGR = Average Annual Growth Rate
1,625
1,730
1,835
1,940
2,045
282
297
312
327
342
Estimated Spend ($m)
WA Australia
9%
7%
5%
24%
97%
0% 25% 50% 75% 100%
1
Visitor Dispersal
EP
ASW
ANW
AGO
ACC
573
595
617
639
661
683
138
142
146
150
154
Estimated Visitors ('000)
WA Australia
7%
2%
5%
61%
47%
0% 25% 50% 75%
1
Purpose of Visit
Holiday
VFR
Business
Education
Other

Tourism Western Australia
Page 15 International Markets Summary Year Ending June 2017
USA13 (Back to top)14
% Change 3 Year
AAGR▲ YE Jun-16 YE Jun-17 YE Jun-17
– YE Jun-16
WA
Estimated Spend ($ Mil) $143 $165 15.9% 15.1%
Estimated Visitors 67,100 84,700 26.2% 21.8%
Estimated Nights 1,646,600 1,825,500 10.9% 14.9%
National
Estimated Spend ($ Mil) $1,610 $1,724 7.1% 15.7%
Estimated Visitors 619,000 706,000 14.1% 14.0%
Estimated Nights 14,139,500 15,141,800 7.1% 8.9%
Source: Tourism Research Australia – International Visitor Survey (visitors aged 15+ years).
Note that estimates on this page are based on survey data and need to be considered with these Confidence Intervals. USA Sample Size: 371, CI Visitors +/- 10.7%, CI Nights +/- 20.5%.
▲ AAGR = Average Annual Growth Rate
1,100
1,260
1,420
1,580
1,740
105
120
135
150
165
Estimated Spend ($m)
WA Australia
9%
3%
17%
18%
93%
0% 25% 50% 75% 100%
1
Visitor Dispersal
EP
ASW
ANW
AGO
ACC
430
500
570
640
710
47
60
73
86
Estimated Visitors ('000)
WA Australia
10%
3%
22%
37%
47%
0% 25% 50%
1
Purpose of Visit
Holiday
VFR
Business
Education
Other

Tourism Western Australia
Page 16 International Markets Summary Year Ending June 2017
SOURCE AND DEFINITIONS (Back to top)15
Source: Tourism Research Australia
o Tourism Research Australia is a branch within the Tourism Division of Austrade providing research information that supports improved decision making, marketing and tourism industry performance for the Australian community.
International Overnight Visitor Survey (IVS): The International Visitor Survey samples 40,000 departing, short-term international travellers over the age of 15 years who have been visiting Australia. The survey is conducted by Computer Assisted Personal Interviewing (CAPI) in the departure lounges of the eight major international airports; Sydney, Melbourne, Brisbane, Cairns, Perth, Adelaide, Darwin and the Gold Coast.
Regional Expenditure Estimates: Regional Expenditure uses a model based approach to allocate international and domestic visitor expenditure to Australian tourism regions.
Definitions
Average Annual Growth Rate (AAGR): o Calculation of the average annual percentage increase / decrease over a specified period of years.
Overnight International Visitors: o International visitors aged 15 years and over who spent at least one night in the region.