tourism respect fiscal model report ... - cut tourism vat
TRANSCRIPT
The full fiscal and employment
impact of reduced VAT on visitor accommodation
and visitor attractions in the UK
A report by Tourism Respect & Nevin Associates
for the Cut Tourism VAT Campaign February 2017
Nevin Associates Ltd Tourism Respect Kilgour 6 Quadrant Grove Spencer Place London NW5 4JN Trinity
Edinburgh EH5 3HF

Table of Contents
Glossary of Terms .............................................................................................................. 1
1 Introduction ............................................................................................................... 2
1.1 Background .......................................................................................................... 2
1.2 The Impact of Brexit ............................................................................................. 4
1.3 The Cut Tourism VAT Campaign ............................................................................ 5
2 Modelling the Impact of Reduced Tourism VAT .......................................................... 6
2.1 The DPE Model ..................................................................................................... 6
2.2 Discussions with HM Treasury and the CGE Report ................................................ 6
2.3 Comparing the DPE and CGE models ..................................................................... 8
2.4 The Sentance-Gillham Review ............................................................................... 9
3 Updated DPE Model Assumptions ............................................................................ 12
3.1 Introduction ....................................................................................................... 12
3.2 Sector development in 2015 ............................................................................... 12
3.3 Assumptions driving the DPE fiscal model............................................................ 15
4 Comparative Results: 2017 compared to 2016 .......................................................... 19
4.1 How a Reduction in VAT would be passed through – the Base Case...................... 19
4.2 Results – The Base Case ...................................................................................... 19
5 The Impact of lower Tourism VAT on the Balance of Trade ....................................... 24
5.1 Introduction ....................................................................................................... 24
5.2 Assumptions ....................................................................................................... 25
5.3 Results ............................................................................................................... 26
5.4 Conclusions ........................................................................................................ 28
Annexe 1: The Full DPE Model ......................................................................................... 32

VAT on Visitor Accommodation and Attractions in the UK: March 2017 1
Glossary of Terms
The following acronyms have been used in this report (in alphabetical order): ABS Annual Business Survey CGE Computable General Equilibrium DPE Dynamic Partial Equilibrium EU European Union FTE Full Time Equivalent (job) GDP Gross Domestic Product GVA Gross Value Added HMRC Her Majesty’s Revenue and Customs HMT Her Majesty’s Treasury ITR International Tourism Receipts OECD Organisation for Economic Co-operation and Development ONS Office of National Statistics SIC Standard Industrial Classification TWER Trade-Weighted Exchange Rate VAT Value-Added Tax

VAT on Visitor Accommodation and Attractions in the UK: March 2017 2
1 Introduction
1.1 Background
The Cut Tourism VAT Campaign (“the Campaign”) is lobbying for the rate of Tourism VAT in the UK to be brought into line with competitor destinations within the European Union (“EU”). The United Kingdom is currently one of only three EU countries not to take advantage of a reduced rate for selected tourism services, including visitor accommodation and attractions. Supporters of the Campaign believe that this puts the sector at a severe competitive disadvantage to operators in nearly every other Member State where reduced rates apply. The case made by the Campaign is that a lower VAT rate will boost the UK’s earnings from tourism, create new jobs and generate additional tax revenues. Although the immediate impact of cutting VAT from its current rate of 20% to a reduced rate of 5% would be a loss of VAT yields, this would be offset by lower prices, stimulating greater demand for accommodation and attractions. This in turn would have the following impacts:
higher levels of expenditure and employment in tourism and related services;
increased employment will generate additional income tax receipts and savings in social security payments;
higher expenditure will increase VAT and corporation tax payments by sector operators;
higher tourism turnover will feed through to higher expenditure in other sectors of the economy, which in turn will generate further tax receipts.
Other benefits from a VAT reduction would include:
a reduction in the UK’s balance of trade deficit. In the 12 months to December 2016, the latest month for which data is available at the time of writing, the UK had a deficit on its tourism account of just over £21.4 billion1. The UK earned £22.2 billion from 37.3 million overseas visitors who spent an average of £593 each. Over the same period, UK residents spent £43.42 billion on 70.43 million visits abroad, or an average of £616 each. The tourism deficit of £21.26 billion was 25.9% higher than the deficit of £16.89 billion in 2015. A VAT reduction for the tourism industry would provide a significant boost to the UK export market;
1 Source: https://www.ons.gov.uk/peoplepopulationandcommunity/leisureandtourism/bulletins/overseastravelandtourism/nov2016.

VAT on Visitor Accommodation and Attractions in the UK: March 2017 3
a reduction in the so-called “shadow economy”. The UK tourism industry is populated by a large number of small firms that may choose not to expand or invest in order to keep below the VAT threshold and avoid paying tax. In France, the “shadow economy” falling outside the tax regime has been cut by an estimated €720 million a year following VAT reductions there.
This report has been prepared by:
Graham Wason of Tourism Respect; and
Michael Nevin of Nevin Associates Ltd. Graham Wason and Michael Nevin were previously Partner and Managing Consultant respectively at Deloitte when they first worked together to assess the impact of reduced UK tourism VAT and have worked together subsequently, completing studies measuring this impact in 1995, 1997, 1998, 2002, 2008, 2010, 2011, 2012, 2014, 2015 and 2016. For these assessments, Messrs Wason and Nevin developed a dynamic partial equilibrium model. This model has been refined and expanded to reflect new findings during each new report. The model is referred to as “the DPE model”.
The most recent reports that have provided quantified estimates of the impact of lower tourism VAT on taxes and jobs include
Bourne Leisure Group and Merlin Entertainments Group, Tourism Sector VAT: A Report on the Impact of Reduced VAT rates on British Visitor Accommodation, Attractions and the Wider Economy, by Deloitte, Graham Wason and Michael Nevin, February 2011;
Nevin Associates Ltd, The fiscal impact of lower VAT rates on visitor accommodation and attractions in the United Kingdom , a report prepared for the Cut Tourism VAT Campaign July 2014, based on ONS data for 2012. This was subsequently updated on dated February 13th 2015 based on ONS data for 2013, and in March 2016 based on ONS data for 2014.
These recent reports included the DPE model, adjusted in each case to reflect the latest data from the Office for National Statistics (ONS) and other available information from the UK and other countries which apply reduced rates of VAT to tourism. The aim of this present report is to:
update the fiscal and employment estimates contained in earlier reports on the basis of the latest available information and particularly ONS data for 2015, which was published in November 2016;
extend the earlier DPE model analysis to assess the impact of lower VAT on the UK’s balance of trade;
assess the impact of VAT reductions to 10% and 15%;

VAT on Visitor Accommodation and Attractions in the UK: March 2017 4
consider the impact of lower tourism VAT for children only; and
separate the impact of reduced VAT on accommodation and attractions.
1.2 The Impact of Brexit
The most significant political development that has occurred since the March 2016 report was the UK vote to leave the EU in the Referendum held on June 23rd 2016. The period leading up to the referendum and since has caused much uncertainty for businesses on what the short-, medium- and long-term consequences are of the ‘Brexit’ decision. In the short-term, the fall in the value of the pound immediately following the referendum result has given a positive boost to tourism by attracting overseas visitors with prices approximately 15% lower than previously, and discouraging some British residents from travelling abroad. This has not translated into confidence within the industry. A survey of Tourism Alliance members some three months after the vote found that only a small majority of businesses responded that they will benefit in the short-term from the referendum decision. Half of all businesses say that leaving the EU will be detrimental to them in the long-term compared to only 18% that say that it will be beneficial. The Tourism Alliance survey highlighted three main issues that the industry needs to have addressed by Government in order for it to continue to provide the levels of economic and employment growth that it was producing before the referendum. These issues are: 1. Maintaining agreements with the EU that facilitate the travel of visitors
across borders. 2. Maintaining the ability to recruit staff from EU countries that have the skills
and motivation required by the industry to provide world-class standards of service to all customers.
3. Ensuring that EU funding that supports tourism development and promotion is maintained until the UK leaves the EU and is seamlessly replaced with appropriate UK funding programmes upon departure.
It cannot be foreseen whether the current exchange rate will remain at its present level, or whether the pound will strengthen or weaken. Nor can it be foreseen what further impacts of Brexit there will be. It is the view of the CTV Campaign that tourism will potentially be adversely affected by Brexit, and the extent of any negative impact will depend on the deal reached with the EU. The loss of access to the Single Market, immigration restrictions, potentially less straightforward passport and visa rules and tariff barriers could all hit inbound tourism. However, Brexit also provides an opportunity for the UK government to simplify the current UK tax system and move away from EU VAT rules and regulations.

VAT on Visitor Accommodation and Attractions in the UK: March 2017 5
1.3 The Cut Tourism VAT Campaign
The Cut Tourism VAT Campaign has its origins in a group set up in the early 1990s by the then British Tourist Authority to examine the disparity between rates of VAT on tourism in the UK and most other EU Member States. Since then, the campaign to introduce competitive VAT rates for the UK’s tourism sector has gained increasing cross-party support. In the lead-up to the last General Election, seven out of twelve political party manifestos included a pledge to reduce VAT on tourism. The Select Committees for Culture, Media & Sport, for Wales, Scotland and Northern Ireland and for Environment, Food and Rural Affairs have all expressed support for reducing tourism VAT. The Campaign is supported by over 170 Members of Parliament from all political parties.

VAT on Visitor Accommodation and Attractions in the UK: March 2017 6
2 Modelling the Impact of Reduced Tourism VAT
2.1 The DPE Model
The first independent analysis of the impact of reduced rates of VAT on tourism and the UK economy was carried out in 1995 by Messrs Wason and Nevin at Deloitte based on comprehensive research, including case studies of tourism VAT changes in other countries and detailed analysis of the price sensitivity of UK tourism. Based on this research Messrs Wason and Nevin developed a Dynamic Partial Equilibrium (DPE) model to illustrate the potential impact of the VAT reduction. The DPE model has been adapted and expanded for subsequent studies in 1997, 1998, 2002, 2008, 2010, 2011, 2012 and in each of the years between 2014 and 2017.
2.2 Discussions with HM Treasury and the CGE Report
Members of the Campaign first met Mr David Gauke MP, Exchequer Secretary to the Treasury, on June 15th 2011. Mr Gauke arranged for officials from HMT to meet Messrs Wason and Nevin on September 30th 2011. HMT officials suggested that the impact of reduced tourism VAT be analysed using a CGE model, and provided the name of Professor Adam Blake of Bournemouth University who built and maintains a CGE model owned by HMRC and used by HMT. Subsequent to the meeting, HMT officials gave permission for Professor Blake to use the core of the existing HMRC model on behalf of the Campaign, provided no sensitive data were revealed. Professor Blake updated and adjusted the HMRC/HMT Model to reflect the latest available data, notably the Government’s own data from the ONS Tourism Satellite Account. The updated and adjusted model is referred to in this present report as “the CGE model”.
Professor Blake's analysis and the CGE model findings were set out in a Tourism Respect report The fiscal impact of lower VAT on tourism services applying HM Treasury’s Computable General Equilibrium Model, 2012. This report was submitted to HMT officials on August 31st 2012 and a second meeting with HMT officials was held on September 18th 2012. Key findings of Professor Blake's analysis are that:
Tourism works in a different way to other sectors in the CGE model for two reasons in particular. Firstly, reducing the price of UK tourism (through the VAT cut) will encourage weekend breaks and days out, entice some UK residents to switch from foreign to domestic holidays and encourage more visits to the UK from overseas residents, thereby increasing UK “exports”; and secondly, a high proportion of the jobs created will be taken by young people and part-time workers, many of whom may be new to the workforce and with limited alternative employment opportunities;
The UK will benefit from substantially higher GDP gains, peaking at £4 billion per year;

VAT on Visitor Accommodation and Attractions in the UK: March 2017 7
Based on reasonably plausible assumptions, the modelling exercise seems to support a general case that a reduction of VAT on tourism services would be fairly close to fiscal neutrality;
Reducing VAT on tourism was compared to other measures aimed at boosting the economy, as follows: o A 2p reduction in the standard rate of corporation tax (simulation CT) o A 20% reduction in rates for employers’ national insurance contributions
(NIC) o A 1p reduction in the standard VAT rate (VAT).
Professor Blake’s conclusion from the CGE analysis is that cutting tourism VAT is one of the “most efficient, if not the most efficient, means of generating GDP gains at low cost to the exchequer that we have seen with the CGE model”. Professor Blake’s findings and the results of the analysis using HMT’s own model were rejected by HMT. Letters from Mr David Gauke to Campaign supporters have stated that the cost of reduced tourism VAT to HMT in lost income would be many times higher than that computed by the Campaign. Since then the Campaign has been seeking to understand why HMT rejects the findings of its own CGE model and the reasons for the different estimates of cost. Graham Wason, Professor Blake and Jonathan Gillham of PwC met HMT officials on December 16th 2014. The meeting was cut short and was inconclusive. A second meeting between the Campaign and Mr David Gauke took place on February 11th 2015. This was followed by a further and more constructive meeting with HMT officials on March 10th 2015. At this meeting, the Campaign noted the following differences or possible differences in assumptions:
1. We have excluded food and beverages from accommodation turnover. HMT stated they also took this into account in their simulations of the costs and impact of a VAT reduction.
2. We have excluded business visitors who can reclaim VAT from accommodation
turnover. Again, HMT stated they had taken this into account in their simulations.
3. HMT have assumed that reduced VAT would apply to a wider range of sectors
than has been assumed by the Campaign. For example, HMT analysis includes theatres, which are excluded by the Campaign.
4. We have assumed that the "shadow economy" or 14% gap between the VAT that HM Comptroller of Audit would expect to be collected and the amount actually collected would be reduced. We do not believe that HMT have taken this impact into account based on our discussions.

VAT on Visitor Accommodation and Attractions in the UK: March 2017 8
5. The DPE model assumes that 60% of new jobs created in the sector are taken up
by people previously economically inactive. Our discussions suggest that HMT is taking a much more conservative view, i.e. they assume a lower proportion of jobs will be taken up by those previously inactive and claiming Social Security benefits.
6. Our model assumes dynamic benefits over time. HMT acknowledge that their
model is static, and our discussions seemed to suggest that they accepted that there might be some dynamic gains.
7. Our model takes into account wider multiplier effects to a greater extent than
are reflected in HMT's figures. A third meeting with Mr David Gauke was held on January 27th 2016. At that meeting the Campaign understood Mr Gauke to recognise that cutting VAT on tourism would lead to long-term benefits to the UK economy and possibly to HMT net income but that the initial (year-one) cost was too high for HMT to contemplate given the present economic climate and political objectives. However he agreed that HMT officials should meet the Campaign again to explore HMT’s earlier reasons for rejecting the findings of HMT’s own model and to move towards agreed assumptions as to the likely impact of reduced VAT on UK visitor accommodation and attractions. The Campaign Chairman met Rt Hon David Gauke MP again in December 2016 to discuss ways in which a reduction in tourism VAT could be implemented. The Campaign put to the Minister the suggestion that a pilot scheme could be run to measure the success of the initiative.
2.3 Comparing the DPE and CGE models
It should be noted that whilst the Treasury’s model (the CGE model) is a comparative-static general equilibrium model, the Wason-Nevin model is best described as a Dynamic Partial Equilibrium (DPE) model, as it examines the impact of a lower VAT rate on the tourism sector, rather than on the entire economy, although it takes account of secondary effects elsewhere in the economy via the multiplier effect. In practice, the DPE model and the Treasury's CGE model have arrived at similar estimates, although by different means. A second difference between the DPE Model and the HM Treasury CGE model is that the Treasury model is "comparative–static". In other words, it assesses the fiscal position before and after a particular tax change, once the effects of the change have fully fed through, without taking account of any lags in the adjustment process. By contrast, the Wason-Nevin DPE model explicitly takes account of lags in the adjustment process, for example the time it will take for operators to pass through a VAT cut in lower prices, and the time it will then take for consumers to respond to lower prices.

VAT on Visitor Accommodation and Attractions in the UK: March 2017 9
2.4 The Sentance-Gillham Review
An independent review of the economic evidence of the impact of reduced tourism VAT was undertaken by Dr Andrew Sentance CBE and Mr Jonathan Gillham of PricewaterhouseCoopers (PwC) and presented to the Campaign in March 2016. Dr Andrew Sentance CBE is Senior Economic Adviser to PwC. He joined PwC after serving for five years (2006-2011) on the Bank of England Monetary Policy Committee (MPC), through the global financial crisis and its aftermath. Before joining the Bank of England, Andrew held senior positions at the CBI, London Business School and British Airways, where he was Chief Economist and Head of Environmental affairs. He has provided economic advice to businesses, the UK government and international institutions throughout his career, as well as being a regular contributor to the media and publishing widely in academic and business books and journals. Dr Jonathan Gillham is a Senior Consultant at PwC. Since 2015, Jonathan has been a member of the OBR’s expert advisory panel which consists of leading economic and fiscal experts that challenges and provides feedback to the OBR on its research and analysis. Prior to joining PwC Jonathan worked as an economist in HM Treasury and HMRC for more than 7 years and specialised in examining the impact of tax, spending and environmental policy on the economy. Jonathan has extensive experience of the UK Budget process and also worked in the Treasury macroeconomic forecasting team. Their report was based on a thorough examination of previous Campaign reports and was informed by discussions with Graham Wason and Michael Nevin as well as public statements from UK Treasury ministers and recent correspondence between HM Treasury and supporters of the Cut Tourism VAT campaign. The Sentance-Gillham review notes that:
The UK is one of only three EU countries (along with Denmark and Slovakia) that does not apply a reduced rate of VAT on some combination of hotel accommodation, theatre/cinema admissions, visitor attractions, and restaurant meals.
Countries generally choose to apply a lower VAT rate because they believe it creates a competitive advantage in an important tradable services activity, leading to wider economic benefits.
The reports analysed a reduction in the VAT rate on hotel accommodation and visitor attractions to 5 percent. This is a less comprehensive extension of reduced VAT than seen in some other countries, where theatres/cinemas/shows and restaurants also benefit from a lower rate of VAT.
There are also other policy issues of concern to the UK government, which may be relevant to the Cut Tourism VAT campaign. Examples include:
VAT on Visitor Accommodation and Attractions in the UK: March 2017 10
- The regional agenda. The campaign makes reference to the benefit of lower VAT on tourism-related activities on seaside towns and other deprived areas of the UK.
- Productivity. Research and analysis into the contribution that the tourism
sector currently makes to UK productivity performance and how this might be enhanced could have an important bearing on the arguments for a VAT cut on tourism-related activities.
- Exports of services. The UK is the second largest exporter of services in
the world, behind the United States, and its services exports are the highest share of GDP for any G7 country by a considerable margin.2 Cutting VAT on tourism-related activities would help the balance of payments, as the Cut Tourism VAT campaign has already highlighted, and would support a strategy of reinforcing our competitive advantage in key services industries.
The conclusions of the Sentance-Gillham review are summarised as follows:
i. The Cut Tourism VAT campaign has compiled and published a considerable body of detailed modelling and economic analysis in support of the case for a lower rate of VAT on tourism-related activities. The modelling work has been informed by a detailed and sophisticated Dynamic Partial Equilibrium (DPE) model of the tourism sector, which points to a boost to GDP and employment in the sector from the tax reduction. The model also shows significant “indirect” or “multiplier” effects which would benefit the rest of the economy. A key conclusion from this modelling work is that extra tax revenue generated by the positive gains to activity and employment in tourism and in the rest of the economy would – over the long-term - produce a sufficiently large offsetting boost to more than recoup the losses generated by the initial tax cut. In other words, the DPE modelling analysis supports the conclusion that the cut in VAT would eventually be self-financing for the Treasury.
ii. The “indirect” or “multiplier” economic effects are central to these DPE
modelling results of the impact on public finances. Without them, the cut in VAT would not be self-financing. An alternative approach – Computable General Equilibrium (CGE) modelling – is available to capture these effects. A CGE model should measure the indirect effects on the rest of the economy more completely than the DPE model, as it aims to capture more completely and accurately the interactions between different sectors in the economy and the constraints on the overall growth of the economy.
2 UK exports of services make up 12% of UK GDP compared to around 8% for France and Germany and around 4% in the US. See “How the services sector is rebalancing Britain’s economy”, PwC UK Economic Outlook, November 2013: http://www.pwc.co.uk/services/economics-policy/insights/uk-economic-outlook/ukeo-nov13-how-the-services-sector-is-rebalancing-britains-economy.html
VAT on Visitor Accommodation and Attractions in the UK: March 2017 11
iii. A CGE modelling exercise carried out by Dr Adam Blake using the Treasury’s own model concluded that the net effect on public finances of a cut in VAT on tourism-related activities would not be positive over the longer-term. This leads us to conclude that there is a higher degree of uncertainty about the “indirect” or “multiplier” effects in the DPE model than in its modelling of the tourism sector, which is very detailed and thorough. The multiplier effects in the DPE modelling have, however, been calibrated against the results of many tourism economic impact studies in the UK and elsewhere.
iv. Despite this, both modelling approaches indicate that there are positive
benefits for output and employment in the UK economy from a cut in tourism-related VAT. This is consistent with the prediction of economic theory. Because a cut in VAT on tourism-related activities should encourage more visitors to the UK and more “homestaying” holidays, it provides a boost to the UK’s competitive position in tourism relative to other countries. This competitiveness boost would be expected to translate into more jobs and economic activity.
v. The CGE modelling results support this view. Even though they were less
positive than the DPE model results for public finances over the longer term, they showed that cutting VAT on tourism-related activities was a tax-efficient means of stimulating growth and jobs in the UK economy, compared to other tax reductions that the Treasury might consider.
vi. The campaign’s analysis has been well-researched and has delivered insights
to inform policy discussion. The depth of research and the modelling detail has been impressive. The research findings make economic sense, even if there is some uncertainty around the size of some of the impacts on public finances. But it is not surprising that different modelling approaches give somewhat different results –and both the DPE and CGE results support the view that there would be substantial benefits to the UK economy from a cut in the VAT rate on tourism-related activities.
vii. The VAT system in the UK has not been comprehensively reviewed since VAT
was introduced over forty years ago – since when the structure of the UK economy has changed dramatically. There are many aspects of the VAT schedule which now appear anomalous, including the wide range of items which are zero-rated and the fact that many very similar products are taxed at very different VAT rates. A full review of the VAT system – including the application of zero and reduced rates – should be part of the government’s wider tax reform agenda, and the economic analysis we have reviewed in this report suggests that consideration of a reduced rate of VAT for tourism-related activities should be part of such a review.
The next section of this report summarises the updated assumptions since the Nevin Associates March 2016 report.
VAT on Visitor Accommodation and Attractions in the UK: March 2017 12
3 Updated DPE Model Assumptions
3.1 Introduction
Our March 2016 report was based upon ONS data for 2014, which was the latest date for which Annual Business Survey (ABS) information was available at that time. This report is based upon ONS data for 2015, which was published in November 2016. As in our 2011, 2014, 2015 and 2016 studies, the analysis is based on a reduction in VAT from a current standard rate of 20% to a reduced rate of 5%. It should be noted that the reduced 5% rate already applies to certain specific parts of the sector, including static caravans and ski lifts, as well as hotels in the Isle of Man. The same methodology has been applied to undertake this analysis as in 2011, 2014, 2015 and 2016, applying a fiscal model which measures not only the direct impact of lower VAT rates, in terms of the direct loss of VAT receipts, but also indirect gains that would accrue to the Exchequer, arising from:
higher turnover as sector demand would be stimulated by lower prices;
greater income and national insurance payments generated by new jobs and higher wages in the sector;
savings in social security payments as a consequence of lower unemployment – with some of the new jobs created in the sector taken up by those previously unemployed;
increased corporation tax payments as a result of higher margins and higher turnover;
increased income taxes paid on dividends generated by the accommodation and attractions sector; and
multiplier impacts from additional taxes generated further down the supply chain for accommodation and attractions.
3.2 Sector development in 2015
The Office for National Statistics (ONS) provides data on turnover, jobs and employment costs in the accommodation and attractions sector based on its Annual Business Survey (ABS). Our review of this data covers the seven years between 2008 and 2015 inclusive. The accommodation sector comprises the entirety of SIC Code 55. (The Standard Industrial Classification (SIC) is a system for classifying industries by a four-digit code established in the late 1930s). Our definition of the visitor attractions sector for the 2011 study covered the following SIC codes within Section R (arts, entertainment and recreation):
91.03: Historic sites and buildings,
91.04: Botanical and zoological gardens and nature reserves,
93.21: Amusement parks and theme parks.

VAT on Visitor Accommodation and Attractions in the UK: March 2017 13
The data provided by the ONS covers:
number of enterprises,
total turnover net of VAT,
approximate Gross Value Added at basic prices,
total employment,
total employment costs and
net capital expenditure. The ONS data also shows the VAT element and gross turnover (= net turnover + VAT) for the accommodation sector. This is not available for the attractions sector, so for the purposes of our analysis we have assumed that the proportion of gross turnover accounted for by VAT is the same for the visitor attractions sector as for the accommodation sector. Trends for each sector are assessed below.
3.2.1 Accommodation
Both net and gross turnover dipped in 2009 compared to 2008, before recovering slightly in nominal terms between 2010 and 2011, with the recovery gaining pace in 2012 and 2013. Net turnover increased from £17.65 billion in 2010 to £20.22 billion in 2013, or by almost 15%, compared to an 11.5% increase in the retail price index. There was a further increase in 2014 to £22.92 billion, more than 13% up on the 2013 figure. This represents healthy growth in both inbound and domestic tourism in 2014, assisted by a competitive (i.e., relatively low) external value of the £. There was a further although more modest increase in 2015, to just over £23.3 billion, an increase of 1.8% over the previous year. Sector employment also increased, although not as rapidly as turnover. After being static over the period between 2008 and 2010, jobs increased ahead of the upturn in real turnover from 377,000 in 2010 (average during the year) to 416,000 in 2013. In 2014, the number of jobs in the sector was virtually static at 418,000. In 2015, employment increased to 444,000 or by just over 6% compared to the preceding year. This represents total employment, including part-time employees, although the same pattern is evident in the full-time equivalent (FTE) data. This suggests that accommodation businesses started hiring staff almost immediately they experienced an upturn in business, ahead of the growth in demand. However, there was no net hiring in the sector in 2014, as businesses sought to squeeze higher productivity from their employees, possibly in anticipation of a slowdown in 2015. In 2015, with turnover slightly up in real terms, hotel operators started hiring. ONS statistics show that a total of 26,000 additional jobs were created in the accommodation sector, and total employment costs increased by almost 9% from £5.8 billion to £6.3 billion. Average remuneration per FTE employee in the sector rose from £24,500 in 2014 to £25,400 in 2015.

VAT on Visitor Accommodation and Attractions in the UK: March 2017 14
Another indication of increased confidence in the sector during 2015 is that net capital expenditure in the sector rose from £1.66 billion in 2014 to £2.88 billion in 2015 according to ONS statistics, an increase of 73%.
3.2.2 Attractions
In interpreting the statistics for the attractions sector, it needs to be borne in mind that the turnover of the sector is significantly lower than accommodation. Total turnover was just under £2 billion in 2015 for all three attractions sub-sectors combined (historic buildings, gardens and zoos and amusement and theme parks). This was less than a tenth of the turnover of the accommodation sector at £23 billion. Therefore, statistically it is likely that key performance indicators including turnover, investment and jobs, will be more volatile for attractions than for accommodation. For example, the total level of investment in attractions may be disproportionately affected by one or two major investment projects, which is evident in the significant year-on-year variations in net investment statistics compared to the smoother pattern in evidence in the accommodation sector. Key performance indicators for each of the attractions subsectors are set out below. 91.03: Historic Buildings. Net turnover fell quite sharply from £377 million in 2008 to £303 million in 2009. It then recovered in 2010 and more strongly in 2011 (possibly reflecting the staycation effect) before stabilising in 2012. It then fell in 2013, from £420 million to £372 million. However, turnover then rose to £458 million in 2014, back to where it was in 2008 in real (inflation-adjusted) terms, as over the period the retail prices index rose by just over 18% from 217 in mid-2008 to 256 in 2014. Net capital expenditure in the sector also rose significantly from £65 million in 2013 to £138 million in 2014. Employment rose slightly from 13,000 jobs to 14,000 jobs (full and part-time). This recovery was consolidated in 2015, with turnover stable at £468 million, and employment still recorded as 14,000, although net capital expenditure fell to £34 million. 91.04: Botanical Gardens and Zoos: the decline in turnover was more severe and prolonged in this sector than in historic buildings, probably not helped by wet weather in the summer and snows in the winters of 2009-10 and 2010-11, falling from £559 million in 2008 to £306 million in 2011, before recovering to £421 million in 2012. The ONS data shows negative gross value-added for the sector in 2011 and 2012 – i.e., it was only surviving with the aid of public subsidies or loss-making equity at macro level. However, recovery continued in 2013, with net turnover up to £526 million and a return to positive GVA. Turnover then dipped slightly in 2014 to £505 million, before resuming its upward path with an increase to £604 million in 2015. Total employment was stable at 18,000 in 2013 and 2014, increasing to 21,000 in 2015. Net capital expenditure increased significantly from £59 million in 2013 to £116 million in
VAT on Visitor Accommodation and Attractions in the UK: March 2017 15
2014 and £140 million in 2015, evidence of increased operator confidence in the sector. 93.21: Amusement and Theme Parks. Turnover increased from £611 million in 2008 to £733 million in 2009, before decreasing sharply to £605 million in 2010 – i.e. the downturn in this sector seems to have occurred one year later than the rest of the accommodation and attractions sector. But amusement and theme parks then recovered strongly in 2011, up to £776 million, before falling back slightly to £750 million in 2012. This may have been due to the "staycation effect" in 2011. There was a return to growth in 2013, with net turnover rising 9% to £823 million. Turnover was stable in 2014, with net sector turnover of £831 million, and experienced 7% growth in 2015 when it rose to £887 million. Employment has risen gradually from 16,000 in 2008 to 18,000 in 2013 and 2014, before increasing to 21,000 in 2015. As in the case of the historic buildings and botanical gardens subsectors, net capital expenditure increased significantly year-on-year, from £65 million in 2013 to £142 million in 2014, suggesting increasing confidence in the sector’s prospects. Capital expenditure fell back to £110 million in 2015.
3.2.3 Conclusions
The statistics for the accommodation and attractions sector are consistent with wider macroeconomic indicators which show that the UK has consistently grown since the bottom of the recession which followed the international financial crisis in 2008/09. Indeed, it could be argued that the attractions and accommodation sector helped to lead the economic recovery, as they started to grow in 2011, one year ahead of the overall economy where recovery commenced in 2012/13. This growth continued in 2015, with turnover across the sector up by 2.3% year-on-year, from £24.7 billion in 2014 to £25.3 billion in 2015, and employment, up 6.8% from 468,000 jobs to 500,000 jobs (full- and part-time).
3.3 Assumptions driving the DPE fiscal model
All the assumptions driving the DPE fiscal model, and their sources, are set out in Annexe 2 to this report which contains the full model. Key changes in assumptions compared to the previous analyses are as follows:
1. Updated net turnover. The latest ONS data has been used to update the opening figures for turnover in the accommodation and attractions sector from 2014 to 2015. ONS statistics indicate that, of total accommodation sector turnover, 74% was accounted for by hotels, most but not all of which have restaurants, and 26% by other forms of accommodation including guest houses, camp sites and caravan parks, most of which do not have a food and beverages (F&B) offer. Industry estimates are that approximately a third of total turnover in hotels with restaurants and bars is accounted for by F&B, and two-thirds by accommodation. On this basis, we estimate that, overall, 24.5% of total visitor accommodation turnover will not benefit from the VAT reduction (= 74% x 33%), and 75.5% – i.e., the accommodation element – will benefit from lower VAT.

VAT on Visitor Accommodation and Attractions in the UK: March 2017 16
2. Changes in VAT payments. One striking result that emerges from ONS statistics is that VAT payments by the accommodation sector have increased much more rapidly than the increase in the sector’s net turnover – with VAT up from £2.7 billion in 2008 to £4 billion in 2015, or by 48%, against an increase in net turnover of 33% over the same period. This reflects the increase in the standard rate of VAT to 20%. Overall, VAT payments as a percentage of net turnover increased from 15.5% in 2008 to 17.0% in 2015. The ONS does not report VAT payments made by the attractions sector, so estimates have been imputed by applying the accommodation VAT rate to historic sites, botanical gardens, amusement and theme parks. This gives a total estimate of VAT paid by the attractions sector of £334 million in 2015.
3. Personnel expenses and investment as a percentage of sector turnover has
been calculated from the latest ONS data (as in 2011, 2014, 2015 and 2016).
4. Turnover per job in the accommodation sector fell slightly from £54,959 in 2014 to £52,536 in the accommodation sector. This decline reflects the fact that job creation in the accommodation sector, of 26,000 additional jobs, represented 6.2% increase in sector employment, which was greater than the increase in sector turnover, up 1.8% from £22.9 billion to £23.3 billion. The increase in jobs lagged behind the increase in turnover – in 2014 sector turnover increased by more than 13% but employment was static, suggesting that industry operators were squeezing higher productivity from their existing workforces (in aggregate). However, there is a limit to the extent to which this is achievable, and the increase in net hiring in 2015 may reflect pressures on the existing workforce as visitor numbers and expenditure continued to increase in 2014/15.
5. By contrast, turnover per job in the attractions sector increased modestly, from £34,765 in 2014 to £34,982 in 2015, according to the ONS statistics.
6. The assumed pass-through of the VAT reduction is the same as in the Base Case modelled in February 2015. The allocation of the reduction is the same as assumed in the March 2016 analysis, as follows:
75% allocated to price cuts;
7% allocated to higher salaries;
3% allocated to training;
10% allocated to greater sector investment;
5% allocated to higher profits. The speed with which price reductions feed through is assumed to be the same as under the March 2016 Rapid Reduction Scenario, with 60% of the total price adjustment occurring in the first year following the VAT reduction, 85% in the second year, and 100% in the third year and thereafter.
7. The estimated annual value of Social Security payments paid to the unemployed,
including housing benefit etc. has been increased in line with inflation from

VAT on Visitor Accommodation and Attractions in the UK: March 2017 17
£8,781 in 2014 (assumed in the March 2016 model) to £8,865 in 2015 (reported in the current model).
The altered values entered into the updated fiscal model are set out in the Table below.
Description 2017 2016 2015
55 Visitor Accommodation net turnover, £m £23,326 £22,973 £20,460
Of which:
55.1 Hotels and similar accommodation £17,368 £17,768 £16,041
55.2 Holiday and other short stay accommodation £2,178 £1,825 £1,551
55.3 Camping grounds, recreational vehicle parks and trailer parks £2,965 £3,027 £2,611
55.9 Other accommodation £815 £353 £257
55 Visitor accommodation VAT Payments, £m £3,973 £3,994 £3,797
Of which:
55.1 Hotels and similar accommodation £3,165 £3,291 £3,044
55.2 Holiday and other short stay accommodation £354 £260 £329
55.3 Camping grounds, recreational vehicle parks and trailer parks £428 £422 £413
55.9 Other accommodation £26 £21 £11
£3,973 £3,994 £3,797
Visitor accommodation VAT payments as a % of net turnover 17.0%3 17.4% 18.6%
Attractions sector turnover net of VAT, £ million
91.03 Historic sites and buildings £468 £434 £365
91.04 Botanical and zoological gardens & nature reserve activities £604 £505 £483
93.21 Amusement parks and theme parks £887 £834 £819
£1,959 £1,773 £1,667
Attractions sector VAT4 £334 £308 £309
Accommodation sector
Personnel expenses - % of turnover net of VAT 28% 25% 29%
Investment - % of turnover net of VAT 12% 7% 9%
Attractions sector
Personnel expenses - % of turnover net of VAT 51% 63% 63%
Investment - % of turnover net of VAT 14.5% 30% 12%
Turnover per job: visitor accommodation sector £52,536 £54,959 £49,183
Turnover per job: visitor attraction sector £34,982 £34,765 £34,020
3 The decline in VAT as a % of turnover may be associated with a rise in net capital expenditure in the sector from £1.65 billion in 2014 to £2.88 billion in 2015, as VAT recoverable on investment in capital assets could be offset against VAT payable on net turnover 4 Imputed estimate applying the same VAT % as for the accommodation sector
VAT on Visitor Accommodation and Attractions in the UK: March 2017 18
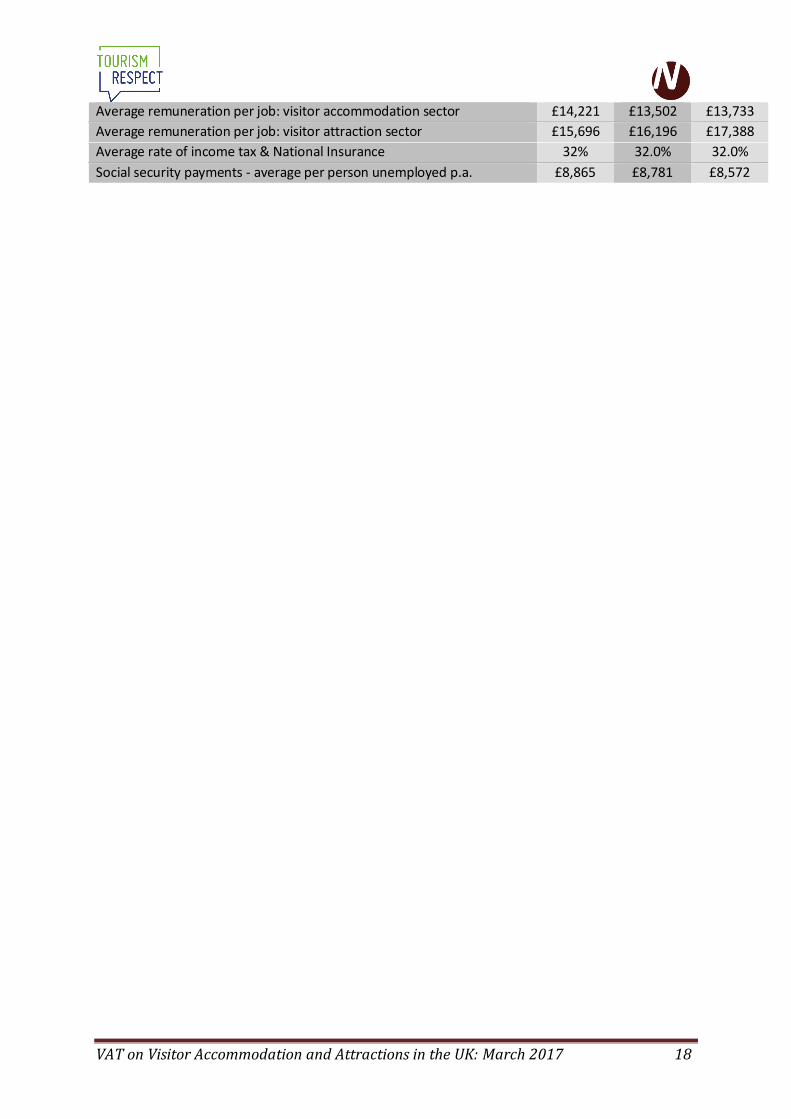
Average remuneration per job: visitor accommodation sector £14,221 £13,502 £13,733
Average remuneration per job: visitor attraction sector £15,696 £16,196 £17,388
Average rate of income tax & National Insurance 32% 32.0% 32.0%
Social security payments - average per person unemployed p.a. £8,865 £8,781 £8,572
VAT on Visitor Accommodation and Attractions in the UK: March 2017 19
4 Comparative Results: 2017 compared to 2016
4.1 How a Reduction in VAT would be passed through – the Base Case
The base case fiscal model assumes that three-quarters of the 15% reduction of VAT will feed through in lower prices, so prices will fall by 11.25% compared to the pre-reduction level (= 75% x 15%). However, this reduction will not happen instantaneously. The evidence from countries that have reduced VAT indicates that it may take 2 to 3 years for a full pass-through of reduced VAT to lower prices. Initially, some operators may seek to retain the VAT reduction and hold their prices at a constant level. However, the evidence from Ireland and France indicates that some operators in a price-sensitive market will take the lead in reducing prices in an effort to increase their market share. This in turn will force an adjustment by competing operators in order to protect their sales. The base case model assumes the following adjustment path:
60% of the total price adjustment occurs in Year 1 following the VAT cut;
85% in Year 2;
100% in Year 3 and thereafter. Leading Campaign supporters such as Bourne Leisure Group, Merlin Entertainment and Premier Inns have pledged to pass on the whole of the cut in VAT to lower prices on the day the measure becomes effective. This is likely to force competitors to do the same and could lead to a significantly faster rate of pass-through than has been assumed in the DPE model.
4.2 Results – The Base Case
Based upon these assumptions, the “comparative static” results indicate a net annual loss to the Exchequer from a VAT reduction of £33 million. A direct loss of VAT yields of £1.563 billion is offset by indirect gains from higher yields from income and corporation tax, savings in social security payments, a smaller shadow economy and multiplier effects. These indirect gains generate additional tax revenues of £1.53 billion in total. The net loss of £33 million compares to a net loss of £43 million computed in the 2016 model. The comparative 2017, 2016 and 2015 figures are shown in the Table overpage.

VAT on Visitor Accommodation and Attractions in the UK: March 2017 20
£ million 2017 2016 2015
(1) Net direct loss of VAT receipts (£1,563.3) (£1,534.8) (£1,484.1)
(2) VAT Yield on increased turnover at 5% £82.7 £85.6 £80.6
(3) VAT Yield on wider base at 5% £45.0 £43.5 £38.8
(4) Income and national insurance derived from new jobs & previously unreported (Shadow Economy) jobs
£176.5 £160.8 £169.6
(5) Income and national insurance derived from higher wages £35.0 £34.4 £33.2
(6) Savings in social security payments £194.9 £190.5 £193.0
(7) Corporation tax from higher margins on current turnover including previously unreported (Shadow Economy) turnover
£70.7 £68.8 £76.5
(8) Corporation tax from higher turnover £69.4 £71.9 £81.3
(9) Income tax paid on dividends £44.5 £43.4 £38.1
(10) Business rates £27.6 £28.6 £26.9
(11) Multiplier impact £783.8 £764.8 £751.6
Net fiscal impact (£33.3) (42.5) £5.6
On a simple “before and after” analysis, the net fiscal cost of a VAT reduction is slightly lower than in the 2016 analyses, principally because turnover per job in the accommodation sector has fallen compared to the previous version of the model. This boosts the additional amount of income tax and National Insurance receipts for the Exchequer (Row [4]) while also generating savings in social security payments (Row [6]) compared to the 2016 analysis. The reason is that, with a lower turnover per job, any given increase in sector turnover will result in greater job creation.
The Table above is based on a simple “before” and “after” comparison. In reality, transition to a post-VAT reduction equilibrium will not be instantaneous. There will be lags in the adjustment process:
firstly, it takes time for some operators to pass through the VAT reduction in lower prices, and
secondly, it takes further time for consumers to respond to lower prices.
The evidence from the French VAT reduction on restaurant meals in July 2009, and the German VAT reduction on hotel accommodation in January 2010, indicates that the first response of many operators will be to retain the proceeds of any VAT cut in higher profits. However, this is not an equilibrium position. Some operators will attempt to gain market share by reducing their prices, and this will provoke a

VAT on Visitor Accommodation and Attractions in the UK: March 2017 21
competitive response from other operators, so tending to reduce prices over a period of approximately three years after a VAT reduction.
Once operators begin to reduce their prices, it will take time for consumers to adjust their purchasing patterns in response to lower prices. The evidence from econometric analysis of the path of adjustment in tourism expenditure after a change in prices suggests the response time from consumers may take between 18 and 24 months. However, it is possible that this consumer response lag may be getting shorter, reflecting more efficient information flows as a result of the growth of the Internet, and a tendency for holidaymakers to book their holidays closer to the date of departure than 10 or 20 years ago, when holidays were often booked many months in advance.
Taking these factors into account, we have estimated that 60 per cent of the total impact of a VAT reduction will be felt in the first year following the reduction, rising to 85 per cent in the second year, and 100 per cent by Year 3.
The implications of this are that:
the full indirect and multiplied impact of a VAT reduction will take time to feed through, with the result that the Exchequer may suffer net losses in the years immediately following a VAT cut, because the loss of yield is not immediately offset by indirect and multiplied gains generated by the demand stimulus;
however, once the effects of the VAT cut begin to feed through in lower prices and higher demand, the indirect gains from VAT deriving from a higher revenue base start to offset the direct loss of VAT yield. By Year 3 the net receipts to the Exchequer are greater than under a “no VAT change” scenario.
Indirect fiscal gains are projected to increase over time compared with a no change baseline, because a VAT cut will provide a stimulus to the entire sector, as was seen in:
the Republic of Ireland following the VAT reduction on hospitality services (hotels and restaurants) there in the mid-1980s,
France following the VAT reduction for cafés and restaurants in 2009, and
Germany, which introduced a lower rate of VAT for hotels in 2010.
Overall, the fiscal balance is approximately neutral after two years, and the Exchequer makes a net gain over a ten-year period, as shown in the chart below.

VAT on Visitor Accommodation and Attractions in the UK: March 2017 22
-£600.0
-£400.0
-£200.0
£0.0
£200.0
£400.0
£600.0
£800.0
£1,000.0
£1,200.0
£1,400.0
-1 0 1 2 3 4 5 6 7 8 9 10
Pre-cut Year of Cut
£ m
illio
n
Net fiscal impact (undiscounted)
From the chart, it will be seen that the Exchequer makes progressively greater gains compared to a “business as usual” scenario over time, because of the dynamic stimulus that lower VAT would give to sector growth and both domestic and inbound tourism.
This would increase the UK's taxation base, not only for VAT, but also for income and corporation tax.
The detailed year-by-year adjustment path is given in the Table overpage. It shows that, while the VAT cut would result in a net loss of revenues to the Exchequer in the first two years following the reduction, considered over the period as a whole a VAT reduction would generate a positive Net Present Value of £880 million in the first five years, and £4,625 million over the ten-year period, compared to £4,222 million in the 2016 run of the model.

VAT on Visitor Accommodation and Attractions in the UK: March 2017 23
Pre-cut Year of Cut
Year -1 0 1 2 3 4 5 6 7 8 9 10
(1) Net direct loss of VAT receipts £0.0 £0.0 -£1,532.1 -£1,501.3 -£1,470.9 -£1,441.1 -£1,411.6 -£1,382.6 -£1,354.1 -£1,326.0 -£1,298.3 -£1,271.0
(2) VAT Yield on increased turnover £0.0 £0.0 £49.6 £70.3 £82.7 £82.7 £82.7 £82.7 £82.7 £82.7 £82.7 £82.7
(3) VAT Yield on wider base £0.0 £0.0 £27.0 £38.3 £45.0 £45.0 £45.0 £45.0 £45.0 £45.0 £45.0 £45.0
(4) Income and national insurance derived from new jobs &
previously unreported (Shadow Economy) jobs£0.0 £0.0 £116.6 £171.3 £208.2 £218.4 £228.5 £238.5 £248.3 £258.0 £267.5 £276.8
(5) Income and national insurance derived from higher wages £0.0 £0.0 £21.0 £29.8 £35.0 £35.0 £35.0 £35.0 £35.0 £35.0 £35.0 £35.0
(6) Savings in social security payments £0.0 £0.0 £137.4 £206.3 £255.4 £274.9 £294.1 £313.1 £331.8 £350.2 £368.3 £386.1
(7) Corporation tax from higher margins on current turnover
including previously unreported (Shadow Economy) turnover£0.0 £0.0 £92.9 £81.7 £80.0 £80.0 £80.0 £80.0 £80.0 £80.0 £80.0 £80.0
(8) Corporation tax from higher turnover £0.0 £0.0 £49.5 £74.6 £92.7 £100.2 £107.6 £114.9 £122.1 £129.1 £136.1 £143.0
(9) Income tax paid on dividends £0.0 £0.0 £29.9 £44.3 £54.1 £57.2 £60.3 £63.3 £66.3 £69.2 £72.1 £74.9
(10) Additional business rates £0.0 £0.0 £19.7 £29.7 £36.9 £39.8 £42.8 £45.7 £48.5 £51.3 £54.1 £56.8
(11) Multiplier impact £0.0 £0.0 £527.8 £780.4 £953.8 £1,008.8 £1,063.0 £1,116.3 £1,168.9 £1,220.6 £1,271.6 £1,321.8
Net fiscal impact (undiscounted) £0.0 £0.0 -£460.6 £25.3 £372.7 £501.0 £627.3 £751.8 £874.4 £995.2 £1,114.1 £1,231.3
Additional jobs directly created 0 0 15,500 23,270 28,806 31,010 33,181 35,320 37,427 39,502 41,546 43,559
Total Direct Jobs Impact 0 0 25,834 38,783 48,010 51,684 55,302 58,867 62,378 65,836 69,243 72,598
Multiplied Jobs 0 0 17,309 25,984 32,167 34,628 37,053 39,441 41,793 44,110 46,393 48,641
Total Direct and Multiplied Jobs Impact 0 0 43,143 64,767 80,177 86,312 92,355 98,308 104,171 109,946 115,635 121,239
First 5 years First 10 Years
Net Present Value , £ mill ion £880 £4,625
Economic Rate of Return, % 49.3% 70.0%

The Impact of Reduced VAT on Visitor Accommodation and Attractions 24
5 The Impact of lower Tourism VAT on the Balance of Trade
5.1 Introduction
Previous versions of the DPE model have assessed the impact of lower VAT on turnover, jobs and taxes within the UK, but only the 2016 Report explicitly considered the impact on the UK's balance of trade. Taking account of the internationally competitive nature of the tourism sector, and its importance as a source of foreign exchange earnings for the UK, the model was extended in 2016 to include a computation of the positive impact of lower tourism VAT on the UK’s balance of trade. This is particularly important given growing concerns regarding the UK’s apparently intractable balance of trade deficit, which has not improved despite an external depreciation in the value of the £ after 2007, and has also been adversely affected by a decline in the value of foreign-exchange earnings from North Sea oil. ONS data indicate the following trends in the UK’s balance of trade:
2012: UK earnings from exports of goods and services: £500 billion. UK expenditure on imports of goods and services: £535 billion. Deficit on the balance of trade = £35 billion.
2013: UK earnings from exports of goods and services: £511 billion. UK expenditure on imports of goods and services: £543 billion. Deficit on the balance of trade = £32 billion.
2014: UK earnings from exports of goods and services: £500 billion. UK expenditure on imports of goods and services: £535 billion. Deficit on the balance of trade = £35 billion.
2015: UK earnings from exports of goods and services: £512 billion. UK expenditure on imports of goods and services: £547 billion. Deficit on the balance of trade = £35 billion.
2016 (11 months to November): UK earnings from exports of goods and services: £494 billion. UK expenditure on imports of goods and services: £529 billion. Deficit on the balance of trade = £35 billion.
There are two ways in which lower tourism VAT would assist the balance of trade:
1. By increasing the UK’s foreign exchange earnings from overseas visitors. We conservatively estimate that overseas tourists account for approximately 40% of all expenditure on visitor accommodation and attractions in the UK.

The Impact of Reduced VAT on Visitor Accommodation and Attractions 25
2. By reducing foreign exchange expenditure by UK residents on holidays abroad.
In a speech on 17 August 2010, the then Prime Minister, David Cameron, challenged the travel industry to raise British residents’ holiday expenditure within the UK from 36% to 50%, and correspondingly reduce the proportion spent abroad from 64% to 50%. In the succeeding two years, the proportion of domestic tourism expenditure by UK residents did indeed increase to just over 40% of all tourism expenditure by UK residents, thus moving in the direction that the PM wished. However, the “staycation” effect witnessed in 2011-2012 eased in the following three years, with the proportion of total tourism expenditure by UK residents on holidays overseas rising in 2014 and 2015, driven by underlying economic recovery and the appreciation of the £ Sterling, particularly against the euro and the dollar. Figures for 2015 indicate that UK residents spent £24.3 billion on domestic tourism and £39.1 billion on overseas tourism, so domestic tourism expenditure represented 38.3% of all tourism expenditure5.
This suggests that, under a “no VAT change” scenario, there is a risk that, over the medium term, the proportion of total tourism expenditure by UK residents abroad will continue to rise. In the short term, we would anticipate an increase in the ratio of domestic tourism expenditure to total tourism expenditure as a consequence of the fall in the external value of the £ since the Brexit vote in the EU Referendum on June 23rd 2016. As during the 2009–2011 period, a significant depreciation in the external value of the £ will tend to boost demand for holidays at home as it makes them cheaper than holidays abroad. Our earlier research (confirmed by other economists) has demonstrated that tourism is highly price sensitive. Therefore, a fall in the international value of the £ - like a reduction in VAT – will provide a stimulus to both domestic UK tourism and international inbound tourism. However, any fall in the external value of the £ is unlikely to continue indefinitely, given the mathematical impossibility of the trade weighted exchange rate of the £ falling to zero, whereas a reduction in VAT will overcome a permanent price disadvantage of British tourism compared to tourism in competing destinations such as Ireland and France. A reduction in VAT would therefore provide a permanent encouragement for UK residents to take their holidays at home and for overseas visitors to come into the UK, and thus help to improve the UK’s balance of trade.
5.2 Assumptions
Our computations of the impact of lower tourism VAT on the balance of trade is based on the following assumptions:
40% of turnover is accounted for by overseas visitors, and hence 40% of the increase in sector turnover is accounted for by additional foreign exchange earnings;
5 Sources: Tourism Alliance, VisitBritain, based on IPS data
The Impact of Reduced VAT on Visitor Accommodation and Attractions 26
in addition, there will be a positive foreign-exchange impact as a consequence of a switch by UK residents from holidays abroad to (relatively cheaper) holidays at home. Business visitors are netted out of this analysis (estimated as 40% of all expenditure on accommodation and 0% on attractions) on the grounds that they can reclaim any VAT on their expenditure. After excluding business visitors, we have applied a working assumption that 50% of additional sector turnover by domestic holiday visitors represents expenditure that would otherwise have been spent overseas. This is consistent with Irish experience, which showed a big increase in domestic holidays by Irish residents following the reduction in VAT there.
5.3 Results
Based on these assumptions, the improvement by Year 4 in the UK's balance of trade would be £1.9 billion if VAT were cut from 20% to 5%.
Over a ten-year period, our computations indicate that the total improvement in the UK's balance of trade in response to a VAT reduction from 20% to 5% would be £23 billion (compared to a 2016 estimate of £22.2 billion), making a very significant contribution to the overall balance of trade position. The detailed year-by-year adjustment path is given in the Table overpage.

The Impact of Reduced VAT on Visitor Accommodation and Attractions 27
Pre-cut Year of Cut
Year -1 0 1 2 3 4 5 6 7 8 9 10
Net turnover under 'Do Nothing'
Accommodation sector ex F&B £17,537 £17,537 £17,274 £17,015 £16,759 £16,508 £16,260 £16,016 £15,776 £15,539 £15,306 £15,077
Attractions sector £1,959 £1,959 £1,930 £1,901 £1,872 £1,844 £1,816 £1,789 £1,762 £1,736 £1,710 £1,684
£19,496 £19,496 £19,203 £18,915 £18,631 £18,352 £18,077 £17,806 £17,538 £17,275 £17,016 £16,761
of which: overseas visitors
Accommodation sector ex F&B £7,015 £7,015 £6,909 £6,806 £6,704 £6,603 £6,504 £6,407 £6,310 £6,216 £6,123 £6,031
Attractions sector £784 £784 £772 £760 £749 £738 £727 £716 £705 £694 £684 £674
Foreign exchange earnings pre-reduction £7,798 £7,798 £7,681 £7,566 £7,453 £7,341 £7,231 £7,122 £7,015 £6,910 £6,807 £6,704
Net turnover post-VAT reduction
Accommodation sector ex F&B £17,537 £17,537 £18,364 £18,709 £18,915 £18,915 £18,915 £18,915 £18,915 £18,915 £18,915 £18,915
Attractions sector £1,959 £1,959 £2,124 £2,289 £2,453 £2,618 £2,783 £2,948 £3,113 £3,277 £3,442 £3,607
£19,496 £19,496 £20,488 £20,997 £21,369 £21,534 £21,698 £21,863 £22,028 £22,193 £22,358 £22,522
of which: overseas visitors
Accommodation sector ex F&B £7,015 £7,015 £7,346 £7,483 £7,566 £7,566 £7,566 £7,566 £7,566 £7,566 £7,566 £7,566
Attractions sector £784 £784 £850 £915 £981 £1,047 £1,113 £1,179 £1,245 £1,311 £1,377 £1,443
Foreign exchange earnings post-reduction £7,798 £7,798 £8,195 £8,399 £8,548 £8,613 £8,679 £8,745 £8,811 £8,877 £8,943 £9,009
Increase in forex earnings from overseas visitors £0 £0 £514 £833 £1,095 £1,273 £1,449 £1,623 £1,796 £1,967 £2,137 £2,305
Increase in domestic visitor expenditure post-reduction
Accommodation sector ex F&B £0 £0 £654 £1,016 £1,294 £1,445 £1,593 £1,739 £1,884 £2,026 £2,165 £2,303
Attractions sector £0 £0 £117 £233 £349 £464 £580 £695 £810 £925 £1,039 £1,154
£0 £0 £771 £1,249 £1,642 £1,909 £2,173 £2,435 £2,694 £2,950 £3,205 £3,457
of which: swtiched from overseas holidays
Accommodation sector ex F&B £0 £0 £196 £305 £388 £433 £478 £522 £565 £608 £650 £691
Attractions sector £0 £0 £58 £116 £174 £232 £290 £348 £405 £462 £520 £577
Savings in forex spending by domestic residents £0 £0 £255 £421 £562 £666 £768 £869 £970 £1,070 £1,169 £1,268
Total improvement in BoP compared to 'Do Nothing'
Increase in forex earnings from overseas visitors £0 £0 £514 £833 £1,095 £1,273 £1,449 £1,623 £1,796 £1,967 £2,137 £2,305
Savings in forex spending by domestic residents £0 £0 £255 £421 £562 £666 £768 £869 £970 £1,070 £1,169 £1,268
£0 £0 £768 £1,254 £1,657 £1,938 £2,217 £2,492 £2,766 £3,037 £3,306 £3,572
Total over 10 years £23,008
Post-Reduction Path of Adjustment
The Impact of Reduced VAT on Visitor Accommodation and Attractions 28
5.4 Conclusions
5.4.1 Impact of lower VAT on the UK’s Tourism Balance
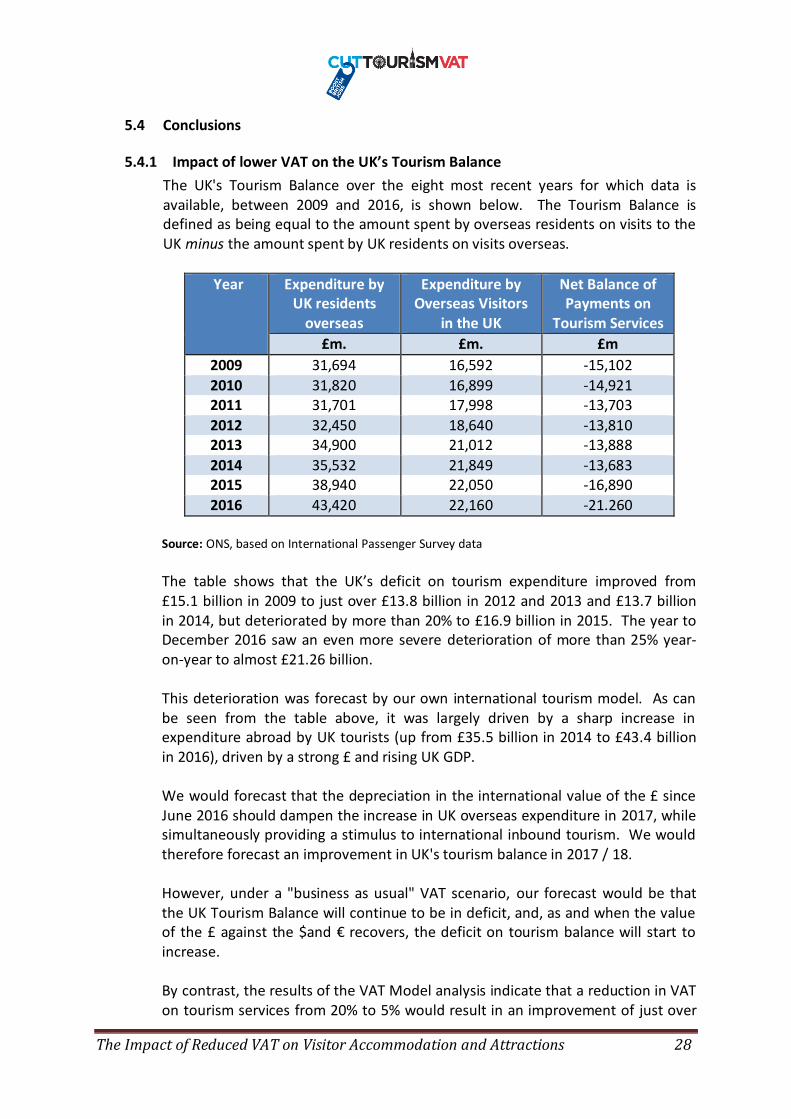
The UK's Tourism Balance over the eight most recent years for which data is available, between 2009 and 2016, is shown below. The Tourism Balance is defined as being equal to the amount spent by overseas residents on visits to the UK minus the amount spent by UK residents on visits overseas.
Year Expenditure by UK residents
overseas
Expenditure by Overseas Visitors
in the UK
Net Balance of Payments on
Tourism Services
£m. £m. £m
2009 31,694 16,592 -15,102
2010 31,820 16,899 -14,921 2011 31,701 17,998 -13,703
2012 32,450 18,640 -13,810 2013 34,900 21,012 -13,888
2014 35,532 21,849 -13,683 2015 38,940 22,050 -16,890
2016 43,420 22,160 -21.260
Source: ONS, based on International Passenger Survey data
The table shows that the UK’s deficit on tourism expenditure improved from £15.1 billion in 2009 to just over £13.8 billion in 2012 and 2013 and £13.7 billion in 2014, but deteriorated by more than 20% to £16.9 billion in 2015. The year to December 2016 saw an even more severe deterioration of more than 25% year-on-year to almost £21.26 billion. This deterioration was forecast by our own international tourism model. As can be seen from the table above, it was largely driven by a sharp increase in expenditure abroad by UK tourists (up from £35.5 billion in 2014 to £43.4 billion in 2016), driven by a strong £ and rising UK GDP. We would forecast that the depreciation in the international value of the £ since June 2016 should dampen the increase in UK overseas expenditure in 2017, while simultaneously providing a stimulus to international inbound tourism. We would therefore forecast an improvement in UK's tourism balance in 2017 / 18. However, under a "business as usual" VAT scenario, our forecast would be that the UK Tourism Balance will continue to be in deficit, and, as and when the value of the £ against the $and € recovers, the deficit on tourism balance will start to increase. By contrast, the results of the VAT Model analysis indicate that a reduction in VAT on tourism services from 20% to 5% would result in an improvement of just over
The Impact of Reduced VAT on Visitor Accommodation and Attractions 29
10%, or £2 billion, in the UK's external tourism balance once the full effects of the VAT reduction had fed through in Year 4 after the VAT reduction. Over time, there would be a progressive improvement in the position, to approximately £3.6 billion by Year 10.
5.4.2 Impact of lower VAT on the UK’s Balance of Trade
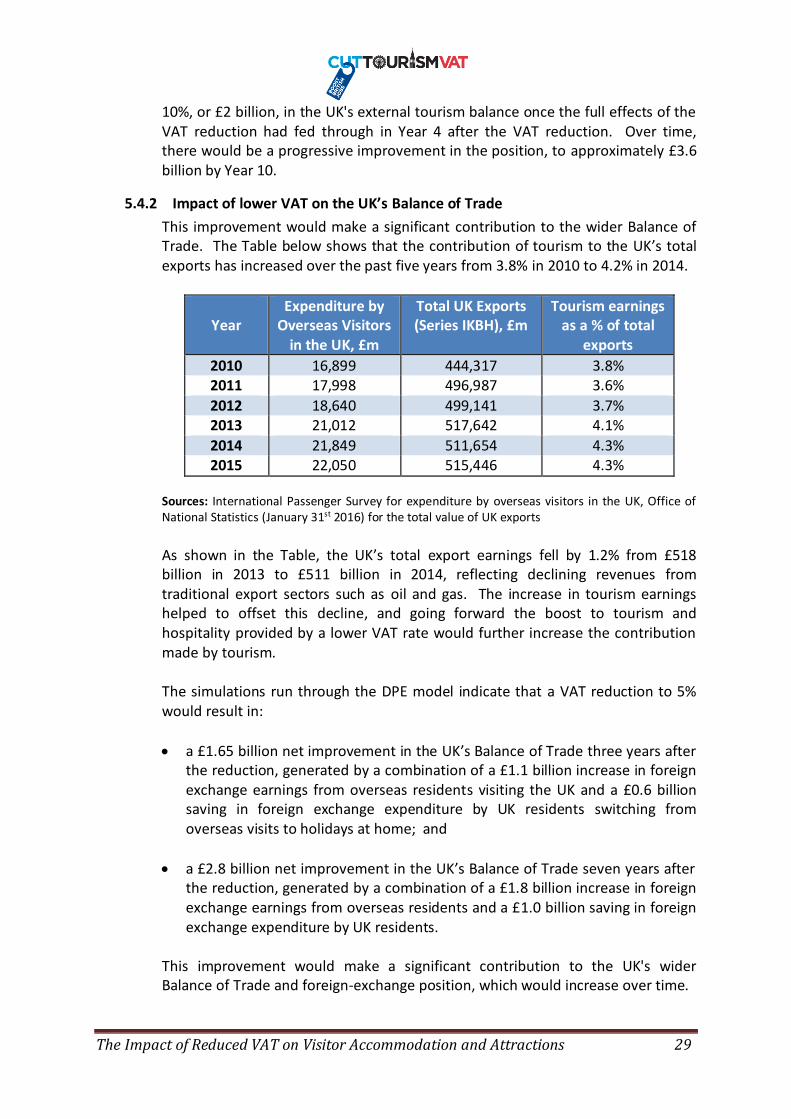
This improvement would make a significant contribution to the wider Balance of Trade. The Table below shows that the contribution of tourism to the UK’s total exports has increased over the past five years from 3.8% in 2010 to 4.2% in 2014.
Year
Expenditure by Overseas Visitors
in the UK, £m
Total UK Exports (Series IKBH), £m
Tourism earnings as a % of total
exports
2010 16,899 444,317 3.8% 2011 17,998 496,987 3.6%
2012 18,640 499,141 3.7% 2013 21,012 517,642 4.1%
2014 21,849 511,654 4.3% 2015 22,050 515,446 4.3%
Sources: International Passenger Survey for expenditure by overseas visitors in the UK, Office of National Statistics (January 31st 2016) for the total value of UK exports
As shown in the Table, the UK’s total export earnings fell by 1.2% from £518 billion in 2013 to £511 billion in 2014, reflecting declining revenues from traditional export sectors such as oil and gas. The increase in tourism earnings helped to offset this decline, and going forward the boost to tourism and hospitality provided by a lower VAT rate would further increase the contribution made by tourism. The simulations run through the DPE model indicate that a VAT reduction to 5% would result in:
a £1.65 billion net improvement in the UK’s Balance of Trade three years after the reduction, generated by a combination of a £1.1 billion increase in foreign exchange earnings from overseas residents visiting the UK and a £0.6 billion saving in foreign exchange expenditure by UK residents switching from overseas visits to holidays at home; and
a £2.8 billion net improvement in the UK’s Balance of Trade seven years after the reduction, generated by a combination of a £1.8 billion increase in foreign exchange earnings from overseas residents and a £1.0 billion saving in foreign exchange expenditure by UK residents.
This improvement would make a significant contribution to the UK's wider Balance of Trade and foreign-exchange position, which would increase over time.

The Impact of Reduced VAT on Visitor Accommodation and Attractions 30
5.4.3 Long term trends in the UK’s Tourism Balance
The figure below shows the UK's international tourism receipts and expenditure over the past 30 years (1977 - 2016 inclusive).
£0
£5,000
£10,000
£15,000
£20,000
£25,000
£30,000
£35,000
£40,000
£45,000
£50,000
£ m
illio
n
International tourismexpenditure by UK residentsoverseas
UK International TourismReceipts
The Figure shows that, in the late 1970s, the UK’s international tourism receipts actually exceeded its international tourism expenditure, generating a modest surplus on the tourism balance. Since then, as can be clearly seen in chart, the growth of tourism expenditure by UK residents overseas has outstripped receipts from international visitors to the UK, resulting in a widening tourism deficit. We predicted this as long ago as the mid-1990s, based upon econometric analysis which revealed that any given increase in income by UK residents would drive a higher rate of growth of expenditure by UK residents overseas than an equivalent increase in income by OECD visitors to the UK1. The chart shows that the increase in international tourism expenditure was reversed over the four years after 2008, as predicted by our tourism forecasting model, driven by a decline in UK real incomes following the international financial crisis. However, as real incomes recovered and the £ strengthened against other international currencies after 2011, the chart shows that UK expenditure overseas started to rise sharply again. This in turn led to a widening of the UK's tourism deficit to a record of £21.3 billion in 2016, exceeding the previous worst deficit of £20.5 billion recorded in 2008. The total deficit year by year since 1977 is shown in figure below.
1 In technical terms, the income elasticity of demand of UK residents for tourism overseas is greater than the income elasticity of demand of overseas visitors to the UK.

The Impact of Reduced VAT on Visitor Accommodation and Attractions 31
-25,000
-20,000
-15,000
-10,000
-5,000
0
5,000£ m
illio
n
UK Tourism Deficit (International Tourirsm Receipts - International Touruism Expenditure), £ million, 1977 - 2016
In the current year (2017) our tourism forecasting model would predict an improvement (reduction) in the tourism deficit, driven by the fall in the value of the £, which will tend to stimulate inbound tourism, while having a dampening effect on outbound tourism – with more UK residents likely to take holidays at home as a result of the increase in the cost of foreign holidays in £ Sterling terms. However, any improvement should not be taken as a signal that the long-term deterioration in the UK's tourism balance is about to reverse. On the contrary, our prediction would remain – as it has over the last 20 years – that, under a "business as usual" VAT scenario, the UK’s tourism balance is likely to remain in deficit and progressively deteriorate over time, as a consequence of the competitive disadvantage suffered by the UK tourism industry compared to its major competitors because of the onerous VAT burden.

The Impact of Reduced VAT on Visitor Accommodation and Attractions 32
Annexe 1: The Full DPE Model

The Impact of Reduced VAT on Visitor Accommodation and Attractions 33
Model Inputs Parameter Value, Source & Comments
£ million
I. Annual Business Inquiry SIC Data
Accommodation sector turnover net of VAT in 2015, £ million
55 Visitor accommodation £23,326Source: ONS, 'Annual Business Inquiry: Section I - Accommodation and food service activities', Release date
10/11/2016 - f igures for 2015
of which:
55.1 Hotels and similar accommodation £17,368NB: This includes F&B sales as w ell as the provision of accommodation services - F&B sales accounting for
approximately one-third of hotel turnover
55.2 Holiday and other short stay accommodation £2,178
55.3 Camping grounds, recreational vehicle parks and trailer parks £2,965
55.9 Other accommodation £815
£23,326
Accommodation sector VAT payments in 2015, £ million
55 Visitor accommodation £3,973Source: ONS, 'Annual Business Inquiry: Section I - Accommodation and food service activities', Release date
10/11/2016 - f igures for 2015
of which:
55.1 Hotels and similar accommodation £3,165NB: This includes F&B sales as w ell as the provision of accommodation services - F&B sales accounting for
approximately one-third of hotel turnover
55.2 Holiday and other short stay accommodation £354
55.3 Camping grounds, recreational vehicle parks and trailer parks £428
55.9 Other accommodation £26
£3,973
Accommodation sector VAT payments as a % of net turnover in 2008
55 Visitor accommodation 17.0% Source: Derived from ONS, 'Annual Business Inquiry' data - dividing VAT through by net turnover
of which:
55.1 Hotels and similar accommodation 18.2% Source: Derived from ONS, 'Annual Business Inquiry' data - dividing VAT through by net turnover
55.2 Holiday and other short stay accommodation 16.3% Source: Derived from ONS, 'Annual Business Inquiry' data - dividing VAT through by net turnover
55.3 Camping grounds, recreational vehicle parks and trailer parks 14.4% Source: Derived from ONS, 'Annual Business Inquiry' data - dividing VAT through by net turnover
55.9 Other accommodation 3.2% Source: Derived from ONS, 'Annual Business Inquiry' data - dividing VAT through by net turnover
Attractions sector turnover net of VAT, £ million
91.03 Historic sites and buildings £468Source: ONS, 'Annual Business Inquiry: Section R - Arts, entertainment and recreation', Release date Nov 2016.
Figues for 2015.
91.04 Botanical and zoological gardens & nature reserve activities £604Source: ONS, 'Annual Business Inquiry: Section R - Arts, entertainment and recreation', Release date Nov 2016.
Figues for 2015.
93.21 Amusement parks and theme parks £887Source: ONS, 'Annual Business Inquiry: Section R - Arts, entertainment and recreation', Release date Nov 2016.
Figues for 2015.
£1,959

The Impact of Reduced VAT on Visitor Accommodation and Attractions 34
Parameter Value, Source & Comments
£ million
II. 2011 Baseline Net Turnover and VAT Receipts
Forecast position in Year 1 - gross turnover
Accommodation sector gross turnover £27,299 Based on 2015 statistics
of which: accommodation services £20,455
hotel F&B services £6,844 Estimated on the basis that one-third of hotel turnover is accounted for by F&B sales, tw o-thirds by accommodation
£27,299
Attractions sector gross turnover £2,293Computed on the basis that VAT forms the same proportion of gross turnover in the attractions sector as in the
accommodation sector
Forecast position in Year 1 - net turnover
Accommodation sector net turnover £23,326 Based on 2015 statistics, as reported in November 2016
of which: accommodation services £17,537
hotel F&B services £5,789 Estimated on the basis that one-third of hotel turnover is accounted for by F&B sales, tw o-thirds by accommodation
£23,326
Attractions sector net turnover £1,959
Forecast position in Year 1 - VAT
Accommodation sector VAT £3,973 Based on 2015 statistics, as reported in November 2016
of which: accommodation services £2,918 Derived from ONS, Annual Business Inquiry Data
hotel F&B services £1,055 Estimated on the basis that one-third of hotel turnover is accounted for by F&B sales, tw o-thirds by accommodation
£3,973
% of Accommodation Sector Turnover accounted for by Business 40.0%
Business customers can reclaim VAT paid on their services, and hence this element does not represent a net loss to
the Exchequer. Source: Consultants' estimate based on industry data and EU benchmarks (close to the German
percentage as estimated by IFO, Munich)
Total accomodation services VAT £2,918
Accommodation services VAT reclaimable by business clients £1,167Computed by multiplying total VAT charged for accommodation services, multiplied by the percentage accounted for
by business customers w ho can then reclaim it
Non-reclaimable VAT on accommodation services £1,751
% of Attractions Sector Turnover accounted for by Business 0.0%Source: Consultants' estimate - it is assumed all attractions' turnover is accounted for by leisure rather than business
customers
Attractions sector VAT £334Source : ONS Business Inquiry data does not provide separate f igures for VAT for the attractions sector, so, for the
purposes of the analysis, the same realised VAT rate is assumed as for the accommodation sector
Attractions sector VAT reclaimable by business clients £0Computed by multiplying total VAT charged for attractions, multiplied by the percentage accounted for by business
customers w ho can then reclaim it
Non-reclaimable VAT om accommodation services £334
Percentage difference in annual real growth in sector turnover under a
"no VAT change" scenario compared to a "reduce VAT to 5%"
scenario
-1.50%Source: An extrapolation of historic trends for accommodation, and based on historic evidence of the dynamic
stimulus given to sector turnover by VAT reductions in other domiciles such as the Republic of Ireland
Percentage difference in annual real growth in sector turnover under
the VAT reduction scenario being modelled-1.50%
Assumes a linear relationship betw een the % reduction in VAT and the dynamic stimulus - so, for example, a 7.5%
VAT reduction w ould have half the dynamic impact of a 15% VAT reduction

The Impact of Reduced VAT on Visitor Accommodation and Attractions 35
Parameter Value, Source & Comments
£ million
III. 2013 Baseline % of Net Turnover
Accommodation sector:
Personnel expenses - % of turnover net of VAT 28.2%Source: Derived from ONS data giving total employment costs of £6,314 m and payments to sub-contractors of £253
m out of net sector turnover in 2015
Training expenses - % of turnover net of VAT 3.0% Source: Consultants' estimate, based on c 10% of employee remuneration
Investment - % of turnover net of VAT 12.3%Source: Derived from ONS data giving net capital expenditure of £2,880 m out of net sector turnover in 2015
(acquisitions of £3,173 m minus disposals of £293 m)
Attractions sector:
Personnel expenses - % of turnover net of VAT 51.1%Source: Derived from ONS data giving total employment costs of £879 m and payments to sub-contractors of £123 m
out of net sector turnover in 2015 for SIC categories 91.03, 91.04 and 93.21
Training expenses - % of turnover net of VAT 5.0% Source: Consultants' estimate, based on c 10% of employee remuneration
Investment - % of turnover net of VAT 14.5%Source: Derived from ONS data giving net capital expenditure of £284 m out of total sector turnover in 2015 for SIC
categories 91.03, 91.04 and 93.21
IVI. Allocation VAT reduction
VAT rate applying pre-reduction 20.00% Standard rate applying from January 2011 and continuing into 2016
VAT rate applying post-reduction 5.00%
Does it apply to children only? 0 0 = No; 1 = VAT reduction only for children under 12; 2 = VAT reduction for all children under 15
Effective VAT rate applying post-reduction 5.00%
Total VAT reduction 15.00%
Proportionate allocation
Allocated to price cuts 75.0%Source: Based on commitment by members of the Cut Tourism VAT to pass through most of any reduction in VAT in
low er prices
Allocated to higher salaries 7.0%
Allocated to training 3.0%
Allocated to greater sector investment 10.0%
Allocated to higher profits 5.0%
100.0%
Price cut sensitivity factor 100.0%
Adjustment path:
Percent of total price adjustment in Year 1 60% Based on evidence of the path of adjustment experienced in Ireland and France, and the dynamic equations
Percent of total price adjustment in Year 2 85% in Dr Perman's econometric models
Percent of total price adjustment in Year 3 100%
Percent of total price adjustment in Year 4 100% NB: It is assumed that the balance not passed through is largely retained in additional profits
Percentage allocation of VAT reduction:
Lower prices 11.25% Computed by multiplying the % reduction in VAT by the % allocation of this reduction
Higher employee remuneration - more staff 1.05%
Greater training expenditure 0.45%
Greater sector investment 1.50%
Higher profits 0.75%
Total reduction in VAT rates 15.00%

The Impact of Reduced VAT on Visitor Accommodation and Attractions 36
Parameter Value, Source & Comments
£ million
V. Elasticities Measuring how sector turnover responds to changes in each parameter
Price -1.2Source: Derived from Roger Perman econometric estimates, October 2010. I.e., each 1% fall in price results in a
1.2% increase in demand. Note this is a low er elasticity than that of 2001, w hen the estimate w as -1.28
Personnel expenses 0.2Source: Consultants' estimates and case studies. Each 1% increase in employee remuneration real w ages results in
a 0.2% increase in sales, as a result of greater productivity.
Training 0.2Source: Consultants' estimates and case studies. Each 1% increase in training results in a 0.2% increase in sales,
as a result of greater productivity.
Investment 0.3
Source: Consultants' estimates and case studies. Each 1% increase in investment results in a 0.2% annual increase
in sales. This is based on an estimated average profit margin of 30%, so that an investment of £1,000 w ould result in
an increase in annual profitability of £1,000 x (30% x 20%) or £60 (6%). If it w as less than this, it w as unlikely that
the investment w ould occur.
VI. Macroeconomic factors
Shadow Economy and VAT Base
Size of the shadow economy as a % of officially reported turnover 14.00%
Source: University of Linz estimates and Report by the Comptroller and Auditor-General, Audit of Assumptions for
Budget 2010, National Audit Off ice March 24th 2010. This report indicated that the VAT Gap - defined as the
difference betw een the amount that the UK Government should in theory collect from VAT, and the amount that it
actually does collect - had w idened from 12% of potential VAT receipts in the early 1990s to 14.5% by 2009/10 -
suggesting that the size of the Shadow Economy in the UK may be increasing
% reduction in the size of the shadow economy post-VAT cut 33.00%
Source: French evidence since the reduction in VAT on restaurant meals in July 2009. The disincentive for small
companies to remain below the VAT threshold, or for cash-based transactions to be reported for tax purposes,
w ould be considerably reduced by a VAT reduction. The reduction is estimated as one-third for a 15% VAT
reduction, and proportionate to that for smaller reductions
Employment, Income Tax and Social Security Impact
Turnover per job: visitor accommodation sector £52,536Source: ONS Business Inquiry data, based on net sector turnover of £23,326 m divided through by total sector
employment of 444,000 (average during the year) full- and part-time in 2015
Turnover per job: visitor attraction sector £34,982Source: ONS Business Inquiry data, based on net sector turnover divided through by total sector employment of
56,000 (average during the year) full- and part-time during 2015
Ratio of Full Time Employment (FTE) equivalents to Total Employment 0.56Source: Based on ONS Business Inquiry data 2015 for the number of full-time employees and total employees (full-
and part-time) (average during the year)
Average remuneration per job: visitor accommodation sector £14,221Source: ONS Business Inquiry data. This gives total employment costs of £6,314 m in 2015, and total sector
employment of 444,000 (average during the year)
Average remuneration per job: visitor attraction sector £15,696Source: ONS Business Inquiry data. This gives total employment costs of £879 m in 2015, and total sector
employment of 56,000 (average during the year)
Average rate of income tax & National Insurance 32.0% Source: Based on standard rate of income tax of 20% plus 12% National Insurance contribution
% of additional jobs taken by those previously unemployed or
economically inactive60.0%
Source: estimate based on the fact that many industry employees w ill be young people & part-time w orkers, many
new to the w orkforce
Social security payments - average per person unemployed p.a. £8,865Source: Includes jobseeker's allow ance, housing benefit and council tax benefit - estimated annual average based
on 2011 estimate uprated by 6% to allow for increases since then

The Impact of Reduced VAT on Visitor Accommodation and Attractions 37
Parameter Value, Source & Comments
£ million
Profitability and Corporation Tax Impact
Percentage operating profit margin 30.0%As many costs are f ixed, any increase in turnover is estimated to increase operating profits by 30p for every £1
increase
Pre-tax profits as a % of operating profits 70.0%Based on the assumption that 30% of (unadjusted) operating profits are absorbed by interest payments and other tax
deductible non-operating costs, on average
Proportion of post-tax profits distributed as dividends 51.8%Source: Financial Times 30/01/17, giving a dividend cover ratio for the FTSE 250 excluding investment companies of
1.93, implying a dividend payout ratio of 1/1.93 = 51.8%.
Percentage tax on dividend payouts 20.0%Source: Assumed to equate to the standard rate of income and corporation tax. This is a conservative estimate -
many private investors w ill pay tax at a 40% or 45% rate.
Applicable rate of corporation tax 20.0% Source: 2016/17 standard rate of corporation tax
Rates Impact
Percent of increased turnover feeding through in higher business rates 1.67%Source: estimate based on business rates receipts of £26.1 bn in 2012/13 (IFS data), representing 1.67% of UK
GDP of £1,571 bn (ONS Data for GDP - Series YBHA, Q2 2012 to Q1 2013)
Multiplier effects
Multiplier 1.67Gross multiplier - applying formula 1/(1-c) w here c = marginal consumption w ithin the UK and is estimated as 40% of
any change in income
Base year 2016
Real Discount Rate 3.50% Treasury Green Book 2003 Edition
Inflation rate 2.00% Based on the Bank of England's CPI target
% of total turnover accounted for by overseas visitors:
Accommodation services 40.0% Source: Indicative estimate for accommodation services
Visitor attractions and amusement parks 40.0% Source: Indicative estimate for commercial visitor attractions
% of additional domestic expenditure that would have otherwise been
spent abroad
Accommodation services 30.0%Source: Indicative estimate for accommodation services, based on Irish experience - excluding business turnover,
50% of additional sector turnover is estimated to be sw itched from overseas holidays
Visitor attractions and amusement parks 50.0%Source: Indicative estimate for vitior attractions - excluding business turnover, 50% of additional sector turnover is
estimated to be sw itched from overseas holidays
% of total turnover accounted for by children:
Children under 12 20.0% Source: Merlin estimate
Children under 15 25.0% Source: Merlin estimate Accommodation Sector Adjustment Path

The Impact of Reduced VAT on Visitor Accommodation and Attractions 38
Pre-cut Year of Cut
Year -1 0 1 2 3 4 5 6 7 8 9 10
"Business as Usual" scenario
Net sector turnover - accommodation services ex F&B £17,537 £17,537 £17,274 £17,015 £16,759 £16,508 £16,260 £16,016 £15,776 £15,539 £15,306 £15,077
VAT base (sales to leisure customers, non-reclaimable) £10,522 £10,522 £10,364 £10,209 £10,056 £9,905 £9,756 £9,610 £9,466 £9,324 £9,184 £9,046
A. Total VAT Yield £1,751 £1,751 £1,725 £1,699 £1,673 £1,648 £1,623 £1,599 £1,575 £1,551 £1,528 £1,505
Effective VAT rate as a % of VAT base 16.6% 16.6% 16.6% 16.6% 16.6% 16.6% 16.6% 16.6% 16.6% 16.6% 16.6% 16.6%
"Reduced VAT Rate" scenario
Impact 1: Immediate loss of yield on existing VAT base - non-reclaimable sales to leisure customers
Yield @ 20% £1,751 £1,751
B1. VAT Yield post-reduction £438 £438 £438 £438 £438 £438 £438 £438 £438 £438
Sub-total (1) : net direct loss of VAT receipts £0 £0 -£1,286.8 -£1,261 -£1,235 -£1,210 -£1,186 -£1,161 -£1,137 -£1,114 -£1,090 -£1,068
Impact 2: Gain in VAT yield due to higher sector turnover
VAT base pre-VAT reduction £10,522 £10,522 £10,522 £10,522 £10,522 £10,522 £10,522 £10,522 £10,522 £10,522 £10,522 £10,522
Increase in VAT base as a result of higher turnover £0 £0 £827 £1,172 £1,379 £1,379 £1,379 £1,379 £1,379 £1,379 £1,379 £1,379
B2. Gain in VAT Yield on increased turnover £0 £0 £41 £59 £69 £69 £69 £69 £69 £69 £69 £69
Impact 3: Gain in VAT yield due to wider base
Widening of VAT base stimulated by lower VAT rate £0 £0 £486 £689 £810 £810 £810 £810 £810 £810 £810 £810
B3. VAT Yield on wider base at reduced rate £0 £0 £24 £34 £41 £41 £41 £41 £41 £41 £41 £41
Impact 4: Gain in income tax yields from additional employment
Sector turnover under "business as usual" £17,537 £17,537 £17,274 £17,015 £16,759 £16,508 £16,260 £16,016 £15,776 £15,539 £15,306 £15,077
Increase in sector turnover under "reduced VAT" compared to "business as usual" £0 £0 £985 £1,485 £1,845 £1,996 £2,145 £2,291 £2,435 £2,577 £2,717 £2,855
Number of sector jobs under "business as usual" 333,803 333,803 328,796 323,864 319,006 314,221 309,507 304,865 300,292 295,787 291,351 286,980
Number of additional jobs supported by increased turnover 0 0 18,751 28,271 35,122 37,993 40,821 43,607 46,350 49,053 51,715 54,337
of which: net new job creation 0 0 11,250 16,962 21,073 22,796 24,493 26,164 27,810 29,432 31,029 32,602
Wages from net new jobs created, £m £0 £0 £160 £241 £300 £324 £348 £372 £395 £419 £441 £464
Income tax and national insurance derived from new jobs £0 £0 £51 £77 £96 £104 £111 £119 £127 £134 £141 £148
Income tax and NI derived from jobs formerly unreported £0 £0 £44 £62 £73 £73 £73 £73 £73 £73 £73 £73
B4. Income and national insurance derived from new & previously unreported jobs £0 £0 £95 £139 £169 £177 £184 £192 £200 £207 £214 £221
Impact 5: Gain in income tax yields from higher wages
B5. Income and national insurance derived from higher wages £0 £0 £18 £25 £29 £29 £29 £29 £29 £29 £29 £29
Impact 6: Savings in social security payments
Net new job creation 0 0 11,250 16,962 21,073 22,796 24,493 26,164 27,810 29,432 31,029 32,602
Savings in social security payments in the formal sector £0 £0 £100 £150 £187 £202 £217 £232 £247 £261 £275 £289
Savings in social security payments in jobs formerly unreported £0 £0 £7 £10 £12 £12 £12 £12 £12 £12 £12 £12
B6. Total social security savings £0 £0 £107 £160 £198 £214 £229 £244 £258 £273 £287 £301
Impact 7: Gain in corporation tax yields from higher profit margin
Sector turnover prior to VAT reduction £10,522 £10,522 £10,522 £10,522 £10,522 £10,522 £10,522 £10,522 £10,522 £10,522 £10,522 £10,522
% increase in operating profit margin as a result of VAT reduction 0.0% 0.0% 3.8% 2.6% 2.3% 2.3% 2.3% 2.3% 2.3% 2.3% 2.3% 2.3%
Effective rate of corporation tax on operating profit margin 15.0% 15.0% 15.0% 15.0% 15.0% 15.0% 15.0% 15.0% 15.0% 15.0% 15.0% 15.0%
Corporation tax from higher margins on current turnover £0 £0 £59 £42 £36 £36 £36 £36 £36 £36 £36 £36
Corporation tax from previously undeclared turnover £0 £0 £20 £29 £34 £34 £34 £34 £34 £34 £34 £34
B7. Total corporation tax increase from existing turnover £0 £0 £80 £71 £70 £70 £70 £70 £70 £70 £70 £70
Post-Reduction Path of Adjustment
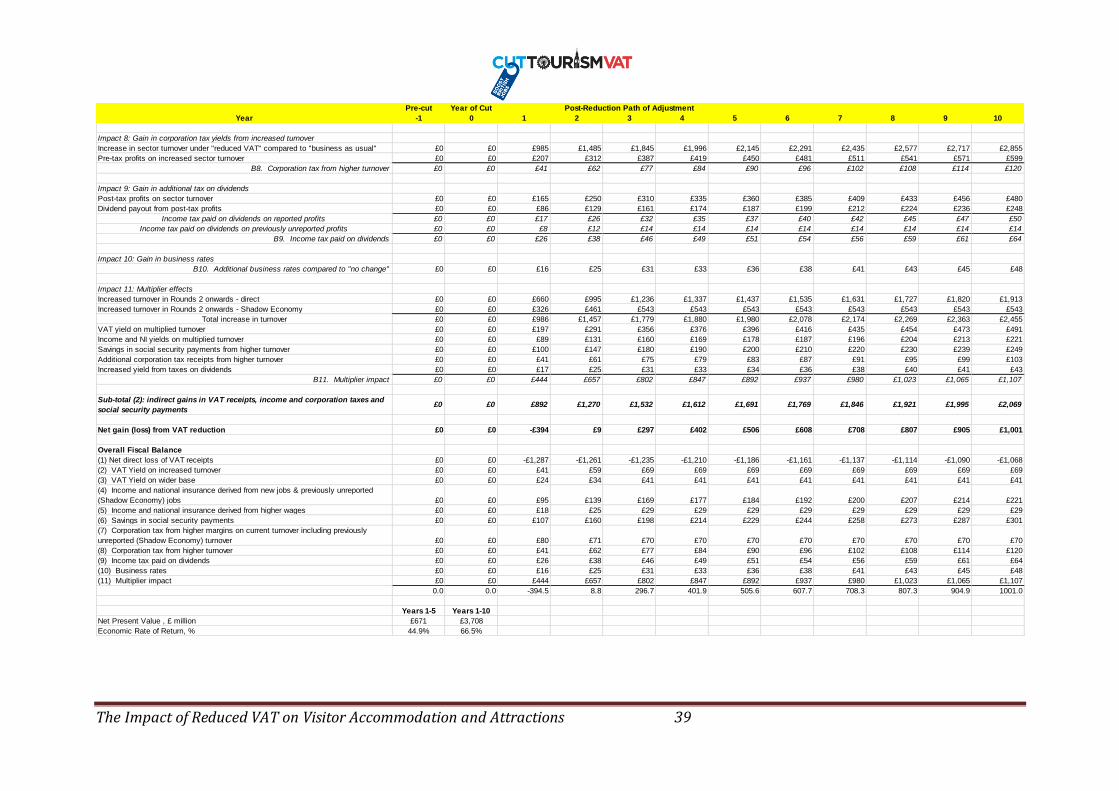
The Impact of Reduced VAT on Visitor Accommodation and Attractions 39
Pre-cut Year of Cut
Year -1 0 1 2 3 4 5 6 7 8 9 10
Impact 8: Gain in corporation tax yields from increased turnover
Increase in sector turnover under "reduced VAT" compared to "business as usual" £0 £0 £985 £1,485 £1,845 £1,996 £2,145 £2,291 £2,435 £2,577 £2,717 £2,855
Pre-tax profits on increased sector turnover £0 £0 £207 £312 £387 £419 £450 £481 £511 £541 £571 £599
B8. Corporation tax from higher turnover £0 £0 £41 £62 £77 £84 £90 £96 £102 £108 £114 £120
Impact 9: Gain in additional tax on dividends
Post-tax profits on sector turnover £0 £0 £165 £250 £310 £335 £360 £385 £409 £433 £456 £480
Dividend payout from post-tax profits £0 £0 £86 £129 £161 £174 £187 £199 £212 £224 £236 £248
Income tax paid on dividends on reported profits £0 £0 £17 £26 £32 £35 £37 £40 £42 £45 £47 £50
Income tax paid on dividends on previously unreported profits £0 £0 £8 £12 £14 £14 £14 £14 £14 £14 £14 £14
B9. Income tax paid on dividends £0 £0 £26 £38 £46 £49 £51 £54 £56 £59 £61 £64
Impact 10: Gain in business rates
B10. Additional business rates compared to "no change" £0 £0 £16 £25 £31 £33 £36 £38 £41 £43 £45 £48
Impact 11: Multiplier effects
Increased turnover in Rounds 2 onwards - direct £0 £0 £660 £995 £1,236 £1,337 £1,437 £1,535 £1,631 £1,727 £1,820 £1,913
Increased turnover in Rounds 2 onwards - Shadow Economy £0 £0 £326 £461 £543 £543 £543 £543 £543 £543 £543 £543
Total increase in turnover £0 £0 £986 £1,457 £1,779 £1,880 £1,980 £2,078 £2,174 £2,269 £2,363 £2,455
VAT yield on multiplied turnover £0 £0 £197 £291 £356 £376 £396 £416 £435 £454 £473 £491
Income and NI yields on multiplied turnover £0 £0 £89 £131 £160 £169 £178 £187 £196 £204 £213 £221
Savings in social security payments from higher turnover £0 £0 £100 £147 £180 £190 £200 £210 £220 £230 £239 £249
Additional corporation tax receipts from higher turnover £0 £0 £41 £61 £75 £79 £83 £87 £91 £95 £99 £103
Increased yield from taxes on dividends £0 £0 £17 £25 £31 £33 £34 £36 £38 £40 £41 £43
B11. Multiplier impact £0 £0 £444 £657 £802 £847 £892 £937 £980 £1,023 £1,065 £1,107
Sub-total (2): indirect gains in VAT receipts, income and corporation taxes and
social security payments£0 £0 £892 £1,270 £1,532 £1,612 £1,691 £1,769 £1,846 £1,921 £1,995 £2,069
Net gain (loss) from VAT reduction £0 £0 -£394 £9 £297 £402 £506 £608 £708 £807 £905 £1,001
Overall Fiscal Balance
(1) Net direct loss of VAT receipts £0 £0 -£1,287 -£1,261 -£1,235 -£1,210 -£1,186 -£1,161 -£1,137 -£1,114 -£1,090 -£1,068
(2) VAT Yield on increased turnover £0 £0 £41 £59 £69 £69 £69 £69 £69 £69 £69 £69
(3) VAT Yield on wider base £0 £0 £24 £34 £41 £41 £41 £41 £41 £41 £41 £41
(4) Income and national insurance derived from new jobs & previously unreported
(Shadow Economy) jobs £0 £0 £95 £139 £169 £177 £184 £192 £200 £207 £214 £221
(5) Income and national insurance derived from higher wages £0 £0 £18 £25 £29 £29 £29 £29 £29 £29 £29 £29
(6) Savings in social security payments £0 £0 £107 £160 £198 £214 £229 £244 £258 £273 £287 £301
(7) Corporation tax from higher margins on current turnover including previously
unreported (Shadow Economy) turnover £0 £0 £80 £71 £70 £70 £70 £70 £70 £70 £70 £70
(8) Corporation tax from higher turnover £0 £0 £41 £62 £77 £84 £90 £96 £102 £108 £114 £120
(9) Income tax paid on dividends £0 £0 £26 £38 £46 £49 £51 £54 £56 £59 £61 £64
(10) Business rates £0 £0 £16 £25 £31 £33 £36 £38 £41 £43 £45 £48
(11) Multiplier impact £0 £0 £444 £657 £802 £847 £892 £937 £980 £1,023 £1,065 £1,107
0.0 0.0 -394.5 8.8 296.7 401.9 505.6 607.7 708.3 807.3 904.9 1001.0
Years 1-5 Years 1-10
Net Present Value , £ million £671 £3,708
Economic Rate of Return, % 44.9% 66.5%
Post-Reduction Path of Adjustment

The Impact of Reduced VAT on Visitor Accommodation and Attractions 40
Attractions Sector Adjustment Path Pre-cut Year of Cut
Year -1 0 1 2 3 4 5 6 7 8 9 10
"Business as Usual" scenario
Net sector turnover - attractions £1,959 £1,959 £1,930 £1,901 £1,872 £1,844 £1,816 £1,789 £1,762 £1,736 £1,710 £1,684
VAT base (sales to leisure customers, non-reclaimable) £1,959 £1,959 £1,930 £1,901 £1,872 £1,844 £1,816 £1,789 £1,762 £1,736 £1,710 £1,684
A. Total VAT Yield £334 £334 £329 £324 £319 £314 £309 £305 £300 £296 £291 £287
Effective VAT rate as a % of VAT base 17.0% 17.0% 17.0% 17.0% 17.0% 17.0% 17.0% 17.0% 17.0% 17.0% 17.0% 17.0%
"Reduced VAT Rate" scenario
Impact 1: Immediate loss of yield on existing VAT base - non-reclaimable sales to leisure customers
Yield @ 20% £334 £334
B1. VAT Yield at reduced rate £83 £83 £83 £83 £83 £83 £83 £83 £83 £83
Sub-total (1) : net direct loss of VAT receipts £0 £0 -£245 -£240 -£235 -£231 -£226 -£221 -£217 -£212 -£208 -£203
Impact 2: Gain in VAT yield due to higher sector turnover
VAT base pre-reduction £1,959 £1,959 £1,959 £1,959 £1,959 £1,959 £1,959 £1,959 £1,959 £1,959 £1,959 £1,959
Increase in VAT base as a result of higher turnover £0 £0 £165 £233 £275 £275 £275 £275 £275 £275 £275 £275
B2. Gain in VAT Yield on increased turnover £0 £0 £8 £12 £14 £14 £14 £14 £14 £14 £14 £14
Impact 3: Gain in VAT yield due to wider base
Widening of VAT base stimulated by lower VAT rate £0 £0 £54 £77 £91 £91 £91 £91 £91 £91 £91 £91
B3. VAT Yield on wider base at reduced rate £0 £0 £3 £4 £5 £5 £5 £5 £5 £5 £5 £5
Impact 4: Gain in income tax yields from additional employment
Sector turnover under "business as usual" £1,959 £1,959 £1,930 £1,901 £1,872 £1,844 £1,816 £1,789 £1,762 £1,736 £1,710 £1,684
Increase in sector turnover under "reduced VAT" compared to "business as usual" £0 £0 £194 £292 £362 £390 £417 £444 £471 £498 £524 £549
Number of sector jobs under "business as usual" 56,000 56,000 55,160 54,333 53,518 52,715 51,924 51,145 50,378 49,622 48,878 48,145
Number of additional jobs supported by increased turnover 0 0 5,551 8,341 10,334 11,137 11,927 12,706 13,473 14,229 14,973 15,707
of which: net new job creation 0 0 3,331 5,005 6,200 6,682 7,156 7,624 8,084 8,537 8,984 9,424
Wages from net new jobs created, £m £0 £0 £52 £79 £97 £105 £112 £120 £127 £134 £141 £148
Income tax and national insurance derived from new jobs £0 £0 £17 £25 £31 £34 £36 £38 £41 £43 £45 £47
Income tax and NI derived from jobs formerly unreported £0 £0 £5 £7 £8 £8 £8 £8 £8 £8 £8 £8
B4. Income and national insurance derived from new & previously unreported jobs £0 £0 £22 £32 £39 £42 £44 £46 £49 £51 £53 £55
Impact 5: Gain in income tax yields from higher wages
B5. Income and national insurance derived from higher wages £0 £0 £3 £5 £6 £6 £6 £6 £6 £6 £6 £6
Impact 6: Savings in social security payments
Net new job creation 0 0 3,331 5,005 6,200 6,682 7,156 7,624 8,084 8,537 8,984 9,424
Savings in social security payments in the formal sector £0 £0 £30 £44 £55 £59 £63 £68 £72 £76 £80 £84
Savings in social security payments in jobs formerly unreported £0 £0 £1 £2 £2 £2 £2 £2 £2 £2 £2 £2
B6. Total social security savings £0 £0 £31 £46 £57 £61 £65 £70 £74 £78 £82 £85
Impact 7: Gain in corporation tax yields from higher profit margin
Sector turnover prior to VAT reduction £1,959 £1,959 £1,959 £1,959 £1,959 £1,959 £1,959 £1,959 £1,959 £1,959 £1,959 £1,959
% increase in operating profit margin as a result of VAT reduction 0.0% 0.0% 3.8% 2.6% 2.3% 2.3% 2.3% 2.3% 2.3% 2.3% 2.3% 2.3%
Effective rate of corporation tax on operating profit margin 15.0% 15.0% 15.0% 15.0% 15.0% 15.0% 15.0% 15.0% 15.0% 15.0% 15.0% 15.0%
Corporation tax from higher margins on current turnover £0 £0 £11 £8 £7 £7 £7 £7 £7 £7 £7 £7
Corporation tax from previously undeclared turnover £0 £0 £2 £3 £4 £4 £4 £4 £4 £4 £4 £4
B7. Total corporation tax increase from existing turnover £0 £0 £13 £11 £10 £10 £10 £10 £10 £10 £10 £10
Post-Reduction Path of Adjustment Post-Reduction Path of Adjustment
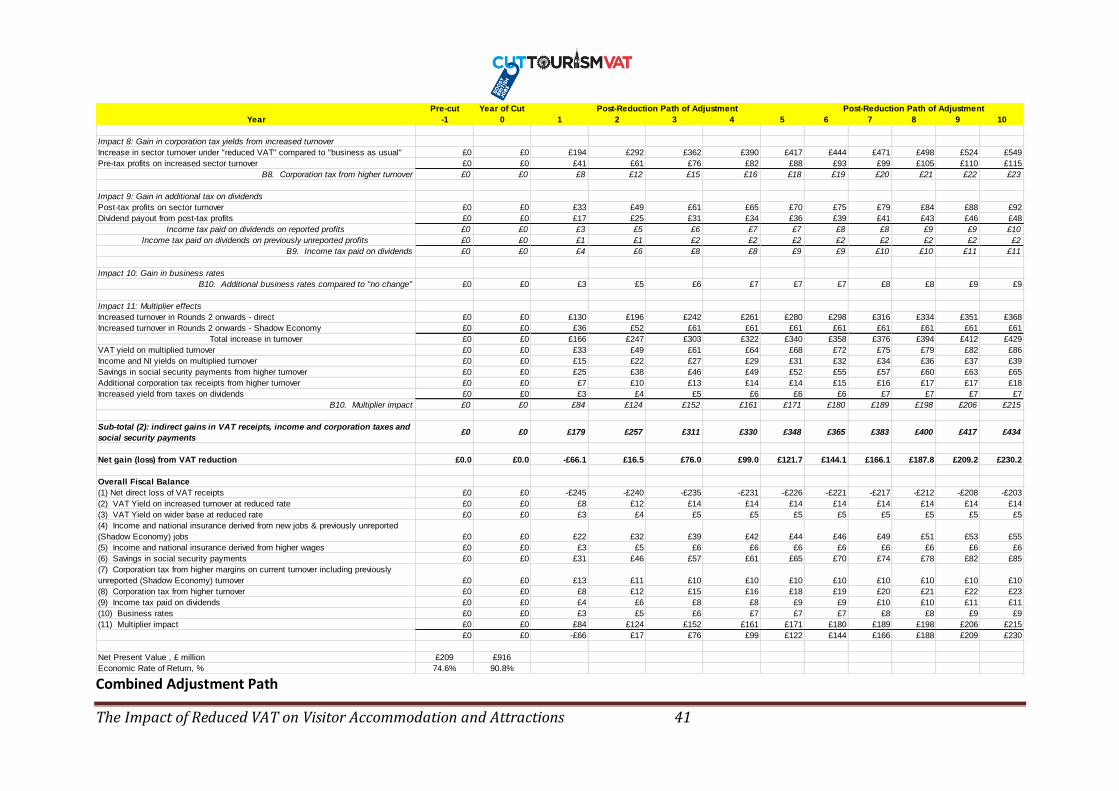
The Impact of Reduced VAT on Visitor Accommodation and Attractions 41
Pre-cut Year of Cut
Year -1 0 1 2 3 4 5 6 7 8 9 10
Impact 8: Gain in corporation tax yields from increased turnover
Increase in sector turnover under "reduced VAT" compared to "business as usual" £0 £0 £194 £292 £362 £390 £417 £444 £471 £498 £524 £549
Pre-tax profits on increased sector turnover £0 £0 £41 £61 £76 £82 £88 £93 £99 £105 £110 £115
B8. Corporation tax from higher turnover £0 £0 £8 £12 £15 £16 £18 £19 £20 £21 £22 £23
Impact 9: Gain in additional tax on dividends
Post-tax profits on sector turnover £0 £0 £33 £49 £61 £65 £70 £75 £79 £84 £88 £92
Dividend payout from post-tax profits £0 £0 £17 £25 £31 £34 £36 £39 £41 £43 £46 £48
Income tax paid on dividends on reported profits £0 £0 £3 £5 £6 £7 £7 £8 £8 £9 £9 £10
Income tax paid on dividends on previously unreported profits £0 £0 £1 £1 £2 £2 £2 £2 £2 £2 £2 £2
B9. Income tax paid on dividends £0 £0 £4 £6 £8 £8 £9 £9 £10 £10 £11 £11
Impact 10: Gain in business rates
B10. Additional business rates compared to "no change" £0 £0 £3 £5 £6 £7 £7 £7 £8 £8 £9 £9
Impact 11: Multiplier effects
Increased turnover in Rounds 2 onwards - direct £0 £0 £130 £196 £242 £261 £280 £298 £316 £334 £351 £368
Increased turnover in Rounds 2 onwards - Shadow Economy £0 £0 £36 £52 £61 £61 £61 £61 £61 £61 £61 £61
Total increase in turnover £0 £0 £166 £247 £303 £322 £340 £358 £376 £394 £412 £429
VAT yield on multiplied turnover £0 £0 £33 £49 £61 £64 £68 £72 £75 £79 £82 £86
Income and NI yields on multiplied turnover £0 £0 £15 £22 £27 £29 £31 £32 £34 £36 £37 £39
Savings in social security payments from higher turnover £0 £0 £25 £38 £46 £49 £52 £55 £57 £60 £63 £65
Additional corporation tax receipts from higher turnover £0 £0 £7 £10 £13 £14 £14 £15 £16 £17 £17 £18
Increased yield from taxes on dividends £0 £0 £3 £4 £5 £6 £6 £6 £7 £7 £7 £7
B10. Multiplier impact £0 £0 £84 £124 £152 £161 £171 £180 £189 £198 £206 £215
Sub-total (2): indirect gains in VAT receipts, income and corporation taxes and
social security payments£0 £0 £179 £257 £311 £330 £348 £365 £383 £400 £417 £434
Net gain (loss) from VAT reduction £0.0 £0.0 -£66.1 £16.5 £76.0 £99.0 £121.7 £144.1 £166.1 £187.8 £209.2 £230.2
Overall Fiscal Balance
(1) Net direct loss of VAT receipts £0 £0 -£245 -£240 -£235 -£231 -£226 -£221 -£217 -£212 -£208 -£203
(2) VAT Yield on increased turnover at reduced rate £0 £0 £8 £12 £14 £14 £14 £14 £14 £14 £14 £14
(3) VAT Yield on wider base at reduced rate £0 £0 £3 £4 £5 £5 £5 £5 £5 £5 £5 £5
(4) Income and national insurance derived from new jobs & previously unreported
(Shadow Economy) jobs £0 £0 £22 £32 £39 £42 £44 £46 £49 £51 £53 £55
(5) Income and national insurance derived from higher wages £0 £0 £3 £5 £6 £6 £6 £6 £6 £6 £6 £6
(6) Savings in social security payments £0 £0 £31 £46 £57 £61 £65 £70 £74 £78 £82 £85
(7) Corporation tax from higher margins on current turnover including previously
unreported (Shadow Economy) turnover £0 £0 £13 £11 £10 £10 £10 £10 £10 £10 £10 £10
(8) Corporation tax from higher turnover £0 £0 £8 £12 £15 £16 £18 £19 £20 £21 £22 £23
(9) Income tax paid on dividends £0 £0 £4 £6 £8 £8 £9 £9 £10 £10 £11 £11
(10) Business rates £0 £0 £3 £5 £6 £7 £7 £7 £8 £8 £9 £9
(11) Multiplier impact £0 £0 £84 £124 £152 £161 £171 £180 £189 £198 £206 £215
£0 £0 -£66 £17 £76 £99 £122 £144 £166 £188 £209 £230
Net Present Value , £ million £209 £916
Economic Rate of Return, % 74.6% 90.8%
Post-Reduction Path of Adjustment Post-Reduction Path of Adjustment
Combined Adjustment Path
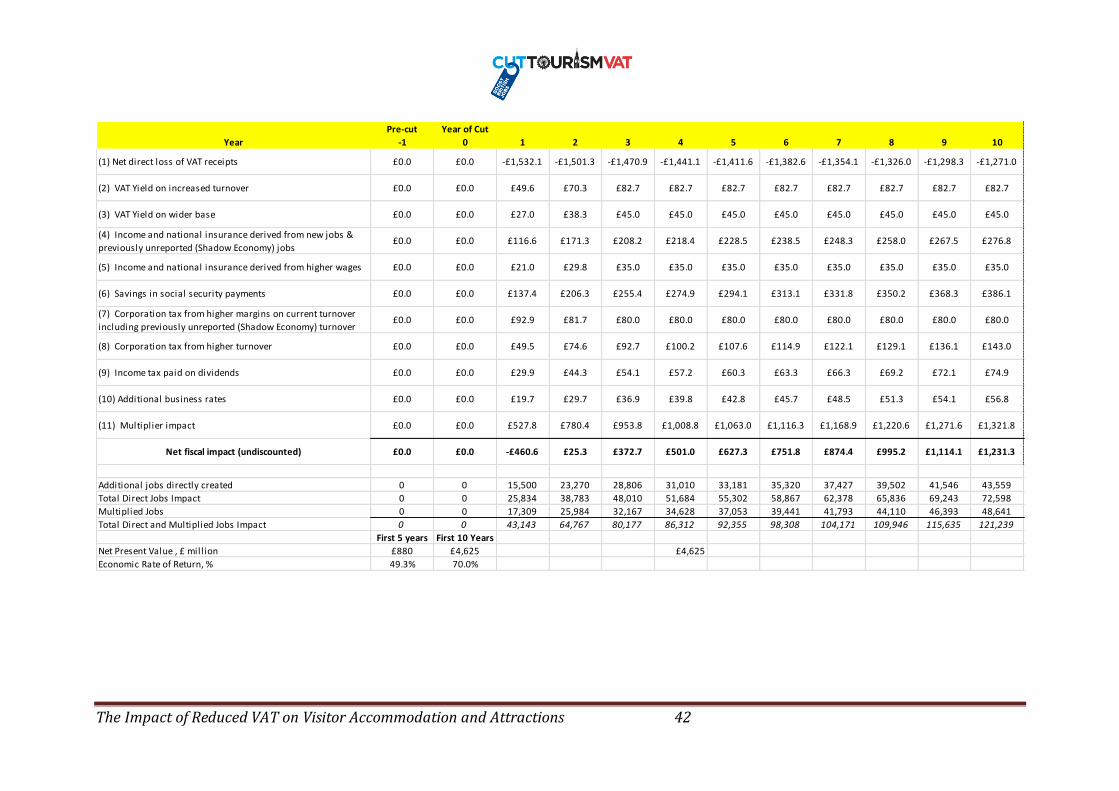
The Impact of Reduced VAT on Visitor Accommodation and Attractions 42
Pre-cut Year of Cut
Year -1 0 1 2 3 4 5 6 7 8 9 10
(1) Net direct loss of VAT receipts £0.0 £0.0 -£1,532.1 -£1,501.3 -£1,470.9 -£1,441.1 -£1,411.6 -£1,382.6 -£1,354.1 -£1,326.0 -£1,298.3 -£1,271.0
(2) VAT Yield on increased turnover £0.0 £0.0 £49.6 £70.3 £82.7 £82.7 £82.7 £82.7 £82.7 £82.7 £82.7 £82.7
(3) VAT Yield on wider base £0.0 £0.0 £27.0 £38.3 £45.0 £45.0 £45.0 £45.0 £45.0 £45.0 £45.0 £45.0
(4) Income and national insurance derived from new jobs &
previously unreported (Shadow Economy) jobs£0.0 £0.0 £116.6 £171.3 £208.2 £218.4 £228.5 £238.5 £248.3 £258.0 £267.5 £276.8
(5) Income and national insurance derived from higher wages £0.0 £0.0 £21.0 £29.8 £35.0 £35.0 £35.0 £35.0 £35.0 £35.0 £35.0 £35.0
(6) Savings in social security payments £0.0 £0.0 £137.4 £206.3 £255.4 £274.9 £294.1 £313.1 £331.8 £350.2 £368.3 £386.1
(7) Corporation tax from higher margins on current turnover
including previously unreported (Shadow Economy) turnover£0.0 £0.0 £92.9 £81.7 £80.0 £80.0 £80.0 £80.0 £80.0 £80.0 £80.0 £80.0
(8) Corporation tax from higher turnover £0.0 £0.0 £49.5 £74.6 £92.7 £100.2 £107.6 £114.9 £122.1 £129.1 £136.1 £143.0
(9) Income tax paid on dividends £0.0 £0.0 £29.9 £44.3 £54.1 £57.2 £60.3 £63.3 £66.3 £69.2 £72.1 £74.9
(10) Additional business rates £0.0 £0.0 £19.7 £29.7 £36.9 £39.8 £42.8 £45.7 £48.5 £51.3 £54.1 £56.8
(11) Multiplier impact £0.0 £0.0 £527.8 £780.4 £953.8 £1,008.8 £1,063.0 £1,116.3 £1,168.9 £1,220.6 £1,271.6 £1,321.8
Net fiscal impact (undiscounted) £0.0 £0.0 -£460.6 £25.3 £372.7 £501.0 £627.3 £751.8 £874.4 £995.2 £1,114.1 £1,231.3
Additional jobs directly created 0 0 15,500 23,270 28,806 31,010 33,181 35,320 37,427 39,502 41,546 43,559
Total Direct Jobs Impact 0 0 25,834 38,783 48,010 51,684 55,302 58,867 62,378 65,836 69,243 72,598
Multiplied Jobs 0 0 17,309 25,984 32,167 34,628 37,053 39,441 41,793 44,110 46,393 48,641
Total Direct and Multiplied Jobs Impact 0 0 43,143 64,767 80,177 86,312 92,355 98,308 104,171 109,946 115,635 121,239
First 5 years First 10 Years
Net Present Value , £ mill ion £880 £4,625 £4,625
Economic Rate of Return, % 49.3% 70.0%

The Impact of Reduced VAT on Visitor Accommodation and Attractions 43
Balance of Trade Impact
Pre-cut Year of Cut
Year -1 0 1 2 3 4 5 6 7 8 9 10
Net turnover under 'Do Nothing'
Accommodation sector ex F&B £17,537 £17,537 £17,274 £17,015 £16,759 £16,508 £16,260 £16,016 £15,776 £15,539 £15,306 £15,077
Attractions sector £1,959 £1,959 £1,930 £1,901 £1,872 £1,844 £1,816 £1,789 £1,762 £1,736 £1,710 £1,684
£19,496 £19,496 £19,203 £18,915 £18,631 £18,352 £18,077 £17,806 £17,538 £17,275 £17,016 £16,761
of which: overseas visitors
Accommodation sector ex F&B £7,015 £7,015 £6,909 £6,806 £6,704 £6,603 £6,504 £6,407 £6,310 £6,216 £6,123 £6,031
Attractions sector £784 £784 £772 £760 £749 £738 £727 £716 £705 £694 £684 £674
Foreign exchange earnings pre-reduction £7,798 £7,798 £7,681 £7,566 £7,453 £7,341 £7,231 £7,122 £7,015 £6,910 £6,807 £6,704
Net turnover post-VAT reduction
Accommodation sector ex F&B £17,537 £17,537 £18,364 £18,709 £18,915 £18,915 £18,915 £18,915 £18,915 £18,915 £18,915 £18,915
Attractions sector £1,959 £1,959 £2,124 £2,289 £2,453 £2,618 £2,783 £2,948 £3,113 £3,277 £3,442 £3,607
£19,496 £19,496 £20,488 £20,997 £21,369 £21,534 £21,698 £21,863 £22,028 £22,193 £22,358 £22,522
of which: overseas visitors
Accommodation sector ex F&B £7,015 £7,015 £7,346 £7,483 £7,566 £7,566 £7,566 £7,566 £7,566 £7,566 £7,566 £7,566
Attractions sector £784 £784 £850 £915 £981 £1,047 £1,113 £1,179 £1,245 £1,311 £1,377 £1,443
Foreign exchange earnings post-reduction £7,798 £7,798 £8,195 £8,399 £8,548 £8,613 £8,679 £8,745 £8,811 £8,877 £8,943 £9,009
Increase in forex earnings from overseas visitors £0 £0 £514 £833 £1,095 £1,273 £1,449 £1,623 £1,796 £1,967 £2,137 £2,305
Increase in domestic visitor expenditure post-reduction
Accommodation sector ex F&B £0 £0 £654 £1,016 £1,294 £1,445 £1,593 £1,739 £1,884 £2,026 £2,165 £2,303
Attractions sector £0 £0 £117 £233 £349 £464 £580 £695 £810 £925 £1,039 £1,154
£0 £0 £771 £1,249 £1,642 £1,909 £2,173 £2,435 £2,694 £2,950 £3,205 £3,457
of which: swtiched from overseas holidays
Accommodation sector ex F&B £0 £0 £196 £305 £388 £433 £478 £522 £565 £608 £650 £691
Attractions sector £0 £0 £58 £116 £174 £232 £290 £348 £405 £462 £520 £577
Savings in forex spending by domestic residents £0 £0 £255 £421 £562 £666 £768 £869 £970 £1,070 £1,169 £1,268
Total improvement in BoP compared to 'Do Nothing'
Increase in forex earnings from overseas visitors £0 £0 £514 £833 £1,095 £1,273 £1,449 £1,623 £1,796 £1,967 £2,137 £2,305
Savings in forex spending by domestic residents £0 £0 £255 £421 £562 £666 £768 £869 £970 £1,070 £1,169 £1,268
£0 £0 £768 £1,254 £1,657 £1,938 £2,217 £2,492 £2,766 £3,037 £3,306 £3,572
Total over 10 years £23,008
Post-Reduction Path of Adjustment