tourism destination development – beyond butler · tourism destination change embraces this...
TRANSCRIPT

TOURISM DESTINATION DEVELOPMENT –
BEYOND BUTLER
A thesis submitted for the degree of
Doctor of Philosophy
at The University of Queensland
in December 2005
Noreen Maree Breakey
Bachelor of Business (Tourism) Honours I
School of Natural and Rural Systems Management

Noreen Breakey Tourism Destination Development
ii
Candidate's Statement of Originality
I declare that the work presented in this thesis is, to the best of my knowledge and belief,
original and my own work, except as acknowledged in the text. The material has not been
previously submitted in any form for a degree at this, or any other university.
Noreen Breakey

Noreen Breakey Tourism Destination Development
iii
Acknowledgments
First and foremost I would like to thank my supervisor, Associate Professor Bob Beeton.
His vision, enthusiasm, and support guided me through the various stages of this process. I
could not imagine having undertaken the PhD journey without him. In addition I wish to
thank my associate supervisor, Louise Horneman, for her practical and detailed suggestions
in the early PhD work.
Along the PhD journey I have been fortunate to receive the love and support of my partner,
Darren, and my family and friends. I thank them all for enduring the long hours and
dedication required to complete this work. Special thanks go to my wonderful mother, who
matched her support to my changing needs as the work progressed.
I thank Dr Bill Carter for organising the initial ‘oldies’ PhD group - Dona Whiley, Noel
Scott, and Richard Bramley. I thank these friends, as well as the newer members, Robyn
Stokes, David Taylor, Glen Hornby, Pallavi Mandke, and Petra Singer, for their invaluable
support and informed input. In particular I wish to thank Dona Whiley who understands the
challenges in balancing the PhD with the ongoing commitments, expectations, and crises in
life. In addition to helping to ensure that my methodological underpinnings and unit of
analysis were clarified, I would like to thank Noel Scott for recommending me to the
Corporate Planning Department at Tourism Queensland where I was able to become
practically involved in destination management and planning for the tourism destinations of
Queensland.
I also thank the support staff at the University of Queensland, the many and helpful library
staff; Laura and Julie from Student Support Services; as well as Lyndelle and the other staff
of the School of Natural and Rural Systems Management.
Finally, I would like to dedicate this work to my precious niece, Anika, and nephew, Kellen,
who as part of the next generation will experience the world and visit, or not visit, the
destinations we create and manage today.

Noreen Breakey Tourism Destination Development
iv
Abstract
My thesis is that the nature of a tourism destination is not predestined as proposed by
destination life-cycle models. Instead tourism destination development is continually
determined by the internal conditions and inter-relations within the tourism destination
system, and the combination of external impacts acting on the destination.
The most popularly applied theory employed to explain tourism growth within a destination
is the life-cycle concept (Butler, 1980). Although the life-cycle model does offer a general
and adjustable means for describing past destination change, it does not consider tourism as
a complex and dynamic system. This work illustrates that alternate theories also offer
important concepts for understanding change within a tourism destination, including
Evolutionary Theory, Punctuated Equilibrium, and Chaos Theory.
While none of these four theories completely explains how and why change occurs within a
tourism destination system, each offers concepts that can be incorporated into the proposed
model that outlines the possible change options and their magnitude, the Multi-Trajectory
Model of Tourism Destination Change. This model proposes that the growth pattern of a
destination variable may at times be in a state of complete ‘equilibrium’, undergoing gradual
positive or negative ‘evolutionary’ change, or within a ‘chaos’ induced ‘punctuation’
causing an immediate, and substantial increase or decrease in growth. The underlying
premise of this proposed model is that change can occur at any time, and can be in any
direction. Therefore tourism is a system that includes most expressions of change theory in
a temporally complex way.
The proposed model raises three Research Issues. The first was that, although tourism
change can be analysed at various levels, area aggregation results in data smoothing.
Secondly, tourism destination change cannot be explained by total yearly visitor numbers
alone. Finally, there is no predetermined pattern of tourism destination development. This
provides a new approach to examining change at a destination.

Noreen Breakey Tourism Destination Development
v
In order to test the model, a tourism destination system was chosen as a case study. This
multi-level system incorporates the tourism destinations of the three local areas of Noosa,
Maroochy, and Caloundra, the Sunshine Coast region they comprise, the State of
Queensland, and the Nation of Australia. This case system provided the opportunity to
compare the same data variable at the different levels, determining whether or not the local
area followed the patterns of change evident at the regional, State, and/or National levels.
The use of the three local areas also allowed for comparison, considering whether tourism
developed in similar ways and at similar times across the local areas, and whether external
influences had similar impacts on the local level destinations or whether the responses
differed. Additionally, the inclusion of the higher aggregate levels provided information on
the environment in which with a lower level destination operates and develops.
The qualitative investigation into the history of the development of tourism within this
multi-layer system identified reasons why tourism has developed and changed in the case
study area. While providing a context for the time-series data analysis, this historical
examination also showed just how many factors affect tourism development, thereby
reinforcing the need for a model that incorporates this complexity.
The focus of the time-series data analysis was on the patterns of change evident in data
variables, considering the trajectories and change points within each pattern. An important
aspect of this approach to understanding tourism destination change was the inclusion of
multiple data variables, both tourism specific, and general growth indicators. Analysis of
possible relationships between the variables added greater depth to the study. Testing such a
model required the collection of a significant body of time-series data, its analysis, and
presentation.
Investigation of the first research issue revealed that under the smooth aggregate patterns of
the higher level data variables there exists an interesting array of complex patterns. This
analysis provided a more detailed picture of the change in both individual variables at the
different geographical levels, as well as sub-categories within a variable, such as visitor
numbers. This study illustrates the need to consider the underlying variables to ensure
greater understanding of the complex change within a destination. Also important was the
inquiry into the remaining research issues. This showed that there is no single pattern which
represents the destination’s change. Various patterns exist, such as for visitor spending,

Noreen Breakey Tourism Destination Development
vi
occupancy levels, and the supply of accommodation. This challenges the notion that a
destination will simply follow the life-cycle pattern. As the Multi-Trajectory Model of
Tourism Destination Change embraces this variation, complexity, and dynamism, the model
explains the differing change trajectories of tourism destination development identified in
the various geographical levels of the case study data.
The general aim of this study was to further understanding of how and why tourism
destinations develop. In the future this knowledge will benefit tourism businesses,
associations, managers, and planners. Ultimately, tourism destination planners need to
accept that destination growth is not a simple and predictable process. The Multi-Trajectory
Model of Tourism Destination Change can be applied to understand the change at a
destination. Such understanding can then be used to develop a framework for the planning
of strategic intervention, which therefore allows for management of change. This could
assist in redirecting tourism development to ensure it is economically, environmentally, and
culturally sustainable through the facilitation of an environment conducive to positive
change.

Noreen Breakey Tourism Destination Development
vii
Table of Contents
CANDIDATE'S STATEMENT OF ORIGINALITY II
ACKNOWLEDGMENTS III
ABSTRACT IV
TABLE OF CONTENTS VII
LIST OF FIGURES XII
LIST OF TABLES XVI
LIST OF ABBREVIATIONS XVII
CHAPTER 1 THE DEVELOPMENT OF A TOURISM SYSTEM AT A DESTINATION - AN
INTRODUCTION 1
1.1 Overview of Chapter One 1
1.2 Background to the Study 4 1.2.1 The Impacts of Tourism Development - An Historic Overview 5 1.2.2 Tourism Planning - An Historic Overview 7 1.2.3 Sustainable Tourism - An Historic Overview 15 1.2.4 Tourism Destination Life-Cycle 22
1.3 Rationale for this Research 23
1.4 Structure of the Dissertation 26

Noreen Breakey Tourism Destination Development
viii
CHAPTER 2 THEORIES ON THE PROCESSES OF CHANGE - DEVELOPMENT OF A
MODEL 29
2.1 Overview of Chapter Two 29
2.2 Approaching the Study of Tourism Destination Change 31 2.2.1 Changing Approaches to Tourism Destination Development 32 2.2.2 Development of the Advocacy Platform 33 2.2.3 Development of the Cautionary Platform 35 2.2.4 Development of the Adaptancy Platform 43 2.2.5 Development of the Knowledge-Base Platform 44 2.2.6 The Ongoing Debate - Tourism Impacts 44
2.3 Tourism Systems - Varying Perspectives 46 2.3.1 Transdisciplinary Theories and Tourism 46 2.3.2 A Systems Approach 47
2.4 Classical Change Theory - The Life-Cycle Model 61 2.4.1 The Product Life-Cycle 62 2.4.2 Application of the Life-Cycle Model to Tourism 70
2.5 Alternative Candidate Theories on the Processes of Change 85 2.5.1 The Theory of Species Evolution 86 2.5.2 Transdisciplinary Theories 95 2.5.3 Punctuated Equilibrium 96 2.5.4 Chaos Theory 101
2.6 Evaluation of the Four Theories in Relation to the Study of the Development of Tourism
Destinations 111 2.6.1 Concepts Offered by each Theory that are Relevant for Understanding Tourism Destination
Development 112 2.6.2 Characteristics of the Theories that are Appropriate for the Study of Tourism Destination
Development 115 2.6.3 Outcomes of the Analysis of the Four Process of Change Theories 118
2.7 The Multi-Trajectory Model of Tourism Destination Change 118 2.7.1 Research Issues Developed from the Multi-Trajectory Model of Tourism Destination Change 121
2.8 Redefining the Research Aim and Questions 126

Noreen Breakey Tourism Destination Development
ix
CHAPTER 3 THE RESEARCH PROCESS 129
3.1 Overview of Chapter Three 129
3.2 The Research Framework 131
3.3 The Research Design 132 3.3.1 Case Study Research 133 3.3.2 Case Study Selection 136
3.4 Data Selection and Analysis 141 3.4.1 Multi-Method Approach - Qualitative and Quantitative 142 3.4.2 Secondary Data 144 3.4.3 Data Analysis 152
3.5 Conclusion 156
CHAPTER 4 THE DEVELOPMENT OF A TOURISM SYSTEM AT A DESTINATION - AN
HISTORICAL OVERVIEW 157
4.1 Overview of Chapter Four 157
4.2 Defining the Tourism Case System 158 4.2.1 Location and Definition of the Sunshine Coast 159
4.3 Changes in Australian Tourism during the 20th Century 163
4.4 Development of Tourism in the Case Area: 1900 – 1980 165 4.4.1 1900 to 1915 - Pre World War One 165 4.4.2 1915 to 1919 - World War One 167 4.4.3 1919 to 1939 - The Interwar Period 168 4.4.4 1939 to 1945 - World War Two 170 4.4.5 1945 to 1950 171 4.4.6 The 1950s 172 4.4.7 The 1960s 174 4.4.8 The 1970s 178
4.5 Development of Tourism in the Case Area: 1980 – 1997 183 4.5.1 Development Boom and Bust: 1980 - 1982 188 4.5.2 Recovery Period: 1983 - 1985 195 4.5.3 Tourism Boom: 1986 - 1988 200

Noreen Breakey Tourism Destination Development
x
4.5.4 The Recession: 1989 - 1991 212 4.5.5 Recovery Period: 1992 - 1994 220 4.5.6 The Unstable Period: 1995 - 1997 228
4.6 Tourism Change Factors 237 4.6.1 Types of Change 237 4.6.2 Change in the National and State Levels of the Tourism System 239 4.6.3 Change in Regional and Local Levels of the Tourism System 243 4.6.4 Tourism Change 246
4.7 Revisiting the Research Issues 247 4.7.1 Research Issue One - Area Aggregation > Data Smoothing 247 4.7.2 Research Issue Two - Change Not Explained By Visitor Numbers 248 4.7.3 Research Issue Three - No Predetermined Pattern 250
4.8 Conclusion 252
CHAPTER 5 TOURISM DESTINATION CASE SYSTEM - A TIME-SERIES ANALYSIS 253
5.1 Overview of Chapter Five 253
5.2 The Research Issues 253 5.2.1 Applying the Proposed Model at Various System Levels 256
5.3 Research Issue One - Area Aggregation 257 5.3.1 Supply of Hotel, Motel and Guest House Accommodation 257 5.3.2 Population Growth 270 5.3.3 Addressing Research Issue One - Data Aggregation 274
5.4 Research Issue Two - Visitor Numbers 274 5.4.1 Sub-Issue One - Visitor Sub-Categories 275 5.4.2 Sub-Issue Two - Seasonality 288 5.4.3 Sub-Issue Three - Other Variables 298 5.4.4 Addressing Research Issue Two - Visitor Numbers 317
5.5 Research Issue Three - No Predetermined Pattern 318 5.5.1 Sub-Issue One - Different Patterns 319 5.5.2 Sub-Issue Two - Trajectory Lengths Differ 328 5.5.3 Sub-Issue Three - Last Stage Not Predictive of Next 336 5.5.4 Addressing Research Issue Three - No Predetermined Pattern 338
5.6 Addressing the Proposed Multi-Trajectory Model of Tourism Destination Change 338

Noreen Breakey Tourism Destination Development
xi
CHAPTER 6 THE DEVELOPMENT OF A TOURISM SYSTEM AT A DESTINATION - A
CONCLUSION 341
6.1 Overview of Chapter Six 341
6.2 Contributions Arising from the Research Questions 341 6.2.1 Research Question One 342 6.2.2 Research Question Two 342 6.2.3 Research Question Three 343 6.2.4 Research Question Four 343 6.2.5 Research Question Five 344
6.3 Contributions and Implications for Destination Planning and Management 344 6.3.1 The Complex Dynamic Destination System 345 6.3.2 Destination Change Patterns 347 6.3.3 Shaping Destination Development 351
6.4 Limitations of the Multi-Trajectory Model of Tourism Destination Change 352 6.4.1 Time Frame Applicability 352 6.4.2 Application of the Model 353
6.5 Avenues of Future Research 353 6.5.1 Why Change Occurs 353 6.5.2 Economic Theories 353 6.5.3 Chaos Theory 354 6.5.4 Agent Theory 354 6.5.5 Recent Destination Development 354 6.5.6 Relationships within Destinations 355
6.6 Conclusion 355
LIST OF REFERENCES 357
DATA SOURCES 388

Noreen Breakey Tourism Destination Development
xii
List of Figures
CHAPTER 1 Figure 1.1 The Early Tourism Destination Growth Trend Models of the Early 1980s. ............................3
Figure 1.2 The Process of Change in a Tourism Destination. .................................................................24
Figure 1.3 The Initial Research Aim, Theses, and Research Questions. .................................................26
Figure 1.4 Dissertation Structure.............................................................................................................27
CHAPTER 2 Figure 2.1 Structure of Chapter Two.......................................................................................................30
Figure 2.2 The Changing Views on the Impacts of Tourism Development. ...........................................33
Figure 2.3 Systems Approaches. .............................................................................................................49
Figure 2.4 System Classifications. ..........................................................................................................55
Figure 2.5 Tourism as an Information System. .......................................................................................59
Figure 2.6 The Growth Curve. ................................................................................................................62
Figure 2.7 The Product Life-Cycle..........................................................................................................63
Figure 2.8 Product Life-Cycle Patterns. ..................................................................................................66
Figure 2.9 The Destination Life-Cycle....................................................................................................71
Figure 2.10 Destination Life-Cycle Stage Predictions. .............................................................................74
Figure 2.11 Changing Life-Cycles. ...........................................................................................................82
Figure 2.12 The Five Patterns of Biological Evolution. ............................................................................90
Figure 2.13 Notional Episodic Model of Tourism Growth. ....................................................................100
Figure 2.14 The Butterfly Effect Image. .................................................................................................105
Figure 2.15 The Chaos Model of Tourism ..............................................................................................110
Figure 2.16 The Multi-Trajectory Model of Tourism Destination Change. ............................................120
Figure 2.17 The Geographical Levels. ....................................................................................................121
Figure 2.18 Conceptualising the Research Aim. .....................................................................................127
Figure 2.19 The Relationship between the Proposed Model and its resultant Research Issues, and the
Theses and Research Questions developed in Chapter One.................................................128
CHAPTER 3 Figure 3.1 The Stages of the Research Process. ....................................................................................130
Figure 3.2 The Research Model used for this Work..............................................................................131
Figure 3.3 Model of Developing Tourism Destination Systems. ..........................................................139
CHAPTER 4 Figure 4.1 The Sunshine Coast Case Study System. .............................................................................159
Figure 4.2 Map of the Sunshine Coast. .................................................................................................160
Figure 4.3 The Sunshine Coast Statistical District. ...............................................................................162
Noreen Breakey Tourism Destination Development
xiii
Figure 4.4 Changes in Key Growth Indicators between 1980 and 1997. ..............................................184
Figure 4.5 The Phases of Development between 1980 and 1997..........................................................186
Figure 4.6 High Rise Building Boom and Bust on the Gold Coast. ......................................................188
Figure 4.7 International Arrivals to Australia. ......................................................................................190
Figure 4.8 Unit Approvals on the Gold Coast and the Sunshine Coast. ................................................192
Figure 4.9 Annual Percentage Change in Population............................................................................193
Figure 4.10 United States: Arrivals into Australia and Exchange Rate...................................................198
Figure 4.11 International Arrivals to Australia – Actual and Predicted. .................................................202
Figure 4.12 Domestic Visitor Nights in Queensland – Actual and Predicted. ........................................203
Figure 4.13 Arrivals to Australia from Japan – Actual and Predicted.....................................................205
Figure 4.14 International Arrivals to Australia from Asia. .....................................................................223
Figure 4.15 International Arrivals to Australia from the Main Asian Source Markets. ..........................224
CHAPTER 5 Figure 5.1 The Research Issues and Sub-Issues of the Proposed Model...............................................254
Figure 5.2 Aggregation within the Tourism System. ............................................................................256
Figure 5.3 Number of Hotels, Motels, and Guest Houses in the Sunshine Coast Statistical District. ...258
Figure 5.4 Number of Hotels, Motels, and Guest Houses in each of the Three Local Government Areas
within the Sunshine Coast Statistical District. .....................................................................258
Figure 5.5 Number of Hotels, Motels and Guest Houses in Queensland. .............................................260
Figure 5.6 Number of Hotels, Motels and Guest Houses in Australia. .................................................261
Figure 5.7 Number of Rooms in Hotels, Motels, and Guest Houses in the Sunshine Coast Statistical
District. ................................................................................................................................261
Figure 5.8 Long-Term Trend in the Number of Rooms in Hotels, Motels, and Guest Houses in the
Sunshine Coast Statistical District. ......................................................................................262
Figure 5.9 Trend in the Number of Rooms in Hotels, Motels, and Guest Houses in the Sunshine Coast
Statistical District.................................................................................................................263
Figure 5.10 Trajectory Changes in the Number of Rooms in Hotels, Motels, and Guest Houses in the
Sunshine Coast Statistical District. ......................................................................................264
Figure 5.11 Number of Rooms in the Hotels, Motels, and Guest Houses in each of the Three Local
Government Areas within the Sunshine Coast Statistical District. ......................................265
Figure 5.12 Number of Rooms in Hotels, Motels, and Guest Houses in Queensland. ............................266
Figure 5.13 Trajectory Changes in the Number of Rooms in Hotels, Motels, and Guest Houses in
Queensland...........................................................................................................................267
Figure 5.14 Number of Rooms in Hotels, Motels, and Guest Houses in Australia. ................................268
Figure 5.15 Trajectory Changes in the Number of Rooms in Hotels, Motels, and Guest Houses in
Australia...............................................................................................................................269
Figure 5.16 Population of the Sunshine Coast Region. ...........................................................................270
Figure 5.17 Population of Caloundra City, Maroochy Shire, and Noosa Shire.......................................271
Figure 5.18 Percentage Change from the Previous Year in the Population of the Sunshine Coast Region,
Caloundra City, Maroochy Shire, and Noosa Shire. ............................................................272

Noreen Breakey Tourism Destination Development
xiv
Figure 5.19 Percentage Change from the Previous Year in the Population of the Sunshine Coast Region,
Queensland, and Australia. ..................................................................................................273
Figure 5.20 Sub-Issues of Research Issue Two. ......................................................................................275
Figure 5.21 Number of Visitor Nights on the Sunshine Coast. ...............................................................276
Figure 5.22 Number of Visitor Nights on the Sunshine Coast by Origin................................................277
Figure 5.23 Number of Visitors to the Sunshine Coast by Origin...........................................................278
Figure 5.24 Type of Accommodation Used by Intrastate Visitors to the Sunshine Coast.......................279
Figure 5.25 Type of Accommodation Used by Interstate Visitors to the Sunshine Coast.......................281
Figure 5.26 Type of Accommodation Used by International Visitors to the Sunshine Coast. ................282
Figure 5.27 Sunshine Coast Domestic Visitor Nights by Stage of Life Categories. ...............................283
Figure 5.28 Total Number of Short-Term Overseas Arrivals to Australia. .............................................284
Figure 5.29 Number of Short-Term Overseas Arrivals to Australia by Generating Region. ..................285
Figure 5.30 Number of Short-Term Overseas Arrivals to Australia from Japan and the Rest of Asia. ..286
Figure 5.31 Number of Short-Term Overseas Arrivals to Australia from Asian Source Countries
(excluding Japan). ................................................................................................................287
Figure 5.32 Number of Visitors to the Sunshine Coast by Origin: Total Visitors, Intrastate Visitors,
Interstate Visitors, and International Visitors. .....................................................................288
Figure 5.33 Number of Intrastate and Interstate Visitors to the Sunshine Coast.....................................289
Figure 5.34 Average Room Occupancy Rate in Sunshine Coast Hotels, Motels, and Guest Houses. ....290
Figure 5.35 Monthly Variation from the Trend in Room Occupancy Rates in Sunshine Coast Hotels,
Motels, and Guest Houses....................................................................................................291
Figure 5.36 Trajectory One: Monthly Room Occupancy Rates in Sunshine Coast Hotels, Motels, and
Guest Houses from 1983 to 1988.........................................................................................293
Figure 5.37 Trajectory Two: Monthly Room Occupancy Rates in Sunshine Coast Hotels, Motels, and
Guest Houses from 1989 to 1992.........................................................................................294
Figure 5.38 Trajectory Three: Monthly Room Occupancy Rate in Sunshine Coast Hotels, Motels, and
Guest Houses from 1992 to 1997.........................................................................................294
Figure 5.39 Yearly Low Occupancy Rates in Sunshine Coast Hotels, Motels, and Guest Houses. ........295
Figure 5.40 Average Site Occupancy Rate in Sunshine Coast Caravan Parks. .......................................296
Figure 5.41 Monthly Variation from the Trend in Site Occupancy Rates in Sunshine Coast Caravan
Parks.....................................................................................................................................297
Figure 5.42 Average Length of Stay in Queensland and on the Sunshine Coast. ...................................299
Figure 5.43 CPI Adjusted Total Sunshine Coast Visitor Expenditure.....................................................301
Figure 5.44 Percentage Change from the Previous Year for the CPI Adjusted Total Sunshine Coast
Visitor Expenditure. .............................................................................................................301
Figure 5.45 Sunshine Coast Visitor Expenditure in Real Dollars by the Origin of Visitors. ..................302
Figure 5.46 Sunshine Coast CPI Adjusted Average Expenditure per Visitor Night by Category. ..........303
Figure 5.47 CPI Adjusted Yearly Takings from Sunshine Coast Hotels, Motels, and Guest Houses. ....305
Figure 5.48 CPI Adjusted Monthly Takings from Sunshine Coast Hotels, Motels, and Guest Houses. .306
Figure 5.49 Trajectory Changes in the Monthly Takings from Sunshine Coast Hotels, Motels, and Guest
Houses..................................................................................................................................307

Noreen Breakey Tourism Destination Development
xv
Figure 5.50 Long Term Trend in the Takings from Sunshine Coast Hotels, Motels, and Guest Houses.308
Figure 5.51 Monthly Variation from the Trend in the Takings from Sunshine Coast Hotels, Motels, and
Guest Houses. ......................................................................................................................309
Figure 5.52 CPI Adjusted Yearly Takings from Sunshine Coast Caravan Parks. ...................................310
Figure 5.53 CPI Adjusted Monthly Takings from Sunshine Coast Caravan Parks. ................................311
Figure 5.54 Long Term Trend in the Takings from Sunshine Coast Caravan Parks...............................312
Figure 5.55 Monthly Variation from the Trend in the Takings from Sunshine Coast Caravan Parks.....312
Figure 5.56 Long-Term Trend in the Room Occupancy Rate in Sunshine Coast Hotels, Motels, and
Guest Houses. ......................................................................................................................314
Figure 5.57 Trajectory Changes in Occupancy Levels in Sunshine Coast Hotels, Motels, and Guest
Houses..................................................................................................................................315
Figure 5.58 Long-Term Trend in the Site Occupancy Rate in Sunshine Coast Caravan Parks...............317
Figure 5.59 The Three Sub-Issues of Research Issue Three. ..................................................................319
Figure 5.60 Sunshine Coast Hotel, Motel, and Guest House Sector – Percentage Change from 1983/84 to
1500%. .................................................................................................................................321
Figure 5.61 Sunshine Coast Hotel, Motel, and Guest House Sector – Percentage Change from 1983/84 to
150%. ...................................................................................................................................322
Figure 5.62 Comparison of the Number of Visitors using Commercial Accommodation and the Total
Number of Rooms in Hotels, Motels, and Guest Houses for the Sunshine Coast – Percentage
Change from 1983/84. .........................................................................................................324
Figure 5.63 Comparison of the Average Expenditure on Accommodation per Visitor Night and the
Takings per Room per Year from Hotels, Motels, and Guest Houses for the Sunshine Coast –
Percentage Change from 1983/84. .......................................................................................325
Figure 5.64 Scatterplot of the Correlation between Percentage Change from 1983/84 in the Average
Expenditure on Accommodation per Visitor Night, and the Takings per Room per Year from
Hotels, Motels, and Guest Houses for the Sunshine Coast. .................................................326
Figure 5.65 Comparison of the Number of Visitors, Total Number of Rooms, and Takings per Room per
Year from Hotels, Motels, and Guest Houses for the Sunshine Coast – Percentage Change
from 1983/84........................................................................................................................327
Figure 5.66 Sunshine Coast Tourism Boom and the Recession – Percentage Change from 1985 to 500%.
.............................................................................................................................................330
Figure 5.67 Sunshine Coast Tourism Boom and the Recession – Percentage Change from 1985 to 100%.
.............................................................................................................................................330
CHAPTER 6 Figure 6.1 Resolution of the Study’s Research Questions and Research Issues. ..................................341

Noreen Breakey Tourism Destination Development
xvi
List of Tables
CHAPTER 2 Table 2.1 Classification of Social System Relationships............................................................................54
Table 2.2 Destination Life-Cycle Research. ...............................................................................................75
Table 2.3 Business Sector - Biological Evolution Terms. ..........................................................................89
Table 2.4 Business Sector - Biological Evolution - Tourism Destination Terms. ......................................93
Table 2.5 Concepts and Implications of the Life-Cycle Theory. ..............................................................112
Table 2.6 Concepts and Implications of the Species Evolution Theory. ..................................................113
Table 2.7 Concepts and Implications of Punctuated Equilibrium.............................................................114
Table 2.8 Concepts and Implications of Chaos Theory. ...........................................................................114
Table 2.9 Characteristics of the Four Process of Change Theories. .........................................................116
Table 2.10 The Three Sub-Issues of Research Issue Two. ....................................................................122
Table 2.11 The Three Sub-Issues of Research Issue Three....................................................................124
CHAPTER 3 Table 3.1 Research Design Options..........................................................................................................133
Table 3.2 Case Study Selection Criteria. ..................................................................................................138
Table 3.3 Tourist/Visitor Statistics. ..........................................................................................................147
Table 3.4 Tourist Accommodation Statistics. ...........................................................................................148
Table 3.5 General Growth Statistics. ........................................................................................................149
Table 3.6 Data Variable Criteria. ..............................................................................................................151
CHAPTER 4 Table 4.1 Major Sunshine Coast Tourist Developments. .........................................................................211
Table 4.2 Economic Climate. ...................................................................................................................241
Table 4.3 The Three Sub-Issues of Research Issue Two ..........................................................................249
Table 4.4 The Three Sub-Issues of Research Issue Three. .......................................................................251
CHAPTER 5 Table 5.1 Trajectories Displayed by Various Tourism and Growth Variables for the Sunshine Coast
During the Six Year Boom and Bust period. .......................................................................331
Table 5.2 Questions for the Analysis of the Trajectory Changes in the Boom and Bust Period...............331
Table 5.3 Answers to the Seven Boom and Bust Questions for each Variable. .......................................335
Table 5.4 The Order of the Changing Trajectories During Boom and Bust period. .................................337

Noreen Breakey Tourism Destination Development
xvii
List of Abbreviations
ABS Australian Bureau of Statistics
ALP Australian Labor Party
ANA Australian National Airways
ANTA Australian National Tourism Association
ATC Australian Tourist Commission
ATIA Australia Tourism Industry Association
BTR Bureau of Tourism Research
CBD Central Business District
CEDA Committee for Economic Development of Australia
CPI Consumer Price Index
CRC Cooperative Research Centre
DTM Domestic Tourism Monitor
EIA Environmental Impact Assessment
EIS Environmental Impact Statements
GDP Gross Domestic Product
IUCN International Union for Conservation of Nature and Natural Resources
IVS International Visitor Survey
LAC Limits of Acceptable Change
LOWESS LOcally-WEighted Scatterplot Smoother
MAPE Mean Absolute Percentage Error
MSRP Major Survey Research Programme
NEPA National Environmental Policy Act
NSW New South Wales, Australia
NTA National Tourism Administration
OESR Office of Economic and Statistical Research
QGTB Queensland Government Tourist Bureau
QTDB Queensland Tourist Development Board
QTTC Queensland Tourist and Travel Corporation
QVS Queensland Visitor Survey
PLI Plant Location International
PWA Price Waterhouse Associates

Noreen Breakey Tourism Destination Development
xviii
ROS Recreation Opportunity Spectrum
R-TAM Regional Tourism Activity Monitor
SD Statistical Division
TAA Trans Australian Airlines
TQ Tourism Queensland
UNCED United Nations Conference on Environment and Development
UNCHE United Nations Conference of the Human Environment
UNEP United Nations Environment Programme
US United States (of America)
WCED World Commission on Environment and Development
WTO World Tourism Organisation
WTTC World Travel and Tourism Council
WWI World War One
WWII World War Two
WWF World Wildlife Fund

Noreen Breakey Tourism Destination Development
Chapter One – The Development of a Tourism System at a Destination 1
Chapter 1 The Development of a Tourism System at a
Destination - An Introduction
1.1 Overview of Chapter One
This study arose from my interest in tourism destinations1. I had worked for over a decade
in a variety of industry positions, operations, and environments. I was interested in the way
that destinations evolve and the impacts of tourism induced changes on both the local
community and the natural environment. When this study commenced in September 1999 I
felt that planning and managing tourism destination development sustainably required an
understanding of how destinations develop and change generically. The seminal work of
Butler (1980), combined with the industry report by QTTC and Boeing (QTTC & Boeing,
1981), and the more recent works of Prideaux (1998; 1999a; 2000), Russell and Faulkner
(1999), and Carter (2000; 2004), suggested that a strategy would be to understand the role of
entrepreneurs and regulation in the shaping of tourism destinations2. This in turn would
allow for the directed development of ‘better’ destinations that would ensure social,
environmental, and economic sustainability. This was consistent with my belief that people
should be able to experience, but not destroy the wonders of this world.
Initially I assumed that in the past, provision of tourism experiences often occurred within
planning systems that emphasised development and commercial success, but which gave
limited consideration to the environmental and socio-cultural dimensions of a destination. I
hypothesised that this often resulted in negative impacts for the local people and the natural
environment.
1 Destination: “as distinct from origin or market, refers to the place where tourists intend to spend their time away from home. This geographic unit visited by tourists may be a self-contained centre, a village or town or a city, a region or an island or a country” (Cho, 2000). 2 Recently I have become aware of the forthcoming double volume on The Tourism Area Life Cycle by Richard W. Butler in the Aspects of Tourism series. Neither I, nor my supervisor, have been able to obtain a copy prior to submission with the books currently on order at the University of Queensland library. This dissertation is therefore presented in ignorance of this material.

Noreen Breakey Tourism Destination Development
Chapter One – The Development of a Tourism System at a Destination 2
Today tourism is increasingly incorporated into national, regional, and local level planning,
and new approaches and thinking are developing. As knowledge of the manner of tourism
destination development3 accumulates, I assumed that it would become possible to
determine the type and level of tourism activity appropriate4 for a developing destination,
and to plan, direct and control development accordingly. Such an informed approach to the
future of tourism destinations would aim to meet the needs of the local community5 and the
tourists, with the sustainable use of the local resources, thereby ensuring the financial
viability of the tourism industry.
As the work progressed, I became aware that the way tourism destinations change6 is not
understood and is far from predictable. In retrospect the proposed models7 of destination
development from the early 1980s (Butler, 1980; QTTC & Boeing, 1981) can be seen as
artefacts of scale as they provide a theoretical pattern of overall destination growth at the
macro level without the fluctuations, changing trends, and seasonality found at the more
detailed micro level (Figure 1.1).
Such models were useful in the early stages of tourism research and represent the orientation
of research at that time. The way the models were developed summarised the tourism
destination phenomenon. Consequently the applicability of the models is limited as they
smooth over significant events and periods of stability and rapid growth, which when
summed create the tourism destination’s overall pattern of growth8.
3 Development can be both the process of developing, as well as a specified state of growth or advancement (Pearsall, 2001). Development in this context is usually associated with progress and may be contrasted with directionless or regressive change (Calhoun, 2002). It often involves the process of converting land to a new purpose by constructing buildings or making use of its resources (Soanes & Stevenson, 2003). 4 Appropriate Tourism requires that the type and scale of tourism is considered suitable for an area in view of its economic, social, environmental, and other conditions (Medlik, 1997). 5 Local Community - A group of people who are socially related by virtue of identity with a particular location (Bradbury, 2003). However this does not imply that all the locals in a community share the same beliefs, culture, ideals, and way of life. Therefore ensuring the needs of the local community are met is problematic as the needs vary, for example, between old and new settlers. 6 Change - In its general application, change is an act or process through which something becomes different (Soanes & Stevenson, 2003). Such a difference is not necessarily ‘development’. In addition the change maybe a positive and/or negative difference depending upon one’s view. 7 Model - A representation of some phenomenon of the real world made in order to facilitate an understanding of its workings (Mayhew, 1997). In general, for practical reasons, a number of simplifying assumptions must be made which limit the extent to which a model truly represents actual conditions, the time period over which any conclusions are valid, and the application for which that model may be employed (Dunlop, 2001). 8 Pattern of Growth - The pattern generated by a variable that is plotted on a graph as a function of time. The pattern thus illustrates the growth of the variable. This may be used to show the growth of a population, sales of a product, etc (Butler et al., 1997).

Noreen Breakey Tourism Destination Development
Chapter One – The Development of a Tourism System at a Destination 3
Tourist Area Cycle of Evolution (1980) Tourism Growth Waves (1981)
Figure 1.1 The Early Tourism Destination Growth Trend Models of the Early 1980s. Butler’s Tourist Area Cycle of Evolution Model (Butler, 1980), and Tourism Growth Waves (QTTC & Boeing, 1981).
Ultimately my study evolved with the changing literature to become one of developing and
addressing appropriate questions about the complex change processes that when combined
result in overall destination growth9. Thus the aim of the work became: to increase
understanding about the ways tourism destinations develop. Ultimately this knowledge
could assist planners in achieving the goals for a destination. One such goal is ‘classical’
sustainable tourism10 (Section 1.2.3), but there are clearly other goals that are sustainable
when the balance between environment, economy and society is differently defined. This is
an important distinction. I will argue that tourism is a system that interacts with the wider
economic and social systems. Further the system can be understood and affected.
Consequently, although the outcome of an areas’ tourism development can be planned, the
‘final’ point is socially constructed, and there is no single formulation of the sustainability
goal.
9 Growth - In its general application, growth is the process of increasing, in size, amount, value, or importance (Soanes & Stevenson, 2003). Economically, change is an increase in an economic variable, normally persisting over successive periods. The variable concerned may be real or nominal, and may be measured in absolute, per capita, or other terms (Black, 2002). 10 Sustainable Tourism - Essentially tourism which can be sustained over the long term because it does not result in negative consequences for the social, cultural and physical environments of the area in which it takes place (Harris & Howard, 1996).

Noreen Breakey Tourism Destination Development
Chapter One – The Development of a Tourism System at a Destination 4
This study has borrowed from a range of change theories11 from disciplines as diverse as
business, biology, and mathematics. While tourism studies have also contributed, the
development of this study, like the development of destinations, was ‘chaotic’. Ideas had to
be explored, theories proposed, and comparative data located. One of the frustrations that
emerged is the erratic nature of tourism statistics and the limited or non-existent data on
developing destinations. It is difficult to attain long-term time-series data on a tourism
variable that is consistent in the definition of the variable, the methodology for
measurement, and the physical boundaries used in the data collection. Fully understanding
the development of a tourism destination requires the availability of multiple data variables
that reflect differing aspects of the destination, are comparative, and are collected over the
same time frame.
Specifically, this study considers various patterns of growth of one principle tourism
destination, and were relevant, several other destination levels, analysing the preconditions
to growth, possible causes of change, and the resultant impact on the destination. This study
is based on information gathered from two sources. Firstly, existing literature across many
disciplines provides concepts from various theories on the processes of change, which can
be applied to tourism destinations. From these theories important concepts12 have been
incorporated into a composite model of tourism destination change. Secondly, data on a
multi-level tourism case is assembled and applied to test the model.
1.2 Background to the Study
This study aims to assist in the planning and management of sustainable tourism
development by increasing the level of understanding of how destinations develop and
change. Published studies on tourism destination change could be considered to have had
four foci: tourism impacts, tourism planning, sustainable tourism, and destination life-
11 Theories - There are many definitions of theory. For this work a theory is an attempt to bind together in a systematic fashion the knowledge that one has of some particular aspect of the world of experience (Ruse, 1995). It embraces a set of interrelated definitions and relationships that organises our concepts of and understanding of the empirical world in a systematic way (Marshall, 1998). 12 Concepts - The terminological means by which social scientists seek to analyse social phenomena, to classify the objects of the observed world, impart meaning through explanation to these phenomena, and formulate higher-level propositions on the basis of these observations (Marshall, 1998). Therefore, for this work, concepts are components of a wider ‘theory’.

Noreen Breakey Tourism Destination Development
Chapter One – The Development of a Tourism System at a Destination 5
cycles. It is however recognised that each of these foci have not developed independently
and that all are affected by wider changes in thinking over the past half century and the
significant increase in tourism activity over that time. These four foci are introduced here to
provide the basis for the research on literature regarding alternative theories on the processes
of change (Chapter Two). In addition, detail on tourism impacts and the destination life-
cycle will be provided in Chapter Two.
1.2.1 The Impacts of Tourism Development - An Historic Overview
As tourism has become progressively more widespread over the past half century, attitudes
towards tourism and its impacts have changed (Foley et al., 1997). In a review of these
changing attitudes, Jafari (1990) retrospectively proposed four platforms: advocacy,
cautionary, adaptancy, and knowledge-based.
The ‘advocacy platform’ was the conventional approach present during the early world
tourism boom of the mid-1950s. At that time the focus was on the twin-fold benefits of
tourism on the economic and sociocultural aspects of a country’s development (Spanoudis,
1982).
The result of this pro-tourism development approach, combined with the limited tourism
experience associated with the relatively newness of the activity, and the dramatic growth of
travel after WWII, was numerous examples of unplanned, haphazard tourism growth, with
apparent irreversible damage to the natural environment and local cultures (Savignac, 1991).
Although the positive picture of tourism development was still the dominant view, by the
mid-1960s other opinions had begun to appear (Spanoudis, 1982). Recognition of the
problem of impact emerged among natural resource managers, who proposed relevant
environmental management strategies, including the concept of Carrying Capacity (Wagar,
1964), Environmental Impact Assessment (EIA) (US Government, 1969), the Recreation
Opportunity Spectrum (Brown et al., 1978; Clark & Stankey, 1979), and the later concepts
of Limits of Acceptable Change (Stankey et al., 1985), and Social Carrying Capacity
(Stankey & McCool, 1989).

Noreen Breakey Tourism Destination Development
Chapter One – The Development of a Tourism System at a Destination 6
By the beginning of the 1980s, research had began to investigate the negative effects of
tourism, including economic ‘disbenefits’, and the costs to the environmental and
sociocultural elements (Travis, 1982). However, in many cases tourism related data was not
available, anecdotal and/or unreliable (Coppock, 1982). An additional difficulty was the
limited number of variables that lend themselves to measurement (Duffield, 1982).
This new attitude which challenged the existing pro-tourism development approach has
since been termed the ‘cautionary platform’ (Jafari, 1990). The acknowledgement of the
negative impacts caused by tourism resulted in the significant shift in focus (Foley et al.,
1997).
Despite this growing support for the ‘cautionary’ approach, the ‘advocacy’ approach
continued to drive much of the development. Debates between supporters of these two
perspectives lead to the realisation that certain types of tourism result in fewer negative
impacts (Pearce, 1989). This provided the basis for the ‘adaptancy platform’ (Jafari, 1990).
Ultimately, this approach generated a range of ‘low impact of tourism types’, with labels
including alternative, green, soft, sustainable, responsible, appropriate, and ecotourism. An
important aspect of this ‘adaptancy platform’ was the emphasise on the ‘mutual dependence’
between the environment and tourism (Foley et al., 1997).
Despite the continuing discourse on tourism development and it’s impacts, there was
consensus that tourism needs to focus on the relationship between the positive and negative
impacts of tourism activity (Jafari, 1990). Applying the principles of sustainable
development (Section 1.2.3), the knowledge-based approach aims to achieve economic,
environmental and sociocultural sustainability. Such an aim requires consideration of the
relationship between the positive and negative impacts of tourism, as well as the trade-off
between various impacts.
Although these platforms developed at different times they were additive and parallel, rather
than sequential. The platforms represent different viewpoints and their supporters continue
to advocate the advantages of their approach to tourism.
Noreen Breakey Tourism Destination Development
Chapter One – The Development of a Tourism System at a Destination 7
In fact, the changing views on tourism development and the growing understanding of the
impacts of tourism have influenced approaches to tourism planning. The effects of tourism
development are incorporated into the concept of sustainable tourism, which aims to achieve
economic, environmental, and sociocultural sustainability, now and in the future. These two
foci, tourism planning and sustainable tourism, will be discussed in the following two
sections. I will return to the details of tourism impact understanding in Chapter Two.
1.2.2 Tourism Planning - An Historic Overview
Prior to the realisation of the negative impacts of tourism development, tourism planning
was perceived as a simple process that focused on encouraging new hotel developments,
ensuring adequate access via transportation, and conducting promotional campaigns (Getz,
1986; Inskeep, 1991). Throughout the 1980s an understanding of the need for better
planning evolved. It was recognised that tourism development was affected by a range of
external factors, such as natural and cultural resources, community, governmental policies,
entrepreneurship, finance, organisation leadership and competition (Baud-Bovy, 1982;
Gunn, 1988). Despite this acknowledgement these factors were not incorporated in practice.
Ultimately this multi-factorial nature lead to the use of more holistic planning approaches
for tourism in the 1990s (Burns, 1999).
1.2.2.1 Tourism Planning: 1945-1980
After WWII, tourism development expanded rapidly with many destinations, such as in the
Mediterranean and the Caribbean, encouraging mass tourism without government planning
going beyond established town planning (Inskeep, 1991). At that time tourism development
plans for individual projects were the usual practice. The plans were focused on ‘physical
planning’ with analyses made of the resources available and the market situation. This
determined a future image that then defined infrastructure requirements and favourable
locations for the various developments (Baud-Bovy, 1982). This type of tourism planning
was suitable for individual developments and the small resorts that existed prior to the
development of mass tourism (Inskeep, 1991). Ahead of its time was an integrated plan for
the State of Hawaii which incorporated tourism into the total regional development plan in
1959 (Inskeep, 1991). However, in general there was relatively little tourism planning
undertaken by the public sector in the late 1950s (Burns, 1999).

Noreen Breakey Tourism Destination Development
Chapter One – The Development of a Tourism System at a Destination 8
By the 1960s the planning activity itself had evolved, with ‘econometric models’ being
applied to planning tourism development. Alternative scenarios were compared on a
cost/benefit basis. However, the process was impeded by the limited availability of reliable
and relevant data, and the small differences between the alternatives (Baud-Bovy, 1982).
This increased level of tourism planning was caused by the realisation of the economic
benefits of tourism growth (Getz, 1986). Consequently governments began to undertake
planning that affected tourism, although tourism itself was not considered equal to other
industries (Burns, 1999).
By the 1970s planning was conducted for individual resort developments. However as
tourism destinations are an amalgam of many developments, which range in size and
investment, the extent of planning for each particular destination varied (Duffield, 1982). At
this time the relative failure of the past approaches to tourism planning provided the basis
for a more integrated approach. There was increasing recognition of the number of factors
that affect tourism development and the complexity of the tourism sector. This occurred
alongside the growing popularity of systems analysis, resulting in its application to tourism
planning, for example, the 1977 World Tourism Organisation (WTO) Handbook of
Integrated Planning which advocated a systems approach to tourism planning (Baud-Bovy,
1982). However, the planning process generally focused on the specific tourist operation in
isolation rather than considering it as interacting within a destination system or any other
wider systems (Getz, 1986; Burns, 1999).
Throughout the 1970s the World Bank operated a specialised tourism department (Davis &
Simmons, 1982). It was set up in recognition of the rapid growth of international tourism
through the 1960s, and the role of tourism as an export for the World Bank member
countries. However, the 1970s was a decade of oil shocks and high inflation. As a result of
the significant economic impacts and uncertainty, combined with other calls on the World
Bank’s resources, the tourism department was phased out in 1979 (Davis & Simmons,
1982). However, despite the economic shocks of the 1970s, international tourism had
continued to increase by over 5 percent per annum (Davis & Simmons, 1982).

Noreen Breakey Tourism Destination Development
Chapter One – The Development of a Tourism System at a Destination 9
1.2.2.2 Tourism Planning: 1980-1991
By the early 1980s the economic importance of tourism in both the domestic and
international arenas was apparent (Archer & Lawson, 1982). This reflected the ‘value
system’ inherent in much of the tourism writings at that time. There was considered to be a
focus on the economic benefits of tourism, the positive role of developing tourism, and how
to invest in further tourism development (Travis, 1982).
In addition governments who were increasingly confronted with tourism externalities began
to plan tourism. This was in an attempt to control or channel tourism to minimise the
adverse aspects, while maintaining its positive effects. Such planning included regional or
national tourism plans, as well as individual local project plans (Spanoudis, 1982). In 1983
the Australian Labor Party generated a policy document for tourism. This document
recognised that the industry contributed significantly to government revenue at the local,
state, and federal levels, while also recognising that the “protection of the environment
should be a pre-requisite of any tourist development” (Australian Labor Party, 1983 p.6).
This aim of minimising the negative impacts of tourism provided the basis for new
guidelines to assist in planning and managing tourism (Burns, 1999). This was expected to
then generate both ‘long-term tourism’ and ‘long-term net benefits’ (Travis, 1982). It was
clear that an interactive planning model needed to link tourism impacts with the
environment, as it was recognised that such activities affect the physical, social and
economic responses (Duffield, 1982).
An important aspect of planning for tourism during the 1980s was the incorporation of the
dynamism of tourism. It was realised that fixed destination plans were therefore not
appropriate. Instead, it was understood that a process involving periodic reassessment and
updating was required (Gunn, 1982). In addition to this monitoring/revision approach, a
second alternative was proposed, using an adaptable and evolutionary process, which
incorporated external changes and any new information (Baud-Bovy, 1982).
Despite the development and existence of tourism plans, in practice many such plans were
not able to be implemented. A survey conducted by WTO in the early 1980s found that half
of tourism development plans had not been implemented at all, and of the remainder many
had only been partially implemented (Baud-Bovy, 1982). The main reasons for this were
Noreen Breakey Tourism Destination Development
Chapter One – The Development of a Tourism System at a Destination 10
considered to be the lack of integration of tourism into the whole economy, the inadequate
consideration paid to socio-economic impacts, the insufficient attention on the ‘real
mechanisms’ of tourism development, plus the inability of plans to adapt to changing
conditions. However, it was believed that the barriers to implementation of tourism plans
could be overcome by changes to the planning process, through the incorporation of the
various stakeholders and the inclusion of relevant external factors (Baud-Bovy, 1982).
De Kadt (1979) had claimed that the standard remedial approach to tourism planning needed
to be replaced by planning that was community-controlled. However, according to Duffield
(1982), one difficulty associated with including local stakeholders in tourism planning was
that it is impossible to establish one method of destination development that will suit all
local communities as these hosts can be extremely diverse, in terms of their physical setting,
their cultural development, the economic conditions that affect them, and their ability to
accommodate change.
By 1982 it was clear that tourism planning needed to reflect the interdependency inherent in
tourism. This characteristic occurs in three ways: interdependency with the overarching
socio-economic development of a nation; interdependency within the tourism sector; and
interdependency between international tourism, domestic tourism and recreation (Baud-
Bovy, 1982). A tourism development plan therefore “has to be integrated into the nation’s
socio-economic and political policies, into the natural and man-made environment, into the
socio-cultural traditions, into the many related sectors of the economy and its financial
schemes, and into the international tourism market” (Baud-Bovy, 1982 p.308). This
challenged the view that tourism planning was only a political activity, involving
regulations, positive and negative repercussions, and ultimately reflecting the desires and
values of political constituencies (Gunn, 1988).
By the mid 1980s, the past economic prioritisation was being questioned, with issues being
raised regarding limits to growth and appropriate planning models. There were many
advocating a change from the traditional, narrow development focus, to make tourism
planning more sensitive to non-economic issues (Getz, 1986). The level of change
proposed, revising the emphasis and scope of tourism planning, suggested a deep-rooted
dissatisfaction with existing tourism planning (Getz, 1986).

Noreen Breakey Tourism Destination Development
Chapter One – The Development of a Tourism System at a Destination 11
At that time tourism planning and management process models were considered to be one of
four types: area-development models, project development models, management and
marketing models, and planning as a conceptual system. A review of tourism planning
models at that time by Getz (1986) concluded that the majority were project and
development focused, and were based on problem-solving methodology. This illustrated the
limited application of conceptual models that integrated the problem-solving processes with
theory and research (Getz, 1986).
Consequently planning for tourism was conducted in various ways. The level of
comprehensiveness in tourism planning varies as it can apply to whole systems or
subsystems, and to various spatial scales, including site/project specific, or a defined
geographical level (Getz, 1986). Tourism planning occurs at a multitude of levels,
incorporating international, national, regional, and local. Planning is also conducted for
specific sectors, such as social tourism or coastal tourism. A range of specific tourism plans
are developed, including national marketing plans and tourism development plans. In
addition there are numerous tourism related plans which focus on areas such as
infrastructure, transport, and conservation (Pearce, 1989). Therefore, in the late 1980s there
was not considered to be a universally accepted method of tourism planning and there was
limited application of related findings (Gunn, 1988).
The impacts of tourism, as evidenced in numerous real-world scenarios, were considered to
be one of two types. Firstly, impacts that are inherent in the development of tourism, and
secondly impacts which could be eliminated or minimised through planning (Gunn, 1988).
This provided the basis for the aim of optimisation of the positive impacts of tourism,
combined with the mitigation of potential negative problems, through integrated planning
and careful management (Inskeep, 1991).
By the late 1980s it was established that tourism planning was required and that it needed to
be comprehensive, action-orientated, focused, explicit in mission, proactive, continuing,
integrative, involve value intuition and judgement, and take a long-term approach (Gunn,
1988; Savignac, 1991). Integrative planning for tourism development was considered
essential and it would be most effective if all factors are considered (Pearce, 1989). In
addition, effective planning was seen to require that the objectives are defined and relate to

Noreen Breakey Tourism Destination Development
Chapter One – The Development of a Tourism System at a Destination 12
the needs of all sectors, resource analysis is matched with evaluation of demand by tourist
markets, and the legal system enforces implementation (Pearce, 1989).
The reasons why planning for tourism is necessary had been clarified by the end of the
decade. Inskeep’s eleven merits of tourism planning are summarised as:
1. As modern tourism is a relatively new activity, the limited experience of the public
and private sectors necessitates the provision of guidance from tourism plans.
2. As tourism is a complicated, multi-sectoral, and fragmented activity, planning is
required to co-ordinate development in an integrated manner.
3. A planning process can match the tourist markets with the products, without
compromising environmental and sociocultural objectives.
4. Economic benefits can be optimised through planning.
5. Planning can optimise other benefits and prevent/lessen associated problems.
6. Planning is required to determine the optimum type and level of tourism for a
particular environment.
7. Planning can ensure that tourism development is sustainable.
8. Planning can be used to maintain flexibility, allowing for new forms of tourism.
9. Tourism planning can ensure that appropriate education and training occurs.
10. A comprehensive and integrated planning process can be closely related to tourism
policy and development.
11. Planning provides a rational basis for investment by the public and private sectors.
(Inskeep, 1991 pp.16-17).
1.2.2.3 Tourism Planning: 1991-2005
The 1990s saw the continued development of tourism planning. In 1991 the dominant view
was controlling activity to maximise benefits and eliminate significant problems (Inskeep,
1991). The major issues relating to tourism planning at that time were the ‘centre stage’
position of the physical environment; recognition of the limits to development, with both
physical and social carrying capacities; community involvement; cultural diversity;
changing tourist and demographic trends; the shift to market-driven economies; the need to
be proactive; and increasing privatisation and deregulation (Hawkins, 1991).

Noreen Breakey Tourism Destination Development
Chapter One – The Development of a Tourism System at a Destination 13
In addition to the variety of interests within tourism operations, numerous aspects of a
tourism destination are managed by non-tourism specific businesses, local bodies and
government agencies, and some aspects are simply not managed (Leiper, 1995). The lack of
tourism knowledge amongst some of these bodies, combined with the level of diversity and
fragmentation of the industry, and the difficulties of coordinated planning continues to result
in instances of unplanned and inappropriate tourism (Tzoanos, 1994). Hall (1997 p.61)
noted that despite the understanding of why tourism planning was necessary and the need
for integrated planning, by the late 1990s models still did not “deal with the ‘real world’ of
planning which is affected by a range of values, interests and stakeholders”.
However, it was understood that tourism planning and management needed to be integrated
with the planning and management of other economic sectors, as many of the key resources
on which tourism depends are managed by others or affected by the actions of others, for
example, forestry, fishing, hunting, manufacturing, and agriculture (Manning & Dougherty,
1999). The barrier to such integration is that in most countries, these aspects of tourism are
managed by a number of different government departments. Integration for tourism is
therefore more difficult than for other industries. Consequently, tourism cannot be planned
for in isolation (Manning & Dougherty, 1999). Yet there continues to be increasing
expectation placed on tourism, with the decline in many traditional industries (Gunn & Var,
2002).
Ultimately tourism planning models need to incorporate the level of complexity inherent in
tourism destinations. History has shown that planning concepts and methods need to vary
according to geographic scale, resulting in planning for the regional level, which
incorporates national, state, and provincial areas; the destination level; and the site level, for
specific projects (Gunn & Var, 2002).
Specific tourism planning models have been developed and introduced. Some endeavour to
establish the form of tourism suitable for the region, such as the 1991 Ecotourism
Diagnostic and Planning Guidelines for Protected Areas Managers (Boo, 1991) and the 1993
Environmentally Based Planning Model for Regional Tourism Development (Dowling,
1993). Planning programs have also aimed to incorporate the various key industry
stakeholders with existing research, in determining the priorities for developing tourism in a

Noreen Breakey Tourism Destination Development
Chapter One – The Development of a Tourism System at a Destination 14
destination, such as Tourism Queensland’s Destination Management Planning process
(Tourism Queensland, 2004).
The expansion of tourism and the economic benefits achieved throughout the 1980s
heightened expectations of what tourism development could deliver. The limited realisation
of these benefits during the 1990s highlighted the need for planning, and the need for total
destination management (Burns, 1999).
Tourism planning has also been increasingly linked with sustainable tourism (Section 1.2.3),
as exemplified by the establishment of the Cooperative Research Centre (CRC) for
Sustainable Tourism in mid 1997 (Jago et al., 2003). However it has been proposed that
while planning exists in policy documents rather than legislation it will remain difficult to
realise sustainable tourism development (Hall, 1997). Reliance on market methods and
processes is not sufficient as often market intervention would not assist in minimising
negative impacts until after degradation had occurred (Collins, 1999).
The main difficulties that still face tourism planners are due to the complexity of tourism;
the abstract nature of tourism; the lack of overall control by one individual; numerous,
significant and unknown external affects; multiple stakeholders; the range of goals and
objectives for tourism; the reliance on voluntary travel and travel preferences; changing
environmental conditions; unpredictable entrepreneurial activity; the effects of
acculturation; and the limited understanding of tourism by local peoples (Gunn & Var,
2002).
Significant changes and events that affect tourism, such as unexpected terrorism attacks,
emphasise the ongoing need for tourism planning. The drop in the volume of travel post-
September 11, 2001 highlighted the economic role of tourism, which extends beyond
tourism specific businesses. As a result, planning for change in the complicated arena of
tourism is necessary (Taylor, 2002).
In achieving ‘better’ tourism development, Clare Gunn and Turgut Var (2002) propose four
goals: enhanced visitor satisfactions; improved economy and business success; sustainable
resource use; and community and area integration. Ultimately “tourism is too important to
mankind to let it continue to drift” (Gunn & Var, 2002 p. xxi).

Noreen Breakey Tourism Destination Development
Chapter One – The Development of a Tourism System at a Destination 15
1.2.3 Sustainable Tourism - An Historic Overview
In parallel with the changing understanding of tourism impacts and planning, perspectives
on the relationship between tourism and the environment have also evolved (Butler, 2000).
Debate on this tourism-environment relationship gained momentum in the 1960s (Fletcher,
2005). The focus at that time was on the deterioration of the environment at tourism
destinations. Increasing debate occurred into the 1970s with a significant shift in attitudes
and perceptions, in line with the general ‘back to nature’ attitude of the hippie generation.
During this period the tourism industry generally believed that the conservationists were
exaggerating the significance of the problems and that the positive aspects of tourism for the
environment balanced out the adverse aspects (Boers & Bosch, 1994). However, the
recognition of tourism impacts continued as tourism spread. In fact between 1970 and 1990
tourism volume increased by 300 percent (Singh & Singh, 1999).
Attitudes within the general tourism industry began to change in the mid-1980s. The main
reasons for the shift in attitude were considered to be: the growing influence of the
organised conservation and environmental movements; tourists who demand quality;
tourists’ awareness of their effect on the environment; and economic motives, as it was
becoming profitable to ‘turn green’ (Boers & Bosch, 1994). However determining what
actually categorised ‘green’ was debatable (Harrison, 1996). Questions were also posed
regarding the balance between the immediate economic gain of tourism activity and the
longer term environmental and cultural impacts (Briguglio, 1996), as discussed above
(Section 1.2.1). In addition the wider changes in approaches to development affected
tourism, including the concepts of ‘integrated’ development, ‘resource management’, and
‘community-based’ development (Hall, 1998).
Acceptance that tourism development can damage the environment paved the way for
control of development to avoid the negative impacts, as the natural resources are also the
tourism resources (Romeril, 1989). This dependence of tourism on the environment was
realised by the tourism industry, government, and the tourists themselves (Boers & Bosch,
1994). It was ultimately realised that, “unless responsible management practices are in
place, the industry can degrade the very feature on which tourism’s prosperity is based”
(Manning & Dougherty, 1999 p.1).

Noreen Breakey Tourism Destination Development
Chapter One – The Development of a Tourism System at a Destination 16
However, despite common understanding of the importance of the natural environment and
the results of uncontrolled tourism, there was limited agreement on the type and/or level of
control. The question posed was: What is the balance between tourism development and
environmental protection? It was realised that agreement is complicated as value
judgements are required, suspicions exist between the environmentalists and the tourism
industry, and there is a lack of consistent political resolve to implement environmental
policies. One reason why the relationship between tourism and the environment is complex
is that both fields are intrinsically diverse (Romeril, 1989).
In the climate of general societal attitude change during the 1980s, with concepts such as the
‘global village’, the 1987 United Nations’ World Commission on Environment and
Development (WCED) published ‘Our Common Future’, commonly known as the
‘Brundtland Report’ (WCED, 1987). Sustainable development was the main concept within
the report. This now widely recognised definition of sustainability is development that
meets the needs of the present without compromising the ability of future generations to
meet their own needs (WCED, 1987). The report specified that development should ensure
intergenerational and intragenerational equity, and embrace social justice, cooperation and
the global community (Collins, 1999). This sentiment was encapsulated by Murphy (1994
p.275): “we do not inherit the earth from our forefathers but borrow it from our children”.
Practically, the definition of sustainable development can be considered to incorporate the
three main areas of “long-term economic sustainability; within a framework of long-term
ecological sustainability; and with an equitable distribution of the costs and benefits of
development” (Woodley, 1993 p. 136). Thus the analytic framework is broad, incorporating
economic, environmental and sociocultural aspects (Fletcher, 2005).
The World Conservation Strategy: Living Resource Conservation for Sustainable
Development (IUCN et al., 1980), with the Brundtland Report (WCED, 1987) have been
credited which the introduction of the term ‘sustainability’ and beginning the popularisation
of sustainable development as a goal for human society (Kreutzwiser, 1993; Manning &
Dougherty, 1999; Gunn & Var, 2002). Sustainable development also received government
support as it incorporated economic growth (Wood, 1993). In addition international
acceptance of sustainable development is thought to be due to its timing, as it emerged when
scientific, economic, sociocultural and environmental problems were converging (Hardy &

Noreen Breakey Tourism Destination Development
Chapter One – The Development of a Tourism System at a Destination 17
Beeton, 2001; Hardy et al., 2002). This is yet another example of the interrelationship of
tourism with other aspects of the wider world.
The concept of sustainable development was adopted by tourism and termed ‘sustainable
tourism’. The extent of the acceptance and use of this term has been considered both
‘satisfying and disturbing’, while implementation has been limited (Butler, 1998).
The first stage had been the realisation that tourism can be dependant on the state of the
environment. The sustainable development principle added an additional focus to tourism,
such that the activities should not threaten the needs of future generations (Boers & Bosch,
1994). Based on an understanding of the evolving nature of tourism, there developed an
increasing level of concern about the future direction and a call for a fundamental shift from
the exploitative to a sustainable tourism development approach (Prosser, 1994). At that
time, sustainable tourism was seen to be the ‘polar opposite’ of the existing mass tourism,
described retrospectively by Clarke (1997).
This lead to the second stage, the belief that the tourism sector, as users of the environment,
should assist in maintaining and improving its quality (Boers & Bosch, 1994). A proposed
working definition was put forward by Butler in 1993. A significant aspect of this definition
was the differentiation between ‘sustainable development in the context of tourism’ and
‘sustainable tourism’ (Nelson, 1993). True sustainable development for tourism was
considered to be “tourism which is developed and maintained in an area (community,
environment) in such a manner and at such a scale that is remains viable over an indefinite
period and does not degrade or alter the environment (human and physical) in which it exists
to such a degree that it prohibits the successful development and well-being of other
activities and processes” (Butler, 1993 p.29).
An alternate definition considered sustainable tourism to ultimately seek “to sustain the
quantity, quality and productivity of both human and natural resource systems over time,
while respecting and accommodating the dynamics of such systems” (Prosser, 1994 pp. 31-
2). Such perspectives illustrate Hunter’s ‘extra-parochial paradigm’ which “entails a much
less ‘precious’ approach to the role and importance of tourism as an entity, and recognises
that tourism does not have an inherent right to grow in an area at the expense of any other

Noreen Breakey Tourism Destination Development
Chapter One – The Development of a Tourism System at a Destination 18
sector, unless it better meets the requirements of sustainable development generally”
(Hunter, 1995 p. 162).
In 1992 the United Nations Conference on Environment and Development (UNCED) was
held in Rio, Brazil. The three-year preparation prior to the conference aimed to ensure that
the outcome, ‘Agenda 21’, was an action plan based on the challenging debates which
generated consensus on the decisions required for achieving sustainable development
(Robinson, 1992). This Earth Summit ‘Agenda for the 21st Century’ included the Rio
Declaration of the 27 principles regarding the environment and development (United
Nations, 1993).
Subsequently, the Agenda 21 for the Travel and Tourism Industry was produced by the
World Travel and Tourism Council, the World Tourism Organisation, and the Earth Council
(WTTC et al., 1995). The Agenda 21 presented strategies the industry should follow to
generate sustainability (Manning & Dougherty, 1999). This cross-national agenda for the
21st Century recognised that the global problems are the result of all the activity at the local
levels (Jackson & Morpeth, 1999). The aggregate picture is therefore the culmination of all
the decisions and actions taken that affect each industry, including tourism and its
destinations. Despite the intentions at that time, the resolutions of the summit still apply
today as there has been limited implementation of the strategies and action plans (Fletcher,
2005).
Social change drivers behind the growing interest in the sustainability of tourism were:
tourist dissatisfaction with existing products; growing environmental awareness and cultural
sensitivity; realisation by destination regions of the important resources they possess, both
human and natural, and their vulnerability; as well as changing attitudes of developers and
tour operators (Prosser, 1994). Drivers for adoption by the tourism industry have been
considered to be economic, public relations and marketing (Butler, 1998).
As industry tried to implement the ideals of sustainable tourism there was a shift in thinking
throughout the 1990s, resulting in the concept of a continuum between non-sustainable mass
tourism and small sustainable tourism. This evolving concept was still focused on the scale
of development (Clarke, 1997).
Noreen Breakey Tourism Destination Development
Chapter One – The Development of a Tourism System at a Destination 19
There is no easy answer for how sustainable tourism can be achieved, particularly as each
destination/environment combination is different (Boers & Bosch, 1994). In addition
sustainable tourism has been viewed from multiple disciplines, including economics,
sociology, anthropology, environmental studies, and ethics, resulting in numerous
definitions and perspectives (Archer et al., 1996). In reality, the debate over the definition,
management and implementation of sustainable tourism continues the age-old discussion on
natural resource usage, as well as reflecting the more recent changes in attitudes regarding
the environment (Hall, 1998). According to Faulkner (1998 p.207) “the emerging
sustainable tourism development philosophy of the 1990s can be viewed as an extension of
the broader realisation that a preoccupation with economic growth without due regard to its
social and environmental consequences is self-defeating in the longer term”.
A review by Collins (1999) of the approaches to sustainable tourism highlighted how rarely
they coincided with the true principles of sustainable development. The focus of tourism
practice was instead on concern for the maintenance of the physical and cultural
environment, in particular the preservation of flora, fauna, and habitat. Generally theory and
research on tourism development has had limited focus on the environment (Milne, 1998) or
social aspects (Williams & Shaw, 1998), which are both important components of
sustainable development. Therefore, despite its popular use, sustainable tourism continues
to be difficult to achieve.
Balancing all the goals is unrealistic in practice, and in reality ‘trade-off’ decisions are
made, generating priorities which ‘skew’ the destination system (Hunter, 1997). Therefore
tourism development, even when aiming for sustainability, could be seen to be really ‘trade-
off tourism’, with the trade-off occurring between dramatic economic growth and
environmental quality (Collins, 1999).
In an attempt to satisfy the aspirations for sustainable development for tourism, ‘principles
for sustainable tourism’ were generated (including Eber, 1992). A primary principle of
sustainable tourism aims to focus attention on the long term (Cooper et al., 1993; Cooper et
al., 1998; Fletcher, 2005). Instead of an ideal destination to be reached the concept of
sustainable tourism is the basis for the direction of the journey. Aspiring to sustainable
tourism is to “declare an intention to manage the scale and nature of tourism in such a way
that social and physical surroundings are preserved” (Boers & Bosch, 1994 p. 55).

Noreen Breakey Tourism Destination Development
Chapter One – The Development of a Tourism System at a Destination 20
Foley, Lennon and Maxwell (1997) asserted that tourism development, to be sustainable,
should focus on the underlying philosophy of sustainable development, aiming to minimise
environmental and cultural damage, optimise visitor satisfaction and maximise long term
economic growth. This attitude regarding the meaning of sustainable tourism was a
development from the initial sustainable tourism concept, of a scale related possession, to a
‘movement’ whereby all tourism, including mass tourism, should aim to be sustainable
(Clarke, 1997).
Achieving a sustainable approach to tourism requires shifts within the main areas of the
tourism system, the attitudes of tourists, the response of destination areas, the
responsibilities of the tourism industry, and the perceptions of the local communities.
Destinations need to take a longer term view, with policy reflecting ecological and social
time frames, not just political and economic time (Prosser, 1994).
As a result of the growing awareness of the need for sustainable tourism, environmental
protection measures have been introduced in some tourism destinations and individual
businesses (Boers & Bosch, 1994). Some consider small-scale tourism as being more
aligned with sustainable tourism than mass tourism (Collins, 1999). This approach
promoted ecotourism as a sustainable form of tourism. Subsequently ecotourism became
the fastest growing, albeit smallest, sector of tourism, resulting in the 1990s being termed
‘the decade of ecotourism’ (Singh & Singh, 1999). However “forms of tourism being
promoted on the basis of sustainability may well be more harmful to the area, its habitants
and environment in the long term than more conventional tourism” (Butler, 1993 p.28). In
addition may believe that there is the potential to develop environmentally sensitive mass
tourism (Collins, 1999). To achieve this form of sustainable tourism development the trend
to maturity is encouraged, as this moves the destination from multiple small operators to a
smaller number of large organisations. This can be considered a positive change as the
small firms often cannot incorporate environmentally friendly practices (Leiper, 1995). One
trade off of this approach is that although the larger firms maybe ‘greener’, they require a
significant volume of tourists. Ultimately it reached the stage where Smith (1999) claimed
that it is politically correct to be environmentally sensitive.

Noreen Breakey Tourism Destination Development
Chapter One – The Development of a Tourism System at a Destination 21
Despite the support for sustainable tourism there are a number of obstacles in its
achievement, including:
1. A lack of understanding about the link between tourist development and
environmental problems
⇒ insufficient understanding of good management practices
2. Institutional problems
⇒ lack of coordination, integration and agreement between the authorities
⇒ lack of research, human resources and funds
3. The necessity for cooperation between the tourist industry and other stakeholders
4. Tourism is primarily an economic activity
⇒ dependence on tourism
⇒ level of competition
⇒ incompatible with gradual, sustainable development
5. Tourism is a sector requiring major capital investment
(Boers & Bosch, 1994 pp.46-7).
At the beginning of the 1990s Butler (1990) called for recognition of tourism as an industry
which inherently involves development and change. It is since become accepted that as an
industrial activity, tourism requires finite land resources, it consumes resources, demands
extensive and specific infrastructural improvements, and creates waste (Foley et al., 1997;
Collins, 1999). The finite nature of natural resources means that ongoing social and
economic benefits require the sustainable use of the natural resources (Romeril, 1989). In
addition, the level of demand is highly susceptible to changing fashion in holiday
destinations, and threats of political instability (Collins, 1999). As the situation is different
at each destination it is important that sustainable tourism is considered an ‘adaptive
paradigm’ which constitutes various approaches (Hunter, 1997).
It is a delicate balance to optimise the returns while protecting the resource base (Prosser,
1994). The principle of sustainable tourism therefore requires holistic, integrative and long-
range planning, and a better balance between the spatial, environmental and economic
aspects of tourism development (Foley et al., 1997; Gunn & Var, 2002). Sustainable
tourism therefore highlights the need for a broader view that incorporates planning aspects
(Section 1.2.2) and impact minimisation (Section 1.2.1), while encompassing all areas of

Noreen Breakey Tourism Destination Development
Chapter One – The Development of a Tourism System at a Destination 22
destination development (Section 1.2.4). Thus the application of the concept of
sustainability to tourism continues to evolve (Ko, 2001).
Accepting that any tourism activity will create some level of impact and change, and that
both natural and human systems are dynamic and can absorb some impact but have limits to
the rate and extent of change, planning for sustainable tourism requires controlling
development within the ‘adaption thresholds’ of the destination (Prosser, 1994). An
important contribution of the aim of sustainable tourism is the incorporation of
responsibility. The resources of the destination must be used responsibly by all those
involved, including businesses, government, the tourists, and the host community (Fletcher,
2005).
As proposed by Getz (1986) in the mid 1980s, an impediment to achieving the goal of
sustainable planning is the inability to model the tourism system thoroughly. The life-cycle
theory (Butler, 1980) was one attempt in providing a model of tourism destination
development. While increasing understanding of such change, the model does not match the
tourism system in its true complex and dynamic form.
1.2.4 Tourism Destination Life-Cycle
The fourth significant focus of tourism destination research has been the destination life-
cycle. This theory will be discussed with other process of change theories in Chapter Two.
Butler's Tourist Area Cycle of Evolution (Butler, 1980) was an application of the marketing
product life-cycle theory to tourism destinations. The product life-cycle, in turn was based
on a metaphor, namely the biological life-cycle of higher living organisms: birth, growth,
maturity and death (Tellis & Crawford, 1981; Hart et al., 1984; Scott, 2003).
The ‘cycle of evolution’ models were based on sequential stages that describe the
development of tourism destinations over time. Substantial application of this framework,
conducted for specific locations indicate the general validity of the evolutionary framework
to describe past tourism development (Section 2.4.2.2).
The model of the destination life-cycle can be used to describe past large-scale or high-level
changes within destinations (Towner & Wall, 1991). However it does not consider the

Noreen Breakey Tourism Destination Development
Chapter One – The Development of a Tourism System at a Destination 23
smaller and lower-level changes and their interaction, nor does it identify the catalysts and
situations conducive for tourism development, or incorporate the significance of external
events and influence. This is partially due to the typical use of a single data variable, such
as total visitor numbers, as the indicator of destination growth. If the tourism system
operating at a destination is to be fully understood multiple data variables that accompany
change at a destination must be examined. This would also provide the opportunity to study
the correlation and interaction between variables. The model being developed by this work
incorporates these complex issues.
1.3 Rationale for this Research
The history outlined above has resulted in those involved in tourism facing a confusing mix
that includes a list of impacts to avoid, a variety of planning models that are often location
specific or require substantial stakeholder involvement, pressure to develop sustainable
tourism, as well as a general destination life-cycle model, which may or may not fit the
overall pattern of growth of a particular destination. Although tourism life-cycle theory is
an ‘adequate’ macro scale description of destination growth, no adequate theory exists for
the micro changes underlying this reported phenomenon13. The intent of this study is to
provide a better model that can be used to understand any type of tourism destination
growth. Such a model would address internal changes and interactions, and the responses
within the destination to external forces. In addition it would illustrate the impact at various
scales. Understanding these changes, interactions, and responses would allow the
construction of theory that could be applied to tourism destinations, irrespective of the
geographical scale.
The macro growth pattern of a destination does not provide the complete picture of the
destination change, as it is in fact the combination of all the interactions of micro level
changes. Growth in total visitor numbers, could for instance, be the result of declining
domestic visitors combined with increasing international visitation, or the introduction of a
new product market, or any other mixture. Although the interactions resulting in the
13 Phenomenon is a fact or situation that is observed to exist or happen, especially one whose cause or explanation is in question (Soanes & Stevenson, 2003).

Noreen Breakey Tourism Destination Development
Chapter One – The Development of a Tourism System at a Destination 24
aggregate pattern are often complex, it is necessary to understand the ‘how and why’ of
micro level changes before the overall macro dynamics can be truly understood. This
knowledge could in turn allow ‘informed’ intervention in tourism destination development.
Consequently the overall aim of this study became: to understand how and why change
occurs within a tourism destination. This required consideration of firstly, the
preconditions that allow, encourage, or prevent certain patterns of growth and secondly, the
role of significant individuals, decisions and events in causing change. The process of
change in a tourism destination can therefore be expressed by an equation (Figure 1.2).
+ =
Figure 1.2 The Process of Change in a Tourism Destination. Illustrates that the resultant pattern of change in a destination is dependant on the manner in which the components of the tourism system are affected by, and respond to intervention, that may be internal to the destination, or from the external operating environment.
The preconditions include the existing tourism, geographical, social, cultural, and political
conditions. Interventions may be internal or external, relating to economic, political, or
legislative decisions, social or cultural change, planning, investment, development, events,
or significant people. The interaction between the preconditions, and the internal and
external intervention, results in the pattern of change for the destination. Additionally the
resultant pattern of change becomes the existing preconditions for future change processes.
By understanding the relationships between the preconditions and the intervention it may be
possible to better predict the resultant change.
From the general aim a series of research questions emerged that directed this study.
Collectively these questions were to examine three theses. Firstly: that the observed
patterns of tourism destination change can be understood as the outcome of a
multitude of smaller events that have a complex pattern of inter-relationships.
PRECONDITIONS INTERVENTION PATTERN OF CHANGE
INTERACTION

Noreen Breakey Tourism Destination Development
Chapter One – The Development of a Tourism System at a Destination 25
Secondly: that the pattern and interaction of the tourism system operates at varying
scales which can be spatial and temporal, and involve social, economic, and political
variables. Finally: that tourism is a complex system, not amenable to simple modes of
analysis.
The research questions developed to assist in the examination of these theses are set out
below and mapped to the chapters of this dissertation (Figure 1.3).
Research Question One:
What concepts within existing theories on the processes of change are relevant for
studying the development of a tourism destination?
(Chapter Two - Literature Review)
Research Question Two:
Can a model of the processes of change in a tourism destination be devised?
(Chapter Two - Output of the Review of Literature)
Research Question Three:
Can a body of data be assembled that allows the proposed model to be applied to a
case study tourism destination?
(Chapter Three - Research Design)
Research Question Four:
Does the proposed model hold when tested against change in the tourism case study?
(Chapter Four and Five - Case Study Research)
Research Question Five:
Can the devised and tested model of change in a tourism destination be used
predictively to assist planning and development of a sustainable tourism destination?
(Chapter Six - Conclusion)

Noreen Breakey Tourism Destination Development
Chapter One – The Development of a Tourism System at a Destination 26
Research Aim Theses (Section 1.3)
Research Questions (Section 1.3)
To increase understanding about the ways tourism
destinations develop (Section 1.1)
What concepts within existing theories on the processes of
change are relevant for studying the development of a tourism
destination?
That tourism is a complex system, not amenable to simple
modes of analysis
That the observed patterns of tourism destination change can
be understood as the outcome of a multitude of smaller events that have a complex pattern of inter-
relationshipsTo understand how and
why change occurs within a tourism destination
(Section 1.3)
That the pattern and interaction of the tourism system operates at
varying scales which can be spatial and temporal, and involve
social, economic, and political variables
Can a model of the processes of change in a tourism destination
be devised?
Can a body of data be assembled that allows the proposed model to
be applied to a case study tourism destination?
Does the proposed model hold when tested against change in
the tourism case study?
Can the devised and tested model of change in a tourism
destination be used predictively to assist planning and development
of a sustainable tourism destination?
Figure 1.3 The Initial Research Aim, Theses, and Research Questions.
1.4 Structure of the Dissertation
In addition to this introductory chapter, the dissertation has five chapters (Figure 1.4). There
are two primary objectives for Chapter Two. Firstly the chapter reviews literature on
tourism destination change (Research Question One) and secondly, a model is developed
from a diversity of existing theories (Research Question Two). In doing so the range of
theories that have been applied, to differing degrees, to understand tourism destination
development, are reviewed. For each of these theories the important contributions and
limitations are identified. As no single theory has been able to address the complexity of
tourism destination change an alternate model is proposed. This model encapsulates the
thesis I have proposed. Elements of the model are not new as the model incorporates
relevant concepts from the theories discussed. A new contribution is the ability of the model
to incorporate a range of variables in many contexts. The remainder of this study involves
the testing of the proposed model through its application to the tourism destination case
study.

Noreen Breakey Tourism Destination Development
Chapter One – The Development of a Tourism System at a Destination 27
Figure 1.4 Dissertation Structure
CHAPTER ONEThe Development of a
Tourism System at a Destination – An Introduction
CHAPTER TWOTheories on the
Processes of Change – Development of a Model
CHAPTER THREEThe Research Process – Methodology, Case Study Design, Secondary Data
& Time Series Analysis
CHAPTER FOURThe Tourism Destination
Case System – An Historical Overview
CHAPTER FIVEThe Tourism Destination
Case System – A Time-Series Analysis
CHAPTER SIXThe Development of a
Tourism System at a Destination – A Conclusion

Noreen Breakey Tourism Destination Development
Chapter One – The Development of a Tourism System at a Destination 28
Chapter Three provides the methodological basis for the case study approach used for this
work. As this research aims to establish whether the theoretical model developed in Chapter
Two can be used to explain tourism destination change, it is necessary to apply the proposed
model to tourism destination change. Case study research is discussed in this chapter and
the specific inquiry approach used in this study is defined. Having established the approach
undertaken, the process involved in the selection of the tourism case study is described.
This is followed by an examination of secondary data, specifically in relation to tourism
statistics (Research Question Three).
To provide a context for the data collected for the tourism case study, Chapter Four provides
a historical overview of the development of tourism in the case study system. This tourism
system encompasses a number of levels, from the three Local Government Areas; Noosa
Shire, Maroochy Shire, and Caloundra City, which make up the Sunshine Coast destination,
through the State and National levels, to Global trends and events. This chapter describes
the impact of significant people, decisions, and events on this multi-level case study. These
impacts are matched to changes in the data variables in the subsequent data analysis chapter.
Chapter Five presents data that describes change in the tourism case study. Applying the
model to be tested results in an analysis of the growth/change patterns in a multitude of data
variables at different levels of the case system (Research Question Four). In addition, the
changes in the various levels of the tourism system are linked to individuals or events that
contributed to the pattern of change, and the preconditions which allowed or encouraged this
change. The patterns at the different levels are also examined to determine whether the
Sunshine Coast destination and its three regions mirror the aggregate state and national
trends. This determines the effect of external influences on the destination and its regions.
Chapter Six concludes the dissertation and presents the main findings of the study and their
potential impact on future planning for tourism. This will determine whether the knowledge
of the processes of change in a tourism destination can be used predictively to assist
planning and development of a sustainable tourism destination (Research Question Five).

Noreen Breakey Tourism Destination Development
Chapter Two – Theories on the Processes of Change 29
Chapter 2 Theories on the Processes of Change -
Development of a Model
2.1 Overview of Chapter Two
It is accepted that “tourism itself changes and evolves over time” (Butler, 1993, p31). In
setting out the general problem Chapter One indicates the need for better change theories for
understanding tourism destination development. Change theories have developed in a range
of disciplines, including biology, business, and mathematics. The past application of such
change theories to the development of tourism destinations varies. Chapter Two reviews the
four major process of change theories, their application to tourism destinations, and the
relevant concepts in each theory that can assist in increasing understanding of destination
development.
This chapter is divided into seven sections (Figure 2.1). The first section considers how the
approaches to the development of tourism have changed over time and is based on Jafari’s
(1990) four platforms of advocacy, cautionary, adaptancy, and knowledge-based. This
expands on the summary provided on tourism impacts in Chapter One.
The second section introduces and justifies the application of transdisciplinary concepts in
approaching and understanding tourism development. General frameworks applied to
tourism destination development will be considered to illustrate the need for a holistic
approach. To achieve this, systems theory will be introduced as the framework for
understanding the open, complex, and dynamic tourism system.
The third section reviews the literature associated with the main change theory that has been
widely applied to tourism destinations, namely the Tourism Area Cycle of Evolution
(Butler, 1980). This tourism destination life-cycle model was an application of the
marketing concept of the product life-cycle to tourism destinations. While the life-cycle
concept has served as a useful descriptive model of the overall change within a destination,
the causes and complexity of destination change requires a more sophisticated framework.

Noreen Breakey Tourism Destination Development
Chapter Two – Theories on the Processes of Change 30
To establish such a framework other ways of understanding the processes of change are
explored.
Figure 2.1 Structure of Chapter Two. Outlining the flow of the chapter and the linkages between the seven sections.
The fourth section of this chapter incorporates three theories on the processes of change:
Species Evolution, a biological metaphor; Punctuated Equilibrium, a biological metaphor
reapplied in business studies; and Chaos Theory, a physical and mathematical metaphor that
has been widely applied to complex systems. The application of each of these theories to
tourism destination development will be examined. Punctuated Equilibrium and Chaos
Theory are two theories that further continue the application of transdisciplinary concepts,
as they are both considered part of the larger transdisciplinary General Theory of Evolution.
This theory is a nonlinear approach that is considered appropriate for the study of open
systems (Laszlo, 1991).
Section five will involve an evaluation of the four candidate process of change theories:
Life-cycle, Species Evolution, Punctuated Equilibrium, and Chaos Theory. This
examination considers the ability of each theory to explain the type of change which occurs
in tourism destinations. It separates out the concepts from each theory that are particularly
2.0 Overview of the Chapter
2.1 Approaches to Destination Change -
Tourism Impacts
2.2 Tourism as a System
2.3 Classical Change Theory - Life-Cycle Theory
2.5 Evaluation of the Change Theories
2.4 Alternative Candidate Theories
2.6 Generation of a Theory - the
Multi-Trajectory Model* Species Evolution* Punctuated Equilibrium* Chaos Theory
2.7 Redefing the Research Aim and Questions
General Transdisciplinary
Theories
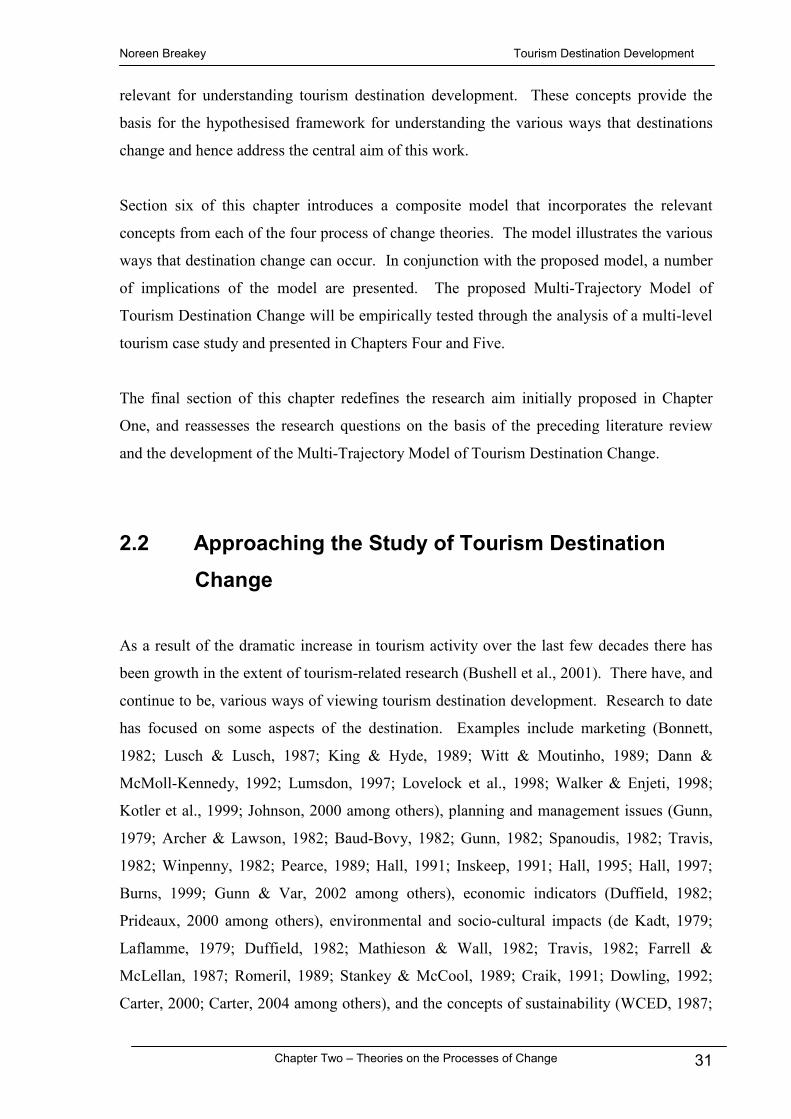
Noreen Breakey Tourism Destination Development
Chapter Two – Theories on the Processes of Change 31
relevant for understanding tourism destination development. These concepts provide the
basis for the hypothesised framework for understanding the various ways that destinations
change and hence address the central aim of this work.
Section six of this chapter introduces a composite model that incorporates the relevant
concepts from each of the four process of change theories. The model illustrates the various
ways that destination change can occur. In conjunction with the proposed model, a number
of implications of the model are presented. The proposed Multi-Trajectory Model of
Tourism Destination Change will be empirically tested through the analysis of a multi-level
tourism case study and presented in Chapters Four and Five.
The final section of this chapter redefines the research aim initially proposed in Chapter
One, and reassesses the research questions on the basis of the preceding literature review
and the development of the Multi-Trajectory Model of Tourism Destination Change.
2.2 Approaching the Study of Tourism Destination
Change
As a result of the dramatic increase in tourism activity over the last few decades there has
been growth in the extent of tourism-related research (Bushell et al., 2001). There have, and
continue to be, various ways of viewing tourism destination development. Research to date
has focused on some aspects of the destination. Examples include marketing (Bonnett,
1982; Lusch & Lusch, 1987; King & Hyde, 1989; Witt & Moutinho, 1989; Dann &
McMoll-Kennedy, 1992; Lumsdon, 1997; Lovelock et al., 1998; Walker & Enjeti, 1998;
Kotler et al., 1999; Johnson, 2000 among others), planning and management issues (Gunn,
1979; Archer & Lawson, 1982; Baud-Bovy, 1982; Gunn, 1982; Spanoudis, 1982; Travis,
1982; Winpenny, 1982; Pearce, 1989; Hall, 1991; Inskeep, 1991; Hall, 1995; Hall, 1997;
Burns, 1999; Gunn & Var, 2002 among others), economic indicators (Duffield, 1982;
Prideaux, 2000 among others), environmental and socio-cultural impacts (de Kadt, 1979;
Laflamme, 1979; Duffield, 1982; Mathieson & Wall, 1982; Travis, 1982; Farrell &
McLellan, 1987; Romeril, 1989; Stankey & McCool, 1989; Craik, 1991; Dowling, 1992;
Carter, 2000; Carter, 2004 among others), and the concepts of sustainability (WCED, 1987;

Noreen Breakey Tourism Destination Development
Chapter Two – Theories on the Processes of Change 32
Boers & Bosch, 1994; Clarke, 1997; Manning & Dougherty, 1999; Hardy et al., 2002
among others), and carrying capacity (Wagar, 1964; Shelby & Heberlein, 1986; Stankey &
McCool, 1989; Butler, 1997; Williams & Gill, 1999 among others).
Each of these research foci has provided the basis for obtaining relevant information on
aspects of tourism destination development. However, the use of data and findings from
domain-specific research is limited to the particular area and issue investigated, as
highlighted by Oh, Kim and Shin (2004) in their recent review of hospitality and tourism
marketing research. Such a mono-disciplinary approach is not appropriate for understanding
the overall change, as tourism is a complex multi-element phenomenon. The outcome is
that a transdisciplinary approach is required (Carlsen, 1999).
2.2.1 Changing Approaches to Tourism Destination Development
As tourism has become progressively more widespread, attitudes towards tourism and its
impacts have changed (Foley et al., 1997). Traditionally, particularly in Western cultures,
the environment was perceived as resources to be used for the satisfaction of humans.
Impacts, if considered, were seen as ‘externalities’ and did not warrant a corresponding
change in behaviour (Manning & Dougherty, 1999).
The limited tourism experience associated with the relatively newness of the activity,
combined with the dramatic growth since WWII, resulted in numerous examples of
unplanned, haphazard growth, with apparent irreversible damage to the natural environment
and local cultures (Savignac, 1991). Only recently have the limits of the environments in
which tourism activity occurs been acknowledged. Usually such environments are
identified only when their limits have been violated (Manning & Dougherty, 1999).
Tourism impact analysis has, since the 1980s, incorporated economic, social, cultural, and
environmental issues. The reporting of impacts revolved around the investigation of
existing tourism enterprises and destinations, and was often descriptive in nature. The
increasing body of knowledge was centred on the resultant impacts of tourism, both positive
and negative. In 1995 Leiper (1995 p.160), building in his seminal work (1979), stated that
more had been “written on impacts, by a greater number of commentators and researchers,
than on any other topic about tourism”.

Noreen Breakey Tourism Destination Development
Chapter Two – Theories on the Processes of Change 33
In 1990, the changing views on tourism were reviewed by Jafari (1990), who proposed four
platforms: advocacy, cautionary, adaptancy, and knowledge-based (Figure 2.2). The
following discussion describes the development of each of these platforms, and the context
in which they developed and continue to be applied.
Figure 2.2 The Changing Views on the Impacts of Tourism Development.
Representing Jafari’s four platforms of Advocacy, Cautionary, Adaptancy and Knowledge-Base (Jafari, 1990), and the accompanying development, research and tourism/environment positions.
2.2.2 Development of the Advocacy Platform
During the early tourism boom of the mid-1950s, the focus was on the positive impacts of
tourism activity. This included the twin-fold benefits of tourism on the economic and
sociocultural aspects of a country’s development (Spanoudis, 1982). The emphasis was
primarily on the positive economic impacts to a country from tourism, with the combined
direct and indirect benefits stimulating the economy. A second positive aspect of tourism
activity was considered to be ‘socio-cultural cross-fertilisation’, with tourism providing
contact between cultures that would increase understanding, educate both tourists and hosts,
spread ideas, increase modernisation, and encourage local arts and craft (Spanoudis, 1982).
Retrospectively, this perspective has been described as the ‘advocacy platform’ by Jafari
(1990), as tourism was perceived as causing minimal interference and the relationship
between tourism and the environment was deemed coexistent. This perspective was even
seen to be so by conservation advocates.
Approaches
Tourism
* Carrying Capacity* Environmental
monitoring
Advocacy Platform
2000
* Appropriate
Adaptancy Platform
Knowledge-base PlatformRelationships between
positive & negativeimpacts
System
Sustainable * Trade-off tourism
Jafari (1990)
EarlyTourism
Boom
Focus onpositive benefits
* economic* sociocultural
Unplanned developmentIncreasing tourism impacts
* ROS* LAC*EIA
Natural resourcemanagement
Cautionary Platform
1970
* environmental* sociccultural
Continued to drive
Research on
Tour
ism
Dev
elop
men
t
* environmental* sociocultural
Interdependencybetweentourism
1980 19901950 1960
development
Pers
pect
ives
on
impacts* economic
and theenvironment
Low impact* Green* Soft* Alternative
tourism* Ecotourism* Responsible* Sustainable

Noreen Breakey Tourism Destination Development
Chapter Two – Theories on the Processes of Change 34
In the late 1940s, the Queensland Government established the Queensland Tourist
Development Board (QTDB) to determine the potential of Queensland’s tourism resources
(Barr, 1990b). Their 1947 report was titled ‘The Tourist Resources of Queensland and the
Requirements for their Development’, and outlined recommendations for the development
of the State’s tourist resources (QTDB, 1947). This report was ahead of its time,
recognising the limits to development, and providing a detailed analysis of the situation at
that time. The report also reflected the conventional thinking, with the focus mainly on
economic development and support for tourism. The report identified 20 key areas suitable
for the establishment of tourism, and provided for each, a description of existing access and
facilities, along with suggestions for their development (QTDB, 1947). In the report, the
tourist industry was defined as “an industry based upon tourist traffic, of the greatest
economic and social importance, and similar to other national industries” (QTDB, 1947).
The focus can therefore be seen to have been on development.
Such tourism development plans were generated throughout the world over the following
thirty years. In 1978 the World Tourism Organisation (WTO) conducted an inventory of
national and regional tourism development plans (WTO, 1978). Of the forty-three National
Tourism Administrations (NTAs) that responded to the questionnaire, twenty-nine had a
national tourism development plan in place, with a further eight preparing such a plan. The
majority of development plans were integrated into the wider national economic and social
plans, with only six countries focussing on a tourism specific development plan. All the
national plans aimed to develop international tourism, with the majority also seeking to
increase domestic travel. The priorities of the majority of plans centred around tourism
development, planning and developing the main tourist areas, building new accommodation,
increasing the diversity of product, and marketing/promotion (WTO, 1978).
At the regional level, six countries of the forty-three NTAs who responded had one or more
regional tourism development plans in place, including Australia with it’s plan for the
Northern Territory. A further sixteen NTAs had one or more regional plans in preparation
(WTO, 1978).
Of particular relevance to the tourism case area analysed in this work were the two ‘Boeing
Reports’ of 1981 and 1986 (QTTC & Boeing, 1981; Boeing, 1986). These reports
highlighted the potential for tourism within Queensland, and the corresponding need for

Noreen Breakey Tourism Destination Development
Chapter Two – Theories on the Processes of Change 35
development and marketing to achieve this (QTTC & Boeing, 1981). The first Boeing
Report provided forecasts for the expected level of domestic and international visitors to
Queensland for 1983 and 1985 for two scenarios, a ‘Natural’ or ‘Baseline’ level of annual
growth, and an ‘Accelerated’ level that could occur if an ‘aggressive tourism posture’ was
adopted (QTTC & Boeing, 1981).
The aim of the follow-up Boeing report was to determine the requirements for continued
tourism growth in Queensland and the economic benefits of such development (Boeing,
1986). This second report was also more comprehensive, including detailed predictions of
global and Australian economic and travel trends. It also predicted tourism growth for 1990,
1995, and 2000 for both ‘Conservative Development’ and ‘Potential Development’ forecasts
for a number of variables at the national and/or state levels (Boeing, 1986).
These reports and plans are examples of the pro-development focus of tourism from WWII
through to the 1980s. The focus was on either developing or encouraging the development
of access, accommodation and related services and facilities to cater for the ever-growing
numbers of tourists. Such development would then increase the benefits received from
tourism activity.
2.2.3 Development of the Cautionary Platform
Although the positive picture of tourism remained in the mid-1960s, other opinions began to
appear (Spanoudis, 1982). The predominant focus on resource usage without concern for the
consequences was progressively questioned as tourist volume and development increased
(Manning & Dougherty, 1999). Through the 1970s the search began for ways to attain a
balance between tourism and the environment (Briassoulis & van der Straaten, 2000).
An indicator of the growing international concern regarding depleting natural resources
generally was the establishment of the Club of Rome and their 1972 report: The Limits to
Growth: A Report for the Club of Rome’s Project on the Predicament of Mankind
(Meadows et al., 1972). This report examined the complex issues of the degradation of the
environment, along with poverty, urban spread, employment insecurity, the alienation of
youth, the loss of traditional values, economic issues, and the loss of faith in institutions
(Meadows et al., 1972).

Noreen Breakey Tourism Destination Development
Chapter Two – Theories on the Processes of Change 36
In the same year, the United Nations Conference of the Human Environment (UNCHE) was
held in Stockholm, entitled ‘Only One Earth’ (United Nations, 1972). In the preparation for
the conference it was recognised that the environment had only recently become a global
public issue (Strong, 1972). The relationship between nature and the activity of humans was
considered to have become increasingly complex (Iglesias, 1972). The UNCHE was the
first global attempt to respond to environmental degradation (US Government, 1972). The
outcomes of this world intergovernment conference on the protection of the environment
drove the related activities of the United Nations through the 1970s and 1980s (United
Nations, 2001).
In recreation areas increasing visitation resulted in the recognition of the problem of impact
among natural resource managers. Clarke and Stankey (1979) proposed the Recreation
Opportunity Spectrum (ROS) as a strategy for managing impact so that the psychological
and experiential needs of the users was met. Combined with carrying capacity, this strategy
developed into the concept of Limits of Acceptable Change (LAC) (Stankey et al., 1985).
This process focused on the desired conditions for recreational setting usage. However, it
was some time before these insights appeared in the tourism literature (see Butler &
Waldbrook, 1991).
Many of the emerging viewpoints regarding tourism impacts were based on an ecological
focus and preservation of cultural identity. Additionally, economic benefits began to be
questioned, with issues raised regarding seasonality and uncertainty (Spanoudis, 1982).
In 1979, ‘Tourism: the good, the bad and the ugly’ was released (Rosenow & Pulsipher,
1979). This review of tourism in America provided an frank account of the positive and
negative aspects of increasing travel and the growing tourism industry, including travel
motivations, economic benefits, the loss of natural and heritage assets, the homogenisation
of mass society, the provision of visitor services in National Parks, the effect of marketing,
and the need for tourism that is appropriate for the area and does not exceed the carrying
capacity of the natural or social environments (Rosenow & Pulsipher, 1979). This book
illustrates the changing attitudes of its time, with the realisation that tourism has both
positive and negative impacts.

Noreen Breakey Tourism Destination Development
Chapter Two – Theories on the Processes of Change 37
By the beginning of the 1980s, the importance of tourism in the international trade arena had
become apparent, along with the recognition that domestic tourism is often even more
significant. This provided a context in which the issue of the impacts of tourism was raised
(Archer & Lawson, 1982). Examples of the negative effects of tourism began to be
described, including economic ‘disbenefits’, and the costs to the environmental and
sociocultural elements (Travis, 1982). In the early 1980s tourism was described by Machlis
and Burch (1983 p.666) as “a paradoxical human activity – a supposedly ‘smokeless
industry’ that produces littered beaches, a cornucopia to local economies that gives rise to
inflation and embittered natives, a profitable enterprise that often requires governmental
subsidy”. Ultimately the relationship between tourism and the environment became a focus
of academic tourism research through the 1980s (Briassoulis & van der Straaten, 2000).
Although it was recognised that there was a need to determine the impacts of tourism there
was very limited data available. In many cases data on the volume of tourists was
unavailable, anecdotal, or unreliable (Coppock, 1982). An additional difficulty with
determining the costs and benefits associated with tourism was the limited number of
variables that lend themselves to measurement (Duffield, 1982). Although economic
aspects were often measurable, environmental and social factors are problematic (Coppock,
1982; Duffield, 1982).
Recognition of the negative physical and social impacts caused by tourism was reviewed in
detail by Mathieson and Wall (1982), and has continued to be discussed. Early research
questioned the balance between the positive economic benefits and the realisation of the
negative social and environmental impacts (Cohen, 1982). This resulted in specific studies
on the impact of tourism. Much of this research focus has been on the impacts of tourism on
the environment (Farrell & McLellan, 1987; Romeril, 1989; Boers & Bosch, 1994;
Kearsley, 1997; Briassoulis, 2000), particularly in recreation settings (Shelby & Heberlein,
1986; Buckley & Pannell, 1990). Social and cultural impacts have also been reviewed in a
variety of contexts (de Kadt, 1979; Pigram, 1987; Craik, 1991; Beaumont, 1997; Page &
Lawton, 1997; Louw & Smart, 1998; Carter, 2000; Carter & Beeton, 2004). In addition,
many books discuss social, environmental and economic impacts (Gunn, 1979; Pearce,
1989; Hall, 1991, 1995; Leiper, 1995; Mercer, 1995; Hall, 1997; Tisdell & Roy, 1998;
Newsome et al., 2002; Mason, 2003).

Noreen Breakey Tourism Destination Development
Chapter Two – Theories on the Processes of Change 38
According to Duffield (1982), existing studies of physical impacts often highlighted the
negative effects of tourism, while studies of the economic impacts focused mainly on the
benefits of such activity. Overall the social impact of tourism was considered largely under-
researched (Duffield, 1982). A review of over 100 research papers on the impacts of
tourism by Travis (1982) confirmed and challenged Duffield (1982). The majority of
studies reviewed by Travis (1982) focused on the benefits, including both the economic and
environmental realms. Secondary consideration was given to the costs of the sociocultural
and political impacts of tourism. Another finding of Travis’s (1982) review was the
extensive list of negative environmental impacts, with only a short list of environmental
benefits. Additionally, the extent of the cultural impacts from tourism appeared to be
dependent on the critical scale, number, status, and attitude of the visitors.
Looking back it can be seen that acknowledgment of the negative impacts caused by tourism
resulted in a significant shift in focus (Foley et al., 1997). A conclusion reached by Travis
(Travis, 1982) in the early 1980s was that tourism, as the cause of negative impacts, needed
to take responsibility through proactive management, ensuring net benefits for the host
community and environment, as well as for the tourists. Coping with the negative
environmental and social costs of tourism required additional effort and resources, and as
this was often considered to be the responsibility of the government, their view of
encouraging tourism for economic benefits also began to shift (Spanoudis, 1982). This new
attitude which challenged the existing pro-tourism development approach was termed the
‘cautionary platform’ by Jafari (1990).
However there was not a universal shift in attitude. Those supporting tourism development
considered conservation to be a threat to the viability of tourism businesses and future
tourism growth, while the conservationists perceived tourism growth and the tourists
themselves to be threats to the natural landscapes and the wildlife within (Coppock, 1982).
This was made more complex by the conservation movement often advocating tourism as
the alternative industry to natural resource exploiting industries, such as mining of Fraser
Island and Cooloola, and logging in the Wet Tropics (University of Queensland, 1971;
Sinclair, 1994; Doyle, 2000; Driml, 2000; Hardy & Beeton, 2001). The range of such
examples is huge and international. In many ways local tourism initially benefits from the
publicity of such controversies (Hundloe et al., 1988). It is subsequent success that is
problematic. Despite these varying perspectives, both conservationists and tourism

Noreen Breakey Tourism Destination Development
Chapter Two – Theories on the Processes of Change 39
developers were bonded by the understanding that tourists may destroy the appeal of the
destination (Coppock, 1982).
Almost by definition, tourist destinations have natural and cultural attractions that are likely
to be sensitive to change, whether it be ecological, social or economic (Duffield, 1982). In
fact the physical environments that are susceptible to change are usually the ones most
attractive to tourists. This is also true for the social realm, with tourists attracted to the less
developed societies, which are vulnerable to change (Duffield, 1982). The conundrum is
that tourism activity with negative impacts could ultimately destroy the features that had
attracted tourists in the beginning, ultimately destroying both tourism and the environment
(Spanoudis, 1982).
Duffield (1982) recognised that within tourism there exists “a basic economic and social
contradiction: the very phenomenon which has been adopted as a tool for regional
development, as an employment and income generator, often depends on the maintenance of
the social, cultural and environmental characteristics of the society it is meant to change”
(Duffield, 1982 p.254).
By 1982 it was accepted that tourism caused environmental impacts and the question had
become ‘What impact is acceptable?’. However, it was realised that this was a ‘highly
emotive topic’ (Coppock, 1982). In an attempt to determine a threshold, tourism began to
draw from environmental management. This area of specialisation developed within the
ecology, natural resources management, and planning disciplines. It aims to provide
knowledge which can be used to manage human activity in natural areas, such as in National
Parks, more effectively (Manning & Dougherty, 1999). Key concepts within environmental
management include Environmental Impact Assessment (EIA) (US Government, 1969;
Thomas, 1998), LAC (Stankey et al., 1985; Nilsen & Taylor, 1997; Newsome et al., 2002),
environmental monitoring (Meijers, 1986; Erickson & King, 1999; Manning & Dougherty,
1999; Newsome et al., 2002), and carrying capacity (Wagar, 1964; Brown et al., 1978;
Shelby & Heberlein, 1986; Romeril, 1989; Stankey & McCool, 1989).
Environmental Impact Assessments (EIAs) aim to predict the effects of particular activities
or developments, to determine what, if any, development should proceed and what
amendments may be required. The EIA process became a requirement for major projects in

Noreen Breakey Tourism Destination Development
Chapter Two – Theories on the Processes of Change 40
numerous countries after the introduction of the National Environmental Policy Act (NEPA)
in the US in 1969 (Glasson et al., 1999). By the early 1970s EIA procedures were starting
to be introduced in various ways across the states of Australia. In 1973, the Australian
Environment Council reviewed the opportunities to establish EIA procedures at the national
level, ultimately resulting in the passing of the Commonwealth Environment Protection
(Impact of Proposals) Act the following year (Thomas, 1998). This Act required the
preparation of Environmental Impact Statements (EISs) for proposals which could have
significant environmental effects, and are federally funded or approved (Thomas, 1998). In
mid 2000 the Environment Protection and Biodiversity Conservation Act 1999 came into
force. This Act includes ‘Assessment by Environmental Impact Statement’ as one of the
approaches in the approval process (Department of Environment and Heritage, 2004). In
Queensland the Integrated Planning Act 1997 forms the planning and development
legislation for the State. Its Integrated Development Assessment System streamlined the
previous multitude of approval processes. Under the Act an impact assessment involves a
broad assessment of the environmental effects of the proposal (Department of Local
Government and Planning, 2004). However, in some places worldwide, the EIA process
became a simple review, without consideration of alternative options, off-site impacts, or
social aspects. Additionally the results of the EIAs have not always been utilised in the
decision making process (Manning & Dougherty, 1999).
The concept of the LAC was developed by Forest Service researchers in the US in the mid
1980s to respond to the environmental impacts of the increasing recreational use of
wilderness areas (Stankey et al., 1985). This planning framework is a flexible process
involving nine interrelated steps which establish a set of resource and social conditions and
the actions required to achieve these standards (Stankey et al., 1985). The LAC process has
been applied to wilderness areas, scenic rivers, historic sites and tourism development areas
(Nilsen & Taylor, 1997). However there has been some hesitancy in setting standards in the
application of the LAC process. This the framework also requires monitoring and
evaluation, which can be used to redefine the standards as the information base increases
(Newsome et al., 2002).
The concept of environmental monitoring began to appear progressively in the literature
after the United Nations Conference on the Human Environment at Stockholm of 1972
(Meijers, 1986). Environmental monitoring is the process of repetitively recording elements

Noreen Breakey Tourism Destination Development
Chapter Two – Theories on the Processes of Change 41
of the environment according to a predefined schedule and utilising comparable
methodologies (Meijers, 1986). Such a process can be continuous or periodic, and often
compares the predicted effects with the actual impacts to recommend changes where
appropriate (Erickson & King, 1999; Manning & Dougherty, 1999). Relevant to tourism is
the application of monitoring to the effects of visitors in natural areas, such as National
Parks. This is considered vital to protect the environment and ensure quality visitor
experiences are maintained (Newsome et al., 2002).
Carrying capacity is an estimate of the biophysical limits of natural resources, with usage
conducted at or below the estimate (Manning & Dougherty, 1999). The concept of carrying
capacity was initially used in animal husbandry, wildlife management and range
management (Shelby & Heberlein, 1986). It was converted from animals to people by the
US forest recreation planners, taking on an additional psychological dimension (Wagar,
1964; Brown et al., 1978; Stankey & McCool, 1989).
The application of the carrying capacity concept to development is “the degree to which an
area can be used for economic activity without degrading the environment there or the
interactive harmony between sectors of the economy, groups of people, and individuals”
(Manning & Dougherty, 1999 p.4). Ultimately, every region where economic activity
occurs has limits beyond which it can be dangerous to step. These limits define the carrying
capacity (Manning & Dougherty, 1999).
The theory of a threshold level is appealing as it is easy to conceptualise. However, in
reality it is problematic to operationalise (Romeril, 1989). It appears easier to determine
numerical limits for animals as a biophysical resource is involved. The application of
carrying capacity to humans is not as simple, because psychological factors are also
involved. In addition there can be different capacities for the various types of impact:
ecological, social, physical, and facility (Shelby & Heberlein, 1986). Ultimately there are
many definitions of carrying capacity and all these estimates involve value judgements.
Such judgements are inherently likely to generate conflict (Shelby & Heberlein, 1986).
Within tourism, carrying capacity is considered to be the level of tourism impact (physical,
biological and/or social) an area can absorb before irreversible damage occurs. Typically
the aim is to measure carrying capacity against the total number of tourists using the

Noreen Breakey Tourism Destination Development
Chapter Two – Theories on the Processes of Change 42
particular area to determine if a predetermined threshold has been reached or exceeded
(Steele, 1995). According to Butler (1997), in many destinations the carrying capacity has
already been exceeded, irrespective of how ‘carrying capacity’ is defined.
One reason why the tourism carrying capacity is difficult to define is that carrying capacity
can differ across various destination elements, such as facilities and infrastructure, physical
space, natural resources, visitor satisfaction, and visitor numbers (Hovinen, 1982). Capacity
levels are affected by the types of tourists and the destination area itself (Mathieson & Wall,
1982). The tourism carrying capacity can also be considered from the perspective of the
host community, or the tourists themselves (O'Reilly, 1986). Additionally each tourism and
environment combination differs, resulting in destination specific carrying capacity
(Romeril, 1989). Other difficulties in defining tourism carrying capacity include the
multiple attributes of the environment which have their own thresholds; the environmental
response to increased usage may be gradual or dramatic; environmental sensitivity relates to
the values of the users; and the type of use can change the level and type of impact
(Manning & Dougherty, 1999).
In addition to being difficult to define, the tourism carrying capacity can change over time as
the destination progresses through it’s life-cycle (Hovinen, 1982; Martin & Uysal, 1990),
and is affected by underlying system changes such as seasonal variations, climatic
combinations, and the level of tourism demand (Collins, 1999).
As a single numerical carrying capacity for an area is seldom appropriate (Manning &
Dougherty, 1999), and defining an actual carrying capacity for an area is difficult, it is rarely
undertaken (Collins, 1999). However, tourist saturation requires measures of control to
ensure that the volume of visitation occurs within the limits of the area (Gunn & Var, 2002).
The recognition of the issues of sustainable development, tourism impact, limits of
acceptable change, and carrying capacity, through the 1980s, provided growing support for
the ‘cautionary’ approach to tourism. At the end of the 1980s, it was stated that “few, if any,
would deny that tourism development …. can be a force causing much irreversible damage
to the environment” (Romeril, 1989 p.204). Despite this, the ‘advocacy’ approach
continued to drive much of the development, with the focus on the positive benefits of
tourism.

Noreen Breakey Tourism Destination Development
Chapter Two – Theories on the Processes of Change 43
2.2.4 Development of the Adaptancy Platform
The debates between supporters of the advocacy and cautionary perspectives were primarily
focused on the impacts of tourism. This lead to the realisation that certain types of tourism
activity result in fewer negative impacts. There was considered to be a need for alternate
forms of tourism development that correlate with the resources available and the
opportunities provided (Pearce, 1989). This provided the basis for a third approach,
characterised initially as the ‘adaptancy platform’ by Jafari (1990). In so doing Jafari
articulated much of the subsequent tourism debate and research direction. Ultimately, this
approach generated a range of ‘low impact types of tourism’, with labels including
alternative, green, soft, sustainable, responsible, appropriate, as well as ecotourism.
An underlying reason for the change in perspective was the growing realisation that the level
of environmental quality is a vital asset for tourism. Ultimately tourism and the
environment are intrinsically interdependent (Boers & Bosch, 1994). In particular, tourism,
more than other economic sectors, is dependant upon and sensitive to the natural and human
qualities of the environment (Manning & Dougherty, 1999). Some argue the long-term
viability of tourism activity is reliant on the maintenance of the natural and cultural
environments (Singh & Singh, 1999). The ‘adaptancy platform’ therefore emphasised this
‘mutual dependence’ between the environment and tourism (Foley et al., 1997). It is
recognised that this is clearly a simplification as some totally artificial environments, such as
Las Vegas, are successful destinations. However, the aims of tourism and nature
conservation are different. Tourism is intrinsically attraction driven and hence specific
natural attractions are overemphasised for tourism.
The trend of growing environmental awareness in tourism reflected the wider environmental
trend within society. Public interest regarding the state of the environment rapidly increased
from the 1980s (Boers & Bosch, 1994), evident by such detailed research as the recent State
of the Environment assessment (Australian State of the Environment Committee, 2001).
Environmental management is no longer just the focus of a few enthusiasts, it is now
supported by tourism developers, planners, and policymakers. In addition, tourists have
become aware of the environmental and social impacts of tourism, and are making their
views known (Gunn & Var, 2002).

Noreen Breakey Tourism Destination Development
Chapter Two – Theories on the Processes of Change 44
2.2.5 Development of the Knowledge-Base Platform
The increasing discourse on tourism development and it’s impacts, illustrated by the rise of
the advocacy, cautionary and adaptancy platforms, resulted in changes in general thinking
regarding tourism (Jafari, 1990). Irrespective of the viewpoint, there was consensus that
tourism is a very large and enduring global industry, that focus needs to be on the
relationship between the positive and negative impacts of tourism activity, and finally that
tourism needs to be studied as a whole (Jafari, 1990).
Thinking regarding the relationship between impacts follows recognition that a significant
problem is the cumulative effects of impacts. When development occurs as a number of
small increases gradually over time EIAs are rarely undertaken. This unplanned cumulative
development can have significant impact, resulting in ‘disaster by creeping instalments’
(Manning & Dougherty, 1999). Although it can be an individual tourism development that
causes significant environmental impacts, it is often the ‘collective development of mass
tourism’ that causes an aggregate impact (Gunn & Var, 2002).
The changing views on tourism development and the growing understanding of the resultant
impacts of tourism activity affected the approaches and development of tourism planning,
including the incorporation of the concept of sustainable tourism. Applying the principles of
sustainable development, the knowledge-based approach aims to achieve economic,
environmental, and sociocultural sustainability. Such an aim requires consideration of the
relationship between the positive and negative impacts of tourism and the trade-off between
various impacts (Section 1.2.3).
Also illustrating this knowledge-base platform is the ongoing application of systems theory
to tourism. A systems approach aims to increase understanding of the structure and function
of the tourism system, and it’s role in the wider social and economic systems. The
application of this approach will be discussed in Section 2.3.2.3.
2.2.6 The Ongoing Debate - Tourism Impacts
Getz (1986) observed that predictions regarding the magnitude of the impact or the
subsequent repercussions were beyond the scope of the models of the 1980s. The outcome

Noreen Breakey Tourism Destination Development
Chapter Two – Theories on the Processes of Change 45
of subsequent research on tourism impacts has been the generation of strategies for
eliminating or minimising negative impacts. Suggested ‘solutions’ for minimising the
impact of tourism on the environment can be broken into four categories; curb tourist
numbers, change tourist type, change the resource for resistance, and educate all concerned
(Butler, 1991). As a result better planning now exists to lessen the negative impacts of
tourism activity (Gunn & Var, 2002). In particular, comprehensive impact models are used
to identify possible impacts for an area.
Although the four platforms (advocacy, cautionary, adaptancy, and knowledge-base) were
developed at different times they were not a sequential evolution (Jafari, 1990). Instead they
represent different viewpoints and their supporters continue to advocate the advantages of
their approach to tourism (Figure 2.2). There are currently advocacy supporters who
promote the positive impacts that tourism has, especially as traditional industries decline and
alternative resource usage can be significantly more exploitative. Additionally, the
cautionary view is maintained by many involved in conservation, natural resource
management and those concerned about the dramatic changes to traditional societies
induced by tourism activity. Aiming to balance the impacts are supporters of the adaptancy
platform. This approach of maximising the positive benefits and minimising the negative
impacts of tourism activity has been incorporated into the wider tourism planning arena.
The knowledge-base platform considers tourism as a whole, and is evidenced by the
increasing use of systems approaches to understanding tourism development.
To date research has not provided an understanding of the complexity of destination change
or a comprehensive set of guidelines which can be applied to a potential or expanding
tourism destination to ensure a sustainable form of tourism results. Although the
knowledge-base platform recognised that tourism needs to be viewed as a whole, tourism is
an exceeding complex system that is embedded in the even more complex economic and
social systems. In addition tourism has complex supply chain linkages to source markets
and is both local and global in character. Consequently it is a candidate for a systems
approach.

Noreen Breakey Tourism Destination Development
Chapter Two – Theories on the Processes of Change 46
2.3 Tourism Systems - Varying Perspectives
An approach that incorporates all internal and external influencing factors is required to
understand the processes of change within a tourism destination. The approach selected for
this study is Systems Theory. Application of this approach defines the tourism destination
as a system of interrelated parts, operating within the wider systems of the national and
international societies and their economies. Additionally, the application of Systems Theory
in this study provides a basis for determining which of the available process of change
theories discussed in this chapter are applicable to understanding the development of
tourism destinations.
2.3.1 Transdisciplinary Theories and Tourism
The initial development of transdisciplinary approaches expanded into and was formalised
as theories such as the General Systems Theory (von Bertalanffy, 1968) and the General
Theory of Evolution (Csanyi, 1989; Laszlo, 1991). Such transdisciplinary concepts are
significant for the study of tourism. In contrast to the tradition ‘science of parts’, these
approaches can be considered the ‘science of the integration of parts’ (Abel, 1998, 2000).
Firstly, as tourism is an open, complex, and dynamic system a holistic view is required to
understand the destination change. Secondly, tourism is a relatively new field of study
without established methodologies, theories, models, or methods (Leiper, 1981). This has
resulted in the multidiscipline study of tourism, and caused the ‘borrowing’ nature of
tourism research, which incorporates methodologies, theories, models, and methods from
various disciplines (Cohen, 1979; Bodewes, 1981; Jafari & Richie, 1981; Leiper, 1981;
Jafari, 1990; Leiper, 1990). The primary advantage of the borrowing approach is that the
main theoretical and methodological work has been done, although this is coupled with the
drawback that the perspective may not suit the context (McKelvey & Aldrich, 1983). The
positive opportunity for tourism research is the potential to ‘borrow’ a broad approach that
can incorporate all the component parts that are often viewed in isolation.
Given that the focus of this study is to further understand the development of tourism
destinations, general theories on the ways in which complex systems evolve are most

Noreen Breakey Tourism Destination Development
Chapter Two – Theories on the Processes of Change 47
applicable. General Systems Theory (von Bertalanffy, 1968) and its application to this
study is discussed in the next section.
The second transdisciplinary theory, the General Theory of Evolution, resulted from
systemic attempts to understand the way complex non-linear systems function. There was
realisation that “organisms co-construct their world rather than passively adapt to it,
resulting in the conclusion that organisms are inevitably a part of what they observe, not
separate from it” (Midgley, 2000 p.3). Section four of this chapter will consider two of the
relevant theoretical concepts of change within the General Theory of Evolution: Punctuated
Equilibrium and Chaos Theory.
2.3.2 A Systems Approach
The basis of the development of systems thinking was the recognition of the complex
behaviour that is exhibited in natural and human systems (Beishon & Peters, 1972). General
Systems Theory is therefore used to describe the way that individual elements interact and
ultimately affect the function of the whole system of elements.
Current systems theory incorporates numerous concepts and models into a transdisciplinary
‘metalanguage’ (Francois, 1999). This has occurred through an accrual process from
various disciplines over the past century. However, the majority of contributions have been
since 1948, and are continuing at an accelerating pace (Flood & Jackson, 1991b; Francois,
1999). Not only have these contributions been from multiple fields of knowledge, but this
convergence has promoted and assisted unification between disciplines (Kast &
Rosenzweig, 1972).
This was a significant change from the previous ‘mechanistic’ science, which considered
that “everything can be observed and described as if it is a machine – a predictable,
functional, inherently understandable object seen from a discrete distance by an independent
subject” (Midgley, 2000 p.2).

Noreen Breakey Tourism Destination Development
Chapter Two – Theories on the Processes of Change 48
2.3.2.1 Systems Theory - Development and Application
In 1950 Ludwig von Bertalanffy proposed the term ‘General Systems Theory’ to
encompass some of the developing principles of his time that could be applied by various
disciplines and to differing levels (Katz & Kahn, 1978). As a biologist von Bertalanffy
realised it was necessary to reach beyond biology to integrate concepts and evidence from
alternate specialisations to fully understand his research topics (Leiper, 1990). In addition
von Bertalanffy was the first to make the distinction between open and closed systems
(Carlsen, 1999).
Other contributors of this time included Weiss, Rapoport, Boulding, Wiener, von Neumann,
von Forster, Miller and Ashby (Katz & Kahn, 1978; Laszlo, 1991; Francois, 1999).
Although it was initially considered a general abstract theory, by the early 1970’s it had
become recognised as a legitimate interdisciplinary approach despite some limitations and
varying applications (von Bertalanffy, 1972), and resulted in a change in the thinking and
approaches in many of the sciences (Beishon & Peters, 1972).
General Systems Theory recognises that there are limitations in looking at how two
components affect each other by considering them as two individual components linked by a
causal or correlative relationship. The contribution of the theory is to consider how multiple
components act together if exposed to concurrent, multiple influences (Laszlo, 1972). The
focus is therefore on the relationships between the components of the system, in terms of
how the components fit together and how they interact (Ackoff, 1972). The components of
a system and these interconnections between them distinguish the system from other
systems and the external environment. It can therefore be understood that the “system and
component mutually determine each other” (Csanyi, 1989 p.1). It is therefore not possible
to understand complex systems by simply analysing its parts (Cilliers, 1998).
As a result of the increasing methodologies, a range of systems approaches developed
(Figure 2.3), including first-order cybernetics (‘hard’ systems methods), and second-order
cybernetics (‘soft’ systems methods) (Ison et al., 1997). Hard systems methods focus on
mathematical models of feedback, control, and communication, while the soft systems view
incorporates the understanding that the same system can be considered differently by
various stakeholders (Ison et al., 1997). These various system approaches are applicable to
different types of problem contexts (Flood & Jackson, 1991a).

Noreen Breakey Tourism Destination Development
Chapter Two – Theories on the Processes of Change 49
Figure 2.3 Systems Approaches. The numerous systems approaches that comprise modern systems thinking have developed from a diverse range of disciplines through the contributions of many researchers and theorists (Ison et al., 1997).
When investigating a system Katz and Kuhn (1978) perceive the aim to be the identification
of the ‘framework’ and the ‘clockwork’ of the system. The framework is essentially the
structure of the system. Understanding this structure provides the opportunity to improve
the design of the system (Checkland, 1972). Clockwork relates to the system elements,
considering their function and the interaction between them. Investigation of a changing

Noreen Breakey Tourism Destination Development
Chapter Two – Theories on the Processes of Change 50
system builds on this knowledge, describing the changes in the properties of the system that
result from internal or external changes (Katz & Kahn, 1978). As the relations between
elements can become extensive for more complex systems, it is important to understand
these interactions.
When considering the type of change that occurs within a system, the change can be
categorised as either first or second-order change (Ison & Russell, 2000). First-order change
is primarily ‘more of the same’. Inputs and outputs vary creating change, however this
change occurs within the existing and established framework of the system. Second-order
change modifies the whole system. This may lead to some additional inputs and outputs
and/or the loss of others. Importantly, this causes change to occur in a ‘changed’ manner, as
if affects both the outcome as well as the process (Ison & Russell, 2000). The
differentiation between first and second-order change is significant for the next section of
this chapter which presents theories on the processes of change. Species Evolution can be
considered to explain how first-order change can occur, while Punctuated Equilibrium
addresses the restructuring of a system or second-order change.
The constant interactions between the elements within systems results in their dynamism. It
has been proposed that a system cannot operate, or exist without some constraints, and yet
there needs to be some mechanism that allows a system to adapt and redefine the limits.
This results in a system of interrelated elements that can oscillate and settle between
gradually changing and self-defined limits of stability. This outcome implies a level of
organisation of the elements and all their relations within a system. The organisation of a
system is defined by the totality of the relations rather than the nature of the elements
(Rapoport, 1985). The elements themselves, when combined within a certain system lose
some of their original significance and/or characteristics, but they attain alternative ones
(Francois, 1999). As a result, a small difference between similar systems can significantly
affect the role of various elements. This may explain the differences between the
development of tourism in apparently similar environments.
The role of information as a link between elements within a system has received some
attention and is relevant to the understanding of the tourism system. Weiner (1948)
considered the amount of information within a system that is available to the community
verses the amount available to the individual. Additionally he contends that the community

Noreen Breakey Tourism Destination Development
Chapter Two – Theories on the Processes of Change 51
system only extends as far as effective communication occurs. When considering the
relationship between the quantity of organisation and quantity of information, Rapoport
(1985 p.137) determined that the “more organised a structure or a process is, the less
information is required to specify it completely”. Tourism has been considered an
information system (Beeton et al., 1997). Such an approach may assist in defining the
extent of a tourism destination, rather than using geographical limits, as well as generating
understanding of the level and type of organisation that exists within a destination.
Unlike the realm of biology, a social system does not usually possess a physical boundary
and the mutually influencing links are fewer and less perfect (Katz & Kahn, 1978). A social
system is in fact a structuring of events, ensuring that the structure of the system is actually
its function (Allport, 1962). Additionally a social system is based upon humans, with their
attitudes, perceptions, beliefs, motivations, habits, and expectations (Katz & Kahn, 1978).
This is particularly pertinent for the tourism system, which involves consumer preferences
and a range of stakeholder interests, from the tourist operations to regulators and the host
community (Murphy, 1983; Woodley, 1993; Jamal & Getz, 1995; Bramwell & Sharman,
1999; Sautter & Leisen, 1999; Brown et al., 2001; Hardy & Beeton, 2001; Machiavelli,
2001; Jamal et al., 2002).
2.3.2.2 Systems Classifications and Tourism
A significant aspect of a systemic method is the incorporation of complexity, whether it be
organic, cultural, power, or other forms of complexity (Mwaluko & Ryan, 2000). This issue
of complexity within systems was realised in the early stages of systems thinking. In the
mid 1950s Boulding (1956) proposed a hierarchy of systems, presenting eight levels of
complexity:
1. Frameworks of static structure
2. The clockworks of physics and astronomy
3. The control mechanism or cybernetic system
4. The cell or self-maintaining structure
5. The genetic or plant level
6. The animal level with purposive behaviour and self-awareness
7. The human level
8. Social organisation or individuals in roles (Boulding, 1956 pp.14-16).

Noreen Breakey Tourism Destination Development
Chapter Two – Theories on the Processes of Change 52
At that time appropriate theoretical models were established for only the first four levels of
complexity (Boulding, 1956). This partially explains why the early systems research
generally focused on biochemical and biological phenomenon (Katz & Kahn, 1978). As
tourism involves social organisation, it fits into the highest level of system complexity on
this scale.
The complexity of a system can be viewed in terms of its level of detail and dynamism
(Senge, 1990). Detail complexity relates to the number of parts or elements within the
system. Dynamic complexity considers the interaction and feedback between all the parts of
the system and between the system parts and the external environment (Senge, 1990). These
links between elements of a system are an inherent aspect of systems theory. Complex
systems are considered ‘richly joined’ as it is not possible to simply vary one factor at a time
(Ashby, 1956). The interactions are dynamic and interconnected. A tourism destination can
be considered to have a high level of both detail complexity and dynamic complexity. A
destination is comprised of numerous elements, including tourism and related operations,
local people, associations and government bodies, and the tourists. Tourism by nature
necessitates interaction between tourists and other elements of the system. Tourism
operators also interact, as they are affected by similar competitor operations, and yet often
link with complementary operators. Additionally a destination can be directly affected by
changes in the internal and external environments, including business, economic,
government, and social factors. A destination requires continual interaction with the
external environment as tourists, by definition, are away from their normal environment.
This generates a high level of interaction and feedback between the parts of the system, as
well as with the external environment.
Determined by its characteristics, a system will lie along a continuum of system types that
extends from relatively simple systems to those that are highly complex (Flood & Jackson,
1991a). Relevant for this study are the general characteristics of complex systems:
1. Consist of a large number of elements.
2. Many interactions between the elements. This interaction is fairly rich as any element
influences, and is influenced by, quite a few other ones.
3. Elements interact in a dynamic way. As a result, complex systems change over time.
4. The interaction can be non-linear in nature.

Noreen Breakey Tourism Destination Development
Chapter Two – Theories on the Processes of Change 53
5. The interactions normally have a fairly short range; i.e. elements receive information
from their immediate neighbours.
6. There are feedback loops in the interactions. The efforts of any action taken by a
certain element can feed back onto itself.
7. Interaction between elements is loosely organised.
8. The attributes of the elements are not predetermined.
9. Each element in the system is ignorant of the behaviour of the system as a whole; it
responds only to information that is available to its locality.
10. Subsystems are purposeful and generate their own goals.
11. Largely open to the environment.
12. Operate under conditions far from equilibrium.
13. Probabilistic in their behaviour.
14. Have a history.
15. Subject to behavioural influences.
(Flood & Jackson, 1991a p.33; Cilliers, 1995 p.125).
Tourism destinations possess characteristics of a complex system. There are numerous
elements which interact in a loosely organised manner, communicating with and affecting
other elements in the system that are linked to them. This interaction changes over time as
the destination evolves. The destination system itself is affected by its social components
that are subject to behavioural influences, and the system operates under conditions far from
equilibrium, while being affected by the external environment.
In addition to classifying a system as either simple or complex, social systems can also be
typed by the relationships between participants (Flood & Jackson, 1991a). Utilising
industrial relations terminology, the three categories of Unitary, Pluralist and Coercive
(Table 2.1) are determined by the extent of common interests, values, aims, objectives,
methods and decision making of the participants (Flood & Jackson, 1991a). Applying this
classification, tourism destinations can be considered to range from pluralist to coercive
depending on the extent of division between stakeholders.
Noreen Breakey Tourism Destination Development
Chapter Two – Theories on the Processes of Change 54
Table 2.1 Classification of Social System Relationships. Relationships between participants in social systems can be classified into one of three categories. The type of relationship assists in defining the problem context of the system. This can be used to determine which particular systems approach is most appropriate (Flood & Jackson, 1991a p.34).
Unitary Pluralist Coercive Interests Common Basic compatibility Not shared Values and beliefs Highly compatible Divergent In conflict The ends and the means Largely agreed upon Do not agree, but
compromise possible Disagree, and compromise
not possible
Decision making All participate All participate Some coercion to accept decisions
Objectives Agreed objectives Agreed objectives No agreement
Determining the overall type of system (Simple/Complex) and the participants relations
(Unitary/Pluralist/Coercive) defines a problem context for which particular systems
approaches are more appropriate (Flood & Jackson, 1991a). For example a Complex-
Pluralist combination is aligned with either an interactive planning approach or soft systems
methodology. However a Complex-Coercive context is considered beyond the systems
methodologies available (Flood & Jackson, 1991a). This provides a rationale for why the
development and/or management of tourism destinations with apparently unresolvable
differences between stakeholders is so difficult (see for example the study of the Daintree
Region in Far North Queensland, Australia (Hardy & Beeton, 2001)).
The general nature of the core meaning of the term ‘system’ allows systems to vary
extensively in their detail. Jordan (1981) has proposed a method of classification, whereby a
system can be categorised on three ‘bipolar dimensions’ which establish it as one of eight
system types (Figure 2.4). Firstly, if a system changes over time or during analysis the
focus is on the ‘function’ of the dynamic state, rather than the ‘structure’ of the static state.
As the form of tourism within a destination evolves over time the tourism system can be
categorised as functional. Secondly, systems can be categorised as being either ‘purposive’
or simply existing (‘non-purposive’). A tourism system is established in a destination to
achieve various benefits, deeming the system to be purposive. Finally, a system, as a set of
linked elements, may or may not be affected by the change or removal of one part or
connection. If unaffected, the system is considered ‘mechanical’, while felt repercussion
indicate that the system is ‘organismic’. Tourism within a destination can be significantly

Noreen Breakey Tourism Destination Development
Chapter Two – Theories on the Processes of Change 55
affected by a change in one element or a link between elements, which can occur either
within the tourism destination, or in the external environment. The tourism system is
therefore organismic. Of the eight possible combinations, the system created by tourism can
be hypothesised as being functional/purposive/organismic, as illustrated by the shaded area
in Figure 2.4 (Jordan, 1981).
Mechanistic Organismic Structural
Functional
Purposive TOURISM
Non-Purposive
Figure 2.4 System Classifications. Representation of the tourism system within the system classification that is based on the emerging taxonomy proposed by Jordan (1981). Of the eight possible system classification options, the tourism system can be considered to be purposive, functional, and organismic (as shown by the shaded box).
If the tourism system can be considered functional, purposive, and organismic, then the
theory being used to understand it must be appropriate for this type of phenomenon. Each
of the four process of change theories will be considered in light of this requirement in the
fourth section of this chapter.
2.3.2.3 Tourism as a System
Tourism is not just a business, an industry, an activity, a market, an economic resource, an
experience, or a phenomenon to be studied. It has a set of ideas and resultant behaviours
which create the system (Leiper, 1979, 1990, 1995). Tourism can be considered a system as
it exemplifies the core meaning of a system: it is an entity that is perceived as containing
multiple elements that are connected by at least one distinguishable link (Jordan, 1981). As
a result it has been proposed that tourism should be analysed as a system, instead of as a
market or industry (Lumsdon, 1997).
TOURISM

Noreen Breakey Tourism Destination Development
Chapter Two – Theories on the Processes of Change 56
The traditional approach to tourism destination management has been reductionist, that is
the research is centered on a particular variable, such as visitor numbers, or discrete
relationships between variables, such as tourist expenditure and employment (Carlsen,
1999). As tourism is a complex system with numerous interrelated parts, it can be argued
that understanding destination development, and management of the change, requires a
systemic approach.
The general development and application of a systems approach resulted in the identification
of the system created by tourism (Board et al., 1978; Leiper, 1979; Mill & Morrison, 1985).
This way of thinking assists in the clarification of complex phenomenon, such as tourism,
that cannot be studied by other methods from the physical sciences because they are not
closed systems (Leiper, 1990). Applying a systems approach to tourism highlights the
significance of its interrelated parts, whereby a change in one causes reverberations to reach
the others (Mill & Morrison, 1985). This perspective allows one element to better
understand its role and to be proactive, by recognising or predicting influential changes in
alternate sectors of the system.
In their study of the capacity pressures due to increasing self-drive weekend recreation in
Britain and the need for recreation management principles, Board, Brunsden, Morgan,
Morly and Thornes (1978) devised a ‘tourist system’ for the destination under study.
Recognising the complexity of the situation this tourist system “consisted of concentrations
of visitors (nodes) and road networks (links)” (Board et al., 1978 p.46).
Applying a holistic approach, Leiper (1979; 1981; 1990) considered the tourism system to
be composed of three fundamental structural elements. The first, a human element is the
necessary requirement of a tourist. Secondly, three geographical elements are incorporated:
the generating region, the transit route, and the destination. The final element is industrial,
commonly known as the travel and tourism industry. This tourism system then operates
within the wider physical, cultural, social, economic, political and technological
environments (Leiper, 1979, 1981, 1990).
As an alternate approach to understanding the tourism system, Gunn (1979; 1988) and with
Var (2002), consider the combination of supply and demand, defining the ‘tourism
functioning system’. This incorporates the market, as the demand component, and

Noreen Breakey Tourism Destination Development
Chapter Two – Theories on the Processes of Change 57
transportation, attractions, services, and information/promotion as the supply side
components.
Applying a systems approach to tourism planning Murphy (1983) incorporated the four
main components of human activity (patterns and preferences), communication (image and
information), space (urban, rural or coastal), and time (stage of development). An
advantage of such a planning approach is that it is applicable at various levels and the
emphasis can change depending on the circumstances (Murphy, 1983).
In their book titled ‘The Tourism System’ Mill and Morrison (1985; 1992; 1998) take a
marketing orientation and describe the tourism system as the composition of four parts:
market/demand, travel, destination, and marketing. This system, which has evolved over
time, also considers the relations between the parts. For instance, marketing links the
destination and the market as it is used to sell the destination/products to the marketplace
(Mill & Morrison, 1985, 1992, 1998). This systems approach to tourism was considered
appropriate as it highlights the interdependency within tourism; it’s open system nature; the
levels of complexity and variety; competitiveness; friction and disharmony, as well as the
responsiveness of the parts (Mill & Morrison, 1998).
Another approach has been to focus on the human elements. Miller and Ditton (1986)
perceived the tourism system as involving a host culture, a guest culture, and a management
culture, composed of relevant public sector government officials at all levels, and the private
sector business people within the travel and tourism industry.
Not only should tourism be viewed as a system, it is in fact a system whose parts are
systems in their own right. Jafari (1987) proposed that tourism is a ‘megasystem’,
comprising the generating or ordinary system and the receiving or non-ordinary system.
This megasystem also incorporates the sociocultural dimension. The generating system, or
day-to-day ordinary life, provides the impetus to leave and the mobilisation to do so. The
receiving system, or non-ordinary world, restores, uplifts, and fulfils the exhausted physique
(Jafari, 1987).
In that same year Chadwick (1987) proposed the ‘travel and tourism system’. A novel
aspect of this system was the inclusion of ‘objectives’, or reasons for travel. The three part

Noreen Breakey Tourism Destination Development
Chapter Two – Theories on the Processes of Change 58
system incorporated the ‘people’, who require ‘services’, to achieve ‘objectives’. Each part
was then separated into its main type, for instance objectives were business, VFR, other
personal business, and pleasure (Chadwick, 1987).
Poon (1993) described the tourism system as a ‘systemic flow of production’ by the key
industry areas to the consumers. The three industry areas were defined as producers, such as
airlines and hotels; distributors, including travel agents and tour operators; and facilitators,
which provide financial services to the consumers (Poon, 1993). In addition to this general
tourism system Poon (1993) proposed a ‘tourism production system’ which incorporated the
dual functions of service, through production and delivery; and information, through
management and distribution.
Considering tourism as an open system Liu (1994a; 1994b) focused on the three levels of
the internal environment, the operating environment, and the macro environment. The
internal environment comprises policy, planning, marketing, organisational, financial and
human components, while the operating environment incorporates the tourists, suppliers,
competing destinations, and competing industries (Liu, 1994b). In this approach the
variables considered for each component may be useful as triggers, or change factors to
measure (Cooper, 1994).
In addition to his previous work on the holistic tourism system (Leiper, 1979, 1981, 1990),
Leiper also focused on the ‘tourist attraction system’ (Leiper, 1995). This system is in fact a
necessary subsystem of a whole tourism system. An important contribution of this approach
was the incorporation of a marker, or information received by the tourist about the nucleus
(site, sight, event, phenomenon, etc). These three elements, the tourist, the marker and the
nucleus comprise the tourist attraction system (Leiper, 1995).
Also applying a systems approach Van den Bergh (1996), in his study of island impacts,
utilised a model incorporating economic activities (accommodation, tourism services,
construction, local services, agriculture, fisheries), people (demography, housing
development, tourist flows, labour market), terrestrial (land use), and marine (water quality,
ecosystems). Important aspects of this research were the focus on the interrelations between
the variables, and the complexity of the system.

Noreen Breakey Tourism Destination Development
Chapter Two – Theories on the Processes of Change 59
As mentioned previously, the tourism system can be considered an information system.
Tourism is driven by information and the key organising link between the parts is the
provision of information (Beeton et al., 1997). Based on this concept, a model of the
tourism system can be developed (Figure 2.5). This model illustrates the main subsystems
of the tourism system, located geographically in either the ‘tourism origin system’ or the
‘tourism destination system’, and the way that information links each of the subsystems
(Beeton et al., 1997).
Figure 2.5 Tourism as an Information System.
This illustrates how the Tourism Destination System fits into the wider system. Based on the concepts presented by Beeton, Horneman and Hardy (1997).
2.3.2.4 Overview of Tourism as a System
Despite the multiple perspectives applied in describing the ‘tourism system’, it can be
agreed that tourism is an open system, as elements within tourism are affected by
environmental factors. These external influences include human, socio-cultural, economic,
political, legal, technological and physical aspects (Leiper, 1990). The tourism system is
therefore functioning within other systems, which effect its activities, and/or are affected by
its presence (Liu, 1994b). Directly involved businesses may be entirely or partially within
the tourism system, while external influences are from related businesses or environments,
Consumer –Self Planning
System
TravelAgencySystem
Media System(includes Publicity,Guide Books, etc)
System ofFamily and
Friends
TRAVELSYSTEM
GovernmentSystem
(RegionalPromotion)
PackagingSystem
(Wholesalers)
Service/ExperienceProviders
TourismDestinationSystem

Noreen Breakey Tourism Destination Development
Chapter Two – Theories on the Processes of Change 60
both social and biophysical (Lundberg, 1990). Parts of the tourism system always overlap
with other activities, such as travel, recreation, and leisure and yet do not encompass all their
activities (Mill & Morrison, 1985, 1998). Additionally each of these activities are inherent
components of the whole industrial social system (Krippendorf, 1986). It should also be
recognised that the components within the internal tourism system environment establish
“the capability and capacity of the tourism system in adapting to its external environment
and maximising the benefits and minimising the costs arising from external changes” (Liu,
1994b p.21).
Tourism systems are dynamic. During the life of a system, its function may alter or change
completely (Katz & Kahn, 1978). Change within a tourism destination is often focused on
the development of the destination itself, as well as components, such as new experiences
and facilities. In fact this review has shown that the recognition of the complexity of
tourism has increased markedly since the limited view of the 1940s.
An important concept underlying system thinking is that a field or phenomenon is not a
single system but can be a hierarchy of systems (Katz & Kahn, 1978). As a result the
tourism system and its subsystems can be identified and studied (Beeton et al., 1997). Of
the multiple subsystems within the tourism system the focus of this study is the system
operating within a tourism destination (as illustrated by the shaded section of Figure 2.5).
The tourism destination itself is comprised of numerous parts including attractions,
facilities, infrastructure, transportation, and hospitality. Each part is dependant upon the
others for attracting, servicing, and satisfying the tourists (Mill & Morrison, 1985). The
destination is the result of the combined activities of all its component parts. Successful
destination development therefore necessitates all these parts to operate in harmony,
providing a value added integrated system (Liu, 1994b; Machiavelli, 2001).
This dissertation is in many ways a quest for candidate theories to explain tourism change.
The above discussion reveals that tourism is not only a complex system but a complex of
systems. Consequently summative theories will only report easily measured macro change.
The components of tourism change can demonstrate a range of patterns of growth or
contraction that may be masked by the overall model.

Noreen Breakey Tourism Destination Development
Chapter Two – Theories on the Processes of Change 61
The following sections review the range of candidate theories that are available for
explaining how tourism changes over time and explores their applicability. Following the
description and evaluation of these process of change theories, a composite model will be
constructed that allows the various subsystems of tourism to be explored and their
summative effects discussed. The implicit assumption that is emerging from this
dissertation is that for tourism to be effectively studied both its subsystems, and the
manifestation of these subsystems in aggregate, need to be understood in parallel, and the
relationships between each of the subsystems explored. This is a theme that will be returned
to in the concluding chapters of this dissertation.
2.4 Classical Change Theory - The Life-Cycle Model
Life-cycle theory, despite being originally based on a biological analogy, has been widely
applied in other contexts. The notion of the fixed life-cycle of higher living organisms,
embracing the predetermined stages of birth, growth, maturity, and decline is a compelling
one (Tellis & Crawford, 1981; Wollin, 1995). The stages of the life-cycle are illustrated
through the use of the ‘S-shaped’ logistic curve (Figure 2.6). This classical curve was
initially developed to describe human population growth by Pearl (1924) and has since been
applied to a variety of growth situations.
An important concept within life-cycle theory is the premise of a process or journey from
the starting point of birth to the termination point of death (Levinson et al., 1978). This
theory supports the concepts of growth, development, change, and evolution, as part of the
life-cycle process.
In a review of the human life-cycle, Levinson and others (1978) incorporated both the
overall pattern and the endless variation within it. The basic pattern is shaped by many and
various influences. The pattern may be changed or the process sped up, slowed down, or
even stopped. However, the underlying sequence is followed for as long as the process
continues (Levinson et al., 1978).

Noreen Breakey Tourism Destination Development
Chapter Two – Theories on the Processes of Change 62
Figure 2.6 The Growth Curve. The ‘S-shaped’ growth curve (Pearl, 1924) which is often used to illustrate the life-cycle theory, encompassing the stages of birth, growth, and maturity.
Another concept of life-cycle theory is the incorporation of stages, or periods, during the
life-cycle. Each stage is different, although there are commonalities across the stages. Each
stage is considered relatively stable, compared to the total life-cycle. However the stages
are not static, with change still occurring within each. Change is also necessary for the
transition from one stage to the next, as each periods builds on the preceding stage(s),
creating the life-cycle (Levinson et al., 1978).
2.4.1 The Product Life-Cycle
A significant application of life-cycle theory occurred within the marketing arena. The
theory was applied to the ‘product’ component within the business sector during the early
1950s (Rink & Swan, 1979) and by the mid 1960s was a concept know by many, but rarely
used, strategically or tactically (Levitt, 1965). The concept of a ‘Product Life-Cycle’
characterises the stages that a product progresses through, commencing with its introduction
into the marketplace and finishing with its departure from the market (Lusch & Lusch,

Noreen Breakey Tourism Destination Development
Chapter Two – Theories on the Processes of Change 63
1987). The extent of its application is illustrated by the inclusion of the life-cycle theory in
nearly all marketing texts from the late 1970s (Onkvisit & Shaw, 1986). Over time the
theory has been applied within the business world as a framework for product management,
strategic planning, cost and financial aspects, retailing, purchasing, international trade,
manufacturing, and forecasting (Tellis & Crawford, 1981). However it has since been
determined that the product life-cycle model is one of many tools available for planning, and
that managers should be aware that the S-shaped pattern is not inevitable (Lumsdon, 1997).
2.4.1.1 The Stages of the Product Life-Cycle
The basis of the product life-cycle is that a successful product progresses through a series of
predetermined sequential stages (Figure 2.7). These stages are defined by the rate of growth
in the sales of the product. The inflection points in the sales curve indicate the change from
one stage to the next (Porter, 1980). Each stage of the life-cycle is considered to have
particular opportunities, as well as challenges for management (Richardson, 1986).
Figure 2.7 The Product Life-Cycle. The stages of the product life-cycle, as determined by the level of sales achieved (Lusch & Lusch, 1987).

Noreen Breakey Tourism Destination Development
Chapter Two – Theories on the Processes of Change 64
The stages of the product life-cycle are:
1. Introduction - the company is aiming to create awareness within the market of the new
product, to stimulate trial, although a loss is often the expected economic outcome of
this stage.
2. Growth - sales increase rapidly as the product reaches the masses, and satisfied
customers repurchase and spread the word, while the company conducts mass
advertising, recoups the initial costs, and generates significant profits, although
competitors appear and attempt to steal market share and profits.
3. Maturity - during this, the longest stage of the product life-cycle, sales increase to a
steady level where they remain, although profits are reduced due to the high costs of
marketing and the significant number of competitors, who each attempt to differentiate
their product or their promotional offers.
4. Decline - the stage of a product’s life where demand, sales, number of competitors all
decrease, often rapidly (Kurtz & Boone, 1984).
A primary criticism of the product life-cycle is the variation that occurs in the growth
patterns of products. One such variation is the inclusion of multiple periods of growth and
decline, which can follow the initial decline stage (Porter, 1980). This lead to the definition
of a fifth life-cycle stage: ‘Death’ or ‘Revitalisation’. A company can choose to let the
product die, or significantly modify the offering and/or promotion in an attempt to boost
sales.
Applying life-cycle theory to products focuses on the level of sales and the pattern generated
by these sales over time. The sales define the various stages of the product’s life-cycle. The
initial application of life-cycle theory to products lead to a secondary focus on the stages
themselves, with researchers examining aspects related to the product, in addition to sales,
that change during the product’s life.
Porter (1980 pp.159-61), presented the common predictions made by various researchers
about the stages of the product life-cycle, in the categories of products, buyers, marketing,
manufacturing and distribution, research and development, competition, risk, margins and
profit, foreign trade, and the overall strategy appropriate for each stage of the product life-
cycle. Even when these predictions are summarised, the main characteristics of each of the
life-cycle stages highlight the range of changes that can occur over a product’s life. These

Noreen Breakey Tourism Destination Development
Chapter Two – Theories on the Processes of Change 65
predictions contributed significantly to the understanding of the process, and the recognition
that change influences other aspects.
2.4.1.2 Limitations of the Product Life-Cycle Theory
This simple but popular product life-cycle model is not universally accepted. One of the
major concerns is the theory’s oversimplification of the growth process of a product (Wind
& Claycamp, 1976). Although the model has been used extensively there are significant
concerns, which have been categorised into applicability, modelling, validity, and
aggregation (Tellis & Crawford, 1981). These limitations are particularly relevant for this
study as they affect the application of the theory to tourism destination change.
The first limitation of the product life-cycle model is its lack of applicability. The model
can be considered an idealisation that does not describe the development pattern of all
products (Lusch & Lusch, 1987). There are many examples that simply do not follow the
pattern (Dhalla & Yuspeh, 1976). Sales growth does not always pass through each stage of
the life-cycle, with some skipping the slow introductory phase, while other pass directly
from growth to decline, bypassing maturity (Porter, 1980). The product life-cycle curve is
only one option frequently selected from a set of patterns (Midgley, 1981). Rink and Swan
(1979) have indicated that although the classical product life-cycle curve is the most
common, at least nine other product life-cycle patterns exist (Figure 2.8).
Within the product life-cycle theory there is no concept that assists in predicting whether the
model will or will not be applicable for a specific product (Porter, 1980). The product life-
cycle stages have provided the basis for common commercial practice in developing
marketing strategies. However these recommendations lack applicability as they “have
usually been vague, nonoperational, not empirically supported, and conceptually
questionable” (Wind & Claycamp, 1976 p.2). Even when products do follow the product
life-cycle stages there is significant variation in the duration of each stage (Porter, 1980;
Kurtz & Boone, 1984). As a result, it is not always possible to determine the current life-
cycle stage of a product (Porter, 1980).

Noreen Breakey Tourism Destination Development
Chapter Two – Theories on the Processes of Change 66
Figure 2.8 Product Life-Cycle Patterns. The various product life-cycle patterns (Rink & Swan, 1979) illustrate that although the classical S-shaped growth pattern is common, there are a range of alternate patterns generated by the volume of sales of a product over time.
The problem of applicability of the product life-cycle theory relates to the second limitation:
its use as a modelling tool. This process of change theory can be considered a useful
descriptive technique, rather than a predictive tool (Day, 1981). The lack of applicability
and the inherent variation restrict the use of the product life-cycle as a planning tool (Porter,
1980). In reality, the product life-cycle should be considered a ‘dependant’ variable that is
determined by marketing and other activities, rather than an ‘independent’ variable that
management must adjust their marketing to suit (Dhalla & Yuspeh, 1976). The theory has
even been considered a tautology, as sales are used to define the stages, which are then used

Noreen Breakey Tourism Destination Development
Chapter Two – Theories on the Processes of Change 67
to predict sales (Hunt, 1976). The concept can also be self-filling as the cycle is dependant
on the marketing activities, which are in turn based on the ‘known’ life-cycle stage (Dhalla
& Yuspeh, 1976). Wollin (1995) contends that the stages are considered predetermined,
resulting in a fatalistic view of those applying the concept that it is only a matter of time
before decline will occur. As forecasting does not occur until the product is in the cycle,
this model is not a tool for predicting when, or where, the cycle may commence (Day,
1981). Application of the life-cycle theory as a forecasting tool requires understanding and
prediction of the forces driving it (Onkvisit & Shaw, 1986), such as the impact of strategic
intervention.
The third limitation is the validity of the product life-cycle. It does not fulfil the needs of
those describing an open system as it fails to consider independent variables. For example
the product model considers only one set of customer characteristics (Wind, 1981). This is
based on the assumption that the potential users are homogenous. Additionally this theory
does not incorporate the level and type of competition, marketing effort, product innovation,
and other environmental factors over which management has some control (Wind &
Claycamp, 1976; Porter, 1980; Midgley, 1981; Tellis & Crawford, 1981). Furthermore the
product life-cycle theory does not consider the impact from external systems, such as
changes to complimentary products, government regulations and policies, demographic
patterns, and social, economic, and cultural trends (Rink & Swan, 1979; Day, 1981).
Instead of considering independent variables the product life-cycle theory is dependent on
the progression of stages, assuming that sales are basically a function of time (Tellis &
Crawford, 1981).
The fourth limitation is that the life-cycle theory does not apply to a defined level of
aggregation. In its application to ‘products’, life-cycle theory can be used for product class,
e.g. television; form, e.g. plasma screen television; or brand, e.g. Panasonic. For each level
there are many examples which do not follow the life-cycle pattern, particularly product
classes and product brands (Dhalla & Yuspeh, 1976), with the product form appearing to
have the closest approximation to the life-cycle model (Tellis & Crawford, 1981). At higher
levels of aggregation it becomes difficult to determine the transition point from one stage to
the next (Abell & Hammond, 1979). The general application of this theory subsequently
extended from products to descriptions of technologies, organisations, industries, and

Noreen Breakey Tourism Destination Development
Chapter Two – Theories on the Processes of Change 68
industry inter-relationships (Wollin, 1995). This application of a product model to complex
systems highlights the limitations of the model.
An additional limitation associated with the product life-cycle is that it is self-limiting.
Firstly, the theory assumes that growth is inevitable (Wollin, 1995). Secondly, product
growth is considered limited as the product is expected to die, or at least require multiple
rejuvenations to prolong life (Tellis & Crawford, 1981). Thirdly, it is perceived that, as
occurs in the life-cycles of higher living organisms, “the developing entity contains within it
an underlying logic, program, or code that regulates the process of change and moves it
from a given point of departure towards a subsequent end which is prefigured in the present
state” (Van de Ven, 1992 p.177). Finally, one of the features of this process of change
theory is that there exists a constraint on long term growth due to a level of saturation
(Wind, 1981).
2.4.1.3 The Current Role of the Product Life-Cycle Theory
As marketing is a context-driven discipline, accepted generalisations need to be periodically
reviewed (Sheth & Sisodia, 1999). The life-cycle theory lead to a change in focus from the
individual products to product replacement cycles, as consumers often replace items with a
next-generation product before the physical life of the earlier generation is over (Norton &
Bass, 1992). The development of this concept is in line with the change from a diffusion
process approach to a diffusion and substitution theory.
Marketing is not the only dynamic context-driven discipline. Industrial age economics has
been supplemented by new growth economic theory, which highlights the importance of
knowledge assets, new ideas and processes, increasing returns, and the effects of market
forces (Sheth & Sisodia, 1999). These changes in the business arena reduce the applicability
of the product life-cycle as its implication of slow evolutionary change is no longer
appropriate (Sheth & Sisodia, 1999).
Despite this, recent marketing texts still focus on the product life-cycle (for example Dann
& Dann, 2004; Rix, 2004). Although it is now clarified that the theory is a ‘teaching tool’,
representing a ‘typical’ product, which therefore may differ from real-world product
examples (Dann & Dann, 2004). However, the main use of the theory is still to determine

Noreen Breakey Tourism Destination Development
Chapter Two – Theories on the Processes of Change 69
which marketing strategies are most appropriate, depending on which stage a product is
considered to be in (Dann & Dann, 2004; Rix, 2004).
Considering the limitation of applicability, Rix (2004) specifies that the product life-cycle is
only applicable to a generic category of product, rather than a specific brand. The life-cycle
pattern is considered to represent the aggregate demand for all brands in the product
category. A specific brand within the category holds a percentage share of the aggregate
sales.
In addition, it is recognised that product life-cycles are getting shorter, as a result of
technological changes (Rix, 2004), effective global distribution, and the increasing speed of
the product development process (Dann & Dann, 2004). The stages are also expected to
differ in length across different products, with some products not passing through all the
stages (Rix, 2004). Therefore the pattern of sales generated by different types of products is
expected to differ (Dann & Dann, 2004). In addition it is also accepted that management
strategies can ‘control’ the shape of the life-cycle pattern (Rix, 2004).
2.4.1.4 Summary of the Product Life-Cycle Theory
In conclusion, the product life-cycle theory is a theoretical model. It is useful as a
descriptive model for the historical analysis of a product. As early as 1976 it was
recognised by Hunt (1976) that as an explanatory theory it is deficient in explaining the
current position or future directions. It is also inadequate for explaining the phenomenon of
product growth and proliferation (Tellis & Crawford, 1981).
A main reason for the inadequacy of the product life-cycle is due to the significant
differences between biological and other systems (Dhalla & Yuspeh, 1976). The predicable
biological growth curves are not necessarily applicable to social phenomenon where the
boundaries are not necessarily limited (Katz & Kahn, 1978). However, the product life-
cycle can be considered as the representation of the culmination of internal and external
forces of change acting on a system (Day, 1981). As a result, the model is often suitable for
understanding past change at a macro level.

Noreen Breakey Tourism Destination Development
Chapter Two – Theories on the Processes of Change 70
2.4.2 Application of the Life-Cycle Model to Tourism
Given that the life-cycle concept was one of the most commonly utilised product change
theories in the 1970s, it is understandable that this model was applied to change within the
tourism arena.
The product life-cycle has been applied at the destination level as well as to individual
tourism companies and products. Consequently the growth pattern of a destination is the
aggregation of the growth patterns of all the companies and products at the destination. This
usage indicates a range in the level of applicability of the model.
The application of the product life-cycle to individual tourism products was part of the wider
use of marketing in the business sector of the travel and tourism industry. As already
mentioned, marketing requires consideration of the stage in the product life-cycle, in order
to apply the appropriate strategies to position the product effectively in the marketplace
(Kurtz & Boone, 1984; Mill & Morrison, 1985; Assael, 1987; Lusch & Lusch, 1987; Dann
& McMoll-Kennedy, 1992; Kotler et al., 1999). This use of the product life-cycle generated
strategies for marketing travel and tourism products, dependant on the stage of life of the
particular product.
Application of the life-cycle model at the macro destination level has provided the basis for
various tourism development models, most commonly Butler’s (1980) Tourist Area Cycle
of Evolution model (Figure 2.9). This life-cycle approach was informed by Stanfield’s
(1978) Resort Cycle analysis of Atlantic City.
This Destination, or Tourism Area, Life-Cycle has six stages that were initially defined by
their characteristics:
1. Exploration – few adventurous tourists; individually planned itineraries; irregular
visitation patterns; interest in nature/culture; close interaction with local people; minimal
effect on social, cultural and physical environments; use of local facilities.

Noreen Breakey Tourism Destination Development
Chapter Two – Theories on the Processes of Change 71
Figure 2.9 The Destination Life-Cycle. The application of the product life-cycle to tourism destinations generated the six-staged Tourist Area Cycle Of Evolution (Butler, 1980).
2. Involvement – increased tourist numbers; start of the provision of tourist facilities;
some advertising; start of tourist market and season; interaction stays high; some
changes in social life of locals; pressure on public sector to provide infrastructure.
3. Development – tourists’ numbers rapidly increase to equal or exceed local population;
clear and different tourist market; extensive advertising and links to the generating
region(s); loss of local control through increased foreign-owned facilities, and
regional/national planning and provision of infrastructure; promotion of artificial
attractions; use of migrant labour.

Noreen Breakey Tourism Destination Development
Chapter Two – Theories on the Processes of Change 72
4. Consolidation – growth rate declines; tourism now a major economic sector; heavy
advertising aiming to extend tourist season and market(s); some opposition to tourism;
clear recreational business districts; old facilities have deteriorated.
5. Stagnation – tourist capacity reached/exceeded; reliance on repeat visitation and
conventions; surplus hotel capacity and changes in ownership; focus on the package
tourist; new developments peripheral to the existing destination; established, but out-of-
fashion image; social, environmental and economic problems.
6. Decline and Demise – tourist market is lost; vacationers decline; reliance on week-
enders and day visitors; high property turnover and conversion of many facilities;
increased local involvement.
......or Rejuvenation – complete changed in the attractions and image; combined public
and private sector efforts; a new tourist market is found, often a special interest group.
Butler’s (1980) Tourist Area Cycle of Evolution model follows the same S-shaped growth
curve used in the classic product life-cycle model. However, Butler’s application of this
theory to tourism destinations generated two transitional stages (Butler, 1980). The initial
‘exploration’ (birth) stage is considered to progress through a period of ‘involvement’ prior
to the ‘development’ (growth) stage. The second transition stage of ‘consolidation’ occurs
between the ‘development’ (growth) period and ‘stagnation’ (maturity). Both the life-cycle
models then progress to decline which can eventuate in death, or be reversed by
rejuvenation. Although the rate of change differs between destinations, each destination is
expected to eventually progress through all the stages (Butler, 1980).
2.4.2.1 Predicting Changing during the Destination Life-Cycle
An important contribution of the product life-cycle theory was the predictions about the
types of change that occur at the different stages of a product’s life. These predictions,
which developed alongside the product life-cycle, have also been applied to tourism
destinations, initially by Butler (1980).

Noreen Breakey Tourism Destination Development
Chapter Two – Theories on the Processes of Change 73
In summary, over the life of a destination there is change from “authenticity to artificial,
from indigenous to imported, from low density to high density, from low energy
consumption to high energy consumption, from locally controlled to externally controlled,
and from sustainable or renewable to unsustainable and nonrenewable” (Butler, 1993 p.32).
The destination predictions for change over the life-cycle link with the earlier tourist
typologies proposed by Cohen (1972) and Plog (1974), and Doxey’s (1976) tourist irritation
index.
The numerous predictions for each stage of the destination life-cycle, have been summarised
by Buhalis (2000) into the categories of destination characteristics, marketing response,
economic impacts, social impacts, and environmental impacts (Figure 2.10).
2.4.2.2 Application of the Life-Cycle Theory to Tourism Destinations
Substantial application of the life-cycle framework, conducted for specific tourist locations,
indicate the general validity of the model in providing a structure to retrospectively describe
past tourism destination development (Table 2.2) (Hovinen, 1981, 1982; Oglethorpe, 1984;
Meyer-Arendt, 1985; Keys, 1986; Keller, 1987; Wilkinson, 1987; Strapp, 1988; Weaver,
1988; Cooper & Jackson, 1989; Barr, 1990a; Cooper, 1990; Debbage, 1990; Weaver, 1990;
Foster & Murphy, 1991; France, 1991; Morgan, 1991; Choy, 1992; Getz, 1992; Ioannides,
1992; Kermath & Thomas, 1992; Shaw & Williams, 1992; di Benedetto & Bojanic, 1993;
Johnson & Snepenger, 1993; Messerli, 1993; Williams, 1993; Agarwal, 1994; Douglas,
1994; Harrison, 1995; Russell, 1995; Formica & Uysal, 1996; Agarwal, 1997; Cooper,
1997; Digance, 1997; Douglas, 1997; Goncalves & Aguas, 1997; Prosser, 1997; Tooman,
1997; Baum, 1998; Priestley & Mundet, 1998; Russell & Faulkner, 1998; Twining-Ward &
Baum, 1998; Knowles & Curtis, 1999; Johnston, 2001; Lundtorp & Wanhill, 2001; Toh et
al., 2001; Hovinen, 2002).
It is important to note that this analysis focuses on the application of Butler’s (1980) life-
cycle model and therefore does not incorporate all studies conducted on the development of
tourism destinations.

Noreen Breakey Tourism Destination Development
Chapter Two – Theories on the Processes of Change 74
Figure 2.10 Destination Life-Cycle Stage Predictions. Summary of the predictions for each stages of the destination life-cycle, regarding the characteristics of the destination, marketing strategies, and economic, social, and environmental impacts (Buhalis, 2000).

Noreen Breakey Tourism Destination Development
Chapter Two – Theories on the Processes of Change 75
Table 2.2 Destination Life-Cycle Research. Research applying the life-cycle model to tourism destination development. This summary includes the type of data parameters used to graph the growth in tourism over time, and highlights the limited number of studies that used such variables and the common use of a single variable, often visitor arrivals/numbers or nights.
Author(s) Year Destination Parameter in Table/Figure
Parameter Graphed Over Time
Hovinen 1981 1982
Lancaster County, Pennsylvania
– –
Oglethorpe 1984 Malta Tourist arrivals British tourist arrivals Hotel number/beds/ownership
Tourist Arrivals Arrivals by main origins Tourist expenditure
Meyer-Arendt 1985 Grand Isle, Louisiana
Schematicized settlement evolution
Resident population
Keys 1986 Queensland regions Population, accommodation capacity & occupancy, tourism employment, building approvals
–
Keller 1987 Canada’s Northwest Territories
Estimate of visitors and expenditure within the region, Location of package tour companies
–
Wilkinson 1987 Small island nations (Caribbean)
Caribbean tourist arrivals Island arrivals Island visitor expenditure 1982 Estimated visitor expenditure
–
Strapp 1988 Sauble Beach, Canada
– Estimated visitor numbers Estimated ‘person-days’
Weaver 1988 Antigua – Tourist numbers Tourism share of GNP
Cooper & Jackson,
and Cooper
1989
1990
Isle of Man, UK Visitor Profile 1986 – Percentage by origin, age, social grade, and repeat visitation
Passenger arrivals Population Passenger arrivals by air/sea
Barr 1990 Whitsundays, Qld, Australia
– –
Debbage 1990 Bahamas 1985 & 1987 – Largest 10 US Airlines by Market Share, 1989 – World’s Largest Hotel Chains by number of hotels and number of rooms
–
Weaver 1990 Cayman Islands Tourist and day-tripper arrivals Total visitor arrivals Foster & Murphy
1991 Parksville & Qualicum Beach, Canada
Accommodation providers Number of units Population by age group
–
France 1991 Caribbean (Barbados)
Hotel rooms by region Hotel establishment by region Tour accommodation types Hotel ownership
Visitors to Barbados
Morgan 1991 Majorca, Spain UK visitors to Spain – Choy 1992 13 Pacific Island
Destinations – Visitor arrivals
Getz 1992 Niagara Falls Bridge crossings by bridge Accommodation rooms Occupancy rates Site attendance Results of industry survey
–
Ioannides 1992 Cyprus Bed Capacity by district Tour arrivals by type
Visitor arrivals by origin Bed capacity by district

Noreen Breakey Tourism Destination Development
Chapter Two – Theories on the Processes of Change 76
Author(s) Year Destination Parameter in Table/Figure
Parameter Graphed Over Time
Kermath & Thomas
1992 Sosua, Dominican Republic
– Number of tourist establishments
Shaw & Williams
1992 Cornwall & Devon Map: tourism restriction areas Visitor perceptions 1990
–
di Benedetto & Bojanic
1993 Florida Cypress Gardens
– Number of visitors
Johnson & Snepenger
1993 Greater Yellowstone Region
Visitor attitudes Profile of businesses Tourist expenditures Perceived impacts
Number of visitors Tourism income by service Visitor nights by region
Messerli 1993 Santa Fe, New Mexico
Average occupancy and room rates
Number of hotel rooms Annual hotel occupancy Annual average room rate
Williams 1993 Minorca, Spain – Visitor numbers by origin Employment structure Hotel rooms
Agarwal 1994 South England seaside resorts
– –
Douglas 1994 Papua New Guinea, Solomon Islands, Vanuatu (Melanesia)
Expected and actual arrivals Number of, and rooms in hotels, resorts, and guesthouses 1990 – arrival sources, occupancy, earnings, employment, and growth
Visitor arrivals by air Cruise passengers
Harrison 1995 Swaziland, Botswana & Lesotho Southern Africa
Total visitors by purpose Origin of hotel guests International tourist arrivals Percent of total intl arrivals
–
Russell and
Russell & Faulkner
1995
1998
Coolangatta – Visitor numbers
Formica & Uysal
1996 Italy International visitors and visitor nights
–
Agarwal 1997 Torbay, UK – – Cooper 1997 British seaside
resorts Hotel room and bed occupancy rates by sector
Total visitor nights in seaside destinations Market share of seaside nights
Digance 1997 Thredbo River Valley, NSW, Australia
– –
Douglas 1997 Melanesia: Papua New Guinea, Solomon Islands, Vanuatu
1993: population, land area, visitor/holiday arrivals, number of rooms, occupancy, tourism earnings, foreign exchange, tourism employment
–
Goncalves & Aguas
1997 Algarve, Portugal Visitor nights by accommodation type
Visitor nights by accommodation type
Prosser 1997 Gold Coast & Coffs Harbour
Population & pop change, employment in service sector, unemployment
Bed numbers in hotels/motels, flats/units and caravan nights
Tooman 1997 Smoky Mountains, US
Quantitative social welfare indicators
–
Baum 1998 7 ‘cold-water’ islands
Arrivals to the Isle of Man, Aland Islands, Iceland, and Newfoundland
Tourism arrivals to Prince Edward Island

Noreen Breakey Tourism Destination Development
Chapter Two – Theories on the Processes of Change 77
Author(s) Year Destination Parameter in Table/Figure
Parameter Graphed Over Time
Priestley & Mundet
1998 Catalan Coast, Spain
– Hotel capacity Population
Twining-Ward & Baum
1998 Baltic Islands – –
Knowles & Curtis
1999 European mass tourist resorts
– –
Johnston 2001 Kona, Hawaii Island Map: tourist landscape Number of rooms Lundtorp & Wanhill
2001 Bornholm (Danish island)
– Number of ferry passengers 1910-2000
Toh, Khan & Koh
2001 Singapore Visitor arrivals by purpose Travel balance: exports/imports
Visitor arrivals by purpose Travel balance: exports/imports
Hovinen 2002 Lancaster County, Pennsylvania
Change in sales by tourist sectors
–
A major problem with the application of the destination life-cycle model has been the
limited availability of relevant data. To generate a pattern of growth for a destination
requires the availability of a consistent collection of data over time for a variable that can be
used as an indicator of growth. The destination life-cycle model utilises visitor numbers as
the variable to be plotted over time to generate the pattern of growth. However consistent
time-series data on visitation is not always available.
Researchers investigating tourism destination development through the application of the
life-cycle model have tried to address this data issue in a number of ways, including the
study of a clear geographically defined destination, such as an island or attraction; the use of
an alternate growth indicator, such as the number of beds or the local population; the
presentation of available data in a table or discussion, such as arrivals for isolated years; the
estimation of data, such as for arrivals; or simply the written account of the destination,
separating it’s development into the stages of the life-cycle. These approaches can be seen
in the review of over 40 tourism destination life-cycle studies (Section 2.4.2.2).
Many of the selected destinations to be studied have been islands, as they often have records
of the number of arrivals (Cooper, 1992; Goncalves & Aguas, 1997). Twelve of the studies
incorporated visitor arrivals to island destinations, in either a graph or table format,
including Malta (Oglethorpe, 1984), small island nations in the Caribbean (Wilkinson,
1987), the Caribbean island of Antigua (Weaver, 1988), the Isle of Man, UK (Cooper &
Jackson, 1989; Cooper, 1990), the Cayman Islands (Weaver, 1990), Barbados (France,
1991), thirteen Pacific Islands (Choy, 1992), Cyprus (Ioannides, 1992), the Spanish island of

Noreen Breakey Tourism Destination Development
Chapter Two – Theories on the Processes of Change 78
Minorca (Williams, 1993), the Melanesian islands of Papua New Guinea, Solomon Islands
and Vanuatu (Douglas, 1994), seven cold-water islands (Baum, 1998), the Danish island of
Bornholm (Lundtorp & Wanhill, 2001), and Singapore (Toh et al., 2001).
Four other island studies were not able to utilise arrival data and instead used alternate data
variables, such as the resident population of Grand Isle, Louisiana (Meyer-Arendt, 1985),
the number of beds available on Vancouver Island (Foster & Murphy, 1991), the number of
UK visitors to Spain (Morgan, 1991), and the number of accommodation rooms available at
Kona on Hawaii Island (Johnston, 2001).
A further three island studies have not reported any time-series data, in a graph or table, to
support the application of the destination life-cycle model. However figures may have been
incorporated into the discussion. These include the studies of the Whitsundays (Barr,
1990a), the Bahamas (Debbage, 1990), and the three Baltic islands of Bornholm, Gotland,
and Aland (Twining-Ward & Baum, 1998). In addition, Douglas’s article (1997) on the
application of the life-cycle model to Melanesian islands did not provide any time-series
data, despite being based on his doctoral thesis (1994), mentioned above.
There have also been a number of applications of the destination life-cycle model to non-
island destinations. Where possible, these studies have used time-series data to determine
the pattern of growth of the destination. These have included the number of tourist related
establishments in Sousa, Dominican Republic (Kermath & Thomas, 1992); visitor numbers,
visitor nights by region, and tourism income by service, for the Greater Yellowstone Region
(Johnson & Snepenger, 1993); Number of hotel rooms, average occupancy, and room rates
(Messerli, 1993); visitor numbers for Coolangatta, Australia (Russell, 1995; Russell &
Faulkner, 1998); visitor nights and the market share of visitor nights for seaside destinations
in Britain (Cooper, 1997); the number of overnight stays in the various forms of
accommodation in Algarve, Portugal (Goncalves & Aguas, 1997); available bed nights in
three accommodation sectors (Prosser, 1997); and the total capacity of the available hotels,
as well as the local population for the Catalan Coast (Priestley & Mundet, 1998). These
studies also illustrate the use of more than one variable as an indicator of change to describe
the development of the destination. In the case of British seaside resorts, Cooper (1997)
combined the graphed data on visitor nights with additional data on occupancy in a table
form.

Noreen Breakey Tourism Destination Development
Chapter Two – Theories on the Processes of Change 79
However, the majority of non-island studies have not been able to incorporate data to
illustrate the destination’s growth pattern, such as for Lancaster County (Hovinen, 1981,
1982, 2002), Parksville and Qualicum Beach, Canada (Foster & Murphy, 1991), Niagara
Falls (Getz, 1992), Cornwall and Devon (Shaw & Williams, 1992), the seaside resorts of the
south coast of England (Agarwal, 1994), Southern Africa (Harrison, 1995), Torbay, UK
(Agarwal, 1997), Thredbo River Valley (Digance, 1997), the Smoky Mountains (Tooman,
1997), and European mass tourist resorts (Knowles & Curtis, 1999).
In three non-island studies data was only provided in a table form, rather than as a graph that
illustrated the pattern of growth. An early application of the life-cycle model, conducted by
Keys (1986) on regions within Queensland, utilised a comparison of a number of data
variables for the different regions as at 1976 and 1981. Harrison (1995), in his study of
Swaziland, included time-series data on the number of visitors in hotels, separated into
holiday tourists, business and other, from 1972 to 1990. In addition Formica and Uysal
(1996) utilised data on international visitors and visitor nights in their study of Italy as a
tourist destination.
In most cases however, the pattern of growth has not been provided because of the limited
data available. Some tourism related data has been presented in a table/figure, or mentioned
in the discussion. One technique was the use of statistics in the discussion of the stages of
growth in the destination under investigation. For example, Hovinen (1982) in his
description of the stages of tourism growth for Lancaster County in Pennsylvania, included
estimates of visitor numbers for various years, the change in the number of motels over a
decade, tourism economic impact data for 1978, and visitor survey data for 1980. It is
interesting to note that even Hovinen’s (2002) recent ‘revisiting’ of the destination life-cycle
as applied to Lancaster Country did not incorporate a graph illustrating the pattern of
growth.
Another study applied the life-cycle theory model to a tourist attraction, Florida Cypress
Gardens (di Benedetto & Bojanic, 1993). Similar to the island studies, the application of the
model to an attraction provides possible access to attendance levels.
There have been only a few studies that have included multiple parameters. Some of these
have used the local population as the second variable (Cooper & Jackson, 1989; Priestley &

Noreen Breakey Tourism Destination Development
Chapter Two – Theories on the Processes of Change 80
Mundet, 1998); separated one variable, such as arrivals or overnight stays, into sub-
categories (Cooper & Jackson, 1989; Goncalves & Aguas, 1997); or provided two related
variables, such as number of accommodation providers and the number of rooms (Foster &
Murphy, 1991). It is interesting to note that one of the early studies incorporated data for
Malta on visitor arrivals, arrivals by main origin, visitor expenditure, as well as the number
of hotel establishments, bed numbers, and the percentage of foreign ownership (Oglethorpe,
1984). One recent study compared the pattern of growth of visitors to Singapore with the
travel balance of payments (Toh et al., 2001).
From this review of studies applying the destination life-cycle model to tourism it is clear
that the analysis of the growth of destinations has been limited by the availability of relevant
time-series tourism data. However the increase in the availability of data on various aspects
of a destination provides the opportunity to analyse multiple patterns of growth evident
within a destination. Such an analysis of multiple change indicators would provide a more
detailed understanding of a destination’s development. However it must be noted that
during the early stages of development, tourism-related data is rarely collected for a
destination.
It can therefore be seen that the destination life-cycle has been used to describe past macro
level or overall changes within destinations (Towner & Wall, 1991). However the theory
does not consider the micro or lower level changes and their interaction, nor does it identify
the catalysts and situations conducive for tourism development, or incorporate the
significance of external events and influence. This is partially due to the typical use of a
single data variable, such as total visitor numbers, as the indicator of destination growth.
This is a good example of “the restrictions imposed by the aggregation process limit the
resort cycle paradigm, in a quantitative context, to being no more than a statistical caricature
of the real world” (Lundtorp & Wanhill, 2001 p.947). If the tourism system operating at a
destination is to be understood multiple variables that accompany change at a destination
must be examined. This would also provide the opportunity to study the correlation and
interaction between variables.

Noreen Breakey Tourism Destination Development
Chapter Two – Theories on the Processes of Change 81
2.4.2.3 Limitations for Describing the Development of a Tourism
Destination System
There has been extensive application of Butler’s (1980) tourism life-cycle to numerous
destinations over the last quarter century. Also during this period a number of limitations
have been noted, by Butler himself, researchers applying the model to a specific destination,
and those reviewing the model as a planning tool. The criticisms have been on both
conceptual and empirical grounds (Prosser, 1995, 1997; Hovinen, 2002). Some of these
criticisms correlate with the product life-cycle limitations already discussed (Section
2.4.1.2), including lack of applicability, limited forecasting use, validity, level of
aggregation, and self-limiting.
Even when Butler’s (1980) destination life-cycle is considered applicable to empirical
research, the model is often remodelled to suit the destination under investigation (see for
example Meyer-Arendt, 1985; Strapp, 1988; Getz, 1992; Harrison, 1995; Johnston, 2001).
Although the model applies generally, its rendition often varies considerably between
destinations. Haywood (1986) proposed four alternate destination life-cycle patterns as
examples of the various observed or possible patterns. Scepticism regarding the ability of
the model to explain destination growth was reinforced by the 13 different patterns
identified by Choy (1992) in his analysis of 13 Pacific Island destinations.
A stage in the destination life-cycle may be divided to suit the explanatory needs of the
researcher. Meyer-Arendt (1985) divided the development stage into three separate phases
to incorporate the momentous impact from external sources, including natural disasters,
wars, and economic depressions.
The stages of the destination life-cycle are also often modified to suit the specific cases and
account for its variables. For example, Harrison (1995) replaced the involvement phase
with the stages of ‘inactivity’ and ‘transition’, and adjusted the development stage to
‘truncated development’.
By the mid-1990s the application of the life-cycle model to tourism destinations had
“become an important focus for tourism research, with a number of authors proposing
refinements of the model to account for the evolution of specific areas” (Prosser, 1995
p.318).

Noreen Breakey Tourism Destination Development
Chapter Two – Theories on the Processes of Change 82
As an alternative to the classical destination life-cycle model, Carter (2000; 2004) presented
a Notional Episodic Model of Tourism Growth based on the empirical study of tourism
destinations. This model indicates that growth is not always gradual and instead occurs in
sporadic steps. The model will be presented and discussed later in this chapter (Section
2.5.3.4). Butler (1993) himself understood that the tourism area life-cycle is not the only
description of development, as it is also possible for a tourism destination to commence as
one large-scale, externally induced, revolutionary development.
The change in the target market during the destination life-cycle also affects the application
of life-cycle theory. As previously mentioned the product life-cycle concept assumes that
consumers are homogeneous. If there is a significant change to the level of technology, the
function of the product, or the target market, a separate life-cycle is required (Abell, 1980).
As a result a destination may be more appropriately described as a number of overlapping
life-cycle curves, each illustrating a different target market (Haywood, 1986) (Figure 2.11).
Figure 2.11 Changing Life-Cycles. The changing life-cycles within the overall destination life-cycle (Haywood, 1986).

Noreen Breakey Tourism Destination Development
Chapter Two – Theories on the Processes of Change 83
The lack of applicability reinforces the notion that the one model is unable to explain
tourism development, as discussed by Getz (1992), Bianchi (1994), and Prosser (1995;
1997). There is therefore a lack of empirical evidence to support the model in its
unmodified form (Prosser, 1995, 1997).
This concept is reinforced by the fact that the life-cycle model does not apply to a defined
level of aggregation (Cooper & Jackson, 1989; Ioannides, 1992). The life-cycle can be
applied in various ways depending on the interpretation of the level of aggregation, such as,
to a hotel, a region, a country, or a market segment (Cooper et al., 1993; Cooper et al.,
1998). The product form appears to have the closest approximation to the life-cycle model
(Tellis & Crawford, 1981). Utilising a life-cycle for each form of tourism within a
destination would result in the multiple life-cycle curves in which one cycle grows as the
previous form declines (Figure 2.11).
The validity of the destination life-cycle is limited as the model does not account for the
significant impact that internal and external influences can have on destination development
(Ioannides, 1992). In reality, the life-cycle pattern of a destination’s growth is dependent on
a number of factors, including access, the level and type of competition, marketing
activities, government policies, environmental factors, and the rate of development (Cooper,
1989). As the life-cycle theory does not incorporate all these important variables, it is
clearly not considering the entire tourism system and its connections.
The concept that a destination will pass through each of the stages of the life-cycle implies
that both growth and decline are inevitable. As discussed above, this deterministic approach
does not recognise the numerous factors which affect destination change (Cooper et al.,
1993; Cooper et al., 1998). “The resort cycle, rather than presenting a rigid and highly
predictable life-to-death story (similar to that of a biological specimen), should be dynamic
and open-ended, telling an even more exciting story of the origin, growth, and proliferation
of resort areas” (Haywood, 1992 p.353).
In addition to limitations relating to the application of the product life-cycle to tourism
destinations, the tourism area life-cycle proposed by Butler (1980) also incorporated the
principle of carrying capacity (Butler, 1991). Conceptual criticisms have questioned the
fixed limit of growth and the difficulty in defining this carrying capacity in practice
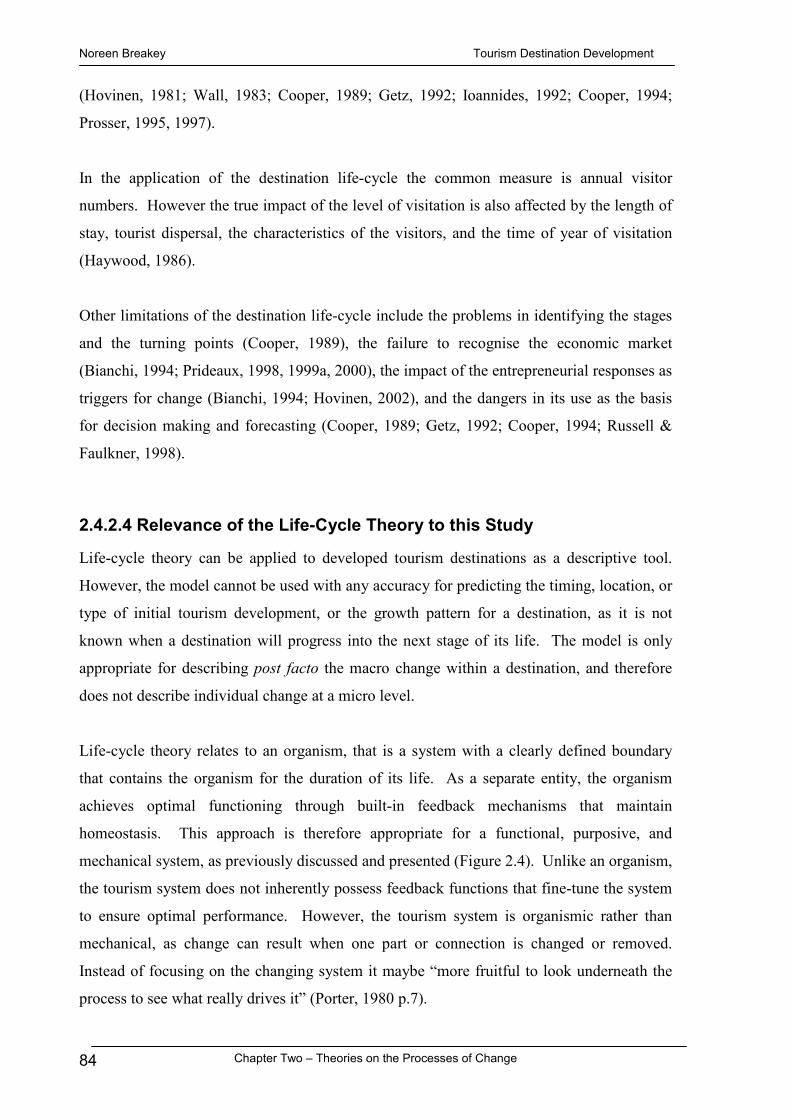
Noreen Breakey Tourism Destination Development
Chapter Two – Theories on the Processes of Change 84
(Hovinen, 1981; Wall, 1983; Cooper, 1989; Getz, 1992; Ioannides, 1992; Cooper, 1994;
Prosser, 1995, 1997).
In the application of the destination life-cycle the common measure is annual visitor
numbers. However the true impact of the level of visitation is also affected by the length of
stay, tourist dispersal, the characteristics of the visitors, and the time of year of visitation
(Haywood, 1986).
Other limitations of the destination life-cycle include the problems in identifying the stages
and the turning points (Cooper, 1989), the failure to recognise the economic market
(Bianchi, 1994; Prideaux, 1998, 1999a, 2000), the impact of the entrepreneurial responses as
triggers for change (Bianchi, 1994; Hovinen, 2002), and the dangers in its use as the basis
for decision making and forecasting (Cooper, 1989; Getz, 1992; Cooper, 1994; Russell &
Faulkner, 1998).
2.4.2.4 Relevance of the Life-Cycle Theory to this Study
Life-cycle theory can be applied to developed tourism destinations as a descriptive tool.
However, the model cannot be used with any accuracy for predicting the timing, location, or
type of initial tourism development, or the growth pattern for a destination, as it is not
known when a destination will progress into the next stage of its life. The model is only
appropriate for describing post facto the macro change within a destination, and therefore
does not describe individual change at a micro level.
Life-cycle theory relates to an organism, that is a system with a clearly defined boundary
that contains the organism for the duration of its life. As a separate entity, the organism
achieves optimal functioning through built-in feedback mechanisms that maintain
homeostasis. This approach is therefore appropriate for a functional, purposive, and
mechanical system, as previously discussed and presented (Figure 2.4). Unlike an organism,
the tourism system does not inherently possess feedback functions that fine-tune the system
to ensure optimal performance. However, the tourism system is organismic rather than
mechanical, as change can result when one part or connection is changed or removed.
Instead of focusing on the changing system it maybe “more fruitful to look underneath the
process to see what really drives it” (Porter, 1980 p.7).

Noreen Breakey Tourism Destination Development
Chapter Two – Theories on the Processes of Change 85
This discussion of the life-cycle model illustrated its use as a descriptive tool, whereby the
past pattern of destination growth can be generated. However, this model does not
incorporate the complex dynamics operating within a destination, or explain why change
occurs. Additionally this model represents change as an overall, gradual process.
A more detailed understanding of tourism destination change requires a model that is
appropriate for open, complex, and dynamic systems. Such a model should also be
applicable at both the macro destination level and the micro levels, generating variable
change rates for system elements. This would provide a more complete picture of the
overall change and the complexity within. The following section reviews candidature
process of change theories and their application to tourism destinations.
2.5 Alternative Candidate Theories on the Processes
of Change
Tourism can be considered an evolutionary process. Change has been identified within
elements of the dynamic tourism system, including people, activities, resources, perceptions,
impacts, control, markets, and rate of change (Butler, 1993). Although such change is
acknowledged as a critical factor, the reasons for change are not clear. The destination life-
cycle model has assisted in describing tourism destination change, but the manner in which
tourism destinations develop and the causes of the development are not well understood.
Gaps exist in the knowledge regarding the turbulent periods of destination development, and
in the fundamental causes of change (Hall & Butler, 1995; Russell & Faulkner, 1999;
Carter, 2000).
This section presents three alternative theories on the processes of change: the Theory of
Species Evolution, Punctuated Equilibrium, and Chaos Theory. For each of these theories I
will explain their significant concepts, past application of the theory to the study of tourism,
and their appropriateness for analysing an open and complex system such as tourism.
The life-cycle concept, presented in the previous section, is based on the stages of life
through which higher organisms progress, from birth through to death. Another biological

Noreen Breakey Tourism Destination Development
Chapter Two – Theories on the Processes of Change 86
description of change provides the basis of the first alternative theory, to be termed for this
study, the Theory of Species Evolution. This candidature process of change theory focuses
on the population level of a species, rather than the life-cycle of an individual organism, and
incorporates various forms of change and periods of stagnation within a non-sequential
framework.
I then present a second alternative theory, the Punctuated Equilibrium model. This theory
was identified within the field of bioevolution by Stephen Gould and Niles Eldredge (1972),
and has been applied within the social sciences (Levinson et al., 1978; Tushman &
Romanelli, 1985; Gersick, 1988, 1991; Wollin, 1995). The model illustrates periods of
stability or equilibrium that are punctuated by periods of rapid change. Inherent in this
theory are the triggers that cause the revolutionary style of change.
The final change theory considered is Chaos Theory. The term encompasses the work of
numerous scientists during the 1970’s and 1980’s into the study of 'dynamical systems' and
the apparent order in the chaos (Gleick, 1987). A significant concept of this theory takes the
Punctuated Equilibrium theory a step further as it highlights the situation whereby the
impact of a change can restructure the system, whether it is caused by an individual, a
seemingly small change, or an external, apparently unrelated change. This is often referred
to as the butterfly effect. Other relevant concepts offered by Chaos Theory include bottom-
up synthesis or self-organisation, lock-in effect, edge-of-chaos and bifurcations (Faulkner &
Russell, 1997).
2.5.1 The Theory of Species Evolution
Biology, the science that inspired the product life-cycle concept, also provides the basis for
an alternative product growth theory. Instead of focusing on the life-cycle of a single
organism, this evolutionary approach considers the changes within a species over time.
Unlike life-cycle theory, Darwinian evolutionary theory is used as a model to explain the
phenomenon of growth, proliferation, and extinction of a species (Leakey, 1979). Such an
evolutionary approach appears appropriate for describing product growth and change. The
underlying concept of this theory is the gradual evolution of a species through adaption and
natural selection. These concepts will be discussed below.

Noreen Breakey Tourism Destination Development
Chapter Two – Theories on the Processes of Change 87
2.5.1.1 Evolution
Evolution is generally considered to be gradual change through natural selection, as
proposed by Charles Darwin in 1859 (Leakey, 1979). This theory is predominantly used to
understand adaptive changes in natural populations (Stansfield, 1977). It is important to
realise that evolution is in fact a process. This process affects change in the gene pool of a
species and ultimately the expression of these genes in individuals and the population
(Stansfield, 1977).
In theory, a species population can be in genetic equilibrium and maintain its current genetic
composition from one generation to another. However in nature, with its changing
environments and species variation, the evolutionary process is virtually unavoidable and
indeterminate (Stansfield, 1977).
Darwin’s concept of natural selection is based on two consistent premises and a resultant
outcome:
Firstly: “Organisms vary, and these variations are inherited (at least in part)
by their offspring.
Secondly: Organisms produce more offspring than can possibly survive.
Conclusion: On average, offspring that vary most strongly in directions favoured
by the environment will survive and propagate. Favourable variation
will therefore accumulate in populations by natural selection” (Gould,
1977 p.11).
Evolution through natural selection is often described as ‘survival of the fittest’. This is
despite Darwin relating survival to reproductive contributions rather than fitness. In practice
the natural selection concept is really based on ‘survival and reproduction of the fitter’
(Stansfield, 1977).
Natural selection results in a number of cumulative alterations in the underlying structure of
the species (Van de Ven, 1992). These methods of change include variation, selection
(sorting), retention, and the struggle for existence (competition) (McKelvey & Aldrich,
1983). Variation as the first type of change, occurs at random in biology. However in the
business world variation may be blind or purposeful. A blind variation occurs by chance or
accident, while a purposeful variation is an intentional adaptive reaction to an external

Noreen Breakey Tourism Destination Development
Chapter Two – Theories on the Processes of Change 88
environmental change. Secondly, selection occurs on the basis of ultimately achieving a
better match between the 'population' and its 'environment' (Wollin, 1995). Thirdly,
retention relates to the ability to maintain the variations within a population that best fit their
environmental niche (McKelvey & Aldrich, 1983). Finally, the struggle for existence is the
inherent desire to survive and propagate. As natural selection encompasses these four
methods of change, Darwin’s theory presents natural selection as the creative factor in the
evolutionary process. Evolution by natural selection is not just a selection process that
simply executes the unfit (Gould, 1977).
2.5.1.2 Role of Adaption
The findings of population ecology since its development during the 1950s have generated
further understanding of the concept of adaption. Evolutionists have discovered that in
addition to changing their size and shape, a species can alter it’s 'life history strategies' by
adjusting the timing of life or the level of energy invested in various activities such as
feeding, growth, and reproduction (Gould, 1977).
As adaption is a gradual process, there is often a period before a specific adaption is useful
in a particular way. This stage has been termed preadaption, despite the misleading
inference that it occurs in preparation for a future adaptive requirement. A result of this
preadaption concept was the realisation that a species can significantly alter it’s function
with only minimal adjustment being made to the form (Gould, 1977). Ultimately, mutations
are considered the basis of a new genetic composition (Stansfield, 1977).
2.5.1.3 Application of the Evolutionary Cycle to the Development of
Products
Gross (1968) suggested that the evolution of species, as described by the theory of natural
selection, would be an appropriate model to explain the development of products in a free
market economy. This concept utilises biological terms which have parallels in the business
sector (Table 2.3). Additionally, the methods used by species for continuing survival have
business strategy counterparts. Specialisation, flexibility, and adjustment to changing
environments are all recognised behaviours in both settings. Selection of one of these three
strategies can influence abilities in the other areas. For example, high levels of
specialisation cause decreased flexibility and lower capabilities for immediate adjustment to
Noreen Breakey Tourism Destination Development
Chapter Two – Theories on the Processes of Change 89
change (Gross, 1968).
Table 2.3 Business Sector - Biological Evolution Terms.
Application of biological evolutionary terms to the business sector (Gross, 1968).
Biological Term Business Term Species Product Variation Product Differences Overpopulation / Overcapacity Excessive Competition Struggle for Existence Struggle for Existence Survival of the Fittest Survival of the Fittest Survival Success / Growth
Tellis and Crawford (1981) applied the concepts of species evolution to marketing and
product change. The process of evolutionary change for species and products is a gradual
continuous change that is:
1. Cumulative - adaption/changes are cumulative as well as successive, so the change is
building on the old to produce a new improved version.
2. Motivated by (three) defined forces
* Generative - the genetic system (managerial and entrepreneurial creativity)
* Selective - the environment (market with consumers and competitors)
* Mediative - humans (government and other agencies)
Each of the defined forces has a unique role and yet is an interdependent part of the
system.
3. Directional - moving towards increasing diversity and complexity (efficiency/progress)
4. Patterned - five patterns in the process of biological evolution are:
⇒ cladogensis - substantial divergence from previous species
⇒ anagenesis - adaption to environment
⇒ adaptive radiation - subspecies adapting to an environmental niche
⇒ stasigenesis - stability/stagnation
⇒ extinction - unable to exist (Figure 2.12) (Tellis & Crawford, 1981)
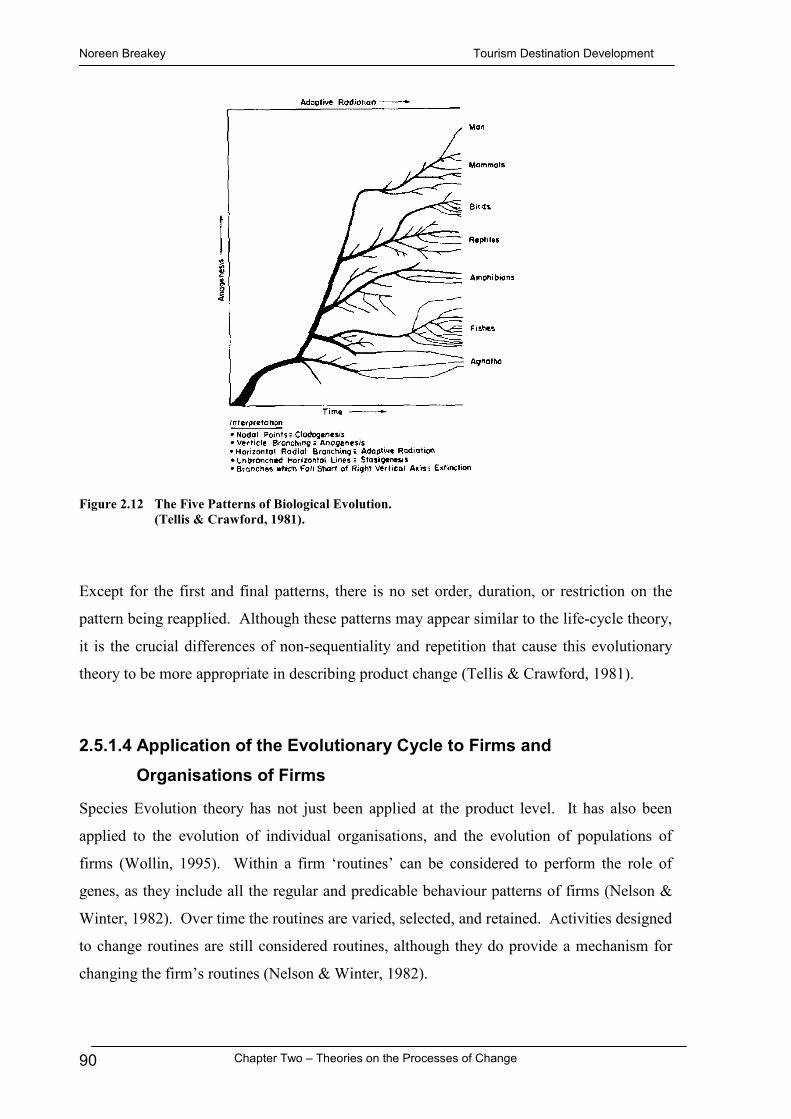
Noreen Breakey Tourism Destination Development
Chapter Two – Theories on the Processes of Change 90
Figure 2.12 The Five Patterns of Biological Evolution. (Tellis & Crawford, 1981).
Except for the first and final patterns, there is no set order, duration, or restriction on the
pattern being reapplied. Although these patterns may appear similar to the life-cycle theory,
it is the crucial differences of non-sequentiality and repetition that cause this evolutionary
theory to be more appropriate in describing product change (Tellis & Crawford, 1981).
2.5.1.4 Application of the Evolutionary Cycle to Firms and
Organisations of Firms
Species Evolution theory has not just been applied at the product level. It has also been
applied to the evolution of individual organisations, and the evolution of populations of
firms (Wollin, 1995). Within a firm ‘routines’ can be considered to perform the role of
genes, as they include all the regular and predicable behaviour patterns of firms (Nelson &
Winter, 1982). Over time the routines are varied, selected, and retained. Activities designed
to change routines are still considered routines, although they do provide a mechanism for
changing the firm’s routines (Nelson & Winter, 1982).

Noreen Breakey Tourism Destination Development
Chapter Two – Theories on the Processes of Change 91
These routines have also been termed ‘decision rules’ by Mahoney (1992). Preforming the
role of genes, these ‘decision rules’ are generators, creating change through problem-solving
activities, entrepreneurial discovery and random activity (Mahoney, 1992). Selection
progressively eliminates, or reduces the role of firms with inferior decision rules or routines
(Mahoney, 1992; Norton & Bass, 1992; Wollin, 1995). The application of the species
evolution theory to organisations can therefore be seen to explain change within firms and
their disappearance from the marketplace, but it does not explain how new firms emerge
(Wollin, 1995).
Application of the theory of species evolution at a macro level considers populations of
firms. This theory explains how certain organisation forms occur in particular environments
(Aldrich et al., 1984). The common form within a population of firms plays the role of
genetics, as it is the form that has been modelled from natural selection processes (Hannan
& Freeman, 1989). Evolution at the population level is the result of the combined routines
of all the firms. The continuing firms exhibit the common dominant competencies
(routines) (McKelvey & Aldrich, 1983). “A niche is the activity space of an organisation or
population or community of organisational forms that reflects the sum total of both its
adaption to environmental forces that are not subject to its influence and the adaption of
environmental forces that are subject to its influences” (McKelvey & Aldrich, 1983 p.111).
This evolutionary change theory is therefore considering the role of external systems.
Following the biological analogy, the theory of niches, with its mathematical methods, has
been applied at the population level to fitness functions, niche width and overlap, carrying
capacity, population density, and generalist and specialist strategies (Wollin, 1995).
Although the basis of species evolution theory is built on gradual evolution and natural
selection, it is recognised that in business forces can work against this process.
Organisations tend to maintain the social structure that was appropriate at the time of their
founding, rather than adapting to suit the changing social environment (Stichcombe, 1965).
This has since been termed ‘structural inertia’ (Hannan & Freeman, 1989). Factors which
constrain structural change and cause this inertia can be internal or external. Forces acting
within a company include investments and assets, limited information, internal politics, and
organisational histories or established routines. External forces consist of entry and exit
barriers, limited information, and established links and commitments to other companies
(Hannan & Freeman, 1989). Although structural inertia can ensure the retention of positive

Noreen Breakey Tourism Destination Development
Chapter Two – Theories on the Processes of Change 92
structural and cultural components, it also minimises the capacity of the organisation, or
population, to adapt to the changing environment (Wollin, 1995). Consequently
environmental selection occurs instead of adaption, as a totally new organisational form
takes over from the previous form (Astley & Van de Ven, 1983). The forces of inertia are
considered to operate in a hierarchical manner, with certain aspects of a population’s form
being easier to change. Structure and peripheral activities are more likely to adapt than the
core elements or ‘nature’ of the organisation (Hannan & Freeman, 1989).
The focus of the energy and resources of a company will depend on the level of competition
in the market place. As mentioned, population ecology illustrates the ability of a species to
alter its ‘life history strategies’. One option is to focus on reproduction, sacrificing intricate
morphological adaption. Such a species is deemed an r-strategist14. Alternatively a species
within a stable environment, with a population close to the carrying capacity of the
environment will utilise k-selection15 and focus on fine-tuning their design, rather than
reproducing (Gould, 1977). Applying this concept to the business world, an environment
comprised of multiple firms uses the level of competition to determine which adaption
strategy is appropriate. An r-selection could be undertaken by a firm experiencing low
competition as they can continue to function without the best set of routines. However, if
competition is high, a firm needs to adjust itself and its products to ensure their design
remains viable and competitive.
2.5.1.5 Applying the Concepts of Species Evolution to Tourism Development
Even before the life-cycle theory was applied to the field of tourism, the concept of product
evolution had been proposed. The popularity of the life-cycle model appears to have limited
the application of species evolution theory.
14 r is the measure of ‘intrinsic rate of increase in population size’. R-strategist applies to species which face irregular and catastrophic reductions in population numbers and which then need to focus primarily on reproduction when conditions improve (Gould, 1977). 15 k is the measure of environmental ‘carrying capacity’. K-strategist relates to species in stable environments with a population around the carrying capacity. Over-reproducing achieves no long-term change so the aim is to raise a small number of highly suited offspring (Gould, 1977).
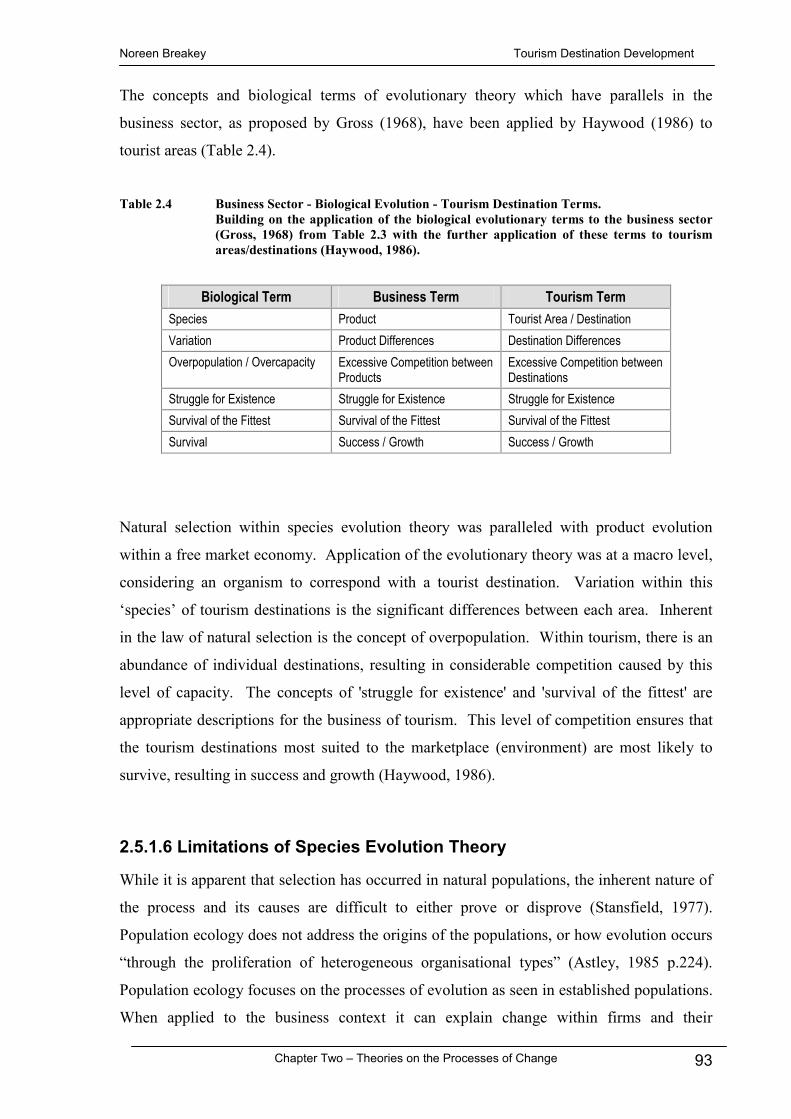
Noreen Breakey Tourism Destination Development
Chapter Two – Theories on the Processes of Change 93
The concepts and biological terms of evolutionary theory which have parallels in the
business sector, as proposed by Gross (1968), have been applied by Haywood (1986) to
tourist areas (Table 2.4).
Table 2.4 Business Sector - Biological Evolution - Tourism Destination Terms.
Building on the application of the biological evolutionary terms to the business sector (Gross, 1968) from Table 2.3 with the further application of these terms to tourism areas/destinations (Haywood, 1986).
Biological Term Business Term Tourism Term Species Product Tourist Area / Destination Variation Product Differences Destination Differences Overpopulation / Overcapacity Excessive Competition between
Products Excessive Competition between Destinations
Struggle for Existence Struggle for Existence Struggle for Existence Survival of the Fittest Survival of the Fittest Survival of the Fittest Survival Success / Growth Success / Growth
Natural selection within species evolution theory was paralleled with product evolution
within a free market economy. Application of the evolutionary theory was at a macro level,
considering an organism to correspond with a tourist destination. Variation within this
‘species’ of tourism destinations is the significant differences between each area. Inherent
in the law of natural selection is the concept of overpopulation. Within tourism, there is an
abundance of individual destinations, resulting in considerable competition caused by this
level of capacity. The concepts of 'struggle for existence' and 'survival of the fittest' are
appropriate descriptions for the business of tourism. This level of competition ensures that
the tourism destinations most suited to the marketplace (environment) are most likely to
survive, resulting in success and growth (Haywood, 1986).
2.5.1.6 Limitations of Species Evolution Theory
While it is apparent that selection has occurred in natural populations, the inherent nature of
the process and its causes are difficult to either prove or disprove (Stansfield, 1977).
Population ecology does not address the origins of the populations, or how evolution occurs
“through the proliferation of heterogeneous organisational types” (Astley, 1985 p.224).
Population ecology focuses on the processes of evolution as seen in established populations.
When applied to the business context it can explain change within firms and their

Noreen Breakey Tourism Destination Development
Chapter Two – Theories on the Processes of Change 94
disappearance from the marketplace, but it does not explain how new firms emerge (Wollin,
1995). As population ecology examines the slow gradual changes, the theory does not
address revolutionary change, such as the emergence of a new population (Astley, 1985). It
is therefore limited as a useful model for predicting where or when tourism systems may
develop.
As already mentioned, there are significant differences between biological and social
systems. The predictable biological growth curves are not necessarily applicable to social
phenomenon (Katz & Kahn, 1978). In addition the theory is deterministic as both types of
change, adaption and selection, are a result of the forces of the external environment (Astley
& Van de Ven, 1983). The theory of population ecology is based within a highly
competitive environment, causing the concepts to only apply in such conditions (Young,
1988).
It has been questioned whether all changes in natural populations are caused by gradual
evolutionary change. Richard Goldschmidt (1878-1958) considered the possibility of a
'hopeful monster' caused by a sudden drastic change within a species that was suitable
within the environment cited in (cited in Stansfield, 1977). This is not to imply that some
changes in the natural world do not occur through the gradual evolutionary process. If this
were not so, a new species would simply appear and the selection process would then
remove the previous species (Gould, 1977).
2.5.1.7 Relevance of Species Evolution Theory to this Study
The common form within a population of firms can be likened to the role that genetics play
for a species, as it is the form that has been modelled from natural selection processes
(Hannan & Freeman, 1989). This concept can be paralleled in tourism with the common
destination type, and within destinations as the common form of tourism in the destination,
as they change over time.
Unlike an organism, a species can significantly change form to adapt to the external
environment. The interaction between the species and the outer world defines the way that
the evolutionary process will progress. The tourism system is closer in type to a species
than to an organism as external systems play a significant role in the development and

Noreen Breakey Tourism Destination Development
Chapter Two – Theories on the Processes of Change 95
evolution of a tourism destination. Additionally the tourism system is not composed of a
number of different organs that each has a specific role in ensuring that the system functions
optimally. Rather, the components of the tourism system are often competing with each
other for survival, and the number and their roles fluctuate over time as the environment
changes.
The species evolution theory provides important concepts on the processes of change as it
aims to explain how the species evolve. There are fundamental aspects common to the
complex system of species evolution and the tourism destination system, as both change
over time, are affected by changes in one part or connection, and aim to survive. Both
systems are therefore classified as functional, organismic, and purposive. The species
evolution theory can therefore be a useful model for explaining and understanding the
manner in which tourism destinations evolve.
In terms of the change that occurs in a system (Section 2.3.2.1), Ison and Russell (2000)
highlighted the two distinct types of system change. First-order change involves changing
inputs and outputs within the existing established framework of the system. This type of
change can therefore be understood by using the concepts from the theory of species
evolution, as this theory focuses on evolutionary change that occurs within the system
boundaries. Second-order change, which involves the modification or restructuring of the
whole system, will be addressed through the use of concepts from punctuated equilibrium
and chaos theory, which are discussed in the following section.
2.5.2 Transdisciplinary Theories
In addition to the General Systems Theory that is being used as a framework for
understanding tourism destination change, a second transdisciplinary theory is relevant for
this study: the General Theory of Evolution. This transdisciplinary theory is the umbrella
term used for a number of overlapping theories that were developed within various
individual fields during a similar period of time (Laszlo, 1991). These theories, that have
been applied within other domains, include Chaos Theory (Gleick, 1987; Abraham, 1991;
Laszlo, 1991; Loye, 1991; Gilgen, 1995; Goerner, 1995), Evolutionary Theory
(Waddington, 1975; Ho & Saunders, 1979; Prigogine & Stengers, 1984), Transformation
Theory (Loye, 1991; Malaska, 1991), Nonequilibrium (Thermodynamics) Theory (Artigiani,

Noreen Breakey Tourism Destination Development
Chapter Two – Theories on the Processes of Change 96
1991; Loye, 1991), (Complex) Dynamical Systems Theory (Abraham, 1991), and
Punctuated Equilibrium (Eldredge, 1972; Eldredge & Gould, 1972; Gould & Eldredge,
1977; Eldredge, 1986, 1995; Wollin, 1995). These theories can be united under the banner
of General Theory of Evolution as they move beyond the linear, mechanistic approach of the
classical Newtonianism that has driven science over the last three centuries, to a nonlinear
approach which incorporates complex and chaotic aspects into the study of open, dynamic
systems (Laszlo, 1991).
Two theories that are both within the General Theory of Evolution and are applied in other
domains are relevant for the further understanding of the change processes that occur within
tourism destinations. These theories, Punctuated Equilibrium, and Chaos Theory are used in
fields from engineering to ecology and business. They will now be introduced and their
application to tourism reviewed.
2.5.3 Punctuated Equilibrium
The Punctuated Equilibrium theory was identified within the field of bioevolution (Eldredge
& Gould, 1972) and has been applied within the social sciences (Levinson et al., 1978;
Tushman & Romanelli, 1985; Gersick, 1988, 1991; Wollin, 1995). The punctuated
equilibrium change paradigm proposes that systems remain relatively stable for prolonged
periods (equilibrium) with rapid revolutionary change occurring periodically (punctuations).
An important concept of punctuated equilibrium is that in some cases the variable measured
may exhibit the punctuational pattern. Alternatively the pattern may appear to represent
gradual change. However if this variable is separated into its component parts, the pattern
for these parts may well be punctuational. The sum of these component punctuational
patterns results in the overall ‘gradual’ pattern.
This is particularly relevant for understanding the change pattern produced by the
development of a tourism destination. Even where a change appears to be gradual, it may be
hypothesised that punctuations underlie the smooth destination pattern.
Noreen Breakey Tourism Destination Development
Chapter Two – Theories on the Processes of Change 97
2.5.3.1 The Development of the Punctuated Equilibrium Paradigm
This step-by-step concept of change emerged from multiple fields, including the study of
change in individuals, groups, organisations, scientific discovery, grand theory, and
biological species. The term was initially used to describe this pattern of change by the
biologists Niles Eldredge and Stephen Gould in the context of evolution as portrayed by
fossil records (Eldredge & Gould, 1972). The process of speciation was reviewed, resulting
in a ‘punctuated equilibria’ view of the history of life, with homeostatic equilibria only
rarely affected by rapid change (Eldredge & Gould, 1972). Within this bioevolution field,
evolution is depicted as a discontinuous multi-level process arising from the hierarchical
organisation of the stable genetic structures and the ecological environment (Wollin, 1995).
The genealogical hierarchy provides the sources of information that form the basis of the
functional system, while the ecological hierarchy establishes what information, both
conventional and innovative, is retained. This perspective provided the basis for punctuated
equilibrium, which incorporates both incremental and discontinuous change.
2.5.3.2 The Theory of Punctuated Equilibrium
Punctuated equilibrium is a proposal about the ‘mode’ of evolution (Gould & Eldredge,
1977). Conceptualising change from a punctuation view establishes long term evolution as
the culmination of equilibrium and revolution. The interrelation between these two states is
determined by the highly durable underlying order. This order was termed ‘deep structure’
by Gersick (1991), as it fitted the description used to distinguish the deep structure of a
sentence from its surface structure (Chomsky, 1966). The punctuated equilibrium concept is
therefore based on the three components: deep structure, periods of equilibrium, and periods
of revolution.
The deep structure of a system is stable during the equilibrium state and in fact limits
change. It is composed of multiple dimensions, including knowledge, organisation, and
social culture. Inherent in this theory of change are the hierarchically structured
characteristics of these dimensions. Certain aspects of each dimension are more
fundamental to the system structure than others. These fundamental aspects of the deep
structure are resistant to change (Wollin, 1995) and cause the prolonged periods which allow
only incremental adaptions to the system (Gersick, 1991). Within biology the deep structure
encompasses the genealogical hierarchy (Gersick, 1991).

Noreen Breakey Tourism Destination Development
Chapter Two – Theories on the Processes of Change 98
According to the punctuated equilibrium theory, revolutionary change in a system results
from the inter-dependant interaction between the deep structure of the system, the wider
environment, and the actions of those within either the system or the wider environment
(Wollin, 1995). During the revolution stage, the deep structure disassembles and
reconfigures. A change is only a revolutionary punctuation if the deep structure is
fundamentally transformed (Gersick, 1991). As punctuations are significant reconstructions
of the fundamental aspects of the deep structure of the system, the punctuation can be
considered a process of change.
The punctuation commences with purposeful action from either within the system or from
the wider environment. The action can trigger change if not constrained by the existing
deep structure of the system, or the wider environment. This initial stage of the
revolutionary change generates an irregularity that deconfigures the deep structure of the
system. Three significant types of purposeful action include innovation, changing
relationships with others, and choice or decision-making (Wollin, 1995). The second stage
of the punctuated change is the development of variations within the system, which occur
during the reconstruction of the deep structure. Thirdly, sorting may occur to establish
which variations are compatible within the reconstructing deep structure. This generates a
preferred deep structure. The final stage of stasis is the establishment of a new and durable
deep structure which then commences the next period of equilibrium (Wollin, 1995).
Understanding that the underlying principles of systems differ and are changeable, clarifies
that triggers that cause change in one system may not affect another, and that constant
drivers may not, in reality be constant (Gersick, 1991).
2.5.3.3 Differences between Punctuated Equilibrium and Traditional
Paradigms
The punctuated equilibrium theory of change is not attempting to replace the previous
gradualism approach to evolution. Instead it offers another pattern which may help explain
change within the complex natural world, and a broad “new interpretation of evolutionary
trends” (Gould & Eldredge, 1977 p.139).

Noreen Breakey Tourism Destination Development
Chapter Two – Theories on the Processes of Change 99
Punctuated equilibrium, as an explanatory mechanism for change, differs from traditional
thought on the process of change in three fundamental ways. Firstly, gradualist paradigms
consider change as a slow progression from form to form. Large changes are perceived as
simply the culmination of multiple small changes. Additionally, the traditional theories
imply that change is always possible, and simply waiting for the opportunity, or need to
adapt, rather than prevented as punctuated equilibrium suggests. Secondly, theorists
applying the concepts of punctuated equilibrium do not accept that systems of the same type
must develop in the same direction. Finally, the punctuation view is that the development
need not always be in a ‘forward’ direction (Gersick, 1991).
The theory of punctuation equilibrium offers explanations for previously unexplained
information, gaps or occurrences. Within the study of palaeontology, information that
indicates a punctuated equilibrium change process was previously considered imperfections
within the fossil record (Gould & Eldredge, 1977).
A notable limitation of traditional models is the minimal attention paid to the mechanisms of
change (Gersick, 1988). Significant to this study is that the punctuated equilibrium model
of system change recognises that strategic intervention can trigger revolution.
2.5.3.4 Application of Punctuated Equilibrium to Tourism Destinations
Within the social sciences the punctuated equilibrium model has been used to describe
change in individuals, groups/teams, organisations, industries, economics, technology, and
the philosophy of science (Gowdy, 1990; Mokyr, 1990; Gersick, 1991; Wollin, 1995).
Treatment of the change theory within the social sciences has ranged from a general
application of the overall concept of stability being punctuated by significant change, to
more detailed use of the underlying concepts, including the interaction of a system’s
hierarchies.
However, this theory has not been directly applied to the development of tourism
destinations. Despite this, the concept of change occurring in a step by step manner has
developed as an alternative to Butler’s classical Destination Area Life-Cycle model (1980).
Carter (2000; 2004) presents a Notional Episodic Model of Tourism Growth (Figure 2.13)

Noreen Breakey Tourism Destination Development
Chapter Two – Theories on the Processes of Change 100
that is based on the empirical study of tourism destinations. This model indicates that
growth is not always gradual and instead occurs in sporadic steps.
Figure 2.13 Notional Episodic Model of Tourism Growth. (Carter, 2000; 2004).
Episodic change can occur within a tourism destination in two ways. Firstly, the number of
visitors corresponds to the facilities on offer. This level of infrastructure is not usually
expanded gradually, as development occurs in definite steps. Secondly, visitor numbers can
demand extra infrastructure. The provision of these extra facilities often occurs in a burst of
development. The pattern of growth is therefore independent of whether destination growth
is supply or demand driven, as both options can result in sporadic change (Carter, 2000).
2.5.3.5 Relevance of the Punctuated Equilibrium Theory to this Study
The theory of punctuated equilibrium offers an explanation for sporadic revolutionary
change, which is not considered by either the life-cycle model or the theory of species
evolution. Punctuated equilibrium theory considers long-term change as the product of both
incremental changes, during the equilibrium state, and the dramatic change occurring during
the punctuation phase. In addition, punctuated equilibrium theory recognises that
differences in the fundamental deep structure of similar systems results in dissimilar

Noreen Breakey Tourism Destination Development
Chapter Two – Theories on the Processes of Change 101
responses to a change. Other significant aspects of this theory are the concepts that changes
may not always be in the forward direction, and that intervention can play a major role in
causing change.
Similar to species evolution, this theory focuses on the important role that the external
environment can have on parts of the system. Additionally both theories incorporate aspects
within the system that are resistant to change, as well as the role of the external environment
in constraining change.
A theme consistent to the three process of change theories is the role of innovation, whether
it be in early stages of development (Life-Cycle Theory), during the evolution of the
destination (Species Evolution), or in dramatic changes (Punctuated Equilibrium).
The Punctuated Equilibrium theory is an appropriate process of change theory for the study
of tourism destination change as it can explain how two different types of change can occur
within the system. These changes within a system have also been discussed (Section
2.3.2.1), as first and second order change (Ison & Russell, 2000). First-order change
involves changing inputs and outputs within the existing established framework of the
system. This is the adaptive change that occurs in the ‘equilibrium’ stage of the punctuated
equilibrium theory. However, the types of change that can occur during this phase are
presented in greater detail by the theory of Species Evolution (Section 2.5.1). The second-
order change that involves the modification or restructuring of the whole system. This is the
punctuation, that is addressed by the punctuated equilibrium theory. Concepts from chaos
theory also offer insight into the reasons why such dramatic change occurs. This theory is
presented in the following section.
2.5.4 Chaos Theory
Chaos Theory, or deterministic chaos, is the study of dynamic phenomenon with nonlinear
characteristics (Sardar & Abrams, 1999). This approach has been seen by some to challenge
Western, classical, linear science, which commenced with the ‘Newtonian paradigm’ focus
on deterministic and time-reversible laws (Prigogine, 1991). Chaos theory considers
dynamical systems that are not predictable. At high levels of complexity it is not possible to
distinguish randomness from order. Chaos theory recognises that nonlinear systems which
Noreen Breakey Tourism Destination Development
Chapter Two – Theories on the Processes of Change 102
exhibit unpredictable random activity may in fact be highly complex and organised (Vilkins,
1993). The perception is that a system whose behaviour cannot be explained by a classical
set of equations, is not necessarily random, as the real level of complexity may not be
incorporated into the equations (Briggs & Peat, 1989).
Since the beginning of the 1960s, scientists and researchers from varying disciplines have
discovered concepts which question the roots of traditional, reductionist science (Vilkins,
1993). These discoveries are linked together under the umbrella term Chaos theory, and
include Catastrophe theory (Thom, 1975), Evolutionary theory (Prigogine & Stengers,
1984), Transformation theory (Loye, 1991), Nonequilibrium theory (Loye, 1991), and
Complex Dynamical Systems theory (Abraham, 1991).
Aiming to increase awareness of the growing concept of deterministic disorder Li and Yorke
(1975) published a paper titled ‘Period Three Implies Chaos’. An important point made in
the report was that science deems reality as ordered with pockets of disorder, when it may
really be order existing in a chaotic reality. This is illustrated by the fact that low-order
deterministic systems can still generate exceedingly complex and unpredictable behaviour
that can appear to be chaotic or random (Vilkins, 1993). The significance of the title of the
paper was that the term ‘Chaos’ became the word used for the associated theories regarding
deterministic disorder (Gleick, 1987). If classical science is the study of order, chaos starts
where classical science finishes. The classical science view is a mechanistic model of
reality. In comparison chaos theory sees reality “as infinite, irreducible to one thing,
heterogeneous, multifaceted and ongoing...creative in contrast to unchanging, and directed
with time rather than timeless” (Vilkins, 1993 p.ii).
Any system can behave very differently if instead of being at or near equilibrium, it is
operating in nonequilibrium conditions. As the system moves away from equilibrium the
descriptive equations change from linear to nonlinear. These nonequilibrium conditions
generate complex dynamics, multiple choices (bifurcation), and the opportunity to self-
organise (Prigogine, 1991).
Levels of chaos in non-linear systems have been categorised, as ‘Stable System’, ‘Dynamic
Chaos System’, or ‘Totally Turbulent System’ (Nilson, 1995); ‘Low Dimensional Chaos’ or
‘High-Dimensional Chaos’ (Elliott & Kiel, 1997); and ‘Weak Chaos’ or ‘Fully Chaotic’

Noreen Breakey Tourism Destination Development
Chapter Two – Theories on the Processes of Change 103
(Mathews et al., 1999). In reality, non-linear systems are likely to be on a continuum
determined by the susceptibility of the system to chaotic behaviour (Russell, 2000). This
allows for the combination of both ‘structured’ and ‘anarchic’ processes to occur
concurrently (Pinfield, 1986).
As chaos theory proved useful in fields of research as diverse as weather prediction, moth
populations, the clustering of stars, and heart attacks (Gleick, 1987) it became apparent that
natural systems can be non-linear. As interaction involving human beings is significantly
more complex than systems such as the weather, it can be assumed that relations between
humans are most probably non-linear (Nilson, 1995). Chaos theory is therefore a
prospective approach appropriate for the study of activities that involve the complex
interaction of human, economic, and natural systems, such as tourism.
Utilising chaos theory requires a holistic approach. The object of study is dynamic systems
and their continually fluctuating sub-systems (Vilkins, 1993).
2.5.4.1 Application to the Social Sciences
Science is not external to society. Science affects society and in turn is effected by it. Due
to the prominent role of technological success, science now plays a major role in social
attitudes, thinking, and decision-making. Developing a social theory from the concepts of
chaos theory provides a ‘meeting ground’ for both science and the humanities (Vilkins,
1993).
Approaching the study of society from a chaos perspective requires application of the
principles and concepts at a philosophical level, rather than as a quantitative science (Ruelle,
1991). In order to quantitatively study chaos within a system it is necessary to understand
the systems’ dynamics. Equations of evolution can be defined for systems such as solar
astronomy and hydrodynamics. However, biological and social systems change in ways that
cannot be precisely gauged, as the dynamics are complicated, and the change patterns
themselves can evolve (Vilkins, 1993). According to Burlingame, Fuhriman and Barnum
(1995) the main concepts within chaos theory which lend themselves to conceptualising the
complexity of the human process are nonlinearity, multiple interactive parts and system
evolution.

Noreen Breakey Tourism Destination Development
Chapter Two – Theories on the Processes of Change 104
2.5.4.2 Chaos Theory Concepts Applicable to Tourism Development
Application of chaos theory usually involves the determination of complicated equations
that can be used to understand and predict the behaviour of complex and dynamic systems.
This is an important contribution of this theory as it incorporates factors that would have
previously been considered ‘background noise’ and eliminated in order to identify the ‘true’
picture (Parry & Drost, 1995).
To date, the significant number of parts and interrelations that operate within a single
tourism destination system does not allow the calculation of equations to describe all the
change that can occur. Applying chaos theory to tourism therefore results in an application
of the underlying concepts within the theory. Five such concepts that can assist in
understanding the development of tourism destinations have been identified by Faulkner and
Russell (1997). These concepts are the butterfly effect, bottom-up synthesis or self-
organisation, lock-in effect, edge-of-chaos, and bifurcations or multiple choices.
The Butterfly Effect:
Models based on ‘order through fluctuations’ consider the significant role of small changes,
or fluctuations, to cause huge ramifications within unstable systems (Prigogine & Stengers,
1984). As this concept is based on small adjustments in input resulting in significant
changes it has also been termed ‘sensitive dependence on initial conditions’ (Gleick, 1987).
The common name, ‘the butterfly effect’, is due to the identification of chaos within
meteorology by Edward Lorenz in 1960, and his exaggeration of this concept, indicating
that the fluttering of a butterfly’s wings in could result in dramatically different weather
patterns in far-reaching parts of the world (Briggs & Peat, 1989). The butterfly image
(Figure 2.14) is synonymous with chaos theory as it highlights one of the critical concepts
presented by this theory: the holistic nature of dynamic systems which allows a small
change to cause significant results because of the organismic relations between the
components (Vilkins, 1993; Sardar & Abrams, 1999).

Noreen Breakey Tourism Destination Development
Chapter Two – Theories on the Processes of Change 105
Figure 2.14 The Butterfly Effect Image. The symbol associated with Chaos Theory, as it illustrated the fine structure that occurs within an apparently disorderly data stream (Gleick, 1987).
The ‘butterfly’ concept had previously been proposed within Catastrophe Theory (Thom,
1975). This theory, which developed as a special branch of dynamical systems theory,
focused on the manner in which continuous action produced a discontinuous outcome. One
aim of Catastrophe Theory was to understand the situations in which change results in
‘catastrophes’, or abrupt changes (Thom, 1975). The study was of phenomena that
exhibited sudden shifts as a result of a small change in circumstances (Briggs & Peat, 1989).
Despite widespread application in the physical, biological and social sciences Catastrophe
Theory was limited by the lack of quantitative prediction. Although the change and
complexity of tourism systems cannot currently be quantified, the catastrophe concept is still
applicable to understanding tourism destination change.
Within classical science very small influences are often simply neglected as the basis is in
approximation and convergence (Gleick, 1987). Small changes are not expected to result in
large effects and are generally deemed noise or error (Briggs & Peat, 1989). Random
fluctuations are expected to average out and divergence in an experiment is seen as a failure
of methodology. Determinism assumes that given an approximate knowledge of initial

Noreen Breakey Tourism Destination Development
Chapter Two – Theories on the Processes of Change 106
conditions and a knowledge of natural law it is possible to predict approximate behaviour of
a system (Vilkins, 1993).
The significance of the butterfly effect is that it raises the question of why a small change
can generate significant effects. Instead of ignoring the fluctuations chaos theory embraces
both them and the unstable conditions that allow such significant repercussions (Prigogine
& Stengers, 1984).
An aspect of the butterfly concept is the disproportional sensitivity of elements within a
system to a small change. Certain elements may change drastically, others slightly, while
some may not change at all (Smith, D. R., 1995).
The tourism example of a small change resulting in a dramatic change provided by Faulkner
and Russell (1997) in their application of Chaos Theory to tourism, was the change in the
state gambling restrictions in the US, which lead to the development of Las Vegas. As will
be discussed in Chapters Four and Five, changing non-tourism specific regulations can
affect the industry significantly. In the late 1970s the Queensland government abolished
death duties. Combined with the existing building and investment climate this change
contributed to the unit building boom on both the Gold and Sunshine Coasts.
Bottom-Up Synthesis / Self-Organisation:
Within the biological world, pattern develops from within what appears as formlessness. A
living organism is able to create and impose order upon itself (Gleick, 1987). In a similar
manner chaos can create a new order that is infinitely complex (Briggs & Peat, 1989).
Bottom-up synthesis implies organisation that incorporates aspects of the system working
from internal guidelines to establish an order appropriate to all. This is significantly
different from organisation that is top-down and controlling (Russell, 2000). Even if
turbulence seems chaotic on the macro level, it can be actually highly organised on the
micro level (Prigogine & Stengers, 1984). Self-organisation is considered an element of
dynamic, open and living systems (Vilkins, 1993; Russell, 2000). The ability to self-
organise addresses the apparent paradox of the Second Law of Thermodynamics, which
expects continual and increasing entropy, despite matter becoming increasingly organised
(Waldrop, 1992).

Noreen Breakey Tourism Destination Development
Chapter Two – Theories on the Processes of Change 107
In the tourism industry self-organisation occurs between the various destination operators,
with some in competitive relations, while other combine in cooperative relationships
(Faulkner & Russell, 1997).
Lock-In Effect:
Certain elements of a system have a greater ability to withstand change and thereby restrict
change. This ‘lock-in effect’ recognises that aspects of a system may remain unchanged
despite multiple periods of chaos and stability. These locked-in features are usually
entrenched in the basis of the system, immune to the changes, or inconsequential (Russell,
2000). The ability of these elements to prevent certain types of change relates to the deep
structure concept of the punctuated equilibrium theory.
A tourism example of this lock-in effect is Las Vegas remaining THE gambling city within
the US despite other states now allowing gambling (Faulkner & Russell, 1997). This ‘first
mover advantage’ was also evident in the abolishment of death duties in Australia.
Although other states followed Queensland in abolishing death taxes, the unit boom and
subsequent bust was most significant in Queensland. This also illustrates the ‘first mover
risk’.
Edge-Of-Chaos:
A system may appear to be in an equilibrium phase when it is actually ‘far from
equilibrium’ and ‘on the edge of chaos’. Illustrating this scenario is sand piled onto a table
to its maximum quantity. At this stage, it is difficult to establish the critical point when the
table will overflow with sand. Additionally, the magnitude of the response is not predicable.
The edge-of-chaos is therefore the state, which appears stable but is in fact ready to radically
change itself (Russell, 2000). This precarious state can be a desired state for business, as to
survive it is best to be as complicated as is workable, as this maintains an adaptable
structure. Consequently an aim is to determine the distance from equilibrium to the
threshold point at which fluctuations can cause a new type of activity within the system
(Prigogine & Stengers, 1984).
In tourism, technological developments have changed in transportation types, resulting in
tourists moving from a railway-based network to a car-based system (Faulkner & Russell,

Noreen Breakey Tourism Destination Development
Chapter Two – Theories on the Processes of Change 108
1997). One sudden change, such as a political coup in an idyllic tropical island can change
its entire tourism future.
Bifurcation / Multiple Choices:
While a system is at equilibrium or close to equilibrium, there is a continuing steady state
that is controlled by an established set of parameters (Prigogine & Stengers, 1984). When a
system is in a state of chaos there are various possible options and/or futures that present
themselves. Bifurcations have been classified as ‘subtle’ (change in type), ‘catastrophic’
(creation or deletion), or ‘explosive’ (sudden large change) (Abraham, 1995). Each
bifurcation can then lead to further bifurcations, as a bifurcation sequence is established
(Liebovitch, 1998).
It is generally not possible to predict the new direction, at either the macro or micro levels.
However, one factor may cause a particular branch to be selected. Additionally an
understanding of the history of the system may indicate the future state (Prigogine &
Stengers, 1984). As a number of future states are possible for a chaotic system, a single
deterministic set of equations cannot be used to explain the future behaviour of the system
(Vilkins, 1993). Early decisions during a chaotic stage have the most significant impact on
the type of stability that is reached.
In tourism, the initial introduction of a five star resort into a destination, such as the opening
of the Sheraton Mirage in the quiet fishing village of Port Douglas in North Queensland,
Australia, results in a transition to an alternate future direction, in this case the change to
upmarket clientele, and the subsequent additional provision of other five star products and
services. This illustrates how an early decision regarding the tourism destination results in a
particular path that may have been significantly different if the idea was not expanded upon.
2.5.4.3 Research Applying Chaos Theory to Tourism Destination
Development
Application of chaos theory to the tourism arena has focused on applying concepts from
within the theory to aspects or levels of tourism to assist in explaining and understanding the
complex phenomenon.

Noreen Breakey Tourism Destination Development
Chapter Two – Theories on the Processes of Change 109
Parry and Drost (1995) considered chaos theory appropriate for the analysis of the complex
and diverse hospitality industry. Limitations of the existing models and forecasting methods
are discussed in their paper, with the focus on the inability of traditional approaches to
incorporate all the important factors. Forecasts based on incomplete information may result
in huge differences over the medium to long term. A main reason for this is that the
important factors are eliminated on the basis of being ‘background noise’ (Parry & Drost,
1995). Chaos theory is presented as a possible new approach to understanding the
hospitality industry. A case study considering the application of the US ‘quality
philosophy’ to Japanese industry is used to highlight three main concepts related to chaos
theory. Firstly Parry and Drost (1995) believe the ‘butterfly effect’ should be accepted and
embraced rather than presuming that planning can avoid all negative changes. Secondly, the
concept of ‘chain reaction’ is used to explain the phenomenon where by a system that
appears to function randomly is really a self-generating, non-linear turbulence that allows
the significant expansion of one small idea. The final concept is the ‘tornado effect’, which
results in chaotic trends that can take an abrupt and unexpected change in direction that did
not occur in a similar situation in the past, or in a similar system (Parry & Drost, 1995). The
ability of a system to suddenly change direction is an important concept that provides the
basis for the composite model to be presented in the final section of this chapter.
Additionally this ‘tornado effect’ can assist in explaining why an external change can
influence two destinations in completely different ways.
The application of chaos theory concepts to tourism destinations was conducted by Faulkner
and Russell (Faulkner & Russell, 1997; Russell & Faulkner, 1999; Russell, 2000). An aim
of the research was to address the fact that chaotic factors are often overlooked when
describing tourism development. To achieve this, a main focus of the research was to
identify and understand the events and/or individuals that triggered significant change
within a tourist destination. Utilising the past development of the Gold Coast as a case
study, the research linked the various stages in tourism development to the activities of
individual entrepreneurs. The research clarified the important association between chaos
theory and entrepreneurship.
Concepts within chaos theory have also been applied to the tourism system by McKercher
(1999). His paper argues that tourism is a non-deterministic, non-linear system that cannot
be fully explained by existing tourism models. Chaos theory is presented as appropriate for

Noreen Breakey Tourism Destination Development
Chapter Two – Theories on the Processes of Change 110
understanding complex systems and the way they function. Concepts from chaos theory are
used as the base for a proposed Chaos Model of Tourism (Figure 2.15).
Figure 2.15 The Chaos Model of Tourism (McKercher, 1999)
An important implication of this model is the potential application at various levels, from
the multi-national scale, through the destination level, down to a single enterprise
(McKercher, 1999). This model divides the tourism system into nine main elements and
illustrates the inter-relationships between these elements. This model is another approach to
breaking down the tourism system into its’ significant parts (as discussed in Section 2.3.2.3).
A significant difference between this model and the other approaches is the inclusion of
‘Rogues’ or ‘Chaos Makers’. This is an element of the tourism system that can push it to
the edge of chaos. The focus on the agents of change is similar to the research by Russell
and Faulkner (1997), who focused on the link between chaos theory and entrepreneurs.

Noreen Breakey Tourism Destination Development
Chapter Two – Theories on the Processes of Change 111
2.5.4.4 Relevance of Chaos Theory to this Study
As chaos theory is a holistic approach to understanding unpredictable, non-linear, dynamic
systems, it is appropriate for the study of a developing tourism system within a destination.
The theory can be used to describe how a system is operating, but not how it will be in the
future. This is partially due to the fact that studying an aspect of society using chaos theory
is applying concepts at a philosophical level. Its use as a predictive theory is not possible at
this stage, as unlike the physical sciences, equations cannot be generated that explain the
dynamic social system.
Chaos theory is aimed specifically at systems that change, and the relation between changes
and their subsequent effects. It is therefore appropriate to apply the concepts of chaos
theory to the functional and organismic tourism destination system. The concepts within the
theory do not necessitate a system having a purpose, or simply existing. Consequently the
chaos theory offers important insight into tourism destination development not offered by
the previously presented process of change theories.
2.6 Evaluation of the Four Theories in Relation to the
Study of the Development of Tourism Destinations
This section is a two-part evaluation of the four process of change theories; Life-Cycle,
Species Evolution, Punctuated Equilibrium, and Chaos Theory. Firstly, this analysis will
highlight the concepts within each theory that are appropriate for understanding tourism
destination development. For each concept, a brief description of its implications for
understanding tourism destination change will be provided. Secondly, each theory will be
considered on the basis of its ability to explain the type of change that occurs within the
tourism system operating at a destination. This evaluation aims to increase the theoretical
basis for understanding how and why change occurs in tourism destinations, and provide the
basis for a composite model of tourism development, that will be presented in the final
section of this chapter.

Noreen Breakey Tourism Destination Development
Chapter Two – Theories on the Processes of Change 112
2.6.1 Concepts Offered by each Theory that are Relevant for Understanding Tourism Destination Development
As the development of tourism research is relatively recent, theories and models have been
borrowed from various disciplines. Because of this, they have limited application when
applied to tourism, as illustrated by the above discussion. It is the opinion of this author that
this is the appropriate time to review the way tourism is studied and to develop a model
which grows out of the complex issues within tourism, rather than attempting to fit tourism
to a model developed for another discipline. In doing so the proposed model does not
negate the value of the concepts presented in the above theories, but rather reorients the
thinking, to develop a model that has tourism as its primarily focus.
The analysis of the concepts from each four process of change theories are presented in
Table 2.5 to Table 2.8. The first column reintroduces the main concepts from each theory
that are appropriate for understanding tourism destination development. For each of the
concepts, a brief description of its implications for understanding tourism destination change
is provided, in the second column.
Some of these concepts and implications offer an explanation of the types of change that can
occur in tourism destinations. Other concepts and implications provide a rationale for why
change can occur in such varying ways. The concepts from each of the four theories all add
to the level of understanding of tourism destination change. The picture generated from the
combination of all of the concepts and implications provided the basis for the proposed
model.
Table 2.5 Concepts and Implications of the Life-Cycle Theory.
Main Concepts Implications Tourism destination growth can be plotted over time to establish a description of the growth pattern for that destination.
As this application has been extensively used, comparisons can be made between various tourism destinations.
Destinations may follow an ‘S-shaped’ growth curve (Butler, 1980).
This is a common growth pattern but variations are expected.
Exploratory tourism often results in more Involvement, which then leads to Development (Butler, 1980).
Understanding of the reasons WHY growth occurs will assist in explaining this process.
A destination’s life-cycle is the culmination of all the life-cycles of the individual companies and products offered.
Each component of a tourism destination system and the external environment can affect the life-cycle of the destination.
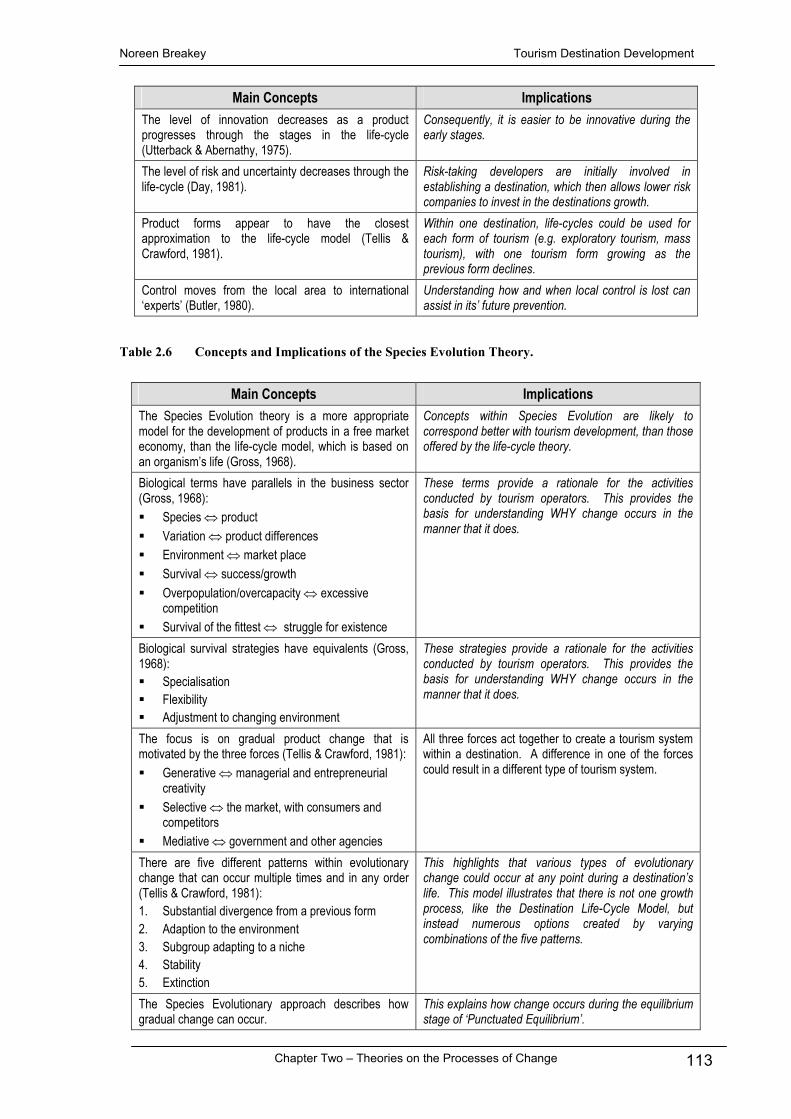
Noreen Breakey Tourism Destination Development
Chapter Two – Theories on the Processes of Change 113
Main Concepts Implications The level of innovation decreases as a product progresses through the stages in the life-cycle (Utterback & Abernathy, 1975).
Consequently, it is easier to be innovative during the early stages.
The level of risk and uncertainty decreases through the life-cycle (Day, 1981).
Risk-taking developers are initially involved in establishing a destination, which then allows lower risk companies to invest in the destinations growth.
Product forms appear to have the closest approximation to the life-cycle model (Tellis & Crawford, 1981).
Within one destination, life-cycles could be used for each form of tourism (e.g. exploratory tourism, mass tourism), with one tourism form growing as the previous form declines.
Control moves from the local area to international ‘experts’ (Butler, 1980).
Understanding how and when local control is lost can assist in its’ future prevention.
Table 2.6 Concepts and Implications of the Species Evolution Theory.
Main Concepts Implications The Species Evolution theory is a more appropriate model for the development of products in a free market economy, than the life-cycle model, which is based on an organism’s life (Gross, 1968).
Concepts within Species Evolution are likely to correspond better with tourism development, than those offered by the life-cycle theory.
Biological terms have parallels in the business sector (Gross, 1968): � Species ⇔ product � Variation ⇔ product differences � Environment ⇔ market place � Survival ⇔ success/growth � Overpopulation/overcapacity ⇔ excessive
competition � Survival of the fittest ⇔ struggle for existence
These terms provide a rationale for the activities conducted by tourism operators. This provides the basis for understanding WHY change occurs in the manner that it does.
Biological survival strategies have equivalents (Gross, 1968): � Specialisation � Flexibility � Adjustment to changing environment
These strategies provide a rationale for the activities conducted by tourism operators. This provides the basis for understanding WHY change occurs in the manner that it does.
The focus is on gradual product change that is motivated by the three forces (Tellis & Crawford, 1981): � Generative ⇔ managerial and entrepreneurial
creativity � Selective ⇔ the market, with consumers and
competitors � Mediative ⇔ government and other agencies
All three forces act together to create a tourism system within a destination. A difference in one of the forces could result in a different type of tourism system.
There are five different patterns within evolutionary change that can occur multiple times and in any order (Tellis & Crawford, 1981): 1. Substantial divergence from a previous form 2. Adaption to the environment 3. Subgroup adapting to a niche 4. Stability 5. Extinction
This highlights that various types of evolutionary change could occur at any point during a destination’s life. This model illustrates that there is not one growth process, like the Destination Life-Cycle Model, but instead numerous options created by varying combinations of the five patterns.
The Species Evolutionary approach describes how gradual change can occur.
This explains how change occurs during the equilibrium stage of ‘Punctuated Equilibrium’.

Noreen Breakey Tourism Destination Development
Chapter Two – Theories on the Processes of Change 114
Table 2.7 Concepts and Implications of Punctuated Equilibrium.
Table 2.8 Concepts and Implications of Chaos Theory.
Main Concepts Implications The Butterfly Effect : a small change can have significant effects (Prigogine & Stengers, 1984; Gleick, 1987; Vilkins, 1993; Russell, 2000).
Provides a rationale for why one change affecting a tourism destination system can have huge ramifications.
Bottom-Up Synthesis / Self-Organisation : a chaotic system can create its own order, which can appear turbulent on the surface, but is actually organised at the micro level (Prigogine & Stengers, 1984; Gleick, 1987; Briggs & Peat, 1989; Vilkins, 1993; Russell, 2000).
Explains the establishment and development of a destination without any top-down control, or single organising agent.
Lock-In Effect : elements within a system can possess the ability to withstand change, and thereby restrict change (Russell, 2000).
Offers an explanation for long-standing aspects of a destination despite monumental change within the destination or competing destinations.
Edge-Of-Chaos : a state that appears stable but is in fact ready to change radically (Prigogine & Stengers, 1984; Russell, 2000).
Assists in explaining why change can suddenly occur unexpectedly.
Bifurcations / Multiple choices / Chain Reaction : a selected direction limits possible options in the future (Prigogine & Stengers, 1984; Vilkins, 1993; Parry & Drost, 1995; Russell, 2000).
Early decisions in a developing destination limit the type of future tourism. These initial decisions are therefore crucial in establishing appropriate tourism for a destination.
Tornado Effect : an abrupt change in direction may not resemble a similar situation in the past, or in a current, similar system (Parry & Drost, 1995).
The ability of a system to suddenly change direction provides the basis for the composite multi-trajectory model to be presented in the final section of this chapter.
Main Concepts Implications Conceptualising change as Punctuated Equilibrium establishes long term evolution as the culmination of change during equilibrium (evolution) and revolution.
Combined with Species Evolution a composite theory can be developed which explains both the gradual change that occurs during equilibrium, and the dramatic punctuated change.
Deep structure resists change. A punctuation only occurs if the deep structure is reconfigured (Gersick, 1991).
This clarifies the significance difference between evolutionary change and a punctuation.
A punctuation is caused by purposeful action from within the system or from the wider environment (Wollin, 1995).
This assists in furthering understanding of how change occurs, rather than just focusing on the impact of the change.
The interrelation between equilibrium and revolution is determined by the highly durable underlying order (Gersick, 1991).
However what happens if no durable underlying order exists and the system continues to re-establish itself over and over?
Systems of the same type do not always develop in a consistent direction (Gersick, 1991).
It is therefore recognised that tourism destinations can develop differently.
Growth can occur in an episodic pattern. This is supported by the empirical research conducted by Carter (2000; 2004) that illustrates dramatic episodic tourism growth.

Noreen Breakey Tourism Destination Development
Chapter Two – Theories on the Processes of Change 115
2.6.2 Characteristics of the Theories that are Appropriate for the Study of Tourism Destination Development
Both the linear (Life-Cycle and Species Evolution) and the non-linear (Punctuated
Equilibrium and Chaos Theory) approaches offer tourism researchers useful models for
understanding the development of tourism destinations. As the classical Newtonian
paradigm is still the predominant scientific approach, linear models, particularly the life-
cycle concept, have been used extensively to describe the processes of change in tourism
destinations.
The Species Evolution theory is more complicated than the life-cycle concept but it is still
inherently a linear model. Its application to tourism development has been limited despite
incorporating a variety of non-sequential changes that eliminates a significant constraint of
the life-cycle concept. Many of the applications of the life-cycle model have augmented the
stages to fit the growth pattern of the destination under analysis. For example, Meyer-
Arendt (1985) separated the development stage into three phases, when attempting to fit the
life-cycle pattern to the Grand Isle, Louisiana, US. This variation could have been better
explained by the non-sequential and repeatable stages of species evolution theory.
Linear models can be applied suitably to linear systems, which by definition have
predictable action if information is known about the starting point and the operating rules
(Ward, 1995). However they cannot incorporate all the complexity or dynamism of
complex systems, such as tourism.
Each of the four theories possesses certain attributes, some of which are appropriate for the
understanding how change occurs within the open and dynamic system operating within a
tourism destination. Table 2.9 identifies attributes of each of the four theories on the
processes of change. The shaded sections indicate attributes appropriate for the study of
change within a tourism destination.
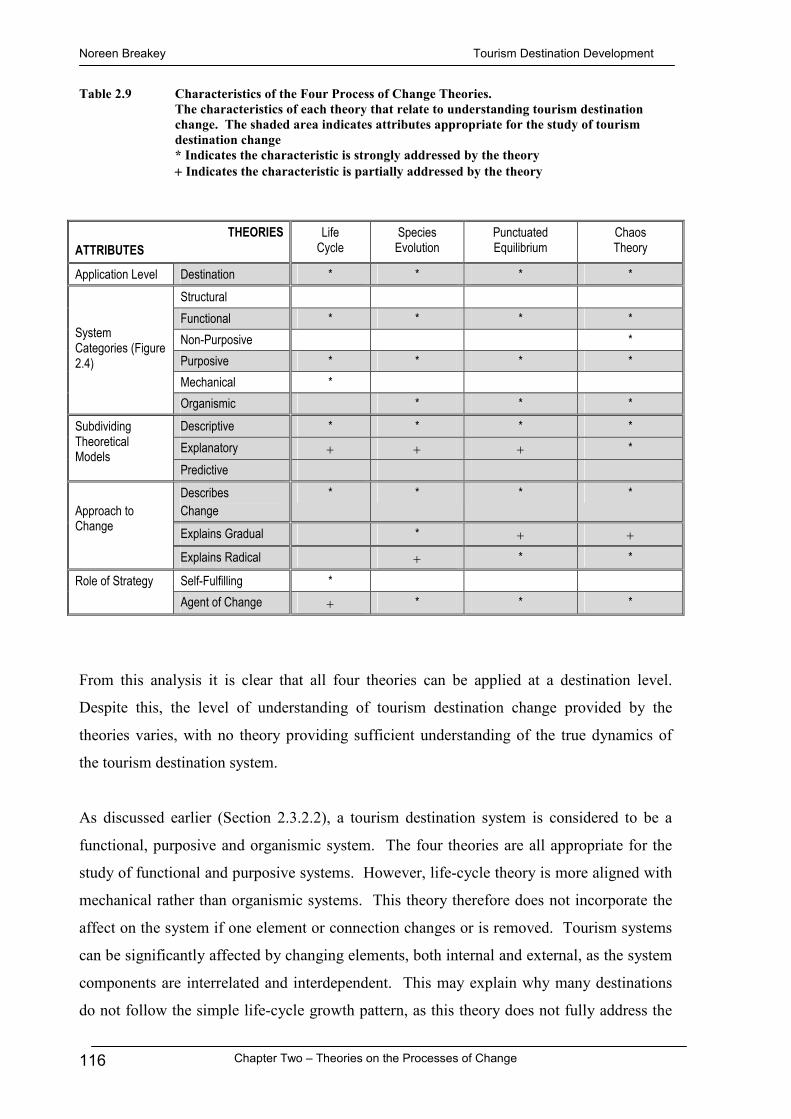
Noreen Breakey Tourism Destination Development
Chapter Two – Theories on the Processes of Change 116
Table 2.9 Characteristics of the Four Process of Change Theories. The characteristics of each theory that relate to understanding tourism destination change. The shaded area indicates attributes appropriate for the study of tourism destination change * Indicates the characteristic is strongly addressed by the theory + Indicates the characteristic is partially addressed by the theory
THEORIES
ATTRIBUTES Life
Cycle Species
Evolution Punctuated Equilibrium
Chaos Theory
Application Level Destination * * * *Structural Functional * * * *Non-Purposive * Purposive * * * *Mechanical *
System Categories (Figure 2.4)
Organismic * * *Descriptive * * * *Explanatory + + + *
Subdividing Theoretical Models
Predictive Describes Change
* * * *
Explains Gradual * + +
Approach to Change
Explains Radical + * *
Self-Fulfilling * Role of Strategy Agent of Change + * * *
From this analysis it is clear that all four theories can be applied at a destination level.
Despite this, the level of understanding of tourism destination change provided by the
theories varies, with no theory providing sufficient understanding of the true dynamics of
the tourism destination system.
As discussed earlier (Section 2.3.2.2), a tourism destination system is considered to be a
functional, purposive and organismic system. The four theories are all appropriate for the
study of functional and purposive systems. However, life-cycle theory is more aligned with
mechanical rather than organismic systems. This theory therefore does not incorporate the
affect on the system if one element or connection changes or is removed. Tourism systems
can be significantly affected by changing elements, both internal and external, as the system
components are interrelated and interdependent. This may explain why many destinations
do not follow the simple life-cycle growth pattern, as this theory does not fully address the

Noreen Breakey Tourism Destination Development
Chapter Two – Theories on the Processes of Change 117
various change forces inherent in tourism destinations or the affect of the external
environment on tourism growth.
All four theories are useful as descriptive models. They can all be applied for reviewing
past growth in a tourism destination and describing some of the change that occurred. The
theories also offer some level of explanation of the change, although the depth of this
explanatory role varies. Concepts that developed from life-cycle theory explain why many
aspects of a destination change throughout its life, including the product, tourist, developer,
local control, resources utilised, and the level of innovation. Species evolution also offers
some explanation of why the change occurs, correlating the reasons why biological change
in species occurs, to the environment of tourism destinations and the forces that act on and
within it. Punctuated equilibrium offers a significant explanation of why a particular type of
change occurs, explaining why change can occur in a dramatic and sudden manner. This
adds and explains the other type of change that is not addressed by the evolutionary life-
cycle and species evolution theories. Chaos theory provides explanations for changes that
are often considered variations or one-off situations by the application of the other three
theories to tourism destinations. The concepts from chaos theory are particularly
appropriate for understanding tourism destination change as they developed from analysis of
complex phenomenon. Each of these four theories therefore offers explanations for
different types of changes, which together can be used to build a more comprehensive
explanation of tourism destination change.
While tourism destinations are not driven by the decisions made by one individual, or a
collective united voice, the strategies undertaken by the various stakeholders can all affect
the growth of the destination. The role of strategy as an agent of change is incorporated by
the theories of species evolution, as the forces of change; punctuated equilibrium, as the
triggers of revolutionary change; and chaos theory, in its concepts of the butterfly effect,
self-organisation, and bifurcations. While life-cycle theory does consider the roles of
developers and innovation, the stages and their related strategies can be self-fulfilling. If the
strategies for a particular stage are implemented, then characteristics of that stage can be
generated, thereby creating the pattern rather than allowing the pattern to occur, potentially
in a different way.

Noreen Breakey Tourism Destination Development
Chapter Two – Theories on the Processes of Change 118
2.6.3 Outcomes of the Analysis of the Four Process of Change Theories
The analysis of the four process of change theories considered the main concepts from each
theory and their implications, which assist in understanding tourism destination change, as
well as a review of the characteristics of each of the theories that are appropriate for the
study of the complex system that operates as a tourism destination. There are a number of
important outcomes of this analysis.
The first outcome is that all four theories include important concepts that are relevant for
understanding tourism destination change, and have characteristics appropriate for the study
of destinations. Secondly, all theories are applicable for describing change and can be
applied at the destination level.
The most commonly applied theory to destination development, life-cycle theory, does not
incorporate the complexity of the interrelating components within the organismic tourism
system, or the opportunity to direct change, and ultimately affect the destination growth
pattern. This theory describes change but only offers limited explanation of the reasons for
the change occurring.
As a result there is a need to incorporate concepts from the other three theories into the
understanding provided by the life-cycle theory. Concepts from species evolution describe
gradual forms of change and concepts from punctuated equilibrium and chaos explain
radical change. Combining the concepts from the four process of change theories will
increase understanding of why change occurs, and how new directions for change can be
developed.
2.7 The Multi-Trajectory Model of Tourism Destination
Change
Analysing the four theories on the process of change resulted in two important conclusions.
Firstly, change can occur in variety of ways and therefore result in multiple patterns.

Noreen Breakey Tourism Destination Development
Chapter Two – Theories on the Processes of Change 119
Secondly, change can be unexpected, as it can occur at any time and may not follow a
predicted path.
The first conclusion, that change can occur in a number of ways, is illustrated by the
variation between the change patterns described in each of the four theories. Life-cycle
theory predicts the classical S-shaped growth curve. Species evolution presents five types of
change. These include introduction and elimination, as well as three other types of change
which are evolutionary and occur in varying order and frequency between introduction and
elimination. The punctuated equilibrium theory moves away from the evolutionary patterns
of the previous two theories, to illustrate that change can occur in a sudden and dramatic
manner. Finally, chaos theory assists in further explaining how and why these punctuated
changes occur. Chaos theory thereby provides a rationale for why change can generate
unpredictable patterns.
The second conclusion, that a change can be unexpected, is addressed by the two chaos
theory concepts of ‘edge-of-chaos’ and the ‘tornado effect’. The ‘edge-of-chaos’ concept
explains why change can occur at any time, with unexpected, radical change occurring in a
state that appeared stable. The ‘tornado effect’ illustrates that an abrupt change may not be
in an expected direction. Change in the past, and in similar situations, does not always
indicate what the new pattern of change will be.
Combining these two conclusions provides the basis for the components of a model for
describing how change can occur within a tourism destination. A tourism destination is a
dynamic system with multiple interrelated parts. Change to the destination system is
dependant on the culmination of all the changes that occur to or because of the component
parts. A detailed understanding of tourism destination change therefore requires analysis at
both the system and sub-system levels. Consequently it was necessary that the proposed
model therefore be parameter independent so this level of analysis could be undertaken.
In addition, a tourism destination can be defined at various geographical scales. For
international travel a continent or country maybe the destination. Alternatively a state,
region or local area may be considered a tourism destination. To ensure that analysis could
be conducted at any, or all, of these levels, the proposed model also needed to operate at
various scales.

Noreen Breakey Tourism Destination Development
Chapter Two – Theories on the Processes of Change 120
The Multi-Trajectory Model of Tourism Destination Change (Figure 2.16), proposed as a
hypothesis here, illustrates that at any given point in time destination change may occur in
five significant ways. The first option (Line 1, in Figure 2.16) illustrates total equilibrium,
where by the current growth level is maintained. The second option (Dotted lines 2,3,4) is
also in an ‘equilibrium’ phase, but there is gradual evolutionary growth occurring. Thirdly
(Line 5), the triggers of chaos are active, resulting in an episodic growth punctuation. The
fourth option (Dotted lines 6,7,8) is the reverse of option two, with a gradual change
resulting in negative growth. The final option (Line 9) is the opposite of option three, with
the forces of chaos causing a dramatic negative punctuation in the growth pattern.
Positive Punctuation Line 5
Positive Evolution
Line 2,3,4
Change Line 1 Point Equilibrium
(Possible Chaos)
Line 6,7,8 Negative Evolution
Line 9 Negative Punctuation
Figure 2.16 The Multi-Trajectory Model of Tourism Destination Change.
These types of changes can occur for any element of a tourism destination, or the destination
itself, irrespective of the geographical level of the destination.
This Multi-Trajectory Model of Tourism Destination Change combines patterns from each
of the four process of change theories presented in this chapter. During a destinations’ ‘life-
cycle’ the growth pattern may at times be in a state of complete ‘equilibrium’, undergoing
gradual positive or negative ‘evolutionary’ change, or within a ‘chaos’ induced
‘punctuation’ that is causing an immediate, and substantial increase or decrease in growth.

Noreen Breakey Tourism Destination Development
Chapter Two – Theories on the Processes of Change 121
2.7.1 Research Issues Developed from the Multi-Trajectory Model of Tourism Destination Change
Combining relevant concepts offered by the four theories on the process of change, allows
for advancement of our understanding of how tourism destinations develop, through the
application of the proposed Multi-Trajectory Model of Tourism Destination Change. There
are three research issues, and six sub-issues which result from this proposed model, the
demonstration of which would support the model.
The proposed model is designed to apply to various geographic levels, from the micro areas,
such as a Local Government Area, to the macro National and Global areas (Figure 2.17).
The further towards the macro scale the study area is, the greater the aggregation of the
component micro areas, resulting in a smoothing of data variables.
MACRO MICRO
Global National State Regional Local
Increasing Aggregation
Increasing Smoothing in Data Variables
Figure 2.17 The Geographical Levels.
The various geographical levels used for the collection of data variables, and the relationship between the levels.
2.7.1.1 Research Issue One - Area Aggregation > Data Smoothing
The first Research Issue states that: although tourism change can be analysed at various
levels, area aggregation results in data smoothing. An aggregate measure of tourism
change, while providing an overview, does not illustrate the underlying change and
complexity that occurs within a tourist destination, or the variation that may exist within
sub-areas.
Although data smoothing is not a new concept relevant only to tourism change, it is
particularly important for furthering understanding of tourism destination development. As
discussed earlier in this chapter (Section 2.4.2.2), many studies of tourism destinations have

Noreen Breakey Tourism Destination Development
Chapter Two – Theories on the Processes of Change 122
focused on one or a small number of aggregate growth variables. Such variables, while
providing a general overview of growth, do not provide a detailed understanding of the
change that has occurred. Analysis of sub-areas can illustrate where and when specific
changes occurred and determine whether individual areas have followed the overall pattern
of growth, or whether this pattern is in reality the culmination of a number of different
growth patterns.
2.7.1.2 Research Issue Two - All Change Not Explained By Visitor
Numbers
The second Research Issue states that: all tourism destination change cannot be
explained by total yearly visitor numbers alone. In both the tourism industry and
academia, tourism demand as illustrated by visitor nights and numbers has been used as a
primary, or even single indicator of the level of tourism within a destination. As discussed
earlier in this chapter, the application of the destination life-cycle model (Butler, 1980) to
existing destinations often involved the use of data on total yearly visitor numbers in
isolation. This was partially due to the lack of available tourism data collected with
consistent methodologies and definitions over time and destinations. A more complete
picture can now be developed as the number of tourism data variables collected and the time
frame of this collection has expanded.
This second research issue has three sub-issues (Table 2.10). The first Sub-Issue considers
that the total number of visitors is not representative of all the sub-categories and therefore
does not show the underlying variation within these sub-categories.
Table 2.10 The Three Sub-Issues of Research Issue Two.
Research Issue Two Sub-Issue One The total visitor numbers does not show the underlying variation of sub-
categories Sub-Issue Two Yearly data obscures seasonal variation Sub-Issue Three Other data needs to be analysed alongside visitor numbers to determine the
effect of changing trends

Noreen Breakey Tourism Destination Development
Chapter Two – Theories on the Processes of Change 123
Total visitor numbers or visitor nights are an aggregation of all types of visitors. As an
overall measure of tourism change, this measurement fails to illustrate the underlying
change, complexity, and variation that may exist within sub-classifications. This overall
measurement can be broken down in a variety of ways, such as origin of the visitors, type of
accommodation utilised, reason for travel, or product markets.
An increase in the total number of visitors does not necessarily mean that all the sub-
categories increased, as domestic visitation may have risen while international visitation fell,
or numbers travelling for holiday/leisure may have increased while business travel
decreased, or the number staying in hotels may have grown while numbers in caravan parks
may have dropped. Such underlying changes may be very significant for certain businesses
which cater to these sub-category visitors, such as inbound operators, conference facilities,
or caravan parks. This Sub-Issue further supports Research Issue One, as total visitor
numbers is an aggregation of the sub-categories.
The second Sub-Issue considers the use of yearly visitor numbers, as total visitor
measurements are often presented as a yearly total. This obscures the seasonal variation of
visitation that is inherent in the tourism industry and has significant impact on tourism
destinations. Tourist destinations often experience dramatic jumps and subsequent drops in
visitation depending on the season. This results in widely fluctuation occupancy levels for
accommodation providers and tour operators, as well as patronage levels for shops, and food
and beverage establishments.
An analysis of the seasonal variation in occupancy also provides an understanding of the
relation between the supply of accommodation and the demand by visitors. This establishes
whether there is an actual need for additional accommodation and assists in determining the
potential profitability of any new accommodation.
The third Sub-Issue proposed that other tourism-related data variables need to be analysed
alongside visitor numbers in order to determine the effect of changing trends on a tourism
destination. The pattern of visitation is not necessarily ‘the’ pattern of change for the
destination, as other variables may demonstrate alternate change patterns. For example,
some variables, including the length of stay of the visitors and their expenditure level have
significant impacts, such as on yield. In addition, the trend in occupancy is the combination

Noreen Breakey Tourism Destination Development
Chapter Two – Theories on the Processes of Change 124
of the forces of both supply and demand. These factors and their effects cannot be
determined by visitor numbers alone.
2.7.1.3 Research Issue Three - No Predetermined Pattern
The third Research Issue states that: there is no predetermined pattern of tourism
destination change. Instead of the expectation that a destination will probably progress
sequentially through the stages of the destination life-cycle, this Multi-Trajectory Model of
Tourism Destination Change illustrates that at any given time during its life, a destination
may ‘change’ to follow any one of the five trajectory options.
The outcome of this proposition is that the pattern of change in a tourism-related data
variable can exhibit any one of the five trajectories followed by a change to one of the other
four. This process can then be repeated over and over. The pattern of each data variable
over time would therefore be a combination of up to the five different trajectories occurring
in any order.
Within this Research Issue there are three Sub-Issues (Table 2.11) which relate to the pattern
of change in destination data variables, as proposed in the Multi-Trajectory Model of
Tourism Destination Change.
The first Sub-Issue states that: tourism-related data variables exhibit different patterns. If
there is no predetermined pattern, then tourism-related data variables will exhibit different
patterns over time.
Table 2.11 The Three Sub-Issues of Research Issue Three.
Research Issue Three Sub-Issue One Tourism-related data variables exhibit different patterns Sub-Issue Two The last stage does not predict the next stage Sub-Issue Three Trajectory lengths are not predetermined

Noreen Breakey Tourism Destination Development
Chapter Two – Theories on the Processes of Change 125
With respect to the Multi-Trajectory Model of Tourism Destination Change, the pattern of a
tourism-related data variable may not exhibit all five trajectory options during a particular
time period. The pattern of a variable may be a single trajectory or a combination of a
number of trajectories. Possible patterns include:
• The pattern shown by a data variable could be a single trajectory which occurs
continually over the time period analysed. The variable may be experiencing a period
of ‘positive evolutionary’ change or ‘relative equilibrium’.
• The pattern exhibited by another data variable may incorporate only gradual types of
change, fluctuating between periods of positive and negative ‘evolutionary’ change.
• Another alternative may be a data variable that increases in dramatic way. This would
generate periods of ‘relative equilibrium’ interspersed with ‘positive punctuations’.
This variable would therefore be exhibiting the standard Punctuated Equilibrium
pattern.
• A different variable may combine ‘evolutionary’ and ‘punctuated’ change trajectories.
For instance, growth may occur in a gradual manner, with decline occurring as a
dramatic decrease.
Different tourism-related variables within a destination may exhibit very different patterns
during the same time frame. Therefore the pattern of change displayed by a tourism
destination is ultimately dependant on the variable(s) considered. Focusing on total visitor
numbers may portray a different type of growth to the analysis of visitors from intrastate,
interstate, or overseas, or the type of accommodation provided.
However, this does not imply that all tourism-related time-series data will not illustrate any
corresponding trajectories or change points. For instance there is an obvious relationship
between the number of establishments and the capacity in a particular accommodation
sector.
The second Sub-Issue states that: the current trajectory does not have a predetermined life.
If there is no set pattern for tourism destination development, one trajectory option does not
last for a preset period of time. The internal and external forces operating on a specific
tourism destination system are different to both other destination systems and the past forces
that acted upon the destination. This results in a lack of order in stage progression, and
instead, an individualised length for each trajectory.

Noreen Breakey Tourism Destination Development
Chapter Two – Theories on the Processes of Change 126
The third Sub-Issue states that: the last stage does not predict the next. This Sub-Issue
follows on from the first Sub-Issue, which stated that there is no set pattern for tourism
destination development. If the pattern of change in the period analysed can be any one of
the trajectories of the Multi-Trajectory Model of Tourism Destination Change, or a
combination of these options, then one stage does not automatically follow another. Any of
the trajectory options may occur after the current pattern. In addition, certain trajectories
may take place multiple times during the life of a destination and others may never occur.
2.8 Redefining the Research Aim and Questions
Chapter One presented the preliminary research aim posed as the basis for the study as: to
understand how and why change occurs within a tourism destination.
The review of the literature on the four process of change theories illustrates the
applicability of concepts from each model for the study of tourism destination development
(Research Question One). Applying the knowledge accrued through this literature review
adds depth to the opening research aim. The research aim can therefore be reconsidered as:
to determine whether tourism destination change occurs as a combination of
equilibrium, gradual evolutionary changes, and dramatic punctuations caused by the
agents of chaos.
The concepts from each of the change theories form the basis of the multi-trajectory
composite model presented in the previous section (Research Question Two). Testing the
implications is therefore a test of the research model, based on the aim of the research.
The research aim above is considering the types of change that occurs within tourism
destinations. Conceptually, the question proposes that destination change is positively
affected by equilibrium periods, evolutionary types of change, and punctuated change
caused by chaos factors (Figure 2.18).

Noreen Breakey Tourism Destination Development
Chapter Two – Theories on the Processes of Change 127
Evolutionary Punctuated Change Change Caused by Chaos
+ +
Destination Change/Growth/ Development
Figure 2.18 Conceptualising the Research Aim.
As mentioned earlier in this section, the Multi-Trajectory Model of Tourism Destination
Change incorporates patterns from each of the process of change theories presented in this
chapter, thereby combining evolutionary change with punctuations and chaos factors. This
leads to the fourth research question, as to whether the model is an appropriate assessment
and combination of the concepts offered by the change theories, and is the model able to
assist in explaining and understanding the change that occurs during the development of a
tourism destination. In order to assess the applicability of this proposed model for
understanding tourism destination growth and its potential to assist in tourism destination
planning, Chapters Four and Five will present the empirical study of the case study system
(Research Question Four). This research will consider how the destinations at the different
levels of the tourism system have changed. Where possible the causes of this change will be
discussed. In addition the similarities and differences between the variables at the different
levels will be analysed.
To ensure understanding of the case tourism system analysis, Chapter Three outlines the
methodological basis for the study, the type of case study research conducted, and the
process involved in selecting the case system. Chapter Four will then provide a historical
context for the data presented in Chapter Five.
The development of the Multi-Trajectory Model of Tourism Destination Change and the
resultant Research Issues builds on the three theses and Research Questions identified in
Chapter One (Figure 2.19).

Noreen Breakey Tourism Destination Development
Chapter Two – Theories on the Processes of Change 128
Research Aim Theses (Section 1.3)
Research Issues(Section 2.7.1) Proposed Model Research Questions
(Section 1.3) Resolved
To increase understanding about the ways tourism
destinations develop (Section 1.1)
What concepts within existing theories on the processes of
change are relevant for studying the development of a tourism
destination?
Ch 2
That tourism is a complex system, not amenable to simple
modes of analysis
Can the devised and tested model of change in a tourism
destination be used predictively to assist planning and development
of a sustainable tourism destination?
That the observed patterns of tourism destination change can
be understood as the outcome of a multitude of smaller events that have a complex pattern of inter-
relationships
To understand how and why change occurs within a
tourism destination(Section 1.3)
To determine whether tourism destination change occurs as a combination of
equilibrium, gradual evolutionary changes, and
dramatic punctuations caused by the agents of
chaos (Section 2.8)
That the pattern and interaction of the tourism system operates at
varying scales which can be spatial and temporal, and involve
social, economic, and political variables
All Tourism Destination Change Cannot Be
Explained By Total Yearly Visitor Numbers Alone
Although Tourism Change Can Be Analysed At Various Levels, Area
Aggregation Results in Data Smoothing
Multi-Trajectory Model of Tourism
Destination Change (Section 2.7)
There Is No Predetermined Pattern of Tourism Destination Change
Ch 2Can a model of the processes of change in a tourism destination
be devised?
Can a body of data be assembled that allows the proposed model to
be applied to a case study tourism destination?
Does the proposed model hold when tested against change in
the tourism case study?
Figure 2.19 The Relationship between the Proposed Model and its resultant Research Issues, and the Theses and Research Questions developed in Chapter One. (Developed from Figure 1.3)

Noreen Breakey Tourism Destination Development
Chapter Three – The Research Process 129
Chapter 3 The Research Process
3.1 Overview of Chapter Three
This chapter describes the methodology used for this study. As the research purpose should
determine the research design and methods (Simon, 1969; Patton, 1990; Bryman, 1992)
there is no one ideal design for conducting research (Simon, 1969; Patton, 1990). Patton
(1990) defines five alternative purposes for research: basic research, applied research,
summative evaluation, formative evaluation, and action research. This study is considered
basic research as it seeks to contribute to fundamental knowledge and theory. This is
achieved through the development (Section 2.7) and testing (Chapters 4 and 5) of the
proposed model to further understanding of the phenomenon of tourism destination
development.
Each stage of the methodology of this study is determined by the requirements of the study’s
research aim and questions. The overall process is presented diagrammatically in Figure
3.1. This sets out the purpose of the research, incorporating the problem, aim, and questions
from Chapter One, the development of the proposed model from Chapter Two, and the ‘core
elements’ of the research process (Blaikie, 2000).
For each of the core elements there are a number of research options available. Selection of
a particular option is determined by the research purpose. The research options selected for
this study are discussed and justified in this chapter.
The research framework selected for this study is the Integrative Systems Model of Tourism
Theory and Planning (Getz, 1986). This research framework will be presented and its
impact on this study discussed in the first section of this chapter. The research design
chosen for this work is a case study approach. The justification of this selection, the type of
case study research utilised, and the process of selecting a case study is discussed in section
two. Data related aspects of the research process are addressed in section three, including a
discussion of the use of both qualitative and quantitative secondary data, the sources of this
data, and the methods of data collection and analysis.

Noreen Breakey Tourism Destination Development
Chapter Three – The Research Process 130
Research Problem Chapter 1
Research Aim & Questions Chapter 1
Development of Concepts, Theories &
ModelChapter 2
Research Framework3.2 Integrative Systems
Model of Tourism Theory & Planning
Research Design 3.3 Case Study
Form of Data 3.4.1 QualitativeQuantitative
Type of Data 3.4.2 Secondary
Data Analysis 3.4.3 Time-Series Analysis
Figure 3.1 The Stages of the Research Process. Research Stages {after Blaike (2000)} and the Research Options Selected for this Study.

Noreen Breakey Tourism Destination Development
Chapter Three – The Research Process 131
3.2 The Research Framework
Consistent with the use of a systems approach (Chapter Two), this work is based within the
framework of the Integrative Systems Model of Tourism Theory and Planning (Getz, 1986).
This model (Figure 3.2) is a tourism application of Chadwick’s (1971) Model of Systemic
Planning. Chadwick (1971) perceived the planning process as involving two directions of
enquiry which occur in parallel with each other. A focus of this conceptual planning system
is to understand the tourism system itself, its dimensions, and the relations between its
components (Getz, 1986).
Problem identification and solutions
Goals to pursueProblems to solve/avoid
Controlling thetourism system
Understanding thetourism system
problem solving
processes
research and
theory
goal formulation
system description, inventories, typologies &
classifications
continuous interaction
projection and evaluation
of goals
systems modelling(descriptive & explanatory)
whole system, subsystem & impacts
evaluation and selection of alternatives
system projection, forecasting,
alternative futures
control & implementation
control strategies needed to obtain desired futures
evaluation & feedback feedback
Figure 3.2 The Research Model used for this Work. The Integrative Systems Model of Tourism Theory and Planning (Getz, 1986), a Tourism Application of Chadwick’s (1971) Model of Systemic Planning.
Noreen Breakey Tourism Destination Development
Chapter Three – The Research Process 132
The first step of the Integrative Systems Model is ‘Understanding the Tourism System’
through a combination of ‘research and theory’ (Getz, 1986). As the aim of this study is to
understand the system that evolves at a tourism destination it is appropriate to use a two-
stage process that incorporates existing theory and empirical research. The first stage of
reviewing existing theory, presented in Chapter Two, considered various theories on the
process of change, that have been used to describe tourism destination development and its
causes. Concepts from each of these theories were then incorporated into a composite
model of tourism destination change. The second stage of empirical research is presented in
Chapters Four and Five. This research is conducted to test the proposed model against the
tourism destination development in the selected case.
The Integrative Systems Model of Tourism Theory and Planning aims to elicit conclusions
regarding the way that a tourism system could be controlled, and strategies for achieving the
planned goals (Getz, 1986). By aiming to increase understanding of how and why
development of a tourism system occurs in a destination this work intends to assist in this
process and provide the basis for further integrative tourism planning.
3.3 The Research Design
Having determined the overall aim and intention of this work and placed it within an
existing tourism planning model, the next decision became the selection of a research design
that would guide the empirical study. The research design is the ‘logic of enquiry’ used for
research and therefore defines the steps used to answer the research questions (Blaikie,
2000). The strategy chosen was case study research.
This section outlines the methodology of case study research, the reasons for its usage in this
study, and the process involved in selecting the case tourism system of destinations. The
case study approach chosen for this work is an instrumental, longitudinal comparative
approach to a case study system that incorporates a number of tourism destination sites at
various geographical levels. The outcome of the case selection process was the use of a case
that consists of the multi-level tourism system that incorporates the tourism destinations of
the three local areas of Noosa, Maroochy, and Caloundra, the Sunshine Coast region they
comprise, the State of Queensland, and the Nation of Australia.

Noreen Breakey Tourism Destination Development
Chapter Three – The Research Process 133
Social science researchers have a number of research designs available (Table 3.1). The
main options are experiment, survey, archival analysis, history, and case study (Yin, 1989).
The research design is primarily determined by the research question, its type/form, whether
control is required, and whether the study is historical or contemporary.
Table 3.1 Research Design Options.
The research design for a social science study is determined by the type of research question (Yin 1989). For this study a case study approach is appropriate as the research question fits the how, why, and what category, does not require control over events, and focuses on understanding a current phenomenon.
Strategy Form of Research Question
Requires Control Over Behavioural Events?
Focuses on Contemporary
Issues Experiment how, why Yes Yes Survey who, what, where, how
many, how much No
Yes
Archival Analysis (e.g. economic study)
who, what, where, how many, how much
No Yes/No
History how, why No No Case Study how, why No Yes
The case study research design is appropriate for how and why questions that do not require
control over events. The case study approach is therefore applicable for research aiming to
increase understanding of how and why tourism destinations develop and change.
Additionally control over the case would be both impossible and undesirable.
3.3.1 Case Study Research
Case study research is extensively used in the fields of law, education, history, business,
medicine, and psychology (Van Maanen et al., 1993). It can be considered the preferred
alternative to the impossibility of control experiments (Carter, 2000). The case study
approach can be utilised in any discipline which involves the study of complex and
unstructured problems (Easton, 1992).
Ultimately all studies of a social phenomenon are case studies, with specified time and place
boundaries (Van Maanen, 1998). The term ‘case study’ can be used to refer to the
methodological choice, the method of inquiry, the object selected for study, the process of

Noreen Breakey Tourism Destination Development
Chapter Three – The Research Process 134
learning about a case, as well as the ultimate product of the inquiry (Stake, 1994).
Additionally a case study can be an account of the current management situation (Bonoma,
1985). In relation to the development of a tourism destination, the case study may be an
account of the lack of overall management of change.
Instead of questioning ‘what is a case?’, the focus should be ‘what is this case about?’ (Van
Maanen, 1998). Each case is “particularistic, descriptive, heuristic, and inductive”
(Merriam, 1988 p.11). Specifically, within the social sciences, a case is considered to be a
unique, bounded, purposive, integrated, specific system, with functioning parts and
patterned behaviour (Stake, 1994). Studying a tourism system within a destination is
studying a case. Additionally, case study inquiry is an appropriate research method if the
study is of a phenomenon that cannot be easily separated from its context, and when the aim
is to identify casual relationships within the system and the wider environment (Yin, 1993,
2003). As the aim of this study is to identify the types of change/growth that occur during
tourism destination development, a case study approach can be utilised.
Case study research methodology does not have a specific, clarified framework. This
limitation may be partially due to the extensive range of fields in which it is used. It has
been claimed (Carter, 2000) that case studies, as research tools, lack rigor, and the results
and conclusions cannot justify scientific generalisation. However, case studies offer the
opportunity for developing and testing theory. As a result the context for the case study is a
vital part of the process and needs to be included in the resultant ‘case study’ (Carter, 2000).
The epistemological question of case study inquiry is ‘what can be learned from the single
case?’ (Stake, 1994).
Case study research can be classified within three distinct types: intrinsic, instrumental, and
collective (Stake, 1994). Intrinsic case study research is used to study a single case to
further information on that particular case. This can be clearly differentiated from using one
case to understand other cases. Application of the instrumental case study approach requires
the case to be selected and investigated to support and refine a theory. A collective case
study is an inquiry into a number of cases. It can be considered as an instrumental case
study of multiple cases, not the study of a collective. For an instrumental or collective case
study research the cases are selected on the basis that understanding them will further
understanding of a phenomenon, a population of cases, or a general condition (Stake, 1994).

Noreen Breakey Tourism Destination Development
Chapter Three – The Research Process 135
This study incorporates an instrumental case study research approach as it is an inquiry into
a case destination system. This type of case study is appropriate as the purpose of the study
is to build theory and understanding of the generic phenomenon of tourism destination
development.
Bouma (2000) outlines the basic types of case study research designs, which are defined by
the question posed by the study: simple, longitudinal, comparison, and longitudinal
comparison. A simple case study research design is appropriate when the aim is to
understand ‘what is going on?’ and to establish whether there is a relationship between two
variables within the case. A longitudinal case study considers change over time. For
example the focus may be on whether or not the relationship between two variables within
the case is the same at two different points in time. The comparative case study incorporates
two or more similar cases, and assesses whether the variables and the relations between
them are the same for each of the cases researched. Longitudinal, comparative research
considers the overall change in the cases over time, as well as change to the variables within
the cases, and the relationships between these variables (Bouma, 2000). In this research I
am aiming to test whether the changes in the selected case study are able to be explained by
the Multi-Trajectory Model of Tourism Destination Change which incorporates overall
destination development as well as change to variables and their relations, within the
different levels of the system. This work investigates one case, with the application of a
longitudinal, comparative approach to the various destination levels of the case system.
Case studies providing multiple evidences for empirical investigation (Robson, 1993)
reduces, but does not eliminate, the risk of bias (Yin, 1994). A case can be thought of as
one amongst others. The case study simply focuses on the one, even though the true interest
may be in a phenomenon or a population of cases, rather than the single case (Stake, 1994).
In this study I have focused primarily on multiple sets of quantitative data, with supporting
contextual qualitative information. This is in contrast to cases where significant qualitative
data is mixed with limited quantitative data. While some of the quantitative data may be
confounded, in most cases it represents an undisputed, objective measure of a relevant
variable over time and at a particular level. Although there are some limitations regarding
data time span and collection, the diversity of data allows the construction of a case study of
greater complexity and data density than is normally the case.
Noreen Breakey Tourism Destination Development
Chapter Three – The Research Process 136
In summary, research utilising case studies requires four main elements:
1. investigation is on contemporary phenomenon within their real-life context, when
2. boundaries between phenomenon and context are not clearly evident;
3. multiple sources of evidence are used (needed); and
4. research is part of a comprehensive research strategy, not just a data collection tactic
or a design feature (Yin, 1989, 1994).
These four elements are evident in this research. The data was collected from numerous
sources, and is used to establish the applicability of the proposed model, which aims to
increase understanding of the phenomenon of tourism, a relatively new field of research,
that operates within the wider social, cultural, economic, political, and environmental
context.
3.3.2 Case Study Selection
The object of this study is to understand the change that occurs during tourism destination
development. The selection of the case was itself an evolutionary process to ensure the
tourism destination(s) chosen provided the opportunity to test the proposed model and its
implications. This process passed through a number of phases of selection criteria and
possible destinations before the final tourism case system of destinations was decided upon.
The remainder of this section outlines this process.
The underlying rationale for this study is my interest in the appropriate management of
natural attractions that become a focus for tourism, and as a result require protection and
tourism planning to ensure sustainability. Consequently the focus was initially on both the
early stages of tourism destination growth and the use of destinations primarily based on
natural attractions. Testing the proposed model required historical data to identify changes
in the level of tourism which result in inflection points as one trajectory is replaced by
another. Therefore the initial criteria for destination selection were the existence of change
point(s), past/present change, historical information, and natural attributes. The locations
considered during this phase included Kakadu, the Kimberlies, and destinations funded
through the international ecotourism society. However the ‘history’ of a newly emerging
tourism destination is limited, both in terms of the short time frame, and available statistical

Noreen Breakey Tourism Destination Development
Chapter Three – The Research Process 137
data. It became apparent that the required cases needed to be existing, established
destinations.
The selection criteria were therefore reviewed and additional criteria considered. This
resulted in an expansion of the criteria to include destinations that had developed
significantly over the last 30 years, experienced a four to ten fold growth in visitation in the
past ten years, exhibited periods of smooth growth and/or staggered growth, incorporated
either keystone events or no apparent keystone events, and measurable changes in visitors
and other development indicators. A consideration at this time was whether to select
destinations that had already been described using Butler’s (1980) life-cycle model.
This developed into a detailed set of selection criteria and possible cases (Table 3.2). The
criteria included aspects that were considered necessary for all destinations, such as natural
attraction(s) and background information, and conditions that could vary across the selected
cases, including the level and type of development, and whether the destination had been
studied before. During this phase numerous destinations were being considered, with the
main eleven possibilities presented in the table.
Consideration was also given to the possibility of incorporating a number of locations at
different stages of tourism development. A conceptual model of the stages of growth
needed to be developed to provide a rationale for selecting destinations or potential
destinations at each of the stages. This Model of Developing Tourism Destination Systems
is presented in Figure 3.3. Prior to tourism development, a location may be considered
either overtly or covertly as a potential destination. This period is termed the ‘Pre-Tourism
System’ (Figure 3.3). If tourism, or a tourism enterprise, is deemed feasible the destination
progresses into the ‘Tourism System I’ phase where the aim is to attract tourists, and often
results in attracting investment and a need to manage the resources. This stage of
development may decline or flourish into a ‘Tourism System II’. At such time decisions
about the future type of tourism are made, whether as informed tourism planning, or as
unregulated, individual/corporate resolutions. Depending on these decisions the destination
will experience one of the change trajectories described in the proposed model developed in
Chapter Two. This results in a ‘Tourism System III’, which can take numerous forms
depending on the development trajectory that occurs.

Noreen Breakey Tourism Destination Development
Chapter Three – The Research Process 138
Table 3.2 Case Study Selection Criteria. The selection criteria developed during the case selection process, and the possible cases which were considered against the criteria.
While still incorporating the natural attraction component, a selection criteria was developed
on the basis of the Model of Developing Tourism Destination Systems (Figure 3.3). This
would include six case study destinations; two locations where tourism is being considered
(Pre-Tourism System), such as Lawn Hill and Lakefield National Parks, two destinations
where there is commercial tourism (Tourism System I), such as the Kimberlies, and two
destinations where tourism is established (Tourism System II), such as Kakadu, Broome,
and/or the Daintree.
Although this phase of the case study selection process appeared to be the ideal basis for
selection there is a significant lack of data on locations at the Pre-Tourism System and
Tourism System I stages, and where destinations are established (Tourism System II) data is
frequently collected at the regional rather than the local level. Consequently, for practical
reasons it became necessary to select destinations that are established tourism regions, with
defined boundaries used in the collection of long-term time-series statistical data.
Port
Doug
las
Whi
tsun
days
Gold
Coas
t
Kaka
du
Ayer
sRoc
k
Wes
tKi
mbe
rlies
Byro
nBa
y
Artic
/Ant
artic
a
Fiji
Ecot
ouris
mSo
ciety
Fund
edPr
ojec
t
Petra
A C C E S S (R equ ired )P hysica l � � � � � � � � �B ackg round In fo rm a t ion � � � � � � � �C on tacts � � � � � � � � � � � � � � �
N a tu ra l A t trac tions /C om ponen t � � � � � � � � � �D eve loped O ve r Las t 20 Y ea rs � � � � � � � � �G row th Leve l (4 -10 X ) � � � � � � �
M in im a l: e .g . tou ris ts us ing loca l fac ilit ie s � �D eve lop ing : e .g . lo ca l accom m oda tion � �D eve loped : e .g . ea rly m ass tou rism � � � � � � � �
G ene ra lly S m oo thS tagga red � � � � � � � � �K eystone E ven ts � � � � � �
P rev iously S tud ied � � �M u ltip le S takeho lde rs � � � � � � � � � � �S ign ifican t E x te rna l E ven ts � � � � �
O T H E R (V a ria tion )
P O S S IB L E C A S E S
SELE
CTI
ON
CR
ITER
IA
G E N E R A L (R equ ired )
LE V E L O F D E V E LO P M E N T (V a ria t ion )
T Y P E O F D E V E LO P M E N T (V a ria tion )

Noreen Breakey Tourism Destination Development
Chapter Three – The Research Process 139
Figure 3.3 Model of Developing Tourism Destination Systems. This model was developed to assist in the selection of appropriate case study destination(s) for this study.
In addition to the issue of the stage of development, the consideration of local or regional
destinations, particularly in Queensland, highlighted the various geographical levels of
tourism destinations. The higher aggregate levels, such as the Nation of Australia or the
State of Queensland, could provide information on the environment in which with a lower
level destination operates and develops. This would involve both the qualitative and
Pre- Tourism System
YES
SUCCESS
START
NO
Tourism System
IFAIL
Tourism System
II
Trajectory
STOP
Decline / Alternative
Development
Trajectory
Trajectory
Tourism System
III
Tourism System
III
Tourism System
III
Decisions affects possible trajectories for
Tourism System III
Is Trajectory Appropriate?Manage success Increasing Value
Attracts Tourists Attracts Investment Manage Resources
Select Appropriate Development
Trajectory

Noreen Breakey Tourism Destination Development
Chapter Three – The Research Process 140
quantitative aspects of the research as regional destinations evolve within the context of
State and National development, and statistical data collected at the regional destination
level is also available at the more aggregate levels.
By selecting a regional tourism destination in Queensland as the case study, it was realised
that it would be possible to compare the same variable at the three levels, determining
whether or not the region followed the patterns of change evident at the National and/or
State levels. If the pattern was followed, it could then be determined whether it was
significant at the regional level, and if the impact was immediate or delayed.
Although the regional destination level was selected partially because of data availability,
the initial investigation of the available quantitative data in Queensland highlighted the
availability of some sub-regional data. For many of the data variables being investigated
local level data was available, although not necessarily for the same length of time. The use
of local areas was considered important for this work, as it provided the opportunity to
investigate and compare the local level destinations. This would determine whether tourism
developed in similar ways and at similar times across the local areas, and whether external
influences had similar impacts on the local level destinations or whether the responses
differed. Change in variables could be assessed to determine whether it was common across
the National, State, regional, and local areas.
The Sunshine Coast destination with its three clear sub-regions, the Shires of Noosa and
Maroochy and the City of Caloundra was finally selected as the case study destination for
this work.
The Sunshine Coast destination region and its sub-regions are all located in Queensland.
Therefore the National and State regulations have been consistent for each over time, all are
potentially affected by large-scale external events, and the data collected at the different
levels across the State are comparable. In addition the three local areas comprise a coastal
and hinterland area. This similar natural environment and the attraction of the beach
provided a basis for the original establishment of tourism in each area. Despite these
similarities the development of each occurred in relative isolation, with varying periods and
types of change, and ultimately differing images, although all have been marketed as part of
the Sunshine Coast region since 1962.

Noreen Breakey Tourism Destination Development
Chapter Three – The Research Process 141
The case study being investigated is therefore a tourism system that is comprised of the
National and State levels, the region of the Sunshine Coast, and its three sub-regions of
Noosa, Maroochy, and Caloundra.
According to Wober (2000) two issues arise when analysing case study data: availability
and comparability. Selecting tourism destinations that are all located in Queensland/
Australia results in consistent methodologies which allow for comparison across the
different levels. Finally various sources of data are available on these destinations and many
are accessible.
3.4 Data Selection and Analysis
This section outlines the data required for the empirical work, the sources used, the data
collection requirements, and the methods used to analyse the data. This research uses
secondary qualitative and quantitative data. The qualitative information, presented in the
following chapter, provides the context and reasoning for the quantitative statistics analysed
in Chapter Five. These statistics are predominately time-series data that have been collected
by various governments departments and agencies, on numerous variables, including both
specific tourism attributes and other general indicators of change. The aim of this study and
nature of the quantitative data make time-series analysis appropriate. This method considers
the overall trend, seasonal variation, and the remaining fluctuations.
The data wherever possible has been collected over the same time period, for the three local
areas, the Sunshine Coast region, the State of Queensland, and the National level. This
allows for comparative analysis to establish the similarities and differences between the
types of change that occurred at the various levels of the system, as well as across the three
local levels. This also provides the opportunity to identify the resultant impact of external
influences at various levels of this tourism system.

Noreen Breakey Tourism Destination Development
Chapter Three – The Research Process 142
3.4.1 Multi-Method Approach - Qualitative and Quantitative
Tourism researchers have the opportunity to choose from a wide range of tools and
techniques from various disciplines to study tourism (Smith, S. L. J., 1995). To select
methods appropriate for studying tourism requires the acknowledgment that there is a
tradeoff between the various methods, and the need to select the option that can be most
suitably applied (Walle, 1997). Research into how a destination develops and why it
changes in the way it does requires a multi-method approach incorporating both qualitative
and quantitative elements. This multi-method technique has been selected as the appropriate
approach to address the aim of this study. Change in a destination can be measured using
quantitative techniques, but understanding the underlying reasons for the change requires a
qualitative approach.
Although the case study approach does not define the data required or the collection and
analysis methods (Goode & Hart, 1952), various methods for collecting information and
making observations are usually necessary for the in-depth investigation of a case study
(Hamel et al., 1993). This results in a number of methods, types of data, sources of
information, and treatment of empirical material. Additionally case study based research
can involve qualitative and/or quantitative data (Yin, 1989, 1993; Stake, 1994; Van Maanen,
1998; Yin, 2003). The multiple data, from different sources, may be collected and analysed
by various methods and the ‘case study’ provides a way of organising the data to understand
the phenomenon under investigation (Goode & Hart, 1952).
Qualitative and quantitative methods are generally accepted as effective and justifiable,
despite the fact that these approaches tend to exist separate from one another (Walle, 1997).
This independency is the result of both types of research being classified under alternate
paradigms (Brannen, 1992). More recently, the two approaches have become regarded as
complementary (Veal, 1997). Qualitative and quantitative methods have different strengths
and weaknesses (Patton, 1990). As the main ‘trade-off’ between quantitative and qualitative
inquiries is really a trade-off between breadth and depth (Patton, 1990), a multi-method
approach can ensure there is a certain level of breadth and depth.
The qualitative/quantitative distinction can be considered at the paradigm or method level
(Brannen, 1992). For this study qualitative and quantitative refers to the type of data

Noreen Breakey Tourism Destination Development
Chapter Three – The Research Process 143
required and the methods of data collection and analysis. Multiple methods can be
incorporated into one study in numerous ways (Miller & Crabtree, 2000), with both
qualitative and quantitative data collected in the same study (Patton, 1990). Bryman (1992)
identified six ways that qualitative and quantitative research can be combined. The
arrangement used for this study is ‘qualitative research that facilitates quantitative research’.
This involves the incorporation of qualitative research to provide ‘background information
on context’ (Bryman, 1992). As Gunn (1994 p.5) states “the nature of the information
needed should be emphasized, and then every principle, technique, and method most
appropriate for resolving that need should be tapped”.
The use of a quantitative method for tourism research is appropriate when the questions
posed can be suitably and conveniently analysed by these techniques. Such a method also
necessitates that adequate, rigorous data can be collected (Walle, 1997). The main
advantages of this scientific method are the methodological exactness of the techniques and
the expression of the output is in a quantifiable form. The tradeoff is that some research
issues may not be able to be addressed as the method is not an appropriate method of inquiry
for all issues (Walle, 1997). Quantitative research involves the identification and definition
of variables and variable categories (Brannen, 1992). This study uses quantitative
measurements of the change in numerous variables. Sources of quantitative data are natural
social settings, semi-natural settings, artificial settings, and social artifacts. Types of social
artifacts include official statistics, public documents, private documents, and personal
records (Blaikie, 2000). The researcher “looks through a narrow lens at a specified set of
variables” (Brannen, 1992). This illustrates why the qualitative context is vital in ensuring
that the quantitative data is placed in the ‘big picture’.
When the aim is to unearth relationships and/or patterns within the phenomenon under
investigation, description should ideally occur in conjunction with another research
objective (Smith, S. L. J., 1995). As this study seeks to understand tourism destination
change, qualitative data is used descriptively to understand why the change observed in the
quantitative data has occurred. The provision of the context of an evaluation is necessary as
it limits the possible interpretations and provides an explanation of divergent evaluative data
(Smith, N. L., 1995). Qualitative data collection methods include interviews, direct
observation, personal experience, and the analysis of artifacts, documents, cultural records,
and visual materials (Patton, 1990; Denzin & Lincoln, 2000; Miller & Crabtree, 2000).

Noreen Breakey Tourism Destination Development
Chapter Three – The Research Process 144
Document analysis in qualitative inquiry includes excerpts, quotations, entire passages from
organisational, clinical, or program records, personal diaries, and open-ended written
responses to questionnaires (Patton, 1990). For this study written accounts of both tourism
destination development and changes in the wider social, political, and economic systems
are used to provide understanding of the historical development that occurred. This includes
significant people, events, changes to regulations, and external influences.
3.4.2 Secondary Data
The terms secondary information and secondary data are used to describe empirical
information that has been collected by others (Stewart, 1984). It is collected either for a
general purpose, such as a national census, or for a particular research project (Blaikie,
2000). Large-scale surveys are particularly applicable for secondary analysis (Blaikie,
2000). Main sources of secondary data include government reports, industry or collective
studies, journals, and books (Stewart, 1984).
The primary advantages of secondary data over primary data are generally the lower costs
involved, the reduction in time needed to collect data, and the availability of routine data on
past situations. However the corresponding disadvantages are that usually the research aim
differs, the study is based upon different assumptions, certain issues may not have been
addressed, the manner of the questioning may not be suitable, and aggregation may result in
an unsuitable level of detail. Additionally it may be difficult to determine the quality of the
data as the primary research may be bias, the research design flawed, or the conclusions
produced unsound (Stewart, 1984; Smith, S. L. J., 1995; Blaikie, 2000).
Another disadvantage often associated with secondary data is its relevance as it may be ‘old’
(Stewart, 1984). This does not usually pose a problem for historical, comparative, or
theoretical research (Blaikie, 2000). Due to the purpose of this study, this aspect of
secondary data is not a disadvantage. In fact the further back in time the data series extends
the greater the potential understanding of how the tourism destinations changed over time.
Secondary analysis and secondary research are the terms used for the additional analysis of
existing information (Stewart, 1984). However ‘secondary analysis’ can be a misleading
term as although the data is from secondary sources the analysis is new (Smith, S. L. J.,

Noreen Breakey Tourism Destination Development
Chapter Three – The Research Process 145
1995). Secondary research can be similar to the original purpose behind the collection of
the data, but usually it is unrelated and aims to resolve an alternate issue (Stewart, 1984;
Blaikie, 2000). Secondary research may involve the reanalysis of one data source or the
integration of data from multiple sources (Stewart, 1984). The steps involved in secondary
research are the identification of data sources, obtaining the information, and evaluating and
integrating the data (Stewart, 1984).
As the researcher is one step removed from secondary data (Blaikie, 2000) any
inconsistencies within the data or the sources need to be investigated (Stewart, 1984). When
evaluating secondary information Stewart (1984) proposes six types of questions which
should be addressed:
1. What was the purpose of the study? Why was the information collected?
2. Who was responsible for collecting the information? What qualification, resources,
and potential biases are represented in the conduct of the study?
3. What information was actually collected? How were the units and concepts defined?
How direct were the measures used? How complete was the information?
4. When was the information collected? Is the information still current or have events
made the information obsolete? Were there specific events occurring at the time the
data were collected that may have produced the particular results obtained?
5. How was the information obtained? What was the methodology employed in
obtaining the data?
6. How consistent is the information obtained from one source with information
available from other sources?
One guideline for improving data quality is to ensure the use of reliable data collection
methods (King et al., 1994). Consistent procedures were applied to the National, State and
regional studies that produced the data for the tourism destinations investigated in this study.
Change in the methodology or classifications are available with the data.
Utilising multiple independent sources can also increase confidence in the data, presuming
similar data and/or conclusions have been found (Stewart, 1984). If disagreement between
sources occurs it is important to establish the rationale for any differences. Knowing
information about the data sources can often explain what initially appear to be
inconsistencies between varying studies. It can often be an operational definition that differs

Noreen Breakey Tourism Destination Development
Chapter Three – The Research Process 146
across the studies rather than the variable itself. If the reason for the differences cannot be
explained, the credibility of each source should be assessed (Stewart, 1984). It is especially
important to know about the primary data collection methods when the results are expressed
as percentages. A percentage is relative and as a result a large percentage change may
simply be the result of a small sample size (Stewart, 1984).
3.4.2.1 Secondary Data in Tourism
Tourism statistics are collected for numerous purposes, such as determining the
magnitude/significance/impact of tourism on a destination, assisting in future planning, for
marketing and promotion purposes, determining the effect on the balance of payments, and
establishing development activities (Burkart & Medlik, 1981; Latham, 1989; Wöber, 2000).
Collection of data on international tourism is often more readily available than for domestic
tourism, due to the role of international tourism as an export and the increased difficulties in
collecting data on national travel (Latham, 1989).
Statistical data which can be used to describe tourism destination development can be
broadly grouped into three types: the visitor, accommodation, and general indicators of
growth. Data on tourists/visitors has been categorised (Table 3.3) as relating to volume,
expenditure, characteristics of the tourist, and characteristics of the trip undertaken (Burkart
& Medlik, 1981; Latham, 1989).
The volume statistics are usually measurements of arrival, trips, and tourist nights, and are
often broken down further into the purpose of travel, such as business and leisure (Latham,
1989). The overall number of arrivals/departures/visitors is often used as the main indicator
of visitation, as discussed in Chapter Two. This data is most useful for transport carriers,
such as airlines, as the length of stay is not relevant to their sales. Total visitor nights is a
better measure of accommodation usage and the potential level of impact on the destination
as it incorporates the two components of visitor numbers and length of stay.
Visitor expenditure statistics provide a measure of the value of tourism to the area. This
variable is often separated into the type of expenditure, such as accommodation, meals,
entertainment, shopping, and travel (Latham, 1989). The calculation of the average

Noreen Breakey Tourism Destination Development
Chapter Three – The Research Process 147
expenditure per visit or night provides a general indicator of the type of visitors and the
typical spending pattern (Burkart & Medlik, 1981).
Table 3.3 Tourist/Visitor Statistics.
Common data variables which are measured over time.
The characteristics of the tourist are usually measurements of age, gender, occupation,
income, stage of life, group type, and the nationality/country of residence for international
visitors or state/city/postcode for domestic tourists. Some studies also consider the forms of
media used to access information, attitudes on past holidays/destinations visited, and holiday
planning (Burkart & Medlik, 1981).
The characteristics of the trip consider the multiple destinations that are often included in a
holiday journey. This usually provides measurements of origin, destination(s), timing,
purpose, mode(s) of transport, accommodation type, activities undertaken, places visited,
and type of trip (tour vs. independent travel) (Burkart & Medlik, 1981; Latham, 1989).
Type Category Sub-CategoriesArrivals / Visitor NumbersVisitor NightsLength of StayTripsAccommodationFood & BeverageEntertainmentShoppingTravelGenderAgeStage of LifeOccupationIncome BracketOriginTravel Party / GroupOriginDestination(s)PurposeMode(s) of TransportAccommodation TypeActivitiesPlaces VisitedType of TourTiming
Volume
Expenditure
Tourist Characteristics
Trip Characteristics
Visitor Statistics

Noreen Breakey Tourism Destination Development
Chapter Three – The Research Process 148
In addition to data on visitation, data is collected on the supply of tourism products in a
destination. This primarily relates to the provision of accommodation (Table 3.4), although
more resent studies have included tour operators, such as the Tourism Queensland Regional
Tourism Activity Monitor (R-TAM).
Table 3.4 Tourist Accommodation Statistics.
Common data variables which are measured over time.
The main measurements of supply are the total number of accommodation establishments in
a particular area, and the total number of rooms provided. The data is usually separated into
the different forms of accommodation, such as hotels and motels, units and flats, and
caravan parks.
The level of visitation, that is the demand by visitors to the destination, is also measured for
those staying in commercial accommodation. This is usually measured as the occupancy
rate for each form of accommodation. This variable, which is often provided on a monthly
basis is commonly used to illustrate the seasonality that exists in tourist destinations.
Data on the accommodation sector also provides indicators of the economic impact of
tourism. This is measured as the takings, or income received, as well as the level of
employment within this industry sector. Data on takings provides a second measurement of
monetary flows, in addition to visitor expenditure, discussed above.
Tourism in a destination usually develops alongside the general development of a the area.
As a result non-tourism data can still provide useful indicators of the growth within the
destination (Table 3.5).
Type Category Sub-CategoriesNumber of EstablishmentsNumber of RoomsNumber of Room NightsNumber of Bed NightsOccupancy RateTakingsEmployment
Economic
Accommodation Statistics
Supply
Volume / Demand

Noreen Breakey Tourism Destination Development
Chapter Three – The Research Process 149
Table 3.5 General Growth Statistics. Common data variables which are measured over time.
A main indicator of general growth is the increase in the local population. This variable is
often separated into age categories, which assists in determining whether the destination is
also attracting retirees as permanent residents.
Other indicators also provide data on the underlying economic climate, using economic
growth rates and interest rates, as well as the level of infrastructural development, as
indicated by the level of building activity.
Variables from all these categories will be presented and analysed in Chapter Five to
illustrate the changing levels of visitor demand, accommodation supply, and general growth
at the various levels of the tourism case study.
3.4.2.2 Limitations Associated with Tourism Data
Methodological problems can be associated with survey research and the situation becomes
more acute in the study of tourism (Latham, 1989). Problems associated with the collection
of data on tourists includes the high level of mobility inherent in tourism, and the interviews
are often conducted in unfamiliar places with crowds, noise, and unpredictable weather
conditions (Latham, 1989). Difficulties associated with analysing tourism include a lack of
credible data, high level of diversity among tourism businesses, the geographical nature of
tourism, and the lack of coherent organisation of the industry (Smith, S. L. J., 1995).
Analysis of tourism statistics is further complicated by the lack of comparability between
Type Category Sub-CategoriesPopulation Age Bracket
RegionEconomic Growth National
StateRegional
Interest Rates General Loan RateHome Loan Rate
Building Activity Residential vs. Non-residentialPublic vs. PrivateType, e.g. Hotels
Growth Statistics

Noreen Breakey Tourism Destination Development
Chapter Three – The Research Process 150
data, due to differences in the definition of the variables measured, as well as varying
methodology and procedures (Latham, 1989).
A difficulty associated with time-series tourism data is missing values. According to Wöber
(2000) the missing data situation for time-series data can arise in two ways: missing data
points or a missing variable. The second situation often arises as a result of amalgamations
during the data collection phase. However it is important to note that even an incomplete set
of data can provide insight into tourism activity at a destination (Wöber, 2000).
Domestic tourism is usually a much greater volume than international tourism and it is
likely that domestic levels are underestimated due to use of alternate accommodation and
travel to a wide variety of areas (Latham, 1989). The underestimation is compounded by the
fact that many tourism surveys often ignore day-trippers (Cockerell, 1997). As a result the
actual demand may be significantly underestimated (Wöber, 2000).
Additionally tourism statistics are usually estimates rather than exact values (Latham, 1989).
To ensure conclusions are sound it is recommended that a number of data sources are used
(Wöber, 2000).
In general, the tourism industry lacks “consistent, credible, and coherent data” (Smith, S. L.
J., 1995 p.2). It was realised in the early 1980s that there was a need for domestic tourism
data that incorporated the volume, value, and characteristics of tourism for a country and the
same information for its individual destinations (Burkart & Medlik, 1981). For this work,
where consistent collection makes it possible, tourism data variables have been collected at
national, state, regional, and local levels. This allows for a comparative analysis of the
trends and seasonality patterns at each level of the case, as well as between the three local
areas.
As previously mentioned, secondary research involves the identification of data sources,
obtaining the information, and evaluating and integrating the data (Stewart, 1984). As “we
are simply not capable of seeing things whole”, theories are built and tested on the
properties of things rather than the things themselves (Dubin, 1969 p.30). This necessitates
the establishment of criterion indicators for the quantitative time-series variables that make
up the destination system (Table 3.6). This also allows the relationships between the

Noreen Breakey Tourism Destination Development
Chapter Three – The Research Process 151
properties to be tested (Dubin, 1969). When analysing a variable the focus is on the amount
or degree to which the property is present within the system. Alternately, an attribute is a
property that is either present, or not present (Dubin, 1969).
Table 3.6 Data Variable Criteria.
The criteria used to determine the possible variables which could be collected, measured and analysed to assess the applicability of the proposed model in the tourism destination case study.
Criteria Sub-Criteria Measure/Basis of Calculation Sources of Secondary DataEconomic Criteria
Visitors - Domestic- International
Number of Arrivals Govnerment Statistical Sources
Visitor Spending Average Spending per Day per Visitor Govnerment Statistical SourcesProperty Ownership % of Local Residents to External Owners Govnerment Statistical SourcesEmployment Number of Positions - Full-time vs Part-
time/CasualGovnerment Statistical SourcesIndividual Businesses
Investment Amount and Type of InvestmentLevel of Innovation, Risk, Uncertainty, Control
Govnerment Statistical SourcesAustralian Bankers
Infrastructure Criteria
Accommodation Products Offered Number/Size of Businesses - Caravan Parks, Hostels, Hotels, Motels, Resorts
Govnerment Statistical SourcesBusiness Proposals
Other Tourism Products Offered Number/Size of Products - Attractions, Tour Operators, Information Centres
Govnerment Statistical SourcesBusiness ProposalsVisitor Information & Guides
Public Facilities Size & Type of Facilities Facility DevelopmentMarketing Criteria
Target Market / Product Markets BrandingPresentation of People & Activities
BrochuresGovnerment Statistical SourcesRTA Documents
Consumer Behaviour & Preferences Attractions Visited Govnerment Statistical SourcesLocal Visitor Surveys
Length Of Stay Average Number of NightsType of Booking Direct (Phone or Internet) or Travel Agencies Accommodation Providers
Access Location of Nearest AirportNumber of Airlines & Flights
FAA
Social Criteria
Local Attitude to Tourists Irritation Index Newspaper Articles
Local Employment % Local to TotalLocal Residents Numbers
Housing DevelopmentTelecommunications
Govnerment Statistical SourcesTelstra
Demographic Characteristics - Tourists AgeGenderOrigin
Govnerment Statistical Sources
Environmental Criteria
Natural Environment Amount of Land Govnerment Statistical SourcesAerial Photography
Quality of Environment Impact Assessments National ParksDevelopment Proposals
Of the quantitative methods of data collection described by Bryman (1992), the use of
official statistics provided a range of tourism and development variables measured over
time. The research process is enhanced by increasing the number of observations, which are
the ‘implications of the theory’ (King et al., 1994). The criteria for data collection is
observations for which data is available or can be collected. Additionally data does not need
to be at the same level of analysis. Instead different levels of aggregation, or various time
periods may be appropriate (King et al., 1994).

Noreen Breakey Tourism Destination Development
Chapter Three – The Research Process 152
3.4.3 Data Analysis
Social science research should aim to be both general and specific, as it should provide
understanding about classes of events and about specific events at certain times (King et al.,
1994). For analysis of change over time, time is in fact a proxy for other processes that
operate over time, as it is not time itself that produces the change (Simon, 1969). A
significant and common obstacle in the study of change over time is that change in the
dependant variable(s) may occur very slowly over a long period of change, and it may not
be possible to observe this entire period. Fortunately this is overcome where the data has
already been collected over time, as has been done for this study. This allows for the
analysis of the time series data, which aims to examine the data from successive periods to
locate and explain the changes that have occurred. Additionally quantitative research can
aim to identify relationships between two or more variables (Simon, 1969). This is an
important aspect of this study.
For qualitative historical data, the first step in the analysis is to summarise the data, with the
focus on generalisation and explanation (King et al., 1994). The qualitative data needs to be
organised into a “readable narrative description with major themes, categories, and
illustrative case examples” (Patton, 1990 p.10). According to King, Keohane, and Verba
(1994) the guidelines governing the summary of historical details are to focus on outcomes
that need to be described and/or explained, simplify the available information, and relate
back to the purpose of the summary and the audience. As qualitative and quantitative are
alternate but not mutually exclusive strategies for research, qualitative information may be
presented alone or in conjunction with quantitative data (Patton, 1990). For this work the
qualitative historical information (Chapter Four) provides the backdrop for the quantitative
time-series data (Chapter Five).
Statistics achieve two purposes. Firstly, to describe and organise large amounts of
quantitative data (descriptive statistics). Secondly, to allow inferences to be made from the
study area to the wider arena (inferential statistics). Although distinct, the two functions are
closely related, as making inferences about the larger population requires the efficient
description of the observed phenomenon (Levy, 1968). Chapter Five utilises descriptive
statistics to present the time-series data on the change in the destinations as tourism
developed. The final chapter (Chapter 6) considers the inferences that can be made about

Noreen Breakey Tourism Destination Development
Chapter Three – The Research Process 153
tourism destination development. This inference from the small number of observed
variables about the larger phenomenon provides generalisations rather than facts (Levy,
1968). These statements aim to increase understanding of the manner in which the tourism
system develops and operates, and can provide the basis for hypotheses that can be tested in
the future. The remainder of this section provides an outline of the methods involved in
analysing time-series data.
A number of different types of time-series data have been included in this research to ensure
an understanding of the development of tourism within the context of local development and
external influences. Of the seven time-series types discussed by Chatfield (1989) three are
used in this analysis: economic, marketing, and demographic.
There are four types of objectives of time series analysis (Chatfield, 1989). Firstly
description, which involves the plotting of data to realize simple descriptive measures,
including trend, seasonal variation, other cyclic changes, ‘irregular’ fluctuations, turning
points, and outliers. These measures are a particularly appropriate form of analysis when
the variation in the data is predominantly due to the trend and/or seasonality. The second
objective is explanation, which is appropriate for time-series analysis of two or more
variables. The variation in one variable is analysed to establish whether it describes the
variation in an alternate variable. Prediction is the third objective. This involves the use of
observed values of a variable to forecast future values. The final objective is control. This
is used for maintaining the ‘quality’ of the output of a process as intervention can occur if
the variable strays from the required value/range (Chatfield, 1989). The analysis of the data
variables for this study is based on the twin objectives of description and explanation.
Existing predictive time series data are included in the study as indicators of expected
tourism development within a destination but this work does not involve the use of past data
to forecast future values. The objective of control is not relevant to this work as the data is
not collected under the required conditions.
The descriptive analysis clarifies the main properties of a series, and should be tried before
using more complicated techniques (Chatfield, 1989). Descriptive analysis involves plotting
the observations against time. This is the first and most important step in time series data
analysis and requires consideration of the choice of scale, the size of the intercept, and the
use of a continuous line or separate dots. The second part of a descriptive analysis involves
Noreen Breakey Tourism Destination Development
Chapter Three – The Research Process 154
the decomposition of the variation in the series into the types of variation. This is
particularly useful when the variation is dominated by trend and/or seasonality, both of
which are relevant for this study. Trend is the ‘long-term change in the mean level’ and
includes all cyclic variation whose ‘wavelength’ is longer than the observed time series.
Seasonal variation is based on cyclical annual variation. The third variation is ‘other cyclic
changes’ which is a variation that cycles with a fixed period that is not annual. Finally there
are the variations that remain when the other three types of variation are removed from the
data. These may or may not be random and can be analysed through the use of moving
average or autoregressive (stochastic) models (Chatfield, 1989). It is important to note that
a ‘stationary’ time series implies there is no systemic change in mean (no trend) or variance,
and periodic variations have been removed. A stationary series then presents the ‘remaining
irregular fluctuations’ (Chatfield, 1989).
The stochastic process is a model that describes the sequential relationship between a
variable and time (Richards, 1979). This generates a one-dimensional time series with
evenly spaced observations, which becomes more complex if observations are not at regular
intervals. ‘Continuous’ data can be transformed into discrete data through sampling or
aggregation. This process deals with a system that is developing over time and describes the
way that the data series fluctuates over time or distance. The oscillations reflect a pattern of
serial correlation, or autocorrelation which can be used to illustrate dependency between
variables in a time-series at different lags (Richards, 1979).
A specific technique involved in the analysis of time-series data is to transform the data
(Chatfield, 1989). This transformation method is particularly relevant to the data collected
for this study as it deals with the significant effect of seasonality. The transformation makes
the seasonal effect additive or multiplicative. The additive transformation technique is used
when the seasonal effects seems to increase with the trend as it makes the seasonal effect
constant from year to year (Chatfield, 1989).
To determine the trend of the data two techniques are used, trend analysis and lowess
smoother. Trend analysis will fit a general trend model to time series data. This study
utilises both linear and polynomial models as required by the data. Trend analysis is
particularly appropriate when there is no seasonal or cyclical component in the data series
(Minitab Inc., 2005). For each trend line the R-squared value (coefficient of determination)

Noreen Breakey Tourism Destination Development
Chapter Three – The Research Process 155
or the Mean Absolute Percentage Error (MAPE) is displayed. The R-squared value ranges
from 0 to 1, indicating how closely the estimated trendline values correspond to the data
observations. The closer the R-squared value is to 1 the greater the relation between the
trendline and the data. The MAPE also measures the accuracy of the fitted trend to the data
and is expressed as a percentage, with a smaller value indicating increased accuracy
(Minitab Inc., 2005).
The LOWESS (LOcally-WEighted Scatterplot Smoother) method is used to fit smooth
curves to a data set. The smoothing method requires no predetermined model for the data
set (Upton & Cook, 2002). This study utilises Minitab Statistical Software to fit the lowess
smoothed line to the time series data. This technique is particularly applicable when the
curvature of the data observations does not change dramatically. The smoothing parameter
ranges between 0 and 1, depending on the level of smoothing required (Minitab Inc., 2005).
When using observations of two time series, to establish the relationship between them,
bivariate time-series analysis is utilised. This technique uses the mean and autocovariance
functions for each series, and the cross-covariance function and its related function, the
cross-correlation (Chatfield, 1989). This study utilises Minitab Statistical Software to
calculate the Pearson correlation coefficient between a pair of data variables to measure the
degree of their linear relationship. The resultant correlation coefficient can range from -1 to
+1. If one variable increases as the other decreases, then the correlation coefficient will be
negative. Alternatively, if the two variables increase together the correlation coefficient will
be positive (Minitab Inc., 2005). This method is particularly useful when the aim of the
study is to increase understanding as the analysis focuses on the interaction between
components of the system (Dubin, 1969).
Time-series data can also be presented as a percentage change on a past time period. This
percentage change ratio is defined as the ratio of the amount of change between two time
periods and is used to express the amount of change in a variable relative to the starting
value of that variable. It can be particularly helpful when comparing data as it takes into
account the size of the variable at the starting point. However caution needs to be exercised
as a small initial number can be paired with a large percentage change despite being a
relatively small increase (Loether & McTavish, 1988).

Noreen Breakey Tourism Destination Development
Chapter Three – The Research Process 156
In Chapter Five, a combination of these time-series analysis techniques are used. The
primary analysis is descriptive, using both data plotting and decomposition of the variation.
This is supported by transformation, trend analysis, lowess smoother, correlation, bivariate
analysis, and percentage change where appropriate.
3.5 Conclusion
This chapter has described the research process that was selected for this study of tourism
destination change. Each stage of the process (Figure 3.1) has been explained. The first two
stages, defining the research topic, problem, aim, and questions were established in Chapter
One and the third stage was defined in Chapter Two, with the development of the proposed
Multi-Trajectory Model of Tourism Destination Change.
The remaining six stages have been addressed in this chapter. The choice made for each
was discussed and the selection justified. The Integrative Systems Model of Tourism
Theory and Planning (Getz, 1986) was selected as the research model for this study. A case
study approach was considered the appropriate research design, given the overall research
aim to be addressed by this study. A multi-method approach incorporating both qualitative
and quantitative components was chosen to increase the level of understanding of tourism
destination change. Secondary data was selected to study past change in the tourism system
of destinations under investigation. The quantitative secondary data was time-series data
that could be represented and analysed using various time series techniques.
This chapter has therefore provided the basis for the qualitative investigation of the change
and development of tourism within the case system in the next chapter (Chapter 4), and the
quantitative time-series analysis of tourism-related variables from the case destinations
conducted in the subsequent chapter (Chapter 5).

Noreen Breakey Tourism Destination Development
Chapter Four – Destination Case System: An Historical Overview 157
Chapter 4 The Development of a Tourism System at a
Destination - An Historical Overview
4.1 Overview of Chapter Four
The previous discussion of models used in understanding tourism development showed how
various aspects of tourism can be viewed. Broadly speaking they were useful in their time,
but note that they had greater limitations as they tried to incorporate the increasingly
complex factors involved. This chapter describes the development of the tourism system
that encompasses a number of levels, from the three Local Government Areas; Noosa Shire,
Maroochy Shire, and Caloundra City, which make up the Sunshine Coast, continuing
through to the State, National, and Global levels. This history of tourism development,
within the context of its place in the overall history of Australia, shows just how many
factors affect tourism development and therefore the need for a model that incorporates this
complexity.
The chapter focuses on the development of tourism within this multi-layer system and
describes changes to the system over time. It identifies some of the possible reasons why
tourism has changed or developed in the case study area. This provides a context for the
data analysis in Chapter Five which tests the Multi-Trajectory Model of Tourism
Destination Change proposed in Chapter Two.
The chapter is in three sections. The first defines the tourism system under investigation.
The second describes the development of tourism within the study area. This historic
overview is divided into three parts: the general development of tourism within the
Australian context through the 20th Century; an historic summary of tourism growth in the
study area from 1900 to 1980; and the development in the area from 1980 to 1997. Given
the availability of time-series data, it is the latter which is of most relevance for the data
analysis in Chapter Five. The chapter concludes with a summary of critical change factors
that have affected tourism development in the case area, and a review of the Research Issues
derived from the proposed Multi-Trajectory Model of Tourism Destination Change,
identifying appropriate data variables for the testing of each Research Issue in Chapter Five.

Noreen Breakey Tourism Destination Development
Chapter Four – Destination Case System: An Historical Overview 158
The separation point of 1980 was chosen for two reasons. The first was data driven. The
Australian Bureau of Statistics (ABS), the Bureau of Tourism Research (BTR), and the
Queensland Tourist and Travel Corporation (QTTC), now Tourism Queensland (TQ),
commenced collection of consistent, multi-variate, time-series, tourism related data around
this time. However, some relevant data is available prior to 1980, and where appropriate,
will be presented. The second reason for the choice of 1980 was that there has been
significant tourism development since then. The end point of 1997 is also data driven, as at
that time a number of the time series tourism data collections ceased. The replacement
studies use different methodologies, and although it was argued that ‘better’ tourism data
was provided, these studies are not comparable to the earlier data.
As the change in the study area considers change at the local, regional, state, national, and
global levels for the majority of the 20th Century, it is not possible to discuss all the
tourism-related changes that occurred. As discussed in Chapters One and Two, tourism
growth is clearly accompanied by social, economic, structural, and environmental changes.
The material presented in this chapter is designed to support the Chapter Five analysis.
Consequently it summarises the different phases of tourism development on the Sunshine
Coast, and the wider social, economic and political context.
4.2 Defining the Tourism Case System
The Sunshine Coast tourism system has a number of levels, which can be defined by
geographical boundaries (Figure 4.1). At the base level are the three local areas: Noosa
Shire, Maroochy Shire, and Caloundra City. These three areas, when aggregated, comprise
the ‘Sunshine Coast’. Tourism within the Sunshine Coast is shaped by changes in the
higher levels of the tourism system, namely the State of Queensland and the Nation of
Australia; which are in turn affected by global events and trends.

Noreen Breakey Tourism Destination Development
Chapter Four – Destination Case System: An Historical Overview 159
Figure 4.1 The Sunshine Coast Case Study System. Map of Australia, showing the location of the Sunshine Coast and its three regions: Noosa, Maroochy, and Caloundra (Ralston, 2001).
The five levels of the tourism system allow the impact of a change at one level to be
assessed on other levels in the hierarchy. In addition, the inclusion of the three local areas
within the Sunshine Coast provides the opportunity to examine the manner in which
different combinations of change agents, policies, events, and responses to development can
produce different outcomes.
The top three levels of the case study have clear geographic boundaries that have remained
unchanged for over a century. This ensures that the use of information and data at these
levels is consistent. However, the lower levels, while being geographic areas, do not have
clear, unchanging boundaries. The term ‘Sunshine Coast’ has been defined in different
ways, and its actual and perceived boundaries have changed over time. The three Local
Government Areas have also evolved, with some changes to boundaries and names.
4.2.1 Location and Definition of the Sunshine Coast
The Sunshine Coast region extends for about 45 kilometres along the south-eastern
Queensland coast, north of Brisbane, from Caloundra through Maroochydore to Noosa

Noreen Breakey Tourism Destination Development
Chapter Four – Destination Case System: An Historical Overview 160
Heads (Figure 4.2). It is a coastline of intermittent beaches, headlands, and small estuaries
between Pumicestone Passage and Noosa River.
Brisbane, with a population of 1.6 million in 2001 (OESR, 2004a), occupies a bay-side
location and lacks the long sandy surf coastline offered on the northern Sunshine Coast and
the much more developed Gold Coast to the south. These features mean that the region was
an ideal location for beach front development (Toghill, 1982).
Figure 4.2 Map of the Sunshine Coast. (Wilkins Tourist Maps, 2004)
The term ‘Sunshine Coast’ was initially used in the 1970s as a marketing label to attract
tourists and residents to the area (Ralston, 2001). At that time, the region included the main
townships of Noosa Heads, Maroochydore, and Caloundra, as well as the smaller coastal
towns of Mooloolaba, Coolum Beach, Peregian Beach, Sunshine Beach, and encompassed
Noosaville, Tewantin, Buderim, Bongaree, and Bli Bli. Over time the hinterland was also
considered part of the ‘Sunshine Coast’ region, incorporating the established towns of
Nambour, Maleny, Montville, Mapleton, Cooroy, Eumundi, Cooran, Pomona, and Kin Kin.
More recently the northern North Shore and Cooloola Shire have been included as part of
Noreen Breakey Tourism Destination Development
Chapter Four – Destination Case System: An Historical Overview 161
the region (Ralston, 2001). Geographically this extended the boundary north of the Noosa
River.
In statistical data collections, the boundaries of the Sunshine Coast are usually defined in
one of two ways. The Sunshine Coast is part of the Moreton Statistical Division (SD),
which includes all of South East Queensland excluding Brisbane. Over time, this Moreton
SD has been disaggregated into small regions. One common break down is the separation of
Statistical Divisions into the Local Government Areas. The Sunshine Coast is not a single
authority and therefore, for the purposes of this work the first definition of the Sunshine
Coast region is the amalgamation of the three Government Authorities of Caloundra City
(originally Landsborough Shire), Maroochy Shire, and Noosa Shire, encompassing a total
area of 3137 square kilometres. The boundaries of these Authorities generally run east-
west. Therefore, each Authority encompasses a strip of coastline, a coastal plain, and a
hinterland area. The development along the coastal strip has been and continues to be
defined by the Town Planning regulations of the three different Authorities.
As the area initially considered to be the Sunshine Coast encompassed part of all three shires
and yet not all of each, the Sunshine Coast Statistical District was established. The
boundaries of this Statistical District were defined in 1980 by a committee that included
representatives from each of the three Local Government Authorities, the Sunshine Coast
Tourism and Development Board, and the ABS. The Sunshine Coast Statistical District
includes the coastal strip from Caloundra to Noosa Heads and inland to Tewantin, Nambour,
and Buderim. This provides the second boundary definition used in this work (Figure 4.3).
The boundary of the Sunshine Coast Statistical District was designed to incorporate the
forecast area of major development through to the end of the 1980s (Rider Hunt and
Partners, 1986). Within this Statistical District the northern most Noosa Shire contains
Tewantin, Noosaville, and the coastal strip from Noosa Heads to Peregian Beach. In the
middle, the Maroochy Shire contains the coastal strip from Coolum Beach down through
Maroochydore and Alexandra Headlands to Mooloolaba, and inland to Buderim, Nambour,
and Kenilworth. In 1980, the southern end of Caloundra, Kawana Waters, and Point
Cartwright were part of the Landsborough Shire, which was changed to the Local
Government Authority of Caloundra City in 1989.

Noreen Breakey Tourism Destination Development
Chapter Four – Destination Case System: An Historical Overview 162
Figure 4.3 The Sunshine Coast Statistical District. The boundary of the Sunshine Coast Statistical District (SD), as defined in 1980. This SD includes the coastal strip from Caloundra to Noosa Heads and inland to Tewantin, Nambour, and Buderim. The boundary was designed to incorporate the forecast area of major development through to the end of the 1980s (Rider Hunt and Partners, 1986).

Noreen Breakey Tourism Destination Development
Chapter Four – Destination Case System: An Historical Overview 163
4.3 Changes in Australian Tourism during the 20th
Century
In Australia, the 20th Century saw the growth of tourism as an activity available for the
everyday person, and in parallel the rise of tourism as an industry. In addition to
summarising the general changes in tourism over the last Century, this section addresses the
changes in the social and political arena in which tourism operates, as well as developments
in technology and transport that significantly affected modes of transport used throughout
the 1900s.
Tourism and travel have changed from simply the domain of the wealthy or the adventurous
to a common activity available to the entire population. This growth of tourism in Australia
since the turn of the 20th Century was primarily affected by the combination of changes in
social attitudes and technological advancements both within the country, and in the
international arena (Hall, 1991). The large-scale increase in tourism worldwide is
considered part of the post World War Two development. This growth has been partially
attributed to the high economic growth of the developed countries through the 1950s and
1960s resulting in ‘real wage’ increases (PLI & PWA, 1980). Tourism is now considered “a
major power of world trade” (Gunn, 2004 p.3).
Attitudes about tourism and travel have changed in Australia, as the majority of its people
engage in annual holidays, weekends away, and expensive honeymoons. The Anglo-Celtic
Australia of 1901 has been replaced with a multi-cultural society, which combined with
increased globalisation and information technology, has seen Australians travelling to the
far-reaches of the world. This desire for travel, both at home and abroad, is made possible
by the corresponding increase in the disposable income of Australians and the introduction
of paid annual leave. Family sizes have also dramatically decreased during the 20th Century,
providing the opportunity for family holidays, as it became both affordable and practical for
the entire family to travel together. In addition, medical breakthroughs and the growing
awareness of the role of healthy living have generated an increasing number of healthy
retirees able to take the time to travel.
Noreen Breakey Tourism Destination Development
Chapter Four – Destination Case System: An Historical Overview 164
In line with general development and changes in technology during the 1900s, transport
options extended from horse drawn carriages, ships, and rail, to cars, buses, four wheel
drives, aeroplanes, and ultimately wide bodied jets. These alternate modes of travel were
further enhanced by access through improve roads, bridges, multiple lane highways,
changing railway gauges, and both domestic and international airports. In addition to the
advancements in the airline industry, there has been a dramatic fall in the cost of domestic
and international air travel.
Changes in society and travel within Australia during the 20th Century gave rise to tourism
as an industry. Over time the facilities catering to tourists have increased in terms of their
number, size, and standard. The main forms of accommodation before World War Two
were in (public) hotels and guest houses. During the late 1950s and the 1960s there was a
boom in motel building, while the 1980s and 1990s saw frantic development of hotels and
holiday units. This progress in accommodation reached the stage where entire resorts, like
Yulara, were purpose built for the provision of services to those visiting attractions, such as
Uluru (Ayers Rock). This reflected the global trend, particularly evident in developing
countries, for the development of ‘integrated resorts’ (Butler, 1999).
To assist travellers in selecting destinations and organising transport and activities, there has
been significant growth in the number of travel agencies, wholesalers, tour companies,
motoring organisations, information bureaus, and related government agencies. There has
been an accompanying increase in the extent and quality of the services provided, with a
significant change being the advent of computerised reservation systems. Part of the growth
in package deals has been the application of economies of scale to develop ‘value-for-
money’ deals.
In addition to the supply of facilities and services, the tourism industry began to promote
itself. The marketing approach, which is necessary to ensure the provision of information to
potential tourists, has become increasingly professional and highly competitive. Beginning
with posters, advertisements and brochures, there have been great advances in computer
programs and printing hardware which have generated higher standards of presentation. In
addition, the advent of the World Wide Web has opened up an alternate communication
medium that still encompasses the powerful visual aids utilised in travel brochures.

Noreen Breakey Tourism Destination Development
Chapter Four – Destination Case System: An Historical Overview 165
4.4 Development of Tourism in the Case Area: 1900 –
1980
This section summarises change within the tourism case area from 1900 to 1980. The focus
is on International, National and State changes and trends, and specific developments within
the three Local Areas of the Sunshine Coast. This overview provides an understanding of
the establishment of tourism at the various system levels, and their change and development
over time.
4.4.1 1900 to 1915 - Pre World War One
At the turn of the 1900s Australia was experiencing the effects of a global depression that
began seven years earlier and continued until 1904 (Berry, 2000). However it was also a
time of optimism with the Commonwealth of Australia being proclaimed on the 1st of
January 1901 (Barker, 1992). A period of change and development followed as government
evolved. Queensland became a state, and in 1902 Brisbane became a city. Between 1905
and the beginning of the First World War, Australia’s population increased from four to five
million with schemes for assisted passage continuing to boost immigration, primarily from
Britain (Mason, 1983). As a result cities and towns became increasingly urbanised and rural
settlements generally grew at a moderate rate, with the initial focus on timber shifting to
various agriculturally based industries (Mason, 1983). This was the situation on the
Sunshine Coast, or North Coast as it was then called.
In 1905 the (Royal) Automobile Club of Queensland formed to cater for the growing use of
the car (Barker, 1992). Australia was keeping pace with the developing world with an
efficient travel network in the populated coastal areas, incorporating transport by ship, train,
coach, bus, and car (Richardson, 1999). On the North Coast, the discovery of gold in
Gympie in 1867 had ensured that by the beginning of the 1900s Gympie was linked to
Brisbane by rail and road.
This inland access between Brisbane and Gympie reduced the need for transport via the
coast and river system, and therefore the dependence on the ports, particularly Mooloolaba
and Tewantin. As a result the coastal towns grew into peaceful seaside retreats. However,

Noreen Breakey Tourism Destination Development
Chapter Four – Destination Case System: An Historical Overview 166
the Noosa, Maroochy, and Mooloolaba Rivers were still the main transport routes
connecting the coast and the hinterland. The importance of the Maroochy River is
illustrated by the building of both Maroochydore’s first hotel and first permanent store on
the river front. Additionally, in Noosa, the main town centre and population was based
around the wharf at Tewantin.
The limited road access in the area was due to a lack of finance within the Local Authorities.
The funding of Local Authorities in the late 1800s had made it difficult in sparsely
populated areas, as the number of ratepayers was small and the geographical area large.
This posed difficulties for the Local Governments in maintaining or improving the roads.
By 1912, the three Shires of Maroochy (1902), Noosa (1910), and Landsborough (1912) had
been established.
Of particular relevance to the development of coastal destinations was the general appeal of
the beach. By 1906 surf bathing was legal in Sydney, the first surf bathers life saving club
was established at Bondi, and surf carnivals had begun (Mason, 1983; Barker, 1992). A
decade later, the Maroochydore Surf Lifesaving Club was formed. It was the first on the
Sunshine Coast and the second in Queensland. As an alternative to the surf beaches at
Maroochydore, Noosa Heads offered a protected beach and at that time was becoming
known as an ideal location for safe beach swimming.
Like other aspects of Australia as it entered the 20th Century tourism was in an embryonic
stage of development. However the beginnings of tourism were evident.
By the early 1900s, there had been little development at Caloundra. There were a few
residents, mainly from Brisbane, a hotel, a guesthouse, and lighthouse. The river bar was
dangerous and the road in was rough. At this time, travel to other locations on better roads
appeared preferable (Holthouse, 1982).
The town of Maroochydore had been established in 1900. It was a little village with no
roads in and was used mainly for fishing and camping in the holiday periods. 1908 marked
the beginning of Maroochydore as a residential seaside resort with the first sale of coastal
allotments by Thomas O’Connor. A number of holiday huts were built, primarily by cane

Noreen Breakey Tourism Destination Development
Chapter Four – Destination Case System: An Historical Overview 167
farmers wanting a weekender by the water. In addition, Cotton Tree Point, on the south
head of the river mouth became a popular camping site.
Inland, a narrow train line between Buderim and Palmwoods had been constructed to
transport fresh produce. The rail route also provided picnic excursionists from Brisbane the
opportunity to reach Buderim. Despite the discomfort of the journey, the travellers enjoyed
this winding and hilly ride through the rainforest, as well as the extensive view over the
Sunshine Coast from the mountain top. Travellers continued to take this trip until 1935
(Holthouse, 1982).
In the late 1800s Noosa Heads was considered a ‘watering hole’ for the people of the mining
and agricultural town of Gympie, although the railway link from Brisbane allowed access
from further afield. In 1900 there were only five houses, including Lagoona House, a guest
house mainly for cattlemen and miners. Noosa Heads was gradually gaining a reputation as
a relaxing location for swimming, fishing, and natural bushland, with picnics in Noosa
Woods a popular activity. However access was limited as visitors were still dependant on
motor boats for transport from Tewantin.
By 1914 some travel within Australia was already being ‘packaged’, combining transport,
accommodation, and excursions. State tourist bureaus were being established, and the
international travel company, Thomas Cook, had opened a Melbourne office (Richardson,
1999). However it would not be until the 1970s that the ‘Sunshine Coast’ was packaged and
holidays sold to the Southern States.
4.4.2 1915 to 1919 - World War One
During the war, the subdivision and sale of coastal allotment continued in the Shire of
Maroochy. This extended the coastal development south from Maroochydore to Alexandra
Headland. The area at the mouth of the River that was used for camping was officially
proclaimed a Camping and Recreational Reserve. By the end of the war, the coastal
Maroochydore/Mooloolaba area was developing as a fishing hub, a farming area with dairy
and fruit farms, and a seaside resort.
Noreen Breakey Tourism Destination Development
Chapter Four – Destination Case System: An Historical Overview 168
The main tourism development in Caloundra during the war was the completion of the
Grand Central Guest House by Allan King. The King family had been running a guest
house at Kings Beach since the 1890s.
Little change occurred in the coastal area of the Noosa Shire as access to Noosa Heads
continued to necessitate a boat trip from Tewantin.
4.4.3 1919 to 1939 - The Interwar Period
The twenty years between the world wars saw significant developments in the various
modes of transport. Commercial air travel began to grow with Qantas, Ansett, and
Australian National Airways (ANA) all founded during this period (Barker, 1992). Despite
the reduction in road construction during the depression years of the 1930s, the number of
vehicles on the road continued to increase. The railway system improved with
electrification, suburban rail expansions, and single gauge lines linking the eastern capital
cities. During this period interstate travel was also conducted by sea, commonly on P&O
vessels (Mason, 1983). By the end of the 1930’s air travel had established reliable services,
first class travel by ship was luxurious, railways were faster, more comfortable, and some
were even air-conditioned (Richardson, 1999).
During the 1920s, two significant bridges were built in Noosa. The first connected
Tewantin to the area which was to become Noosaville. This was settled predominantly by
wealthy miners building holiday and retirement homes. A second bridge provided road
access to Noosa Heads, heralding the beginning of the development of Noosa Heads. As a
result, Lagoona House was extended and the painting of the name across the roof was to
provide the landmark for Noosa for almost fifty years.
Also in the late 1920s, in line with a road building proposal being considered by the Noosa
Council, an entrepreneurial developer, T.M. Burke approached the Council about his plan to
purchase 470 acres of their land in return for the construction of bridges and all-weather
roads. Approval of the plan resulted in the subdivision and sale of seaside residential blocks
at Noosa Beach Estate, now known as Sunshine Beach. Sales continued through until 1935
when further development was postponed because of the depression and then the Second
World War (Edwards, 2001).

Noreen Breakey Tourism Destination Development
Chapter Four – Destination Case System: An Historical Overview 169
To the south, the first sale of allotments began in Coolum in the early 1920s (Jenkins, 2001).
The other entrepreneurial developer, O’Connor, continued the sale of subdivisions along the
coast of the Maroochy Shire. In addition he also incorporated sports areas into the ‘town
plan’, organised the first Maroochydore Show, established a dairy, and built a town hall,
which was used to show moving pictures (Holthouse, 1982). According to an article in the
Nambour Chronicle in March 1927, the conveniences for visitors to Mooloolaba included “a
boarding house, café, stores, telephone exchange, life-saving club, ambulance, public
dressing sheds for bathers and Clarke’s Royal Mail bus service….and books may be
delivered twice weekly” (reprinted in Maroochy Shire Library Service, 1994 p.46 italics
added).
Land in Caloundra was also being subdivided and residential homes established. In
addition, there were a growing number of farms, with the produce sent to Brisbane via the
Pumicestone Passage. Thus tourism on the Sunshine Coast developed as the region itself
developed.
By the 1930s, the three main coastal resorts of Noosa Heads, Maroochydore/Mooloolaba,
and Caloundra were all separately linked by road to the inland highway. This resulted in the
development of a distinctive local character for each town. There was to be no coastal
linkages until the 1960s. A common characteristic was the peaceful and friendly
atmosphere present in each location. All the townspeople knew each other, the guest houses
provided a family environment and the same visitors returned year after year. As with the
beaches to the south of Brisbane at the Gold Coast, the attraction extended beyond Brisbane,
with these developing destinations attracting visitors and new residents from further afield
(Toghill, 1982).
The late 1920s saw the introduction to the Sunshine Coast of the aeroplane. The aerodrome
site was selected and cleared, and a landing strip marked out for light planes. This is now
Aerodrome Road in Maroochydore (Maroochy Shire Library Service, 1994).
This period also saw development in the role of government in tourism. Federally, the
Australian National Tourism Association (ANTA) was founded by private sector interests to
encourage international tourism (PLI & PWA, 1980). At a State level the Queensland
Government Tourist Bureau (QGTB) was formed to replace the Queensland Government

Noreen Breakey Tourism Destination Development
Chapter Four – Destination Case System: An Historical Overview 170
Intelligence and Tourist Bureau, taking over responsibility for bookings and promotion
(Barr, 1990b). By the 1920s the state tourist bureaus, which had begun as state agencies
linked to government departments, like the railways, were major booking offices for
transport and accommodation (Davidson & Spearritt, 2000). Also impacting on travel was
the introduction of one mandatory week’s paid annual leave for the working people in 1936
(Richardson, 1999).
Beach tourism continued to grow in popularity with the increase in accessibility and the
introduction of surfboarding. However, due to concern regarding modesty issues swimming
costumes continued to be regulated (Barker, 1992). In addition coach companies were
taking tours to remote locations, and camping grounds and caravan parks began to be
established (Richardson, 1999).
4.4.4 1939 to 1945 - World War Two
In addition to the safety precautions, Australian’s lives were also significantly altered by
wartime regulations and workforce changes (Mason, 1983). The Federal Government
centralised and controlled the country’s work-force and limited production (Chambers,
1999). Travel was restricted and interstate travel necessitated a pass and a valid reason
(Mason, 1983). Women replaced men in the work-force, including factories, farming and
certain areas of the military (Chambers, 1999).
Thousands of soldiers camped in the Sunshine Coast region during World War II (Angell,
2001). The military believed that the strip between Caloundra and Noosa, was a logical
landing spot for the enemy (Maroochy Shire Library Service, 1994). When the war reached
the Pacific, Caloundra and Bribie Island became armed camps to protect the entrance to the
Port of Brisbane. The beaches were guarded with barbed wire and machine guns, and on the
coast, training camps and firing ranges were established. After the war, one such area was
subdivided as a housing estate, becoming Battery Hill in Caloundra (Holthouse, 1982).

Noreen Breakey Tourism Destination Development
Chapter Four – Destination Case System: An Historical Overview 171
4.4.5 1945 to 1950
The increasing role of Australia in the international arena dispelled the pre-war perspective
of relative isolation (Mason, 1983). This internationalisation, combined with increasing
technological advancements in transport changed the general attitude to travel (Richardson,
1999).
In the post war period the Federal Government exercised strong controls over the economy,
aiming to establish a welfare state. Additionally government nationalisation of key
industries was proposed, including the airlines. As the High Court deemed such
nationalisation unconstitutional the government established its own domestic airline, Trans
Australian Airlines (TAA), and took over the international carrier Qantas (Mason, 1983;
Barker, 1992; Chambers, 1999; Richardson, 1999).
At the state level the Queensland Tourist Development Board was established in 1946 to
determine the potential of Queensland’s tourism resources (Barr, 1990b), as discussed in
Chapter Two. Their report (QTDB, 1947), published a year later, provided a comprehensive
review of the State, considering the ‘attractiveness’ of Queensland to the local, interstate and
international tourists. The study determined that Queensland had numerous tourist
attractions and sunny weather, but at that time did not possess the standards of transport and
accommodation necessary to satisfactorily cater for interstate and international tourists
(QTDB, 1947). The board recognised the limitations to tourism infrastructure development
created by the existing short-term lease land tenure arrangements, recommending perpetual
or 99-year leases. Another major concern addressed in the report was the need to issue
permits to build as building restrictions were still in place from the war. Other issues
addressed by the Board included publicity, staff training, hotel classification, entertainment,
youth hostels, conservation and creating ‘tourist mindedness’ (QTDB, 1947).
Of the 20 Queensland key areas identified in the report, two incorporated the Sunshine
Coast region. The first was from Caloundra north to Coolum, and included the hinterland.
It was thought that the ‘seaside resorts’ of Caloundra, Mooloolaba, Alexandra Headland,
Maroochydore, and Coolum offered ‘similar attractions’ to the Gold Coast, although they
were less developed. As well as the surfing beaches, the inland waterways were considered
ideal for safe swimming, boating activities, and fishing. The report also commented on the

Noreen Breakey Tourism Destination Development
Chapter Four – Destination Case System: An Historical Overview 172
inland ‘resorts’ of Maleny, Montville, and Mapleton. The poor quality access road from the
coast to this fertile mountain range with its panoramic views was noted. In addition,
improvements to some of the roads connecting the coast to the Bruce Highway were
considered necessary (QTDB, 1947).
The second key area incorporated Bundaberg, Maryborough, and Gympie to Coolum.
Relevant to the Sunshine Coast region, this locality included Tewantin, Noosa Heads, and
Coolum. According to the report, Tewantin already provided hotel accommodation, and
offered safe swimming, boating and fishing. The attractions of Noosa Heads were
considered to be the combination of the mouth of the River, the coastal area, and the
National Park. Although there was some camping accommodation provided, there was seen
to be an undersupply. Coolum Beach was considered a potential development site. In all
three areas, the need for quality accommodation to cater for the interstate or international
market was noted (QTDB, 1947).
4.4.6 The 1950s
In 1949 a change of Federal Government resulted in the lifting of the severe restrictions
imposed during the war. The limits placed on imported commodities eased, the restrictions
imposed on tourists’ travelling allowances were reduced, and the closing time of hotels
changed from the war time 6pm to 10pm in the various states over the following 20 years
(Barker, 1992). This was the beginning of an economic boom that was to last through the
1950’s (Chambers, 1999; Hancock, 1999). By the mid 1950s unemployment was no longer
a problem and full employment was expected to continue (Fraser, 1993). Moreover, the
political stability of the 1950s and 1960s resulted in strong investment from Britain and the
US (Chambers, 1999).
The population of Australia increased, predominantly through large-scale Government
encouraged migration, including British ex-servicemen, Europeans, and refugees from the
communist countries. This resulted in an increasingly assertive multicultural minority
(Mason, 1983; Chambers, 1999). A significant effect of these ethnic communities was the
change in traditional eating and drinking habits. ‘Eating out’ was uncommon in the 1950s,
but with the opening of numerous and varied restaurants, tradition changed. Additionally

Noreen Breakey Tourism Destination Development
Chapter Four – Destination Case System: An Historical Overview 173
wine became a regular addition to a meal, and public festivals became popular (Mason,
1983).
Changes to beach based activity during the 1950s were the appearance and subsequent
banning of the bikini, and the introduction of the Malibu surfboard (Barker, 1992). Away
from the beach, National Parks continued to be established.
During this decade Ansett took over ANA, and Qantas used its first 707 jet aircraft and
inaugurated a round-the-world service (Barker, 1992). The changes in the economy and
reliability of the jet airliners resulted in a significant increase in medium to long haul travel
(Richardson, 1999).
The other transport related changes were the building and upgrading of roads, and the
increasing use of the motor car, which dominated domestic travel. In parallel, motels,
caravan parks, and camping grounds spread around the country (Richardson, 1999). During
the 1950s the motel, as a new form of accommodation, became established. There were
over 270 motels Australia-wide by 1960. Queensland became the motel capital of the
country with the main focus on the Gold Coast, as 36 of the State’s 59 motels were located
there (Davidson & Spearritt, 2000). Most motels were single storey and build around a
courtyard where the cars were parked. The main windows usually overlooked this car park
rather than the countryside, thereby not taking advantage of their often superb locations. An
advantage of these new motels over the existing hotels and guest houses was that they
usually charged per room rather than per person, and were therefore economical for families
(Davidson & Spearritt, 2000).
By the 1950s there was a decline in the role of the state tourist bureaus due to the rapid
growth in retail travel agencies. Additionally the publication of an Australia-wide
accommodation directory by the motoring organisations in the late 1950s, in effect replaced
the guides supplied by the state bureaus (Davidson & Spearritt, 2000).
In the post-war years Noosa, and particularly Hasting Street, increased in popularity as a
holiday destination. At that time Hastings Street had a caravan park at each end, and a
series of mismatched houses, tourist accommodation, shops and vacant lots between them
(Gloster, 1997). The Noosa area was first promoted as a tourist destination in 1957 with the

Noreen Breakey Tourism Destination Development
Chapter Four – Destination Case System: An Historical Overview 174
production and distribution of a brochure by the Tewantin-Noosa Chamber of Commerce
(Edwards, 2001).
Development of T.M. Burke’s beach estate, at what is now Sunshine Beach, had been on
hold since 1935. In 1951 his son reviewed the situation and by the end of the decade had
won the tender to extend the coastal road south to Coolum and build three bridges, in
exchange for the lease of extra crown land south of Sunshine Beach. A second lease was
also granted by Maroochy Shire for the section of land over the shire border. This lease was
under the jurisdiction of the Crown Land Development Act of Queensland that provided a
framework for this type of agreement, the pattern of which had been set earlier in the
century. This scheme was being used to build all the sections of the coastal highway from
Caloundra to Noosa as the Government, while promoting progress, could not afford to
finance the road work. The first stage of the new coastal road, from Noosa to Coolum
opened in 1960 (Edwards, 2001).
By 1950 the commercial centre of Maroochydore had shifted from the River Esplanade to
the Ocean Esplanade (Maroochy Shire Library Service, 1994). In 1958, the beachfront
national park, which extended from the north of the Maroochy River up to just south of Mt
Coolum, was extinguished by the State Government. This was to allow for the Maroochy
Airport, an adjacent high rise hotel and the residential beachside suburbs of Marcoola and
Mudjimba (Gloster, 1997). The need for a larger airport was due to the growth of air traffic
and the introduction of larger planes (Maroochy Shire Library Service, 1994).
4.4.7 The 1960s
World tourism expanded during the 1960s as Europeans began to travel further and those in
developing countries began to travel internationally. After 1967 the foreign travel policy of
Japan was relaxed and, when combined with the ‘economic miracle’ of Japan’s growth,
outbound travel began to grow (Prideaux, 1995; Go, 1997). Additionally the development
of wide-bodied planes resulted in increased capacity and decreased airfares. According to
Go (1997) the ‘distance’ limitation in travel to Australia had been significantly reduced.
However by the mid 1960s the domestic market still accounted for 95 percent of tourism
within Australia (Davidson & Spearritt, 2000).

Noreen Breakey Tourism Destination Development
Chapter Four – Destination Case System: An Historical Overview 175
In 1964 the Australian National Travel Association (ANTA), which began in 1929 with a
general charter for promoting Australia, commissioned two New York consultancy firms to
assess the nation’s travel and tourism industry. The consultants assessed the state and
territory tourism bureaus, concluding that they provided appropriate promotion and sales
within Australia but individually were not and could not effectively promote overseas. They
recommended the establishment of a national body to coordinate the industry and promote
Australia internationally. This resulted in the creation of the Australian Tourist Commission
(ATC) in 1967 for ‘the encouragement of visitors to Australia, and travel within Australia,
by people from other countries’. The coordination of the development of tourism attractions
and facilities remained with the individual states and territories (Davidson & Spearritt,
2000).
In 1957 a Country Liberal Government was elected in Queensland after 25 years of Labor.
At this time the vast majority of Queensland land was in various leasehold titles. By the end
of the 1960s there were considerable changes in the land laws with land grants and free
holding being used as development tools.
The State Tourist Bureau of Queensland began promoting the Sunshine Coast region in
1962, with the advent of the ‘three-day scenic Sunshine Coast tours’ (Edwards, 2001). To
provide a central booking agency for the Noosa Shire, Noosa Tourist Accommodation was
formed at the end of 1964, continuing to operate until 1972 (Edwards, 2001). At this time
the ‘Sunshine Coast’ was becoming the official name for the area. As a result a partnership
was established in 1967 between the three Councils and the private sector for a regional
tourism marketing body, the Sunshine Coast Promotion Bureau (Prideaux & Cooper, 2002).
During this decade the aeroplane replaced the train as the main form of long distance mass
transportation. The phenomenal increase in car ownership further resulted in the declining
patronage of the railways (Davidson & Spearritt, 2000). On the Sunshine Coast, the
Maroochy Airport was officially opened in 1961 (Maroochy Shire Library Service, 1994).
The airport was owned, operated, and managed by the Maroochy Shire Council (Ralston,
2001). The name was later changed to the Sunshine Coast Airport (Maroochy Shire Library
Service, 1994).

Noreen Breakey Tourism Destination Development
Chapter Four – Destination Case System: An Historical Overview 176
This decade saw increasing numbers visiting national parks and from 1967 the state level
national park services began to be established throughout Australia (Davidson & Spearritt,
2000). In parallel environmental concern accelerated during the mid 1960s, as discussed in
Chapters One and Two. In Queensland conservation issues included the protection of the
Great Barrier Reef and the Cooloola beach area from mining (Hundloe, 1985).
The 1960s saw the development of a new beach culture. The surfboarding craze expanded
with the establishment of small surfboard manufacturers, surf movies, an Australian winning
the 10th international surfing championship, and the Beach Boys topping the music charts.
In an era of full employment temporary jobs were readily available ensuring that ‘surfies’
and ‘surfie chicks’ could maintain their travelling lifestyle. The established surf clubs did
not approve of the new craze and the traditional yellow and red flags began to divide the
swimmers and bodysurfers from the board riders (Davidson & Spearritt, 2000).
By the late 1960s lightweight nylon tents, with aluminium or fibreglass poles,
predominantly from North America, arrived on the Australian market. Mesh screens were
added and the tents became compact enough to fit easily into the boot of a car (Davidson &
Spearritt, 2000). Caravan parks and camping grounds were increasing in number and the
facilities provided improving. These parks became an integral part of the economy of the
coastal settlements (Davidson & Spearritt, 2000).
Due to the informal use of Noosa Woods as a camp ground, the Woods were officially
changed to incorporate fee-paying camping in 1963. Progressively, the Woods were cleared
for extra camp sites, which generated more funds for the Noosa Council. This was opposed
by the Noosa Park Association, which continually tried to persuade the Council to
regenerate the Woods (Gloster, 1997).
The Noosa Parks Association had been formed in 1962 by Dr Arthur Harrold and a group of
like-minded individuals. This was the first community-based conservation group in
Queensland. Their initial aim was to prevent the proposed road around the Noosa National
Park, from Noosa Heads to Sunshine Beach. At that time, the National Park, which had
been established in 1939, was a small 245 hectare parcel of land. Although appearing to
extend to the coast, it was actually surrounded by potential roads and development sites. By
conducting a large-scale community awareness program the Association was able to extend

Noreen Breakey Tourism Destination Development
Chapter Four – Destination Case System: An Historical Overview 177
the Park to the coastline in 1964, despite the opposing campaign conducted by T.M. Burke,
the major developer with land at Alexandria Bay, in conjunction with the Council and some
of the Noosa business sector (Gloster, 1997).
The coastal towns on the Sunshine Coast had remained small resort towns operating as
centres for local agricultural produce until the 1960s (OESR, 2001). Growth from the 1960s
on was rapid, with the acceleration in the development of residential areas, retirement
settlements, and resorts and other tourist facilities (OESR, 2001). By the 1960s, the
beginning of the development projects that were to change the Sunshine Coast’s character
had begun (Holthouse, 1982).
At this time Noosa was like many other quiet coastal towns, visited by families, surfers,
fishermen, water-skiers, and boating enthusiasts. The combination of the limited
accommodation and the increasing number of visitors from the southern States caused many
to purchase their own holiday house, or built flats or motels (Edwards, 2001).
At the start of the 1960s the towns in the Noosa Shire each had their own character,
determined partially by their use. Tewantin was the shopping and business hub, Noosaville
the fishing village, and Noosa Heads the beach resort. The residential areas were mainly in
Tewantin and Noosaville. At that time the bottom of Noosa Hill, later to become known as
Noosa Junction, was a dirt road through the bush, linking Tewantin Road with the new
coastal highway. The first business at the Junction was a fish and chip shop, which began
operation from a tin shed in 1963. Over the following years a number of businesses catering
to the traveller were established, including service stations, unit and motel accommodation,
a café and some shops (Edwards, 2001).
With the extension of the coastal highway, Peregian, at the southern end of the Noosa Shire,
had grown into a small community. In 1962, electricity was connected, and a roadhouse and
restaurant opened. Two years later, a Surf Lifesavers Clubhouse was erected, and
swimming and wading pools built. By 1967, there were a total of 32 houses. In
comparison, there were 85 dwellings in the older Sunshine Beach estate, 101 in Noosa
Heads, and 430 in Noosaville (Edwards, 2001).

Noreen Breakey Tourism Destination Development
Chapter Four – Destination Case System: An Historical Overview 178
During the early 1960s, it became apparent that Main Beach at Noosa Heads had receded
significantly over the past 20 years and the trend did not appear to be changing. ‘Protection’
of the beach resulted, with the construction of a stone wall in 1964. Following further sand
loss, a more substantial rock and boulder wall was constructed five years later. This
retaining wall was to protect the properties that had been built on the foreshore (Edwards,
2001).
Noosa was not the only beach suffering erosion. The cyclone season of 1967/68 had
affected many South East Queensland beaches. In a bid to protect the beaches, the State
Government introduced the Beach Protection Act in 1968. This primarily protected the
foredune area of beaches that had not already been built upon (Edwards, 2001).
From the 1960s to the early 1980s, the Noosa Council encouraged development along the
coastal strip, as the extra rates generated could be used for the building of inland roads. In
1969, the Council approved an eight storey ‘integrated resort’ unit development for the
ocean side of Hastings Street. This was the first submission of a high rise application in
Noosa. The approval was granted, despite opposition from a community campaign led by
Marjorie Harrold. At that time there was no town plan for Hasting Street and therefore no
limit to what could be approved.
Subsequently a town plan was developed and a limit of three storeys established for the
ocean side of the street. However, no height restrictions were established for the non-ocean
side of the street. The approval for the eight storey project eventually lapsed due to the
financial difficulties of the developer (Gloster, 1997). An extension was not granted by the
Council on the basis that the foreshore was part of the newly defined Beach Erosion Control
Area under the Beach Authority Act and the proposed type of development was no longer
considered appropriate (Edwards, 2001).
4.4.8 The 1970s
In the 1970s, under the Federal Governments of Gough Whitlam and Malcolm Fraser,
migration from all parts of the globe continued. Politics during the 1970s were also driven
by issues of the 1960s, including the environment, feminism, sexual liberation, and
indigenous rights (Manne, 1999). Money was spent extensively in a bid to solve national

Noreen Breakey Tourism Destination Development
Chapter Four – Destination Case System: An Historical Overview 179
problems and assist international situations, creating economic difficulties at a time when
many economies in the developed world were already experiencing ‘stagflation’, which
implied stagnant economic growth combined with increasing unemployment and rising
inflation (Chambers, 1999). In the second half of the decade the Fraser Government aimed
to generate business confidence and reduced the portion of a company that needed to be
Australian owned, in order to attract foreign capital (Chambers, 1999).
By 1970 Joh Bjelke-Petersen had become Queensland Premier, a position he retained until
his retirement in 1987 (Barker, 1992). In order to make the State the ‘money-capital’ of
Australia, death duties were abolished, stamp duties cut, payroll tax exemption levels
increased, land taxes reduced, other state taxes controlled and land freeholding accelerated.
This was part of the ultimately successful plan to induce large-scale interstate and
international investment in the progress and development of Queensland (Walter, 1990).
The reaction to this aggressive development policy was epitomised by the ‘See Queensland
first, before Joh sells it’ bumper sticker (Stuart, 1985). Queensland in the 1970s
experienced a polarisation between the pro-development government and the growing
community concern for the natural environment. By 1971 individual conservation groups
had formed the Queensland Conservation Council. One strategy utilised by the
conservationists was to play the State Government off against the Federal Government. For
example the approval and control of mining is a state responsibility, but as the export of
minerals is a commonwealth function, the federal government prevented sand mining on
Fraser Island by withholding export licences (Hundloe, 1985).
Opposition to sandmining had grown through the 1960s, with mining occurring on the
Sunshine Coast at North Shore, north of Tewantin. In the early 1970s, applications were
submitted for the mining of Sunshine and Peregian Beaches. Despite being on different
sides on the Noosa National Park issue during the 1960s, T.M. Burke, the Noosa Shire, the
Maroochy Shire, the local residents and the environmentalists, all opposed the granting of a
dredging lease. The mining application was ultimately refused by the Minister for Mines on
the basis of ‘public interest’ (Edwards, 2001).
Another conflict between development and conservation was occurring over the issue of
canal developments. In 1972, backed by the State Government and the Noosa Council, the
wetland ecosystem of Hays Island was transformed into Noosa Sound. The development

Noreen Breakey Tourism Destination Development
Chapter Four – Destination Case System: An Historical Overview 180
incorporated the clearing of mangroves, land filling, and the construction of three bridges.
Four years later surf broke over the estate. To protect Noosa Sound, the developer, Noosa
Council, and the State Government contributed to the creation of a new Noosa Spit,
effectively destroying the natural river mouth and bar system (Gloster, 1997; Edwards,
2001). One effect of the Hays Island development was to harden public feeling against any
further canal developments in Noosa (Cato, 1989).
In 1973, the T.M. Burke company purchased non-waterfront land in Noosaville for a canal
development, Noosa Waters Estate. Opposition to the proposal grew over time, with issues
being raised about pollution, flooding, drainage, and the potential of further canal
developments in Noosa. In 1978, the plan was changed to a navigable lake rather than
canals as this changed the approval and relevant regulations from the state level to the local
authority. The following year, the company was bought out and the plan continued to be
reviewed and resubmitted (Edwards, 2001).
In the Maroochy Shire, the first canal developments were proposed in the mid 1970s,
ultimately resulting in ‘Maroochy Waters’ and ‘Emerald Waters’. Controversy reigned as
the local population expressed concern over the environmental changes, citing American
examples. Ultimately the Maroochy Council determined that the canals were required
because of the growing population, as the canals would reduce development along the
coastal and river esplanades (Maroochy Shire Library Service, 1994).
The world recession in the mid 1970s significantly affected international visitor numbers to
Australia, with total numbers down from 1974 for both 1975 and 1976. The main source
markets impacted were New Zealand and North America (QTTC & Boeing, 1981). This
was indicative of the increasingly competitive nature of the maturing tourism industry. “The
arrival of the jumbo jets and the giant hotel chains inevitably led to declining profit margins,
desperate international competition and losses” (Turner, 1976 p.15). However international
travel generally continued to increase despite the occasional lowering of the growth rate for
the energy crisis in 1973/4 and 1979, and the economic recession of 1981 (Go, 1997).
Interestingly, visitation from the United Kingdom and European markets was largely
unaffected by the economic recession of the 1970s, presumably because of the high numbers
visiting friends and relatives (PLI & PWA, 1980). During the 1970s international flights to

Noreen Breakey Tourism Destination Development
Chapter Four – Destination Case System: An Historical Overview 181
Australia increased. In 1973, the first direct flight between Japan and Australia began
operation, and by the end of the decade Queensland was serviced by five international
airlines, totalling 34 flights each week (Rider Hunt and Partners, 1983, 1991).
Domestically, Sydney’s Kingsford Smith International Airport, Australia’s first legal casino
in Hobart, and the Sydney Opera House all opened in the early 1970s (Barker, 1992;
Davidson & Spearritt, 2000).
On the Sunshine Coast, the coastal road ran from Caloundra all the way to Noosa by the
beginning of the 1970s. In 1975, the Main Roads Minister gazetted this coastal Nicklin
Way – David Low Highway as a main road. As a result, only 10 percent of subsequent
maintenance costs were to be paid by the Local Shires. In addition, the Minister announced
that the road from Eumundi to Noosaville would be upgraded, as this provided a shorter link
to the coast from the inland highway (Edwards, 2001).
During this time the old resorts along the coastal road were being replaced, and land values
were escalating. Lagoona House, on Hastings Street, was demolished to be replaced by a
shopping arcade. The beach, stretching south from Noosa to the Maroochy River, was
filling up with the resorts of Sunshine, Marcus, Peregian, Coolum and Ninderry Beaches.
High-rises had been established at Maroochydore and Alexandra Headlands, and town-
houses were perched out on Point Cartwright. The ginger factory at Buderim was moved to
Yandina, as a town-house development required the land. Also in the hinterland, the inland
road linked the towns of Mapleton, Flaxton, and Montville. The second stretch of coast
from Point Cartwright south to Caloundra was also filling with the townships of Buddina,
Warana, Bokarina, Wurtulla, and Currimundi. In Caloundra, the Westaway Towers rose up
from their rocky hilltop location (Holthouse, 1982; Jenkins, 2001).
Into the 1970s, the growth of the residential areas of Tewantin and Noosaville continued,
with tourist accommodation and private dwellings increasing at Noosa Heads. Sunshine and
Peregian Beaches were developing both residential and holiday accommodation. Noosa
Junction, at the bottom of Noosa Hill, was the last area to be settled (Edwards, 2001). The
Noosa Shire Division 4 Town Planning Scheme was gazetted in 1973. This continued to
support concentrated residential and accommodation units, hotels, and ‘communal premises’
for the Tewantin and Noosa Division. However high density proposals could be rejected if

Noreen Breakey Tourism Destination Development
Chapter Four – Destination Case System: An Historical Overview 182
the development was considered to have a negative affect on the environment, traffic, or
public utilities (PLI & PWA, 1980).
By the beginning of the 1970s, two Victorian families had purchased the Pine Trees Caravan
Park, which occupied two acres of land between Hastings Street and the Noosa River. This
company built a Mobile Service Station on Hastings Street, and in 1973, a six unit motel,
which was expanded the following year to 32 units. The motel incorporated a restaurant and
a few shops, and was affiliated with the Flag Motel Group. An adjacent block was
purchased in 1975 and 14 units erected. Another resort building was added in 1978, with 28
more units and a number of commercial premises (PLI, 1980).
In 1973 Butts’ Shopping Town was opened, later to be renamed Big Top Shopping Centre.
It was built by the grandson of the owner of the original Maroochydore store (Maroochy
Shire Library Service, 1994). The following year the Noosa Heads Surf Life Saving Club
opened its modern clubhouse, complete with a liquor license (Cato, 1989). By 1977,
Kawana Estates, in the Landsborough Shire was under way (Jenkins, 2001), and in 1979, the
new terminal at Maroochy Airport opened (Maroochy Shire Library Service, 1994). Also in
1979, the first King of the Mountain race was held in Pomona. The race has been held every
year since (Edwards, 2001).
By the early 1970s state and territory tourist bureaus were competing for the role of booking
agent with both the increasing numbers of commercial travel agencies, which had spread to
most shopping areas, and the motoring organisations, which controlled the accommodation
guide market (Davidson & Spearritt, 2000). To encourage travel to the Sunshine Coast,
representatives from the three shires flew to Sydney in the early 1970s. The discovery that
people wanted package deals resulted in inclusive deals, incorporating airfares, transfers,
and accommodation for seven, ten, or fourteen days. East-West Airlines, which had only
begun direct flights from Sydney to Maroochydore in 1970, increased the number of flights
to cater for the extra bookings. The number and type of packages offered expanded as
Traveland and Qantas became involved in the second half of the decade (Edwards, 2001).
The role of the regional marketing body, the Sunshine Coast Promotion Bureau was
expanded to incorporate a tourism development focus in 1976, and was renamed the
Sunshine Coast Tourism and Development Board (Prideaux & Cooper, 2002).

Noreen Breakey Tourism Destination Development
Chapter Four – Destination Case System: An Historical Overview 183
In 1979 the Queensland Tourist and Travel Corporation (QTTC) was formed, as a
replacement of the Department of Tourism, taking control of the fourteen Queensland
Government Tourist Bureaus (Williams, 1980). The primary functions of QTTC were to
promote and market tourism and travel, make tourism and travel arrangements, provide
tourism and travel information services, encourage the development of the tourism and
travel industry, and advise Ministers (Queensland Government, 1979).
Also in 1979, recognition of the potential income and employment offered by the tourism
industry, resulted in extra assistance from the Federal Budget. Funding for the ATC was
almost doubled for the 1979/80 year and a system of deprecation introduced for tourist
accommodation providers constructing new or extended facilities. The focus of the overseas
marketing by the ATC were to be the source markets of Japan, North America, and Britain
(Rider Hunt and Partners, 1979).
4.5 Development of Tourism in the Case Area: 1980 –
1997
This section summarises the general development and the growth of tourism within the
study area, from 1980 to 1997. This summary aims to highlight significant people, policies,
developments, and events that have affected tourism within the case system. As there has
been significant tourism development since 1980, it is possible to examine periods of
development and decline, both gradual and sudden, as well as periods of equilibrium.
The development of tourism in the case system, from 1980 to 1997, is grouped into six
phases; Development Boom and Bust (1980-1982), Recovery Period (1983-1985), Tourism
Boom (1986-1988), The Recession (1989-1991), Recovery Period (1992-1994), and the
Unstable Period (1995-1997). The three-year phases are not arbitrary but were determined
by the economic and political climate, and the extent of general development and tourism
growth exhibited during that time (Figure 4.4 and Figure 4.5)16.
16 Note - For variables that are measured in Australian dollars, such as the value of building, visitor expenditure and hotel sector takings, all have been converted to incorporate the CPI adjustment (base financial year of 1989-1990).

Noreen Breakey Tourism Destination Development
Chapter Four – Destination Case System: An Historical Overview 184
Figure 4.4 Changes in Key Growth Indicators between 1980 and 1997.
Annual Percentage Change in Population (ERP)
0
1
2
3
4
5
1980 1981 1982 1983 1984 1985 1986 1987 1988 1989 1990 1991 1992 1993 1994 1995 1996 1997Year
%C
hang
e
Queensland
Australia
Gross Domestic Product (Average) Australia - Percentage Change
-3
-2
-1
0
1
2
3
4
5
6
1979
/80
1980
/81
1981
/82
1982
/83
1983
/84
1984
/85
1985
/86
1986
/87
1987
/88
1988
/89
1989
/90
1990
/91
1991
/92
1992
/93
1993
/94
1994
/95
1995
/96
1996
/97
1997
/98
Year
%C
hang
e
Interest Rates - Australia - at mid year
0
2
4
6
8
10
12
14
16
18
20
1980 1981 1982 1983 1984 1985 1986 1987 1988 1989 1990 1991 1992 1993 1994 1995 1996 1997Year
%C
hang
e
Housing Loan Interest Rate
Daily Cash Market Interest Rate
CPI - Australia
0
20
40
60
80
100
120
140
1980
/81
1981
/82
1982
/83
1983
/84
1984
/85
1985
/86
1986
/87
1987
/88
1988
/89
1989
/90
1990
/91
1991
/92
1992
/93
1993
/94
1994
/95
1995
/96
1996
/97
1997
/98
Year
Bas
eYe
ar:1
989/
90=
100.
0

Noreen Breakey Tourism Destination Development
Chapter Four – Destination Case System: An Historical Overview 185
Value of Total Building Commenced in Queensland
0
1000
2000
3000
4000
5000
6000
7000
8000
1979
/80
1980
/81
1981
/82
1982
/83
1983
/84
1984
/85
1985
/86
1986
/87
1987
/88
1988
/89
1989
/90
1990
/91
1991
/92
1992
/93
1993
/94
1994
/95
1995
/96
1996
/97
1997
/98
Year
$m
Value of Hotel Building Commenced in Queensland
050
100150200250300350400450500550600
1979
/80
1980
/81
1981
/82
1982
/83
1983
/84
1984
/85
1985
/86
1986
/87
1987
/88
1988
/89
1989
/90
1990
/91
1991
/92
1992
/93
1993
/94
1994
/95
1995
/96
1996
/97
1997
/98
Year
$m
Overseas Visitors to Australia
0
500
1,000
1,500
2,000
2,500
3,000
3,500
4,000
4,500
5,000
1980 1981 1982 1983 1984 1985 1986 1987 1988 1989 1990 1991 1992 1993 1994 1995 1996 1997Year
Shor
tTer
mA
rriv
als
('000
s)
Domestic Visitors to Queensland - Staying in Commercial Accommodation
0
1000
2000
3000
4000
5000
6000
7000
1980/81 1982/83 1984/85 1986/87 1988/89 1990/91 1992/93 1994/95 1996/97Year
Vist
ors
('000
s)

Noreen
Breakey
TourismD
estinationD
evelopment
ChapterFour–
Destination
Case
System
:An
HistoricalO
verview186
Figure4.5
ThePhasesofD
evelopmentbetw
een1980
and1997.
19801981
19821983
19841985
19861987
1988
InternationalS
ituation/Events
NegativeEconom
icG
rowthAustralia
wonthe
Americas
CupRelease
ofCrocodile
Dundee
USExchange
RatePeaks
AgainstA$
Stockmarket
Crash
LargestSourceCounty
-Japan
FederalM
inistry
PaulHoganAds
AirfaresSlashed
State
Ministry
&Bust
State
Tourism
&E
ventsBoeing
ReportCom
monwealth
Gam
esSecond
BoeingReport
Expo88
JohBjelke-Petersen
BobHawke
HighG
rowthin
InternationalVisitors
Malcolm
Fraser
Mike
Ahern
Develo
pm
entB
oo
m&
Bust
Recovery
To
urism
Bo
om
Promotion
ofQ
ueenslandO
verseas
TourismO
verseasProm
otionSchem
e
InternationalVisitors
toA
ustraliaPeak
Visitationfrom
USHigh
Growth
inInternationalVisitors
State
LevelHigh
PopulationG
rowth
IncreasedTrade
withAsia
NegativeEconom
icG
rowth
Deregulation,G
lobalisation,Housing-led
Recovery
BrisbaneAirport
Upgrade
IntegratedResort
DevelopmentAct
FallingAustralian
Dollar
QTTC
Operating
High-riseBuilding
Boom
NationalT
ourism&
Events
Timeshare
Accomm
odation
State
Governm
ent
FederalG
overnment
TwoAirline
Agreement
Departmentof
Sport,Recreation&
Tourism
FederalLevel
Increasein
AirfaresG
rowthin
5-starhotels
ForeignInvestm
entEncouraged
One
Million
VisitorM
ark
AustraliaNo.1
Preferencefor
Americans

Noreen
Breakey
TourismD
estinationD
evelopment
ChapterFour–
Destination
Case
System
:An
HistoricalO
verview187
19891990
19911992
19931994
19951996
1997
InternationalS
ituation/Events
GulfW
arAsian
Economic
Crisis
FederalM
inistry
NationalTourismStrategy
AviationPolicy
Reforms
IncreasingTrade
withAsia
Housing-ledRecovery
Dropin
AirfaresRise
&Fallof
Compass
IncreasedDirectFlights
UpgradeofPacific
Highway
State
Ministry
R.Cooper
PopulationPasses
3M
illion
State
Tourism
&E
ventsCEDA
ReportonQ
ldTourism
LionsConference
inBrisbane
Exhibition/ConventionCentre
open
BobHawke
(c'ont)
InternationalVisitors
toA
ustralia
FederalG
overnment
FederalLevel
NationalT
ourism&
Events
TourismPolicy
AustraliaNo.1
Preferencefor
Japan
Recessio
n
Wayne
Goss
Reco
very
JohnHoward
BobBorbidge
TourismForecasting
Council
State
Governm
ent
Un
stable
PaulKeating
Growth
ininternationaltravelby
Asians
Departmentof
Industry,Science&
Tourism
HighPopulaiton
Growth
AirlineDeregulation
Departmentof
Tourism
PilotsDispute
Economic
Recession
State
Level
QTTC
Overseas
Review
Rise&
FallofCom
passII
BuildingUnits
andG
roupTitles
Act
Qantas
Floated
BankruptBusinesses
Qantas
TakeoverofAustralian
Airlines
IntlAirport,Quay
West,Novotel,
TreasuryCasino
ZeroEconom
icG
rowth
Economic
Reform,
Deregulation,Privatisation
QTTC
Promotes
Queensland
Destinations
Changefrom
TraditionalM
arketsto
AsianNations

Noreen Breakey Tourism Destination Development
Chapter Four – Destination Case System: An Historical Overview 188
Information for this section has been sourced from various government reports, industry
reports, development reports, books, and journals. In order to provide a context for the
building activity and the development of the study area, both in general and for tourism
specifically, the Rider Hunt reports have been utilised. These development reviews provide
understanding of the building sector, the economic climate, investment, political change,
and tourism development on a quarterly basis, as seen by Rider Hunt and Partners.
Although the initial report was for the Gold Coast, the report was expanded to include the
Sunshine Coast from 1980, becoming the Queensland Development Report in 1988. This
type of detailed and regular information on the ‘current’ situation has been invaluable in this
analysis. However it is important to note that these reports aim to provide information to
assist development. Wherever possible this information is supported, or questioned, by
additional sources.
4.5.1 Development Boom and Bust: 1980 - 1982
In 1980, Queensland was experiencing a high rise development boom. This building frenzy,
most evident on the Gold Coast, had begun in 1977 and reached its peak in 1981 (Figure
4.6). The boom was partially due to the abolishment of death duties in 1977 by the state
government, in conjunction with lower interest rates and rising inflation (Figure 4.4) (Jones,
1986).
Figure 4.6 High Rise Building Boom and Bust on the Gold Coast. As shown by the number of new dwelling approvals for houses and units and the number of commenced developments 1977-1983 (ABS 8731.3 Building Approvals, Queensland).
0
5 0 0
1 0 0 0
1 5 0 0
2 0 0 0
2 5 0 0
3 0 0 0
3 5 0 0
4 0 0 0
4 5 0 0
5 0 0 0
5 5 0 0
D e c - 7 6 J u n - 7 7 D e c - 7 7 J u n - 7 8 D e c - 7 8 J u n - 7 9 D e c - 7 9 J u n - 8 0 D e c - 8 0 J u n - 8 1 D e c - 8 1 J u n - 8 2 D e c - 8 2 J u n - 8 3 D e c - 8 3
H a lf Y e a r ly
Num
ber
T o t a l A p p r o v a l s
T o t a l C o m m e n c e m e n t s
H o u se s - A p p r o v a l s
U n i t s - A p p r o v a l s

Noreen Breakey Tourism Destination Development
Chapter Four – Destination Case System: An Historical Overview 189
The crash in early 1982 was due to rising interest rates, increased construction costs, and the
lowering of death duties in other states (Jones, 1986). After a number of years of national
economic growth under the Fraser Government, the financial year of 1982/83 recorded
negative growth of 2.5 percent. This economic predicament was not isolated to Australia,
with 1982 considered one of the worst years internationally since the depression of the
1930s (Rider Hunt and Partners, 1983).
By 1982 the high population growth of Queensland, when compared to the other States and
Territories, had been recognised. The increasing population was seen by Premier Bjelke-
Peterson as a reflection of the perceived potential of Queensland growth, and as a forerunner
of new businesses, ideas, opportunities, investment and development (Rider Hunt and
Partners, 1982). This was further enhanced by the successful holding of the 1982
Commonwealth Games, which placed Brisbane ‘back on the map’ (Garnsey, 1984; Sutton,
1984; Barker, 1992).
The potential in Queensland had been realised but much of the growth was in the planning
stages, and existing development was often the culmination of a number of individual
projects. This was particularly evident for tourism. At that time tourism in Queensland was
considered highly competitive, inconsistent, uncoordinated, and lacked an ‘industry’ identity
(PLI & PWA, 1980).
The first ‘Boeing Report’, in 1981, provided an understanding of the potential of tourism
within Queensland, and the corresponding need for development and marketing to achieve
this (QTTC & Boeing, 1981). The report considered Queensland to be in the “initial stage of
tourism expansion” as it was “not a well-known travel destination”, although it was
perceived to have “the greatest untapped potential of any world tourist market” (QTTC &
Boeing, 1981 pp.3&9).
This Boeing Report provided forecasts for the expected level of domestic and international
visitors to Queensland for 1983 and 1985 for two scenarios, a ‘Natural’ or ‘Baseline’ level
of annual growth, and an ‘Accelerated’ level that could occur if an ‘aggressive tourism
posture’ was adopted (QTTC & Boeing, 1981). The predicted number of international
arrivals to Australia for 1983 and 1985 have been compared to the actual visitors, as
recorded by the Australian Bureau of Statistics (ABS) (Figure 4.7). This shows that

Noreen Breakey Tourism Destination Development
Chapter Four – Destination Case System: An Historical Overview 190
although the forecasts were not achieved, the 1983 prediction was met by 1985, and the
1985 prediction was exceeded by 1986.
Figure 4.7 International Arrivals to Australia. Actual Visitor Arrivals (ABS 3401.0 Overseas Arrivals and Departures) and the 1981 Boeing predictions (QTTC & Boeing, 1981).
Growth in international visitor numbers to Australia in the late 1970s was greater than the
world trend. This growth was attributed to cheaper airfares and an increased level of
marketing and promotion. The main sources of international tourists during this period were
New Zealand, North America, United Kingdom/Ireland, Continental Europe, and Japan.
Also at the National level, the passing of the two airline agreement in 1981, resulted in the
reorganisation of the services of Ansett and TAA and a significant increase in the price of
airfares (Williams, 1980; Jones, 1986; Barker, 1992; Atherton & Atherton, 1998;
Richardson, 1999).
At this time, the domestic market still accounted for more than 90 percent of all visitors,
with 80 percent of domestic trips originating in the same state as the destination. However,
the focus of Government was on international visitors as earners of foreign capital (PLI &
PWA, 1980).
0
250
500
750
1000
1250
1500
1750
2000
1973 1974 1975 1976 1977 1978 1979 1980 1981 1982 1983 1984 1985 1986
Year
Shor
tTer
mA
rriv
als
(000
's)
Actual Short-Term Overseas Arrivals
1981 Boeing - 'Normal' Forecasts

Noreen Breakey Tourism Destination Development
Chapter Four – Destination Case System: An Historical Overview 191
4.5.1.1 The Sunshine Coast - Development Boom and Bust: 1980 - 1982
By the beginning of the 1980s the Sunshine Coast region had changed from a quiet rural
area based on primary industries to a mainly urban environment focused on the leisure
industry (Edwards, 2001). In the expanding resort towns, entertainment focused around
surfing, fishing, golf, river cruising, and dining, but with little of the nightlife found on the
Gold Coast (Holthouse, 1982). Despite this transformation, the rural history of the region
was still in evidence. In Noosa Shire, the Council was still located in Pomona, a small
inland rural town.
In the Noosa Shire, Noosa Junction was overtaking Tewantin as the commercial centre
(Edwards, 2001). Hastings Street had also been transformed from the pre-war beach
architecture to modern brick and tile buildings, although it still maintained its reputation as
the one ‘party’ street (Gloster, 1997).
Part of the reason that Queensland was perceived as being a progressive state in the early
1980s was the building boom taking place on the Gold and Sunshine Coasts (Figure 4.8)
(Garnsey, 1984). Unlike the Gold Coast the abolishment of death duties in Queensland in
early 1977 took a year to affect the level of investment in residential building on the
Sunshine Coast. The new demand for residential accommodation resulted in increased
approvals, but the limited workforce spread the commencements through into the early
1980s (Rider Hunt and Partners, 1980).
As a result of the building activity the Sunshine Coast was transformed from a “quiet, out-
of-the-way holiday spot for the knowledgeable few…..(to a) boom area with frantic
residential and commercial development leaping ahead as fast as the bulldozers could push
aside the coastal scrub” (Toghill, 1982 p.23). However, it was thought at that time, that the
development was more ‘tastefully executed’ than in other locations because of the control
exercised by the local governments (Toghill, 1982).
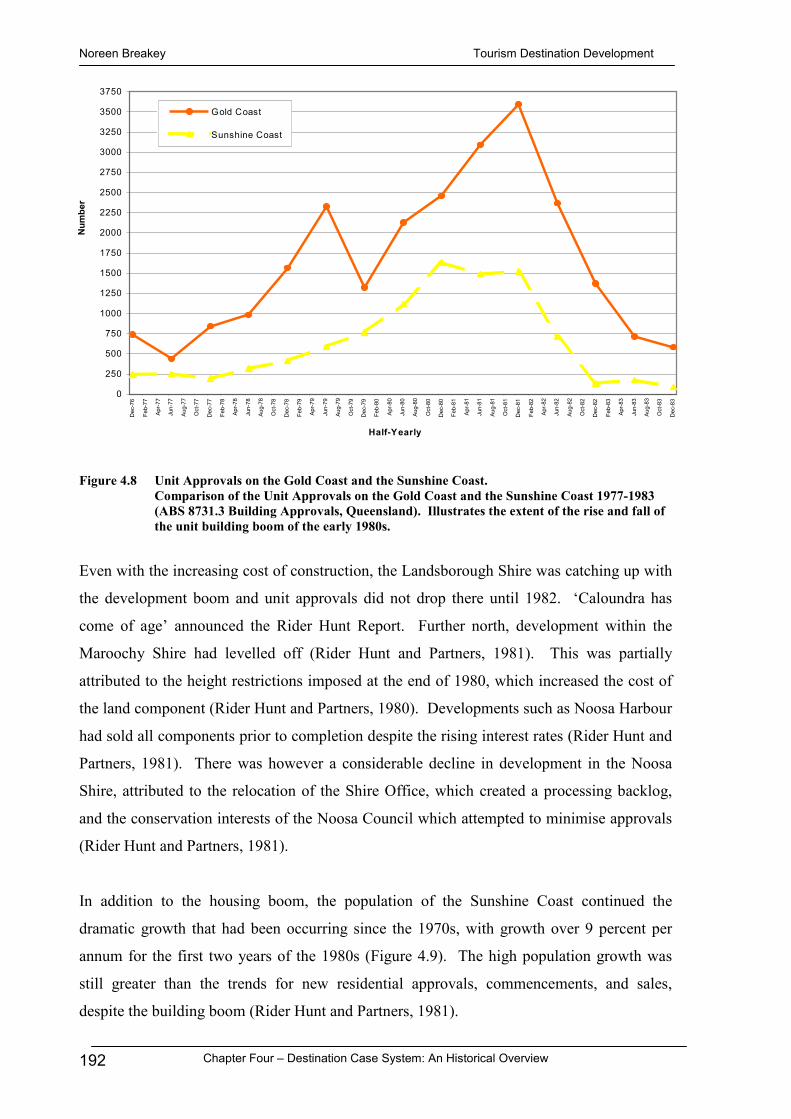
Noreen Breakey Tourism Destination Development
Chapter Four – Destination Case System: An Historical Overview 192
Figure 4.8 Unit Approvals on the Gold Coast and the Sunshine Coast. Comparison of the Unit Approvals on the Gold Coast and the Sunshine Coast 1977-1983 (ABS 8731.3 Building Approvals, Queensland). Illustrates the extent of the rise and fall of the unit building boom of the early 1980s.
Even with the increasing cost of construction, the Landsborough Shire was catching up with
the development boom and unit approvals did not drop there until 1982. ‘Caloundra has
come of age’ announced the Rider Hunt Report. Further north, development within the
Maroochy Shire had levelled off (Rider Hunt and Partners, 1981). This was partially
attributed to the height restrictions imposed at the end of 1980, which increased the cost of
the land component (Rider Hunt and Partners, 1980). Developments such as Noosa Harbour
had sold all components prior to completion despite the rising interest rates (Rider Hunt and
Partners, 1981). There was however a considerable decline in development in the Noosa
Shire, attributed to the relocation of the Shire Office, which created a processing backlog,
and the conservation interests of the Noosa Council which attempted to minimise approvals
(Rider Hunt and Partners, 1981).
In addition to the housing boom, the population of the Sunshine Coast continued the
dramatic growth that had been occurring since the 1970s, with growth over 9 percent per
annum for the first two years of the 1980s (Figure 4.9). The high population growth was
still greater than the trends for new residential approvals, commencements, and sales,
despite the building boom (Rider Hunt and Partners, 1981).
0
250
500
750
1000
1250
1500
1750
2000
2250
2500
2750
3000
3250
3500
3750
Dec
-76
Feb-
77
Apr-7
7
Jun-
77
Aug-
77
Oct
-77
Dec
-77
Feb-
78
Apr-7
8
Jun-
78
Aug-
78
Oct
-78
Dec
-78
Feb-
79
Apr-7
9
Jun-
79
Aug-
79
Oct
-79
Dec
-79
Feb-
80
Apr-8
0
Jun-
80
Aug-
80
Oct
-80
Dec
-80
Feb-
81
Apr-8
1
Jun-
81
Aug-
81
Oct
-81
Dec
-81
Feb-
82
Apr-8
2
Jun-
82
Aug-
82
Oct
-82
Dec
-82
Feb-
83
Apr-8
3
Jun-
83
Aug-
83
Oct
-83
Dec
-83
Half-Yearly
Num
ber
Gold Coast
Sunshine Coast

Noreen Breakey Tourism Destination Development
Chapter Four – Destination Case System: An Historical Overview 193
Figure 4.9 Annual Percentage Change in Population. Comparison of the annual percentage change in population (ERP) for the Sunshine Coast, Queensland, and Australia 1977-1982 (ABS 3212.3, ABS 3202.3 & ABS 3218.0).
By early 1982, the previous two years of high demand had finally been met, heralding a
drop in approval and commencement activity (Rider Hunt and Partners, 1982). The building
bubble had burst and the following downturn continued for almost five years (Cato, 1989).
The beginnings of ‘mass tourism’ on the Sunshine Coast were evident in the early 1980s.
The provision of new quality accommodation, and general tourist services and computer
booking facilities were expected to attract the package tour operators with their large visitor
numbers (Rider Hunt and Partners, 1981). In comparison to almost 3 000 hotel/motel rooms
on the Gold Coast in early 1980, Maroochy Shire had 558 rooms, and Landsborough Shire
113 rooms (PLI, 1980). There was also significant tourism development planned,
particularly for Noosa.
Noosa Holdings was aiming to expand its tourism facilities in Noosa Heads, changing the
‘scale and character’ of the destination and appealing to top market cliental (PLI, 1980).
One of their proposals was to remove the council caravan park at Noosa Woods and upgrade
the area to a naturally planned native parkland, in exchange for the opportunity to develop
0
1
2
3
4
5
6
7
8
9
10
11
12
13
14
1977 1978 1979 1980 1981 1982
Year
%
Australia
Queensland
Sunshine Coast Statistical District

Noreen Breakey Tourism Destination Development
Chapter Four – Destination Case System: An Historical Overview 194
an international hotel on Noosa Spit, located past the Woods. The long term plan was then
to close the Woods off to the public, thereby providing a natural ‘garden’ for the use of their
hotel guests (PLI, 1980).
The completion of this newly created Noosa Spit provided an opening for developers to
utilise this prime, but unstable location. In addition to the plans of Noosa Holdings, a
consortium proposed a development incorporating a deep water marina behind the Spit.
Opposition by the Noosa Parks Association and the community assisted in its ultimate
withdrawal (Gloster, 1997).
In the Noosa Shire a limit of six storeys had been established by the council, as a
compromise between the developers aim for 12 storeys and the conservationists lobby for
three storeys. As a result, numerous six storey buildings along the non-ocean side of
Hastings Street were proposed and approved (Gloster, 1997). The number of developments
approved by Noosa Council resulted in the forming of a concerned citizens group to protest
over the number of multiple dwellings, particularly around Sunshine Beach, as the area did
not even have sewerage (Cato, 1989). In the Maroochy Shire, another lobby group was
vocally opposing high rise development. The situation was even more untenable as the
development polices of council had not been clarified (Rider Hunt and Partners, 1980).
The results of the State Government’s Coastal Management Investigation had been released
in 1976. The recommendations supported the aim of the Noosa Parks Association to protect
the strip of land between the existing coastal development and Lake Weyba. To this end, it
had been recommended that any new arterial road between Noosa and Maroochy be located
west of the lake. Despite this, the council agreed to T.M. Burke’s plan to develop a town
plan for the coastal strip, running south from Sunshine Beach to Peregian Beach. This in
effect gave the developer the opportunity to pay for a town plan that would ‘control’ his
development. However, by the time Main Roads announced this planned eastern route
almost a decade had passed and an environmentally conscious Noosa Council had been
elected. The council, supported by the Noosa Parks Association and the local residents, was
able to have the route changed back to the inland side of the lake. This allowed for the
ultimately successful lobbying of the Goss Government, by numerous forces, to have the
coastal strip added to Noosa National Park (Gloster, 1997).

Noreen Breakey Tourism Destination Development
Chapter Four – Destination Case System: An Historical Overview 195
The proposed level of tourism-related development of the early 1980s was related to the
building boom and was therefore significantly affected by the building bust. Although this
boom and subsequent drop in building activity was not at the level experienced on the Gold
Coast, the change in the building market prevented planned developments from progressing
and businesses did fail. In Noosa Heads, the numerous six storey proposed developments
along the non-ocean side of Hasting Street did not eventuate. In particular, the Noosa
Holdings development group was declared bankrupt, thus ending their development plans
(Gloster, 1997).
Although the 1979-1982 Noosa Council was considered by Rider Hunt and Partners (Rider
Hunt and Partners, 1981) to have minimised approvals for conservation reasons, the council
was generally perceived as pro-development (Gloster, 1997). In response ‘The Residents’
Team’ was established and elected. They aimed to be “reform-orientated new councillors
with strong conservation, town planning, design, and lifestyle protection priorities” (Gloster,
1997 p.15). They believed that Noosa could be both economically and ecologically
sustainable. In the aftermath of the development boom, Hastings Street properties had been
put back into the depressed market, and business confidence had plummeted. The newly
elected council called for a workshop incorporating all the stakeholders. The input provided
the base for the Hastings Street Development Control Plan (Gloster, 1997).
4.5.2 Recovery Period: 1983 - 1985
In addition to the collapse of the high rise boom and the economic downturn, the early
1980s had seen increasing unemployment, a drought affected agricultural sector, extensive
bush fires, and the collapse of the mineral boom. Under these conditions the Federal
Coalition Government was replaced in 1983 by Bob Hawke’s ALP Government (Chambers,
1999; Macintyre, 1999).
By 1984, the effects of the Hawke Government were beginning to gradually change the
economic environment of Australia, with a focus on deregulation, globalisation,
rationalisation, and large-scale entrepreneurial businesses. The housing led economic
recovery, assisted by the end to the drought, the drop in interest rates, and the jump in
consumer confidence, resulted in positive economic growth.

Noreen Breakey Tourism Destination Development
Chapter Four – Destination Case System: An Historical Overview 196
The growth in the Australian economy was in the forefront of world recovery. Private
sector business investment was positive, the employment situation was improving, and
interest rates were starting to rise (Figure 4.4). This economic rate of growth although
continuing was expected to slow down (Rider Hunt and Partners, 1985, 1986).
This period was the beginning of a new business era, with strong links between politics and
the private arena. This affected tourism development, with the focus on corporate
development, rather than small enterprises established by individuals (Richardson, 1999).
One of Hawke’s ‘business mates’ was Alan Bond, the entrepreneur behind the win of the
America’s Cup Yacht Race for Australia in 1983 (Norington, 1990; Stewart, 1994). Also in
the public eye were business figures including Christopher Skase, who owned and
developed the Mirage resorts at the Gold Coast and Port Douglas (Stewart, 1994).
The surplus of units from the boom period, combined with the growing global trend,
resulted in the rise of timeshare accommodation. However the momentum was not
maintained and the sector was in decline within a few years.
In 1983 the Hawke Ministry established the Department of Sport, Recreation, and Tourism.
The new Federal Minister for Tourism, Mr Brown, was perceived as understanding the
potential benefits of tourism and supporting its development (Rider Hunt and Partners,
1983).
At the State level, the collection of tourism-related data by the ABS and QTTC was
revealing the economic benefits of tourism in Queensland. Further research into the visitor
characteristics was seen by Mr Peter McKechnie, the Queensland Tourism Minister, as
necessary to assist future planning and the tourist operators (Rider Hunt and Partners, 1984).
In 1983, Queensland also began actively promoting the State in the international arena,
despite pressure to pool resources for national promotion. Queensland considered it was just
‘tagged onto’ the national campaigns, with the dominate focus on the southern States. In
addition, delays in decisions at the Federal level reinforced Queensland’s decision to
conduct its own promotion (Rider Hunt and Partners, 1983).

Noreen Breakey Tourism Destination Development
Chapter Four – Destination Case System: An Historical Overview 197
Early 1984 heralded a slash in domestic airfares, with drops of up to 45 percent (Rider Hunt
and Partners, 1983). Internationally two new multi-stopover airfares were introduced to
encourage international travel to and within Australia. The existing domestic airfares had
previously been seen as a discouragement for inbound tourists to leave the main arrival port
of Sydney.
The new airfares were in conjunction with the advertising campaigns that featured Paul
Hogan, encouraging Americans to ‘Visit Oz’ and Australians to ‘See Australia First’ and
included the ‘throw another shrimp on the barbie’ advertisement (Rider Hunt and Partners,
1984; Richardson, 1999). This release of Paul Hogan and Crocodile Dundee in the mid
1980s had extensive exposure, with the initial advertisements in California resulting in an 80
percent increase in visa applications from the state by mid 1984 (Rider Hunt and Partners,
1984; Barker, 1992). In the three years to 1985 Australia had moved from the 49th
preference for American tourists to number one (Rider Hunt and Partners, 1986).
Consequently, during this three year Recovery Period there were a number of factors which
influenced arrivals to Australia by US visitors. These included the drop in airfares, new
stopover airfares, the drop in the A$ in relation to the US$, significant promotional activity,
and the winning of the Americas Cup by Australia. This corresponds with data on the
change in the pattern of visitation of arrivals to Australia from the US during this 1983 and
1985 period (Figure 4.10). These changes were in addition to the expected natural increase
in visitation forecast in 1981 by the Boeing Report (QTTC & Boeing, 1981), which
accurately predicted the 1983 visitation level.
The US Dollar strengthened against the Australian Dollar in this three year recovery period.
During the initial low growth period (1975-1983), the US$ compared to the A$, dropped
from $1.20 in 1975/6 to only 86c by 1983/84, reaching a low of 66c in 1984/85. Through
the remainder of the growth period, and the subsequent drop and gradual increase in
visitation, the US$ has fluctuated between $0.66 and $0.79.
Partially due the increasing visitation from the US, Australia past the mark of one million
international annual visitors in 1984 (Figure 4.7). At this time the other main growth market
was Japan (Rider Hunt and Partners, 1985).

Noreen Breakey Tourism Destination Development
Chapter Four – Destination Case System: An Historical Overview 198
Figure 4.10 United States: Arrivals into Australia and Exchange Rate. Short-term visitor arrivals to Australia from the US 1975-1997 (ABS 3401.0 Overseas Arrivals and Departures), compared with the exchange rate (Reserve Bank of Australia) and the predictions made in the 1981 Boeing Report (QTTC & Boeing, 1981), and illustrating the change in the pattern of visitation that occurred during this 1983-1985 period.
By 1985 there was an air of optimism about tourism for the coming years. Planned events
included America’s Cup, Expo 88, Bicentennial celebrations, and the annual Formula One
Grand Prix (Department of Sport Recreation and Tourism, 1985). In order to capitalise, the
federal government was actively promoting Australia as a destination. In addition to the
established commonwealth and state bodies, the Tourism Overseas Promotion Scheme was
put in place to facilitate and coordinate promotion of Australia to encourage increased
inbound tourism (Department of Sport Recreation and Tourism, 1985).
4.5.2.1 Sunshine Coast - Recovery Period: 1983 - 1985
The growth in tourism visitation to the Sunshine Coast during the early years of the 1980s
was expected to continue, especially with the coming introduction of medium-sized jets to
the Maroochydore airport (Rider Hunt and Partners, 1983). An additional drawcard to the
region was the Noosa Triathlon, first held in 1983. The popularity of this annual event
0255075
100125150175200225250275300325350
1975
1976
1977
1978
1979
1980
1981
1982
1983
1984
1985
1986
1987
1988
1989
1990
1991
1992
1993
1994
1995
1996
1997
Year
Num
bero
fOve
rsea
sA
rriv
als
(000
's)
0.00
0.20
0.40
0.60
0.80
1.00
1.20
1.4019
75/76
1976
/77
1977
/78
1978
/79
1979
/80
1980
/81
1981
/82
1982
/83
1983
/84
1984
/85
1985
/86
1986
/87
1987
/88
1988
/89
1989
/90
1990
/91
1991
/92
1992
/93
1993
/94
1994
/95
1995
/96
1996
/97
Financial Year
US$
perA
$1
United States Arrivals1981 Boeing PredictionsUnited States Dollar

Noreen Breakey Tourism Destination Development
Chapter Four – Destination Case System: An Historical Overview 199
ultimately resulted in a limit being placed on the number of competitors (Edwards, 2001).
Also introduced during this period was the annual race meeting at Corbould Park in
Caloundra (Jenkins, 2001).
By 1983, the price of units had dropped to 70 percent of their boom prices. However buyers
were still evident for the high quality, well positioned, discounted properties. New high rise
projects were not expected to eventuate, until the existing units were sold. In addition, such
projects would have to conform to the new building height restrictions of 12 floors in
Landsborough Shire and 6 floors in Maroochy Shire (Rider Hunt and Partners, 1983).
Despite the oversupply of units in 1983, an increase in housing approvals was considered
necessary to prevent an under supply of new house stock (Rider Hunt and Partners, 1983).
The population growth, while the lowest in five years was still above 5 percent per annum,
for 1982 and 1983. The turn around in the residential building sector was also expected to
be assisted by the lower interest rates for 1983 (Figure 4.4) (Rider Hunt and Partners, 1983).
Commercial property development was occurring with developers able to take advantage of
low tenders by builders and sub-contractors due to the limited level of new dwelling
construction. This involved aged care facilities and shopping centre expansions at Kawana,
Maroochydore, and Bli Bli (Rider Hunt and Partners, 1983).
Development of Noosa Spit again became an issue in 1983. The newly formed QTTC had
been given the opportunity to develop two coastal sites that were currently public land.
QTTC selected Port Douglas and Noosa Spit, where it aimed to construct an international
resort and a deep water marina. Community protest again assisted in the decision that
QTTC would ‘look elsewhere’ (Gloster, 1997).
By 1984, the home unit building sector was showing signs of recovery with the highest
number of sales since the property crash of early 1982 (Rider Hunt and Partners, 1984). The
release of new projects included the popular ‘six pack’ walk up units which are relatively
inexpensive for the developer and the buyers (Rider Hunt and Partners, 1984).

Noreen Breakey Tourism Destination Development
Chapter Four – Destination Case System: An Historical Overview 200
In addition, a new form of accommodation, timesharing, had reached the Sunshine Coast
with the remarketing of a Maroochydore development as a timeshare resort in 1984 (Rider
Hunt and Partners, 1984).
During its three-year term, from 1982 to 1985, the Noosa Council achieved numerous town
planning and conservation gains. These included increased protection of Noosa River and
the North Shore, the introduction of town planning controls over Hasting Street, the
prevention of development on Noosa Spit, the construction of the boardwalk from Hastings
Street to the National Park, and the concept of a population limit proposed. In addition, the
council meetings were open to the public. This policy assisted in raising community
knowledge and survived even after subsequent changes in council members (Gloster, 1997).
The cinema complex at Noosa Junction opened in time for the Christmas season of 1985.
This was a new direction for the Junction, as a night time venue, with cafes, restaurants, and
the cinema which expanded from the initial two cinemas to five (Edwards, 2001).
4.5.3 Tourism Boom: 1986 - 1988
By the mid 1980s there was significant expansion, profitability, and optimism within the
tourism industry. The foundations for this tourism boom had been established during the
recovery period.
International tourism was becoming ‘big business’, with the falling Australian dollar
assisting inbound travel and hampering outbound tourism. There was an accompanying
increase in investment in hotels and resorts, and a recognition of the economic benefits of
tourism (Richardson, 1999). Positive signs for Queensland tourism growth were the direct
air links to the state’s airports and the potential investment from overseas resulting from the
virtual elimination of foreign investment restrictions (Rider Hunt and Partners, 1986).
Differences between the State National Party and the Federal Labor Government affected
the airline industry, as the 12 percent share of inbound direct flights to Queensland was
limited by the Federal Government. This was despite the growing visitor nights spent in the
state and the proposal presented by Sir Frank Moore, as chairman of QTTC, for a privately
funded new Brisbane international terminal, which was not accepted by the Federal

Noreen Breakey Tourism Destination Development
Chapter Four – Destination Case System: An Historical Overview 201
Government (Rider Hunt and Partners, 1987b). Although the extra flight leg from Sydney
to Brisbane was providing a boost to domestic airlines, the rising costs were resulting in
higher package prices for a Queensland holiday, make the deals less competitive
internationally (Rider Hunt and Partners, 1989).
The growth of total international visitors to Australia for 1986/87 maintained the rate of 25
percent achieved the previous year. This was the highest growth rate achieved by any
country. With the bicentenary celebrations and Expo 88 planned, the growth was expected
to continue for 1988. This level of visitation was to surpass the ‘2 million in 1988’ planned
by John Brown in 1983, when he became the Minister for Tourism, prior to Australia
meeting the one million mark (Rider Hunt and Partners, 1988).
The second Boeing Report was released in 1986, providing ‘Conservative’ and ‘Potential’
tourism growth forecasts to the year 2000 (Boeing, 1986). The aim of the follow-up Boeing
report was to determine the requirements for continued tourism growth in Queensland and
the economic benefits of such development (Boeing, 1986).
The report outlined changes in Queensland that had occurred since the initial 1981 report,
including increased understanding of tourism’s economic benefits, the need for diversified
economies, and the proliferation of tourism providers, facilities/services, flights, packages,
and promotion. The industry had reached a ‘critical mass’ that would support further
successful tourism ventures, generating a developmental momentum for tourism (Boeing,
1986).
The second report was also more comprehensive, including detailed predictions of global
and Australian economic and travel trends (Boeing, 1986). The report predicted tourism
growth for 1990, 1995, and 2000 for both ‘Conservative Development’ and ‘Potential
Development’ for a number of variables at the national and/or state levels. In addition, the
report considered visitation levels to the four main regions of Queensland (Boeing, 1986).
The potential ‘Development’ forecasts for international arrivals for 1990, 1995, and 2000
proved reasonably accurate (Figure 4.11). However, the forecasted domestic travel for
Queensland was again overly optimistic (Figure 4.12), with the actual numbers not even
reaching the ‘Conservative’ forecasts. This appears to indicate the quality of the data and

Noreen Breakey Tourism Destination Development
Chapter Four – Destination Case System: An Historical Overview 202
analysis for global travel was not matched for travel at the national level. As discussed in
Chapter Three international travel is easier to accurately measure than domestic travel.
Figure 4.11 International Arrivals to Australia – Actual and Predicted.
Actual international arrivals to Australia (IVS - 1986-2001), compared with the 1986 Boeing forecasts (Boeing, 1986).
The greater quality and quantity of tourism related data available by the mid 1980s resulted
in an expectation that these predictions would be more accurate than the 1981 forecasts
(Rider Hunt and Partners, 1987a). The Boeing predictions also assisted in increasing the
profile of tourism and provided a data driven rationale for development.
The major tourism event in Queensland during this three year period was World Expo 88,
which Brisbane hosted from the 30th of April to the 30th of October 1988 (World Expo 88
Authority, 1988).
0
500
1000
1500
2000
2500
3000
3500
4000
4500
5000
5500
6000
1986 1987 1988 1989 1990 1991 1992 1993 1994 1995 1996 1997 1998 1999 2000 2001
Year
Shor
tTer
mA
rriv
als
(000
's)
Actual Short-Term Overseas Arrivals1986 Boeing - 'Conservative' Forecasts
1986 Boeing - 'Development' Forecasts

Noreen Breakey Tourism Destination Development
Chapter Four – Destination Case System: An Historical Overview 203
Figure 4.12 Domestic Visitor Nights in Queensland – Actual and Predicted. Actual domestic visitor nights spent in Queensland (DTM - 1986-1996), compared with the 1986 Boeing forecasts (Boeing, 1986).
The build up to the Expo was also significant. According to the Rider Hunt report released
early in 1988, the hopes for Expo 88 appeared well founded, with expectations already being
reached and even surpassed, as illustrated by ticket sales and accommodation reservations
(Rider Hunt and Partners, 1988).
In support of the Expo, the new runways and domestic terminals had opened at Brisbane
Airport, and shopping hour and outdoor dining restrictions had been removed (Rider Hunt
and Partners, 1988, 1993). Provision of five-star accommodation boomed through the mid
1980s, reaching its peak in this bicentennial year (Davidson & Spearritt, 2000). The growth
was particularly evident in South-East Queensland and in the tourist areas (Rider Hunt and
Partners, 1987b). Queensland hotel and general building activity was at record levels with
most projects due for completion in time for the Expo and there were thousands of jobs
available in the construction and service sectors (Rider Hunt and Partners, 1988).
0
5000
10000
15000
20000
25000
30000
35000
40000
45000
50000
55000
60000
65000
70000
1986 1987 1988 1989 1990 1991 1992 1993 1994 1995 1996
Year
Vis
itor
Nigh
ts(0
00's
)Intrastate1986 Intrastate Boeing Conservative Forecast1986 Intrastate Boeing Development ForecastInterstate1986 Interstate Boeing Conservative Forecast1986 Interstate Boeing Development Forecast

Noreen Breakey Tourism Destination Development
Chapter Four – Destination Case System: An Historical Overview 204
Total attendance at Expo 88 reached 16.5 million visits, double the initial target of 7.8
million and significantly more than the revised forecast of 12 million (Rider Hunt and
Partners, 1988). The QTTC report on the impact of the Expo on Queensland’s tourism
industry found it an unprecedented success, with the number of visits 70 percent higher than
the optimistic forecasts (NCSTT, 1989). Brisbane itself primarily benefited with
neighbouring regions and the ‘rest of Queensland’ also experiencing higher visitation
(NCSTT, 1989). The report also predicted that tourism in Queensland would benefit in the
long-term by the high level of interest expressed in the state (NCSTT, 1989). Effects of
Expo 88 on the Sunshine Coast will be covered in following section (Section 4.5.3.1).
During the 1980s, the economies of the European countries stagnated, while those of Japan
and the ‘four tigers’: South Korea, Taiwan, Hong Kong, and Singapore attained rapid
economic growth. Indonesia, Malaysia, and China also increased their industrial
development (Macintyre, 1999). The developments in world tourism, as a result of
changing economic conditions and lifestyles, particularly applied to the Asia-Pacific region
(Grey & Edelmann, 1991). Australia extended trade with Asia and by the end of the decade
this region took half of Australia’s exports and provided half of the imports (Macintyre,
1999). Additionally increasing numbers of Asians were migrating to Australia. These
closer links with Asia, in particular eastern south-east Asia, also affected social and cultural
evolution in Australia. Balancing this out, was a loosening of ties to the United Kingdom
(Chambers, 1999).
In particular, Japan was experiencing the ‘recession of the over-valued yen’. Travelling
overseas was one way to capitalise on its buying power (Rider Hunt and Partners, 1987b).
When combined with encouragement to travel overseas by their government, Japanese
outbound travel soared.
With increasing awareness and promotion of Australian throughout 1987, the introduction of
a new airline and competitive airfares, plus the attraction of Expo 88, Japan had became the
largest national source of international visitors to Australia by 1988 (Rider Hunt and
Partners, 1989; Rider Hunt, 1994). This increasing travel by the Japanese was seen to
particularly benefit Queensland, as they appeared to favour the warm climate (Rider Hunt
and Partners, 1988).

Noreen Breakey Tourism Destination Development
Chapter Four – Destination Case System: An Historical Overview 205
This prominent attention on the mounting number of Japanese visitors in 1986 was
occurring when their yearly numbers to Australia were around 150,000. This was almost
three times the number of visitors during 1980. However, over the next six year period their
visitation was to escalate to over 600 thousand, representing a further four fold increase
(Figure 4.13). This growth rate was above even the positive ‘Potential Development’
predictions of the 1986 Boeing report.
Figure 4.13 Arrivals to Australia from Japan – Actual and Predicted.
Number of short-term overseas arrivals to Australia from Japan 1975-1997 (ABS 3401.0 - Overseas Arrivals and Departures). Highlights that although visitation had tripled over the six years from 1980 to 1986 and there was significant focus on this growing source country, the dramatic growth was yet to come, with four times the 1986 visitation level recorded by the end of the next six year period in 1992. The actual number of visitors is also compared to the predictions made in the two Boeing reports.
The growth in visitation from the US, which intensified in the mid 1980s also continued,
with 1987 and 1988 the record years for visitors from the US (as shown in Figure 4.10).
As international tourism became big business, investment in hotels and resorts increased
(Richardson, 1999). As well as publicity aiming to attract Japanese visitors to Australian
629.9
813.1
48.8145.6
352.3
0
100
200
300
400
500
600
700
800
900
1975
1976
1977
1978
1979
1980
1981
1982
1983
1984
1985
1986
1987
1988
1989
1990
1991
1992
1993
1994
1995
1996
1997
Year
Num
bero
fOve
rsea
sA
rriv
als
from
Japa
n(0
00's
)
Japan - Overseas Arrivals
1981 Boeing Case A Prediction
1986 Boeing Case A Prediction
1986 Boeing Case B Prediction

Noreen Breakey Tourism Destination Development
Chapter Four – Destination Case System: An Historical Overview 206
shores, the Queensland Minister for Tourism, Peter McKechnie, was promoting the State to
Japanese investors. This highlighted the opportunities provided by the booming Queensland
tourism industry and the limited government interference in foreign investment (Rider Hunt
and Partners, 1985).
In the year of 1987, direct tourist expenditure in Queensland increased by 37 percent, as
reported by the Major Survey Research Programme (MSRP). This rise was attributed to the
higher standard of accommodation that became available and the choice by Australians to
utilise the new hotels rather than travel overseas. This also resulted in the number of
international arrivals finally exceeding the departures of Australians overseas (Rider Hunt
and Partners, 1987b).
From mid 1987, the ABS began to collect tourist accommodation data on the use of self-
contained units, flats, and houses. This was vital to understanding the use of
accommodation by tourists, as for many destinations, including the Sunshine Coast, units
provide the majority of accommodation. In 1988, more than half the holiday units in
Queensland were located on the Gold Coast, 30 percent on the Sunshine Coast, and only 6
percent in Cairns (Rider Hunt and Partners, 1988).
Domestically, four wheel drive vehicles were also becoming popular. The addition of new
manufactures resulted in decreasing purchase prices (Davidson & Spearritt, 2000). This
affected travel to more remote destinations and four wheel drives became part of the
camping holiday.
At this time the agricultural sector was also booming as a result of the best wet season for
many years (Rider Hunt and Partners, 1988). Politically, the Hawke Ministry continued at
the Federal level. In Queensland, the ‘Joh era’ of almost twenty years, came to an end in
1987, although the National Party remained in power until 1989 under Mike Ahern, the
Member for Landsborough on the Sunshine Coast and Russell Cooper (Jenkins, 2001). The
Ahern Government’s focus was on economic development of the state, including tourism,
without the ‘cronyism’ of the ‘Joh era’. However this plan was limited by its two year term
(Reynolds, 2002).

Noreen Breakey Tourism Destination Development
Chapter Four – Destination Case System: An Historical Overview 207
4.5.3.1 Sunshine Coast - Tourism Boom: 1986 - 1988
The July 1986 issue of The Gold Coast & Sunshine Coast Development Report (Rider Hunt
and Partners, 1986) reviewed the report on Australia’s tourist industry by Mintel, a
statistical research group. This report highlighted the vital role of domestic tourism, with
domestic visitor numbers seven times higher than international visitor numbers. However,
the focus of tourism promotions was seen to be on high-cost accommodation which in
general was unaffordable for the majority of the domestic market. According to the Rider
Hunt report the Sunshine Coast should cater to the domestic travellers by providing a
complete range of accommodation types, with the focus on the middle to budget price range.
In addition, the domestic market was seen to be an increasing source as the falling
Australian dollar discouraged overseas trips (Rider Hunt and Partners, 1986).
A pro-development Noosa Council, under Bert Wansley, was elected for the 1985-1988
period. Chairman Wansley considered development to be inevitable and believed that the
role of the Council was to ensure such development was orderly. One of their specific foci
was to encourage large-scale development on the North Shore. The ‘Leisuremark’
development aimed to establish a population base there, along with major tourist projects,
including a 600 room international hotel, a golf course, an artificial lake, and an airport.
This pro-development Council was opposed by the pro-conservation Noosa Parks
Association for their three year term. Mostly each was able to stalemate the plans of the
other, but not achieve their own goals. The ‘Leisuremark’ proposal, in various forms, was
ultimately blocked after a new council was elected in 1988. Other approved projects did
however eventuate, including ‘No. 1 Hasting Street’, more commonly known as the ‘chest
of drawers’ building as it was staggered against the hillside (Gloster, 1997).
Development of Noosa Spit also became a possibility again when the pro-development
Council called for expressions of interest. This resulted in a proposal from Club Med. The
campaigns for and against were heated and the level of media attention contributed to Club
Med’s decision to consider Byron Bay instead (Gloster, 1997). After the numerous failed
proposals to develop Noosa Spit, and the continual campaigning of Noosa Parks
Association, the State Government declared that the Spit would remain a public park
(Gloster, 1997).

Noreen Breakey Tourism Destination Development
Chapter Four – Destination Case System: An Historical Overview 208
Unit sales continued on the Sunshine Coast, with the largest number occurring in Noosa
(Rider Hunt and Partners, 1986). These continuing sales lowered the supply and made
viable a number of proposed new developments (Rider Hunt and Partners, 1986).
Approvals for units, although recovering, had occurred disproportionately across the shires,
with high approval numbers in Landsborough and low numbers in Noosa (Rider Hunt and
Partners, 1986).
Due to the growing popularity of retirement villages, individual units and studios on the
Sunshine Coast began selling during 1986. By mid that year there were approximately 100
dwellings for sale, with another hundred under construction (Rider Hunt and Partners,
1986). The main restriction was the difficulty faced by the potential purchasers who needed
to sell their existing properties during the period of economic uncertainty and high interest
rates (Rider Hunt and Partners, 1986).
In the retail sector, stage one of the redevelopment of the Maroochydore Shopping Centre
was completed, and the Franklins Shopping Centre was built on the main corner of Noosa
Junction (Rider Hunt and Partners, 1986; Edwards, 2001).
The second half of 1986 saw the effects of increasing tourism. While the number of visitors
had continued to grow, there had been a greater rise in the number of visitor nights and the
level of expenditure. There had also been a jump in activity at the Maroochydore airport,
with the number of domestic passenger movements increasing over 50 percent for the
1983/84 year (Rider Hunt and Partners, 1986). This coincided with the arrival of the first
737 flight to the Sunshine Coast (Jenkins, 2001).
1986 was the end of the five year downturn that had followed the boom at the beginning of
the 1980s. It then took at least another year for the large investors to return to Noosa (Cato,
1989). Optimism about the future of the tourism industry saw the beginning of construction
of what was then called the Hyatt Coeur de Lion resort, the approval of the Nambour
redevelopment, and extension plans for the Big Pineapple (Rider Hunt and Partners, 1986).
According to Rider Hunt Report, there were two beneficial outcomes of the stock market
crash of 1987 for the Sunshine Coast (Rider Hunt and Partners, 1988). The first related to
the transfer of cash from stock market to the banking sector, which caused a fall in interest

Noreen Breakey Tourism Destination Development
Chapter Four – Destination Case System: An Historical Overview 209
rates. When combined with negative gearing for residential properties, this resulted in
increased approvals and commencements for new residential properties. The second impact
was the reduction in speculators at the top end of the unit market. The demand by these
buyers had been causing prices to escalate. Had this trend continued the market could have
collapsed. Instead constant continual growth occurred (Rider Hunt and Partners, 1988).
Interest in the potential of tourism on the Sunshine Coast was becoming greater. However,
the development of tourism facilities was seen as a necessary requirement for attracting
increasing numbers of tourists. The gradual growth of major projects, including ‘The
Wharf’ at Mooloolaba which was opened in 1988, was expected to gain momentum, as the
increased number of facilities and tourists would instil further confidence, resulting in
further investments (Rider Hunt and Partners, 1988; Jenkins, 2001).
In 1988, the Sunshine Coast Tourism and Development Board was separated into the new
Sunshine Coast Economic Development Board and Tourism Sunshine Coast, which
maintain the marketing role for the region (Prideaux & Cooper, 2002).
Although Brisbane primarily benefited from higher visitation during the Expo 88 period
from April to October 1988, the Sunshine Coast also experienced increased visitation
(NCSTT, 1989). The region attracted 3.7 million visitor nights, of which 80 percent were
from interstate or overseas. This level of visitation was an additional increase of 19 percent
on top of the average annual growth rate of 13 percent (from 1983-87). Even more
significant was the 44 percent rise in visitor expenditure on the Sunshine Coast for 1988,
compared to the previous year (NCSTT, 1989). In a review of destinations to be visited in
the future the Sunshine Coast was ranked third for both interstate and international visitors
to the Expo (NCSTT, 1989).
By the time the Hyatt Regency Coolum was nearing completion, a number of other tourism
developments had been proposed, including the Sheraton and Laguna Beach Resorts in
Noosa, Twin Waters at Mudjimba, and Underwater World at Mooloolaba (Rider Hunt and
Partners, 1988).
The Sheraton Noosa Resort was developed by Suncorp, which was a State Government
owned business. As a result it was able to bypass the local Council, so long as it “roughly

Noreen Breakey Tourism Destination Development
Chapter Four – Destination Case System: An Historical Overview 210
complied with the Council’s town plan” (Gloster, 1997 p.73). When the construction of
this, and other six storey buildings began in Hastings Street, Munna Point, and Noosa
Sound, the locals realised the impact of these high-rise developments, and ultimately voted
in a new Council. The Sheraton Noosa Resort opened in November 1989, one floor lower
than the original plan (Edwards, 2001).
Elected in 1988, this Noosa Council aimed to scale down the extensive development
supported by the previous Council. Chairman Playford was to remain head of the Noosa
Council through the subsequent Recession, Recovery, and Unstable periods. During this
decade a number of changes were made that aimed to integrate business, conservation, and
recreation. The town plan was changed to ban all high rise developments in the Shire.
Camping was removed from Noosa Woods to allow for regeneration and public utilisation
through the sealing of the road alongside Noosa Inlet to the Spit and the establishment of
picnic areas, bikeways, and walkways. This transformation provided a boost to public and
business sector support for the Playford Council. The Park Road boardwalk from Hastings
Street to Noosa National Park was expanded to provide a system of walkways that linked
the National Park, the beachfront, Noosa Woods and the Spit, Laguna Hill, Noosa Junction,
Noosa Sound, and Noosaville. This was part of the plan to ‘landscape’ the Shire, beginning
with Noosa Woods and Hasting Street, and extending to Noosaville, Noosa Junction,
Peregian Beach and Sunshine Beach, as well as inland to Kin Kin, Cooran, Pomona and
Cooroy (Gloster, 1997).
One aim of the Playford Council was to attract people who would create jobs rather than
require a job. This included self employed professionals, small business entrepreneurs and
self-funded retirees. This exclusivity extended to the type of tourist that the Noosa Council
was aiming to attract. The idea was to treat the top end of the tourist market as annual
‘honorary Noosans’. This plan was partially driven by the population cap concept, which
wanted money to be spent and invested in the Shire without excessive visitor numbers. The
focus in all areas was quality not quantity. This ‘cultural’ marketing philosophy was
supported by the introduction of annual events such as the Noosa Jazz Party, and the Hot
and Spicy Food Festival (Gloster, 1997).

Noreen Breakey Tourism Destination Development
Chapter Four – Destination Case System: An Historical Overview 211
In the Maroochy Shire, increasing visitors were arriving via the Maroochy Airport.
However, the terminal was unable to cope with the peak passenger periods (Rider Hunt and
Partners, 1988).
Also in the Council elections of 1988, Councillor Don Aldous became the second Mayor of
Caloundra City, succeeding the late Jack Beausang. His Mayoral term supported the
expansion of infrastructure throughout the City and a rate of growth seldom parallelled in
Queensland. He served on the foundation committee of Sunshine Coast Turf Club, which
built the racecourse and associated infrastructure at Corbould Park. Cr Aldous has also
served on the Sunshine Coast Tourism Board and the Sunshine Coast Economic
Development Board.
The major tourism developments in Queensland were documented in a 1988 research report
(Basch & Bull, 1988). These projects were separated into three categories: under
construction, committed, and proposed. On the Sunshine Coast there were a number of
hotels and resorts in each category, with one ‘other tourist development’ underway, and few
proposed, as shown in Table 4.1 (Basch & Bull, 1988). This illustrated the level of
optimism surrounding tourism during 1988, as the growth of the past few boom years was
expected to continue.
Table 4.1 Major Sunshine Coast Tourist Developments.
As at February 1988 (Basch & Bull, 1988).
Stage Hotels & Resorts
Other Tourist Developments
Under Construction (1988-89)
Hyatt Regency Coolum On The Beach Noosa Crest Units Maroochy River Holiday Resort
The Wharf - Mooloolaba
Committed (1989-91)
Twin Waters River Heads Resort & Marina Cascades International Rainbow Mountain Country Club Alexandra Park Tourist Village & Fauna Park Apartments Noosa
Proposed (1990-92)
Hilton Terrace Resort Settler’s Cove Club Crocodile Resort Tripcony-Hibiscus Park Development Mayfair Resort Noosa Northshore Resort Hotel Mooloolaba
Laguna Lookout & Theme Park Underwater World Harbourside Marina

Noreen Breakey Tourism Destination Development
Chapter Four – Destination Case System: An Historical Overview 212
4.5.4 The Recession: 1989 - 1991
In 1989, the growth in international tourists plateaued. The increase over the previous three
years had been the result of a number of positive factors discussed above (Rider Hunt and
Partners, 1989). In addition to the predicted drop in visitation after Expo 88, travel within
Australia was significantly hampered by the Pilot’s Dispute, which lasted from August 1989
to January 1990. The situation was considered to be an example of a modern corporate
state, as the government, big business, unions, and the industrial tribunal all worked
together, with the support of the general public, against the single union (Norington, 1990).
A report by QTTC on the effect of the strike found the total loss in visitor expenditure in
Queensland to be $473 million (QTTC, 1990). The strike depleted finances and in the case
of Ansett utilised resources that were originally planned to be used in preparation for
deregulation, ultimately weakening the airline (Easdown & Wilms, 2002).
The downturn in visitation caused by the pilot’s dispute resulted in accommodation
providers offering discounts to attract visitors. Findings from the survey on the level of
discounting in Queensland showed that up to 80 percent of the accommodation providers in
certain regions were offering discounts of between 10 percent and 50 percent off the
standard room rates (QTTC, 1990). The response by the Sunshine Coast accommodation
providers will be reviewed in the following section (Section 4.5.4.1).
As expected, the 1989 MSRP data on travel in Queensland showed decreases due to the
pilots’ dispute. The effect on travel was highlighted by the data on the type of transport
used to reach Queensland which showed a rise in numbers travelling by car. The number
who still arrived by air indicated the positive impact of the emergency substitution
arrangements. However the dispute did not result in a windfall for other transport operators
with no notable rise in the number travelling to Queensland by rail and coach, except for Far
North Queensland where coach travel increased (Rider Hunt and Partners, 1990).
Another change in the visitation patterns was the transfer from interstate travellers to
Queensland visitors. This was considered to be due to the booking by Queenslanders of the
cheap packages offered by operators to boost the dramatic occupancy drop. This swing to

Noreen Breakey Tourism Destination Development
Chapter Four – Destination Case System: An Historical Overview 213
intrastate visitors also explains why the coach and rail sectors did not receive a significant
gain, except in Far North Queensland (Rider Hunt and Partners, 1990).
Using November 1989 as an indicator of the impact of the dispute, Rider Hunt determined
that a drop of 20 percent had occurred in the number of international tourist arrivals to
Australia (Rider Hunt and Partners, 1990). This was the one year during the 1980s when
international visitation dropped noticeably (Figure 4.11).
In 1990 the domestic aviation market was deregulated, with the passing of the Airlines
Agreement (Termination) Act (Barker, 1992; Atherton & Atherton, 1998). Despite the aim
of the airlines to maintain the status quo the deregulation was attributed to the power of the
deregulation trend internationally as a progressive economic tool, combined with the
lobbying of the tourism industry (Gow & Maher, 1994).
The main impact of competition in the domestic airline industry, as a result of deregulation,
was the drop in airfares and the introduction of more direct flights. This made air travel
between certain cities cheaper than travel by bus or train. In particular Cairns became more
affordable for domestic travellers (Rider Hunt and Partners, 1991). Subsequent airline
changes that followed deregulation included the rise and fall of Compass (December 1990 –
December 1991) and Compass II (August 1992 – March 1993) (Atherton & Atherton, 1998;
Richardson, 1999).
By the early 1990s the business and economic boom was over. In addition to the increasing
number of bankruptcies, unemployment was above 10 per cent, the budget deficit was
increasing, savings were low, exports were decreasing in competitiveness, and the treasurer
Paul Keating had announced an economic recession (Barker, 1992; Stewart, 1994).
Australia was not alone as much of the Western world was in a recession. This, combined
with concerns of safety and terrorism due to the Persian Gulf War resulted in a downturn in
international tourism for many countries (Go, 1997). In Australia international tourist
numbers continued to increase but the yield was lower, due to decreases in the number of
visitor nights and overall expenditure (Richardson, 1999).

Noreen Breakey Tourism Destination Development
Chapter Four – Destination Case System: An Historical Overview 214
There was concern over the future level of international tourism to Australia as visitor
numbers for November 1990 were only slightly higher than the 1989 figure, which had been
affected by the pilots’ dispute (Rider Hunt and Partners, 1990). This uncertainty was due to
number of factors, including the lower financial support for overseas marketing campaigns
by government, the impact of deregulation on domestic airfares, the decrease in international
airfares due to the increasingly competition marketplace. It also included privatisation of
the government airlines, the growth of new and therefore competing destinations in Eastern
Europe, the military conflict in the Middle East, foreign investment restrictions, and the
worldwide economic recession (Rider Hunt and Partners, 1990).
International travel in the first few months of 1991 was significantly affected by the Gulf
War. Although the war ended in March, there were limited forward bookings for the second
quarter, resulting in a fall in people flying to and from Australia in the first half of 1991
(Rider Hunt and Partners, 1992). Because of the drop in visitor numbers, special airfare and
accommodation packages were offered. These did entice some travellers, especially from
New Zealand (Rider Hunt and Partners, 1991). By mid year, the situation had improved,
and increased numbers of international visitors began arriving (Rider Hunt and Partners,
1991). In these conditions Australia still increased its general inbound Japanese visitors for
1991, one of only two destinations to achieve this (Rider Hunt and Partners, 1993).
In 1991, the recession was expected to halt the growing level of tourism activity. Modest
growth was expected, primarily with a domestic focus. The increase in Australians
travelling within the country was considered to be the result of the drop in domestic airfares
due to deregulation and the rise in international airfares because of the Gulf War (Rider
Hunt and Partners, 1991). Additionally, the recession was affecting the number of jobs
available in London, resulting in a decline in the number of European working holidays
(Rider Hunt and Partners, 1991). If domestic tourism accounted for 90 percent of tourism in
Australia, a 10 percent decrease in international travel to Australia could be counteracted by
a 1 percent rise in domestic travel (Rider Hunt and Partners, 1991).
Although the economic situation deteriorated after the ‘boom’ period, Queensland’s
economic and tourism development was above the national average (Grey & Edelmann,
1991). Heavy investment in tourism development in the State was still being planned in

Noreen Breakey Tourism Destination Development
Chapter Four – Destination Case System: An Historical Overview 215
1989 but progressively through the year there was a reduction in the number of firmly
committed projects (Grey & Edelmann, 1991).
In late 1989, a Labor Government was elected in Queensland, the first in over three decades.
At the beginning of the 1990s, Queensland was considered the growth state. The population
passed the three million mark, growing at double the National rate. 75 percent of this
growth occurred in South-East corner. In addition, the unemployment level was lowering
(Rider Hunt and Partners, 1990, 1992).
The 1991 report on the challenges and opportunities of tourism in Queensland, conducted by
the Committee for Economic Development of Australia (CEDA) (Grey & Edelmann, 1991),
commented on the 1986 Boeing Report, indicating its influence and lasting impact. The
foreword of the CEDA report also highlighted the focus of foreign investment on the up-
market segment, rather than the middle of the range domestic market which still formed the
vast majority of Australian tourism (Proctor, 1991). For the three years from 1987, over 50
percent of foreign investment in tourism outside capital cities had occurred within
Queensland (Grey & Edelmann, 1991).
In the tourism sector a number of large prominent businesses were placed into receivership
because of the combination of the oversupply of hotel rooms, particularly in five-star
accommodation, the pilots’ dispute and lower tourism demand (Grey & Edelmann, 1991).
Despite the deflation of the tourism growth rate, domestic tourism was still expected to
increase, due to extensive advertising, incentive discounts, and the rise in international
airfares due to the Middle East conflict (Rider Hunt and Partners, 1989, 1990).
One growing accommodation sector during this period, was bed and breakfast
establishments. These small but numerous concerns were then included in the national
accommodation guides. This type of accommodation had been fashioned on the British
style that Australians had experienced while on holiday there (Davidson & Spearritt, 2000).
Assisting travel to Queensland from the southern state was the upgrading of the Pacific
Highway from two to four lanes. This route links Sydney with Brisbane and is one of the
most popular tourist routes in Australia, with numerous coastal resorts located along the
Noreen Breakey Tourism Destination Development
Chapter Four – Destination Case System: An Historical Overview 216
way. The upgrade was funded by the state and federal governments (Davidson & Spearritt,
2000).
Sir Frank Moore stepped down as Chairman of QTTC in 1990. However, his influence on
tourism development was still expected to be felt through his new role, leading the tourism
industry body, Australia Tourism Industry Association (ATIA) (Rider Hunt and Partners,
1990).
Other changes within the Australian tourism industry heralded increasing coordination
between the various tourism surveys. The regional boundaries of the MSRP, conducted by
QTTC, had been changed the to fit the ABS borders (Rider Hunt and Partners, 1990). In
addition, the IVS data from the BTR became available monthly. This significantly reduced
the period of time between data collection and its commercial application (Rider Hunt and
Partners, 1990).
By the 1990s the main sources of growth of inbound tourism had changed. The traditional
markets of New Zealand, Western Europe and North America, had been replaced by Asian
nations, with the initial focus on Japan (Griffin & Darcy, 1997). This potential visitation
was seen as incorporating much of Asia, as the economies were improving and the standards
of living were increasing. The change from the traditional markets was seen as particularly
relevant for the hotel sector, as a significantly higher percent of Asians utilise this form of
accommodation (Rider Hunt and Partners, 1990).
Although 1991 ended with a worldwide recession, tourism in Queensland was recovering,
and the outlook was positive (Rider Hunt and Partners, 1991). International visitation to
Australia had reached a record high despite the slow start (Rider Hunt and Partners, 1992).
The number of holiday visitors from overseas had doubled between the early boom year of
1986 and 1991. This growth was expected to continue, boosted by increased funding and
competitive airfares (Rider Hunt and Partners, 1992).
Within just three years of Expo 88 the Queensland tourism industry had faced “the pilots’
strike, an over supply of accommodation, a slower national economy, and a reassessment by
foreign investors of Queensland’s tourist potential” (Grey & Edelmann, 1991 p.7).

Noreen Breakey Tourism Destination Development
Chapter Four – Destination Case System: An Historical Overview 217
The Foreign Land Register reported in March 1990 that foreign investors only owned 1
percent of the State. Japanese ventures accounted for the largest foreign invested value,
while US ownership represented the greatest land area (Rider Hunt and Partners, 1990).
The Foreign Land Register follow up report of 1991, demonstrated that foreign ownership in
Queensland had occurred for different countries at different times. Germany invested
during 1980-82, Britain during 1981-85, the US during 1987-89, and Japan from 1988 to
1990 (Rider Hunt and Partners, 1991).
Despite this generally small role in the state, a study conducted on foreign ownership of
tourism operations in the Queensland coastal destinations, conducted by the Foreign
Investment Secretariat of the Queensland Treasury Department, showed that the investment
had been focused on certain areas and operations. Over 60 percent of 5-star hotels in the
State’s three main tourist destinations, the Sunshine Coast, Gold Coast, and Cairns, were
foreign owned, and of these 60 percent were Japanese owned. A second focus had been
duty free stores on the Gold Coast, with 70 percent being foreign owned. There were no
foreign investments in 1-2 Star accommodation or in the Whitsunday region (Rider Hunt
and Partners, 1991). A second component of the study considered the management of the
hotel, rather than the owner. Although Japanese owned 9 out the 14 five-star hotels in
Queensland, only three were managed by Japanese companies. American companies
managed half, with two operated by Hong Kong companies, one managed by a United
Kingdom company, and one by an Australian company (Rider Hunt and Partners, 1991).
Although the level of foreign ownership was high for certain sectors of the tourism industry,
this input of foreign investment was considered necessary for growth in the tourism industry
as Australian investment was not forthcoming (Rider Hunt and Partners, 1991).
4.5.4.1 Sunshine Coast - Recession: 1989 - 1991
In early 1990, the Sunshine Coast was initially performing well, despite the high interest
rates, and low consumer confidence (Rider Hunt and Partners, 1990). However, by the
second quarter, the negative economic climate had reached the Coast (Rider Hunt and
Partners, 1990). Despite the economic and housing situation, tourism continued to grow. In
fact the downturn, combined with the conflict in the Middle East encouraged Australians to

Noreen Breakey Tourism Destination Development
Chapter Four – Destination Case System: An Historical Overview 218
holiday closer to home, boosting visitation to the Sunshine Coast (Rider Hunt and Partners,
1991).
By the end of 1989, there was a downturn in both the house and unit sectors. This was seen
as the result of the increasing interest rates (Figure 4.4), rising building costs, and a drop in
consumer confidence (Rider Hunt and Partners, 1989). In general, the downturn in the
housing sector was relatively uniform across the Sunshine Coast (Rider Hunt and Partners,
1990). This returned commencements to the level required by the existing population
growth trend (Rider Hunt and Partners, 1990). By 1989 the population of the three Sunshine
Coast shires had reached the 1978 Gold Coast population (Rider Hunt and Partners, 1989).
By mid 1989 the Sunshine Coast had the third highest number of hotel rooms, after the Gold
Coast and Cairns, having overtaken the number of rooms provided in Brisbane (Rider Hunt
and Partners, 1989). Based on the ABS tourism data, the Rider Hunt Report commented
that the Sunshine Coast was the cheapest place in Queensland to take a holiday, as the
average expenditure was only $42 per room night (Rider Hunt and Partners, 1989).
The level of foreign ownership on the Sunshine Coast was not as dependent on Asian
investors as other tourist centres. In fact, the largest area of foreign owned land belonged to
investors from the United Kingdom, with the smaller area of land owned by New Zealanders
worth the most (Rider Hunt and Partners, 1990).
In the April edition of the Rider Hunt Report the suggested focus for tourism on the
Sunshine Coast was the domestic market (Rider Hunt and Partners, 1989). Data had shown
that most tourists are from interstate, followed by Queensland visitors, that they arrive
mainly by road and stay about one week. Stable sustained moderate growth was seen as
attainable if the destination concentrated on attracting the long stay domestic visitors, rather
than competing for international visitors with destinations that provided better airport and
tourist facilities (Rider Hunt and Partners, 1989).
Due to the downturn in visitation as a result of the pilot’s dispute, the commercial
accommodation providers offered discounts to attract domestic visitors. The survey
conducted in 1990 to determine the level of discounting in Queensland, found that on the
Sunshine Coast, 20 percent of the hotels and motels were offering discounts and 25 percent

Noreen Breakey Tourism Destination Development
Chapter Four – Destination Case System: An Historical Overview 219
of holiday units were discounting (QTTC, 1990). Despite the negative impacts of the
dispute, the hotels and motels on the Sunshine Coast did more business than expected,
despite or as an outcome of the pilot’s dispute (Rider Hunt and Partners, 1990).
During this recession period, the first major stage of the Sunshine Motorway was completed
(Rider Hunt and Partners, 1989). This was expected to affect the long-term urban growth of
the Coast (Rider Hunt and Partners, 1990). The Noosa Chamber of Commerce was
lobbying for the second stage of the Motorway to extend to Noosa Heads. Despite the
Queensland Government’s plans to upgrade the coastal highway, traffic congestion was still
believed to be a significant problem in accessing Noosa (Rider Hunt and Partners, 1990).
Inland, the four lane highway was extended to Nambour, providing fast and easy access to
and from Brisbane, and the Nambour bypass was opened (Rider Hunt and Partners, 1990;
QTTC, 1991).
The Noosa Council had been attempting to obtain State Government approval for a
Development Control Plan for Noosa’s North Shore since the beginning of their term, in
1988. This finally occurred after the State change to the Labor Government of Wayne Goss
(Gloster, 1997).
Developers were focused elsewhere, including T.M. Burke’s proposed ‘Spaceworld Theme
Park’, with residential development and a lake system for Emu Swamp, which lay west of
the David Low Highway at Peregian Beach. This proposal promoted lobbying by the Noosa
Parks Association for the inclusion of the area in Noosa National Park. The Noosa Council,
followed by Maroochy Council rejected T.M. Burke proposal and the Goss Government
approved the addition of the land to the National Park just prior to the 1992 State Election.
However, T.M. Burke’s initial concept of Noosa Waters from the 1970s became a reality in
1991, after numerous variations and having passed through a number of companies. At the
initial sale all land was sold (Edwards, 2001). Another addition to the Noosa Shire was
Noosa River Harbour Town at Tewantin, which incorporated a marina with rentable berths,
the first in Noosa (Rider Hunt and Partners, 1990).
In contrast the plans for Settler’s Cove resort at Noosa Inlet were abandoned (Rider Hunt
and Partners, 1990). In 1988, this had been one of the proposed developments during the

Noreen Breakey Tourism Destination Development
Chapter Four – Destination Case System: An Historical Overview 220
peak of the tourism boom (Table 4.1). Kern Corporation, which developed Apartments
Noosa in 1988, had all three of its Sunshine Coast sites on the market by 1990 (Rider Hunt
and Partners, 1990). In general, the large-scale developments had slowed, but approvals for
medium-level projects continued (Rider Hunt and Partners, 1990).
Despite the recession, development in the Maroochy Shire continued with the opening of the
$300 million, 324 room Twin Waters Resort, expansions to the Mooloolaba Underwater
World which doubled the size of the tropical oceanarium, and the new $2 million terminal at
the Sunshine Coast Airport began operation (Rider Hunt and Partners, 1990; Maroochy
Shire Library Service, 1994). In addition, the Osprey, the first beachfront accommodation at
Mooloolaba for about eight years, was under construction (Rider Hunt and Partners, 1990).
The Maroochy’s CBD was also to undergo a $200,000 rejuvenation, and the Maroochy
Council was preparing development control plans for the railway and hinterland towns
(Rider Hunt and Partners, 1990).
Changes were also happening in Caloundra Local Area, with plans for a commercial and
retail two-tiered building, called Caloundra City Centre, and the opening of the Ettamogah
Pub (Rider Hunt and Partners, 1990).
4.5.5 Recovery Period: 1992 - 1994
By the beginning of the recovery period in 1992, Paul Keating had become Prime Minister.
This Labor Government was to further the policies of the previous decade through the sale
or partial sale of government enterprises, increasing trade with Asia, reducing protection of
Australian industries, assisting enterprise bargaining, and reducing public expenditure
(Chambers, 1999; Macintyre, 1999). In regard to tourism, Paul Keating called tourism the
‘star growth industry of the Nineties’ (Rider Hunt and Partners, 1993).
Both the National and State economies appeared to be on the road to recovery by 1992, after
two financial years of zero economic growth. The housing led recovery was showing
positive signs, and the boom would continue throughout this recovery period. The
residential development was encouraged by low interest rates, the First Home Buyer
scheme, high affordability conditions, strong consumer confidence, and the improving
employment market (Rider Hunt, 1994, 1995; Midwood - Tourism & Development, 1996).

Noreen Breakey Tourism Destination Development
Chapter Four – Destination Case System: An Historical Overview 221
The State’s tourism industry was also doing well in 1992, recording the busiest ever eight
month period (Rider Hunt and Partners, 1992). The falling Australian dollar boosted
tourism, although growth was perceived to be limited by the supply of suitably located
accommodation (Rider Hunt and Partners, 1992).
The Federal Economic Statement made in 1992 provided some tax concessions and
incentives for tourism development. However, this was not expected to be enough to
encourage the required investment in new hotels. Financiers had extensive requirements for
the funding of such projects, and investment from overseas was limited as other countries
were competing for the financial boost. Rider Hunt proposed that further government
incentives were required as any tax received would be more than that from non-existing
projects. Without new accommodation the growth in visitors would be limited by supply,
rather than demand (Rider Hunt and Partners, 1992).
Also in 1992, the National Tourism Strategy was launched by the Tourism Minister, Alan
Griffiths. This strategy, titled ‘Australia’s Passport to Growth’ boldly forecast 6.5 million
overseas visitors by the year 2000. The question posed by Rider Hunt was, will there be
enough rooms to accommodate them? Even if all the potential projects did go ahead the
supply would only be increasing at one quarter of the level of the forecast demand (Rider
Hunt and Partners, 1992).
1992 was a significant year for tourism in Queensland, as the state overtook New South
Wales as the ‘main holiday State’ for international visitors (Rider Hunt and Partners, 1993).
In terms of international air travel, the decision by Qantas to utilise Cairns as a hub saw a
corresponding rise in the number of flights (Rider Hunt and Partners, 1992). Air New
Zealand had selected Brisbane as its Australian hub, under the Trans Tasman ‘Open Skies’
agreement. This resulted in an increase in the number of flights to Asian destinations and
provided an additional reason to move ahead with the international terminal in Brisbane
(Rider Hunt and Partners, 1992). During 1992, the Federal Government also made a
number of Aviation Policy reforms. These included the merging of Qantas and Australian
Airlines, progressive deregulation of domestic and international airline operations,
deregulation of trans Tasman traffic, and the granting of ‘Beyond Rights’ to Air New
Zealand (Rider Hunt and Partners, 1993; Atherton & Atherton, 1998; Richardson, 1999).

Noreen Breakey Tourism Destination Development
Chapter Four – Destination Case System: An Historical Overview 222
In the 20 years since the first direct flight between Japan and Australia in 1973 the number
of flights had increased to 55 each week (Rider Hunt and Partners, 1983). Another increase
in the role of Australia in international air travel was the sale of one quarter of Qantas to
British Airways, providing an important link to one of the powerful world airlines (Rider
Hunt and Partners, 1993).
In a review of international tourism to Australia for the first three years of the 1990s, based
on the IVS data, the Rider Hunt report examined the apparent phenomenon whereby the
number of inbound visitors was increasing, but the total number of nights was decreasing.
The forces resulting in this overall reduction in the average length of stay were considered
two-fold. Firstly, the effect of the worldwide recession reduced both the number of
backpackers and those visiting friends and relatives, the two long stay markets. Secondly,
the rapidly growing Asian markets were generally short stay visitors (Rider Hunt and
Partners, 1993).
Throughout the 1980s the total number of visitors to Australia from Asian countries
increased in accordance with the rising number of Japanese travellers (Figure 4.14). This
pattern changed in 1992, with the dramatically increasing number of total Asian visitors
growing well above the growth of the Japanese market. This initial increase in the numbers
from the ‘rest of Asia’ was mainly due to dramatic growth in visitation from Singapore and
Taiwan (Rider Hunt and Partners, 1993). The trend continued and for 1993 more visitors
arrived from ‘other Asia’ than from Japan, although Japan remained the largest national
source of visitors, a position it had maintained since 1988 (Rider Hunt, 1994).
Taiwan had 20 million people, and growth in visitation to Australia for the five years to
1991 was 190 percent (Rider Hunt and Partners, 1992). However, this growth had been
from a small base of 12,000 visitors in 1986. By 1993/94 Taiwan had become Australia’s
sixth largest source country, due to the easing of restrictions on outbound travel, and the
addition of direct flights between the two countries (Prideaux, 1995). One factor considered
to be restricting growth was the limited knowledge of Taiwanese about Australia (Rider
Hunt and Partners, 1992). In addition, there appeared to be limited recognition of the
potential of the significant and sustained growth in outbound Taiwanese travel by the
Australian tourism industry (Prideaux, 1995, 1996). South Korea had 42 million people,
and its growth in visitation to Australia for the five years to 1991 was 390 percent (Rider

Noreen Breakey Tourism Destination Development
Chapter Four – Destination Case System: An Historical Overview 223
Hunt and Partners, 1992), although this jump was from an even smaller base of 4,800
visitors.
Figure 4.14 International Arrivals to Australia from Asia.
Total number of international arrivals to Australia from Asia 1980-1997 (ABS 3401.0 - Overseas Arrivals and Departures), separated into the number of arrivals from Japan and the number for the rest of Asia, and illustrating that the increase in total Asian arrivals matched the growth in Japanese visitors until 1992.
While spending had previously been declining as the length of stay by international visitors
reduced, there was an increase of 20 percent in shopping expenditure in 1993. This was
attributed to changes in the items offered to the visitors (Rider Hunt, 1994). The first half of
1993 saw a jump in visitation from New Zealanders, a reflection of their economic recovery
and the strengthening New Zealand dollar (Rider Hunt and Partners, 1993). In addition, the
number of Singaporean, Taiwanese and Korean tourists coming to Queensland continued to
rapidly increase, with Korea the fastest growing Asian market in 1993 (Rider Hunt and
Partners, 1993; Rider Hunt, 1994). Another boost in international nights for Queensland
was due to the holding of the international Lions convention in Brisbane (Rider Hunt, 1995).
In addition to the growing visitation from the ‘other Asia’ markets, the potential
accompaniment of investment from these countries was also posed (Rider Hunt and
Partners, 1993).
Other Asia
Japan
0
250
500
750
1000
1250
1500
1750
2000
225019
80
1981
1982
1983
1984
1985
1986
1987
1988
1989
1990
1991
1992
1993
1994
1995
1996
1997
Year
Num
bero
fOve
rsea
sA
rriv
als
(000
's)
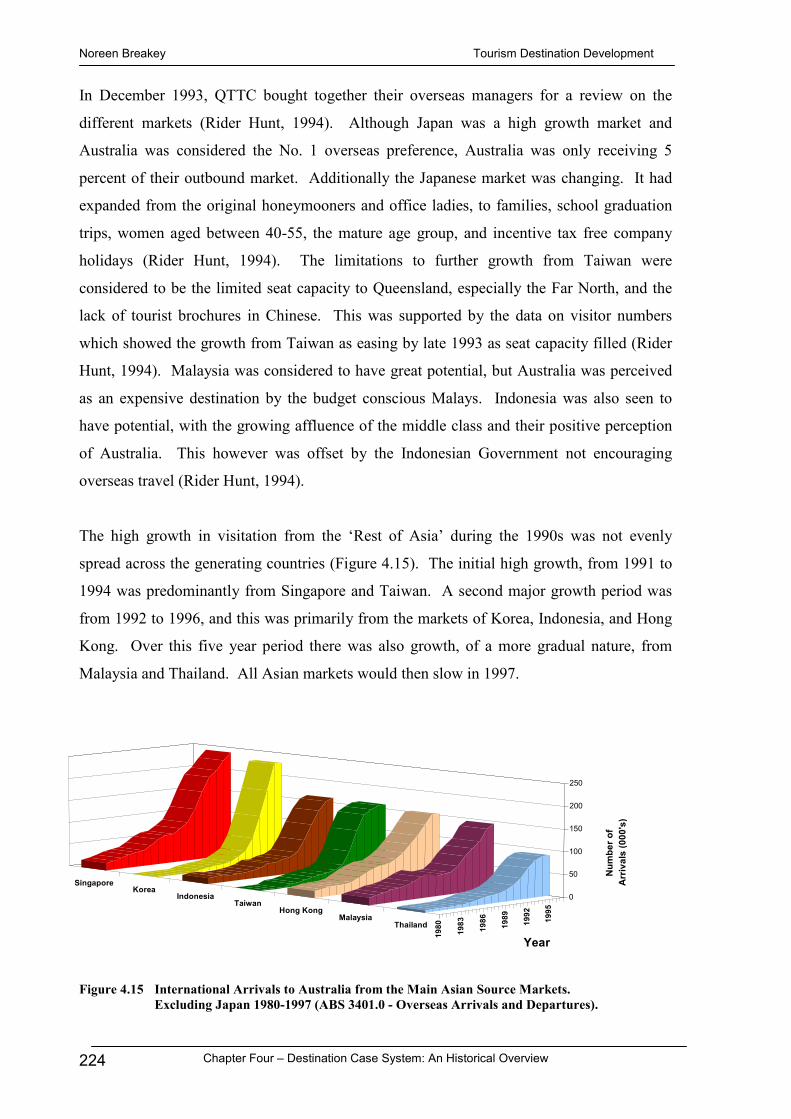
Noreen Breakey Tourism Destination Development
Chapter Four – Destination Case System: An Historical Overview 224
In December 1993, QTTC bought together their overseas managers for a review on the
different markets (Rider Hunt, 1994). Although Japan was a high growth market and
Australia was considered the No. 1 overseas preference, Australia was only receiving 5
percent of their outbound market. Additionally the Japanese market was changing. It had
expanded from the original honeymooners and office ladies, to families, school graduation
trips, women aged between 40-55, the mature age group, and incentive tax free company
holidays (Rider Hunt, 1994). The limitations to further growth from Taiwan were
considered to be the limited seat capacity to Queensland, especially the Far North, and the
lack of tourist brochures in Chinese. This was supported by the data on visitor numbers
which showed the growth from Taiwan as easing by late 1993 as seat capacity filled (Rider
Hunt, 1994). Malaysia was considered to have great potential, but Australia was perceived
as an expensive destination by the budget conscious Malays. Indonesia was also seen to
have potential, with the growing affluence of the middle class and their positive perception
of Australia. This however was offset by the Indonesian Government not encouraging
overseas travel (Rider Hunt, 1994).
The high growth in visitation from the ‘Rest of Asia’ during the 1990s was not evenly
spread across the generating countries (Figure 4.15). The initial high growth, from 1991 to
1994 was predominantly from Singapore and Taiwan. A second major growth period was
from 1992 to 1996, and this was primarily from the markets of Korea, Indonesia, and Hong
Kong. Over this five year period there was also growth, of a more gradual nature, from
Malaysia and Thailand. All Asian markets would then slow in 1997.
Figure 4.15 International Arrivals to Australia from the Main Asian Source Markets.
Excluding Japan 1980-1997 (ABS 3401.0 - Overseas Arrivals and Departures).
1980
1983
1986
1989
1992
1995
ThailandMalaysia
Hong KongTaiwan
IndonesiaKorea
Singapore
0
50
100
150
200
250
Year
Num
bero
fA
rriv
als
(000
's)
Noreen Breakey Tourism Destination Development
Chapter Four – Destination Case System: An Historical Overview 225
Overseas visitor numbers continued to increase during 1994. However this incorporated a
drop in the number from New Zealand. The continual strengthening of their economy, with
the introduction of the Goods and Services Tax, may have resulted in New Zealanders
venturing further away for their trips overseas (Rider Hunt, 1995). The economic recovery
also under way in America also affected visitor numbers, with growth of over 10 percent
from this market (Rider Hunt, 1994). Effective from April 1994, the tax free overseas
incentive holiday was extended by the Japanese Government from three to four nights
(Rider Hunt, 1994). Japanese visitation to Queensland was also assisted by the
reintroduction of direct flights from Japan to Brisbane, and the opening of the 24 hour
Kansai International Airport near Osaka in Japan. This new airport initially provided seven
thousand extra seats to Australia each week (Rider Hunt, 1994, 1995). In the ‘other Asia’
markets, Korea moved into third place after Singapore and Taiwan (Rider Hunt, 1994).
Although in 1989, the restrictions placed on overseas travel by Koreans were lifted, it was in
1994 that this was extended to include civil servants (Rider Hunt - Midwood, 1996).
In early 1993 investors seemed to be waiting for the Federal Election in March before
starting new projects (Rider Hunt and Partners, 1993). Despite this 1993 was the height of
the housing boom (Midwood - Tourism & Development, 1996). The growth was attributed
to “low interest rates, high affordability conditions, strong consumer confidence, and the
improving employment market” (Rider Hunt, 1994 p.3 italics added). At that time, the most
expensive land in Queensland was located at the Gold Coast, Noosa, and Cairns (Rider
Hunt, 1994). In the public sector, there was also significant building activity, with major
projects under way in Brisbane including the Treasury Casino and the International Airport
Terminal (Rider Hunt, 1994). The Federal Minister for Tourism had also established the
Tourism Forecasting Council in 1993. It’s aim was to generate ‘accurate and reliable’
forecasts for the industry (Midwood - Tourism & Development, 1996).
A change for the building sector in 1994 was the Building Units and Groups Titles Act
(Queensland Government, 1994). The Act increased flexibility as developments could
occur in stages. In addition, it became possible to incorporate both group and strata titles in
a development, and for different Body Corporates at different stages of a development. An
important impact of the Act for the tourism industry was the provision for lease-back hotels,
with increasing control to be held by the lessee/hotel operator (Rider Hunt, 1995).

Noreen Breakey Tourism Destination Development
Chapter Four – Destination Case System: An Historical Overview 226
According to the Queensland Development Report (Rider Hunt, 1994) the increasing
visitation to Queensland’s main destinations was not being matched by the supply of rooms.
Some of the factors causing this lack of investment were considered to be the “world wide
shortage of capital, reluctance of institutions to invest in hotels, poor profitability in the past,
and a lack of understanding of tourism trends” (Rider Hunt, 1994 p.7 italics added). This
problem was to be exacerbated if the demand level was to rise as expected. The ATC
published forecasts in 1994 for international visitor numbers to Australia, predicting 8.4
million arrivals in 2004. This 180 percent increase over the forthcoming decade would not
be achieved without a corresponding rise in the number of hotel rooms (Rider Hunt, 1994).
Within Queensland Garry Draffin, as the new chief executive of QTTC, was aiming to
increase development of tourism through assistance to investors (Rider Hunt, 1994).
4.5.5.1 Sunshine Coast - Recovery Period: 1992 - 1994
After the national economic downturn at the beginning of the 1990s, the Sunshine Coast was
expected to be at the forefront of the recovery. This was due to the higher population
growth rate and the resultant need for building activity, combined with its role as an
established tourist destination, the flow on effects of tourism activity, low vacancies in
‘prime’ retail and office space, available workforce, desirable lifestyle, and its proximity to
Brisbane and an international airport, via dual lane highways (Rider Hunt and Partners,
1992). Over this three year period, a number of signs indicated recovery, while others such
as capital investment and employment appeared to lag behind (Rider Hunt, 1994).
Approvals for both units and houses on the Sunshine Coast had jumped by the end of 1991,
and continued to rise the over the following two years (Rider Hunt and Partners, 1992,
1993). In the unit sector, the six and twelve ‘pack’ projects continued to demonstrate the
most growth (Rider Hunt and Partners, 1992). By 1993, units were selling successfully off-
the-plan (Rider Hunt and Partners, 1993). However caution was expressed over rising
building activity, in order to prevent over building in the residential sector (Rider Hunt and
Partners, 1993).
In contrast, there was little activity in the non-residential building sector, with a few small
projects beginning by the end of 1992 (Rider Hunt and Partners, 1992).

Noreen Breakey Tourism Destination Development
Chapter Four – Destination Case System: An Historical Overview 227
The plans for The Sands shopping centre to proceed in 1992 was seen as a vote of
confidence in the region by a successful company (Rider Hunt and Partners, 1992). By mid
1993 there was considerable activity in the retail building sector, with the Sunshine Plaza
expansion under construction, and a number of other projects in the planning stages (Rider
Hunt and Partners, 1993).
In 1993, a 120 unit development for Hastings Street was approved (Rider Hunt and Partners,
1993). The development trend was beginning again, and by early in the new year, four
projects were in the planning or construction stage (Rider Hunt, 1994). The media began to
focus on the Hastings Street developments, highlighting the record prices paid for the
exclusive property (Rider Hunt, 1994).
The Sunshine Coast Tourist Board conducted an initiative to increase the profile of the coast
among new markets, both national and international (Rider Hunt and Partners, 1993).
With respect to the region’s attractions, Underwater World was sold to an Australian
company, which planned to expand the facilities and attractions provided, and the Big
Pineapple redirected its marketing to international clients and higher income groups. This
attraction also planed to extend, incorporating restaurants, retail areas, and ‘ecologically
themed’ attractions (Rider Hunt and Partners, 1993).
The Maroochy Shire Council upgraded the runway at the airport, to cater for both increased
traffic and heavier aircraft (Rider Hunt and Partners, 1993). Additionally, Maroochy began
holding a number of major events, including the Sunshine Surf Classic, Sydney to
Mooloolaba Yacht Classic, Mooloolaba Triathlon and the Sunshine Coast Art Group Annual
Exhibition (Maroochy Shire Library Service, 1994)
The 1991-1994 Playford Council in Noosa prepared a zero development Development
Control Plan for the Marcus High Dunes, between the David Low Highway and the National
Park, north of Peregian. After much lobbying the Goss Government supported the plan in
1995 (Gloster, 1997).
Noreen Breakey Tourism Destination Development
Chapter Four – Destination Case System: An Historical Overview 228
4.5.6 The Unstable Period: 1995 - 1997
In 1995, the Queensland economy recorded zero growth. This unexpected drop was
affected by the improving economic climate in the Southern States, lower northward
migration, the sudden drop in activity in the housing sector, the ongoing drought in the rural
areas, and the reduction in tourism growth due to the limited supply of hotel rooms,
particularly for international guests (Rider Hunt, 1995).
In late 1995 the State Labor Government was voted out and Rob Borbidge, a past Gold
Coast motel operator became Premier (Walker, 1995). The change back to the conservative
coalition, was seen as a potential return to growth, investment and development for the state
(Rider Hunt - Midwood, 1996). The Queensland Treasury, after comparing various
industries, revealed that tourism was the state’s biggest revenue generator (Midwood -
Tourism & Development, 1996).
Labor was also voted out at the 1996 Federal election, with John Howard elected as Prime
Minister, ending thirteen years of Labor rule (Kelly, 1999). The Howard government
continued economic reform, furthered trade liberalisation, continued deregulation of the
finance sector, and increased privatisation (Macintyre, 1999). The budget aimed to ‘put
money back into the pockets of families’. This was seen as positive for domestic tourism.
In addition superannuation contributions became ‘less attractive’ to high income earners,
resulting in increased use of negative gearing and property investment. Although interest
rates fell throughout 1996, these drops were not enough to bring the Australian dollar down
against the Asian currencies (Midwood - Tourism & Development, 1996, 1997).
In 1995 all building sector activity was in decline and confidence in the industry was low
(Rider Hunt, 1995). Demand for residential and other building had dropped, with the only
exception being activity in the retail sector (Rider Hunt, 1995). The decline in both the
residential and non-residential sectors for 1995/96 was unusual as these sectors usually
move in opposite directions (Midwood - Tourism & Development, 1996). Numerous public
sector projects in Brisbane reached completion during 1995, including the Treasury Casino,
the Exhibition/Convention Centre, and the International Airport Terminal (Rider Hunt,
1995). In addition Qantas was floated to the public in 1995 (Atherton & Atherton, 1998;
Richardson, 1999). Two main accommodation developments in Brisbane, the Novotel, and

Noreen Breakey Tourism Destination Development
Chapter Four – Destination Case System: An Historical Overview 229
Quay West were also completed that year (Rider Hunt - Midwood, 1996). This left little
other construction under way, and further developments were not planned or expected. This
situation extended to the national level, with few Federal capital works expected (Rider
Hunt, 1995).
In the residential sector the overbuilding of housing and units between 1990 and 1993
caused the drop in activity for 1994 and 1995. Australia as a whole built twice the required
number of new houses, with Queensland and Brisbane building 50 percent too many
(Midwood - Tourism & Development, 1997). With significantly more new dwellings
commenced than the ‘underlying requirements’, it was expected that the surplus would not
be absorbed until 1997 (Rider Hunt, 1995).
The building oversupply was also seen outside the residential sector. According to the
Industry Commission report on tourist accommodation there was an oversupply within
Australia. Rider Hunt, while agreeing in principle, specified that the location of these rooms
still resulted in an undersupply in the main tourist destinations. In addition, a small number
of rooms available in various small motels was not the block of hotel rooms required by the
overseas wholesalers, particularly the Asian companies (Rider Hunt, 1995). Despite the
provision by the Tourism Forecasting Council of ‘accurate and timely’ forecasts of supply
and demand to assist in investment, the growth in visitors was still not being matched by
new hotel rooms. In another attempt to support tourism development, the Federal Minister
for Tourism brought together representatives from the tourism, construction, property
investment, and finance sectors (Rider Hunt, 1995).
Because of the limited supply of affordable rooms in the main tourist destinations, the
number of international visitors nights were expected to only increase marginally for 1995
(Rider Hunt, 1995). This rising demand and limited supply which had resulted in higher
occupancies was causing operators to raise room rates. This was particularly evident in
Brisbane despite the recent opening of two new hotels (Rider Hunt, 1995). Increased room
rates in Sydney hotels was causing potential visitors to select more value for money
destinations (Midwood - Tourism & Development, 1996). This scenario was expected to
spread nationally to other major international destinations. Without overseas promotion
repositioning Australian destinations, the higher tariffs were expected to discourage tourists
who could choose alternate destinations. This further supported the need for the

Noreen Breakey Tourism Destination Development
Chapter Four – Destination Case System: An Historical Overview 230
construction of budget hotels, required by both domestic and international visitors (Rider
Hunt, 1995).
By 1996 the need for hotel rooms, the increased rates, high occupancies, and profitability
forecasts culminated in a high level of new hotel commencements for the State. This was
the highest value of accommodation projects since 1991 (Midwood - Tourism &
Development, 1997). In 1997 there were in fact more beds provided by holiday apartments
than by hotels. The holiday apartments had become the preferred type of accommodation
for stays of over three nights. Responding to this trend some hotels began to redefine
themselves as ‘all-suites’ with kitchens and other facilities. Motels had diminished in appeal
from their heyday in the 1960s and tended to be used primarily for one night stopovers. Old
and run-down hotels, motels, and apartments were often remodelled to provide for the
increasing numbers of backpackers. In 1997, almost half the Australian supply of
backpackers beds were located in Queensland.
During the early 1990s there was a domestic trend towards holidaying in one’s state. This
affected Queensland more significantly than New South Wales and Victoria (Midwood -
Tourism & Development, 1996). However, 1996 appeared to herald the end of this trend as
visitors again began to travel further afield (Midwood - Tourism & Development, 1997).
By 1995, six of the top ten overseas markets were Asian, with the three main generators
being Japan, Singapore and Korea (Rider Hunt, 1995; Midwood - Tourism & Development,
1996). At that time, the strongest growth within the Asian markets was from Indonesia. In
addition there was definite growth in the United Kingdom and Ireland market, partly due to
the introduction of new charter flights (Rider Hunt, 1995).
In the four years from 1992, the number of international flights into Brisbane had almost
doubled (Midwood - Tourism & Development, 1996). By 1996 the new Brisbane
International terminal was the second busiest airport in the country, despite no direct flights
from America (Midwood - Tourism & Development, 1996). In 1997 a daily flight from Los
Angeles via Sydney was introduced, providing the first direct international connection from
America to Brisbane since 1993. Additionally a direct flight from Japan replaced the flight
via a Cairns stopover at 4am (Midwood - Tourism & Development, 1997).

Noreen Breakey Tourism Destination Development
Chapter Four – Destination Case System: An Historical Overview 231
The beginning of 1996 saw positive growth in international visitation from New Zealand.
The growth of over 40 percent in the number of New Zealanders was attributed to their
strengthening economy and the price competition from the increased flights and the new
airlines, Kiwi and Freedom Air (Midwood - Tourism & Development, 1996). The Asian
market continued to grow in 1996, but the slowdown of the Japanese, was joined by the
Thai and Taiwanese. The lower growth was attributed to the rising costs of visiting
Australia and the cheaper package deals to America and Europe caused by lower airfares
(Midwood - Tourism & Development, 1996, 1997). The number of flights from Europe had
dropped but greater concern was expressed about promotion to Europeans of Australia as a
‘desert’ destination, as Africa was cheaper, nearer and in the same time zone (Midwood -
Tourism & Development, 1996). Ultimately lower international visitation was recorded for
1996. This was seen as the result of the increasing value of the Australian dollar and
inadequate international marketing (Midwood - Tourism & Development, 1997). At this
time QTTC developed a new marketing policy, promoting individual destinations within
Queensland, rather than the State as a whole (Midwood - Tourism & Development, 1997).
Drops in the number of international visitors from some Asian markets occurred in early
1997, partially affected by the media presentations of Pauline Hansen, a vocal, right-wing
Queensland politician (Midwood - Tourism & Development, 1997). The lower visitation
caused the industry to question their reliance on 12 percent growth. This more realistic
outlook caused changes, including lower airfares creating more competitive packages. In
addition, the Federal Government cancelled the planned budget cuts and instead provided
emergency funds to assist the industry (Midwood - Tourism & Development, 1997).
This mid year analysis was supported by the review of the Asian markets at the annual
gathering of QTTC’s overseas managers. The past growth was not expected to continue.
The Japanese economic growth had halted, the Yen had dropped 20 percent in relation to the
Australian dollar in the last year, and the focus of the Japanese on ‘value for money’
resulted in the selection of cheaper overseas destinations. The Taiwanese market had been
growing rapidly until American airfares dropped in 1995. In addition, travel agents were
receiving less incentives, room rates in Sydney had increased and the Australian dollar was
rising. The incredible growth in visitation from Korea was not expected to be maintained,
because of their economic situation, government discouragement of overseas travel, and the
elimination of visa requirements for Hawaii. Visitation from Singapore appeared more

Noreen Breakey Tourism Destination Development
Chapter Four – Destination Case System: An Historical Overview 232
positive, particularly as Far North Queensland was popular and there was increasing
visitation to the Sunshine Coast, which provided families with longer stays in beachfront
apartments. However, travel by Singaporeans was affected by the limited airline seats and
the resultant increase in airfares. Malaysia was perceived as a growth market, particularly
for the Gold Coast. This potential was being assisted by the increasing number of flights
(Midwood - Tourism & Development, 1997).
In other international markets, the American situation was improving, with the combined
effects of Bill Clinton’s visit, publicity about the Sydney 2000 Olympics, word-of-mouth
promotion of the unpolluted environment of Australia, and the value for money received
with the strength of the American dollar (Midwood - Tourism & Development, 1997). New
Zealand also continued the high growth for 1995 and 1996 despite the demise of Kiwi Air
(Midwood - Tourism & Development, 1997).
The expected positive end to the year was dashed by the contraction of the South East Asian
economies the following month (Midwood - Tourism & Development, 1997). This ‘Asian
Economic Crisis’ affected numerous Asian countries and resulted in an immediate decrease
in what had been the high-growth visitor markets for Australia (Richardson, 1999). The
decrease in international visitors from January to June 1997 to 1998 was 80 percent for
South Korea, 52 percent for Thailand, 47 percent for Indonesia, and 26 percent for Malaysia
(Cockerell & Muqbil, 1998). Although the effect was severe, certain segments of the
industry were hit harder than others (Richardson, 1999). Earnings at Australia’s 14 Casinos
plummeted, and the airlines reduced services to Asia (Cockerell & Muqbil, 1998).
Countries were also affected differently as the cost of international travel was either
increased or decreased, and tourism strategies varied in their success (Prideaux, 1999b). It
is worth noting that the reasons given for the crisis were the same factors given a few years
prior for the ‘Asian Miracle’ (El Kahal, 2001).
At the time of the economic shakeout in October 1997, Australia was considered to be in a
sounder state than it had been for many years (Midwood - Tourism & Development, 1997).
The Premier was enticing business to Queensland and the seven year drought was over
(Midwood - Tourism & Development, 1997). However, the economy was expected to be
affected by the drop in the Asian economies, especially in the tourism and mining industries
(Midwood - Tourism & Development, 1997).

Noreen Breakey Tourism Destination Development
Chapter Four – Destination Case System: An Historical Overview 233
4.5.6.1 Sunshine Coast - Unstable Period: 1995 - 1997
The upturn in the economy of the Sunshine Coast during the last recovery period appeared
to have halted by mid 1995 (Rider Hunt, 1995). However, despite the general slowdown in
development, the opportunity to take advantage of low construction costs had enticed some
developers with a long term view to begin work in prime locations (Rider Hunt, 1995). By
the end of 1996 five large projects had been launched in prime locations, from Kawana to
Coolum (Midwood - Tourism & Development, 1996).
Despite the economic changes during this unstable period at the state, national and global
levels, the level of confidence in the local Sunshine Coast development industry continued
to slowly rise (Midwood - Tourism & Development, 1997). By 1997, projects were
increasing in size all along the coast. These developments were generally backed by
medium to large developers with proven experience (Midwood - Tourism & Development,
1997). The Sunshine Coast was the only region in Queensland which recorded a higher
level of non-residential building in early 1997, compared to early 1996 (Midwood - Tourism
& Development, 1997).
Interest rate drops during 1996 did not appear to significantly affect the real estate and
development industries on the Sunshine Coast (Midwood - Tourism & Development, 1997).
Although residential activity, in terms of both sales and approvals, had dropped in the first
half of 1995, the fall was noticeably less than the slide in approvals in other regions, such as
Brisbane. This was partially attributed to the rising population, which was absorbing the
new dwellings (Midwood - Tourism & Development, 1997). Against the National and State
trend the Sunshine Coast, along with the Gold Coast, had matched the population growth
with the number of new houses over the first five years of the 1990s (Midwood - Tourism &
Development, 1997). The 1996 Census showed that the Sunshine Coast was the fastest
growing region in the State, with the population jumping 32 percent since the previous
Census (Rider Hunt, 1995; Midwood - Tourism & Development, 1997). In addition, new
residents of the Sunshine Coast did not necessarily require finance for their new homes and
were therefore less affected by changes in interest rates (Rider Hunt, 1995).
Some unit construction was occurring, focused on prime positions in Coolum, Cotton Tree,
Maroochydore, and Caloundra (Rider Hunt, 1995). The only area were an oversupply of
units was thought to be potentially occurring was in some areas of Caloundra (Rider Hunt,

Noreen Breakey Tourism Destination Development
Chapter Four – Destination Case System: An Historical Overview 234
1995). Unit sales were progressing, especially in ideal locations, such as close to the water
and in the prestige residential market (Midwood - Tourism & Development, 1997). The six
units in Noosa Court, a new beachfront property on Hastings Street, all sold prior to
completion (Midwood - Tourism & Development, 1997). The site for this development cost
$4367/sq m in 1995. This topped the sale of Annabelle’s from the previous year, which
went for $3709/sq m (Midwood - Tourism & Development, 1997).
The nationwide development of non-residential building was evident on the Sunshine Coast,
with the focus on commercial and retail projects (Rider Hunt, 1995). This included the $270
million dollar Sunshine Plaza with a six-screen cinema, as well as a $7 million dollar
expansion to the Big Top Shopping Centre (Maroochy Shire Library Service, 1994). To the
north, a shopping centre was opened in Noosaville (Edwards, 2001). Also under way was a
review of the plans of existing shopping centres in all three Local Areas as interest
continued to focus on expansion in the retail sector (Midwood - Tourism & Development,
1996).
In addition, the construction of a number of strata style one/two bed ‘motel’ apartments
were under way at Mooloolaba, Alexandra Headlands, Maroochydore, and Sunshine Beach
(Rider Hunt, 1995). The local developers believed there was a growing market for this type
of accommodation, and they were popular with investors (Rider Hunt, 1995).
By the mid 1990s, Maroochydore was recognised as the commercial centre of the Sunshine
Coast, with its retail and commercial developments assisted by the banks, national retailers,
and Government Departments (Rider Hunt, 1995). Substantial growth of the CBD area was
expected to occur over the following fifteen years. To incorporate the forecast doubling in
jobs, the focus was on a number of 15-storey office towers, rather than a sprawling city
environment (Rider Hunt, 1995). A draft strategic plan for the Maroochy Shire aimed to
incorporate 200,000 residents and visitors by 2006. The plan was released to criticism by
environmentalists who considered the proposal to be encouraging ‘Los Angeles-style
development’ (Rider Hunt, 1995). The CBD area of Mooloolaba was also reviewed, with
the remodelling focusing on a pedestrian-friendly promenade, and a scenic beachfront
(Midwood - Tourism & Development, 1996).
Noreen Breakey Tourism Destination Development
Chapter Four – Destination Case System: An Historical Overview 235
By 1995, height restrictions in the Maroochy Shire followed those established in Noosa.
New three storey limits came into effect for Buderim and Coolum (Rider Hunt, 1995).
Although the proposed three storey limit in Alexandra Headlands was not passed, higher
development necessitated consent by the Council (Midwood - Tourism & Development,
1997). Building height restrictions in Noosa Shire were a maximum of four storeys for high
density residential areas, three storeys for medium density residential/commercial areas, and
all other areas were restricted to two storeys (Rider Hunt, 1995).
Despite stricter height constraints, the Maroochy Council relaxed restrictions on site
population, site coverage and landscaping to approve a ten-storey unit and retail project on
Mooloolaba Esplanade (Midwood - Tourism & Development, 1997). The Council was also
considering a 17-storey hotel development if it complied with the original application
(Midwood - Tourism & Development, 1997). One approval, for an expansion of Sunshine
Plaza, caused an outcry from the community, with over a thousand objections, on the basis
that the region was already ‘overshopped’ (Midwood - Tourism & Development, 1997).
Noosa Council was also approving new developments, with a resort and conference centre
planned for Tewantin, on the site of the Noosa Lakes Motel (Midwood - Tourism &
Development, 1997).
In general, development plans for Caloundra City were lower than the other Shires. This
was attributed to uncertainty surrounding the new Town Plan of 1996 (Midwood - Tourism
& Development, 1997). One project approved by the Council was a development at
Kawana Waters that incorporated a hotel, commercial buildings, convention centre, retail
premises, and food and beverage outlets (Midwood - Tourism & Development, 1997).
In addition to these approved projects, significant future development was expected, with
the release of three significant sites on to the market in 1997. These were the Mooloolaba
Hotel site, the Maroochydore Hotel site, and the Westpac Bank site in Hastings Street
(Midwood - Tourism & Development, 1997).
Results of the 1996 Census showed that Noosa’s ‘no growth’ plan was unable to prevent
population growth, with a rise of 7 percent since the 1991 Census. This was the highest

Noreen Breakey Tourism Destination Development
Chapter Four – Destination Case System: An Historical Overview 236
growth rate of the three local areas, although the population in this Shire was still
considerably lower than the other areas (Midwood - Tourism & Development, 1997).
At this time, the Noosa Shire Council was planning to cap the population prior to the 1997
council election. This was to be achieved through ‘back-zoning’ of high density areas,
additional restrictions in zoning requirements, and the incorporation of increased ‘green
belts’. Concern was raised regarding the effects of changing the rules for those with
property, and the expected rise in land values as the supply would be further limited (Rider
Hunt, 1995). Ultimately the planning scheme to limit the Noosa Shire’s population growth
to approximately 56,000 by 2006 was passed in 1997 (Prideaux & Cooper, 2002).
At this time the Maroochy Council decided to purchase additional land for the expansion of
the Sunshine Coast Airport over the following twenty years, to incorporate a longer runway
and facilities to cater to increased passenger and aircraft movements (Rider Hunt, 1995).
Upgrading of the Ginger Factory at Yandina was also occurring, aiming to increase
exposure and ultimately visitor numbers (Rider Hunt, 1995).
Visitor numbers in other destinations were declining, but visitation continued to increase on
the Sunshine Coast. In 1996, there was growth in visitor nights, occupancy rates, takings,
and number of rooms, with the greatest rises occurring in the motel category (Rider Hunt,
1995; Midwood - Tourism & Development, 1997). The increased visitation was attributed
to the main market of intrastate visitors, primarily budget-conscious families. This
corresponded with the national trend of holidaying closer to home. The level of
international visitors also increased, particularly from New Zealand and Singapore
(Midwood - Tourism & Development, 1997). The local tourism organisations had been
promoting to wholesalers and incentive marketers in South East Asia, particularly Malaysia,
Singapore, and Indonesia (Rider Hunt, 1995).
A calculation of the average room rate for units in 1996 showed that prices in Caloundra
were half those in Noosa, with Maroochy rates in the middle (Midwood - Tourism &
Development, 1996). By the following year, the average room rate was $74, an increase of
16 percent over the preceding two years. This was providing increased returns for investors
(Midwood - Tourism & Development, 1997). The rise in rates occurred when the growth in

Noreen Breakey Tourism Destination Development
Chapter Four – Destination Case System: An Historical Overview 237
room nights for hotels, motels and units increased in line with the rise in supply, thereby
maintaining the occupancy rates (Midwood - Tourism & Development, 1997).
In 1997, concern was expressed that the Sunshine Coast had a shortage of international
resorts, with only the Hyatt, Sheraton, and Twin Waters, all of which had been operating for
at least six years. By the end of the year, the rising visitor numbers had resulted in a number
of new accommodation proposals (Midwood - Tourism & Development, 1997). One such
plan was for a five-star health resort near Landsborough, which would be owned and
operated by an Austrian company (Midwood - Tourism & Development, 1997). Another
proposal was an international hotel to be added the Wharf and Underwater World complex
in Mooloolaba (Midwood - Tourism & Development, 1996).
4.6 Tourism Change Factors
The preceding historical description of the case area illustrates the significant development
of tourism at all levels between 1980 and 1997, as well as the variety of factors that
influenced the growth. This section focuses on these growth factors by reviewing the types
of changes that have occurred. Firstly, the change is considered in the context of the
proposed Multi-Trajectory Model of Tourism Destination Change. Secondly, the numerous
factors which have affected tourism destination development are identified. These are
separated into the change factors at the state, national, and global levels; and the local and
regional levels of the tourism case system.
4.6.1 Types of Change
The types of change, presented in the Multi-Trajectory Model of Tourism Destination
Change proposed in Chapter Two, included dramatic and gradual change in a positive or
negative direction, as well as the maintenance of equilibrium (Figure 2.16).
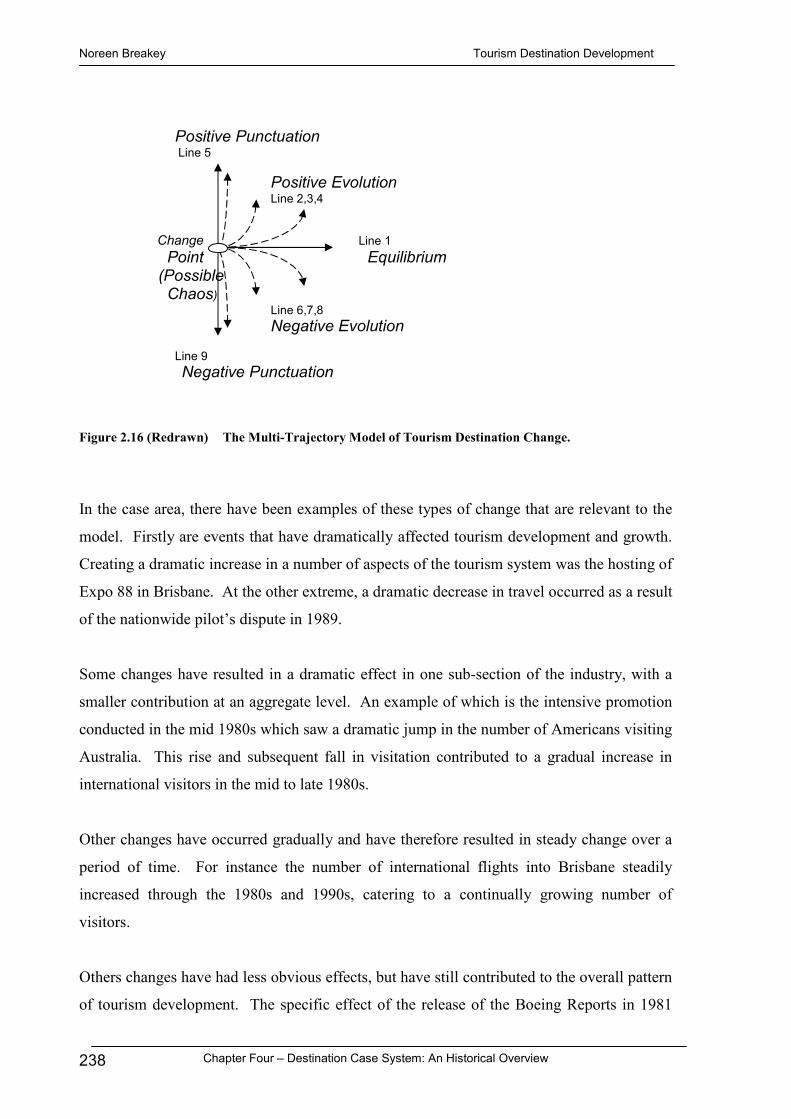
Noreen Breakey Tourism Destination Development
Chapter Four – Destination Case System: An Historical Overview 238
Positive Punctuation Line 5
Positive Evolution
Line 2,3,4
Change Line 1 Point Equilibrium
(Possible Chaos)
Line 6,7,8 Negative Evolution
Line 9 Negative Punctuation
Figure 2.16 (Redrawn) The Multi-Trajectory Model of Tourism Destination Change.
In the case area, there have been examples of these types of change that are relevant to the
model. Firstly are events that have dramatically affected tourism development and growth.
Creating a dramatic increase in a number of aspects of the tourism system was the hosting of
Expo 88 in Brisbane. At the other extreme, a dramatic decrease in travel occurred as a result
of the nationwide pilot’s dispute in 1989.
Some changes have resulted in a dramatic effect in one sub-section of the industry, with a
smaller contribution at an aggregate level. An example of which is the intensive promotion
conducted in the mid 1980s which saw a dramatic jump in the number of Americans visiting
Australia. This rise and subsequent fall in visitation contributed to a gradual increase in
international visitors in the mid to late 1980s.
Other changes have occurred gradually and have therefore resulted in steady change over a
period of time. For instance the number of international flights into Brisbane steadily
increased through the 1980s and 1990s, catering to a continually growing number of
visitors.
Others changes have had less obvious effects, but have still contributed to the overall pattern
of tourism development. The specific effect of the release of the Boeing Reports in 1981

Noreen Breakey Tourism Destination Development
Chapter Four – Destination Case System: An Historical Overview 239
and 1986 is unknown. However it is clear that these reports contributed to the growing
understanding of the economic benefits of tourism development. The information provided
and predictions made were unparalleled at that time. This provided the basis for action
undertaken by governments and developers.
4.6.2 Change in the National and State Levels of the Tourism System
A number of types of change have been identified during the research into the history of
Queensland and Australia which have affected tourism development at the state, national
and international levels of the tourism case area. It is important to note that these factors do
not occur in isolation and are instead interconnected elements of the tourism system and its
external environment.
4.6.2.1 Tourism Change Factor One - Building Booms
Building of hotels and units appears to occur more in line with building booms, rather than
as a result of research data illustrating a growing need for tourist accommodation. In
addition the type of accommodation built seems to be aligned with building regulations and
the type of building boom, rather than the form and standard of accommodation required by
visitors, such as the excess development of units in the early 1980s without visitor trends
indicating a need.
4.6.2.2 Tourism Change Factor Two - Level of Promotion
Building of hotels and units appears to occur more in line with building booms, rather than
as a result of research data illustrating a growing need for tourist accommodation. In
addition the type of accommodation built seems to be aligned with building regulations and
the type of building boom, rather than the form and standard of accommodation required by
visitors, such as the excess development of units in the early 1980s without visitor trends
indicating a need.

Noreen Breakey Tourism Destination Development
Chapter Four – Destination Case System: An Historical Overview 240
4.6.2.3 Tourism Change Factor Three - Cost of Airfares
A dramatic change in the cost of airfares is significant for international visitation levels. For
example the cheap airfares in the late 1970s positively affected the number of international
visitors. This was in contrast with the world travel trend. Alternatively, the high cost of
airfares compared to other international destinations can reduce visitation to Australia. In
the mid 1980s the high airfares for trips to Australia was considered to be the main barrier to
increased visitors from the United Kingdom.
However, the cost of airfares may be only one of a number of factors affecting destination
choice and ultimately visitation levels. For instance the lower level of international
visitation in 1997 resulted in a drop in airfares to generate more competitive package deals.
4.6.2.4 Tourism Change Factor Four - Economic Impact of Tourism
There was an increase in the level of understanding of the economic impacts of tourism
activity, from the early 1980s through to the last years of the 1990s. This resulted in further
investment, earnings, employment, and promotion, which resulted in further research, and
increased knowledge regarding tourism, thus keeping the cycle going. The research has
highlighted the industry’s impact on GDP, employment, balance of payments, local
economies, and by 1997/98 a Tourism Satellite Account for Australia had been established.
4.6.2.5 Tourism Change Factor Five - Economic Climate
The economy of Australia can affect tourism activity. The relationship between the national
economic climate and the situation in other countries is especially important. There are
numerous examples of the effect of the Australian economy on tourism, particularly
international travel to and from Australia (Table 4.2).

Noreen Breakey Tourism Destination Development
Chapter Four – Destination Case System: An Historical Overview 241
Table 4.2 Economic Climate. Changes in the economy of Australia or other countries that have affected travel to and from Australia.
Economic Change Impact on Tourism Falling Australian dollar during the mid 1980s Assisted inbound travel and hampered outbound
tourism
Overvaluation of the Japanese yen around 1987 The Japanese outbound market was boosted as the way to capitalise on its buying power was to travel overseas
After the recession of the early 1990s, the Australian dollar began to fall again
Boosted tourism, both domestically and internationally
New Zealand economic recovery and strengthening dollar in 1993
A jump in visitation from New Zealand
In 1996 the Australian dollar began to increase in value
Australia recorded lower international visitation
By 1996/97, the Yen had dropped 20% in relation to the Australian dollar
Growth in Japanese visitation levelled out
The rising Australian dollar in relation to other Asian countries
The growth in level of Asian visitors slowed by mid 1997
At the same time, the American dollar was still stronger than the Australian dollar
Australia was a ‘value-for-money’ destination for US travellers
Asian economic crisis of 1997 Dramatic drop in visitation from Asia
Devaluation of the Australian dollar relative to the US, UK and other European currencies after the Asian downturn of 1997
Provided a short-term opportunity for increased inbound travel from these regions
4.6.2.6 Tourism Change Factor Six - Government: Tourism
Throughout the 20th Century the role of Government in tourism has developed. Such
involvement has included the establishment of government bureaus, departments, and
agencies, and support for tourism through promotion, funding, and research. The level of
involvement has fluctuated depending on the priorities of each ministry and the economic
health of the tourism industry. Illustrating the effect of external conditions on government
support for tourism was the change from planned Federal budget cuts to emergency funding
following the Asian economic crisis in 1997.
4.6.2.7 Tourism Change Factor Seven - Government: Non-tourism
Government policies regarding a range of issues can also affect tourism development.
These include the economy, business, taxation, investment, and deregulation; building

Noreen Breakey Tourism Destination Development
Chapter Four – Destination Case System: An Historical Overview 242
assistance, requirements and restrictions; immigration and visa requirements; trade, foreign
investment, and international relations; mining; and conservation, and natural area
management. A specific example was the upgrading of the Pacific Highway. This was
funded primarily by the NSW and Federal Government and ultimately assisted travel north
to Queensland. However the timing and the extent of the work was well outside the control
of the Queensland tourism industry.
4.6.2.8 Tourism Change Factor Eight - Events
Events can have a variety of direct and indirect tourism impacts on the host city, region,
and/or country. There were numerous direct impacts of the holding of Expo 88 in Brisbane
during 1988. These included a significant increase in international and domestic visitor
numbers, and clear diversions from the ‘usual’ patterns of visitation within Queensland.
A less obvious impact is the role of an event in presenting the host area to a wider audience,
whether it be nationally or internationally. For example, the 1982 Commonwealth Games is
believed to have put the ‘Big Country Town’ of Brisbane ‘on the map’.
There are also impacts of events that are not specifically tourism but can affect the industry.
For example, prior to Expo 88 there was significant building activity to prepare for and
capitalise on the event.
4.6.2.9 Tourism Change Factor Nine - Accommodation Supply
Tourism visitation is dependant on the combined factors of supply and demand. However
the extent and type of accommodation that is provided by a destination does not always
correlate with the level and type of demand. This was exemplified in the mid 1990s when
the growth in visitation in Queensland was considered to be limited by the supply of
accommodation, rather than the level of demand. Additionally, the specific and well-
documented need for budget accommodation for both the domestic and price-sensitive
international markets was not met, as new 5-star hotels continued to be built instead.

Noreen Breakey Tourism Destination Development
Chapter Four – Destination Case System: An Historical Overview 243
4.6.3 Change in Regional and Local Levels of the Tourism System
A number of factors have been identified during the research into the history of the Sunshine
Coast and it’s Local Authorities which have affected tourism development at these local and
regional levels of the tourism case area. As mentioned, these change factors are all related
elements of the tourism system and its external environment.
4.6.3.1 Tourism Change Factor One - Stakeholder Vision
The type of development and the aims of stakeholders can affect the direction of
development. Such stakeholders include developers, Councillors, conservation associations,
and local community associations. For example, in 1980 the plans of Noosa Holdings for
development along Hastings Street aimed to change the ‘scale and character’ of the
destination and appeal to top market cliental. Although their aims were not fulfilled at the
time, by the end of the decade the first five-star international hotel had opened on Hasting
Street, the Sheraton Noosa Resort. The Noosa Council elected in the late 1980s did not
support high-rise developments, such as the Sheraton, but their vision was still to attract the
top end of the tourist market. This quality, rather than quantity focused Council, under
Chairman Playford was still in place in 1997.
4.6.3.2 Tourism Change Factor Two - Local Councils
Local Government determines the town plans for an area, thereby affecting the developer’s
plans and ultimately tourism development. The lack of town plans in the 1960s resulted in
approval for an eight-storey building on the ocean side of Hastings Street. Consequently a
plan restricting buildings to three-storeys was introduced. However, this still did not restrict
development on the non-ocean side.
The agenda of the Local Councils also directs the development of the area. This often
results in periods of pro-development, alternating with environmentally conscious decision-
making. In Noosa the 1982 to 1985 Council achieved numerous town planning and
conservation gains. This was followed by a pro-development Council who focused on
ensuring that the ‘inevitable’ development occurred in an orderly manner. One of their
specific foci was to encourage large-scale residential, leisure and tourism development on
the North Shore. The construction of numerous six storey buildings in Hastings Street,
Noreen Breakey Tourism Destination Development
Chapter Four – Destination Case System: An Historical Overview 244
Munna Point, and Noosa Sound, resulted in the realisation by the locals of the impact of
such developments, and ultimately voted in a new Council. This Playford Council scaled
down the extensive development supported by the previous Council.
4.6.3.3 Tourism Change Factor Three - State Government
Changes in Government at the State level can also affect development at the regional level.
For example, the State Government extinguished the Maroochy beachfront National Park in
1958 for the development of the airport, hotels, and the suburbs of Marcoola and Mudjimba.
4.6.3.4 Tourism Change Factor Four - Federal Government
Decisions made by the Federal Government can support or override regional and/or State
decisions, thereby shaping the development of the region. For example the approval and
control of mining is a state responsibility, but as the export of minerals is a commonwealth
function, the federal government intervened to prevent sand mining on Fraser Island.
4.6.3.5 Tourism Change Factor Five - Planning Requirements
Length of time required for the planning, financing, approval, and commencement of
projects, often results in a changes in Government during the process. This can be
especially pertinent for changes in the Local Council or the State Government. For
example, the Noosa Council agreed to T.M. Burke’s plan to develop a town plan for the
coastal strip, running south from Sunshine Beach to Peregian Beach, and incorporating a
new arterial road. However, by the time Main Roads announced this planned eastern route
almost a decade had passed and the newer environmentally conscious Noosa Council
blocked its construction.
4.6.3.6 Tourism Change Factor Six - Nature
The weather and natural disasters, such as cyclones and coastal movements, can affect
existing and future coastal developments. On the Sunshine Coast this has particularly
affected Noosa Heads, along Main Beach and on Noosa Spit. In addition, the impact of the
1967/68 cyclone season resulted in the introduction of the Queensland Beach Protection Act
to protect the foredune area of beaches that had not already been built upon.

Noreen Breakey Tourism Destination Development
Chapter Four – Destination Case System: An Historical Overview 245
4.6.3.7 Tourism Change Factor Seven - Financial Difficulties
The financial state of the developers affects the timing and progression of development
plans. This may be the individual situation of a developer, or a reflection of the nation-wide
economic climate. As a consequence of the building bust of the early 1980s, many
companies, such as Noosa Holdings were declared bankrupt. This prevented their large-
scale, international resort plans from going ahead.
4.6.3.8 Tourism Change Factor Eight - Local Associations
Community protest and conservation orientated associations can also affect tourism
development. The pro-development Noosa Council of the mid 1980s was opposed by the
pro-conservation Noosa Parks Association for their three year term. Ultimately each was
generally able to stalemate the plans of the other, but not achieve their own goals.
4.6.3.9 Tourism Change Factor Nine - Combining Forces
Although opposed on many issues, sometimes different parties can unite for a common goal.
Despite being on different sides on the Noosa National Park issue during the 1960s, T.M.
Burke, the Noosa Shire, the Maroochy Shire, the local residents and the environmentalists,
all opposed the granting of a sand-mining dredging lease in the 1970s.
4.6.3.10 Tourism Change Factor Ten - Retirement Destination
The Sunshine Coast has also been affected by its development as a retirement destination.
By 1986 the growing popularity of Retirement Villages had resulted in a number of
developments of the Sunshine Coast and studios began to sell. This has affected the social
structure and infrastructure needs.
4.6.3.11 Tourism Change Factor Eleven - Accessibility
The level of access is one of the most important factors determining the rate of general
growth, and therefore tourism development. The lack of easy access to the seaside towns in
the early 1900s severely restricted their progress. In the later 1900s, the development of
airline services and multi-lane highways significantly improved and enhanced all aspects of
tourism expansion.

Noreen Breakey Tourism Destination Development
Chapter Four – Destination Case System: An Historical Overview 246
4.6.3.12 Combination of Tourism Change Factors
The change factors described above interact over time. The particular combination and the
timing of the various changes can affect the development of the destination.
The reason that large-scale development does not occur is not necessarily because of
limiting legislation, community opposition, or economic forces, but the combination of
these forces. For example, in 1969 the Noosa Council approved an eight storey resort
development for the ocean side of Hastings Street in 1969. This was granted because there
was no town plan for Hasting Street and therefore no limit to what could be approved. The
approval for the project lapsed due to the financial difficulties of the developer. An
extension was applied for, but not granted. The Council determined that the foreshore was
part of the newly defined Beach Erosion Control Area under the Beach Authority Act and
the proposed type of development was not considered appropriate. This situation was
therefore affected by the combination and timing of Local Council regulations, developers
plans, financial difficulties, and State regulations.
4.6.4 Tourism Change
The development of tourism within Australia and Queensland, and more specifically on the
Sunshine Coast, has not been solely the result of specific individual decisions and events,
but the combination of these inter-related changes and their flow on effects. Tourism
development is ultimately affected by the general flux of all aspects of development
globally, nationally, and locally. This thereby incorporates changes within the public and
private sectors of the tourism industry, non-tourism specific government policies at the
Federal and State levels, building and investment by Australians and foreigners, and the
economic state of Australia within the global setting.
In addition, tourism as an industry is part of and contributes to the economy. This
perception of tourism changed from the earlier view of tourism simply being an activity
people do on holidays. The development of tourism throughout the last two decades of the
20th Century has resulted in tourism being recognised as an industry that is part of the
international economy. At the local or regional level, tourism can be the primary driver of
development. In the case area of the Sunshine Coast the contribution of tourism to the local

Noreen Breakey Tourism Destination Development
Chapter Four – Destination Case System: An Historical Overview 247
economy in 1998/99 was greater than the contribution by any other industry (OESR, 2004b).
This significant role of tourism in the economy of the Sunshine Coast in 1998/99 was
greater than for any other destination in Queensland.
4.7 Revisiting the Research Issues
This section revisits the three research issues derived from the Multi-Trajectory Model of
Tourism Destination Change, presented in Chapter Two. This is used to identify data
variables that can be analysed in Chapter Five to determine whether the research issues, and
therefore the proposed model, are supported by the data on change in this tourism system.
Progressive growth of the case area, along with the apparently chaotic nature of the
development of the Sunshine Coast made it an ideal candidate for testing the model.
The development of tourism in the three areas of the Sunshine Coast, within the Queensland,
Australia, and global contexts, exemplifies the different types of change proposed by the
Multi-Trajectory Model of Tourism Destination Change developed in Chapter Two.
There are three research issues resulting from this proposed model, the demonstration of
which would support the model.
4.7.1 Research Issue One - Area Aggregation > Data Smoothing
The first Research Issue states that: although tourism change can be analysed at various
levels, area aggregation results in data smoothing. An aggregate measure of tourism
change, while providing an overview, does not illustrate the underlying change and
complexity that occurs within a tourist destination, or the variation that may exist within
sub-areas.
Providing support for this first Research Issue would be any tourism or growth variable that
has been measure over time for various levels of the study area, particularly the lowest level
of the three Local Government Areas. Data variables which could be used to demonstrate
Noreen Breakey Tourism Destination Development
Chapter Four – Destination Case System: An Historical Overview 248
area aggregation in the study area include those related to population, building activity,
visitation, and tourism accommodation.
To illustrate the effect of data smoothing a tourism variable and a general growth variable
were selected. The tourism variable was the supply of accommodation in the hotel, motel,
and guest house sector, and the growth variable was population.
Over the 1980 to 1997 period reviewed in this chapter, the level of accommodation supplied
on the Sunshine Coast has grown, to cater to the increased visitation. Of the various types
of accommodation, the hotel, motel and guest house sector has seen significant development
since 1980, including the additional of the prominent international hotel properties. This
variable can be analysed in terms of the total number of properties and the total number of
rooms provided by these establishments. Analysis of both these variables will identify
whether the level of growth on the Sunshine Coast is similar to the patterns at the higher
State and National levels. Conducting the analysis at the Local Area level will demonstrate
whether growth was uniform across the destination, or whether parts of the region
experienced growth at different times, or in differing amounts.
As discussed in this chapter, there has been significant population growth on the Sunshine
Coast, which has been higher than the State and National trends. If area aggregation results
in data smoothing it would be expected that the yearly population change on the Sunshine
Coast would have fluctuated more than the State and National data. In addition the growth
pattern of the Sunshine Coast population can be analysed in terms of the changes in the three
Local Areas. This may also reflect the differing policies of the Local Governments
regarding population growth, for example, the population cap for Noosa.
4.7.2 Research Issue Two - Change Not Explained By Visitor Numbers
The second Research Issue states that: tourism change cannot be explained by
total yearly visitor numbers alone. Total visitor numbers is an aggregation of all types of
tourists. As an aggregate measure of tourism change, this measurement also fails to describe
the underlying change, complexity, and variation that may exist within sub-classifications.

Noreen Breakey Tourism Destination Development
Chapter Four – Destination Case System: An Historical Overview 249
This overall measurement can be broken down in a variety of ways, such as origin, type of
accommodation, or product markets. In addition, a measure of total visitor numbers alone
does not illustrate changing patterns within the data. Factors such as the length of stay and
visitor expenditure level have significant impact on yield, and cannot be determined by
visitor numbers alone. This second research issue has three sub-issues (Table 4.3).
Table 4.3 The Three Sub-Issues of Research Issue Two
Research Issue Two
Description Data Variables
Sub-Issue One The pattern of total visitor numbers does not represent the underlying variation of sub-categories
Visitors to the Sunshine Coast by • Origin • Accommodation used • Stage of life Visitors to Australia by • Origin
Sub-Issue Two Yearly data obscures seasonal variation
Sunshine Coast visitation by • Intrastate visitors • Interstate visitors • International visitors • Total visitors Sunshine Coast occupancy rates • Hotels, motels & guest houses • Caravan parks
Sub-Issue Three Other data needs to be analysed alongside visitor numbers to determine the effect of changing trends
Sunshine Coast visitation • Average length of stay • Visitor expenditure • Takings by accommodation providers • Occupancy rates
The first Sub-Issue states that the pattern of total number of visitors does not represent the
underlying variation of sub-categories. Providing support for this Sub-Issue would be any
variable of visitation that has been measured over time and separated into sub-categories.
Data variables which could be used to demonstrate whether there is underlying variation
include those related to origin, accommodation used, transport used, stage of life, age, and
nationality. Additionally a measure of visitation can be conducted for the number of
visitors, or the number of visitors nights, which is the result of the number of visitors and
their length of stay. To illustrate the underlying patterns of sub-category visitation, four
variables were selected: visitors to the Sunshine Coast by origin, by accommodation used,

Noreen Breakey Tourism Destination Development
Chapter Four – Destination Case System: An Historical Overview 250
and by stage of life; and visitors to Australia by country of origin. Wherever possible,
multiple sources of data were utilised.
The second Sub-Issue states that yearly data obscures seasonal variation. The use of yearly
visitor numbers conceals the seasonal variation which is often significant in tourism
destinations. Providing support for this Sub-Issue would be variables on visitation levels
that have been measured over time, at quarterly or monthly intervals, such as the number of
visitors and occupancy levels. Both these variables were selected, utilising sub-categories.
Total visitor numbers by quarter were separated into intrastate, interstate, and international.
In addition, the monthly occupancy levels were analysed for two forms of accommodation:
Hotels, Motels, and Guest Houses; and Caravan Parks.
The third Sub-Issue proposed that other data variables need to be analysed alongside visitor
numbers to determine the effect of changing trends. Providing support for this Sub-Issue
would be tourist variables on aspects of visitation that have been measured over time,
including length of stay, occupancy rates, visitor expenditure, and takings by tourism
operations, such as accommodation providers. These variables were all measured for the
Sunshine Coast.
4.7.3 Research Issue Three - No Predetermined Pattern
The third Research Issue states that: there is no predetermined pattern of tourism
destination change. Instead of the expectation that a destination will probably progress
sequentially through the stages of the Destination Life-Cycle, this Multi-Trajectory Model
of Tourism Destination Change illustrates that at any given time during its life, a destination
may ‘change’ to follow any one of the five trajectory options. Within this Research Issue
there are three Sub-Issues which relate to the destination pattern of change (Table 4.4).
The first Sub-Issue states that tourism-related data variables exhibit different patterns. If
there is no predetermined pattern, then data variables will exhibit different patterns over
time. Providing support for this Sub-Issue would be any collection of tourism-related
variables that have been measured over the same time frame. To determine whether this
sub-issue holds true even within a sector of the industry, the hotel, motel and guest house
sector was selected for analysis. This sector has been included in previous issues, however a

Noreen Breakey Tourism Destination Development
Chapter Four – Destination Case System: An Historical Overview 251
comparison of the different variables within this sector would determine whether tourism
variables exhibit different patterns.
Table 4.4 The Three Sub-Issues of Research Issue Three.
Research Issue Three
Description Data Variables
Sub-Issue One Tourism-related data variables exhibit different patterns
Hotel, Motel & Guest Houses • Occupancy • Visitor numbers & total rooms • Takings & expenditure on
accommodation • Visitor numbers, total rooms,
occupancy & takings
Sub-Issue Two The last stage does not predict the next stage
Comparison of variables during the boom and bust periods
Sub-Issue Three Trajectory lengths are not predetermined
Comparison of variables during the boom and bust periods
The second Sub-Issue states that the current trajectory does not have a predetermined life. If
there is no set pattern for tourism destination development, one trajectory option does not
last for a preset period of time. To determine whether the one trajectory has a
predetermined duration, a six year time frame was selected when tourism in Australia
generally experienced an expansion followed by downturn. These two periods, the
‘Tourism Boom’ and ‘The Recession’ were discussed in this chapter. If there was a preset
ending to a trajectory, analysis of such a situation would be expected to exhibit a growth
trajectory followed by a declining trajectory across the eight tourism-related variables,
which have previous been presented.
The third Sub-Issue states that the last stage does not predict the next. This Sub-Issue
follows on from the first Sub-Issue, which stated that there is no set pattern for tourism
destination development. If the pattern of change in the period analysed can be any one of
the trajectories of the Multi-Trajectory Model of Tourism Destination Change, or a
combination of these options, then one stage does not automatically follow another. To
determine the whether the one trajectory precedes another, the six year time frame and the
eight variables utilised for the previous Sub-Issue were selected. If the ordering of the
trajectories was consistent, such a scenario would be expected to produce a growth
trajectory followed by a declining trajectory across the tourism-related variables.

Noreen Breakey Tourism Destination Development
Chapter Four – Destination Case System: An Historical Overview 252
4.8 Conclusion
This chapter has summarised the development of tourism in the case area, in the context of
the wider social, economic, and political changes. The information provides support for the
time series data presented in Chapter Five. Patterns in the data can therefore be understood
in relation to the context in which they occurred.
The chapter also reviewed the Research Issues derived from the proposed Multi-Trajectory
Model of Tourism Destination Change, and identified the data variables to be used to test
each Research Issue in the following chapter.

Noreen Breakey Tourism Destination Development
Chapter Five – Destination Case System: A Time-Series Analysis 253
Chapter 5 Tourism Destination Case System - A Time-
Series Analysis
5.1 Overview of Chapter Five
This chapter tests the proposed Multi-Trajectory Model of Tourism Destination Change
developed in Chapter Two, using the tourism case system introduced in Chapter Four. This
is achieved by addressing each of the Research Issues and Sub-Issues derived from the
Multi-Trajectory Model of Tourism Destination Change (Section 2.7.1). The demonstration
of these issues, through the presentation and analysis of tourism-related data variables,
provides support for the proposed model. The data variables to be used to test each of the
Research Issues were identified in Chapter Four (Section 4.7).
The Sunshine Coast region is a destination that has experienced significant tourism growth.
This has occurred within the contexts of the wider State, National, and Global tourism
systems. As discussed in Chapter Four, tourism had been a part of the Sunshine Coast
throughout the 20th Century. However, the major part of this development has occurred
since 1980. Data on this growth was generally recorded using a consistent methodology
until 199717. Consequently this provides the general time boundary of the quantitative data
variables used to establish whether the proposed model fits observed data.
5.2 The Research Issues
Chapter Two reviewed four theories on the process of change and their application to the
phenomenon of tourism destination development. While none of the theories provide a
complete explanation of the complex changes that occur in a destination, all offer important
concepts which assist in understanding tourism development and growth. These concepts
17 Some minor changes to the methodology have occurred over time, including boundary adjustments, and changes in definitions, such as the required number of rooms for a unit/apartment to be included in the data collection.

Noreen Breakey Tourism Destination Development
Chapter Five – Destination Case System: A Time-Series Analysis 254
provided the basis for the development of the Multi-Trajectory Model of Tourism
Destination Change, presented in the final section of Chapter Two (Figure 2.16).
This Multi-Trajectory Model of Tourism Destination Change proposes that the growth
pattern of a tourism-related variable may at times be in a state of complete ‘equilibrium’,
undergoing gradual positive or negative ‘evolutionary’ change, or within a ‘chaos’ induced
‘punctuation’ that is causing an immediate, and substantial increase or decrease in growth.
This relates directly to the stated aim of this work (Section 2.8). Therefore support for the
proposed model would indicate that tourism destination change occurs as a combination of
equilibrium, gradual evolutionary changes, and dramatic punctuations caused by the agents
of chaos. The data analysis in this chapter will identify if these different trajectories are
evident in the change patterns of the data variables in the tourism case system.
In Chapter Two the Multi-Trajectory Model was used to derive three Research Issues and
six Sub-Issues (Figure 5.1). The first two Research Issues are the underlying basis to the
model.
Figure 5.1 The Research Issues and Sub-Issues of the Proposed Model. The Relationships between the research issues and sub-issues that provide the foundation for the Multi-Trajectory Model of Tourism Destination Change.
The Multi-Trajectory Modelof Tourism Destination Change
No PredeterminedPattern
Sub-IssueOne
Different Patterns
Sub-IssueTwo
Sub-IssueThree
Other Variables
Sub-IssueTwo
Seasonality
Trajectory Lengths Dif fer
Sub-IssueThree
Research Issue One
Area Aggregation > Data Smoothing
Research Issue Three
Last Stage does not Predict Next
Sub-IssueOne
Visitor SubCategories
Research Issue Two
Change not Explainedby Visitor Numbers

Noreen Breakey Tourism Destination Development
Chapter Five – Destination Case System: A Time-Series Analysis 255
Research Issue One considers the change in the pattern displayed by a data variable at
different geographical levels. The general premise being that the greater the aggregation,
the smoother the data pattern. Ultimately the variation within a data pattern, and the
different trajectories displayed, needs to be considered in relation to the geographical level
under analysis. In addition, this Research Issue highlights the applicability of the proposed
model to the various geographic levels.
Research Issue Two addresses the limitations inherent in describing the change in a tourism
destination simply through the analysis of yearly visitor numbers. The three Sub-Issues
demonstrate the variation in the patterns of underlying and related data variables by
considering firstly, the sub-categories of visitor numbers, secondly, the seasonality within
yearly totals, and thirdly, other variables which assist in providing a more complete picture
of the changes occurring within a destination. Additionally, in examining this second
Research Issue the application of the proposed model to an array of data variables, many of
which were collected by different agencies applying a range of methodologies, at various
geographical scales, and using a number of time frames, is examined.
The third Research Issue and its Sub-Issues relate to the pattern of change exhibited by
destination data variables, as the culmination of the various trajectories proposed by the
Multi-Trajectory Model of Tourism Destination Change. This is embodied in Research
Issue Three which states that there is no predetermined pattern. The concept is supported
through the demonstration of the three Sub-Issues. The first Sub-Issue addresses the
different types of patterns of change that occur, the second considers the unspecified
duration of a stage or trajectory, and the third relates to the lack of order in stage
progression.
The linkages between the Research Issues (Figure 5.1) illustrate the relationships between
the Issues and Sub-Issues. There are strong links between certain issues (unbroken lines) as
well as secondary linkages (dashed lines). These links show that the explanation of one
issue may also provide support for other issues. Ultimately the demonstration of all these
issues is a basis for supporting the Multi-Trajectory Model of Tourism Destination Change
in relation to the tourism case system analysed in this work.

Noreen Breakey Tourism Destination Development
Chapter Five – Destination Case System: A Time-Series Analysis 256
The following sections of this chapter address each of these Research Issues in turn, using
tourism and general growth data from various levels of the tourism case system. These data
variables were obtained from many sources. For variables that are measured in Australian
dollars, such as the value of new buildings, visitor expenditure, and takings from the
accommodation sector, the recorded measurements have been converted to incorporate the
CPI adjustment using a base financial year of 1989-1990. The data analysis focuses on the
growth patterns, which incorporates the trajectories and the points where these trajectories
change. Where required this is achieved through the statistical analysis of the trends, as
described in Chapter Three (Section 3.4.3).
5.2.1 Applying the Proposed Model at Various System Levels
Chapter Two discussed the applicability of the proposed model to various geographic levels,
from the micro areas, such as a Local Government Area, to the macro National and Global
levels. The further a study area aggregates, the more likely that smoothing of the pattern
generated by the data variable will occur. The various levels of aggregation, presented in
Chapter Two (Figure 2.17), have been expanded to incorporate the specific levels of the
tourism system being used as the case study for this work (Figure 5.2). This aspect of the
design of the Multi-Trajectory Model of Tourism Destination Change, which allows for
application at these various tourism levels, provides the basis for the first Research Issue.
MACRO MICRO
Global National State Regional Local
World Australia Queensland Sunshine Coast Local Areas
Increasing Aggregation
Increasing Smoothing in Data Variables
Figure 5.2 Aggregation within the Tourism System. The effect of aggregation on the various levels of the tourism system, including the case system used in this study. (Developed from Figure 2.17).

Noreen Breakey Tourism Destination Development
Chapter Five – Destination Case System: A Time-Series Analysis 257
5.3 Research Issue One - Area Aggregation
The first Research Issue states that: although tourism change can be analysed at various
levels, area aggregation results in data smoothing. While an aggregate measure of
tourism change provides an overview it does not describe the underlying change and
complexity that occurs within a tourism destination, or the variation that may occur within
sub-areas. This is addressed by the proposed Multi-Trajectory Model of Tourism
Destination Change.
This Research Issue will be addressed through an examination of the patterns of change
displayed by variables at different levels of the case area. As determined in Chapter Four, a
tourism variable, the supply of accommodation in the hotel, motel, and guest house sector
was selected, in conjunction with a general growth indicator, population change.
5.3.1 Supply of Hotel, Motel and Guest House Accommodation
Part of the development of tourism over the last twenty years of the 20th Century included
the change in the number and capacity of accommodation operations. Data on the type of
accommodation, as provided by the Australian Bureau of Statistics (ABS), has been
collected for three categories: firstly hotels, motels, and guest houses; secondly self-
contained flats, units and houses; and thirdly caravan parks.
This analysis will focus on the hotel, motel, and guest house sector, using the quarterly data
on both the number of establishments and the total number of rooms. This data is analysed
at the Local, Regional, State, and National levels to determine the effects of smoothing as
the areas are aggregated. The data on the number of rooms has also been analysed using a
Lowess Scatter-Plot Smoother to establish the long-term trend (as described in Section
3.4.3). This identifies the growth trajectories within this variable, for each of the different
layers of the tourism case system.

Noreen Breakey Tourism Destination Development
Chapter Five – Destination Case System: A Time-Series Analysis 258
5.3.1.1 Number of Establishments
The past 20 years have seen a small rise in the number of hotels, motels, and guest houses
within the Sunshine Coast Statistical District (Figure 5.3). In 1983, the total number of
establishments in the region was 62. Ten years later the number peaked at 83 before
dropping to 75 by 1997.
Figure 5.3 Number of Hotels, Motels, and Guest Houses in the Sunshine Coast Statistical District. (Quarterly: 1983 – 1997) (Source: ABS 8635.3 Tourist Accommodation)
This growth in the number of hotels, motels, and guest houses on the Sunshine Coast can be
separated into the number in each of the three Local Government Areas (Figure 5.4). This
data is provided from 1988 to 1997, as the earlier data is not available at the local level.
Figure 5.4 Number of Hotels, Motels, and Guest Houses in each of the Three Local Government Areas within the Sunshine Coast Statistical District. (Quarterly: 1988 – 1997) (Source: ABS 8635.3 Tourist Accommodation)
0
20
40
60
80
100
Jun 83
Qtr
Dec83
Qtr
Jun 84
Qtr
Dec84
Qtr
Jun 85
Qtr
Dec85
Qtr
Jun 86
Qtr
Dec86
Qtr
Jun 87
Qtr
Dec87
Qtr
Jun 88
Qtr
Dec88
Qtr
Jun 89
Qtr
Dec89
Qtr
Jun 90
Qtr
Dec90
Qtr
Jun 91
Qtr
Dec91
Qtr
Jun 92
Qtr
Dec92
Qtr
Jun 93
Qtr
Dec93
Qtr
Jun 94
Qtr
Dec94
Qtr
Jun 95
Qtr
Dec95
Qtr
Jun 96
Qtr
Dec96
Qtr
Jun 97
Qtr
Dec97
Qtr
Quarter
Num
bero
fEst
ablis
hmen
ts
Sunshine Coast
0
5
10
15
20
25
30
35
40
45
50
Mar88
Qtr
Sep88
Qtr
Mar89
Qtr
Sep89
Qtr
Mar90
Qtr
Sep90
Qtr
Mar91
Qtr
Sep91
Qtr
Mar92
Qtr
Sep92
Qtr
Mar93
Qtr
Sep93
Qtr
Mar94
Qtr
Sep94
Qtr
Mar95
Qtr
Sep95
Qtr
Mar96
Qtr
Sep96
Qtr
Mar97
Qtr
Sep97
Qtr
Quarter
Num
bero
fEst
ablis
hmen
ts
MaroochyNoosaCaloundra

Noreen Breakey Tourism Destination Development
Chapter Five – Destination Case System: A Time-Series Analysis 259
The total number of establishments within the Sunshine Coast (Figure 5.3) is the sum of the
number in each local area, but it can be seen that the overall regional pattern is not
representative of the growth in each area.
Within the Sunshine Coast region, the majority of hotels, motels, and guest houses were
located in the Maroochy Shire. The remainder were split between the other two local areas,
with the number in the Noosa area dropping below the Caloundra contribution in the mid
1990s. The number in Caloundra remained relatively stable, only ranging between 16 and
18 establishments throughout the decade. The greatest absolute fluctuation occurred within
Noosa, where the number of establishments dropped from 23 to 13 between 1988 and 1995,
before rising to 16 by the end of the 1997.
At the regional level, there was a small increase in the number of hotels, motels, and guest
houses between 1988 and 1993. This was in fact comprised of a rise in the number of
establishments in Maroochy and Caloundra, combined with a drop in the number in Noosa.
Such a scenario illustrates how area aggregation masks underlying change patterns.
The reduction in the regional number of hotels, motels, and guest houses, through 1995 and
the early months of 1996 reflected a drop in all three areas, although the timing and extent of
the decline differed across the three local areas. The different patterns exhibited by each of
the local areas illustrates the effect of smoothing that occurs when the number of
establishments is amalgamated to the regional level.
As with the regional rise in the number of hotels, motels, and guest houses, the Queensland
level also rose over this fourteen year period (Figure 5.5). In 1983, the total number of
hotels, motels, and guest houses in the State was 875. By 1997, this had grown to almost
1200.
At both the state and regional levels, there was growth in the number of establishments from
1983 to mid-1987, although the patterns differed. At the regional level, the growth appeared
to occur in a step like pattern. This was obscured at the State level, as the aggregate of all
the regions in Queensland resulted in a smoother growth trajectory.

Noreen Breakey Tourism Destination Development
Chapter Five – Destination Case System: A Time-Series Analysis 260
Figure 5.5 Number of Hotels, Motels and Guest Houses in Queensland. (Quarterly: 1983 – 1997) (Source: ABS 8635.3 Tourist Accommodation)
Another difference between the data at the state and regional levels, is that the drop in the
mid 1990s that occurred on the Sunshine Coast is not evident at the Queensland level. The
decline in the number of hotels, motels, and guest houses in the region was offset by
increasing numbers in other areas of the state.
As the data pattern already appeared to be relatively smooth at the Queensland aggregate,
there is less difference between the patterns at the State and National levels. The number of
hotels, motels, and guest houses in Australia, like the Regional and State data, also rose
during this period (Figure 5.6). Both the patterns of the Queensland and National data show
a ‘positive evolutionary’ trajectory from 1983 to 1990, after which both generally exhibit a
‘equilibrium’ stage. This is followed at the State level, by the beginnings of another
‘positive evolutionary’ growth period. This trajectory change is not as apparent at the
Australian level, illustrating that development in Queensland may have been higher than the
National trend at that time.
0
200
400
600
800
1000
1200
Jun 83
Qtr
Dec83
Qtr
Jun 84
Qtr
Dec84
Qtr
Jun 85
Qtr
Dec85
Qtr
Jun 86
Qtr
Dec86
Qtr
Jun 87
Qtr
Dec87
Qtr
Jun 88
Qtr
Dec88
Qtr
Jun 89
Qtr
Dec89
Qtr
Jun 90
Qtr
Dec90
Qtr
Jun 91
Qtr
Dec91
Qtr
Jun 92
Qtr
Dec92
Qtr
Jun 93
Qtr
Dec93
Qtr
Jun 94
Qtr
Dec94
Qtr
Jun 95
Qtr
Dec95
Qtr
Jun 96
Qtr
Dec96
Qtr
Jun 97
Qtr
Dec97
Qtr
Quarter
Num
bero
fEst
ablis
hmen
ts
Queensland

Noreen Breakey Tourism Destination Development
Chapter Five – Destination Case System: A Time-Series Analysis 261
Figure 5.6 Number of Hotels, Motels and Guest Houses in Australia. (Quarterly: 1983 – 1997) (Source: ABS 8635.0 Tourist Accommodation)
5.3.1.2 Total Number of Rooms
In contrast to the small rise in the number of hotels, motels, and guest houses on the
Sunshine Coast (Figure 5.3), the total number of rooms provided by these establishments
more than doubled over the same time frame (Figure 5.7).
Figure 5.7 Number of Rooms in Hotels, Motels, and Guest Houses in the Sunshine Coast Statistical
District. (Quarterly: 1983 – 1997) (Source: ABS 8635.3 Tourist Accommodation)
0
500
1000
1500
2000
2500
3000
Jun 83
Qtr
Dec83
Qtr
Jun 84
Qtr
Dec84
Qtr
Jun 85
Qtr
Dec85
Qtr
Jun 86
Qtr
Dec86
Qtr
Jun 87
Qtr
Dec87
Qtr
Jun 88
Qtr
Dec88
Qtr
Jun 89
Qtr
Dec89
Qtr
Jun 90
Qtr
Dec90
Qtr
Jun 91
Qtr
Dec91
Qtr
Jun 92
Qtr
Dec92
Qtr
Jun 93
Qtr
Dec93
Qtr
Jun 94
Qtr
Dec94
Qtr
Jun 95
Qtr
Dec95
Qtr
Jun 96
Qtr
Dec96
Qtr
Jun 97
Qtr
Dec97
Qtr
Quarter
Num
bero
fRoo
ms
Sunshine Coast
0
500
1000
1500
2000
2500
3000
3500
4000
4500
5000
5500
Jun 83
Qtr
Dec83
Qtr
Jun 84
Qtr
Dec84
Qtr
Jun 85
Qtr
Dec85
Qtr
Jun 86
Qtr
Dec86
Qtr
Jun 87
Qtr
Dec87
Qtr
Jun 88
Qtr
Dec88
Qtr
Jun 89
Qtr
Dec89
Qtr
Jun 90
Qtr
Dec90
Qtr
Jun 91
Qtr
Dec91
Qtr
Jun 92
Qtr
Dec92
Qtr
Jun 93
Qtr
Dec93
Qtr
Jun 94
Qtr
Dec94
Qtr
Jun 95
Qtr
Dec95
Qtr
Jun 96
Qtr
Dec96
Qtr
Jun 97
Qtr
Dec97
Qtr
Quarter
Num
bero
fEst
ablis
hmen
tsAustralia

Noreen Breakey Tourism Destination Development
Chapter Five – Destination Case System: A Time-Series Analysis 262
This growth in the number of available rooms occurred primarily between the beginning of
1987 and the end of 1990. The rise in the capacity of the hotels, motels, and guest houses
over this four year period represents a dramatic increase between the early period of gradual
increase (1983 to 1986) and the last phase of relative equilibrium (1991 to 1997). To
illustrate this overall trend the data has been smoothed (Lowess=0.4) to highlight these
general trajectories within the data (Figure 5.8).
Figure 5.8 Long-Term Trend in the Number of Rooms in Hotels, Motels, and Guest Houses in the
Sunshine Coast Statistical District. (Calculated from: ABS 8635.3 Tourist Accommodation using a Lowess Scatter-Plot Smoother {Lowess = 0.4})
Compared to the six periods discussed in Chapter Four, this Sunshine Coast accommodation
development period appears to have lagged behind the nationwide tourism boom period that
had begun in 1986. In addition, the completion of projects that were underway appears to
have resulted in an extra year of development.
The application of a lower level of smoothing shows both the actual pattern of the change in
the variable, as well as the overall trend (Figure 5.9, Lowess=0.1). The pattern of growth
between 1987 and 1991 shows that the increase in the number of rooms followed a stepwise
pattern. This is due to the opening of a number of large hotels. During the four year growth
period, the individual steps in the total number of rooms vary in magnitude depending on
the number and size of the new establishments.

Noreen Breakey Tourism Destination Development
Chapter Five – Destination Case System: A Time-Series Analysis 263
The first major step in the number of rooms, which occurred in the second six months of
1988, can be mainly attributed to the opening of the 324 room Hyatt Regency Coolum. The
second step in the growth period, in the second half of 1989, is the result of the opening of
the 169 room Sheraton Noosa Resort. The last step in the growth period, in the second half
of 1990, is partially due to the opening of the Twin Waters Resort. After each sharp
increase in the total number of rooms, there is a gradual decline before the next large
increase. This may reflect change in the competitive environment as low yielding rooms
drop out of the market.
Figure 5.9 Trend in the Number of Rooms in Hotels, Motels, and Guest Houses in the Sunshine Coast
Statistical District. (Calculated from: ABS 8635.3 Tourist Accommodation using a Lowess Scatter-Plot Smoother {Lowess = 0.1})
In addition to highlighting the step-like growth in capacity during the four year development
period, the lower level of analytic smoothing (Lowess=0.1), which identifies the trend of the
regional data, also shows the changing trajectories that occurred during the overall
‘equilibrium’ period that followed the growth years.
The fifteen years of data on the number of rooms in the hotel, motel, and guest house sector
has been separated into these different periods of change. For each trajectory, a trend
analysis was conducted using a time-series linear model. This analysis establishes the
direction and length of each change period. These trajectories were plotted against the

Noreen Breakey Tourism Destination Development
Chapter Five – Destination Case System: A Time-Series Analysis 264
quarterly Sunshine Coast data (Figure 5.10). This process also identifies the change points,
where one trajectory ends, and a new trajectory exhibiting a different type of growth,
commences.
The first two periods, of early gradual growth followed by the development period, are again
clearly evident. The post-development phase has been divided into the three periods of
gradual increase, gradual decline, and subsequent return to gradual growth.
Figure 5.10 Trajectory Changes in the Number of Rooms in Hotels, Motels, and Guest Houses in the
Sunshine Coast Statistical District. (Calculated from: ABS 8635.3 Tourist Accommodation using a Linear Trend Model)
Within the Sunshine Coast region, the change in the capacity offered by the hotel, motel,
and guest house sector is determined by the increased number of rooms offered in each local
area. The growth patterns for each of the three areas differ (Figure 5.11). This data, as with
the number of establishments, is only available for the period from 1988 to 1997. This
however still shows the effects of the tourism development phase, and the subsequent
relative equilibrium.
Yt = 1164.8 + 10.6485*tMAPE = 1.46%
Yt = 378.491 + 62.2956*tMAPE = 4.74%
Yt = 1859.15 + 18.0280*tMAPE = 0.92%
Yt = 3786.2 - 27.8727*tMAPE = 0.76%
Yt = 975.214 + 27.8452*tMAPE = 2.05%

Noreen Breakey Tourism Destination Development
Chapter Five – Destination Case System: A Time-Series Analysis 265
Figure 5.11 Number of Rooms in the Hotels, Motels, and Guest Houses in each of the Three Local Government Areas within the Sunshine Coast Statistical District. (Quarterly: 1988 – 1997) (Source: ABS 8635.3 Tourist Accommodation)
The pattern of the data on the capacity of the hotel, motel, and guest house sector in the
Caloundra area is similar to that for the number of establishments (Figure 5.4). Both exhibit
equilibrium for the late 1980s, followed by slight growth in the early 1990s, a second period
of equilibrium, followed by a decline and subsequent recovery. These parallel patterns are
due to the change in capacity with the introduction of new establishments. Despite this clear
relationship between the variables, there is a difference in the patterns for these variables in
the other local areas. This is due to the opening of large capacity resorts, which did not
occur in the Caloundra area.
In Noosa Shire, the capacity of this accommodation sector fluctuated around 600 rooms. By
the end of the decade, the capacity had not even risen by the increase recorded in the
Caloundra Shire. There was however significant range in capacity over this time. The
introduction of the Sheraton Resort in 1989 saw capacity step up to pass the 700 room mark,
while in the mid 1990s the number of rooms dropped to approximately 450. The second
step up in the number of rooms occurred in 1996, with the addition of two smaller
establishments. The growth in capacity in the Noosa area appeared to occur in steps, but the
decline in the number of rooms occurred more gradually.
The doubling of the number of rooms in the hotel, motel, and guest house sector on the
Sunshine Coast, is therefore primarily due to the large jumps in capacity within the
0
200
400
600
800
1000
1200
1400
1600
Mar88
Qtr
Sep88
Qtr
Mar89
Qtr
Sep89
Qtr
Mar90
Qtr
Sep90
Qtr
Mar91
Qtr
Sep91
Qtr
Mar92
Qtr
Sep92
Qtr
Mar93
Qtr
Sep93
Qtr
Mar94
Qtr
Sep94
Qtr
Mar95
Qtr
Sep95
Qtr
Mar96
Qtr
Sep96
Qtr
Mar97
Qtr
Sep97
Qtr
Quarter
Num
bero
fRoo
ms
MaroochyNoosaCaloundra
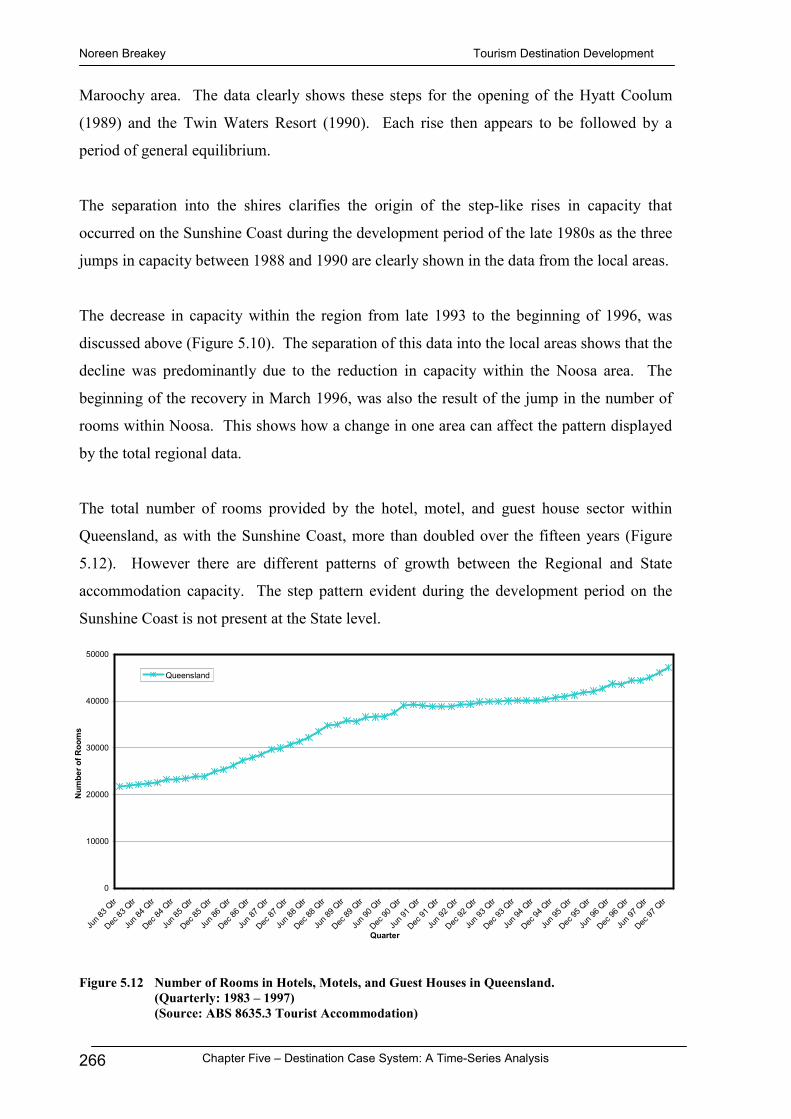
Noreen Breakey Tourism Destination Development
Chapter Five – Destination Case System: A Time-Series Analysis 266
Maroochy area. The data clearly shows these steps for the opening of the Hyatt Coolum
(1989) and the Twin Waters Resort (1990). Each rise then appears to be followed by a
period of general equilibrium.
The separation into the shires clarifies the origin of the step-like rises in capacity that
occurred on the Sunshine Coast during the development period of the late 1980s as the three
jumps in capacity between 1988 and 1990 are clearly shown in the data from the local areas.
The decrease in capacity within the region from late 1993 to the beginning of 1996, was
discussed above (Figure 5.10). The separation of this data into the local areas shows that the
decline was predominantly due to the reduction in capacity within the Noosa area. The
beginning of the recovery in March 1996, was also the result of the jump in the number of
rooms within Noosa. This shows how a change in one area can affect the pattern displayed
by the total regional data.
The total number of rooms provided by the hotel, motel, and guest house sector within
Queensland, as with the Sunshine Coast, more than doubled over the fifteen years (Figure
5.12). However there are different patterns of growth between the Regional and State
accommodation capacity. The step pattern evident during the development period on the
Sunshine Coast is not present at the State level.
Figure 5.12 Number of Rooms in Hotels, Motels, and Guest Houses in Queensland.
(Quarterly: 1983 – 1997) (Source: ABS 8635.3 Tourist Accommodation)
0
10000
20000
30000
40000
50000
Jun 83
Qtr
Dec83
Qtr
Jun 84
Qtr
Dec84
Qtr
Jun 85
Qtr
Dec85
Qtr
Jun 86
Qtr
Dec86
Qtr
Jun 87
Qtr
Dec87
Qtr
Jun 88
Qtr
Dec88
Qtr
Jun 89
Qtr
Dec89
Qtr
Jun 90
Qtr
Dec90
Qtr
Jun 91
Qtr
Dec91
Qtr
Jun 92
Qtr
Dec92
Qtr
Jun 93
Qtr
Dec93
Qtr
Jun 94
Qtr
Dec94
Qtr
Jun 95
Qtr
Dec95
Qtr
Jun 96
Qtr
Dec96
Qtr
Jun 97
Qtr
Dec97
Qtr
Quarter
Num
bero
fRoo
ms
Queensland

Noreen Breakey Tourism Destination Development
Chapter Five – Destination Case System: A Time-Series Analysis 267
Yt = 21440.4 + 251.745*tMAPE = 0.45%
Yt = 17280.5 + 707.116*tMAPE = 1.15%
Yt = 35593.0 + 103.126*tMAPE = 0.50%
Yt = 17413.4 + 490.824*tMAPE = 0.63%
The pattern of growth shown by the data on the number of rooms for Queensland has been
separated into four periods, each with a different growth trajectory (Figure 5.13). These
trajectories can then be compared to the pattern of growth for the capacity of the hotels,
motels, and guest houses on the Sunshine Coast (Figure 5.10).
An important difference in the growth in capacity between the regional and state levels was
the timing of the main period of development. At the state level, the rise in the number of
available rooms occurred primarily between the latter stages of 1985 and the end of 1990,
while growth on the Sunshine Coast did not begin until 1987. The Queensland data
therefore reflects the general tourism expansion period that had began by 1986, as discussed
in Chapter Four. There was a delay before the development boom was evident on the
Sunshine Coast. The growth phases for both the Sunshine Coast and Queensland had ended
by late 1990 due to the recession and the time involved in completing projects already
underway.
Another difference in the patterns of growth at the regional and state levels was the drop in
the capacity on the Sunshine Coast over a two and half year period, beginning early 1994.
At the state level, the number of rooms was still rising, and even began growing at an
increasing rate.
Figure 5.13 Trajectory Changes in the Number of Rooms in Hotels, Motels, and Guest Houses in Queensland. (Calculated from: ABS 8635.3 Tourist Accommodation using a Linear Trend Model)

Noreen Breakey Tourism Destination Development
Chapter Five – Destination Case System: A Time-Series Analysis 268
Although the Queensland pattern of growth is smoother than the step-like growth exhibited
at the Local and Regional levels, the National pattern of growth in the capacity of rooms in
the hotels, motels and guest house sector is even smoother (Figure 5.14). However, the
Australian data still shows the tourism boom years from 1986 to the early 1990s.
Figure 5.14 Number of Rooms in Hotels, Motels, and Guest Houses in Australia. (Quarterly: 1983 – 1997) (Source: ABS 8635.0 Tourist Accommodation)
The data on the total number of rooms in Australia has also been separated into the different
periods of growth (Figure 5.15). This shows the growth in the mid 1980s, the subsequent
accelerated growth, a period of relative equilibrium, and a second increase in capacity.
When compared to the time periods discussed in Chapter Four, the transition into increased
capacity in late 1985 correlates with the beginning of the development boom (1986-1988).
However capacity also continued to rise after the end of the boom years. This accelerated
growth continued through the Recession period (1989-1991), which incorporated the Pilot’s
Dispute, airline deregulation, and the Gulf War. The Recovery Period (1992-1994) saw a
slow down in the increasing capacity in the hotel, motel, and guest house sector nation-wide.
As mentioned in Chapter Four, concern was raised during this period about the limited
amount of hotel accommodation in Australia, especially in some of the main tourist
destinations. The rising occupancies and room rates assisted in plans for new
establishments, which are evident in the rising capacity from mid 1995.
0
20000
40000
60000
80000
100000
120000
140000
160000
180000
200000
Jun 83
Qtr
Dec83
Qtr
Jun 84
Qtr
Dec84
Qtr
Jun 85
Qtr
Dec85
Qtr
Jun 86
Qtr
Dec86
Qtr
Jun 87
Qtr
Dec87
Qtr
Jun 88
Qtr
Dec88
Qtr
Jun 89
Qtr
Dec89
Qtr
Jun 90
Qtr
Dec90
Qtr
Jun 91
Qtr
Dec91
Qtr
Jun 92
Qtr
Dec92
Qtr
Jun 93
Qtr
Dec93
Qtr
Jun 94
Qtr
Dec94
Qtr
Jun 95
Qtr
Dec95
Qtr
Jun 96
Qtr
Dec96
Qtr
Jun 97
Qtr
Dec97
Qtr
Quarter
Num
bero
fRoo
ms
Australia

Noreen Breakey Tourism Destination Development
Chapter Five – Destination Case System: A Time-Series Analysis 269
Figure 5.15 Trajectory Changes in the Number of Rooms in Hotels, Motels, and Guest Houses in Australia. (Calculated from: ABS 8635.3 Tourist Accommodation using a Linear Trend Model)
Comparing the patterns for Australia and Queensland shows four similar growth trajectories,
although the time frames differ (Figure 5.13 and Figure 5.15). Both have a change point in
September 1985, for the start of the boom years. This shows that development of the
Sunshine Coast lagged behind both the state and national trends, as the development
trajectory for the Sunshine Coast did not begin until March the following year. At the end
of 1990 the increasing capacity at the national level continued its upward growth, while
capacity reached a plateau for Queensland. This shows that Australia and Queensland began
the growth period together, while Queensland and the Sunshine Coast began their phases of
relative equilibrium together. It is interesting to note that this change point for Queensland
and the Sunshine Coast occurred at the same time as the change from the Liberal/National
State Government to the first Labor Government for over two decades.
In summary, at the regional level the pattern of growth in hotel, motel, and guest house
rooms incorporated five different growth trajectories. This was smoothed out at the state
and national levels, as each experienced only three types of trajectories during the fifteen
years. The smoothing of the growth patterns at the higher system levels illustrates the
Research Issue of data smoothing at aggregate levels.
Yt = 99991.9 + 1000.33*tMAPE = 0.35%
Yt = 85702.2 + 2242.43*tMAPE = 0.51%
Yt = 138884 + 639.751*tMAPE = 0.88%
Yt = 107491 + 1218.04*tMAPE = 0.39%

Noreen Breakey Tourism Destination Development
Chapter Five – Destination Case System: A Time-Series Analysis 270
5.3.2 Population Growth
There was a threefold increase in the population of the Sunshine Coast region during the last
twenty years of the 20th Century. As mentioned in Chapter Four this rapid increase is a
significant defining aspect of development in the region. There was continual growth in the
regional population from 1976 into the 21st Century (Figure 5.16), with the data displaying a
trajectory that gradually increases over the period. The population within the destination is
therefore experiencing a period of ‘positive evolution’, as described by the Multi-Trajectory
Model of Tourism Destination Change.
Figure 5.16 Population of the Sunshine Coast Region. (1976 – 2000)
(Source: ABS 3212.3 Estimated Regional Population)
The population growth of the Sunshine Coast region is the culmination of the increase in the
population of the three Local Government Areas: Caloundra, Maroochy and Noosa (Figure
5.17). The overall trend for each has also been ‘positive evolution’. However, the data
shows that the local areas have experienced different levels of growth over the twenty-five
years.
0
25000
50000
75000
100000
125000
150000
175000
200000
225000
250000
1976 1977 1978 1979 1980 1981 1982 1983 1984 1985 1986 1987 1988 1989 1990 1991 1992 1993 1994 1995 1996 1997 1998 1999 2000 2001
Year
Popu
latio
n
Sunshine Coast Statistical District

Noreen Breakey Tourism Destination Development
Chapter Five – Destination Case System: A Time-Series Analysis 271
Figure 5.17 Population of Caloundra City, Maroochy Shire, and Noosa Shire. (1976 – 2000)
(Source: ABS 3212.3 Estimated Regional Population)
The increasing growth in the population of the Maroochy and Noosa Shires since the late
1980s is offset by the constant growth within Caloundra City, resulting in a less obvious
change in the regional population data pattern. Since 1990, the Maroochy Shire has seen the
greatest absolute increase in population, growing from just over 70 thousand to almost 130
thousand people by 2001. However, it has been the Shire of Noosa that has grown by a
larger percentage, 70 percent over the decade.
To clearly illustrate this difference in the growth patterns, as well as to display the effects of
smoothing when higher levels of the tourism system are analysed, the patterns displayed by
the yearly growth rates are analysed.
The population pattern for the Sunshine Coast appeared to illustrate relatively steady growth
(Figure 5.16). However, the pattern actually incorporated yearly population changes of
between three and eleven percent (Figure 5.18). This demonstrates that despite the
continual ‘positive evolution’ increase in population, the growth rate has changed over time.
0
10000
20000
30000
40000
50000
60000
70000
80000
90000
100000
110000
120000
130000
1976 1977 1978 1979 1980 1981 1982 1983 1984 1985 1986 1987 1988 1989 1990 1991 1992 1993 1994 1995 1996 1997 1998 1999 2000 2001
Year
Popu
latio
n
Maroochy Shire
Caloundra City
Noosa Shire

Noreen Breakey Tourism Destination Development
Chapter Five – Destination Case System: A Time-Series Analysis 272
Figure 5.18 Percentage Change from the Previous Year in the Population of the Sunshine Coast Region, Caloundra City, Maroochy Shire, and Noosa Shire. (1977-2000)
(Calculated From: ABS 3212.3 Estimated Regional Population)
There were even greater growth rate fluctuations occurring in the three local areas (Figure
5.18). The three areas seem to generally follow the same regional pattern until the early
1990s when the Noosa Shire population growth ceases to change in line with the region.
While the yearly growth rate increased in 1991 for Maroochy and Caloundra, Noosa grew at
a lower rate. The Shire instead experienced a greater rise in population growth for 1994 and
1995 than the remainder of the region. In the last year, the Noosa Shire population growth
is again at odds with the regional increase as the growth rate lowers. The recent separation
of Noosa Shire from the regional pattern of population growth coincides with the population
cap introduced into the town plan in late 1997, as discussed in Chapter Four.
Comparing the growth rate of the three local areas to the aggregated regional growth rate
demonstrates how the macro picture is the result of changes in the areas, and yet is not
representative of them. The three peaks in the regional growth rate (Figure 5.18) occurred
in 1981, 1989, and 1991. When compared to the local area growth rate changes, it can be
seen that in 1981, Caloundra experienced the highest growth rate, while in 1989, Noosa’s
percentage increase was highest, and in 1991, the Maroochy Shire topped the growth rate.
This can also be seen in the total population of the local areas (Figure 5.17), where the
population of Noosa grew significantly in the late 1980s where as the greater population
growth in the Maroochy Shire occurred in the early 1990s. The regional population growth
0
2
4
6
8
10
12
14
1977 1978 1979 1980 1981 1982 1983 1984 1985 1986 1987 1988 1989 1990 1991 1992 1993 1994 1995 1996 1997 1998 1999 2000 2001Year
Perc
enta
geC
hang
ein
Popu
latio
n
MaroochyCaloundraNoosaSunshine Coast

Noreen Breakey Tourism Destination Development
Chapter Five – Destination Case System: A Time-Series Analysis 273
thus provides a useful indicator of the overall development of the region. However the local
level data illustrates where the centre(s) of the growth were and where one area may have
experienced a different pattern of growth to the remainder of the region.
The yearly population growth rate of the Sunshine Coast is noticeably higher and more
varied than the State and National population increases (Figure 5.19). Unlike the dramatic
growth rate of the Sunshine Coast region, the Queensland population had only been
increasing by between approximately 1.5 and 3.5 percent per year. This is still higher than
the total Australian population, which had only been growing between around 1 and 2
percent per year. This highlights the effect of the northward migration trend, as Queensland,
and in particular the Sunshine Coast, record greater growth than the National trend, as
determined by the net effects of the birth and death rates, and migration.
Figure 5.19 Percentage Change from the Previous Year in the Population of the Sunshine Coast Region, Queensland, and Australia. (1977-2000)
(Calculated From: ABS 3212.3 & 3212.0 Estimated Regional Population)
The patterns generated by the population growth at the local, regional, state, and national
levels illustrates the effects of smoothing as the analysis progresses up the levels of the case
system. Despite the overall smoothing, some of the peaks in the population growth are
evident at the regional, state, and national levels, such as the rise at the beginning and end of
the 1980s. All three levels show a jump in the population for 1981 and again in 1989,
although the extent of the growth differs for each. However, the Sunshine Coast
experienced another peak in population growth in 1991. This was in contrast to both the
State and National trends.
0
2
4
6
8
10
12
14
1977 1978 1979 1980 1981 1982 1983 1984 1985 1986 1987 1988 1989 1990 1991 1992 1993 1994 1995 1996 1997 1998 1999 2000 2001
Year
Perc
enta
geC
hang
ein
Popu
latio
n
Sunshine Coast Statistical DistrictQueenslandAustralia

Noreen Breakey Tourism Destination Development
Chapter Five – Destination Case System: A Time-Series Analysis 274
5.3.3 Addressing Research Issue One - Data Aggregation
The analysis of the growth trends of the different variables, hotel, motel, and guest house
establishments and rooms, and population, at the various levels of the case system has
demonstrated that an aggregate measure of change does provide an overview of the total
area described. However it does not illustrate the underlying change and complexity that
occurs within a tourist destination, or the variation that may exist within sub-areas. In
particular the centres of growth in the lower areas cannot be understood from higher level
data. This supports the first Research Issue of the Multi-Trajectory Model of Tourism
Destination Change.
5.4 Research Issue Two - Visitor Numbers
The second Research Issue states that: tourism change cannot be explained by total
yearly visitor numbers alone. Total visitor numbers is an aggregation of all types of
visitors. As an overall measure of tourism change, this measurement fails to illustrate the
underlying change, complexity, and variation that may exist within sub-classifications, and
the impact of change in other variables.
This second research issue has three sub-issues (Figure 5.20). The first Sub-Issue considers
that the total number of visitors is not representative of all the sub-categories and therefore
does not show the underlying variation within these sub-categories. This Sub-Issue further
supports the first Research Issue, as total visitor numbers is an aggregation of the sub-
categories.
The second Sub-Issue considers the use of yearly visitor numbers. The yearly measurement
obscures the seasonal variation of visitation that has significant impact on tourism
destinations, including the economic viability of tourism and related businesses.
The third Sub-Issue proposes that other variables need to be considered in addition to
visitation numbers to understand the changing tourism trends in a destination. The visitation
pattern may not be the only change pattern of a destination, as other variables may display
different patterns.

Noreen Breakey Tourism Destination Development
Chapter Five – Destination Case System: A Time-Series Analysis 275
Figure 5.20 Sub-Issues of Research Issue Two. (reproduced from Figure 5.1)
5.4.1 Sub-Issue One - Visitor Sub-Categories
The first Sub-Issue states that: the pattern of total visitor numbers does not represent the
underlying variation of sub-categories. Total visitor numbers or visitor nights are an
aggregation of all types of visitors. As an overall measure of tourism change, this
measurement fails to illustrate the underlying variation that may exist within sub-
classifications. This overall measurement can be broken down in a variety of ways, such as
the origin of the visitors, type of accommodation utilised, reason for travel, or product
markets.
This first Sub-Issue will therefore be addressed through a discussion of the various patterns
of change exhibited by sub-categories of the total visitation received at different levels of the
tourism system. As determined in Chapter Four, four visitation sub-category variables were
selected: visitors to the Sunshine Coast by origin, by accommodation used, and by stage of
life; and visitors to Australia by country of origin. Wherever possible, multiple sources of
data are utilised.
Sub-IssueOne
Visitor SubCategories
Research Issue Two
Change not Explainedby Visitor Numbers
Sub-IssueTwo
Seasonality
Sub-IssueThree
Other Variables

Noreen Breakey Tourism Destination Development
Chapter Five – Destination Case System: A Time-Series Analysis 276
5.4.1.1 Visitors to the Sunshine Coast by Origin
Regional data on total yearly visitor nights are sourced from the Queensland Office of
Economic and Statistical Research (OESR). The Sunshine Coast data shows that the
absolute number of visitor nights in the region doubled between 1985 and 1999 (Figure
5.21). This growth was sporadic with years of increasing numbers of visitor nights followed
by decline for one or two years. The doubling of visitor nights during this fifteen-year
period illustrates an era of fluctuating growth, with the overall trend of a gradually
increasing trajectory.
Figure 5.21 Number of Visitor Nights on the Sunshine Coast.
(1985 – 1999) (Source: OESR – Visitor Expenditure in Regional Queensland)
The number of visitor nights in the region during 1988, with the impact of Expo 88, appears
to continue the growth trend from the previous few years. The decline for 1989 was not
unexpected, as discussed in Chapter Four. From 1993, growth in visitor nights has been
continual with only 1998 experiencing a decline from the previous year. This reduction for
1998 is in parallel with the decline in international visitors to Australia due to the ongoing
impacts of the Asian Crisis that occurred in late 1997.
However, within this overall ‘growth’ there are components that exhibit very different
patterns of change. The National Bureau of Tourism Research (BTR) data separates the
yearly visitor nights in the Sunshine Coast into the origin of the visitors (Figure 5.22). This
shows the number of nights spent in the destination by Queenslanders, those from interstate,
0
2 0 0 0
4 0 0 0
6 0 0 0
8 0 0 0
1 0 0 0 0
1 2 0 0 0
1 4 0 0 0
1 9 8 5 1 9 8 6 1 9 8 7 1 9 8 8 1 9 8 9 1 9 9 0 1 9 9 1 1 9 9 2 1 9 9 3 1 9 9 4 1 9 9 5 1 9 9 6 1 9 9 7 1 9 9 8 1 9 9 9Y e a r
Visi
torN
ight
s('0
00)
S u n s h in e C o a s t

Noreen Breakey Tourism Destination Development
Chapter Five – Destination Case System: A Time-Series Analysis 277
and those from overseas. The changes in visitor nights seen in the total regional data
(Figure 5.21) can be understood in greater detail with the nights separated into the origin of
the visitors.
Figure 5.22 Number of Visitor Nights on the Sunshine Coast by Origin. (1985 – 1999) (Source: BTR – Domestic Tourism Monitor and International Visitor Survey)
The growth in total visitor nights from 1985 to 1986 was predominantly an increase in
interstate visitation to the Sunshine Coast, with the rise for the following year being
primarily an increase in Queenslanders. The number of intrastate visitor nights spent in the
region did not reach this 1987 level again until 1995. It is noteworthy that the number of
Queensland visitors to the Sunshine Coast for 1988 was actually a decrease from the
previous year. Therefore the boost received by tourism providers from Expo 88 was not due
to an increase in Queensland visitor nights.
Against the general visitation trend, the number of international visitors declined in 1990.
This may have been the result of the impact of the Pilots Dispute on the planning of
international travellers who utilise air transport extensively.
The data illustrates that the decrease in visitor nights in 1992 occurred for all visitor origins.
From 1993, visitor nights from all sectors continued to grow with the small number of
international visitors continuing a fluctuating growth trajectory, even with the Asian Crisis.
0
5 0 0
1 0 0 0
1 5 0 0
2 0 0 0
2 5 0 0
3 0 0 0
3 5 0 0
4 0 0 0
4 5 0 0
5 0 0 0
5 5 0 0
6 0 0 0
1 9 8 5 1 9 8 6 1 9 8 7 1 9 8 8 1 9 8 9 1 9 9 0 1 9 9 1 1 9 9 2 1 9 9 3 1 9 9 4 1 9 9 5 1 9 9 6 1 9 9 7 1 9 9 8 1 9 9 9Y e a r
Visi
torN
ight
s('0
00)
In tr a s ta teIn te rs ta teIn te rn a t io n a l

Noreen Breakey Tourism Destination Development
Chapter Five – Destination Case System: A Time-Series Analysis 278
In parallel to visitor nights, data on the number of visitors for each financial year is provided
by Tourism Queensland (TQ, previously QTTC - Queensland Tourist and Travel
Corporation). This visitation data is broken down into the origin of these visitors (Figure
5.23). Certain characteristics of this series are similar to the data on visitor nights discussed
above, including the increase for 1988 for interstate and international visitors and the decline
for intrastate visitation. However there are also numerous differences between the two data
series. This is partially due to the dependence of visitor nights on the length of stay, which
is not relevant for the number of visitors (discussed further in Section 5.4.3.1).
Additionally, the TQ data on visitor numbers incorporates only those who stayed in
commercial accommodation.
Figure 5.23 Number of Visitors to the Sunshine Coast by Origin.
(1983/4 – 1996/7) (Source: QTTC/TQ – Major Survey Research Programme and Queensland Visitor Survey)
The fourteen-year data series on visitors to the Sunshine Coast shows the general increase in
the number of visitors from each of the three origin categories. The number of visitors from
Queensland fluctuated between 2.12 million and 3.3 million over the fourteen year period.
By 1996/97 the intrastate visitation was 21 percent greater than the 1983/84 level. Interstate
visitor numbers rose in the years leading up to 1988/89, before dropping in 1989/90, and
then increasing again over the second half of this period. The overall rise in interstate
visitation over the fourteen years was almost a 150 percent increase on the 1983/84 level.
While representing only a small percentage of total visitors to the Sunshine Coast the
number of international visitors tripled over the fourteen years, with a peak for Expo 88.
0
1 0 0 0
2 0 0 0
3 0 0 0
4 0 0 0
5 0 0 0
6 0 0 0
7 0 0 0
1 9 8 3 -1 9 8 4
1 9 8 4 -1 9 8 5
1 9 8 5 -1 9 8 6
1 9 8 6 -1 9 8 7
1 9 8 7 -1 9 8 8
1 9 8 8 -1 9 8 9
1 9 8 9 -1 9 9 0
1 9 9 0 -1 9 9 1
1 9 9 1 -1 9 9 2
1 9 9 2 -1 9 9 3
1 9 9 3 -1 9 9 4
1 9 9 4 -1 9 9 5
1 9 9 5 -1 9 9 6
1 9 9 6 -1 9 9 7
Y e a r
Visi
tors
('000
)
T o ta lIn t ra s ta teIn te rs ta teIn te rn a t io n a l

Noreen Breakey Tourism Destination Development
Chapter Five – Destination Case System: A Time-Series Analysis 279
Interestingly the growth years of one category often appear to be the lower visitation years
for another. It is therefore clear that the total number of visitors conceals these underlying
irregularities.
5.4.1.2 Visitors to the Sunshine Coast by Accommodation Used
The number of visitor nights can be further separated into the type of accommodation
utilised for each of the three origin categories: hotel/motel, caravan park/camping, rented
house/flat, staying with friends or relatives, or staying in their own property. This provides
additional details regarding the complexity that occurs beneath the overall measure of
visitation.
This is an important component of visitation as it illustrates the trend in the type of
accommodation used. This can be important in establishing whether there has been a
change in the need for certain forms of accommodation.
The majority of nights spent by Queensland visitors on the Sunshine Coast occurred at the
visitor’s friends or relatives place (Figure 5.24). Use of this type of accommodation grew
significantly in 1991, and since then the pattern of change generally matches the overall
pattern of the number of intrastate visitor nights (Figure 5.22), exhibiting a decline over the
next two years, followed by increasing nights.
Figure 5.24 Type of Accommodation Used by Intrastate Visitors to the Sunshine Coast. (1985 – 1996) (Source: BTR – Domestic Tourism Monitor)
0
2 0 0
4 0 0
6 0 0
8 0 0
1 0 0 0
1 2 0 0
1 4 0 0
1 6 0 0
1 8 0 0
2 0 0 0
2 2 0 0
1 9 8 5 1 9 8 6 1 9 8 7 1 9 8 8 1 9 8 9 1 9 9 0 1 9 9 1 1 9 9 2 1 9 9 3 1 9 9 4 1 9 9 5 1 9 9 6Y e a r
Num
bero
fNig
hts
('000
)
In tr a s ta te - F r ie n d s /R e la t iv e s P la c e
In tra s ta te - R e n te d H o u s e /F la t
In tr a s ta te - C a m p in g /C a ra v a n P a rk
In tra s ta te - O w n H o u s e /F la t
In tr a s ta te - H o te l/M o te l

Noreen Breakey Tourism Destination Development
Chapter Five – Destination Case System: A Time-Series Analysis 280
The second most utilised form of accommodation for Queensland visitors was the rented
house or flat. In 1987, the number of visitor nights for this category almost matched the
number spent with friends and relatives. In the same year the number of nights visitors
spent in their own property also increased dramatically. As a result of the changes to these
two types of accommodation, and a smaller rise in the number of nights spent in hotels and
motels, the peak in total intrastate visitors nights can be explained (Figure 5.22). The
number of nights spent in these three types of accommodation fell for 1988, while the
number of nights spent camping or in caravan parks jumped.
The drop in total intrastate visitors for 1989 saw a reduction in the number of nights spent in
all five accommodation categories. The rise in 1990 in the nights spent in the three less used
forms of accommodation: the hotel sector, caravans and camping, and use of their own
home, resulted in the peak in the total visitor nights for that year.
As mentioned above, the pattern displayed by the total number of intrastate visitor nights
from then until 1996 is generally reflected by the pattern of the number using their friends or
relatives place. However, it is worth noting that there was also a dramatic increase in the
nights spent in rented accommodation for 1994.
Additionally the number of nights spent in the hotel sector has increased significantly over
the eleven year period when compared to the other four forms of accommodation. In 1985
the least number of intrastate visitor nights were provided by the hotel sector. By 1996 the
nights in this sector were secondly only to the visiting friends and relatives category. This
rise initially occurred in 1990, by which time the Hyatt Regency Coolum had been open a
year and the Sheraton Noosa was just opening its doors.
Despite the overall decrease in Sunshine Coast intrastate visitor nights during 1988, there
was an increase in the number staying in caravan parks or camping, and those staying with
friends and relatives. The decrease in the nights occurred in the rented accommodation, the
hotel sector, and nights spent by visitors in their own property.
Similar to the intrastate visitor nights, the bulk of interstate nights are spent at a friends or
relatives place (Figure 5.25). This form of accommodation therefore explains the majority
of the total interstate visitor nights (Figure 5.22). The patterns of change for these two

Noreen Breakey Tourism Destination Development
Chapter Five – Destination Case System: A Time-Series Analysis 281
variables generally match, with the exception of 1991. The growth in interstate visitor
nights for this year was due to the growth in the number of nights spent in the hotel sector,
and in caravan parks or camping.
Figure 5.25 Type of Accommodation Used by Interstate Visitors to the Sunshine Coast.
(1985 – 1996) (Source: BTR – Domestic Tourism Monitor)
In both 1985 and 1996 thirty-five percent of the interstate visitor nights were spent in a
friends or relatives place. The rising categories were the hotel sector and rented
accommodation, which increased from 16 percent and 18 percent of the total interstate
nights, to 23 percent and 21 percent respectively, over the twelve years.
The increase in interstate visitor nights in 1988 saw a rise in the number staying in caravan
parks or camping, and those using their own properties. There was a decline in the number
staying in hotels or rented properties, and a small decrease in those staying with friends and
relatives.
As with both intrastate and interstate visitor nights, the majority of international visitor
nights on the Sunshine Coast are spent at a friend or relatives’ place (Figure 5.26). The
pattern of change for this form of accommodation generally matches the pattern of the
number of international visitor nights (Figure 5.22), with the exception of 1994. In this year
the nights spent at a friends or relatives declined and the increase in total overseas visitors
was due to the jump in the nights spent in rented accommodation. The significant rise in the
0
2 0 0
4 0 0
6 0 0
8 0 0
1 0 0 0
1 2 0 0
1 4 0 0
1 6 0 0
1 8 0 0
2 0 0 0
2 2 0 0
1 9 8 5 1 9 8 6 1 9 8 7 1 9 8 8 1 9 8 9 1 9 9 0 1 9 9 1 1 9 9 2 1 9 9 3 1 9 9 4 1 9 9 5 1 9 9 6Y e a r
Num
bero
fNig
hts
('000
)
In te r s ta te - F r ie n d s /R e la t iv e s P la c e
In te r s ta te - R e n te d H o u s e /F la t
In te r s ta te - C a m p in g /C a ra v a n P a r k
In te r s ta te - O w n H o u s e /F la t
In te r s ta te - H o te l/M o te l
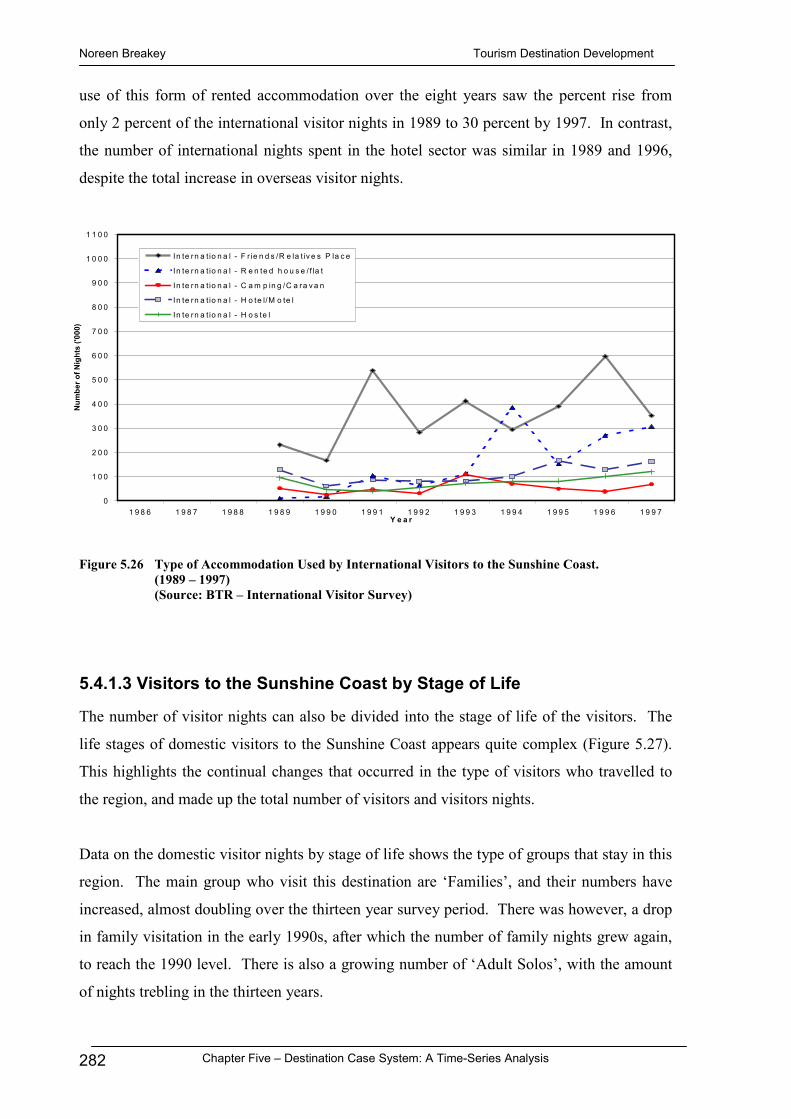
Noreen Breakey Tourism Destination Development
Chapter Five – Destination Case System: A Time-Series Analysis 282
use of this form of rented accommodation over the eight years saw the percent rise from
only 2 percent of the international visitor nights in 1989 to 30 percent by 1997. In contrast,
the number of international nights spent in the hotel sector was similar in 1989 and 1996,
despite the total increase in overseas visitor nights.
Figure 5.26 Type of Accommodation Used by International Visitors to the Sunshine Coast. (1989 – 1997) (Source: BTR – International Visitor Survey)
5.4.1.3 Visitors to the Sunshine Coast by Stage of Life
The number of visitor nights can also be divided into the stage of life of the visitors. The
life stages of domestic visitors to the Sunshine Coast appears quite complex (Figure 5.27).
This highlights the continual changes that occurred in the type of visitors who travelled to
the region, and made up the total number of visitors and visitors nights.
Data on the domestic visitor nights by stage of life shows the type of groups that stay in this
region. The main group who visit this destination are ‘Families’, and their numbers have
increased, almost doubling over the thirteen year survey period. There was however, a drop
in family visitation in the early 1990s, after which the number of family nights grew again,
to reach the 1990 level. There is also a growing number of ‘Adult Solos’, with the amount
of nights trebling in the thirteen years.
0
1 0 0
2 0 0
3 0 0
4 0 0
5 0 0
6 0 0
7 0 0
8 0 0
9 0 0
1 0 0 0
1 1 0 0
1 9 8 6 1 9 8 7 1 9 8 8 1 9 8 9 1 9 9 0 1 9 9 1 1 9 9 2 1 9 9 3 1 9 9 4 1 9 9 5 1 9 9 6 1 9 9 7Y e a r
Num
bero
fNig
hts
('000
)
In te rn a t io n a l - F r ie n d s /R e la t iv e s P la c e
In te rn a t io n a l - R e n te d h o u s e / f la t
In te rn a t io n a l - C a m p in g /C a ra v a n
In te rn a t io n a l - H o te l/M o te l
In te rn a t io n a l - H o s te l

Noreen Breakey Tourism Destination Development
Chapter Five – Destination Case System: A Time-Series Analysis 283
Figure 5.27 Sunshine Coast Domestic Visitor Nights by Stage of Life Categories. (1984/85 – 1996/97) (Source: BTR – Domestic Tourism Monitor)
The changing patterns in the data on the stage of life of domestic visitors to the Sunshine
Coast shows the changes that underlie a measurement of domestic visitor nights spent in the
destination. These fluctuations result in the overall pattern but each sub-category
contributes a different and dynamic component.
5.4.1.4 International Visitors to Australia by Origin
The change underlying total visitor numbers is also evident at higher system levels. For
example, the total number of international visitors to Australia can be divided into visitation
from a number of regions, each of which comprises numerous countries. As shown in
Chapter Four, levels of visitation from various countries is determined by a multitude of
factors including the state of their economy, encouragement or discouragement to travel
overseas by their Government, the level of promotion conducted by Australia, airfare and
package prices, the exchange rate for the Australian dollar, and other competing
destinations. The different combinations of these, and other factors results in a complex
array of visitation patterns for each region and country.
The total number of short-term visitor arrivals to Australia increased dramatically over the
twenty years from 1980 to 1999 (Figure 5.28). From 1980 to 1983, visitor numbers were in
an ‘equilibrium’ phase, with numbers fluctuating between 900 and 950 thousand visitors.
0
5 0 0
1 0 0 0
1 5 0 0
2 0 0 0
2 5 0 0
3 0 0 0
3 5 0 0
4 0 0 0
1 9 8 4 /8 5 1 9 8 5 /8 6 1 9 8 6 /8 7 1 9 8 7 /8 8 1 9 8 8 /8 9 1 9 8 9 /9 0 1 9 9 0 /9 1 1 9 9 1 /9 2 1 9 9 2 /9 3 1 9 9 3 /9 4 1 9 9 4 /9 5 1 9 9 5 /9 6 1 9 9 6 /9 7Y e a r
Num
bero
fVis
itorN
ight
s(0
00's
)F a m il ie sO ld e r C o u p le sM a r r ie d C o u p le sA d u lt S o lo sD e p e n d e n t C h ild re nO ld e r S o lo s

Noreen Breakey Tourism Destination Development
Chapter Five – Destination Case System: A Time-Series Analysis 284
From 1984, there was generally continual growth, with the exception of major events. The
tourism boom years, which incorporated the build up to and holding of Expo 88, is
highlighted by growth trajectory for the 1986 to 1988 period. The following year
incorporated the post-Expo lull in visitors, combined with the Pilot’s Dispute, culminating
in a drop in international visitors. After this fall for 1989, overseas visitation began a slow
rise, which continued until 1997, the year of the Asian Crisis. The subsequent drop in
visitors affected the latter stages of 1997, resulting in lower growth for that year, as well as
for 1998.
Figure 5.28 Total Number of Short-Term Overseas Arrivals to Australia.
(1980 – 2000) (Source: ABS 3401.0 Overseas Arrivals and Departures)
This overall growth in international visitation, while highlighting the significant events that
affected Australian tourism, does not show the fluctuations in the numbers from each region.
The total visitation per year is a combination of the number of visitors from each region. An
overall increase may in fact be a combination of a dramatic rise from one region, a small rise
from a second, no rise for a third, and a drop in the numbers from a fourth.
The total overseas visitation to Australia can be separated into the number of visitors from
the main regions of the world (Figure 5.29). This illustrates the different growth patterns for
each region, and shows the change from the main markets of Oceania and Europe in 1980 to
the Asian markets in the 1990s.
0
500,000
1,000,000
1,500,000
2,000,000
2,500,000
3,000,000
3,500,000
4,000,000
4,500,000
1980 1981 1982 1983 1984 1985 1986 1987 1988 1989 1990 1991 1992 1993 1994 1995 1996 1997 1998 1999Year
Num
bero
fVis
itors
Overseas Visitors

Noreen Breakey Tourism Destination Development
Chapter Five – Destination Case System: A Time-Series Analysis 285
1980 19
83 1986 19
89 1992 19
95 1998
Total Africa andOthers
Total AmericaTotal Oceania
Total EuropeTotal Asia
0200,000400,000600,000800,000
1,000,0001,200,0001,400,0001,600,0001,800,0002,000,0002,200,000
Year
Num
bero
fA
rriv
als
Figure 5.29 Number of Short-Term Overseas Arrivals to Australia by Generating Region. (1980 – 1999) (Source: ABS 3401.0 Overseas Arrivals and Departures)
Total international visitation appeared relatively constant for the early years of the 1980s.
This was in fact the result of a decline in visitors from the Oceania region, offset by slow
growth from the other regions. The growth period from 1986, occurred for the four main
generating regions, although the growth in American visitors was slowing by 1988. The
overall drop in visitor numbers for 1989 did not represent the visitation from all the regions,
with increased numbers arriving from Asia and Europe despite the Pilot’s Dispute. The
increase in international arrivals during the 1990s was, in the main, due to the rapid growth
of the Asian economies. In addition the drop in numbers for 1998 was specifically related to
the effects of the Asian Crisis, with visitation continuing to increase from all the other
regions.
The pattern presented by data on the total number of international visitors to Australia shows
the overall growth and the significant events (Figure 5.28). This data has been separated
into the main regions of the world, illustrating the different patterns of these sub-variables
(Figure 5.29). The visitation levels of these regions can be further broken down into their
component countries. The Asian region incorporates a number of significant tourist
generators. The number of visitors from these countries has increased considerably.
However, the extent and the periods of growth differ.

Noreen Breakey Tourism Destination Development
Chapter Five – Destination Case System: A Time-Series Analysis 286
As highlighted in Chapter Four, Japan was the first Asian country to generate large numbers
of visitors to Australia. This growth, during the 1980s, surpassed all other countries, with
Japan becoming the largest national source of international visitors to Australia by 1988.
Throughout the 1980s, the total number of visitors to Australia from Asian countries
increased in accordance with the rising number of Japanese travellers (Figure 5.30). This
pattern changed in the early 1990s, with the dramatically increasing number of total Asian
visitors growing well above the growth of the Japanese market. In 1993, more visitors
arrived from ‘Other Asia’ than from Japan, although Japan remained the largest singe source
of visitors.
Figure 5.30 Number of Short-Term Overseas Arrivals to Australia from Japan and the Rest of Asia.
(1980 – 1997) (Source: ABS 3401.0 Overseas Arrivals and Departures)
As discussed in Chapter Four, the high growth in visitation from the ‘Rest of Asia’ during
the 1990s was not evenly spread across the generating countries (Figure 5.31). All Asian
markets then slowed for 1997.
The total number of short-term international visitors to Australia can therefore be seen to
incorporate the rise and fall of visitation from the various countries that make up the regions
of the world. Changes in the direction of growth may only be due to certain countries or a
region. It is therefore important to view the visitation trends for the smaller categories in
order to understand the overall pattern.
O th e r A s ia
J a p a n
0
2 5 0
5 0 0
7 5 0
1 0 0 0
1 2 5 0
1 5 0 0
1 7 5 0
2 0 0 0
2 2 5 0
1 9 8 0 1 9 8 1 1 9 8 2 1 9 8 3 1 9 8 4 1 9 8 5 1 9 8 6 1 9 8 7 1 9 8 8 1 9 8 9 1 9 9 0 1 9 9 1 1 9 9 2 1 9 9 3 1 9 9 4 1 9 9 5 1 9 9 6 1 9 9 7Y e a r
Num
bero
fOve
rsea
sA
rriv
als
(000
's)

Noreen Breakey Tourism Destination Development
Chapter Five – Destination Case System: A Time-Series Analysis 287
1980
1982
1984
1986
1988
1990
1992
1994
1996
ThailandMalaysia
Hong KongTaiwan
IndonesiaKorea
Singapore
0
50
100
150
200
250
Year
Num
bero
fA
rriv
als
(000
's)
Figure 5.31 Number of Short-Term Overseas Arrivals to Australia from Asian Source Countries (excluding Japan). (1980 – 1997) (Source: ABS 3401.0 Overseas Arrivals and Departures)
5.4.1.5 Addressing Research Sub-Issue One - Visitor Numbers
An overall measurement of visitation does not clarify the intrinsic complexity of sub-
components, despite comprising the total interaction of all these changing components.
There are times however, when the overall pattern of visitation may generally match the
pattern of one or more of the underlying variables. This may be due to the changes in the
most common category, or due to the changes in other variable categories cancelling each
other out. However, in the examples above, the total number of visitors does not show the
underlying variation of all the sub-categories, thereby supporting the first Research Sub-
Issue.
In addition, this Sub-Issue is obviously another variation of the first Research Issue, as the
aggregation of variables, whether they are geographical areas or visitor numbers, still results
in the smoothing effect. However, an important distinction relevant for this Sub-Issue, is
that the underlying change has occurred in the same geographical level, and is therefore
important in understanding visitation.

Noreen Breakey Tourism Destination Development
Chapter Five – Destination Case System: A Time-Series Analysis 288
5.4.2 Sub-Issue Two - Seasonality
The second Sub-Issue considers the use of yearly visitor numbers. Yearly measurement
obscures the seasonal variation of visitation that has significant impact on tourism
destinations.
This Research Sub-Issue will be addressed through an examination of the patterns of change
displayed by seasonal visitation variables. As determined in Chapter Four, these variables
are quarterly visitor numbers by origin; and monthly occupancy levels in the hotel, motel,
and guest house sector, and the caravan park sector.
5.4.2.1 Visitor Numbers to the Sunshine Coast by Quarter
The data on annual visitation to the Sunshine Coast by the origin of the visitor displays clear
and separate growth lines for each category (Figure 5.23). However the quarterly data
introduces the seasonality effect and demonstrates the complexity within this variable
(Figure 5.32).
Figure 5.32 Number of Visitors to the Sunshine Coast by Origin: Total Visitors, Intrastate Visitors, Interstate Visitors, and International Visitors. (Quarterly: September 1983 – September 1994) (Source: QTTC/TQ – Major Survey Research Programme and Queensland Visitor Survey)
0
5 0
1 0 0
1 5 0
2 0 0
2 5 0
3 0 0
Sep-83
Jan-8
4
May-84
Sep-84
Jan-8
5
May-85
Sep-85
Jan-8
6
May-86
Sep-86
Jan-8
7
May-87
Sep-87
Jan-8
8
May-88
Sep-88
Jan-8
9
May-89
Sep-89
Jan-9
0
May-90
Sep-90
Jan-9
1
May-91
Sep-91
Jan-9
2
May-92
Sep-92
Jan-9
3
May-93
Q u a r te r
Visi
tors
('000
)
T o ta l
In tra s ta te
In te rs ta te
In te rn a t io n a l

Noreen Breakey Tourism Destination Development
Chapter Five – Destination Case System: A Time-Series Analysis 289
On a yearly basis the total number of visitors to this destination from within Queensland is
generally higher than the number from interstate. This relationship changes when the
quarterly data is analysed, as at different times during this eleven year period the number of
interstate visitors is higher than the number visiting from within Queensland. From 1983 to
the end of 1989, the greater number of Australian visitors to the Sunshine Coast fluctuated
between those from Queensland and those from interstate. From 1990 the number of
intrastate visitors remained higher than the number from interstate for each quarter, despite
the different visitation patterns. The smaller number of visitors from overseas had a limited
impact on the total quarterly visitation pattern.
The different domestic visitation patterns of intrastate and interstate visitor numbers
becomes clearer when separated from the international and total visitor numbers (Figure
5.33). The peaks in the two categories occur in opposite quarters. The interstate market
consistently records its main peak visitation during the September quarter, which coincides
with a trough in the number of visitors from Queensland. Usually in the first and last
quarters of the year the numbers from Queensland peak, while there is trough in the
visitation from interstate. Intrastate visitation then drops for the second quarter, with
numbers from the rest of Australia fluctuating.
Figure 5.33 Number of Intrastate and Interstate Visitors to the Sunshine Coast. (Quarterly: September 1983 – September 1994) (Source: QTTC/TQ – Major Survey Research Programme and Queensland Visitor Survey)
Sep-
83
Mar
-84
Sep-
84
Mar
-85
Sep-
85
Mar
-86
Sep-
86
Mar
-87
Sep-
87
Mar
-88
Sep-
88
Mar
-89
Sep-
89
Mar
-90
Sep-
90
Mar
-91
Sep-
91
Mar
-92
Sep-
92
Mar
-93
Sep-
93
Mar
-94
Sep-
94
Intrastate
Interstate0
25
50
75
100
125
150
175
200
225
Visi
tors
(000
's)
Quarter

Noreen Breakey Tourism Destination Development
Chapter Five – Destination Case System: A Time-Series Analysis 290
5.4.2.2 Occupancy Rates on the Sunshine Coast by Month
The level of visitation affects the occupancy levels of the various accommodation providers.
The seasonality of visitation to the Sunshine Coast region can be described by the ABS data
on monthly occupancy rates. This data is presented for two categories of accommodation
providers: hotels, motels, and guest houses; and caravan and camping. The monthly
occupancy level of each accommodation category shows the level of variation caused by
seasonality.
In addition to plotting the occupancy data, the monthly observations have then been plotted
together to illustrate the variation from the trend for each month. This overall trend has
been calculated by deseasonalising the data and is presented and discussed in Section
5.4.3.4. The monthly data highlights the level and range of occupancy for each month for
the different accommodation categories.
Occupancy Levels in Hotels, Motels, and Guest Houses:
The monthly occupancy level of hotels, motels, and guest houses on the Sunshine Coast
(Figure 5.34) demonstrates the seasonality experienced within this region.
Figure 5.34 Average Room Occupancy Rate in Sunshine Coast Hotels, Motels, and Guest Houses.
(Monthly: 1983 – 1997) (Source: ABS 8635.3 Tourist Accommodation)
0
20
40
60
80
100
Apr-83
Oct-83
Apr-84
Oct-84
Apr-85
Oct-85
Apr-86
Oct-86
Apr-87
Oct-87
Apr-88
Oct-88
Apr-89
Oct-89
Apr-90
Oct-90
Apr-91
Oct-91
Apr-92
Oct-92
Apr-93
Oct-93
Apr-94
Oct-94
Apr-95
Oct-95
Apr-96
Oct-96
Apr-97
Oct-97
Month
Occ
upan
cy(%
)
Sunshine Coast

Noreen Breakey Tourism Destination Development
Chapter Five – Destination Case System: A Time-Series Analysis 291
During this fifteen year period the highest occupancy level reached was 80 percent during
Expo 88. This is consistent with the increase in demand by visitors from interstate and
overseas during the event. Occupancy levels reached as low as the 30s during the off-peak
seasons between the end of the Christmas school holidays and beginning of the Easter break,
and between the end of the Easter break and the mid-year holidays, for the years from 1989
to 1992. The drop in occupancy in 1989 corresponds to the large jump in supply after the
Hyatt Regency Coolum opened in the second half of 1988 (discussed further in Section
5.4.3.4).
From this data, the occupancy levels for each month of the fifteen years in the hotel, motel,
and guest house category, as variation from the trend, has been determined (Figure 5.35).
This demonstrates firstly, the difference between the months due to the extent of seasonality
within the tourism industry, and secondly, the variation within each month. As each value is
plotted against the trend line, the months that are above or below average are identified.
Figure 5.35 Monthly Variation from the Trend in Room Occupancy Rates in Sunshine Coast Hotels, Motels, and Guest Houses. (1983 – 1997) (Calculated from: ABS 8635.3 Tourist Accommodation by de-trending the data {Lowess = 0.333})

Noreen Breakey Tourism Destination Development
Chapter Five – Destination Case System: A Time-Series Analysis 292
January is consistently the highest occupancy month for this accommodation sector. This is
expected as the nation-wide school holidays extend until the last week of January and the
average daily temperature of 27°C establishes the beaches of the Sunshine Coast as a
popular destination. Occupancy levels for February and March are below the trend with
April crossing the average due to the week and a half break for Easter that occurs primarily
in this month. May and June occupancy percentages are low with the mid-year holidays
increasing the occupancy levels for July. However, the percentages reached for August are
not in line with school holidays. These visitors maybe international travellers or visitors
from southern states who are not dependant on the school holidays and may wish to escape
winter temperatures. The generally higher than average occupancies recorded for
September and October can again be linked to the two-week school holidays at this time.
November and December record occupancy percentages around the trend.
The occupancy values for the months of Expo 88 (indicated by the * in Figure 5.35)
illustrate the effect of the Expo on the occupancy levels of this accommodation sector. The
effect occurred for the six months of the event.
After excluding the effect of Expo 88 on occupancy, the level of variation within each
month ranges from 5.75 percent for the month of June to 17.5 percent during January. This
variation is due to the numerable factors that have affected occupancy over the fifteen years.
The data has also been separated into the divergent periods that are evident in the
seasonality pattern of occupancy levels over the fifteen years (Figure 5.34). The first period
lasted from April 1983 to October 1988, the second from October 1988 to February 1989,
the third from February 1989 to June 1992, and the fourth from June 1992 to December
1997. The trajectories for each of the four periods will be discussed further in Section
5.4.3.4.
This analysis considers the seasonality patterns displayed in each of the different time
frames. The focus is on the first, third and fourth periods as the second period only lasted
five months, thereby not presenting even a full year of seasons.
In the first time frame (Figure 5.36), from April 1983 to October 1988, the January
occupancies provide the main peak, with the exception of occupancy levels during Expo 88.

Noreen Breakey Tourism Destination Development
Chapter Five – Destination Case System: A Time-Series Analysis 293
30
40
50
60
70
80
Apr-83
Aug-83
Dec-83
Apr-84
Aug-84
Dec-84
Apr-85
Aug-85
Dec-85
Apr-86
Aug-86
Dec-86
Apr-87
Aug-87
Dec-87
Apr-88
Aug-88
Month
Occ
upan
cy(%
)The second highest peak widened over this five year period, changing from a September
peak in 1983, to a four month high by 1987, extending from July to October. In addition the
occupancy level ranged considerably during this period, usually varying between 33 and 72
percent, with the atypical high of 80 percent recorded during Expo 88. The median
occupancy was 48 percent.
Figure 5.36 Trajectory One: Monthly Room Occupancy Rates in Sunshine Coast Hotels, Motels, and
Guest Houses from 1983 to 1988. (Source: ABS 8635.3 Tourist Accommodation)
In the 1989 to 1992 period (Figure 5.37), the seasonality pattern had four different sized
peaks each year. January was still the highest occupancy month. This was followed by the
September peak, then July, and the lowest peak occurred for the Easter break. This differed
from the usual three peaks in the first period. A second difference between these two
periods was that the occupancies were generally lower across the board between 1989 and
1992. The median level was 41 percent, 7 percent lower than the first period, and the
occupancy level ranged from 30 to 64 percent.
From mid 1992, the pattern changed again (Figure 5.38). The lowest yearly occupancies
rose from 30 to above 40 percent. The peak months also recorded higher occupancies than
the previous period, and similar occupancy rates to the first trajectory. However, the height
achieved during Expo 88 was not matched. In addition, occupancy levels from 1993
onwards generally stayed over 55 percent for the seven consecutive months each year from
July to January. In the previous period, only the month of January was over 55 percent.

Noreen Breakey Tourism Destination Development
Chapter Five – Destination Case System: A Time-Series Analysis 294
Due to this rise in the occupancy rates the median level attained in this post 1992 period was
57 percent.
Figure 5.37 Trajectory Two: Monthly Room Occupancy Rates in Sunshine Coast Hotels, Motels, and Guest Houses from 1989 to 1992. (Source: ABS 8635.3 Tourist Accommodation)
Figure 5.38 Trajectory Three: Monthly Room Occupancy Rate in Sunshine Coast Hotels, Motels, and Guest Houses from 1992 to 1997. (Source: ABS 8635.3 Tourist Accommodation)
30
40
50
60
70
80
Jun-9
2
Oct-92
Feb-93
Jun-9
3
Oct-93
Feb-94
Jun-9
4
Oct-94
Feb-95
Jun-9
5
Oct-95
Feb-96
Jun-9
6
Oct-96
Feb-97
Jun-9
7
Oct-97
Month
Occ
upan
cy(%
)
30
40
50
60
70
80
Dec-87
Apr-8
8Au
g-88
Dec-88
Apr-89
Aug-8
9Dec
-89Apr-
90Au
g-90
Dec-90
Apr-9
1Au
g-91
Dec-91
Apr-9
2Aug
-92Dec
-92Ap
r-93
Month
Occ
upan
cy(%
)

Noreen Breakey Tourism Destination Development
Chapter Five – Destination Case System: A Time-Series Analysis 295
A significant difference between the three periods was the change in the base line
occupancies (Figure 5.39). The initial increase in the yearly low occupancies ended in 1989,
when the rate dropped and stayed below those for the first period. In addition the jump in
the yearly lows from 30 percent during the middle period to 40 percent in the last period is
clearly illustrated. The discussion of the events that occurred around the change points
between each period will be included in analysis of the changing occupancy trajectories in
Section 5.4.3.4.
Figure 5.39 Yearly Low Occupancy Rates in Sunshine Coast Hotels, Motels, and Guest Houses.
(Monthly: 1983 – 1997) (Source: ABS 8635.3 Tourist Accommodation)
The changing patterns of visitor seasonality for the Sunshine Coast hotel, motel, and guest
house sector are not reflected in the visitor number patterns. The data on the visitors staying
in commercial accommodation, both on a yearly basis (Figure 5.23), and on a quarterly basis
(Figure 5.32) exhibit different patterns, as total visitation, although fluctuating, generally
continued to rise.
Occupancy Levels in Caravan Parks:
The monthly occupancy level of the sites in caravan parks (Figure 5.40), like the occupancy
percentages for hotels, motels, and guest houses, illustrates the seasonality experienced
within the Sunshine Coast.
0
10
20
30
40
50
60
70
80
90
100
Apr-83
Oct-83
Apr-84
Oct-84
Apr-85
Oct-85
Apr-86
Oct-86
Apr-87
Oct-87
Apr-88
Oct-88
Apr-89
Oct-89
Apr-90
Oct-90
Apr-91
Oct-91
Apr-92
Oct-92
Apr-93
Oct-93
Apr-94
Oct-94
Apr-95
Oct-95
Apr-96
Oct-96
Apr-97
Oct-97
Month
Occ
upan
cy(%
)
1983-1988 1989-1992 1992-1997

Noreen Breakey Tourism Destination Development
Chapter Five – Destination Case System: A Time-Series Analysis 296
Figure 5.40 Average Site Occupancy Rate in Sunshine Coast Caravan Parks. (Monthly: 1988 – 1997) (Source: ABS 8635.3 Tourist Accommodation)
During the ten-year period from January 1988 to December 1997 the highest site occupancy
levels attained were between 72 and 73.5 percent for January 1993, 1994, and 1995. This is
due to the combination of the peak occupancy month with the slightly higher occupancy
trend during these three years.
The lowest occupancy level during this decade was 37.5 percent recorded in February 1988.
February is normally a low occupancy month (Figure 5.41), but this was recorded before the
significant increase in the number of caravan parks occurred in second half of 1988. This
low occupancy for caravan parks during February 1988 is in contrast with the occupancy
level recorded for hotels, motels, and guest-houses for the same month, as the occupancy for
these establishments reached the highest level for any February in the fifteen year period.
As with the above accommodation category, the average caravan park occupancy levels for
each month of the ten years (Figure 5.41) reveals firstly, the difference between the months
due to the extent of seasonality within the tourism industry, and secondly, the variation
within each month. Each value is plotted against the trend line, to ensure that months that
are above or below average can be identified. This trend line will be presented and
discussed in Section 5.4.3.4.
0
20
40
60
80
100Ja
n-88
Apr
-88
Jul-8
8
Oct
-88
Jan-
89
Apr
-89
Jul-8
9
Oct
-89
Jan-
90
Apr
-90
Jul-9
0
Oct
-90
Jan-
91
Apr
-91
Jul-9
1
Oct
-91
Jan-
92
Apr
-92
Jul-9
2
Oct
-92
Jan-
93
Apr
-93
Jul-9
3
Oct
-93
Jan-
94
Apr
-94
Jul-9
4
Oct
-94
Jan-
95
Apr
-95
Jul-9
5
Oct
-95
Jan-
96
Apr
-96
Jul-9
6
Oct
-96
Jan-
97
Apr
-97
Jul-9
7
Oct
-97
Month
Occ
upan
cy(%
)
Sunshine Coast
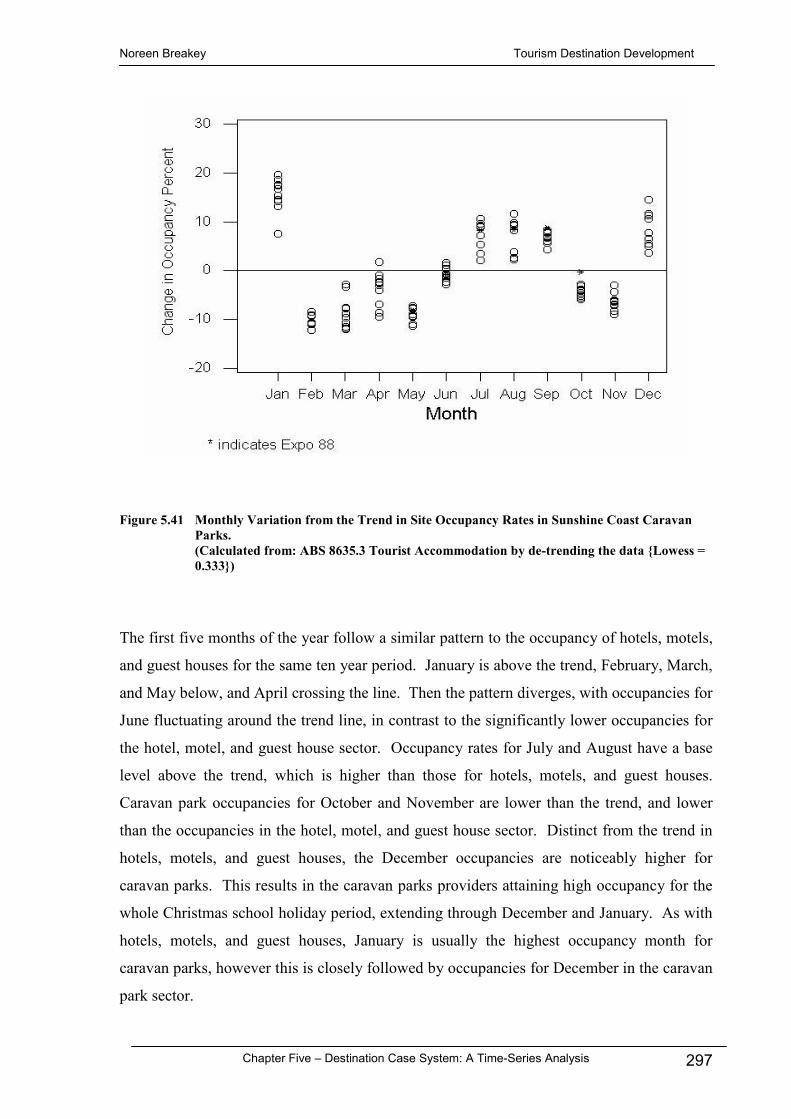
Noreen Breakey Tourism Destination Development
Chapter Five – Destination Case System: A Time-Series Analysis 297
Figure 5.41 Monthly Variation from the Trend in Site Occupancy Rates in Sunshine Coast Caravan Parks. (Calculated from: ABS 8635.3 Tourist Accommodation by de-trending the data {Lowess = 0.333})
The first five months of the year follow a similar pattern to the occupancy of hotels, motels,
and guest houses for the same ten year period. January is above the trend, February, March,
and May below, and April crossing the line. Then the pattern diverges, with occupancies for
June fluctuating around the trend line, in contrast to the significantly lower occupancies for
the hotel, motel, and guest house sector. Occupancy rates for July and August have a base
level above the trend, which is higher than those for hotels, motels, and guest houses.
Caravan park occupancies for October and November are lower than the trend, and lower
than the occupancies in the hotel, motel, and guest house sector. Distinct from the trend in
hotels, motels, and guest houses, the December occupancies are noticeably higher for
caravan parks. This results in the caravan parks providers attaining high occupancy for the
whole Christmas school holiday period, extending through December and January. As with
hotels, motels, and guest houses, January is usually the highest occupancy month for
caravan parks, however this is closely followed by occupancies for December in the caravan
park sector.

Noreen Breakey Tourism Destination Development
Chapter Five – Destination Case System: A Time-Series Analysis 298
The occupancy values for the months of Expo 88 (indicated by the * in Figure 5.41) show
the limited effect of the Expo on the Sunshine Coast caravan parks. Such a small impact
resulted in occupancy levels within the normal range for all months except October, the last
month of the Exposition. Despite the limited effect of Expo the two months following the
event recorded their highest levels of occupancy when compared to the rest of the decade.
Outside the months of Expo 88 the level of variation in occupancy within each month ranges
from 3 percent for the month of October to 12 percent during January. As with hotels,
motels, and guest houses this range is due to the various factors which have impacted on
occupancy levels. The level of variation within each month is lower for caravan parks than
for hotels, motels, and guest houses.
5.4.2.3 Addressing Research Sub-Issue Two - Seasonality
Seasonal data shows the variation that occurs within a singe year. These fluctuations are
masked in yearly data measurements. Data that is provided quarterly or monthly
demonstrates the effects of seasonality on the destination. As this seasonality is an inherent
factor in the tourism industry, its impact can only be determined if seasonal, rather than
yearly data is analysed. This supports the second Research Sub-Issue, that yearly data
obscures the seasonal variation.
5.4.3 Sub-Issue Three - Other Variables
The third Sub-Issue states that: other data needs to be analysed alongside visitor
numbers in order to determine the effect of changing trends. The pattern of visitation in
a region is not necessarily the only pattern of tourism change for the destination, as other
variables may demonstrate alternate change patterns.
This Research Sub-Issue will be addressed through an examination of the patterns of change
displayed by variables on aspects of visitation. As determined in Chapter Four, these
variables are length of stay, occupancy rates, visitor expenditure, and takings by two types
of accommodation providers: hotels, motels, and guest houses; and caravan parks.

Noreen Breakey Tourism Destination Development
Chapter Five – Destination Case System: A Time-Series Analysis 299
5.4.3.1 Average Length of Stay on the Sunshine Coast
The average length of stay by visitors in commercial accommodation on the Sunshine Coast,
as recorded QTTC/TQ, has ranged from four to seven and a half nights over the fourteen
years the surveys were conducted (Figure 5.42).
Figure 5.42 Average Length of Stay in Queensland and on the Sunshine Coast.
(1983/84 – 1996/97) (Source: QTTC/TQ – Major Survey Research Programme and Queensland Visitor Survey)
For the first two years, from 1983-84, the average length of stay on the Sunshine Coast was
six nights. This increased to around seven nights for the subsequent three years before
beginning a gradual decline to around four and a half nights during the mid 1990s.
This range in the average length of stay can have a significant effect on visitor nights.
Hypothetically, if the same number of people had visited the Sunshine Coast in 1987/88, as
for 1995/96, there would have been about 40 percent less visitor nights in the second year,
due to the decrease in the length of stay.
The data on the yearly average length of stay in Queensland forms a smoother pattern than
the Sunshine Coast data, thereby further supporting Research Issue One on area aggregation
resulting in smoother patterns.
During the initial two years of the survey, the average length of stay on the Sunshine Coast
was one and a half times the State average. The rise over the following few years was
0
1
2
3
4
5
6
7
8
1983-1984
1984-1985
1985-1986
1986-1987
1987-1988
1988-1989
1989-1990
1990-1991
1991-1992
1992-1993
1993-1994
1994-1995
1995-1996
1996-1997
Year
Num
bero
fNig
hts
Sunshine Coast
Queensland

Noreen Breakey Tourism Destination Development
Chapter Five – Destination Case System: A Time-Series Analysis 300
greater for Queensland than the Sunshine Coast. Since the late 1980s the length of stay has
generally been falling. This trend toward short breaks is greater at the regional level, with
the length of stay for Queensland in 1996/97 remaining above the early 1980s figure. The
trend from long stays in the 1980s to short stays in the 1990s appears more significant on the
Sunshine Coast than the Queensland average.
Data on the length of stay highlights the importance of encouraging visitors to stay longer,
or attracting long staying visitors, as this can be just as significant to a destination, as simply
aiming for increased visitor numbers.
Obviously, this highlights the use of data of both visitor numbers and visitor nights in
understanding destination change, as the second variable incorporates the impact of both the
number of visitors, and their length of stay.
5.4.3.2 Visitor Expenditure on the Sunshine Coast
This section considers the revenue received by the Sunshine Coast tourism industry. Data
on the expenditure level of visitors to the region is provided by two sources, QTTC/TQ and
OESR.
Total Yearly Visitor Expenditure:
Data from the QTTC/TQ Major Survey Research Programme (MSPR) and the Queensland
Visitor Survey (QVS) includes the total yearly expenditure by visitors on the Sunshine
Coast. This data, which has been CPI adjusted, shows an overall escalation in expenditure
of more than 500 percent over the fourteen years that the surveys were conducted (Figure
5.43).
There was initially a jump in annual expenditure of nearly 90 percent from 1983/84 to
1984/85. This can be consider the result of a 30 percent increase in the number of visitors
using commercial accommodation, discussed above (Figure 5.23) and a 40 percent change
in the average expenditure per night. Analysis of the rise in visitation on its own, would not
show the more significant leap in the amount of revenue received by the region from
tourism, as demonstrated by this variable.

Noreen Breakey Tourism Destination Development
Chapter Five – Destination Case System: A Time-Series Analysis 301
Figure 5.43 CPI Adjusted Total Sunshine Coast Visitor Expenditure. (1983/84 – 1996/97) (Calculated From: QTTC/TQ – Major Survey Research Programme and Queensland Visitor Survey and ABS 6401.1 CPI)
The following year saw a slight decline in total visitor expenditure, but since then
expenditure has continued to increase. This growth generated an increase of almost 95
percent over the six years from 1985/86 and an additional 123 percent in the following five
years till 1996/97. This has been a rise of between about 10 to 30 percent per year (Figure
5.44).
Figure 5.44 Percentage Change from the Previous Year for the CPI Adjusted Total Sunshine Coast
Visitor Expenditure. (1984/85 – 1996/97) (Calculated From: QTTC/TQ – Major Survey Research Programme and Queensland Visitor Survey and ABS 6401.1 CPI)
0
1 0 0 0 0 0
2 0 0 0 0 0
3 0 0 0 0 0
4 0 0 0 0 0
5 0 0 0 0 0
6 0 0 0 0 0
7 0 0 0 0 0
8 0 0 0 0 0
9 0 0 0 0 0
1 0 0 0 0 0 0
1 9 8 3 -1 9 8 4
1 9 8 4 -1 9 8 5
1 9 8 5 -1 9 8 6
1 9 8 6 -1 9 8 7
1 9 8 7 -1 9 8 8
1 9 8 8 -1 9 8 9
1 9 8 9 -1 9 9 0
1 9 9 0 -1 9 9 1
1 9 9 1 -1 9 9 2
1 9 9 2 -1 9 9 3
1 9 9 3 -1 9 9 4
1 9 9 4 -1 9 9 5
1 9 9 5 -1 9 9 6
1 9 9 6 -1 9 9 7
Y e a r
$(0
00's
)
S u n s h in e C o a s t
-20
-10
0
10
20
30
40
50
60
70
80
90
100
1984-1985 1985-1986 1986-1987 1987-1988 1988-1989 1989-1990 1990-1991 1991-1992 1992-1993 1993-1994 1994-1995 1995-1996 1996-1997Year
%Cha
nge
Sunshine Coast

Noreen Breakey Tourism Destination Development
Chapter Five – Destination Case System: A Time-Series Analysis 302
It is notable that 1988/89, while recording an increase in expenditure of 32 percent on the
previous year, which is higher than all years after the dramatic growth for 1984/85, was not
a record year for visitation. This again illustrates the impact of tourism variables other than
the number of visitors for understanding the changing tourism destination phenomenon,
particularly in this case the economic impact.
Total Yearly Visitor Expenditure by Origin:
The OESR also provides data on the total yearly visitor expenditure. This data, from 1985
to 1999, and expressed in current financial terms, is separated into the annual expenditure
levels of visitors from Queensland, interstate, and overseas (Figure 5.45).
Figure 5.45 Sunshine Coast Visitor Expenditure in Real Dollars by the Origin of Visitors.
(1985 – 1999) (Source: OESR – Visitor Expenditure in Regional Queensland)
This data shows a similar pattern to the data provided by TQ for the overlapping years
(Figure 5.43), with the continual growth in expenditure accelerating from the early 1990s.
The separation of expenditure into the visitor origins also supports the previous Sub-Issue of
Visitor Sub-Categories as, for example, the decline in total expenditure for 1999 did not
represent a decline in all sub-categories, as only the expenditure received from interstate
visitors dropped.
0
2 5 0
5 0 0
7 5 0
1 0 0 0
1 2 5 0
1 5 0 0
1 9 8 5 1 9 8 6 1 9 8 7 1 9 8 8 1 9 8 9 1 9 9 0 1 9 9 1 1 9 9 2 1 9 9 3 1 9 9 4 1 9 9 5 1 9 9 6 1 9 9 7 1 9 9 8 1 9 9 9Y e a r
$(m
illio
n)
T o ta l V is ito rs
In tra s ta te V is ito rs
In te rs ta te V is ito rs
In te rn a tio n a l V is ito rs
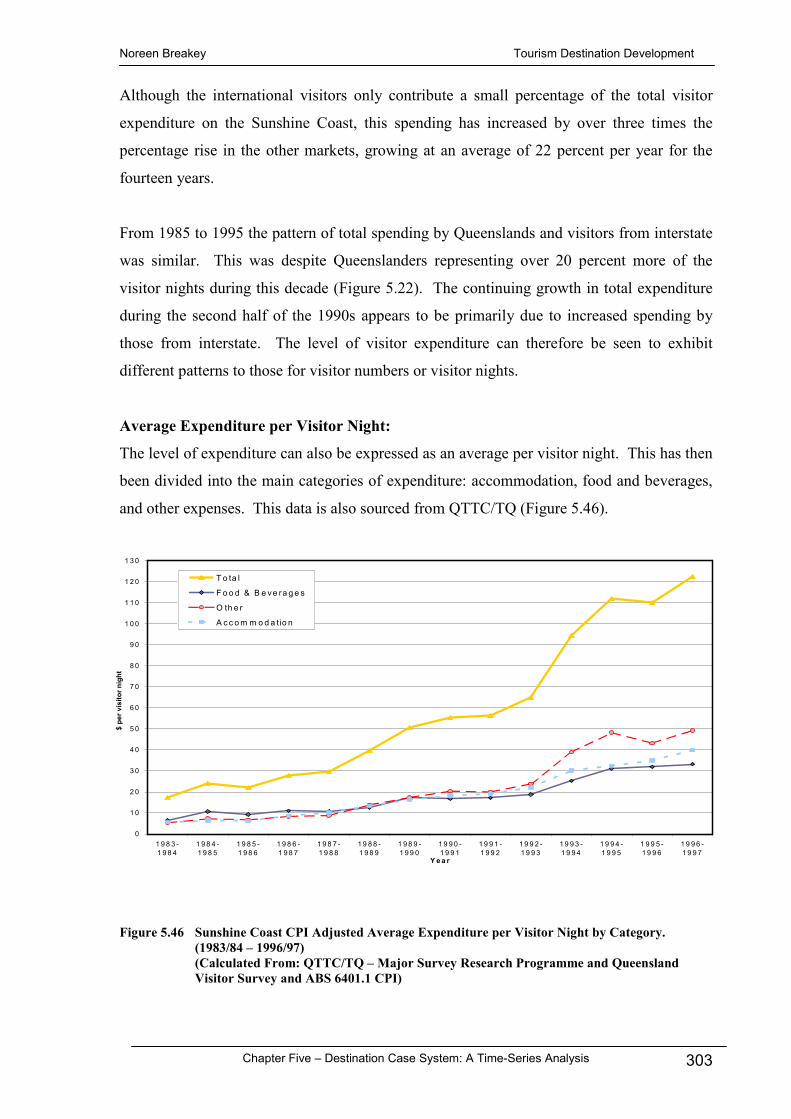
Noreen Breakey Tourism Destination Development
Chapter Five – Destination Case System: A Time-Series Analysis 303
Although the international visitors only contribute a small percentage of the total visitor
expenditure on the Sunshine Coast, this spending has increased by over three times the
percentage rise in the other markets, growing at an average of 22 percent per year for the
fourteen years.
From 1985 to 1995 the pattern of total spending by Queenslands and visitors from interstate
was similar. This was despite Queenslanders representing over 20 percent more of the
visitor nights during this decade (Figure 5.22). The continuing growth in total expenditure
during the second half of the 1990s appears to be primarily due to increased spending by
those from interstate. The level of visitor expenditure can therefore be seen to exhibit
different patterns to those for visitor numbers or visitor nights.
Average Expenditure per Visitor Night:
The level of expenditure can also be expressed as an average per visitor night. This has then
been divided into the main categories of expenditure: accommodation, food and beverages,
and other expenses. This data is also sourced from QTTC/TQ (Figure 5.46).
Figure 5.46 Sunshine Coast CPI Adjusted Average Expenditure per Visitor Night by Category. (1983/84 – 1996/97) (Calculated From: QTTC/TQ – Major Survey Research Programme and Queensland Visitor Survey and ABS 6401.1 CPI)
0
1 0
2 0
3 0
4 0
5 0
6 0
7 0
8 0
9 0
1 0 0
1 1 0
1 2 0
1 3 0
1 9 8 3 -1 9 8 4
1 9 8 4 -1 9 8 5
1 9 8 5 -1 9 8 6
1 9 8 6 -1 9 8 7
1 9 8 7 -1 9 8 8
1 9 8 8 -1 9 8 9
1 9 8 9 -1 9 9 0
1 9 9 0 -1 9 9 1
1 9 9 1 -1 9 9 2
1 9 9 2 -1 9 9 3
1 9 9 3 -1 9 9 4
1 9 9 4 -1 9 9 5
1 9 9 5 -1 9 9 6
1 9 9 6 -1 9 9 7
Y e a r
$pe
rvis
itorn
ight
T o ta l
F o o d & B e ve ra g e s
O th e r
A c c o m m o d a tio n

Noreen Breakey Tourism Destination Development
Chapter Five – Destination Case System: A Time-Series Analysis 304
Between 1983/84 and 1992/93, the average expenditure per visitor night seemed to be
relatively evenly split between the three categories of accommodation, food and beverages,
and other expenses. Since then, the spending on other products and services has increased
in advance of the accommodation, and the food and beverage categories.
Over the fourteen years, the average expenditure has risen from under $20 per night to over
$120. This increasing expenditure per visitor night, combined with the rise in the number of
visitor nights (Figure 5.21), is represented by the large annual growth rate in total
expenditure within the Sunshine Coast region, discussed above.
5.4.3.3 Takings by Accommodation Providers on the Sunshine Coast
This section considers the revenue received by the accommodation providers on the
Sunshine Coast. This provides an additional variable for considering revenue generated by
tourism. The demand side data from the visitors provided the level of visitor expenditure,
discussed above. Incorporating data from the supply side generates a more complete
picture. This data is sourced from the ABS and incorporates the takings of two
accommodation provider categories.
The level of takings are provided on a monthly basis for the hotels, motels, and guest houses
sector, and the caravan park sector. As with the occupancy data, this monthly data on
takings varies significantly due to seasonality. The analysis also shows the overall trend of
this irregular data, using a Lowess Scatter-Plot Smoother to deseasonalise the observations
and reveal the underlying trend. In addition, the observations for each month are plotted
together to illustrate the variation for each month from the trend line.
Takings from Hotels, Motels, and Guest Houses:
The level of CPI adjusted takings received by the hotel, motel, and guest house providers on
the Sunshine Coast has risen over time (Figure 5.47). In 1984, the takings received totalled
slightly less than five million dollars. By 1997 this has escalated to just under 76 million
dollars. The annual takings have continually increased each year with a significant jump of
over 10 million dollars from 1992 to 1993.

Noreen Breakey Tourism Destination Development
Chapter Five – Destination Case System: A Time-Series Analysis 305
Figure 5.47 CPI Adjusted Yearly Takings from Sunshine Coast Hotels, Motels, and Guest Houses. (1984 – 1997)
(Calculated From: ABS 8635.3 Tourist Accommodation and 6401.1 CPI)
The doubling of the number of available rooms in hotels, motels, and guest houses on the
Sunshine Coast (Section 5.3.1.2) occurred during the four year growth period, from the
beginning of 1987 to the end of 1990. As the number of rooms multiplied so did the total
annual takings. With annual increases in takings of between 29 to 47 percent, this
development phase recorded the highest growth percentages of the fourteen-year period. By
1990, this accommodation sector had increased the annual takings to nearly three and a half
times the predevelopment level of 1986. Such an increase in takings would be expected if
the demand for rooms increased in the same vein as supply, but there was only a 22 percent
increase in the number of visitors utilising commercial accommodation during this four year
period (Figures 5.24, 5.25 & 5.26).
During this four year growth period, the average expenditure on accommodation rose from
ten dollars per night to seventeen (Figure 5.46). The drop in the hotel, motel, and guest
house occupancy trend (Figure 5.34 and Figure 5.56), which corresponds with the increase
in the number of rooms in this sector does not appear to have negatively affected the
increasing annual takings trend. Interestingly, this indicates that the pattern displayed by the
data on yearly takings during the development period, appears to fit the growth pattern in the
number of rooms in the hotel, motel, and guest house sector, rather than the patterns
exhibited by visitor numbers or occupancy levels.
0
10,000
20,000
30,000
40,000
50,000
60,000
70,000
1984 1985 1986 1987 1988 1989 1990 1991 1992 1993 1994 1995 1996 1997Year
$(0
00's
)
Sunshine Coast

Noreen Breakey Tourism Destination Development
Chapter Five – Destination Case System: A Time-Series Analysis 306
In general, the post-development rise in occupancy levels from 1991 does not appear to have
resulted in greater percentage increases in yearly takings. However, the jump of 10 million
dollars in yearly takings between 1992 and 1993 does correlate with the shift in occupancy
levels at this time (Figure 5.34). The average nightly accommodation expenditure also
correlates with the increased takings, rising from $17 to $27 per night, per visitor utilising
commercial accommodation between 1991-92 and 1993-94 (Figure 5.46).
As discussed in the previous Sub-Issue on seasonality (Section 5.4.2), separating the yearly
data variables into their quarterly or monthly values illustrates the significance of
seasonality. Breaking the yearly takings from hotels, motels, and guest houses into the level
of takings per month also shows the effect of seasonality on this accommodation sector
(Figure 5.48).
Figure 5.48 CPI Adjusted Monthly Takings from Sunshine Coast Hotels, Motels, and Guest Houses.
(Monthly: 1983 – 1997) (Calculated From: ABS 8635.3 Tourist Accommodation and 6401.1 CPI)
With respect to takings within the Sunshine Coast region, the extent of this seasonality has
been increasing over time. The range in monthly takings over the first year (April 1983 –
March 1984) was under four hundred thousand. By 1997, this variation had extended out to
over four million dollars, a ten-fold increase. In both cases January recorded the highest
level of takings for the year.
0
1000
2000
3000
4000
5000
6000
7000
8000
9000
10000
Apr-83
Oct-83
Apr-84
Oct-84
Apr-85
Oct-85
Apr-86
Oct-86
Apr-87
Oct-87
Apr-88
Oct-88
Apr-89
Oct-89
Apr-90
Oct-90
Apr-91
Oct-91
Apr-92
Oct-92
Apr-93
Oct-93
Apr-94
Oct-94
Apr-95
Oct-95
Apr-96
Oct-96
Apr-97
Oct-97
Month
$(0
00's
)
Sunshine Coast

Noreen Breakey Tourism Destination Development
Chapter Five – Destination Case System: A Time-Series Analysis 307
In addition to the increase in the range in monthly takings over time, the pattern of the initial
five years appears to differ from the subsequent years (Figure 5.49). From early 1983 to
mid 1988, the monthly takings for this accommodation sector peaked in January, with two
smaller rounded increases around April and August/September. From 1988, takings from
July became significant. This linked to a further peak for September/October. Easter
holidays, fluctuating between March and April also continued to provide a period of
increased takings. January still maintained its position as the leading month for
accommodation takings, although the Christmas holiday period extended, with December
takings increasing considerably. The reasonably high level of takings for August links the
twin peaks of July and September/October. This yield from August is consistent with the
level of occupancy attained (Figure 5.35), despite this month not occurring during the school
holidays.
Figure 5.49 Trajectory Changes in the Monthly Takings from Sunshine Coast Hotels, Motels, and
Guest Houses. (Calculated from: ABS 8635.3 Tourist Accommodation using a Linear Trend Model)
The long term trend (Lowess=0.333) in the level of takings from hotels, motels, and guest
houses in the region was increasing at an increasing rate (Figure 5.50). This was evident
from the data on yearly takings (Figure 5.47). The scatter of the data points around the trend
line also illustrates the widening gap in the range of monthly takings. The significant
increase in takings has been so great that January 1993 had more takings in the one month
than the total for the year of 1984.
Yt = 248.473 + 12.1899*tMAPE = 21.64%
Yt = -1909.77 + 48.5223*tMAPE = 20.72%

Noreen Breakey Tourism Destination Development
Chapter Five – Destination Case System: A Time-Series Analysis 308
Figure 5.50 Long Term Trend in the Takings from Sunshine Coast Hotels, Motels, and Guest Houses. (Calculated from: ABS 8635.3 Tourist Accommodation using a Lowess Scatter-Plot Smoother {Lowess = 0.333})
The average level of takings for each month (Figure 5.51) illustrates the difference between
the months and the variation within each month over the fourteen years. Each data point is
plotted against the trend line to identify months that are above or below average. As
mentioned January is the highest takings month. With peaks for the holidays, and the
increased occupancy for August, the troughs occur in February, May and June. The lowest
grouping for the month of January all occurred before 1989 and are, as expected, lower than
the subsequent takings for this month. February through to July in both 1996 and 1997
recorded takings well below the trend. Despite these low periods, the intervening second six
months of 1996 saw the highest takings for October and November, in relation to the long-
term trend.
The monthly variation correlates with the pattern produced by the occupancy levels of
hotels, motels, and guest houses, although the range within each month differs (Figure 5.35).
For example, in comparison to the other months, August is quite compact in the range of
takings but spread out for occupancy. In contrast, June (excluding Expo 88) is packed
together for occupancy but widely spread for takings.

Noreen Breakey Tourism Destination Development
Chapter Five – Destination Case System: A Time-Series Analysis 309
Figure 5.51 Monthly Variation from the Trend in the Takings from Sunshine Coast Hotels, Motels, and Guest Houses. (Calculated from: ABS 8635.3 Tourist Accommodation by de-trending the data {Lowess = 0.333})
Unlike the impact on the occupancy from Expo 88 on hotels, motels, and guest houses
(Figure 5.35), the data points for takings during Expo (indicated by the * in Figure 5.51) do
not stand out. Only the takings for July and August are at the highest point from the trend,
but they are still consistent with the monthly range.
Takings from Caravan Parks:
The total amount of CPI adjusted takings received by caravan parks on the Sunshine Coast
rose for each year of the 1988 to 1997 period (Figure 5.52). The greatest yearly increase in
takings occurred for 1989 which recorded a 30 percent rise, equating to almost 2 million
dollars. This jump correlates with the increase in the number of caravan parks and the
corresponding total site capacity. The number of caravan parks rose 48 percent, from 29 to
43, between March 1988 and March 1989. Since then the total number of caravan parks has
been slowly declining, with a gradual increase in the average capacity. Takings from
caravan parks, although not climbing by the 1989 amount, continued to rise.

Noreen Breakey Tourism Destination Development
Chapter Five – Destination Case System: A Time-Series Analysis 310
Figure 5.52 CPI Adjusted Yearly Takings from Sunshine Coast Caravan Parks. (1988 – 1997)
(Calculated From: ABS 8635.3 Tourist Accommodation and 6401.1 CPI)
When compared to the takings by the hotel, motel, and guest house category the actual
takings are noticeably less, with the hotel, motel, guest house sector takings for 1988 already
exceeding the level of takings reached in 1997 by caravan parks. Additionally the increase
in caravan park takings has been only a fraction of that attained by the hotel, motel, and
guest house sector, 150 percent verses almost 400 percent respectively over the decade. The
significant jump in takings in the hotel, motel, and guest house sector occurred in 1993.
This year was not as noteworthy in the caravan park sector, with 1989 recording the greatest
leap. The takings in both accommodation sectors have risen every year despite fluctuating
visitor numbers, changing occupancies, and varying numbers of providers and capacities.
Consistent with the other monthly data, the breakdown of the takings from caravan parks
into the level of takings per month, shows the effect of seasonality (Figure 5.53). Although
this seasonality has increased in range over time, as it did for the hotel, motel, and guest
house sector, it has not been as marked for the caravan park sector. The range has changed
from $440 thousand dollars in 1989 to $670 thousand by 1997. In both years January was
the highest month for takings and February the lowest.
0
2000
4000
6000
8000
10000
12000
14000
16000
1988 1989 1990 1991 1992 1993 1994 1995 1996 1997Year
$(0
00's
)
Sunshine Coast

Noreen Breakey Tourism Destination Development
Chapter Five – Destination Case System: A Time-Series Analysis 311
Figure 5.53 CPI Adjusted Monthly Takings from Sunshine Coast Caravan Parks. (Monthly: 1988 – 1997)
(Calculated From: ABS 8635.3 Tourist Accommodation and 6401.1 CPI)
The seasonality pattern for takings by caravan parks has been relatively consistent over the
ten year period, with a peak for December/January and the Easter break and a twin peak for
July to September. The variation for 1988 can be linked to Expo 88. This was the one year
where the January takings were surpassed or matched by all months from July to December
of that year. Compared to the seasonality in takings from hotels, motels, and guest houses
from 1988, the main difference is the higher level of takings in October for the hotel, motel,
and guest house sector, than for caravan parks, when compared to the other takings per
month. Similar to the hotels, motels, and guest houses, and consistent with monthly
occupancy rates for caravan parks, the takings from the month of August are also high
despite being outside of school holidays.
As seen by the yearly takings (Figure 5.52) the long term trend (Lowess=0.333) in the level
of takings from caravan parks has been growing (Figure 5.54). The boost for the second
half of 1988 and the yearly rise for 1989 is evident, with the rate of increase lowering after
these two years. The data points scattered around the trend line shows the slight widening in
the range over the years.
0
200
400
600
800
1000
1200
1400
1600
Jan-8
8
May-88
Sep-88
Jan-8
9
May-89
Sep-89
Jan-9
0
May-90
Sep-90
Jan-9
1
May-91
Sep-91
Jan-9
2
May-92
Sep-92
Jan-9
3
May-93
Sep-93
Jan-9
4
May-94
Sep-94
Jan-9
5
May-95
Sep-95
Jan-9
6
May-96
Sep-96
Jan-9
7
May-97
Sep-97
Month
$('0
00s)
Sunshine Coast

Noreen Breakey Tourism Destination Development
Chapter Five – Destination Case System: A Time-Series Analysis 312
Figure 5.54 Long Term Trend in the Takings from Sunshine Coast Caravan Parks. (Calculated from: ABS 8635.3 Tourist Accommodation using a Lowess Scatter-Plot Smoother {Lowess = 0.333})
The level of takings for each month of the decade (Figure 5.55) shows the disparity between
the months and the diversity within each month. The data points are plotted against the
trend line to distinguish months that are above or below average.
Figure 5.55 Monthly Variation from the Trend in the Takings from Sunshine Coast Caravan Parks.
(Calculated from: ABS 8635.3 Tourist Accommodation by de-trending the data {Lowess = 0.333})

Noreen Breakey Tourism Destination Development
Chapter Five – Destination Case System: A Time-Series Analysis 313
As with occupancy, January is the month registering the highest level of takings in the
caravan park sector. These January takings were further above the trend than all the other
months in the decade, apart from the lower level of takings for January 1988. The end of
1988 and a number of months in 1989 were the highest takings values for those months,
with respect to the long term trend. July to October 1996 also recorded high takings which
were above the trend line, but November to May 1997 saw some of the lowest levels of
takings in relation to the trend.
The monthly variation in takings corresponds with the pattern generated by the occupancy
levels of caravan parks. The difference occurs in the range within certain months (Figure
5.41). For instance, with respect to the other months, January is rather condensed in the
range of takings but widely spread for occupancy, outside of the 1988 low takings value.
The reverse occurs for February and May, which are compact for occupancy but spread out
for takings.
As with the occupancy levels of caravan parks (Figure 5.41) the values for takings during
the months of Expo 88 (illustrated by the * in Figure 5.55) appear to exhibit a limited impact
from the Expo. This small effect resulted in takings that were within the normal range for
all months except June which actually recorded a slightly lower than usual level of takings.
5.4.3.4 Occupancy Rates on the Sunshine Coast
Data on tourism demand, provided by visitor numbers, illustrates part of the destination
picture. One variable that is used to represent the relationship between this demand level
required by the visitors, and the available supply of accommodation, is the occupancy level.
The trend in the occupancy rate shows this relationship as it changes over time. The time-
series data on occupancy rates for the Sunshine Coast region, as recorded by the ABS, are
available for the accommodation sectors.
This monthly data on occupancy rates for the Sunshine Coast hotel, motel, and guest house
sector, and the caravan park sector, has been presented and discussed in Section 5.4.2.2. To
demonstrate the underlying trend of the fluctuating occupancy levels the raw data has been
deseasonalise using a Lowess Scatter-Plot Smoother to show the overall occupancy trend.
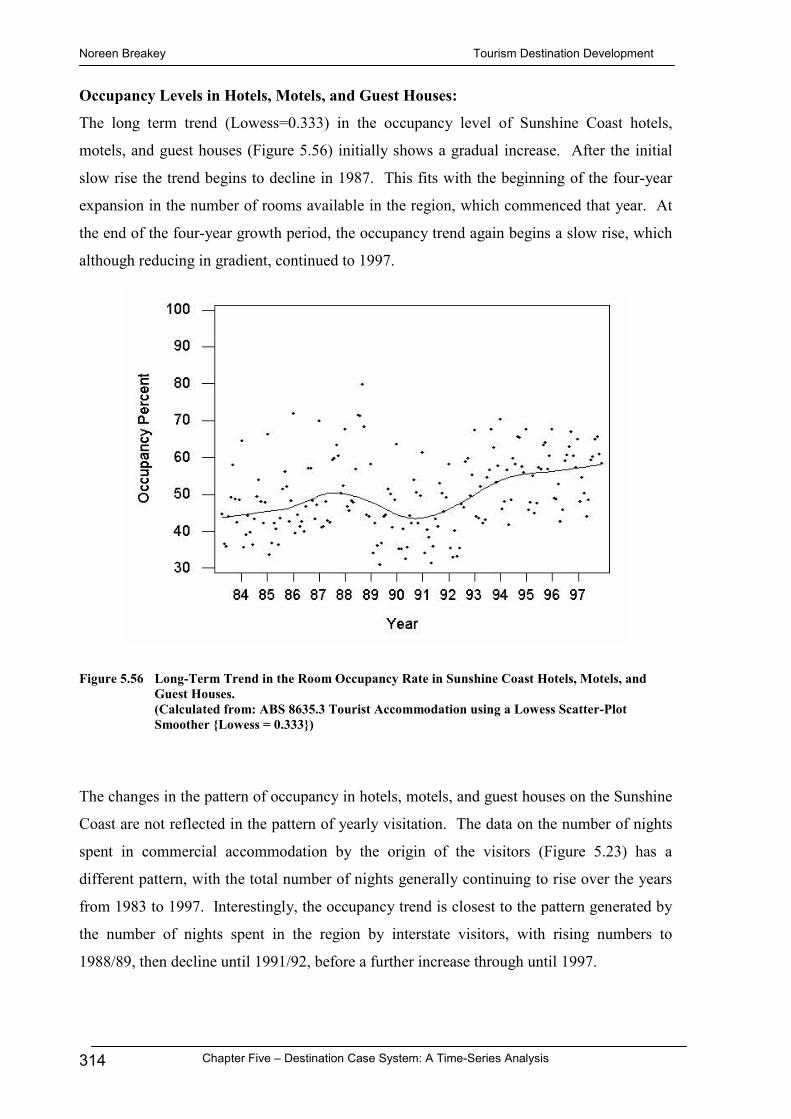
Noreen Breakey Tourism Destination Development
Chapter Five – Destination Case System: A Time-Series Analysis 314
Occupancy Levels in Hotels, Motels, and Guest Houses:
The long term trend (Lowess=0.333) in the occupancy level of Sunshine Coast hotels,
motels, and guest houses (Figure 5.56) initially shows a gradual increase. After the initial
slow rise the trend begins to decline in 1987. This fits with the beginning of the four-year
expansion in the number of rooms available in the region, which commenced that year. At
the end of the four-year growth period, the occupancy trend again begins a slow rise, which
although reducing in gradient, continued to 1997.
Figure 5.56 Long-Term Trend in the Room Occupancy Rate in Sunshine Coast Hotels, Motels, and
Guest Houses. (Calculated from: ABS 8635.3 Tourist Accommodation using a Lowess Scatter-Plot Smoother {Lowess = 0.333})
The changes in the pattern of occupancy in hotels, motels, and guest houses on the Sunshine
Coast are not reflected in the pattern of yearly visitation. The data on the number of nights
spent in commercial accommodation by the origin of the visitors (Figure 5.23) has a
different pattern, with the total number of nights generally continuing to rise over the years
from 1983 to 1997. Interestingly, the occupancy trend is closest to the pattern generated by
the number of nights spent in the region by interstate visitors, with rising numbers to
1988/89, then decline until 1991/92, before a further increase through until 1997.

Noreen Breakey Tourism Destination Development
Chapter Five – Destination Case System: A Time-Series Analysis 315
The fifteen years of data on the average monthly occupancy levels in hotels, motels, and
guest houses on the Sunshine Coast has been separated into four different change periods.
For each trajectory, a trend analysis was conducted using a time-series linear model. This
analysis establishes the direction and extent of each period of change. These trajectories
were plotted against the quarterly Sunshine Coast data (Figure 5.57). This process also
identifies the three change points, where the current trajectory changes to a new trajectory
that exhibits a different type of growth.
Figure 5.57 Trajectory Changes in Occupancy Levels in Sunshine Coast Hotels, Motels, and Guest
Houses. (Calculated from: ABS 8635.3 Tourist Accommodation using a Linear Trend Model)
The first growth trajectory extended from April 1983 to October 1988. Sunshine Coast
occupancy in this accommodation sector was therefore rising throughout both the Recovery
Period (1983-85) and the Tourism Boom (1986-88).
The growth period ended in October 1988, which was also the last month of Expo 88. This
drop in occupancy also corresponds to the large jump in supply after the Hyatt Regency
Coolum opened in the second half of 1988, as discussed in Section 5.3.1.2 (Figure 5.9). As
shown in Section 5.4.1.1, the rise in visitation to the Sunshine Coast, although fluctuating,
was generally an increasing trajectory (Figure 5.21). Therefore, a drop in occupancy would
be expected after a step up in the number of rooms available.
Yt = 40.8336 + 0.255244*tMAPE = 15.67%
Yt = 430.7 - 5.52*tMAPE = 17.39%
Yt = 41.2117 + 1.48E-02*tMAPE = 16.05%
Yt = 28.8062 + 0.183566*tMAPE = 14.33%

Noreen Breakey Tourism Destination Development
Chapter Five – Destination Case System: A Time-Series Analysis 316
Theoretically, the reduction in occupancy would gradually ease as the level of visitor
demand for accommodation catches up to the over supply of rooms. However on the
Sunshine Coast the occupancy trend for the hotel, motel, and guest house sector did not rise
until 1992. This third trajectory, from February 1989 to June 1992, was basically a period
of equilibrium, with the monthly occupancies fluctuating around a relatively constant
occupancy rate.
The occupancy trend therefore did not begin to rise after the drop for 1988, despite
increasing visitation. However during this period the supply of accommodation also
continued to rise, with the opening of various hotels, motels, and guest houses, including the
Sheraton Noosa and Twin Waters Resorts (Figure 5.9). This increasing trajectory for the
supply of rooms continued until December 1990 (Figure 5.10).
It was not for another 18 months that the increasing visitation demand caught up to the
supply of rooms, beginning a new growth trajectory for occupancy. This trajectory
extended from June 1992 to the end of the data set in December 1997, thereby extending
from the Recovery Period (1992-94) through the Unstable Period (1995-97). However this
growth trajectory was not as marked as the first trajectory of the Tourism Boom.
Occupancy Levels in Caravan Parks:
The lowest monthly occupancy level for caravan parks (Figure 5.40) during the decade from
1988, was 37.5 percent recorded in February 1988. February is normally a low occupancy
month (Figure 5.41), but this was recorded before the significant increase in the number of
caravan parks occurred in second half of 1988. Such an increase in both the number of
parks and the total number of sites in the region could have resulted in lower average
occupancy from mid 1988 onward. The long-term trend line does not however show any
significant reduction in occupancy at this time (Figure 5.58).
This long-term trend line was determined by removing the seasonality from the data
(Lowess=0.333). This produced a relatively flat trend in the occupancy level of the caravan
parks on the Sunshine Coast (Figure 5.58). After nearly four years of operating at an
average occupancy of around 50 percent, a gradual increase occurred over the subsequent
three years to mid 1994, when the trend began to decrease slightly for two years and then
began to climb slowly again. Part of the reason for the low level of overall positive change
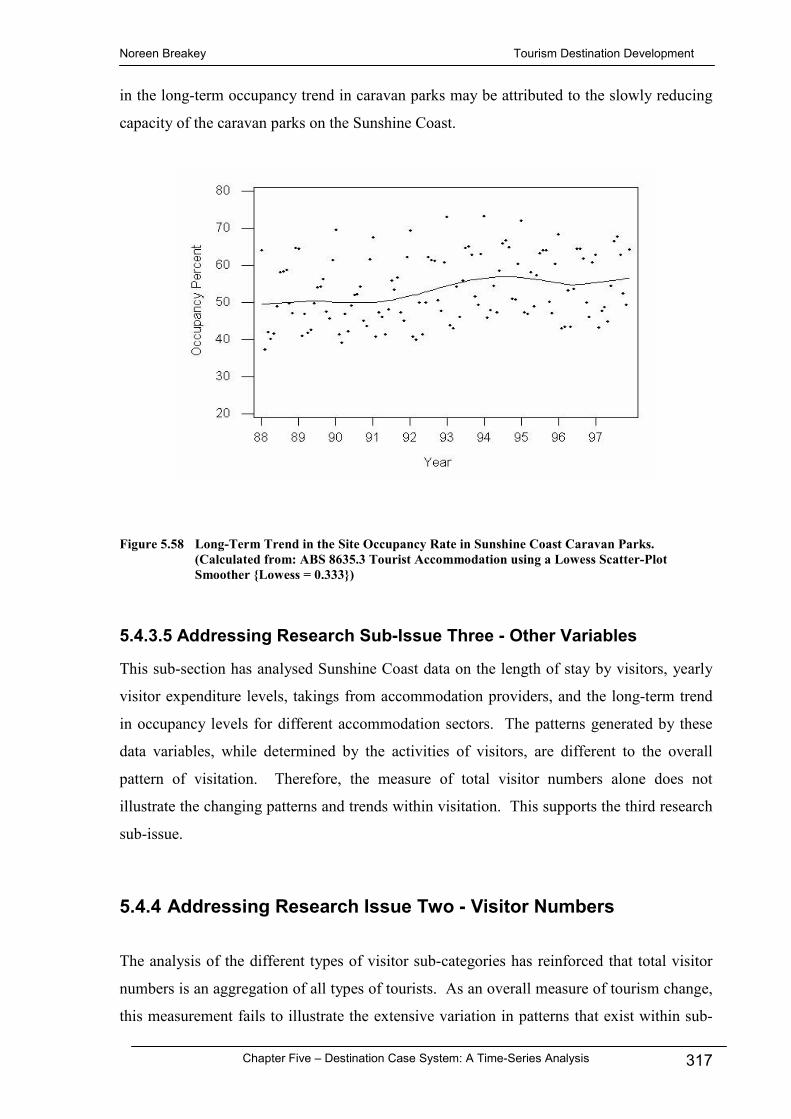
Noreen Breakey Tourism Destination Development
Chapter Five – Destination Case System: A Time-Series Analysis 317
in the long-term occupancy trend in caravan parks may be attributed to the slowly reducing
capacity of the caravan parks on the Sunshine Coast.
Figure 5.58 Long-Term Trend in the Site Occupancy Rate in Sunshine Coast Caravan Parks. (Calculated from: ABS 8635.3 Tourist Accommodation using a Lowess Scatter-Plot Smoother {Lowess = 0.333})
5.4.3.5 Addressing Research Sub-Issue Three - Other Variables
This sub-section has analysed Sunshine Coast data on the length of stay by visitors, yearly
visitor expenditure levels, takings from accommodation providers, and the long-term trend
in occupancy levels for different accommodation sectors. The patterns generated by these
data variables, while determined by the activities of visitors, are different to the overall
pattern of visitation. Therefore, the measure of total visitor numbers alone does not
illustrate the changing patterns and trends within visitation. This supports the third research
sub-issue.
5.4.4 Addressing Research Issue Two - Visitor Numbers
The analysis of the different types of visitor sub-categories has reinforced that total visitor
numbers is an aggregation of all types of tourists. As an overall measure of tourism change,
this measurement fails to illustrate the extensive variation in patterns that exist within sub-

Noreen Breakey Tourism Destination Development
Chapter Five – Destination Case System: A Time-Series Analysis 318
classifications. Yearly data also obscures the impact of seasonality of tourism-related
variables. In addition, a measure of total visitor numbers alone does not illustrate changing
patterns that cannot be determined by visitor numbers alone. This supports the second
research issue, that tourism change cannot be explained by total yearly visitor numbers
alone.
5.5 Research Issue Three - No Predetermined Pattern
The third Research Issue states that: there is no predetermined pattern of tourism
destination change. Unlike the Destination Life-Cycle with its sequential stages, the Multi-
Trajectory Model of Tourism Destination Change proposes that at any point in its life, a
destination may ‘change’ to follow any one of the trajectory options. Different tourism
related variables may exhibit very different patterns. This does not imply that all time-series
data will not illustrate corresponding trajectories or change points.
The outcome of this proposition is that the pattern of change in a tourism-related data
variable can exhibit any one of the five trajectories followed by a change to one of the other
four. This process can then be repeated over and over. The pattern of each data variable
over time would therefore be a combination of up to the five different trajectories occurring
in any order.
Within this Research Issue there are three Sub-Issues which relate to the pattern of change in
destination data variables as proposed in the Multi-Trajectory Model of Tourism Destination
Change (Figure 5.59). The first Sub-Issue states that tourism-related data variables exhibit
different patterns over time, the second Sub-Issue relates to the lack of order in stage
progression, and the third Sub-Issue considers the unspecified duration of a stage or
trajectory. The remainder of this section will address each of these Sub-Issues in turn,
thereby demonstrating that tourism destination change does not follow one predetermined
pattern.

Noreen Breakey Tourism Destination Development
Chapter Five – Destination Case System: A Time-Series Analysis 319
Figure 5.59 The Three Sub-Issues of Research Issue Three. (reproduced from Figure 5.1)
5.5.1 Sub-Issue One - Different Patterns
The first Sub-Issue states that: tourism-related data variables exhibit different patterns.
If there is no predetermined pattern, then tourism-related data variables will exhibit different
patterns over time.
This has already been seen in the figures used to substantiate the first two Research Issues,
as varying patterns were found when analysing different geographical scales, sub-categories
of data variables, seasonal data, and a range of different variables.
With respect to the Multi-Trajectory Model of Tourism Destination Change, the pattern of a
tourism-related data variable may not exhibit all five trajectory options during a particular
time period. The pattern of a variable may be a single trajectory or a combination of a
number of trajectories, as discussed in Chapter Two (Section 2.7.1.3).
Last Stage does not Predict Next
Research Issue Three
No PredeterminedPattern
Trajectory Lengths Differ
Sub-IssueThree
Different Patterns
Sub-IssueTwo
Sub-IssueOne

Noreen Breakey Tourism Destination Development
Chapter Five – Destination Case System: A Time-Series Analysis 320
Different tourism-related variables can exhibit very different patterns during the same time
frame. Therefore the pattern of change displayed by a tourism destination is ultimately
dependant on the variable(s) considered. As shown in the discussion of the first Sub-Issue
in Research Issue Two on Visitor Sub-Categories (Section 5.4.1), an aggregate increase in
visitation may be due to a rise in one market combined with a fall in another. Focusing on
total visitor numbers can therefore portray a different type of growth to the analysis of
visitors from intrastate, interstate, or overseas; or the analysis of the type of accommodation
used.
However, this does not imply that all tourism-related time-series data will not illustrate any
corresponding trajectories or change points. For instance there is an obvious relationship
between the number of establishments and the capacity in an accommodation sector. This
resulted in very similar patterns for the two data variables in the hotel, motel, and guest
house sector for the Caloundra Shire (Figure 5.4 and Figure 5.11) as no large resorts were
built during the time period analysed.
Even within one sector of a destination, different patterns of change are exhibited. As
determined in Chapter Four this section will analyse, compare, and discuss the various
patterns shown by data variables related to the hotel, motel, and guest house sector. This
section presents the different patterns of change, highlighting the relationships between
these accommodation-related variables. This data has been provided in the previous
sections, but to allow for a more direct comparison of these patterns, the variables have been
transformed to produce the percentage change in each variable from the base year of
1983/84, thereby utilising the same measure and scale.
5.5.1.1 Overview of the Hotel, Motel, and Guest House Sector
This accommodation sector incorporates the two forces of demand and supply. Demand for
accommodation by tourists is illustrated by data on the number of visitors staying in
commercial accommodation on the Sunshine Coast. The supply of accommodation is
presented through the use of data on the changing number of establishments, the total
number of rooms available and the relationship between these variables, the average number
of rooms per establishment. The combination of the forces of supply and demand results in
the recorded levels of occupancy data within this sector.

Noreen Breakey Tourism Destination Development
Chapter Five – Destination Case System: A Time-Series Analysis 321
In addition to these supply and demand related variables, this analysis also considers the
patterns shown by financial data, the average expenditure on accommodation by the visitors,
and the takings received by this accommodation sector, as a yearly total, and as an average
level of takings per available room.
There has been significant variation in the percentage change since 1983/84 for these eight
variables. One variable increased by over 1400 percent, two by around 600 perent and the
other five by less than 150 percent. As a result all the variables are presented together
(Figure 5.60), and secondly, the five variables with the lower level of change are displayed
(Figure 5.61).
Figure 5.60 Sunshine Coast Hotel, Motel, and Guest House Sector – Percentage Change from 1983/84 to 1500%. (1983/84 – 1996/97) (Calculated From: QTTC/TQ – Major Survey Research Programme and Queensland Visitor Survey, and ABS 8635.3 Tourist Accommodation and 6401.1 CPI)
Over this fourteen year period all eight variables increased by some margin. The major
percentage increase since 1983/84 occurred in the level of takings by the hotel, motel, and
guest house sector, which increased by 1400 percent on a CPI adjusted basis. This total
yearly level of takings rose every year despite fluctuating visitor numbers, changing
occupancies, and varying numbers of providers and capacities.
-1000
100200300400500600700800900
100011001200130014001500
1983 -1984
1984 -1985
1985 -1986
1986 -1987
1987 -1988
1988 -1989
1989 -1990
1990 -1991
1991 -1992
1992 -1993
1993 -1994
1994 -1995
1995 -1996
1996 -1997
Year
%In
crea
se
Total No of Rooms in Establishments
Average Accommodation Expenditure per Visitor Night
Takings per Room per Year
No of Visitors in Commercial Accommodation
Takings from Establishments
Average No of Rooms per Establishment
No of Establishments
Occupancy Trend (Loess = 0.333)

Noreen Breakey Tourism Destination Development
Chapter Five – Destination Case System: A Time-Series Analysis 322
Figure 5.61 Sunshine Coast Hotel, Motel, and Guest House Sector – Percentage Change from 1983/84 to 150%. (1983/84 – 1996/97) (Calculated From: QTTC/TQ – Major Survey Research Programme and Queensland Visitor Survey, and ABS 8635.3 Tourist Accommodation and 6401.1 CPI, Aust)
As a result, the level of takings per room also increased substantially, rising by over 600
percent. This growth was parallelled by the data on the average expenditure on
accommodation per visitor night. This relationship will be explored further in Section
5.5.1.4.
The other five accommodation-related variables increased by less than 150 percent in this
fourteen year period (Figure 5.61). Increasing between 90 percent and 130 percent were the
average number of rooms per establishment, the total number of rooms available, and the
number of visitors staying in commercial accommodation. Over this period the number of
establishments and occupancy trend rose by approximately 10 percent and 30 percent
respectively.
5.5.1.2 Occupancy
Unlike the other data variables, which measure people, dollars, and rooms, the occupancy
level is constrained to 100 percent. As the initial 1983/84 occupancy level was already in
the low 40 percents the highest growth rate possible would have been 130 percent and this
-100
102030405060708090
100110120130140150
1983 -1984
1984 -1985
1985 -1986
1986 -1987
1987 -1988
1988 -1989
1989 -1990
1990 -1991
1991 -1992
1992 -1993
1993 -1994
1994 -1995
1995 -1996
1996 -1997
Year
%In
crea
se
No of Visitors in Commercial Accommodation
Total No of Rooms in Establishments
Average No of Rooms per Establishment
No of Establishments
Occupancy Trend (Loess = 0.333)

Noreen Breakey Tourism Destination Development
Chapter Five – Destination Case System: A Time-Series Analysis 323
would have required all the hotels, motels, and guest houses to have all their rooms occupied
for every night of every month. Given this context, the increase in the trend in occupancy
(Lowess=0.333) of almost 30 percent was notable but not outstanding. The change in the
type of occupancy after 1992 was more significant. This occupancy trajectory, as discussed
in Section 5.4.2.2, showed seven continuous months per year recording occupancy rates
over 55 percent, combined with the low season monthly occupancies remaining above 40
percent (Figure 5.38).
5.5.1.3 Visitor Numbers and Total Rooms
Section 5.4.1.1 showed that the total number of visitor nights within the Sunshine Coast
doubled between 1985 and 1997. In correlation with this increase in demand (Figure 5.21),
the supply of rooms in hotels, motels, and guest houses also doubled (Figure 5.7). However,
this doubling of supply and demand occurred on different time frames within this twelve-
year period. The duration of the primary growth in hotel rooms was the four years from
1987 to 1990, with two times the 1985 level of rooms reached by the end of this expansion.
From then on, the supply of rooms has remained relatively constant. In comparison the
demand for visitor nights required a decade of fluctuating growth to double in number, with
the trend for visitor nights that of a gradually increasing trajectory over the twelve years.
The increase in visitor numbers can therefore be seen to have occurred more gradually than
the addition of extra rooms in the hotel, motel, and guest house sector. The percentage
change from 1983/84 for these two variables (Figure 5.62) shows the general positive climb
in visitor numbers over the whole period, with the growth in the number of rooms occurring
over the shorter time frame.
By considering the percentage changes since 1983/84 it can be seen that the number of
visitors utilising commercial accommodation increased by a larger percentage than any of
the other seven hotel-related variables presented for the first year (Figure 5.60 and Figure
5.61). The same level of growth in the total number of rooms was reached two years later in
1986/87. The number of visitors then grew at a faster rate until 1988/89 when the room
supply had again increased by the same percentage as the number of visitors. The increase
in room supply continued its development trajectory, thereby increasing at a higher rate than
that demonstrated by the visitors. At the end of 1990/91, when there had been a 100 percent

Noreen Breakey Tourism Destination Development
Chapter Five – Destination Case System: A Time-Series Analysis 324
increase of the number of rooms since 1983/84, this growth trajectory for the development
of rooms changed to begin a period of relative equilibrium. Three years later the level of
visitors utilising commercial accommodation had again increased above the supply
percentage increase, indicating the possible requirement of a corresponding increase in the
supply of rooms in hotels, motels, and guest houses.
Figure 5.62 Comparison of the Number of Visitors using Commercial Accommodation and the Total
Number of Rooms in Hotels, Motels, and Guest Houses for the Sunshine Coast – Percentage Change from 1983/84. (1983/84 – 1996/97) (Calculated From: QTTC/TQ – Major Survey Research Programme and Queensland Visitor Survey, and ABS 8635.3 Tourist Accommodation)
The patterns displayed by these two variables show that even when different variables
increase by a similar amount over a specified time frame, there can still be different growth
trajectories occurring. In this case, the visitor numbers increased along a gradually
increasing evolutionary trajectory, while over the same period room numbers exhibited an
equilibrium, positive growth, equilibrium pattern.
5.5.1.4 Takings and Expenditure on Accommodation
There is a match between the patterns of change of the average takings per room per year
and the average expenditure on accommodation per visitor night. The match occurs both in
the pattern of growth and the value of the percentage change from the base year (Figure
5.63).
0
2 5
5 0
7 5
1 0 0
1 2 5
1 5 0
1 9 8 3 -1 9 8 4
1 9 8 4 -1 9 8 5
1 9 8 5 -1 9 8 6
1 9 8 6 -1 9 8 7
1 9 8 7 -1 9 8 8
1 9 8 8 -1 9 8 9
1 9 8 9 -1 9 9 0
1 9 9 0 -1 9 9 1
1 9 9 1 -1 9 9 2
1 9 9 2 -1 9 9 3
1 9 9 3 -1 9 9 4
1 9 9 4 -1 9 9 5
1 9 9 5 -1 9 9 6
1 9 9 6 -1 9 9 7
Y e a r
%In
crea
se
N o o f V is i t o r s in C o m m e r c ia lA c c o m m o d a t io n
T o t a l N o o f R o o m s inE s t a b l is h m e n t s

Noreen Breakey Tourism Destination Development
Chapter Five – Destination Case System: A Time-Series Analysis 325
Figure 5.63 Comparison of the Average Expenditure on Accommodation per Visitor Night and the Takings per Room per Year from Hotels, Motels, and Guest Houses for the Sunshine Coast – Percentage Change from 1983/84. (1983/84 – 1996/97) (Calculated From: QTTC/TQ – Major Survey Research Programme and Queensland Visitor Survey, and ABS 8635.3 Tourist Accommodation and 6401.1 CPI)
The patterns of growth for these two variables may have been expected to be similar as they
both aim to measure the amount paid or received for accommodation. However, the primary
data was collected by separate Government bodies, administering different surveys, with
one questioning the visitor with respect to their spending in the region, while the other
collected data on the revenue received by the accommodation providers. It would therefore
be expected that the variables could differ, due to the different methodologies used, the
effects of sampling, the reliability of the respondents answers, and the amalgamation of all
accommodation types into the visitor expenditure survey.
Despite this, these two variables increased together over the thirteen years, reaching over
600 percent by the end of 1996/97. The main deviation between the two data sets occurred
in 1988/89, which included Expo 88, when the growth in the average takings per room was
higher than the recorded rise in the average expenditure on accommodation.
0
1 0 0
2 0 0
3 0 0
4 0 0
5 0 0
6 0 0
7 0 0
8 0 0
9 0 0
1 0 0 0
1 9 8 3 -1 9 8 4
1 9 8 4 -1 9 8 5
1 9 8 5 -1 9 8 6
1 9 8 6 -1 9 8 7
1 9 8 7 -1 9 8 8
1 9 8 8 -1 9 8 9
1 9 8 9 -1 9 9 0
1 9 9 0 -1 9 9 1
1 9 9 1 -1 9 9 2
1 9 9 2 -1 9 9 3
1 9 9 3 -1 9 9 4
1 9 9 4 -1 9 9 5
1 9 9 5 -1 9 9 6
1 9 9 6 -1 9 9 7
Y e a r
%In
crea
seA v e r a g e A c c o m m o d a t io nEx p e n d itu r e p e r V is ito r N ig h t
T a k in g s p e r R o o m p e r Y e a r

Noreen Breakey Tourism Destination Development
Chapter Five – Destination Case System: A Time-Series Analysis 326
This fit between the percentage changes in takings per room in the hotel, motel, and guest
house sector, and expenditure on accommodation is statistically robust. The correlation
coefficient between these variables is r = +0.995, indicating a very strong positive linear
relationship (Figure 5.64).
Figure 5.64 Scatterplot of the Correlation between Percentage Change from 1983/84 in the Average Expenditure on Accommodation per Visitor Night, and the Takings per Room per Year from Hotels, Motels, and Guest Houses for the Sunshine Coast. (Calculated From: QTTC/TQ – Major Survey Research Programme and Queensland Visitor Survey, and ABS 8635.3 Tourist Accommodation and 6401.1 CPI)
5.5.1.5 Visitor Numbers, Total Rooms, Occupancy and Takings
A comparison of the different patterns of the percentage change in the eight variables was
conducted to determine whether additional relationships between the variables occurred.
When comparing the relationship between the growth patterns from 1983/84 for number of
visitors, total rooms available, and takings received per room (Figure 5.65), only one
consistent relationship could be found. It can be seen that when the growth in visitors using
commercial accommodation was equal or higher than the increase in the number of rooms,
the level of takings per room always grew.

Noreen Breakey Tourism Destination Development
Chapter Five – Destination Case System: A Time-Series Analysis 327
Figure 5.65 Comparison of the Number of Visitors, Total Number of Rooms, and Takings per Room per Year from Hotels, Motels, and Guest Houses for the Sunshine Coast – Percentage Change from 1983/84. (1983/84 – 1996/97) (Calculated From: QTTC/TQ – Major Survey Research Programme and Queensland Visitor Survey, and ABS 8635.3 Tourist Accommodation and 6401.1 CPI)
5.5.1.6 Addressing Research Sub-Issue One - Different Patterns
Overall there are very different patterns of growth from 1983/84 for the eight
accommodation related variables. Although all variables experienced some growth over the
thirteen years, there was significant variation in the type, extent, and timing of the growth.
In the variables analysed there were only a limited number of identifiable relationships
between the variables. Firstly, the growth in the number of visitors and the number of
available rooms fluctuated around each other. However the two patterns differed, with the
visitors number variable increasing along a gradually increasing evolutionary trajectory,
while room numbers followed an equilibrium, positive growth, equilibrium pattern.
Secondly, the value of accommodation takings and the visitor expenditure on
accommodation matched. Despite the different methodological approaches these two
variables measure a similar phenomenon and therefore such a relationship is not unexpected.
0
2 0
4 0
6 0
8 0
1 0 0
1 2 0
1 4 0
1 6 0
1 9 8 3 -1 9 8 4
1 9 8 4 -1 9 8 5
1 9 8 5 -1 9 8 6
1 9 8 6 -1 9 8 7
1 9 8 7 -1 9 8 8
1 9 8 8 -1 9 8 9
1 9 8 9 -1 9 9 0
1 9 9 0 -1 9 9 1
1 9 9 1 -1 9 9 2
1 9 9 2 -1 9 9 3
1 9 9 3 -1 9 9 4
1 9 9 4 -1 9 9 5
1 9 9 5 -1 9 9 6
1 9 9 6 -1 9 9 7
Y e a r
%C
hang
ein
Visi
torN
umbe
rs&
Num
bero
fRoo
ms
0
1 0 0
2 0 0
3 0 0
4 0 0
5 0 0
6 0 0
7 0 0
%C
hang
ein
the
Taki
ngs
perR
oom
perY
ear
N o o f V i s i t o r s i n C o m m e r c ia lA c c o m m o d a t i o nT o t a l N o o f R o o m s i nE s t a b l i s h m e n t sT a k i n g s p e r R o o m p e r Y e a r

Noreen Breakey Tourism Destination Development
Chapter Five – Destination Case System: A Time-Series Analysis 328
Apart from these two relationships there was little correlation between the patterns of
change in these accommodation related variables. In addition to demonstrating that
different patterns occur in tourism-related variables, this also highlights the complexity that
exists within a tourism destination, as variables do not appear to change in a set pattern with
respect to other variables.
The variety in the change patterns within this destination, along with the level of complexity
in the relations between the variables, would be increased if other accommodation sectors or
non-accommodation variables were added to the discussion. A single pattern is therefore
not representative of the complex arrangement of rising and falling aspects of a tourism
destination as it changes over time. This supports the first Sub-Issue, that tourism-related
data variables exhibit different patterns.
5.5.2 Sub-Issue Two - Trajectory Lengths Differ
The second Sub-Issue states that: the current trajectory does not have a predetermined
life. Demonstration that one trajectory option does not last for a preset period of time would
illustrate that there is no set pattern for tourism destination development. The internal and
external forces operating on a specific tourism destination system are different to both other
destination systems and the past forces that acted upon the destination. This results in a lack
of order in stage progression, and instead, an individualised length for each trajectory.
5.5.2.1 The Boom and Bust Periods
As determined in Chapter Four, a six year time frame was selected to establish whether one
trajectory has a predetermined duration. These two three year periods, the ‘Tourism Boom’
and ‘The Recession’ were discussed in the previous chapter. If there was a preset ending to
a trajectory, this situation would be expected to show a growth trajectory followed by a
declining trajectory across various tourism-related variables.
The boom years occurred from 1986 to 1988, as the potential economic benefits of tourism
were realised and big business invested with the support of Government. This phase was
followed by the recession period of 1989 to 1991, which incorporated the post-Expo lull, the
Pilot’s Dispute, airline deregulation, the Nationwide economic recession, and the Gulf War.

Noreen Breakey Tourism Destination Development
Chapter Five – Destination Case System: A Time-Series Analysis 329
The eight Sunshine Coast variables analysed in this section have been presented and
discussed in the previous Research Issues. The focus in this section is on the trajectories
evident for the different variables during the boom and bust years. To permit a more direct
comparison of the pattern of trajectory change, the variables have been transformed to
produce the percentage change in each variable from the base year of 1985, thereby utilising
the same measure and scale for all variables.
The six years of data for each variable, as the percentage change from 1985, has been
separated into its different change periods, through a process of inspection. For each
trajectory, a trend analysis was conducted using a time-series model. The majority of
trajectories were determined by the application of a linear model. However, certain change
patterns required analysis using a polynomial model, as the growth occurred at an increasing
rate. The analysis of the data also established the direction and duration of each period of
change. This process also identified the change points, where one trajectory changes to
another.
It is important to note that the data could generate different trajectories if the time period
was changed. Inspection of a longer or shorter pattern of data may generate alternate
trajectories and change points. For example, in this six year analysis a drop for 1990
followed by a rise for 1991, may be two separate trajectories, or one, depending on the
percentage change recorded for 1992.
There has been significant variation in the percentage change since 1985 for the eight
variables. One variable increased by almost 450 percent, another by around 350 percent,
and the other six by less than 100 percent. As a result the two high growth variables are
presented together (Figure 5.66), and secondly, the five variables with the lower level of
change are displayed (Figure 5.67). These figures show the percentage change in the actual
data values for each of the variables analysed.

Noreen Breakey Tourism Destination Development
Chapter Five – Destination Case System: A Time-Series Analysis 330
Figure 5.66 Sunshine Coast Tourism Boom and the Recession – Percentage Change from 1985 to 500%. (1986 – 1991) (Calculated From: QTTC/TQ – Major Survey Research Programme and Queensland Visitor Survey, and ABS 8635.3 Tourist Accommodation and 6401.1 CPI)
Figure 5.67 Sunshine Coast Tourism Boom and the Recession – Percentage Change from 1985 to
100%. (1986 – 1991) (Calculated From: QTTC/TQ – Major Survey Research Programme and Queensland Visitor Survey, and ABS 8635.3 Tourist Accommodation and 6401.1 CPI)
The trajectories have also been separated into the three categories of growth, decline, and
equilibrium, and are displayed for each year for each variable (Table 5.1). The growth
period encompasses high or low growth, or growth that is increasing at an increasing rate.
- 1 0
0
1 0
2 0
3 0
4 0
5 0
6 0
7 0
8 0
9 0
1 0 0
1 9 8 5 1 9 8 6 1 9 8 7 1 9 8 8 1 9 8 9 1 9 9 0 1 9 9 1Y e a r
%in
crea
sefr
om19
85
P o p u la t io n ( S C )
N o o f E s ta b l is h m e n ts ( S C )
C a p a c i t y o f E s ta b lis h m e n ts ( S C )
V is i to r N ig h ts ( S C )
In t r a s ta te V is i to r N ig h ts ( S C )
In te r s ta te V is i to r N ig h ts ( S C )
y = 8 . 5 6 9 4 x 2 + 5 . 8 7 5 9 x - 1 4 . 8 1 4R 2 = 0 . 9 9 8 3
- 4 0
0
4 0
8 0
1 2 0
1 6 0
2 0 0
2 4 0
2 8 0
3 2 0
3 6 0
4 0 0
4 4 0
4 8 0
1 9 8 5 1 9 8 6 1 9 8 7 1 9 8 8 1 9 8 9 1 9 9 0 1 9 9 1Y e a r
%in
crea
sefr
om19
85
B u i ld in g A p p r o v a ls ( S C )
H o t e l S e c t o r T a k in g s ( S C )
P o ly . ( H o te l S e c t o r T a k in g s ( S C ) )

Noreen Breakey Tourism Destination Development
Chapter Five – Destination Case System: A Time-Series Analysis 331
This allows for a comparison to be made between the variables, as it clearly shows which
variables were experiencing the same type of trajectory in the same year and when the
variables changed to a different trajectory, if at all.
Table 5.1 Trajectories Displayed by Various Tourism and Growth Variables for the Sunshine Coast
During the Six Year Boom and Bust period.
If there was a preset ending to a trajectory, analysis of the data variables over the six year
boom and bust period would be expected to show a growth trajectory followed by a
declining trajectory across various tourism-related variables. This proposition can be
separated into a number of sub-propositions. These relate to the type of trajectories
experienced during the boom and bust periods, changes in trajectories, and the timing of
such changes. The sub-propositions generated seven questions that have been analysed for
each variable (Table 5.2). The remainder of the section will address each of these questions
in turn.
Table 5.2 Questions for the Analysis of the Trajectory Changes in the Boom and Bust Period.
Boom and Bust Period Question One Did the variables increase during at least one of the boom years? Question Two Were the variables increasing at the beginning of the boom period? Question Three Did the variables continue to increase through the boom years? Question Four Did the variables decline at the end of the boom years i.e. in 1989? Question Five Did any of the variables drop later in ‘The Recession’? Question Six Did any of the variables continually decrease during ‘The Recession’? Question Seven Did any variable(s) not decrease during ‘The Recession’?
Variable 1986 1987 1988 1989 1990 1991(Expected Pattern)
Intrastate Visitor Nights
Interstate Visitor Nights Growth
Total Visitor Nights Decline
No. of Hotel Establishments Equilibrium
Capacity of Htl Establishments
Hotel Sector Takings
Building Approvals
Population
Tourism Boom The Recession

Noreen Breakey Tourism Destination Development
Chapter Five – Destination Case System: A Time-Series Analysis 332
5.5.2.2 Did the variables increase during at least one of the boom
years?
This question addresses whether the ‘Tourism Boom’ positively affected all the variables
analysed. This examines whether the overall condition affected all the variables considered.
All the variables analysed experienced growth for at least one year of the boom period.
However, the patterns varied and the years when the growth occurred differ across the
variables.
5.5.2.3 Were the variables increasing at the beginning of the boom
period?
This question addresses whether all the variables analysed were already showing the
positive effects at the beginning of the boom period. This also highlights any variables
which had a late start to the growth period.
The majority of these variables were experiencing a growth trajectory for 1986. However
intrastate visitor nights and total building approvals did not increase significantly for 1986
and were therefore experiencing equilibrium trajectories. Both these variables began to
increase the following year, therefore illustrating delayed growth.
5.5.2.4 Did the variables continue to increase through the boom years?
This question addresses whether there were any variables that showed an early end to the
growth period, thereby exhibiting a shorter growth trajectory.
The majority of variables demonstrated growth trajectories which continued until the end of
the boom period. The exceptions were intrastate visitor nights and the number of
establishments. Intrastate visitor nights had only one year of growth, which occurred in the
middle of the boom period. Therefore, in addition to a late start to the growth period,
intrastate visitor nights also experienced an early end to growth. The pattern for the number
of establishments differed. Although this variable also experienced an early end to the
boom period, the number of establishments had increased for the first few years, reaching an
equilibrium trajectory by 1988.

Noreen Breakey Tourism Destination Development
Chapter Five – Destination Case System: A Time-Series Analysis 333
5.5.2.5 Did the variables decline at the end of the boom years, i.e. in
1989?
This question addresses whether all the variables decreased together after the completion of
the boom, or whether some variables were not immediately affected by the negative external
impacts.
Less than half the variables ended their growth period in 1989, at the end of the boom
period. Those that did included total visitors nights, interstate visitors nights, and building
approvals. Total visitor nights and interstate visitation both displayed the same overall
pattern during this six year period, although the total visitor nights were not as extreme in
either the increases or decreases, as interstate visitation. This is due to the effects of
smoothing at the aggregate level, as discussed in Sub-Issue One of the second Research
Issue. Total visitor nights and interstate visitor nights both illustrate three years of growth
during the boom period, followed by decline for 1989. These were the only two variables to
fit the ‘expected pattern’. The other variable which began to decline at the end of the boom
period was building approvals, which had a late start to the growth period.
5.5.2.6 Did any of the variables drop later in ‘The Recession’?
This question addresses whether some variables showed a late end to growth period, thereby
exhibiting a longer growth trajectory.
Only one variable experienced a late change from growth to decline. This was the capacity
of establishments which experienced five years of growth before the decline in 1991, the last
year of the recession period. There are a number of factors which could have affected the
ongoing increase in accommodation capacity despite the downturn in demand. As discussed
in Chapter Four, these factors include the building of accommodation in line with building
activity rather than the demand trend exhibited; the length of time for planning, approval,
commencement and opening of developments; and the level of optimism that surrounded
tourism business activity in the mid 1980s.

Noreen Breakey Tourism Destination Development
Chapter Five – Destination Case System: A Time-Series Analysis 334
5.5.2.7 Did any of the variables continually decrease during ‘The
Recession’?
This question addresses whether there were any variables that declined over the three years
of ‘The Recession’ period, or whether certain variables showed an early end to the decline
period, thereby exhibiting a shorter negative trajectory.
The only variable which exhibited a declining trajectory which extended over the three year
recession period was building approvals. All the other variables displayed different patterns,
as shown in Table 5.1.
In fact only three other variables experienced a decline during the initial year of the
recession period. These were the three categories of visitor nights – total, intrastate,
interstate, and they all increased again for 1990. In the case of total and interstate visitor
nights, the increase continued, with the number of nights in 1991 greater than the boom
years. In contrast intrastate visitor nights began to decline again in 1991.
5.5.2.8 Did any variable(s) not decrease during ‘The Recession’?
This question addresses whether ‘The Recession’ negatively affected all the variables
analysed. This examines whether the overall condition affected all the variables considered.
Two variables continued to grow despite the recession period. These were population and
takings from the hotel sector. These variables both increased at an increasing rate over the
entire six year period. Therefore the recession did not halt the rising population growth in
this region. The continual increase in takings in the hotel sector throughout the boom and
the recession periods illustrates that despite fluctuations in visitation and occupancy, and
major events, such as Expo 88 and the Pilot’s Dispute, the yield continued to increase at an
increasing rate.
Another variable did not recede with the recession. The number of establishments in the
hotel sector began an equilibrium trajectory in 1988. This trajectory continued into and
throughout the recession years.

Noreen Breakey Tourism Destination Development
Chapter Five – Destination Case System: A Time-Series Analysis 335
5.5.2.9 Addressing Sub-Issue Two - Trajectory Lengths Differ
The analysis of the trajectories experienced by these variables during the boom and bust
shows that the different variables have responded to the internal and external forces
operating on the Sunshine Coast destination in varying ways.
The responses for the seven questions for each variable (Table 5.3) shows that the total
visitor numbers and interstate visitor numbers followed the same pattern. These two
variables were also the only two that exhibited the expected pattern, of growth through the
boom years and a decline for the beginning of the recession. The other variables did not
decline, or declined earlier or later, or had not experienced growth for the boom years. This
clearly shows the complexity of the change that occurs in tourism-related variables.
The same responses to the seven questions also occurred for the level of takings and
population growth, as these two variables recorded growth for the entire period despite all
the changes. All the other variables responded to the boom and bust period in different
ways.
Table 5.3 Answers to the Seven Boom and Bust Questions for each Variable.
Variable Q 1 Q 2 Q 3 Q 4 Q 5 Q 6 Q 7
Interstate Visitors Yes No No No No No No
Intrastate Visitors Yes Yes Yes Yes No No No
Total Visitors Yes Yes Yes Yes No No No
No. Establishments Yes Yes No No No No No
Capacity Establishments Yes Yes Yes No Yes No No
Takings Yes Yes Yes No No Yes No
Build Approvals Yes No Yes Yes No No Yes
Population Yes Yes Yes No No Yes No
This analysis of the patterns of change for a number of variables during the six years of the
‘Tourism Boom’ and ‘The Recession’ has illustrated that trajectories last for different
periods of time. Even during times of National growth, some local-level tourism-related

Noreen Breakey Tourism Destination Development
Chapter Five – Destination Case System: A Time-Series Analysis 336
variables may experience equilibrium, or even declining trajectories. During times of
National decline, these local-level tourism-related variables may exhibit continual growth,
limited growth, equilibrium, or decline. The duration of the growth, equilibrium, and
declining trajectories as well as the beginning and end years of these trajectories differ. This
supports the second Sub-Issue, that a trajectory does not have a predetermined life.
5.5.3 Sub-Issue Three - Last Stage Not Predictive of Next
The third Sub-Issue states that: the last stage does not predict the next. This Sub-Issue
follows on from the first Sub-Issue, which stated that there is no set pattern for tourism
destination development. If the pattern of change in the period analysed can be any one of
the trajectories of the Multi-Trajectory Model of Tourism Destination Change, or a
combination of these options, then one stage does not automatically follow another. Any of
the trajectory options may occur after the current pattern. In addition, certain trajectories
may take place multiple times during the life of a particular destination variable and others
may never occur.
5.5.3.1 The Boom and Bust Periods
To determine whether the one trajectory precedes another, the six year time frame utilised
for the previous Sub-Issue was chosen, as outlined in Chapter Four. This incorporated a
time when tourism in Australia generally experienced an expansion, the ‘Tourism Boom’,
followed by a downturn, ‘The Recession’. If the ordering of the trajectories was consistent,
such a scenario would be expected to produce a growth trajectory followed by a declining
trajectory across tourism-related variables.
As seen in the discussion of the previous Sub-Issue, all the analysed variables experienced a
positive growth trajectory during at least part of the ‘Tourism Boom’ period, which lasted
from 1986 to 1988. However, there was no set pattern, as variables began the growth phase
in different years, the growth trajectories differed in duration, and relevant for this Sub-
Issue, the subsequent trajectories evident during ‘The Recession’ varied.
This section considers the changes from one type of trajectory to another, and whether
certain changes are consistent across multiple tourism-related variables. The analysis also

Noreen Breakey Tourism Destination Development
Chapter Five – Destination Case System: A Time-Series Analysis 337
considers different types of growth. The growth periods examined in the previous section
are separated into trajectories for the different levels of growth; low growth, high growth,
and growth occurring at a increasing rate.
The focus for this Sub-Issue is the order of the trajectories. This aims to establish whether
one type of trajectory is consistently followed by another, or whether there is no set order to
the changing trajectories. The trajectories for the eight variables during the boom and bust
period were separated into the type of trajectories, and placed in order of occurrence (Table
5.4).
Table 5.4 The Order of the Changing Trajectories During Boom and Bust period.
Variable Trajectory One
Trajectory Two
Trajectory Three
Trajectory Four
Trajectory Five
Intrastate Visitors E HG D HG D
Interstate Visitors HG LG D HG
Total Visitors HG LG D HG
No. Establishments LG E
Capacity Establishments LG HG D
Takings IG
Build Approvals E HG D
Population IG
Legend: HG – High Growth LG – Low Growth IG – Increasing Growth E – Equilibrium D – Decline
This analysis shows that different trajectory orders occurred during the boom and bust
period. As discussed above, the interstate and total visitor numbers follow the same pattern,
and both taking and population continued to grow at an increasing rate.
Analysing the order of the trajectories for the variables that changed trajectories during this
six year period shows that there is no set trajectory order. For example, a low growth
trajectory can be followed by high growth, equilibrium, or even decline. If a variable is

Noreen Breakey Tourism Destination Development
Chapter Five – Destination Case System: A Time-Series Analysis 338
currently in a low growth trajectory, it is therefore not possible to accurately predict which
trajectory will be next.
In addition the current trajectory of one variable is not necessarily the same as other
variables. At the beginning of the boom period the eight variables analysed demonstrated
four different types of trajectories: equilibrium, low growth, high growth, or increasing
growth.
5.5.3.2 Addressing Sub-Issue Three - Last Stage Not Predictive of Next
This analysis of the order of trajectories during the boom and recovery periods shows that
the trajectories for different variables do not occur in a specific order. Individual trajectories
may last for the whole analysis period, or be followed by one of the other trajectories. This
illustrates that the existing trajectory cannot be used to determine the future trajectory.
5.5.4 Addressing Research Issue Three - No Predetermined Pattern
The analysis of the trajectories of the different tourism-related data variables demonstrates
that there is no particular pattern of change in a destination. Various tourism-related
variables experience different trajectories concurrently, and often change to another
trajectory at different times. Therefore an analysis of a particular period involves a complex
array of current and changing trajectories. This supports the third Research Issue, that there
is no predetermined pattern of tourism destination change.
5.6 Addressing the Proposed Multi-Trajectory Model of
Tourism Destination Change
This chapter has presented support for the Research Issues and Sub-Issues of the Multi-
Trajectory Model of Tourism Destination Change through the analysis of tourism-related
data variables within the case tourism system, which incorporates the Sunshine Coast region
within the State and National contexts.

Noreen Breakey Tourism Destination Development
Chapter Five – Destination Case System: A Time-Series Analysis 339
This analysis of the data has demonstrated that increasing the geographical size of the area
analysed can smooth the pattern displayed by the data variable, that the pattern displayed by
total visitor numbers is not representative of all visitor segments or other tourism variables,
and that the pattern displayed by tourism variables does not follow a predetermined pattern,
as one trajectory does not change to another specific trajectory after a defined period of
time.
The demonstration of these Research Issues in the tourism case system analysed shows the
need for the proposed Multi-Trajectory Model of Tourism Destination Change as a means of
usefully investigating change in tourism destinations.

Noreen Breakey Tourism Destination Development
Chapter Five – Destination Case System: A Time-Series Analysis 340

Noreen Breakey Tourism Destination Development
Chapter Six – Conclusion 341
Chapter 6 The Development of a Tourism System at a
Destination - A Conclusion
6.1 Overview of Chapter Six
This chapter reviews the main findings and implications of the study and demonstrates its
contribution to future tourism destination development. The chapter consists of five
sections. The first section considers the resolution of the research questions, explains how
each has been addressed by the study, and considers the research contributions which arose
from these guiding questions. The second section presents the additional research
contributions and their implications for destination planning and management. Outlining
the contributions of this study also resolves the three proposed theses. In concluding, the
limitations of this study are discussed, and further avenues of research suggested.
6.2 Contributions Arising from the Research
Questions
The following discussion illustrates how each of the Research Questions (from Chapter
One), and the Research Issues which result from the proposed Multi-Trajectory Model of
Tourism Destination Change (developed in Chapter Two) have been resolved (Figure 6.1).
Research Aim Theses (Section 1.3)
Research Issues(Section 2.7.1) Resolved Proposed Model Research Questions
(Section 1.3) Resolved
To increase understanding about the ways tourism
destinations develop (Section 1.1)
What concepts within existing theories on the processes of
change are relevant for studying the development of a tourism
destination?
Ch 2
That tourism is a complex system, not amenable to simple
modes of analysis
Ch 6
Although Tourism Change Can Be Analysed At Various Levels, Area
Aggregation Results in Data Smoothing
Multi-Trajectory Model of Tourism
Destination Change (Section 2.7)
There Is No Predetermined Pattern of Tourism Destination Change
Ch 5
Ch 5
Ch 2
Ch 3
Ch 4 & 5
Can a model of the processes of change in a tourism destination
be devised?
Can a body of data be assembled that allows the proposed model to
be applied to a case study tourism destination?
Does the proposed model hold when tested against change in
the tourism case study?
Can the devised and tested model of change in a tourism
destination be used predictively to assist planning and development
of a sustainable tourism destination?
That the observed patterns of tourism destination change can
be understood as the outcome of a multitude of smaller events that have a complex pattern of inter-
relationships
To understand how and why change occurs within a
tourism destination(Section 1.3)
To determine whether tourism destination change occurs as a combination of
equilibrium, gradual evolutionary changes, and
dramatic punctuations caused by the agents of
chaos (Section 2.8)
That the pattern and interaction of the tourism system operates at
varying scales which can be spatial and temporal, and involve
social, economic, and political variables
All Tourism Destination Change Cannot Be
Explained By Total Yearly Visitor Numbers Alone
Ch 5
Figure 6.1 Resolution of the Study’s Research Questions and Research Issues. (Developed from Figure 1.3 and Figure 2.19)

Noreen Breakey Tourism Destination Development
Chapter Six – Conclusion 342
6.2.1 Research Question One
What concepts within existing theories on the processes of change are relevant
for studying the development of a tourism destination?
Chapter Two reviewed four theories on the processes of change that have been applied to
understanding tourism destination development. The existing application of these theories
ranged from extensive, for the Destination Life-Cycle Theory (Table 2.2), to limited, for the
Species Evolution and Punctuated Equilibrium Theories, to the application of the theoretical
concepts, for Chaos Theory. While no individual theory provided a comprehensive model
for studying the complex tourism destination system, each theory provided an array of
important concepts which can be used to further understand destination development. These
concepts and their implications were presented in Table 2.5 (Life-Cycle), Table 2.6 (Species
Evolution), Table 2.7 (Punctuated Equilibrium), and Table 2.8 (Chaos Theory).
Incorporation of these concepts builds on the commonly used Life-Cycle Theory (Butler,
1980), while still ensuring that the important Life-Cycle Theory concepts are kept. This
provides the basis for a more informed and applicable approach to understanding tourism
destination development.
6.2.2 Research Question Two
Can a model of the processes of change in a tourism destination be devised?
Utilising the relevant concepts from the four process of change theories, and the insight
gained from the analysis of literature, a model was devised in Chapter Two: The Multi-
Trajectory Model of Tourism Destination Change (Section 2.7). The underlying premise of
this model is that change can occur at any time, and can be in any direction. That is tourism
is a system that includes most expressions of change theory in a temporally complex way.
Resulting from the model were the three Research Issues of: area aggregation resulting in
data smoothing; destination change is not explained by yearly visitor levels alone; and
there is no predetermined pattern of tourism destination development. This provided a
new approach to examining change at a destination. The focus was on the patterns of
change evident in data variables, which could be analysed in terms of the trajectories and
change points within the pattern. An important aspect of this approach to understanding

Noreen Breakey Tourism Destination Development
Chapter Six – Conclusion 343
tourism destination change was the inclusion of multiple data variables, both tourism
specific, and general growth indicators. Possible relationships between these variables
added greater depth. Testing such a model required the collection of a significant body of
time-series data, its analysis, and presentation.
6.2.3 Research Question Three
Can a body of data be assembled that allows the proposed model to be applied
to a case study tourism destination?
The limited availability of data on tourism variables restricted past descriptions of how
specific tourism destination developed. Since the early 1980s the body of tourism data in
Australia has increased dramatically. As outlined in Chapter Three it is now possible to
collect data at various geographical scales, including national, state, regional and even some
more recent data is available at the local level. Consequently a vast body of data was
assembled on the selected case area for numerous tourism variables, and their sub-
categories, as well as for non-tourism growth indicators. However it must be recognised
that not all aspects of a destination are measurable, and not all theoretically quantifiable
aspects are actually measured. Despite this, the extent of the collection of data provided a
sound basis for testing the proposed model. This also illustrates the availability of an
extensive, albeit not fully comprehensive, range of tourism and general data variables that
can be accessed to understand change in a specific destination.
6.2.4 Research Question Four
Does the proposed model hold when tested against change in the tourism case
study?
The proposed Multi-Trajectory Model of Tourism Destination Change was tested through
the analysis of data from the selected case area in terms of the Research Issues of the model.
These Research Issues and their Sub-Issues were individually tested against the data in
Chapter Five. The case area data supports the Research Issues and therefore the proposed
model. In summary, the complexity present at lower levels and within sub-categories is not

Noreen Breakey Tourism Destination Development
Chapter Six – Conclusion 344
explained by the data pattern of the higher aggregations, and there is no single pattern which
represents the destination’s change, as various data patterns exist. As the Multi-Trajectory
Model of Tourism Destination Change embraces this complexity and variation, it provides a
new and applicable approach to analysing change with a destination.
6.2.5 Research Question Five
Can the devised and tested model of change in a tourism destination be used
predictively to assist planning and development of a sustainable tourism
destination?
An important contribution of this work is the third thesis which states: that tourism is a
complex system, not amenable to simple modes of analysis. The proposed model is
designed around the complexity, dynamism, and uncertainty that occurs in tourism
destinations. Rather than using a theoretical model which may not fit a particular
destination, this model embraces the chaos inherent in the system. Tourism destination
planning needs to accept that destination growth is not a simple and predictable process, and
that both large and apparently small uncontrollable changes in the internal or external
environment can affect destination development. In addition, the complex interrelations
between the components of a tourism destination system, which also incorporates the
external environment, result in a unique combination of factors influencing the direction of a
destination at any given time.
6.3 Contributions and Implications for Destination
Planning and Management
Significant contributions of this study regarding destination change are related to the first
two theses outline in Chapter One (Section 1.3), namely: that the observed patterns of
tourism destination change can be understood as the outcome of a multitude of smaller
events that have a complex pattern of inter-relationships, and secondly: that the pattern
and interaction of the tourism system operates at varying scales which can be spatial
and temporal, and involve social, economic, and political variables. The aspects within
Noreen Breakey Tourism Destination Development
Chapter Six – Conclusion 345
these theses include the complexity within a destination, it’s dynamism, and the multi-layer
destination system (Section 6.3.1) as well as the variety of development patterns at the
destination and sub-destination levels (Section 6.3.2). These contributions provide the basis
for better informed tourism destination planning and management (Section 6.3.3).
6.3.1 The Complex Dynamic Destination System
6.3.1.1 Destination Complexity
This study has illustrated the complexity of tourism destinations. Each destination is
comprised of numerous individual tourism and tourism-related business. This fragmented
industry operates within the local environment, with its physical, political, social, and
cultural dimensions. In turn, the destination is affected by the wider regional, state, national,
and international arenas.
Within the destination, components are connected, some by cooperation, others by
competition, and some by supply chains. This destination complexity is further
compounded by the varying aims of the different stakeholders, both internal and external. In
addition the nature of the systems are such that there is not complete destination
management control. An overall vision and management plan can be developed. However
implementation and success depend upon collaboration, cooperation, or some complex mix
of the two, between the many stakeholders within the destination.
6.3.1.2 Destination Dynamism
In addition to the structural complexity inherent in tourism destination, the situation is
continually in flux (temporal complexity). The historical review of Chapter Four and the
data presented in Chapter Five highlighted this dynamism. The monthly data patterns
showed the variation in visitor numbers, and within this variable, the ongoing changes in the
origin of visitors, their ages/stage of life, their spending, and the type of accommodation
used, which then affects the occupancy levels within the various accommodation providers.
Over and above changing visitor patterns are other incremental and significant changes.
These include new accommodation, changing accessibility, changes in government and new
legislation, environmental changes and natural disasters, changing trends in society and

Noreen Breakey Tourism Destination Development
Chapter Six – Conclusion 346
demographics, fluctuating financial and investment markets, and both planned and
unplanned events. These changes can also occur at the local, regional, national, and
international levels. In addition to the changes themselves, each change can have flow on
effects throughout the destination. Reactions and responses, and the timing of such
responses vary across the destination, furthering complexity.
6.3.1.3 Destination Levels
The application of the proposed Multi-Trajectory Model of Tourism Destination Change to
the various geographical levels of the tourism case area has demonstrated the applicability
of the model at these varying levels. The model can therefore be applied to ‘destinations’ at
the national, state, regional, and local levels. This is an important contribution of the model
as tourism destinations are defined at all these differing levels.
At the national level, marketing activity can be more effectively targeted if it is based on
research on the various source regions and countries, as conducted by the national tourism
body, Tourism Australia. This involves an understanding of the situation in important
markets, including the economic climate and exchange rate, the government outlook and
regulations regarding outbound tourism, as well as social and cultural market preferences for
overseas travel (see for example Tourism Australia, 2004, 2005). This study highlights why
such research is important. However it is vital that such understanding is actually used as
the basis for informed decision making.
At the lower destination levels, this study is also relevant. In the case area analysed in this
work, there exists the ‘destination’ of the Sunshine Coast, which incorporates the three
‘destinations’ of Noosa, Maroochy, and Caloundra. As described in the historical summary
of the development, these local destinations initially developed quite separately.
Additionally each local area is governed by a separate Council, resulting in differing
regulations and council agendas over time. This generates additional complexity for
planning of the local and regional destinations regarding issues of cooperation, commitment,
and consistency. The study shows that different arrangements produce different outcomes.

Noreen Breakey Tourism Destination Development
Chapter Six – Conclusion 347
6.3.1.4 Systems Approach to Destination Change
The Multi-Trajectory Model of Tourism Destination Change incorporates the need for an
even more complex systems approach than that used in this work for the study of tourism
destination development. The level of complexity, its dynamism, and the multiple
destination levels are all addressed by systems thinking. Such an approach provides the
basis for understanding the multitude of components and their interactions, without
oversimplifying the factors involved in destination development.
6.3.2 Destination Change Patterns
6.3.2.1 Varying Destination Change Patterns
As recognised by Butler (1980) the life-cycle model may or may not fit the overall pattern of
development of a particular destination. Despite this acknowledgement the model has been
applied both descriptively and predictively. This has resulted in a belief that destinations
will follow the life-cycle growth pattern. In contrast, this work has shown that when
considering a number of different data variables the gradual S-shaped life-cycle pattern is
not always applicable.
For instance, changes in the overall level of occupancy are very unlikely to follow this
pattern, as they are the result of the dynamic relationship between the number of rooms and
the level of visitation. Occupancy levels may even be higher in the early exploration and
involvement stages as the small number of visitors only require a small supply of rooms. A
large increase in supply is likely to cause a drop in occupancy until the visitor numbers
increase accordingly.
The extensive level of variation in the possible patterns of change for data variables can be
understood in the context of the Species Evolution Theory discussed in Chapter Two. As
shown, one of the main concepts of this theory is that there are five different patterns within
evolutionary change that can occur multiple times and in any order (Tellis & Crawford,
1981) (Figure 2.12). This proposes that there is not one growth process, as defined by the
Life-Cycle Theory, but instead numerous options created by varying combinations of the
five patterns.

Noreen Breakey Tourism Destination Development
Chapter Six – Conclusion 348
This multi-pattern concept provided the base for the Multi-Trajectory Model of Tourism
Destination Change proposed in the conclusion of Chapter Two (Figure 2.16). This model
proposes that the growth pattern of a variable may at times be in a state of complete
‘equilibrium’, undergoing gradual positive or negative ‘evolutionary’ change, or within a
‘chaos’ induced ‘punctuation’ that is causing an immediate, and substantial increase or
decrease in growth. These different trajectories are evident in the change patterns of the
data variables presented in Chapter Five.
The most common form of growth in the Sunshine Coast data appears to be fluctuating
positive and negative evolutionary change, which over the long-term is a positive trend or
equilibrium (see for example Figure 5.3 Number of Hotels, Motels, and Guest Houses;
Figure 5.16 Population; Figure 5.21 Number of Visitor Nights; Figure 5.40 Average Site
Occupancy in Caravan Parks, and Figure 5.43 Visitor Expenditure). However there is also
evidence of punctuated change (see for example Figure 5.7 Number of Rooms in Hotels,
Motels, and Guest Houses). This form of change is addressed by the theory of Punctuated
Equilibrium presented in Chapter Two. A main concept of this theory is that change can
occur in an episodic pattern (Table 2.7).
Such change has been demonstrated for tourism by Carter (2000; 2004). As discussed in
Chapter Two, he proposes that various growth indicators including the level of development
and the number of visitors will increase in a step like pattern. Data on these two variables
for the Sunshine Coast illustrate that this proposition holds for the development indicator but
is not as evident for visitation.
The growth in the number of rooms available in hotels, motels, and guest houses in the
Sunshine Coast region (Figure 5.7) was significantly and suddenly affected by the addition
of new hotels, including the Hyatt Regency Coolum in 1988 and the Sheraton Noosa Resort
in 1990. The addition of the rooms occurred in a step like pattern during the growth period
between 1987 and 1990. This phenomenon is understandable as the opening of a large hotel
will immediately affect the total supply of rooms in the region by the magnitude of the
development. In contrast the pattern displayed by the level of visitation to the Sunshine
Coast has fluctuating periods of both increasing and decreasing numbers with an overall
rising trend, rather than the step wise episodic growth shape (Figure 5.21).

Noreen Breakey Tourism Destination Development
Chapter Six – Conclusion 349
The Multi-Trajectory Model of Tourism Destination Change has incorporated these
concepts, highlighting the various different trajectories that a destination may experience
over time. The above discussion shows that the research aim developed in the work was
met (Section 2.8). Tourism destination change occurs as a combination of equilibrium,
gradual evolutionary changes, and dramatic punctuations caused by the agents of chaos.
6.3.2.2 Variation in Underlying Patterns
The Multi-Trajectory Model of Tourism Destination Change is based on the premise that the
destination growth level is ultimately the culmination of the change patterns of all the
individual companies and products offered. As a result each component of the tourism
system can affect the development of the destination.
This is exemplified by the growth in the supply within an accommodation sector, which is
obviously significantly affected by the addition of one large hotel to the destination. On the
Sunshine Coast, the opening of the 324 room Hyatt Regency Coolum in 1988 changed the
number of regional establishments (Figure 5.3) and more significantly the total number of
rooms available (Figure 5.7).
This basic principle can be applied to different variables, as the overall pattern of a
particular variable is ultimately an aggregate of the change patterns of the categories that
make up the variable. Although the overall pattern may be growth, this may be the result of
a combination of an increase in certain categories of the variable combined with a decline in
others.
On the Sunshine Coast the total number of intrastate visitors decreased in 1988, while Expo
88 was being held in Brisbane. This overall decline was really the combination of an
increase in the number of Queensland visitors aged over 40, with a larger decline in the
number of visitors from Queensland under the age of 40.
The Multi-Trajectory Model of Tourism Destination Change illustrates the need to consider
the many underlying variables and their patterns of change to provide a more detailed
understanding of the complex change within a destination.

Noreen Breakey Tourism Destination Development
Chapter Six – Conclusion 350
6.3.2.3 Not One Destination Pattern
This study has shown that there are differences in destination change patterns. This occurs
both across destination variables and within the sub-categories of individual variables. This
challenges the notion that a destination will simply follow the life-cycle pattern.
Even if the number of visitors to a destination was to follow the classic life-cycle pattern,
data on other variables may generate alternate patterns. For instance, the pattern of visitor
numbers may indicate the ‘maturity phase’ of the life-cycle. At the same time the number of
visitor nights may be rising, due to an increasing average length of stay. Such a situation is
likely to result in higher occupancy levels and ultimately the need for additional
accommodation. This would not be expected if the destination was really in ‘a maturity
phase’. However, further investigation would be required before investment in
accommodation is undertaken. The increase in visitor nights may be occurring for a
particular type of accommodation. In fact there may be a rise in the number of visitors
staying for an extended period in their own property. Investment in a hotel or unit complex
would then be unwise.
This example has highlighted the need to analyse the concurrent destination change patterns
in generating a greater understanding of destination change, as there is not a predetermined
pattern a destination must follow. The Multi-Trajectory Model of Tourism Destination
Change, developed by this work, provides a useful model for such detailed analysis. The
model is therefore an important contribution of this research, not the least because it
demonstrates that tourism is an extremely complex socio-economic phenomenon with
positive and negative outcomes.
6.3.2.4 Multi-Variate Destination Change
This study incorporated a multitude of tourism and growth related variables and has also
considered the patterns produced by the component sub-variables. This has provided the
opportunity to study correlation and interaction between variables. Analysis of the
underlying changes in a destination provides a more detailed understanding of how the
growth occurred and assists in explaining the overall development process. Therefore
understanding the tourism system operating at a destination requires the analysis of multiple
variables that accompany change at a destination.

Noreen Breakey Tourism Destination Development
Chapter Six – Conclusion 351
The Multi-Trajectory Model of Tourism Destination Change proposed by this study is
applicable to various data variables and their sub-categories. This includes both tourism
specific variables, and other indicators of change. The model also suggests a starting point
for the development of a systems analysis strategy for the study of tourism.
6.3.3 Shaping Destination Development
6.3.3.1 Sustainable Tourism Development
This study provides a model on how change occurs in the development of a tourism
destination. This knowledge can be used to assist in achieving more sustainable tourism
destination development.
Developing sustainable tourism that is appropriate for an area necessitates an understanding
of the tourism destination system, in terms of both the internal interactions and the responses
to external influences. Insight into these interactions and responses allows decisions to be
made on the required type, extent and timing of suitable strategic interventions to achieve
the desired tourism development.
Those involved in planning for sustainable tourism require an understanding of change
within tourism destinations. This study provides practical information for tourism planners,
as the model of tourism destination change outlines the variety and magnitude of possible
growth patterns that occur as destinations develop.
6.3.3.2 Identify Changing Trajectories
The Multi-Trajectory Model of Tourism Destination Change can be applied to understand
the change at a destination. Such understanding can then be used to develop a framework
for planning strategic intervention, which therefore allows for management of change.
When the type of change of a particular destination variable progresses to another change
type, a new trajectory is commencing. Tourism planners need to identify this change point
and the new trajectory, as this is the direction that the destination is heading.

Noreen Breakey Tourism Destination Development
Chapter Six – Conclusion 352
6.3.3.3 Encouragement and Prevention
Identifying the current trajectory of change allows tourism planners to understand the
multiple future states that the destination is progressing towards. This allows planners to
assess whether the future state is desirable. If so, this type of change can be encouraged and
supported. However, if the potential future is undesirable, steps can be taken wherever
possible to prevent the future state from occurring. This approach can foster early proactive
prevention. Destination development can thus be shaped.
6.4 Limitations of the Multi-Trajectory Model of
Tourism Destination Change
6.4.1 Time Frame Applicability
Tourism destination change can be analysed at various temporal scales. The Multi-
Trajectory Model of Tourism Destination Change appears to be most applicable in the
medium time frame.
If too short a time frame is used for yearly data, such as three years, the values would just
appear to have the two trajectories, or possibly only one. Such a short measurement period
may indicate yearly trajectory changes, which if inspected over a longer period could simply
be fluctuations within a single overall trajectory. It also may not be possible to distinguish
between gradual or dramatic change as there is no basis for comparison.
At the other end of the spectrum, too long a time frame could conceal trajectory changes
which appear as variation from the overall trend. This is particularly relevant for analysis at
higher geographical levels, such as for national data.
In addition it is important to note that data could generate different patterns if the analysis
time period is changed. Inspection of a longer or shorter pattern of data may generate
alternate trajectories and change points. In the six year analysis conducted in Chapter Five,
a drop for 1990 followed by a rise for 1991 may be two separate trajectories, or one,
depending on the change recorded for 1992.

Noreen Breakey Tourism Destination Development
Chapter Six – Conclusion 353
6.4.2 Application of the Model
As with all theoretical models, if the theorem fits the observed real world then the model is
supported, but not proven (Levy, 1968). The Multi-Trajectory Model of Tourism
Destination Change is supported by the analysis on the case study area, which includes data
from the three Local Areas, the Sunshine Coast region, Queensland and Australia. However
this does not prove the model. Despite this, the findings of this case study provide a useful
framework to hypothesise about the growth of tourism destinations.
6.5 Avenues of Future Research
6.5.1 Why Change Occurs
This study has focused on the patterns of change evident in a range of data variables,
including tourism specific data and general growth indicators, data from different
geographical levels, and sub-categories within data variables. Providing a context for this
time-series data analysis is the qualitative description of tourism destination development
provided in Chapter Four. This study therefore provides the basis for future research into
why these patterns occur.
Such research could focus on understanding the preconditions that allow, encourage,
constrain, or prevent certain patterns of growth. Such knowledge would further assist
destination management planning in refining tourism development.
6.5.2 Economic Theories
Increased understanding of the change within a destination may be generated through the
application of economic concepts and tools. As proposed by Prideaux (1998; 1999a; 2000),
in the development of his Resort Development Spectrum mentioned in Section 1.1, the
equilibrium price points determined by supply and demand change over time and with
destination capacity. Such economic concepts can provide the basis for further research into

Noreen Breakey Tourism Destination Development
Chapter Six – Conclusion 354
the destination change variables, the relationships between them, and the trajectories and
patterns they generate.
6.5.3 Chaos Theory
Greater understanding of the reasons for the change in destination variables can be achieved
by considering a number of concepts offered by Chaos Theory. As discussed in Chapter
Two (Table 2.8) these concepts include the butterfly effect, bifurcations, lock-in effect, and
edge of chaos. Furthering the research conducted by Faulkner and Russell (1997; 1999)
these concepts can be explored to understand the change points, when one trajectory
changes to another.
6.5.4 Agent Theory
As described in the historical summary of tourism development in Chapter Four, individual
and group decisions and actions have significant impact on the direction and extent of
development. The role and impact of these people could be further understood by applying
concepts from the recently developed agent theory. This theory offers insights into the
various types and roles of particular agents. In tourism destinations such agents could
include local government, local associations, and developers.
6.5.5 Recent Destination Development
At the time that this study was initially planned tourism data collection in Australia had
recently changed. In order to collect time-series data over an extended period it was
necessary to use the pre 1998 measurements. This also provided the opportunity to analyse
destination change from the beginning of tourism data collection in the various levels of the
case area, thereby generating an historical understanding of the destination system.
As time has passed, it would now be possible to collect and analyse the tourism time-series
data from 1998 onward. This would provide further opportunities for model development to

Noreen Breakey Tourism Destination Development
Chapter Six – Conclusion 355
better understand the recent changes in the tourism case area. Such research could
determine whether the trends identified in this study continued into the 21st Century.
In addition, the impact on the various destination levels by more recent events, such as
September 11, the War on Terror, the Bali bombings, SARS, and the Asian Tsunami could
be analysed. This would link into the current and growing interest in crises and turbulence
in society, and the subsequent effects on tourism development and travel (Faulkner, 2001;
Glaesser, 2003; Prideaux et al., 2003; Butler, 2004).
6.5.6 Relationships within Destinations
Further investigation could be undertaken of the relations between components of tourism
destinations. A theme that has emerged from this work has been the relationship between
positive building and investment periods, and the construction of tourist accommodation.
This appears to have impacted on the timing, extent, and type of development undertaken.
There appears to be less correlation with accommodation provision, and the trends in
visitation and the types of accommodation used and needed. Such detailed research into
particular aspects of a destination could yield greater understanding of how the system
operates, and highlight opportunities to adjust the system to increase financial sustainability.
6.6 Conclusion
“Theories are nets cast to catch what we call ‘the world’: to rationalise, to explain, and to
master it. We endeavour to make the mesh ever finer and finer” (Popper, 1959 p.59).
Tourism is a relatively young discipline so it was reasonable to initially borrow theories of
change from other disciplines to explain tourism destination development. This study has
shown the limitations of these early destination models, and the need for a model which was
developed specifically for tourism, and which incorporates the increasingly complex and
dynamic role of tourism in the modern world. While utilising concepts on the process of
change from a variety of disciplines, the Multi-Trajectory Model of Tourism Destination
Change has the benefit of having been developed from a study within the discipline of
tourism. This devised and tested model best captures the issues of tourism destination

Noreen Breakey Tourism Destination Development
Chapter Six – Conclusion 356
development and is a more sophisticated representation of the models of Butler (1980),
QTTC and Boeing (1981), Prideaux (1998; 1999a; 2000), Russell and Faulkner (1999), and
Carter (2000; 2004). This study has developed destination change theory, providing a basis
for the reality of tourism planning for a sustainable future, thus making the net of knowledge
finer.

Noreen Breakey Tourism Destination Development
References 357
List of References
Abel, T 1998, 'Complex Adaptive Systems, Evolutionism, and Ecology within Anthropology: Interdisciplinary Research for Understanding Cultural and Ecological Dynamics', Georgia Journal of Ecological Anthropology, vol. 2, pp. 6-29. ---- 2000, 'Ecosystems, Sociocultural Systems, and Ecological Economics for Understanding Development: The Case of Ecotourism on the Island of Bonaire, N.A.' PhD thesis, University of Florida. Abell, DF 1980, Defining the Business: The Starting Point of Strategic Planning, Prentice-Hall, Englewood Cliffs, New Jersey. Abell, DF & Hammond, JS 1979, Strategic Market Planning: Problems and Analytical Approaches, Prentice-Hall, Englewood Cliffs, New Jersey. Abraham, FD 1995, 'Introduction to Dynamics: A Basic Language; a Basic Metamodeling Strategy', in FD Abraham & AR Gilgen (eds), Chaos Theory in Psychology, Greenwood Press, Westport, Connecticut, pp. 31-50. Abraham, R 1991, 'Complex Dynamical Systems Theory: Historical Origins, Contemporary Application', in E Laszlo (ed.), The New Evolutionary Paradigm, Gordon and Breach Science Publishers, New York, pp. 1-10. Ackoff, RL 1972, 'Towards a System of System Concepts', in J Beishon & G Peters (eds), Systems Behaviour, Harper & Row, London, pp. 83-9. Agarwal, S 1994, 'The Resort Cycle Revisited: Implications for Resorts', in CP Cooper & A Lockwood (eds), Progress in Tourism, Recreation and Hospitality Management, John Wiley & Sons, Chichester, vol. 5, pp. 194-208. ---- 1997, 'The Resort Cycle and Seaside Tourism: An Assessment of Its Applicability and Validity', Tourism Management, vol. 18, no. 2, pp. 65-73. Aldrich, H, McKelvey, B & Ulrich, D 1984, 'Design Strategy from the Population Perspective', Journal of Management, vol. 10, no. 1, pp. 67-86. Allport, FH 1962, 'A Structuronomic Conception of Behavior: Individual and Collective', Journal of Abnormal and Social Psychology, vol. 64, no. 1, pp. 3-30. Angell, E 2001, 'The Mystery Firestorm That Swept a Street', The Courier-Mail, November 30, p. 3. Archer, B, Jafari, J & Wall, G 1996, 'Introduction', in L Briguglio, B Archer, J Jafari & G Wall (eds), Sustainable Tourism in Islands and Small States: Issues and Policies, Pinter, London, pp. 1-5.

Noreen Breakey Tourism Destination Development
References 358
Archer, BH & Lawson, FR 1982, 'Trends in Tourism Planning and Development', Tourism Management, vol. 3, no. 4, pp. 206-7. Artigiani, R 1991, 'Social Evolution: A Nonequilibrium Systems Model', in E Laszlo (ed.), The New Evolutionary Paradigm, Gordon and Breach Science Publishers, New York, pp. 93-129. Ashby, WR 1956, An Introduction to Cybernetics, John Wiley & Sons Inc, New York. Assael, H 1987, Consumer Behaviour and Marketing Action, 3rd edn, PWS-Kent & Nelson, California. Astley, WG 1985, 'The Two Ecologies: Population and Community Perspectives on Organizational Evolution', Administrative Science Quarterly, vol. 30, no. 2, pp. 224-41. Astley, WG & Van de Ven, AH 1983, 'Central Perspectives and Debates in Organization Theory', Administrative Science Quarterly, vol. 28, no. 2, pp. 245-73. Atherton, TC & Atherton, TA 1998, Tourism, Travel and Hospitality Law, LBC Information Services, Sydney. Australian Labor Party 1983, Tourism: An Australian Labor Party Policy Document, The Australian Labor Party's New Direction for Queensland, The Labor Party, Queensland Branch, Brisbane. Australian State of the Environment Committee 2001, Australia, State of the Environment 2001: Independent Report to the Commonwealth Minister for the Environment and Heritage, CSIRO Publishing, Melbourne. Barker, A 1992, What Happened When: A Chronology of Australia 1788-1990, Allen & Unwin, Sydney. Barr, T 1990a, 'From Quirky Islanders to Entrepreneurial Magnates: The Transition of the Whitsundays', The Journal of Tourism Studies, vol. 1, no. 2, pp. 26-32. ---- 1990b, No Swank Here? The Development of the Whitsundays as a Tourist Destination to the Early 1970s, Studies in North Queensland History, James Cook University. Basch, AJ & Bull, AO 1988, Research Report: Labour Force Needs Survey - Gold Coast, Sunshine Coast, Whitsunday Regions, Queensland Agricultural College, Gatton. Baud-Bovy, M 1982, 'New Concepts in Planning for Tourism and Recreation', Tourism Management, vol. 3, no. 4, pp. 308-13. Baum, T 1998, 'Tourism Marketing and the Small Island Environment', in E Laws, B Faulkner & G Moscardo (eds), Embracing and Managing Change in Tourism: International Case Studies, Routledge, London, pp. 116-37.

Noreen Breakey Tourism Destination Development
References 359
Beaumont, N 1997, 'Perceived Crowding as an Evaluative Standard for Determining Social Carrying Capacity in Tourist Recreation Areas: The Case of Green Island, North Queensland', in CM Hall, J Jenkins & G Kearsley (eds), Tourism Planning and Policy in Australia and New Zealand: Cases, Issues and Practice, McGraw-Hill, Roseville NSW, pp. 168-80. Beeton, RJS, Horneman, L & Hardy, A 1997, Tourism as an Information System,Unpublished Report, School of Natural and Rural Systems Management, University of Queensland. Beishon, J & Peters, G 1972, 'Introduction: Systems and Systems Behaviour', in System Behaviour, The Open University Press, London, pp. 11-2. Berry, E 2000, 'An Application of Butler's (1980) Tourist Area Life Cycle Theory to the Cairns Region, Australia 1876-1998', PhD thesis, James Cook University of North Queensland. Bianchi, R 1994, 'Tourism Development and Resort Dynamics: An Alternative Approach', Progress in Tourism, Recreation and Hospitality Management, vol. 5, pp. 181-93. Black, J 2002, A Dictionary of Economics, Oxford University Press, Oxford. Blaikie, N 2000, Designing Social Research, Polity Press, Cambridge. Board, C, Brunsden, D, Gerrard, J, Morgan , BS, Morley, CD & Thornes, JB 1978, 'Leisure and the Countryside: The Example of the Dartmoor National Park', in J Blunden, P Haggett, C Hamnett & P Sarre (eds), Fundamentals of Human Geography: A Reader, Harper & Row in association with Open University Press, London, pp. 44-52. Bodewes, TGW 1981, 'Development of Advanced Tourism Studies in Holland', Annals of Tourism Research, vol. 8, no. 1, pp. 35-51. Boeing 1986, Tourism Potential in Queensland to the Year 2000, Boeing Commercial Airplane Company, Seattle. Boers, H & Bosch, M 1994, The Earth as a Holiday Resort: An Introduction to Tourism and the Environment, Institute of Tourism and Transport Studies, Urtrecht, The Netherlands. Bonnett, J 1982, 'Implications of Marketing and Promotion for the Development of Tourism', Tourism Management, vol. 3, no. 4, pp. 242-7. Bonoma, TV 1985, The Marketing Edge: Making Strategies Work, Free Press, New York. Boo, E 1991, 'Planning for Ecotourism', Parks, vol. 2, no. 3, pp. 4-8. Boulding, KE 1956, 'General Systems Theory: The Skeleton of Science', General Systems,vol. 1, pp. 11-7. Bouma, GD 2000, The Research Process, Oxford University Press, Oxford.

Noreen Breakey Tourism Destination Development
References 360
Bradbury, J 2003, 'Community', in I McLean & A McMillan (eds), The Concise Oxford Dictionary of Politics, Oxford University Press, Oxford. Bramwell, B & Sharman, A 1999, 'Collaboration in Local Tourism Policymaking', Annals of Tourism Research, vol. 26, no. 2, pp. 392-415. Brannen, J 1992, 'Combining Qualitative and Quantitative Approaches: An Overview', in J Brannen (ed.), Mixing Methods: Qualitative and Quantitative Research, Avebury, Aldershot, pp. 3-38. Briassoulis, H 2000, 'Environmental Impacts of Tourism: A Framework for Analysis and Evaluation', in H Briassoulis & J van der Straaten (eds), Tourism and the Environment: Regional, Economic, Cultural and Policy Issues, Kluwer Academic Publishers, Dordrecht, Netherlands, pp. 21-38. Briassoulis, H & van der Straaten, J 2000, 'Tourism and the Environment: An Overview', in H Briassoulis & J van der Straaten (eds), Tourism and the Environment: Regional, Economic, Cultural and Policy Issues, Kluwer Academic Publishers, Dordrecht, Netherlands, pp. 1-20. Briggs, J & Peat, FD 1989, Turbulent Mirror: An Illustrated Guide to Chaos Theory and the Science of Wholeness, Harper & Row, New York. Briguglio, L 1996, 'Preface', in L Briguglio, B Archer, J Jafari & G Wall (eds), Sustainable Tourism in Islands and Small States: Issues and Policies, Pinter, London, pp. xii-xiii. Brown, K, Adger, WN, Tompkins, E, Bacon, P, Shim, D & Young, K 2001, 'Trade-Off Analysis for Marine Protected Area Management', Ecological Economics, vol. 37, no. 3, pp. 417-34. Brown, PJ, Driver, BL & McConnell, C 1978, 'The Opportunity Spectrum Concept and Behavioral Information in Outdoor Recreation Resource Supply Inventories: Background and Application', in GH Lund, VJ LaBau, PF Folliott & DW Robinson (eds), Integrated Inventories of Renewable Natural Resources: Proceedings of the Workshop, Rocky Mountain Forest and Range Exp. Station, Fort Collins, Colorado, vol. RM-55, pp. 73-84. Bryman, A 1992, 'Quantitative and Qualitative Research: Further Reflections on Their Integration', in J Brannen (ed.), Mixing Methods: Qualitative and Quantitative Research,Avebury, Aldershot, pp. 57-78. Buckley, R & Pannell, J 1990, 'Environmental Impacts of Tourism and Recreation in National Parks and Conservation Reserves', The Journal of Tourism Studies, vol. 1, no. 1, pp. 24-32. Buhalis, D 2000, 'Marketing the Competitive Destination of the Future', Tourism Management, vol. 21, no. 1, pp. 97-116. Burkart, AJ & Medlik, S 1981, Tourism: Past, Present and Future, 2nd edn, Heinemann, London.

Noreen Breakey Tourism Destination Development
References 361
Burlingame, GM, Fuhriman, A & Barnum, KR 1995, 'Group Therapy as a Nonlinear Dynamical System: Analysis of Therapeutic Communications for Chaotic Patterns', in FD Abraham & AR Gilgen (eds), Chaos Theory in Psychology, Greenwood Press, Westport, Connecticut, pp. 73-86. Burns, P 1999, 'Paradoxes in Planning: Tourism Elitism or Brutalism?' Annals of Tourism Research, vol. 26, no. 2, pp. 329-48. Bushell, R, Prosser, GM, Faulkner, HW & Jafari, J 2001, 'Tourism Research in Australia', Journal of Travel Research, vol. 39, no. 3, pp. 323-6. Butler, B, Butler, D & Isaacs, A (eds) 1997, A Dictionary of Finance and Banking, Oxford University Press, Oxford. Butler, RW 1980, 'The Concept of a Tourist Area Cycle of Evolution: Implications for Management of Resources', Canadian Geographer, vol. 24, no. 1, pp. 5-12. ---- 1990, 'Alternative Tourism: Pious Hope or Trojan Horse?' Journal of Travel Research,vol. 28, no. 3, pp. 40-5. ---- 1991, 'Tourism, Environment and Sustainable Development', Environmental Conservation, vol. 18, no. 3, pp. 201-9. ---- 1993, 'Tourism: An Evolutionary Perspective', in JG Nelson, RW Butler & G Wall (eds), Tourism and Sustainable Development: Monitoring, Planning, Managing, University of Waterloo, Canada, pp. 27-43. ---- 1997, 'The Concept of Carrying Capacity for Tourism Destinations: Dead or Merely Buried?' in CP Cooper & S Wanhill (eds), Tourism Development: Environmental and Community Issues, John Wiley & Sons, Chichester, pp. 11-21. ---- 1998, 'Sustainable Tourism: Looking Backwards in Order to Progress?' in CM Hall & AA Lew (eds), Sustainable Tourism: A Geographical Perspective, Longman, Harlow, UK, pp. 25-34. ---- 1999, 'Problems and Issues of Integrating Tourism Development', in DG Pearce & RW Butler (eds), Contemporary Issues in Tourism Development, Routledge, London, pp. 65-80. ---- 2000, 'Tourism and the Environment: A Geographical Perspective', Tourism Geographies, vol. 2, no. 3, pp. 337-58. ---- 2004, 'Geographical Research on Tourism, Recreation and Leisure: Origins, Eras and Directions', Tourism Geographies, vol. 6, no. 2, pp. 143-62. Butler, RW & Waldbrook, LA 1991, 'A New Planning Tool: The Tourism Opportunity Spectrum', The Journal of Tourism Studies, vol. 2, no. 1, pp. 2-14. Calhoun, C (ed.) 2002, Dictionary of the Social Sciences, Oxford University Press, Oxford. Carlsen, J 1999, 'A Systems Approach to Island Tourism Destination Management', Systems Research and Behavioral Science, vol. 16, no. 4, pp. 321-8.

Noreen Breakey Tourism Destination Development
References 362
Carter, RW 2000, 'Cultural Change and Tourism: Towards a Prognostic Model', PhD thesis, The University of Queensland. ---- 2004, 'Implications of Sporadic Tourism Growth: Extrapolation from the Case of Boracay Island, the Philippines', Asia Pacific Journal of Tourism Research, vol. 9, no. 4, pp. 383-404. Carter, RW & Beeton, RJS 2004, 'A Model of Cultural Change and Tourism', Asia Pacific Journal of Tourism Research, vol. 9, no. 4, pp. 423-42. Cato, N 1989, The Noosa Story: A Study in Unplanned Development, The Jacaranda Press. Chadwick, G 1971, A Systems View of Planning: Towards a Theory of the Urban and Regional Planning Process, Pergamon Press, Oxford. Chadwick, RA 1987, 'Concepts, Definitions and Measures Used in Travel and Tourism Research', in JRB Ritchie & CR Goeldner (eds), Travel, Tourism, and Hospitality Research,John Wiley & Sons, New York, pp. 47-60. Chambers, J 1999, A Traveller's History of Australia, 2nd edn, A Traveller's History, The Windrush Press, Gloucestershire. Chatfield, C 1989, The Analysis of Time Series: An Introduction, Chapman and Hall, London. Checkland, PB 1972, 'A Systems Map of the Universe', in J Beishon & G Peters (eds), Systems Behaviour, The Open University Press, London, pp. 50-5. Cho, B-H 2000, 'Destination', in J Jafari (ed.), Encyclopedia of Tourism, Routledge, London, pp. 144-5. Chomsky, N 1966, Cartesian Linguistics: A Chapter in the History of Rationalist Thought,Harper & Row, New York. Choy, DJL 1992, 'Life Cycle Models for Pacific Island Destinations', Journal of Travel Research, vol. 30, no. 3, pp. 26-31. Cilliers, P 1995, 'Postmodern Knowledge and Complexity (or Why Anything Does Not Go)', South African Journal of Philosophy, vol. 14, no. 3, pp. 124-32. ---- 1998, Complexity and Postmodernism: Understanding Complex Systems, Routledge, London. Clark, RN & Stankey, GH 1979, The Recreation Opportunity Spectrum: A Framework for Planning, Management and Research, U.S. Dept. of Agriculture, Forest Service, Pacific Northwest Forest and Range Experiment Station, Portland, Orlando. Clarke, J 1997, 'A Framework of Approaches to Sustainable Tourism', Journal of Sustainable Tourism, vol. 5, no. 3, pp. 224-33.

Noreen Breakey Tourism Destination Development
References 363
Cockerell, N 1997, 'Urban Tourism in Europe', Travel and Tourism Analyst, no. 6, pp. 44-67. Cockerell, N & Muqbil, I 1998, The Fall-out from the Asian Economic Crisis, Occasional Paper Number 22, Pacific Asia Travel Association. Cohen, E 1972, 'Towards a Sociology of International Tourism', Social Research, vol. 39, no. 1, pp. 164-82. ---- 1979, 'Rethinking the Sociology of Tourism', Annals of Tourism Research, vol. 6, no. 1, pp. 18-35. ---- 1982, 'Marginal Paradises - Bungalow Tourism on the Islands of Southern Thailand', Annals of Tourism Research, vol. 9, no. 2, pp. 189-228. Collins, A 1999, 'Tourism Development and Natural Capital', Annals of Tourism Research,vol. 26, no. 1, pp. 98-109. Cooper, C 1989, 'Tourist Product Life Cycle', in SF Witt & L Moutinho (eds), Tourism Marketing and Management Handbook, Prentice Hall, New York, pp. 577-81. ---- 1990, 'Resorts in Decline - the Management Response', Tourism Management, vol. 11, no. 1, pp. 63-7. ---- 1992, 'The Life Cycle Concept and Strategic Planning for Coastal Resorts', Built Environment, vol. 18, no. 1, pp. 57-66. ---- 1994, 'The Destination Life Cycle: An Update', in AV Seaton, CL Jenkins, RC Wood, PUC Dieke, MM Bennett & LR MacLellan (eds), Tourism: The State of the Art, John Wiley & Sons, Chichester, pp. 340-6. ---- 1997, 'Parameters and Indicators of the Decline of the British Seaside Resort', in G Shaw & A Williams (eds), The Rise and Fall of British Coastal Resorts: Cultural and Economic Perspectives, Mansell, London, pp. 79-101. Cooper, C & Jackson, S 1989, 'Destination Life Cycle: The Isle of Man Case Study', Annals of Tourism Research, vol. 16, no. 3, pp. 377-98. Cooper, C, Fletcher, J, Gilbert, D & Wanhill, S 1993, Tourism: Principles and Practice,Pitman Publishing, London. Cooper, C, Fletcher, J, Gilbert, D, Shepherd, R & Wanhill, S 1998, Tourism: Principles and Practice, 2nd edn, Longman, London. Coppock, JT 1982, 'Tourism and Conservation', Tourism Management, vol. 3, no. 4, pp. 270-6. Craik, J 1991, Resorting to Tourism: Cultural Policies for Tourist Development in Australia,Allen & Unwin, Sydney.

Noreen Breakey Tourism Destination Development
References 364
Csanyi, V 1989, Evolutionary Systems and Society: A General Theory of Life, Mind, and Culture, Duke University Press, Durham. Dann, S & Dann, S 2004, Introduction to Marketing, John Wiley & Sons Australia, Ltd, Milton, Queensland. Dann, SJ & McMoll-Kennedy, JR 1992, Marketing: Concepts and Strategies. Instructor's Manual, Thomas Nelson Australia, Melbourne. Davidson, J & Spearritt, P 2000, Holiday Business: Tourism in Australia since 1870,Melbourne University Press, Melbourne. Davis, HD & Simmons, JA 1982, 'World Bank Experience with Tourism Projects', Tourism Management, vol. 3, no. 4, pp. 212-7. Day, GS 1981, 'The Product Life Cycle: Analysis and Applications Issues', Journal of Marketing, vol. 45, no. 4, pp. 60-7. de Kadt, E (ed.) 1979, Tourism - Passport to Development: Perspectives on the Social and Cultural Effects of Tourism in Developing Countries, Oxford University Press, New York. Debbage, KG 1990, 'Oligopoly and the Resort Cycle in the Bahamas', Annals of Tourism Research, vol. 17, no. 4, pp. 513-27. Denzin, NK & Lincoln, YS 2000, 'Introduction: The Discipline and Practice of Qualitative Research', in NK Denzin & YS Lincoln (eds), Handbook of Qualitative Research, 2nd edn, Sage Publications, California, pp. 1-28. Department of Environment and Heritage 2004, Flowchart of the Referral, Assessment and Approval Process under the Epbc Act, viewed 15 August 2004, <http://www.deh.gov.au/epbc/assessmentsapprovals/flowchart.html>.
Department of Local Government and Planning 2004, Integrated Planning Act: Overview,viewed 15 August 2004, <http://www.ipa.qld.gov.au/overview/default.asp>.
Department of Sport Recreation and Tourism 1985, Tourism Overseas Promotion Scheme: Guidelines, Australian Government Publishing Service, Canberra. Dhalla, NK & Yuspeh, S 1976, 'Forget the Product Life Cycle Concept!' Harvard Business Review, vol. 54, no. 1, pp. 102-12. di Benedetto, CA & Bojanic, DC 1993, 'Tourism Area Life Cycle Extensions', Annals of Tourism Research, vol. 20, no. 3, pp. 557-70. Digance, J 1997, 'Life Cycle Model', Annals of Tourism Research, vol. 24, no. 2, pp. 452-5. Douglas, N 1994, 'They Came for Savages: A Comparative History of Tourism Development in Papua New Guinea, Solomon Islands and Vanuatu, 1884-1984', PhD thesis, University of Queensland.

Noreen Breakey Tourism Destination Development
References 365
---- 1997, 'Applying the Life Cycle Model to Melanesia', Annals of Tourism Research, vol. 24, no. 1, pp. 1-22. Dowling, RK 1992, 'Tourism and Environment Integration: The Journey from Idealism to Realism', Progress in Tourism, Recreation and Hospitality Management, vol. 4, pp. 33-46. ---- 1993, 'An Environmentally Based Approach to Tourism Planning', PhD thesis, Murdoch University. Doxey, GV 1976, 'When Enough's Enough: The Natives Are Restless in Old Niagara', Heritage Canada, vol. 2, no. 2, pp. 26-7. Doyle, T 2000, 'The Campaign to Save the Wet Tropics', in G McDonald & M Lane (eds), Securing the Wet Tropics, The Federation Press, Annandale, NSW. Driml, S 2000, 'Ecotourism: Opportunities and Threats', in G McDonald & M Lane (eds), Securing the Wet Tropics, The Federation Press, Annandale, NSW. Dubin, R 1969, Theory Building, The Free Press, New York. Duffield, BS 1982, 'Tourism: The Measurement of Economic and Social Impact', Tourism Management, vol. 3, no. 4, pp. 248-55. Dunlop, S 2001, A Dictionary of Weather, Oxford University Press, Oxford. Easdown, G & Wilms, P 2002, Ansett: The Collapse, Lothian Books, Melbourne. Easton, G 1992, Learning from Case Studies, 2nd edn, Prentice Hall, London. Eber, S (ed.) 1992, Beyond the Green Horizon: Principles for Sustainable Tourism, World Wide Fund for Nature UK, Godalming, England. Edwards, D 2001, Country and Coast: A History of the Development of the Noosa Shire,Denise Edwards, Noosa Heads. El Kahal, S 2001, Business in Asia Pacific: Text and Cases, Oxford University Press, Oxford. Eldredge, N 1972, Macroevolutionary Dynamics: Species, Niches, and Adaptive Peaks,McGraw-Hill Publishing, New York. ---- 1986, Time Frames: The Rethinking of Darwinian Evolution and the Theory of Punctuated Equilibria, Heineman, London. ---- 1995, Reinventing Darwin: The Great Debate at the High Table of Evolutionary Theory,John Wiley & Sons, New York. Eldredge, N & Gould, SJ 1972, 'Punctuated Equilibria: An Alternative to Phyletic Gradualism', in TJM Schopf (ed.), Models in Paleobiology, Freeman, Cooper & Company, San Francisco, pp. 82-115.

Noreen Breakey Tourism Destination Development
References 366
Elliott, E & Kiel, LD 1997, 'Introduction', in LD Kiel & E Elliott (eds), Chaos Theory in the Social Sciences: Foundations and Applications, The University of Michigan Press, Ann Arbor, pp. 1-15. Erickson, SL & King, BJ 1999, Fundamentals of Environmental Management, John Wiley & Sons Inc, New York. Farrell, BH & McLellan, RW 1987, 'Tourism and Physical Environment Research', Annals of Tourism Research, vol. 14, no. 1, pp. 1-16. Faulkner, B 1998, 'Tourism Development Options in Indonesia and the Case of Agro-Touirsm in Central Java', in E Laws, B Faulkner & G Moscardo (eds), Embracing and Managing Change in Tourism: International Case Studies, Routledge, London, pp. 202-21. ---- 2001, 'Towards a Framework for Tourism Disaster Management', Tourism Management,vol. 22, no. 2, pp. 135-47. Faulkner, B & Russell, RA 1997, 'Chaos and Complexity in Tourism: In Search of a New Perspective', Pacific Tourism Review, vol. 1, no. 2, pp. 93-102. Fletcher, J 2005, 'Sustainable Tourism', in C Cooper, J Fletcher, A Fyall, D Gilbert & S Wanhill (eds), Tourism: Principles and Practice, 3rd edn, Financial Times Prentice Hall, Harlow, England, pp. 258-90. Flood, RL & Jackson, MC 1991a, Creative Problem Solving: Total Systems Intervention,John Wiley & Sons Ltd, Chichester, England. ---- 1991b, 'Preface', in Critical Systems Thinking: Directed Readings, John Wiley & Sons Ltd, Chichester, England, pp. xv-xvi. Foley, M, Lennon, JJ & Maxwell, GA 1997, Hospitality, Tourism and Leisure Management: Issues in Strategy and Culture, Cassell, London. Formica, S & Uysal, M 1996, 'The Revitalization of Italy as a Tourist Destination', Tourism Management, vol. 17, no. 5, pp. 323-31. Foster, DM & Murphy, PE 1991, 'Resort Cycle Revisited - the Retirement Connection', Annals of Tourism Research, vol. 18, no. 4, pp. 553-67. France, L 1991, An Overview of Tourism in the Caribbean, Centre for Travel and Tourism, Sunderland, UK. Francois, C 1999, 'Systemics and Cybernetics in a Historical Perspective', Systems Research and Behavioural Science, vol. 16, no. 3, pp. 203-25. Fraser, BW 1993, Long-Run Economic Growth and Human Capital, Reserve Bank of Australia. Garnsey, JM 1984, 'Queensland and Brisbane as a Focus for Advertising Strategies and the Games', paper presented to The 1982 Commonwealth Games: A Retrospect, Brisbane.

Noreen Breakey Tourism Destination Development
References 367
Gersick, CJG 1988, 'Time and Transition in Work Teams: Towards a New Model of Group Development', Academy of Management Journal, vol. 31, no. 1, pp. 9-41. ---- 1991, 'Revolutionary Change Theories: A Multilevel Exploration of the Punctuated Equilibrium Paradigm', Academy of Management Review, vol. 16, no. 1, pp. 10-36. Getz, D 1986, 'Models in Tourism Planning: Towards Integration of Theory and Practice', Tourism Management, vol. 7, no. 1, pp. 21-32. ---- 1992, 'Tourism Planning and the Destination Life Cycle', Annals of Tourism Research,vol. 19, no. 4, pp. 752-70. Gilgen, AR 1995, 'A Search for Bifurcations in the Psychological Domain', in FD Abraham & AR Gilgen (eds), Chaos Theory in Psychology, Greenwood Press, Westport, Connecticut, pp. 139-44. Glaesser, D 2003, Crisis Management in the Tourism Industry, Elsevier Butterworth-Heinemann, Oxford. Glasson, J, Therivel, R & Chadwick, A 1999, Introduction to Environmental Impact Assessment, 2nd edn, The Natural and Built Environment, UCL Press Limited, London. Gleick, J 1987, Chaos: Making a New Science, Penguin Books, New York. Gloster, M 1997, The Shaping of Noosa, Noosa Blue Publishing Group, Noosa Heads. Go, FM 1997, 'Asian and Australasian Dimensions of Global Tourism Development', in FM Go & CL Jenkins (eds), Tourism and Economic Development in Asia and Australasia,Cassell, London, pp. 3-34. Goerner, SJ 1995, 'Chaos and Deep Ecology', in FD Abraham & AR Gilgen (eds), Chaos Theory in Psychology, Greenwood Press, Westport Connecticut, vol. 27, pp. 3-18. Goncalves, VFdC & Aguas, PMR 1997, 'The Concept of Life Cycle: An Application to the Tourist Product', Journal of Travel Research, vol. 36, no. 2, pp. 12-22. Goode, WJ & Hart, PK 1952, Methods in Social Research, McGraw Hill, New York. Gould, SJ 1977, Ever since Darwin, W W Norton & Company, New York. Gould, SJ & Eldredge, N 1977, 'Punctuated Equilibria: The Tempo and Mode of Evolution Reconsidered', Paleobiology, vol. 3, no. 2, pp. 115-51. Gow, DJ & Maher, A 1994, 'Regulation in Theory and Practice', in R Stewart (ed.), Government and Business Relations in Australia, Allen & Unwin Pty Ltd, NSW, pp. 113-29. Gowdy, JM 1990, 'Economic Evolution and Selection: Old Controversies and New Approaches', International Journal of Social Economics, vol. 17, no. 12, pp. 4-13.

Noreen Breakey Tourism Destination Development
References 368
Grey, P & Edelmann, K 1991, Tourism in Queensland: Challenges and Opportunities,Committee for Economic Development of Australia. Griffin, T & Darcy, S 1997, 'Australia: Consequences of the Newly Adopted Pro-Asia Orientation', in FM Go & CL Jenkins (eds), Tourism and Economic Development in Asia and Australasia, Cassell, London, pp. 67-90. Gross, I 1968, Towards a General Theory of Product Evolution: A Rejection of the 'Product Life Cycle' Concept, Marketing Science Institute, Cambridge, Mass. Gunn, CA 1979, Tourism Planning, Crane Russak and Co., New York. ---- 1982, 'Destination Zone Fallacies and Half-Truths', Tourism Management, vol. 3, no. 4, pp. 263-9. ---- 1988, Tourism Planning, 2nd edn, Taylor & Francis, New York. ---- 1994, 'A Perspective on the Purpose and Nature of Tourism Research Methods', in JRB Ritchie & CR Goeldner (eds), Travel, Tourism, and Hospitality Research: A Handbook for Managers and Researchers, 2nd edn, John Wiley & Sons, New York, pp. 3-11. ---- 2004, 'Prospects for Tourism Planning: Issues and Concerns', The Journal of Tourism Studies, vol. 15, no. 1, pp. 3-7. Gunn, CA & Var, T 2002, Tourism Planning: Basics, Concepts, Cases, 4th edn, Routledge, New York. Hall, CM 1991, Introduction to Tourism in Australia: Impacts, Planning and Development,Longman Cheshire Pty Ltd, Melbourne. ---- 1995, Introduction to Tourism in Australia: Impacts, Planning and Development, 2ndedn, Longman Australia Pty Ltd, Melbourne. ---- 1997, 'Introduction: Issues in Tourism Planning and Policy', in CM Hall, J Jenkins & G Kearsley (eds), Tourism Planning and Policy in Australia and New Zealand: Cases, Issues and Practice, McGraw-Hill, Roseville NSW, pp. 16-36. ---- 1998, 'Historical Antecedents of Sustainable Development and Ecotourism: New Labels on Old Bottles?' in CM Hall & AA Lew (eds), Sustainable Tourism: A Geographical Perspective, Longman, Harlow, UK, pp. 13-24. Hall, CM & Butler, RW 1995, 'In Search of Common Ground: Reflections on Sustainability, Complexity and Process in the Tourism System - a Discussion between C. Michael Hall and Richard W. Butler', Journal of Sustainable Tourism, vol. 3, no. 2, pp. 99-105. Hamel, J, Dufour, S & Fortin, D 1993, Case Study Methods, Sage Publications, Newbury Park. Hancock, I 1999, 'The Rise of the Liberal Party', in R Manne (ed.), The Australian Century: Political Struggle in the Building of a Nation, Text Publishing, Melbourne, pp. 119-47.

Noreen Breakey Tourism Destination Development
References 369
Hannan, MT & Freeman, J 1989, Organizational Ecology, Harvard University Press, Cambridge, Massachusetts. Hardy, A & Beeton, RJS 2001, 'Sustainable Tourism or Maintainable Tourism: Managing Resources for More Than Average Outcomes', Journal of Sustainable Tourism, vol. 9, no. 3, pp. 168-92. Hardy, A, Beeton, RJS & Pearson, L 2002, 'Sustainable Tourism: An Overview of the Concept and Its Position in Relation to Conceptualisations of Tourism', Journal of Sustainable Tourism, vol. 10, no. 6, pp. 475-96. Harris, R & Howard, J 1996, Dictionary of Travel, Tourism and Hospitality Terms,Hospitality Press, Melbourne. Harrison, D 1995, 'Development of Tourism in Swaziland', Annals of Tourism Research,vol. 22, no. 1, pp. 135-56. ---- 1996, 'Sustainability and Tourism: Reflections from a Muddy Pool', in L Briguglio, B Archer, J Jafari & G Wall (eds), Sustainable Tourism in Islands and Small States: Issues and Policies, Pinter, London, pp. 69-89. Hart, CW, Casserly, G & Lawless, MJ 1984, 'The Product Life Cycle: How Useful?' The Cornell Hotel and Restaurant Administration Quarterly, vol. 24, no. 3, pp. 54-63. Hawkins, DE 1991, 'Series Foreword', in E Inskeep (ed.), Tourism Planning: An Integrated and Sustainable Development Approach, Van Nostrand Reinhold, New York, pp. xi-xiii. Haywood, KM 1986, 'Can the Tourist-Area Life Cycle Be Made Operational?' Tourism Management, vol. 7, no. 3, pp. 154 -67. ---- 1992, 'Revisiting Resort Cycle', Annals of Tourism Research, vol. 19, no. 2, pp. 351-4. Ho, MW & Saunders, PT 1979, 'Beyond Neo-Darwinism: An Epigenetic Approach to Evolution', Journal of Theoretical Biology, vol. 78, no. 4, pp. 573-91. Holthouse, H 1982, Illustrated History of the Sunshine Coast, AH & AW Reed Pty Ltd, Frenchs Forest, NSW. Hovinen, GR 1981, 'A Tourist Cycle in Lancaster County, Pennsylvania', Canadian Geographer, vol. 25, no. 3, pp. 283-6. ---- 1982, 'Visitor Cycles: Outlook for Tourism in Lancaster County', Annals of Tourism Research, vol. 9, no. 4, pp. 565-83. ---- 2002, 'Revisiting the Destination Lifecycle Model', Annals of Tourism Research, vol. 29, no. 1, pp. 209-30. Hundloe, T 1985, 'The Environment', in A Patience (ed.), The Bjelke-Petersen Premiership 1968-1983 Issues in Public Policy, Longman Cheshire, Melbourne, pp. 81-94.

Noreen Breakey Tourism Destination Development
References 370
Hundloe, T, Neumann, R & Halliburton, M 1988, Great Barrier Reef Tourism, Institute of Applied Environmental Research, Griffith University, Brisbane. Hunt, SD 1976, Marketing Theory: Conceptual Foundations of Research in Marketing,Gridseries in Marketing, Grid Inc, Columbus. Hunter, C 1995, 'On the Need to Re-Conceptualise Sustainable Tourism Development', Journal of Sustainable Tourism, vol. 3, no. 3, pp. 155-65. ---- 1997, 'Sustainable Tourism as an Adaptive Paradigm', Annals of Tourism Research, vol. 24, no. 4, pp. 850-67. Iglesias, E 1972, 'Development and the Human Environment', in Development and Environment: Report and Working Papers of a Panel of Experts Convened by the Secretary-General of the United Nations Conference on the Human Environment (Founex, Switzerland, June 4-12, 1971), pp. 47-65. Inskeep, E 1991, Tourism Planning: An Integrated and Sustainable Development Approach,Van Nostrand Reinhold, New York. Ioannides, D 1992, 'Tourism Development Agents: The Cypriot Resort Cycle', Annals of Tourism Research, vol. 19, no. 4, pp. 711-31. Ison, RL & Russell, DB 2000, Agricultural Extension and Rural Development: Breaking out of Traditions, Cambridge University Press, Cambridge. Ison, RL, Maiteny, PT & Carr, S 1997, 'Systems Methodologies for Sustainable Natural Resources Research and Development', Agricultural Systems, vol. 55, no. 2, pp. 257-72. IUCN, UNEP & WWF 1980, World Conservation Strategy: Living Resource Conservation for Sustainable Development, International Union for Conservation of Nature and Natural Resources (IUCN), United Nations Environment Programme (UNEP) & World Wildlife Fund (WWF). Jackson, G & Morpeth, N 1999, 'Local Agenda 21 and Community Participation in Tourism Policy and Planning: Future or Fallacy', Current Issues in Tourism, vol. 2, no. 1, pp. 1-35. Jafari, J 1987, 'Tourism Models: The Sociocultural Aspects', Tourism Management, vol. 8, no. 2, pp. 151-9. ---- 1990, 'Research and Scholarship: The Basis of Tourism Education', The Journal of Tourism Studies, vol. 1, no. 1, pp. 33-41. Jafari, J & Richie, JRB 1981, 'Towards a Framework for Tourism Education: Problems and Prospects', Annals of Tourism Research, vol. 8, no. 1, pp. 13-34. Jago, L, Fredline, L & Cooper, C 2003, 'Bill Faulkner: Progressing Tourism Research and Beyond', in L Fredline, L Jago & C Cooper (eds), Progressing Tourism Research: Bill Faulkner, Channel View Publications, Clevedon.

Noreen Breakey Tourism Destination Development
References 371
Jamal, TB & Getz, D 1995, 'Collaboration Theory and Community Tourism Planning', Annals of Tourism Research, vol. 22, no. 1, pp. 186-204. Jamal, TB, Stein, SM & Harper, TL 2002, 'Beyond Labels: Pragmatic Planning in Multistakeholder Tourism-Environmental Conflicts', Journal of Planning Education and Research, vol. 22, no. 2, pp. 164-77. Jenkins, L 2001, 'Sunshine Coast Timeline', The Courier-Mail, November 30, p. 2. Johnson, D 2000, Sales and Marketing in the Tourism Industry, McGraw-Hill Companies, Sydney. Johnson, JD & Snepenger, DJ 1993, 'Application of the Tourism Life Cycle Concept in the Greater Yellowstone Region', Society and Natural Resources, vol. 6, no. 2, pp. 127-48. Johnston, CS 2001, 'Shoring the Foundations of the Destination Life Cycle Model, Part 2: A Case Study of Kona, Hawaii Island', Tourism Geographies, vol. 3, no. 2, pp. 135-64. Jones, M 1986, A Sunny Place for Shady People: The Real Gold Coast Story, Allen & Unwin, Sydney. Jordan, N 1981, 'Some Thinking About System', in FE Emery (ed.), Systems Thinking: Selected Readings, Revised edn, Penguin, Harmondsworth, vol. 2, pp. 15-39. Kast, FE & Rosenzweig, JE 1972, 'The Modern View: A Systems Approach', in J Beishon & G Peters (eds), Systems Behaviour, The Open University, London, pp. 14-28. Katz, D & Kahn, RL 1978, The Social Psychology of Organisations, 2nd edn, Wiley, New York. Kearsley, G 1997, 'Managing the Consequences of Overuse by Tourists of New Zealand's Conservation Estate', in CM Hall, J Jenkins & G Kearsley (eds), Tourism Planning and Policy in Australia and New Zealand, McGraw Hill, Roseveill, NSW, pp. 87-98. Keller, CP 1987, 'Stages of Peripheral Tourism Development - Canada's Northwest Territories', Tourism Management, vol. 8, no. 1, pp. 20-32. Kelly, P 1999, 'Labor and Globalisation', in R Manne (ed.), The Australian Century: Political Struggle in the Building of a Nation, Text Publishing, Melbourne, pp. 224-63. Kermath, BM & Thomas, RN 1992, 'Spatial Dynamics of Resorts: Sosua, Dominican Republic', Annals of Tourism Research, vol. 19, no. 2, pp. 173-90. Keys, NHE 1986, 'Tourism Area Evolution in Queensland', Masters thesis, Griffith University. King, B & Hyde, G 1989, Tourism Marketing in Australia, Hospitality Press, Melbourne. King, G, Keohane, RO & Verba, S 1994, Designing Social Inquiry: Scientific Inference in Qualitative Research, Princeton University Press, Princeton.

Noreen Breakey Tourism Destination Development
References 372
Knowles, T & Curtis, S 1999, 'The Market Viability of European Mass Tourist Destination. A Post-Stagnation Life-Cycle Analysis', International Journal of Tourism Research, vol. 1, no. 2, pp. 87-96. Ko, JTG 2001, 'Assessing Progress of Tourism Sustainability', Annals of Tourism Research,vol. 28, no. 3, pp. 817-20. Kotler, P, Bowen, J & Makens, J 1999, Marketing for Hospitality and Tourism, 2nd edn, Prentice-Hall, New Jersey. Kreutzwiser, R 1993, 'Desirable Attributes of Sustainability Indicators for Tourism Development', in JG Nelson, RW Butler & G Wall (eds), Tourism and Sustainable Development: Monitoring, Planning, Managing, University of Waterloo, Canada, pp. 243-7. Krippendorf, J 1986, 'Tourism in the System of Industrial Society', Annals of Tourism Research, vol. 13, no. 4, pp. 517-32. Kurtz, DL & Boone, LE 1984, Marketing, The Dryden Press, New York. Laflamme, A 1979, 'The Impact of Tourism', Annals of Tourism Research, vol. 6, no. 2, pp. 139-48. Laszlo, E 1972, The Systems View of the World: The Natural Philosophy of the New Developments in the Sciences, Basil Blackwell, Oxford. ---- 1991, 'Introduction', in E Laszlo (ed.), The New Evolutionary Paradigm, Gordon and Breach Science Publishers, New York, pp. xix-xxv. Latham, J 1989, 'The Statistical Measurement of Tourism', Progress in Tourism, Recreation and Hospitality Management, vol. 1, pp. 55-76. Leakey, RE 1979, 'Introduction', in The Illustrated Origin of Species, Oxford University Press, Melbourne. Leiper, N 1979, 'The Framework of Tourism: Towards a Definition of Tourism, Tourist, and the Tourist Industry', Annals of Tourism Research, vol. 6, no. 4, pp. 390-407. ---- 1981, 'Towards a Cohesive Curriculum in Tourism - the Case for a Distinct Discipline', Annals of Tourism Research, vol. 8, no. 1, pp. 69-84. ---- 1990, Tourism Systems: An Interdisciplinary Perspective, Massey University, Palmerston North N.Z. ---- 1995, Tourism Management, RMIT Press, Melbourne. Levinson, DJ, Darrow, CN, Klein, EB, Levinson, MH & McKee, B 1978, The Seasons of a Man's Life, Alfred A. Knopf, New York. Levitt, T 1965, 'Exploit the Product Life Cycle', Harvard Business Review, vol. 43, no. 6, pp. 81-95.

Noreen Breakey Tourism Destination Development
References 373
Levy, SG 1968, Inferential Statistics in the Behavioural Sciences, Holt, Rinehart and Winston Inc, New York. Li, T-Y & Yorke, JA 1975, 'Period Three Implies Chaos', American Mathematical Monthly,vol. 82, no. 10, pp. 985-92. Liebovitch, LS 1998, Fractals and Chaos Simplified for the Life Sciences, Oxford University Press, New York. Liu, Z-H 1994a, 'The Environment of Tourism Development: A Systems Study', PhD thesis, Universities of Great Britain and Ireland. ---- 1994b, 'Tourism Development: A Systems Analysis', in AV Seaton, CL Jenkins, RC Wood, PUC Dieke, MM Bennett & LR MacLellan (eds), Tourism: The State of the Art, John Wiley & Sons, Chichester, pp. 20-30. Loether, HJ & McTavish, DG 1988, Descriptive and Inferential Statistics: An Introduction,Allyn and Bacon Inc, Boston. Louw, HA & Smart, A 1998, 'Social Aspects of Tourism and Development', in CA Tisdell & KC Roy (eds), Tourism and Development: Economic, Social, Political and Environmental Issues, Nova Science Publishers, Commack, New York, pp. 69-91. Lovelock, CH, Patterson, PG & Walker, RH 1998, Services Marketing: Australia and New Zealand, Prentice Hall, Sydney. Loye, D 1991, 'Chaos and Transformation: Implications of Nonequilibrium Theory for Social Science and Society', in E Laszlo (ed.), The New Evolutionary Paradigm, Gordon and Breach Science Publishers, New York, pp. 11-31. Lumsdon, L 1997, Tourism Marketing, Tourism and Hospitality Management Series, International Thomson Business Press, London. Lundberg, DE 1990, The Tourist Business, 6th edn, Van Nostrand Reinhold, New York. Lundtorp, S & Wanhill, S 2001, 'The Resort Lifecycle Theory: Generating Processes and Estimation', Annals of Tourism Research, vol. 28, no. 4, pp. 947-64. Lusch, RF & Lusch, VN 1987, Principles of Marketing, Kent Publishing Company, Boston. Machiavelli, A 2001, 'Tourist Destinations as Integrated Systems', Tourism Review, vol. 56, no. 3/4, pp. 6-11. Machlis, GE & Burch, WRJ 1983, 'Relations between Strangers: Cycles of Structure and Meaning in Tourist Systems', The Sociological Review, vol. 31, no. 4, pp. 666-92. Macintyre, S 1999, A Concise History of Australia, Cambridge University Press, Cambridge. Mahoney, JT 1992, 'Organizational Economics within the Conversation of Strategic Management', Advances in Strategic Management, vol. 8, pp. 103-55.

Noreen Breakey Tourism Destination Development
References 374
Malaska, P 1991, 'Economic and Social Evolution: The Transformational Dynamics Approach', in E Laszlo (ed.), The New Evolutionary Paradigm, Gordon and Breach Science Publishers, New York, pp. 131-56. Manne, R 1999, 'Introduction', in R Manne (ed.), The Australian Century: Political Struggle in the Building of a Nation, Text Publishing, Melbourne, pp. 1-10. Manning, EW & Dougherty, TD 1999, 'Planning Tourism in Sensitive Ecosystems', in TV Singh & S Singh (eds), Tourism Development in Critical Environments, Cognizant Communication Corporation, New York, pp. 1-20. Maroochy Shire Library Service 1994, Maroochydore to Mooloolaba: Then and Now, Local Studies Section, Maroochy Shire Library Service, Maroochydore. Marshall, G (ed.) 1998, A Dictionary of Sociology, Oxford University Press, Oxford. Martin, BS & Uysal, M 1990, 'An Examination of the Relationship between Carrying Capacity and the Tourism Lifecycle: Management and Policy Implications', Journal of Environmental Management, vol. 31, pp. 327-33. Mason, KJ 1983, Experience of Nationhood: Australia and the World since 1900, 2nd edn, McGraw-Hill Book Company, Sydney. Mason, P 2003, Tourism Impacts, Planning and Management, Butterworth Heinemann, Oxford. Mathews, KM, White, MC & Long, RG 1999, 'Why Study the Complexity Sciences in the Social Sciences', Human Relations, vol. 52, no. 4, pp. 439-62. Mathieson, A & Wall, G 1982, Tourism: Economic, Physical and Social Impacts, Longman Scientific & Technical, Harlow, Essex. Mayhew, S 1997, A Dictionary of Geography, Oxford University Press, Oxford. McKelvey, B & Aldrich, H 1983, 'Populations, Natural Selection, and Applied Organizational Science', Administrative Science Quarterly, vol. 28, no. 1, pp. 101-28. McKercher, B 1999, 'A Chaos Approach to Tourism', Tourism Management, vol. 20, no. 4, pp. 425-34. Meadows, DH, Meadows, DL, Randers, J & Behrens, WW 1972, The Limits to Growth: A Report for the Club of Rome's Project on the Predicament of Mankind, The Club of Rome, Rome. Medlik, S 1997, Dictionary of Travel, Tourism and Hospitality, 2nd edn, Butterworth-Heinemann, Oxford. Meijers, EMJ 1986, 'Defining Confusions: Confusing Definitions', Environmental Monitoring and Assessment, vol. 7, no. 2, pp. 127-59.

Noreen Breakey Tourism Destination Development
References 375
Mercer, D 1995, "a Question of Balance" Natural Resource Conflict Issues in Australia, 2ndedn, The Federation Press, Annandale, NSW. Merriam, SB 1988, Case Study Research in Education: A Qualitative Approach, Jossey-Bass, San Francisco. Messerli, HR 1993, 'Tourism Area Life Cycle Models and Residents' Perceptions: The Case of Santa Fe, New Mexico', PhD thesis, Cornell University. Meyer-Arendt, KJ 1985, 'The Grand Isle, Louisiana Resort Cycle', Annals of Tourism Research, vol. 12, no. 3, pp. 449-65. Midgley, DF 1981, 'Towards a Theory of the Product Life Cycle: Explaining Diversity', Journal of Marketing, vol. 45, no. 4, pp. 109-15. Midgley, G 2000, Systemic Intervention: Philosophy, Methodology, and Practice, Kluwer Academic/Plenum, New York. Midwood - Tourism & Development 1996, Queensland Development Report, Gold Coast. ---- 1997, Queensland Development Report, Gold Coast. Mill, RC & Morrison, AM 1985, The Tourism System: An Introductory Text, Prentice-Hall International, Englewood Cliffs, New Jersey. ---- 1992, The Tourism System: An Introductory Text, 2nd edn, Prentice Hall, Englewood Cliffs, New Jersey. ---- 1998, The Tourism System: An Introductory Text, 3rd edn, Kendall/Hunt, Dubuque, Iowa. Miller, ML & Ditton, RB 1986, 'Travel, Tourism and Marine Affairs', Coastal Zone Management Journal, vol. 14, no. 1/2, pp. 1-20. Miller, WL & Crabtree, BF 2000, 'Clinical Research', in NK Denzin & YS Lincoln (eds), Handbook of Qualitative Research, 2nd edn, Sage Publications, California, pp. 607-31. Milne, SS 1998, 'Tourism and Sustainable Development: Exploring the Global-Local Nexus', in CM Hall & AA Lew (eds), Sustainable Tourism: A Geographical Perspective,Longman, Harlow, UK, pp. 35-48. Minitab Inc. 2005, Minitab 'Help', Pennsylvania, Release 14.20. Mokyr, J 1990, 'Punctuated Equilibria and Technological Progress', The American Economic Review, vol. 80, no. 2, pp. 350-4. Morgan, M 1991, 'Dressing up to Survive: Marketing Majorca Anew', Tourism Management, vol. 12, no. 1, pp. 15-20. Murphy, PE 1983, 'Tourism as a Community Industry: An Ecological Model of Tourism Development', Tourism Management, vol. 4, no. 3, pp. 180-93.

Noreen Breakey Tourism Destination Development
References 376
---- 1994, 'Tourism and Sustainable Development', in WF Theobald (ed.), Global Tourism: The Next Decade, Butterworth-Heinemann, Oxford, pp. 274-90. Mwaluko, GS & Ryan, TB 2000, 'The Systemic Nature of Action Learning Programmes', Systems Research and Behavioural Science, vol. 17, no. 4, pp. 393-401. NCSTT 1989, Expo 88 Impact: The Impact of World Expo 88 on Queensland's Tourism Industry, The National Centre for Studies in Travel and Tourism (NCSTT), James Cook University, Queensland Tourism and Travel Corporation, Brisbane. Nelson, JG 1993, 'An Introduction to Tourism and Sustainable Development with Special Reference to Monitoring', in JG Nelson, RW Butler & G Wall (eds), Tourism and Sustainable Development: Monitoring, Planning, Managing, University of Waterloo, Canada, pp. 3-23. Nelson, RR & Winter, SG 1982, An Evolutionary Theory of Economic Change, Harvard University Press, Cambridge, Massachusetts. Newsome, D, Moore, SA & Dowling, RK 2002, Natural Area Tourism: Ecology, Impacts and Management, Aspects of Tourism, Channel View Publications, Sydney. Nilsen, P & Taylor, G 1997, 'A Comparative Analysis of Protected Area Planning and Management Frameworks', in SF McCool & DN Cole (eds), Proceedings: Limits of Acceptable Change and Related Planning Processes: Progress and Future Directions,USDA Forest Service, Ogden, Utah, vol. INT-GTR-371, pp. 49-57. Nilson, TH 1995, Chaos Marketing: How to Win in a Turbulent World, McGraw-Hill, London. Norington, B 1990, Sky Pirates: The Pilots' Strike That Grounded Australia, ABC Enterprises, Crows Nest, NSW. Norton, JA & Bass, FM 1992, 'Evolution of Technological Generations: The Law of Capture', Sloan Management Review, vol. 33, no. 2, pp. 66-77. OESR 2001, Regional Economic Report: The Sunshine Coast Region, Office of Economic and Statistical Research, Queensland Government Treasury, Brisbane. ---- 2004a, Local Government Area Profile: The Brisbane Region, Office of Economic and Statistical Research, Queensland Government Treasury, Brisbane. ---- 2004b, The Contribution of International and Domestic Visitor Expenditure to the Queensland Regional Economies: 1998-99, Office of Economic and Statistical Research, Queensland Government Treasury, Brisbane. Oglethorpe, M 1984, 'Tourism in Malta: A Crisis of Dependence', Leisure Studies, vol. 3, no. 2, pp. 147-62. Oh, H, Kim, B-Y & Shin, J-H 2004, 'Hospitality and Tourism Marketing: Recent Developments in Research and Future Directions', International Journal of Hospitality Management, vol. 23, no. 5, pp. 425-47.

Noreen Breakey Tourism Destination Development
References 377
Onkvisit, S & Shaw, J 1986, 'Competition and Product Management: Can the Product Life Cycle Help?' Business Horizons, vol. 29, no. 4, pp. 51-62. O'Reilly, AM 1986, 'Tourism Carrying Capacity - Concepts and Issues', Tourism Management, vol. 7, no. 4, pp. 254-8. Page, SJ & Lawton, G 1997, 'The Impact of Urban Tourism on Destination Communities: Implications for Community Tourism Planning in Auckland', in CM Hall, J Jenkins & G Kearsley (eds), Tourism Planning and Policy in Australia and New Zealand: Cases, Issues and Practice, McGraw-Hill, Roseville NSW, pp. 209-26. Parry, B & Drost, R 1995, 'Is Chaos Good for Your Profits?' International Journal of Contemporary Hospitality Management, vol. 7, no. 1, pp. i-iii. Patton, MQ 1990, Qualitative Evaluation and Research Methods, Sage Publications, Newbury Park, California. Pearce, D 1989, Tourist Development, Longman Scientific & Technical, Essex. Pearl, R 1924, Studies in Human Biology, Williams & Wilkins Company, Baltimore. Pearsall, J (ed.) 2001, The Concise Oxford Dictionary, Oxford University Press, Oxford. Pigram, JJ 1987, Tourism in Coffs Harbour: Attitudes, Perceptions and Implications,University of New England, Coffs Harbour. Pinfield, LT 1986, 'A Field Evaluation of Perspectives on Organizational Decision Making', Administrative Science Quarterly, vol. 31, no. 3, pp. 365-88. PLI 1980, Market Studies, Pine Trees Resort, Noosa Heads, Queensland, Final Report,Plant Location International (PLI), Sydney. PLI & PWA 1980, Market Studies, Noosa Heads, Queensland, Phase 1 Report, Plant Location International (PLI) & Price Waterhouse Associates (PWA), Sydney. Plog, SG 1974, 'Why Destination Areas Rise and Fall in Popularity', Cornell Hotel and Restaurant Administration Quarterly, vol. 14, no. 4, pp. 55-8. Poon, A 1993, Tourism, Technology and Competitive Strategies, CAB International, Wallingford, England. Popper, KR 1959, The Logic of Scientific Discovery, Hutchinson of London, London. Porter, ME 1980, Competitive Strategy: Techniques for Analyzing Industries and Competitors, The Free Press, New York. Prideaux, B 1995, 'Taiwan's Outbound Tourism Industry Opportunities for Australia', paper presented to National Tourism and Hospitality Conference, Melbourne.

Noreen Breakey Tourism Destination Development
References 378
---- 1996, 'Recent Developments in the Taiwanese Tourist Industry - Implications for Australia', International Journal of Contemporary Hospitality Management, vol. 8, no. 1, pp. 10-5. ---- 1998, 'The Resort Development Spectrum: An Examination of the Role of the Market in Resort Development', in B Faulkner, C Tidswell & DB Weaver (eds), Progress in Tourism and Hospitality Research 1998: Proceedings of the Eighth Australian Tourism and Hospitality Research Conference, 11-14 February, Bureau of Tourism Research, Canberra, pp. 670-90. ---- 1999a, 'The Role of the Transport System in the Growth of Coastal Resorts - an Examination of Resort Development in South Queensland', PhD thesis, University of Queensland. ---- 1999b, 'Tourism Perspectives of the Asian Financial Crisis: Lessons for the Future', Current Issues in Tourism, vol. 2, no. 4, pp. 279-93. ---- 2000, 'The Resort Development Spectrum - a New Approach to Modeling Resort Development', Tourism Management, vol. 21, no. 3, pp. 225-40. Prideaux, B & Cooper, C 2002, 'Marketing and Destination Growth: A Symbiotic Relationship or Simple Coincidence?' Journal of Vacation Marketing, vol. 9, no. 1, pp. 35-51. Prideaux, B, Laws, E & Faulkner, B 2003, 'Events in Indonesia: Exploring the Limits to Formal Tourism Trends Forecasting Methods in Complex Crisis Situations', Tourism Management, vol. 24, no. 4, pp. 475-87. Priestley, G & Mundet, L 1998, 'The Post-Stagnation Phase of the Resort Cycle', Annals of Tourism Research, vol. 25, no. 1, pp. 85-111. Prigogine, I 1991, 'Foreword', in E Laszlo (ed.), The New Evolutionary Paradigm, Gordon and Breach Science Publishers, New York, pp. xiii-xvii. Prigogine, I & Stengers, I 1984, Order out of Chaos: Man's New Dialogue with Nature,New Science Library, Shambhala Boulder. Proctor, SR 1991, 'Foreword', in P Gray & K Edelmann (eds), Tourism in Queensland: Challenges and Opportunities, Committee for Economic Development of Australia. Prosser, GM 1995, 'Tourist Destination Life Cycles: Progress, Problems and Prospects', paper presented to National Tourism and Hospitality Conference 1995, Melbourne. ---- 1997, 'The Development of Tourist Destinations in Australia: A Comparative Analysis of the Gold Coast and Coffs Harbour', in R Teare, BF Canziani & G Brown (eds), Global Directions: New Strategies for Hospitality and Tourism, Cassell, London, pp. 305-32. Prosser, R 1994, 'Societal Change and the Growth in Alternative Tourism', in E Cater & G Lowman (eds), Ecotourism: A Sustainable Option?, John Wiley & Sons Ltd.

Noreen Breakey Tourism Destination Development
References 379
QTDB 1947, The Tourist Resources of Queensland and the Requirements for Their Development, Queensland Tourist Development Board (QTDB). QTTC 1990, An Examination of the Effect of the Domestic Aviation Dispute on Queensland Tourism, Market Research Department, Queensland Tourist and Travel Corporation, Brisbane. ---- 1991, A Profile of Tourism Growth, Development and Potential in Queensland,Queensland Tourist and Travel Corporation, Brisbane. QTTC & Boeing 1981, Tourism Potential in Queensland, Queensland Tourist and Travel Corporation & Boeing Commercial Airplane Company, Seattle. Queensland Government 1979, Queensland Tourist and Travel Corporation Act, 1 August 1979. ---- 1994, Building Units and Group Titles Act 1994, Number 69. Ralston, D 2001, Creating Growth: Challenges Facing the Sunshine Coast, CEDA Information Paper No. 75, The Committee for Economic Development of Australia. Rapoport, A 1985, General System Theory: Essential Concepts and Applications, Abacus Press, Kent. Reynolds, P 2002, Lock, Stock & Barrel: A Political Biography of Mike Ahern, University of Queensland Press, Brisbane. Richards, KS 1979, Stochastic Processes in One-Dimensional Series: An Introduction, vol. 23, Concepts and Techniques in Modern Geography, Geo Abstracts, Norwich. Richardson, JI 1999, A History of Australian Travel and Tourism, Hospitality Press, Melbourne. Richardson, SL 1986, 'A Product Life Cycle Approach to Urban Waterfronts: The Revitalization of Galveston', Coastal Zone Management, vol. 14, no. 1, pp. 21-46. Rider Hunt 1994, Queensland Development Report, Gold Coast. ---- 1995, Queensland Development Report, Gold Coast. Rider Hunt - Midwood 1996, Queensland Development Report, Gold Coast. Rider Hunt and Partners 1979, Gold Coast Development Report, Gold Coast. ---- 1980, Gold Coast & Sunshine Coast Development Report, Gold Coast. ---- 1981, Gold Coast & Sunshine Coast Development Report, Gold Coast. ---- 1982, Gold Coast & Sunshine Coast Development Report, Gold Coast. ---- 1983, Gold Coast & Sunshine Coast Development Report, Gold Coast.

Noreen Breakey Tourism Destination Development
References 380
---- 1984, Gold Coast & Sunshine Coast Development Report, Gold Coast. ---- 1985, Gold Coast & Sunshine Coast Development Report, Gold Coast. ---- 1986, Gold Coast & Sunshine Coast Development Report, Gold Coast. ---- 1987a, Gold Coast & Sunshine Coast Development Report, Gold Coast. ---- 1987b, Queensland Development Report, Gold Coast. ---- 1988, Queensland Development Report, Gold Coast. ---- 1989, Queensland Development Report, Gold Coast. ---- 1990, Queensland Development Report, Gold Coast. ---- 1991, Queensland Development Report, Gold Coast. ---- 1992, Queensland Development Report, Gold Coast. ---- 1993, Queensland Development Report, Gold Coast. Rink, DA & Swan, JE 1979, 'Product Life Cycle Research: A Literature Review', Journal of Business Research, vol. 7, no. 3, pp. 219-42. Rix, P 2004, Marketing: A Practical Approach, 5th edn, McGraw Hill Australia Pty Limited, North Ryde, NSW. Robinson, NA 1992, Agenda 21 & the Unced Proceedings, with Parvez Hassan & Francoise Burhenne-Guilmin; under the auspices of the Commission on Environmental Law of the World Conservation Union: The International Union for the Conservation of Nature and Natural Resources (IUCN), Oceana Publications, New York. Robson, C 1993, Real World Research: A Resource for Social Scientists and Practitioner-Researchers, Blackwell, Oxford. Romeril, M 1989, 'Tourism and the Environment: Accord or Discord?' Tourism Management, vol. 10, no. 3, pp. 204-8. Rosenow, JE & Pulsipher, GL 1979, Tourism: The Good, the Bad, and the Ugly, Media Productions & Marketing, Lincoln, Nebraska. Ruelle, D 1991, Chance and Chaos, Princeton University Press, Princeton, New Jersey. Ruse, M 1995, 'Theory', in T Honderich (ed.), The Oxford Companion to Philosophy,Oxford University Press, Oxford. Russell, RA 1995, 'Tourism Development in Coolangatta: An Historical Perspective', Honours thesis, Griffith University.

Noreen Breakey Tourism Destination Development
References 381
---- 2000, 'Tourism, Chaos and Entrepreneurship: A Comparative Study of the Development of Surfers Paradise and Coolangatta, Gold Coast, Australia', PhD thesis, Griffith University. Russell, RA & Faulkner, B 1998, 'Reliving the Destination Life Cycle in Coolangatta: An Historical Perspective on the Rise, Decline and Rejuvenation of an Australian Seaside Resort', in E Laws, B Faulkner & G Moscardo (eds), Embracing and Managing Change in Tourism: International Case Studies, Routledge, London, pp. 95-115. ---- 1999, 'Movers and Shakers: Chaos Makers in Tourism Development', Tourism Management, vol. 20, no. 4, pp. 411-23. Sardar, Z & Abrams, I 1999, Introducing Chaos, Icon Books, Cambridge. Sautter, ET & Leisen, B 1999, 'Managing Stakeholders: A Tourism Planning Model', Annals of Tourism Research, vol. 26, no. 2, pp. 312-28. Savignac, AE 1991, 'Foreword', in E Inskeep (ed.), Tourism Planning: An Integrated and Sustainable Development Approach, Van Nostrand Reinhold, New York, pp. xv-xvi. Scott, NR 2003, 'Tourism Trends: Evolution of Tourism Product Markets', PhD thesis, University of Queensland. Senge, PM 1990, The Fifth Discipline: The Art of Practice of the Learning Organisation,Currency Doubleday, New York. Shaw, G & Williams, A 1992, 'Tourism, Development and the Environment: The Eternal Triangle', Progress in Tourism, Recreation and Hospitality Management, vol. 4, pp. 47-59. Shelby, B & Heberlein, T 1986, Carrying Capacity in Recreation Settings, Oregon State University Press, Oregon. Sheth, JN & Sisodia, RS 1999, 'Revisiting Marketing's Lawlike Generalisations', Academy of Marketing Science, vol. 27, no. 1, pp. 71-87. Simon, JL 1969, Basic Research Methods in Social Science, Random House, New York. Sinclair, J 1994, Fighting for Fraser Island: A Man and an Island, Kerr Publishing, Alexandria, NSW. Singh, TV & Singh, S 1999, 'Preface', in TV Singh & S Singh (eds), Tourism Development in Critical Environments, Cognizant Communication Corporation, New York, pp. ix-xii. Smith, DR 1995, 'The Inapplicability Principle: What Chaos Means for Social Science', Behavioral Science, vol. 40, no. 1, pp. 22-41. Smith, NL 1995, 'The Influence of Societal Games on the Methodology of Evaluative Inquiry', in DM Fournier (ed.), Reasoning in Evaluation: Inferential Links and Leaps,Jossey-Bass Publishers, San Francisco, pp. 5-14. Smith, SLJ 1995, Tourism Analysis: A Handbook, 2nd edn, Longman, Essex.

Noreen Breakey Tourism Destination Development
References 382
Smith, VL 1999, 'Foreword', in TV Singh & S Singh (eds), Tourism Development in Critical Environments, Cognizant Communication Corporation, New York, pp. vii-viii. Soanes, C & Stevenson, A (eds) 2003, The Oxford Dictionary of English, Oxford University Press, Oxford. Spanoudis, C 1982, 'Trends in Tourism Planning and Development', Tourism Management,vol. 3, no. 4, pp. 314-8. Stake, RE 1994, 'Case Studies', in NK Denzin & YS Lincoln (eds), Handbook of Qualitative Research, Sage Publications, California, pp. 236-47. Stankey, GH & McCool, SF 1989, 'Beyond Social Carrying Capacity', in EL Jackson & TL Burton (eds), Understanding Leisure and Recreation: Mapping the Past, Charting the Future, Venture Publishing, State College, PA, pp. 497-516. Stankey, GH, Cole, DN, Lucas, RC, Peterson, ME & Frissell, SS 1985, The Limits of Acceptable Change (Lac) System of Wilderness Planning, vol. INT-76, General Technical Report, United States Department of Agriculture, Forest Service, Intermountain Forest and Range Experiment Station, Ogden, Utah. Stansfield, CA 1978, 'Atlantic City and the Resort Cycle: Background to the Legalization of Gambling', Annals of Tourism Research, vol. 5, no. 2, pp. 238-51. Stansfield, WD 1977, The Science of Evolution, MacMillan Publishing Co Inc, New York. Steele, P 1995, 'Ecotourism: An Economic Analysis', Journal of Sustainable Tourism, vol. 3, no. 1, pp. 29-44. Stewart, DW 1984, Secondary Research: Information Sources and Methods, vol. 4, Applied Social Research Methods Series, Sage Publications, Newbury Park. Stewart, RG 1994, 'Introduction', in R Stewart (ed.), Government and Business Relations in Australia, Allen & Unwin Pty Ltd, NSW, pp. xiv - xxvi. Stichcombe, AL 1965, 'Social Structure and Organisations', in JG March (ed.), Handbook of Organisations, Rand McNally & Company, Chicago, pp. 142-93. Strapp, JD 1988, 'The Resort Cycle and Second Homes', Annals of Tourism Research, vol. 15, no. 4, pp. 504-16. Strong, MF 1972, 'Introduction', in Development and Environment: Report and Working Papers of a Panel of Experts Convened by the Secretary-General of the United Nations Conference on the Human Environment (Founex, Switzerland, June 4-12, 1971), pp. ix-x. Stuart, R 1985, 'Resource Development Policy: The Case of Queensland's Export Coal Industry', in A Patience (ed.), The Bjelke-Petersen Premiership 1968-1983: Issues in Public Policy, Longman Cheshire, Melbourne, pp. 53-80. Sutton, R 1984, 'On Being the Host Broadcaster: Producing the Games', paper presented to The 1982 Commonwealth Games: A Retrospect, Brisbane.

Noreen Breakey Tourism Destination Development
References 383
Taylor, GD 2002, 'Foreword', in CA Gunn & T Var (eds), Tourism Planning: Basics, Concepts, Cases, 4th edn, Routledge, New York, pp. xv-xvi. Tellis, GJ & Crawford, CM 1981, 'An Evolutionary Approach to Product Growth Theory', Journal of Marketing, vol. 45, no. 4, pp. 125-32. Thom, R 1975, Structural Stability and Morphogenesis: An Outline of a General Theory of Models, Reading, Mass. Thomas, I 1998, Environmental Impact Assessment in Australia, 2nd edn, The Federation Press, Annandale, NSW. Tisdell, CA & Roy, KC (eds) 1998, Tourism and Development: Economic, Social, Political and Environmental Issues, Nova Science Publishers, Commack, New York. Toghill, J 1982, Tropic Coast: The Coastal Playgrounds of Queensland, AH & AW Reed Pty Ltd, Frenchs Forest. Toh, RS, Khan, H & Koh, A-J 2001, 'A Travel Balance Approach for Examining Tourism Area Life Cycles: The Case of Singapore', Journal of Travel Research, vol. 39, no. 4, pp. 426-32. Tooman, LA 1997, 'Applications of the Life-Cycle Model in Tourism', Annals of Tourism Research, vol. 24, no. 1, pp. 214-34. Tourism Australia 2004, United States: Country Overview, Tourism Australia, Canberra. ---- 2005, China: Country Overview, Tourism Australia, Canberra. Tourism Queensland 2004, Sunshine Coast Destination Management Plan, Brisbane. Towner, J & Wall, G 1991, 'History and Tourism', Annals of Tourism Research, vol. 18, no. 1, pp. 71-84. Travis, AS 1982, 'Managing the Environmental and Cultural Impacts of Tourism and Leisure Development', Tourism Management, vol. 3, no. 4, pp. 256-62. Turner, L 1976, 'The International Division of Leisure: Tourism and the Third World', Annals of Tourism Research, vol. 4, no. 1, pp. 12-24. Tushman, ML & Romanelli, E 1985, 'Organisational Evolution: A Metamorphosis Model of Convergence and Reorientation', Research in Organizational Behavior, vol. 7, pp. 171-222. Twining-Ward, L & Baum, T 1998, 'Dilemmas Facing Mature Island Destinations: Cases from the Baltic', Progress in Tourism and Hospitality Research, vol. 4, no. 2, pp. 131-40. Tzoanos, G 1994, 'Foreword', in H Boers (ed.), The Earth as a Holiday Resort: An Introduction to Tourism and the Environment, Institute of Tourism and Transport Studies, Urtrecht, The Netherlands, p. 5.

Noreen Breakey Tourism Destination Development
References 384
United Nations 1972, Only One Earth, United Nations Conference on the Human Environment (UNCHE), 5-16 June 1972, Stockholm, Sweden. ---- 1993, Earth Summit: Agenda 21 - the United Nations Programme of Action for Sustainable Development: Rio Declaration of Environment and Development, United Nations Conference on Environment and Development (UNCED) 3-14 June1992, Rio de Janeiro, Brazil. ---- 2001, Concise Report on World Population Monitoring, 2001: Population, Environment and Development: Report of the Secretary-General, E/CN.9/2001/1, Economic and Social Council, Thirty-fourth Session of the Commisssion on Population and Development, United Nations. University of Queensland 1971, Government of Australia 1971: Case Studies: 1. Cooloola,University of Queensland, Department of Government, Brisbane. Upton, G & Cook, I 2002, A Dictionary of Statistics, Oxford University Press, Oxford. US Government 1969, National Environmental Policy Act of 1969 (Nepa), United States Congress No. 42 U.S.C 4321-4347. ---- 1972, Stockholm and Beyond, United States Secretary of State's Advisory Committee on the United Nations Conference on the Human Environment (UNCHE), 5-16 June 1972. Utterback, JM & Abernathy, WJ 1975, 'A Dynamic Model of Process and Product Innovation', The International Journal of Management Science, vol. 3, no. 6, pp. 639-56. Van de Ven, AH 1992, 'Suggestions for Studying Process: A Research Note', Strategic Management Journal, vol. 13, Special Issue: Summer, pp. 169-88. van den Bergh, JCJM 1996, Ecological Economics and Sustainable Development: Theory, Methods and Applications, Edward Elgar, Cheltenham. Van Maanen, J 1998, 'Different Strokes: Qualitative Research in the Administrative Science Quarterly 1956 to 1996', in J Van Maanen (ed.), Qualitative Studies of Organisations, Sage Publications, Thousand Oaks, pp. ix-xxx. Van Maanen, J, Manning, PK & Miller, ML 1993, 'Editors' Introduction', in J Hamel, S Dufour & D Fortin (eds), Case Study Methods, Sage Publications, Newbury Park, pp. v-vi. Veal, AJ 1997, Research Methods for Leisure and Tourism: A Practical Guide, 2nd edn, Financial Times Pitman Publishing in association with the Institute of Leisure and Amenity Management, London. Vilkins, D 1993, 'The Social Implications of Chaos Theory', Masters thesis, University of Queensland. von Bertalanffy, L 1968, General Systems Theory: Foundations, Development, Applications, Revised edn, George Braziller, New York.

Noreen Breakey Tourism Destination Development
References 385
---- 1972, 'General System Theory: A Critical Review', in J Beishon & G Peters (eds), Systems Behaviour, Harper & Row, London, pp. 29-49. Waddington, CH 1975, The Evolution of an Evolutionist, Edinburgh University Press, Edinburgh. Wagar, JA 1964, The Carrying Capacity of Wild Lands for Recreation, vol. 7, Forest Science Monograph, Society of American Foresters, Washington, DC. Waldrop, M 1992, Complexity: The Emerging Science at the Edge of Order and Chaos,Simon & Schuster, New York. Walker, J 1995, Goss: A Political Biography, University of Queensland Press, Brisbane. Walker, RH & Enjeti, MK 1998, 'Dynamics of Marketing a Tourism Destination: The Tasmanian Experience', in CH Lovelock, PG Patterson & RH Walker (eds), Services Marketing: Australia and New Zealand, Prentice Hall, Sydney, pp. 530-3. Wall, G 1983, 'Cycles and Capacity: A Contradiction in Terms?' Annals of Tourism Research, vol. 10, no. 2, pp. 268-70. Walle, AH 1997, 'Quantitative Versus Qualitative Tourism Research', Annals of Tourism Research, vol. 24, no. 3, pp. 524-36. Walter, J 1990, 'Johannes Bjelke-Petersen: The Populist', in D Murphy, R Joyce & M Cribb (eds), The Premiers of Queensland, University of Queensland Press, Brisbane, pp. 495-526. Ward, M 1995, 'Butterflies and Bifurcations: Can Chaos Theory Contribute to Our Understanding of Family Systems?' Journal of Marriage and the Family, vol. 57, no. 3, pp. 629-38. WCED 1987, Our Common Future, World Commission on Environment and Development, Oxford University Press, Oxford. Weaver, DB 1988, 'The Evolution of a 'Plantation' Tourism Landscape on the Caribbean Island of Antigua', Journal of Economic and Social Geography, vol. 79, no. 5, pp. 319-31. ---- 1990, 'Grand Cayman Island and the Resort Cycle Concept', Journal of Travel Research,vol. 29, no. 2, pp. 9-15. Wiener, N 1948, Cybernetics or Control and Communication in the Animal and the Machine, John Wiley & Sons Inc., New York. Wilkins Tourist Maps 2004, Sunshine Coast Map, viewed 21 August 2004 <wwvv.wilmap.com.au >. Wilkinson, PF 1987, 'Tourism in Small Island Nations: Fragile Dependence', Leisure Studies, vol. 6, no. 2, pp. 127-46.

Noreen Breakey Tourism Destination Development
References 386
Williams, A & Shaw, G 1998, 'Tourism and the Environment: Sustainability and Economic Restructuring', in CM Hall & AA Lew (eds), Sustainable Tourism: A Geographical Perspective, Longman, Harlow, UK, pp. 49-59. Williams, BA 1980, A Survey of Federal and State Government Policies Related to the Development of the Tourist Industry in Queensland, Queensland Agricultural College, Lawes. Williams, MT 1993, 'An Expansion of the Tourist Site Cycle Model: The Case of Minorca (Spain)', The Journal of Tourism Studies, vol. 4, no. 2, pp. 24-32. Williams, PW & Gill, A 1999, 'A Workable Alternative to the Concept of Carrying Capacity: Growth Management Planning', in TV Singh & S Singh (eds), Tourism Development in Critical Environments, Cognizant Communication Corporation, New York, pp. 51-64. Wind, Y 1981, 'A Framework for Classifying New-Product Forecasting Models', in Y Wind, V Mahajan & RN Cardozo (eds), New-Product Forecasting: Models and Applications,Lexington Books, Toronto, pp. 3-45. Wind, Y & Claycamp, HJ 1976, 'Planning Product Line Strategy: A Matrix Approach', Journal of Marketing, vol. 40, no. 1, pp. 2-9. Winpenny, JT 1982, 'Issues in the Identification and Appraisal of Tourism Projects in Developing Countries', Tourism Management, vol. 3, no. 4, pp. 218-21. Witt, SF & Moutinho, L (eds) 1989, Tourism Marketing and Management Handbook,Prentice Hall, New York. Wöber, KJ 2000, 'Standardizing City Tourism Statistics', Annals of Tourism Research, vol. 27, no. 1, pp. 51-68. Wollin, AS 1995, 'A Hierarchy-Based Punctuated-Equilibrium Model of the Processes of Emergence and Change of New Rural Industries', PhD thesis, Griffith University. Wood, DM 1993, 'Sustainable Development in the Third World: Paradox or Panacea?' The Indian Geographical Journal, vol. 68, no. 1, pp. 6-20. Woodley, A 1993, 'Tourism and Sustainable Development: The Community Perspective', in JG Nelson, RW Butler & G Wall (eds), Tourism and Sustainable Development: Monitoring, Planning, Managing, Heritage Resources Centre, University of Waterloo, Waterloo, Ontario, vol. Dept. of Geography Publication Series No.37, pp. 135-47. World Expo 88 Authority 1988, World Expo 88: The Official Souvenir Program, Australian Consolidated Press, Sydney. WTO 1978, Inventory of Tourism Development Plans, World Tourism Organisation, Madrid, Spain.
Noreen Breakey Tourism Destination Development
References 387
WTTC, WTO & Earth Council 1995, Agenda 21 for the Travel and Tourism Industry: Towards Environmentally Sustainable Development, World Travel and Tourism Council (WTTC), World Tourism Organisation (WTO) and Earth Council, London. Yin, RK 1989, Case Study Research - Design and Methods, vol. 5, Applied Social Research Methods Series, Sage Publications, Newbury Park, California. ---- 1993, Applications of Case Study Research, Sage Publications, Newbury Park, California. ---- 1994, Case Study Research: Design and Methods, 2nd edn, vol. 5, Applied Social Research Methods Series, Sage Publications, Thousand Oaks, California. ---- 2003, Applications of Case Study Research, 2nd edn, Sage Publications, Thousand Oaks, California. Young, RC 1988, 'Is Population Ecology a Useful Paradigm for the Study of Organizations?' The American Journal of Sociology, vol. 94, no. 1, pp. 1-24.
Noreen Breakey Tourism Destination Development
Data Sources 388
Data Sources
Australian Bureau of Statistics, 3202.3 - Estimated Resident Population and Area for Local
Authority Areas, Queensland.
Australian Bureau of Statistics, 3212.3 - Estimated Resident Population, Queensland.
Australian Bureau of Statistics, 3218.0 - Regional Population Growth, Australia.
Australian Bureau of Statistics, 3401.0 - Overseas Arrivals and Departures, Australia.
Australian Bureau of Statistics, 6401.0 - CPI, Australia.
Australian Bureau of Statistics, 8635.0 - Tourist Accommodation, Australia.
Australian Bureau of Statistics, 8635.3 - Tourist Accommodation, Queensland.
Australian Bureau of Statistics, 8731.0 - Building Approvals, Australia.
Australian Bureau of Statistics, 8731.3 - Building Approvals, Queensland.
Boeing Commercial Airplane Company 1986, Tourism Potential in Queensland to the Year
2000, Seattle.
Bureau of Tourism Research 1986-1996, Domestic Tourism Monitor (DTM).
Bureau of Tourism Research 1986-2001, International Visitor Survey (IVS).
Office of Economic and Statistical Research 1985 – 1999, Visitor Expenditure in Regional
Queensland.

Noreen Breakey Tourism Destination Development
Data Sources 389
Queensland Tourist and Travel Corporation (later Tourism Queensland) 1983/84 – 1996/97,
Major Survey Research Programme (MSRP) and Queensland Visitor Survey (QVS).
Queensland Tourist and Travel Corporation & Boeing Commercial Airplane Company
1981, Tourism Potential in Queensland, Seattle.
Reserve Bank of Australia 1949/50-1996/97, Exchange Rates of the Australian Dollar.