touriga nacional x environment interaction in the little
TRANSCRIPT
Touriga Naçional x environment interaction in the Little Karoo region
of South Africa
by
Margaux Nel
Thesis presented in partial fulfilment of the requirements for the degree of Master of Agriculture Sciences
at Stellenbosch University
Department of Viticulture and Oenology, Faculty of AgriSciences
Supervisor: Dr VA Carey
December 2009
By submitting this dissertation electronically, I declare that the entirety of the work contained therein is my own, original work, that I am the owner of the copyright thereof (unless to the extent explicitly otherwise stated) and that I have not previously in its entirety or in part submitted it for obtaining any qualification. December 2009
Copyright © 2009 Stellenbosch University
All rights reserved
Declaration
Abstract The Little Karoo region of South Africa stretches from Montagu in the west, through Barrydale on the Langeberg Mountain, towards Ladismith, Calitzdorp, Oudtshoorn and De Rust in the east, with the Swartberg mountain range in the north. The Wine of Origin district of Calitzdorp is a small, demarcated area around Calitzdorp in the Little Karoo, surrounded by the Rooiberg, Swartberg and Kleinberg mountains. With a mean February temperature (MFT) of 23.7ºC and a low annual rainfall of 233 mm, the district of Calitzdorp has a similar climate to that of the Douro Demarcated Region (DDR). The MFT is comparable to the DDR mean July temperature, and it seems that the Douro Superior sub-region to the east of the DDR has a mean July temperature of higher than 25°C. In the Cima Corgo sub-region (in the centre of the DDR), and the Baixo Cargo sub-region, the mean July temperatures are ±25°C and ±22°C respectively. Annual rainfall in the DDR is much higher, with Baixo Cargo recording 1 018 mm, Cima Corgo recording 658 mm and Douro Superior in the east recording only 437 mm. Touriga Naçional is one of the highest quality Portuguese red grape varieties. It produces high-quality port-style wine as well as table wines. Excellent quality Touriga Naçional wines have a dark black/purple colour, good extract, high, elegant tannin content and intense aromas, with typical plum, raisin, wild fruit, mulberry, “fynbos” and cherry aromas. The most suitable terroir for Touriga Naçional in the DDR has been found to be on sites that restrain the natural vigour of the grapevine. Soils with moderate to low water-holding capacity, in association with low rainfall, result in water deficits during the growing season and are considered optimal to restrict growth vigour. A steep, northern middle slope is ideal in the southern hemisphere for high temperatures and sunlight interception. Warm temperatures (25 to 30 °C) during the day and cooler temperatures during the night are optimal for photosynthesis and colour development. In order to study factors affecting the quality of Touriga Naçional in Calitzdorp, two Vitis vinifera L. cv. Touriga Naçional commercial vineyards in the Calitzdorp district were selected. Each vineyard was divided into two separate management blocks based on their empirically determined quality of production. Two crop-reduction treatments, the standard 50% crop reduction (which was considered to be the control) and a further less drastic treatment of 25% crop reduction, were applied. Significant differences were found in viticultural performance between the two adjacent Touriga Naçional management blocks in each vineyard, especially with respect to vigour. The upper management blocks, which provided grapes for reserve-quality port-style wines, experienced a higher water deficit due to the moderate soil water-holding capacity and higher temperatures in comparison to the lower sites. The higher water deficits had a restraining effect on the Touriga Naçional vines, and therefore the upper sites had lower vigour, which contributed to better quality of both the wine and port-style wine, and this could be recognised sensorially. However, it was not reflected in the chemical analytical results. Crop load also appeared to have an effect on the Touriga Naçional grapevines, but this appeared to be dependent on the management block. The 50% crop reduction had a significant positive effect on the sensory analyses, but did not significantly affect the chemical analyses. Calitzdorp terroir has a similar effect on Touriga Naçional compared to the DDR terroir, and that is why Calitzdorp can produce good table and port-style wines from Touriga Naçional.

Opsomming Die Klein Karoo-streek in Suid Afrika strek vanaf Montagu in die weste, deur Barrydale teen die Langeberg, na Ladismith, Calitzdorp, Oudtshoorn en De Rust in die ooste, met die Swartberg in die noorde. Die distrik van Calitzdorp is ‘n klein area rondom Calitzdorp, in die Klein Karoo, wat deur die Rooiberg, Swartberg en Kleinberg omring is. Calitzdorp het ‘n gemiddelde Februarie-temperatuur (GFT) van 23.7°C en ‘n lae jaarlikse reënval van 223 mm, wat soortgelyk is aan die klimaat van die Douro Vallei in Portugal. Die Douro Vallei se gemiddelde Julie-temperatuur (GJT) in vergelyking met die GFT van Calitzdorp is hoër, met temperature van meer as 25°C in die substreek Douro Superior. Vir die substreke Cima Cargo en Baixo Cargo is die GJT ±25°C en ±22°C onderskeidelik. Die jaarlikse reënval is ook hoër by Baixo Cargo, met 1 018 mm, Cima Cargo met 658 mm en Douro Superior met slegs 437 mm. Touriga Naçional is een van die beste Portugese rooi kultivars wat hoëkwaliteit tafel- en portwyne produseer. ‘n Tipiese hoëkwaliteit Touriga Naçional-wyn het ‘n swartpers kleur, hoë ekstrak, hoë elegante tanniene en intense aromatiese geure wat tipiese pruim, rosyne, wilde vrugte, moerbei, fynbos en kersie aromas insluit. Die geskikste terroir vir Touriga Naçional is op swak gronde wat die natuurlike groeikrag van die wingerdstok strem. Gronde met matige tot lae grondwaterhouvermoë tesame met lae reënval veroorsaak ‘n waterstremming in die wingerdstok gedurende die groeiseisoen en word as optimaal beskou omdat dit beheersde groei veroorsaak. In die suidelike halfrond word relatief steil, noordelike middelhange as ideaal beskou vir hoë temperature en maksimale sonligonderskepping. Gepaardgaande hiermee is die interne dreinasie verantwoordelik vir vinniger uitdroging van die grond. Hoë temperature (25 tot 30°C) gedurende die dag en koue nagte is optimaal vir fotosintese en kleurontwikkeling. Twee Vitis vinifera L. cv. Touriga Naçional kommersiële wingerde in die Calitzdorp-distrik is geselekteer en in twee afsonderlike bewerkingsblokke verdeel, gebaseer op kwaliteitsverskille. In elke blok was die verdeling van so ‘n aard dat daar ‘n hoërliggende helfte en ‘n laerliggende helfte was. Twee trosverminderingsbehandelings, nl. 50% (kontrole) en 25%, gebaseer op trosgetalle, is toegepas. By elkeen van die wingerde was daar betekenisvolle groeiverskille tussen die twee aangrensende helftes. Die boonste helftes (of gedeeltes) het minder gegroei a.g.v. ‘n hoër waterstremming sowel as hoër temperatuur as die laer helftes. Dit het geblyk om ‘n positiewe invloed op die kwaliteit van beide die tafel- en portwyne uit te oefen. Troslading het ook ‘n effek op die Touriga Naçional-wingerde gehad, maar dit blyk of dit blok-afhanklik is. Die 50% trosverminderingsbehandeling het ‘n beduidende positiewe verskil in die sensoriese analises gemaak, maar nie ‘n beduidende verskil in die chemiese analises van die wyne nie. Calitzdorp se terroir het ‘n soortgelyke effek op Touriga Naçional as dié van die DDR terroir en daarom kan Calitzdorp soortgelyke goeie tafel- en portwyne van Touriga Naçional produseer.

This thesis is dedicated to my family and friends

Biographical sketch Margaux Nel was born in Calitzdorp on 23 September 1984. She matriculated at Principia
College in Oudtshoorn in 2002. After matriculating, she enrolled for a BSc Agric degree (Wine
Specialisation) and graduated in 2006. In 2007 Margaux enrolled for the MSc Agric degree
(Viticulture).

Acknowledgements I wish to express my sincere gratitude and appreciation to the following persons and institutions:
Dr Victoria Carey of the Department of Viticulture and Oenology, for acting as my supervisor, and for guidance, advice, encouragement, passion and enthusiasm;
The Department of Viticulture and Oenology, for support throughout my studies;
Prof Martin Kidd, for his help with the statistical data interpretation;
Mr Carel Nel, for advice and financial support throughout my studies;
Tinake van Zyl, Carolyn Howell and Zelmari Coetzee, for their technical assistance in the vineyard, and encouragement and support;
Dirk Brink, Suzet Brink, Carel Nel, Jeanne Nel, Jacques Conradie, Boets Nel, Pieter Terblanche, Ellenore Cronje, Rozanne Nel, Sammie Brink and Fannie Geyser, for their support and help with the sensory analyses of the wines;
My friends, for their support, love and reassurance throughout my studies;
My family, for their support, love and understanding;
Leon Coetzee, for his love and support.

Preface This thesis is presented as a compilation of five chapters. Chapter 1 General introduction and project aims Chapter 2 Literature review Chapter 3 Materials and methods Chapter 4 Research results Chapter 5 General discussion and conclusions

Contents
Chapter 1. Introduction and project aims 1
1.1 Introduction 2 1.2 Project aims 4 1.3 References 5
Chapter 2. Dominant site factors that determine the growth, yield and berry quality of Touriga Naçional 6
2.1 Introduction 7 2.2 Background 7
2.2.1 Touriga Naçional 7 2.2.2 Douro Demarcated Region 7
2.3 The influence of dominant enviromental factors on the growth vigour of grapevines 10
2.3.1 Soil 10 2.3.2 Climate 11
2.4 The influence of climate on the physiology of the vine 13 2.5 The influence of climate on berry composition and quality 14 2.6 The influence of berry composition and quality on wine quality 16 2.7 Conclusions 17 2.8 References 18
Chapter 3. Materials and methods 20
3.1 Experimental vineyard 21 3.2 Treatments and experimental layout 21 3.3 Climatic parameters 22 3.4 Vineyard measurements 22 3.4.1 Soil analyses and root distribution 22 3.4.2 Canopy and leaf measurements 22 3.4.3 Physiological measurements 22 3.4.4 Cane measurements 23 3.4.5 Berry analyses 23 3.5 Microvinification 25 3.6 Wine analyses 25 3.7 Sensory analyses 26 3.8 Statistical analyses 26 3.9 References 26
Chapter 4. Research results 27
4.1 Climatic parameters 28 4.2 Soil descriptions and analyses 34 4.3 Vineyard measurements 37

4.3.1 Canopy and leaf measurements 38 4.3.2 Water potential measurements 43 4.3.3 Stomatal conductance measurements 48 4.3.4 Cane measurements 54 4.3.5 Berry analyses 56 4.4 Wine and port-style wine analyses 61 4.5 Sensory analyses 66 4.6 References 67
Chapter 5. General discussion and conclusions 70
5.1 Introduction 71 5.2 General discussion 71 5.3 Perspectives and future research 72 5.4 Conclusions 73 5.5 References 74

CChhaapptteerr 11
Introduction and project aims
2
Chapter 1: Introduction and project aims
1.1 Introduction
Until recently, the Little Karoo has been renowned mostly for producing dessert wine, liqueur (port-style) wines and brandy. However, it is now also becoming known for producing better quality red wines, especially those from the Portuguese variety Touriga Naçional, which is in line with the market trend, set by the Portuguese, to produce excellent red wines from this variety. The Little Karoo region of South Africa stretches from Montagu in the west, through Barrydale in the Langeberg Mountains, towards Ladismith, Calitzdorp, Oudtshoorn and De Rust in the east, with the Swartberg Mountain range in the North. The district of Calitzdorp is a small area around Calitzdorp, in the Little Karoo, and it is surrounded by the Rooiberg, Swartberg and Kleinberg mountains. Calitzdorp has produced good quality port-style wines since the 1980s and is known as the Port Capital of South Africa. Calitzdorp has a mean February temperature of 23.7ºC (1980 to 1990) (Fig. 1.1). According to the Winkler index, Calitzdorp falls within region V. Based on this potential estimation, Calitzdorp should grow late varieties for high-volume wines and dessert wines. Although Calitzdorp is renowned for its liqueur wines, it has recently also begun to set high standards for red wines, especially the Portuguese variety red wines. There are six single varietal Touriga Naçional dry red wines produced in South Africa, of which four are produced in Calitzdorp. Boplaas (Calitzdorp, Little Karoo) Touriga Naçional 2003 received an 86 Robert Parker rating (Parker, 2009). Parker is a wine advocate in the USA. De Krans (Calitzdorp, Little Karoo) Touriga Naçional 2004, 2005 and 2006 received 4-star ratings in the Platter’s South African wine guide (Van Zyl, 2009). The Platter’s South African Wine Guide is the most comprehensive guide to South African wines. This suggests that the potential exists in a warmer wine-producing area such as Calitzdorp, Little Karoo for the production of high quality red wines from the variety Touriga Naçional.

3
Max Temperature Min Temperature Mean Temperature
1 2 3 4 5 6 7 8 9 10 11 12
Month
0
5
10
15
20
25
30
35
Te
mp
era
ture
(oC
)
Figure 1.1 Mean monthly minimum, maximum and mean temperatures (whiskers denote range of values over the measurement period) from the historical Calitzdorp weather station (-33.5499992 : 21.6833324 with an altitude of 229 m) for the period 1980 to 1990.
Touriga Naçional grapes have the characteristics of higher total acidity and lower pH values at harvest, even in the extreme climates of the Douro Valley (Oliveira et al., 2006). Touriga Naçional grapevines also have naturally vigorous growth and should, therefore, be planted in low potential soils, such as poor and rocky soils (Guichard et al., 2004), or in the case of Calitzdorp, soils with a high sub-soil clay percentage, to restrain their growth. Soil and climate together impact on the plant water status and, therefore, the growth vigour of grapevines. All vines can withstand water stress for considerable periods. Touriga Naçional has been the focus of much research in Portugal due to its importance for port and red wine production. Diurnal fluctuation in leaf water potential, from -200 kPa (predawn) down to -800 kPa (midday) for low summer-stressed grapevines, and -600 kPa (predawn) down to -1700 kPa (midday) for severe summer stressed Touriga Naçional grapevines, have been observed in mid-growth season (véraison) in the Douro Demarcated Region (DDR) (Moutinho-Pereira et al., 2004). It has been noted that even high soil water contents could not prevent the daily water deficit experienced by the grapevines between 9 am and 6 pm (Oliveira, 1993). A recent study on the performance of Touriga Naçional in three different regions (Moutinho-Pereira et al., 2004) showed that a large midday decrease in leaf water content occurred even if the soil was moist. This appeared to be due to a high evaporative demand. On a typical summer’s day, photosynthetic activity decreased due to stomatal closure. The influence of non-stomatal factors was found to become more important when the environmental stress was more severe. The intrinsic water-use efficiency also decreased from morning to midday, mainly during the ripening phase, when environmental stress was more severe (Moutinho-Pereira et al., 2004). Stomatal regulation is a complex interaction of external and internal factors (Düring, 1976). Wind can also cause stomatal closure and consequently limit CO2 uptake and photosynthesis (Freeman et al., 1982). The short-term regulation of gas exchange to reduce

4
water loss could be one of the reasons why Touriga Naçional performs well in warm climate areas. To improve the quality of Touriga Naçional, a certain degree of water deficit is needed, but extreme water stress should be avoided (Oliveira, 1993). Water is one of the key factors determining wine quality and it is therefore important to monitor water status and apply irrigation judiciously (Choné et al., 2001). In low rainfall regions with high summer temperatures in both Portugal (Oliveira, 1993) and the Little Karoo, irrigation is needed to avoid extreme water stress situations. According to the criteria of the South Africa Port Producers’ Association (SAPPA), a dark colour is very important for a good quality vintage port. Polyphenol composition depends largely on climate, and anthocyanin accumulation in Touriga Naçional berries can be influenced by humidity and temperature inter alia (Mateus et al., 2001). Other port quality attributes include a residual sugar range of between 90 and 100 g/L, an alcohol range of between 19.0 and 19.6 vol. %, ripe tannins, a pH of 3.6 or lower, and 5.0 to 5.8 g/L total acidity (C.C Nel, SAPPA Chairperson, personal communication, 2008). According to SAPPA (C.C Nel, SAPPA chairperson, personal communication, 2008), there is a promising future for Touriga Naçional as a red wine due to its higher acidity, smaller berries for good extraction of colour and aroma compounds, good tannin structure and colour, and the ability to perform well in warmer climates. There has, however, been no research performed in the Little Karoo on Portuguese or any other red wine varieties. In fact, there is very limited research on Portuguese varieties in South Africa despite the dire need for such research to assist wine producers to improve the quality of red wine production from varieties such as Touriga Naçional in warmer climates. This is one of the main motivations for the commencement of this research in the Little Karoo. High-quality grapes are typically associated with low yields, small bunches, small berries and low-vigour canopies, because vineyards with low yield and low vigour have open canopies with good leaf and fruit exposure (Smart & Robinson, 1991). In Calitzdorp, especially with respect to Touriga Naçional, some of the grape producers take this theory to the extreme and reduce 50% of their crop as normal practice. The determination of the quality effects on grape maturation of different crop reductions will give a clearer picture as to whether this is a necessary practice. In order to produce high quality grapes for the production of excellent quality wine, the physiology of the vine must be known to enable canopy manipulation (Sousa et al., 2006).
1.2 Project Aims
The ultimate aims of the project are to determine the reasons for quality-related differences between two adjacent Touriga
Naçional blocks in order to determine why the one block delivers reserve quality wines and port-style wines, and the other block only good quality wines and port-style wines,
to determine differences in physiological performance between four Touriga Naçional management blocks, and
to determine the qualitative effects on grape maturation of 50% and 25% crop reduction in the Touriga Naçional blocks.

5
1.3 References
Choné, X., Van Leeuwen, C., Dubourdieu, D. & Gaudiller, J.P., 2001. Stem water potential is a sensitive indicator of grapevine water status. Ann. Bot. 87, 477-483.
Düring, H., 1976. Studies on environmentally controlled stomatal transpiration in grapevines. I. Effects of light intensity and air humidity. Vitis 15, 82-87.
Freeman, B.M., Kliewer, W.M. & Stern, P., 1982. Influence of windbreaks and climatic region on diurnal fluctuation of leaf water potential, stomatal conductance, and leaf temperature of grapevines. Am. J. Enol. Vitic. 33, 233-236.
Guichard, F., Pereira, G.M., Guimaraens, D., Peixoto, F., De Almeida, A.R., Silva Lopes, T., Sandman, G. & Carvalho, M., 2004. Port wine. Instituto dos Vinhos do Douro e do Porto.
Mateus, N., Proença, S., Ribeiro, P., Machado, J.M. & De Freitas, V., 2001. Grape and wine polyphenolic composition of red Vitis vinifera varieties concerning vineyards altitude. Cienc. Tecnol. Aliment. 3, 102-110.
Moutinho-Pereira, J.M., Correia, C.M., Gonçalves, B.M., Bacelar, E.A. & Torres-Pereira, J.M., 2004. Leaf gas exchange and water relations of grapevines grown in three different conditions. Photosynthetica 42, 81-86.
Oliveira, C., Barbosa, A., Silva Ferreira, A.C., Guerra, J. & De Pinho, P.G., 2006. Carotenoid profile in grape related to aromatic compounds in wines from Douro region. Journal of Food Science 71(1), S1-S6.
Oliveira M.T. 1993. Plant water stress under low rainfall, high temperature summer conditions in Portugal. NATO ASI Series 16, 497-509.
Parker, P., 2009. The independent consumer’s guide to fine wine. http://www.erobertparker.com (Retrieved 30/09/2009).
Smart, R. & Robinson, M., 1991. Sunlight into wine. Winetitles, Adelaide.
Sousa, T.A., Oliveira, M.T. & Pereira, J.M., 2006. Physiological indicators of plant water status of irrigated and non-irrigated grapevines grown in a low rainfall area of Portugal. Plant and Soil. 282, 127-134.
Van Zyl, F. 2008. Platter’s South African Wine Guide. http://www.platteronline.com (Retrieved 30/07/2008).

CChhaapptteerr 22
Literature review
Dominant site factors that determine the growth, yield and berry quality of Touriga
Naçional

7
Chapter 2: Dominant site factors that determine the growth, yield and berry quality of Touriga Naçional
2.1 Introduction
Touriga Naçional is a Portuguese grape variety that is cultivated mainly in the Douro Demarcated Region (DDR) and is considered one of the best adapted black varieties in this region for the production of quality wines. The vineyards in the DDR are classified by means of a scoring method that limits the production as well as regulates the quality of port wine. This scoring method takes into account the topographic, soil, climate and cultivation factors of the vineyard (Guichard et al., 2004). Different topographic factors influence the growth vigour of the vine by way of related soil characteristics and mesoclimate. Location, altitude, slope, aspect and shelter are the main factors that influence the mesoclimate. Furthermore, poorer and rockier soil with a low potential restrains Touriga Naçional’s naturally vigorous growth, which influences the canopy micro-climate (Fletcher, 1978). Climate, on the other hand, has implications for the physiology of the vine. Photosynthesis and respiration are sensitive to environmental conditions. At the same time, precursors of secondary compounds in the berries are synthesised from photosynthetic and respiration products and form the framework for colour and aroma compounds. Excellent quality Touriga Naçional wines and port wines have a dark black/purple colour and complex aroma, which is why the presence of polyphenols in grapes is essential for wine and port wine quality.
2.2 Background
2.2.1 Touriga Naçional
Touriga Naçional grapevines have naturally vigorous growth and should, therefore, be planted in low-potential soils, such as poor and rocky soils, to restrain their growth (Guichard et al., 2004). The grapes have a high resistance to heat and most diseases. Downy mildew can infect the grapes during hot rainy days during spring and summer but this is easily treated with a systematic agent (Guichard et al., 2004). Under restrained conditions, Touriga Naçional produces small bunches with very small, short, oval-shaped black berries (Goussard, 2008), that have the characteristics of high total acidity and lower pH values at harvest (Oliveira et al., 2006). Touriga Naçional produces very full-bodied, pitch-black wines and port-style wines with a purple edge, intense aromatic properties, high extract (Stevenson, 1988) and high tannin content (Guichard et al., 2004). These properties and balanced flavours that turn into more complex aromas as the port-style wine ages are characteristic of aged vintage ports.
2.2.2 Douro Demarcated Region (DDR)
Touriga is cultivated mainly in the DDR. The DDR is also the only region in which research has been performed on Touriga Naçional.

8
In 1998, only 2% of the DDR vineyards were planted to Touriga Naçional vines. The reason for this was that the original clones for Touriga Naçional were subject to poor berry set. Touriga Naçional is a naturally vigorous variety, and the more vigorously the grapevine grows, the worse the berry set and the poorer the organoleptic varietal characteristics. However, clonal selection has improved the situation over the past decade, and more Touriga Naçional vineyards are being planted (Guichard et al., 2004). Touriga Naçional is used mainly in the production of port wine, but in recent years has also been used for the production of dry red wine. Although Portugal has the largest area under Touriga Naçional, especially in the DDR, more and more vines are being planted in other countries, such as in South Africa, where 87 ha were planted in 2008 (Van Wyk & Le Roux, 2008), the USA (Goldfarb, 2007) and Australia (Higgs, 2009). In the beginning of the eighteenth century, trading between Great Britain and Portugal flourished. The increasing English demand for port wine raised the price of this commodity. This encouraged fraud and falsification of the product, using brandy, elderberries, sugar and other mixtures in adulterations. The British merchants decided to stop the purchase of port wines from farmers, whom they accused of fraud, and the prices dropped in the 1740s. In 1757 the first borders of the DDR were drawn, making it one of the first controlled appellations of origin. The region was delimited to prevent fraud with port and to maintain the quality of the fortified wines (Guichard et al., 2004). The DDR has expanded over the years and the current border was demarcated in 1921. In an effort to ensure that the rate by which production increases does not exceed the rate of demand, the government established a vineyard scoring system. This prevents prices being affected by fluctuations in the market. The way the DDR government limits production is by enforcing a vineyard scoring system. Port wine quotas are then awarded to the vineyards with the highest scores. This method was conceived by Álvaro Moreira da Fonseca and was first applied in 1947 (Guichard et al., 2004). The Vineyard Classification Criteria take into account all the terroir elements that influence the quality of the grapes (Table 2.1) and ranks the vineyards form A to F (Table 2.2). “A” is acknowledged as having the highest quality potential. Terroir is a French word that describes the interaction of the soil, terrain and climate effects on the vine, combined with the human factor and viticultural management practices that influence the quality of the grapes (Turner & Creasy, 2003).

9
Table 2.1 The Douro Vineyard Quality Classification Criteria - scoring method (Fletcher, 1978)
Factors considered Minimum points
Maximum points
Weight of each factor as %
Altitude -900 150 20.6
Productivity -900 120 20.0
Nature of the land (soil) -600 100 13.7
Locality -50 600 12.7
Methods of cultivation -500 100 11.8
Varieties -300 150 8.8
Slope -100 100 3.9
Aspect -30 100 2.5
Density -50 50 1.9
Stoniness 0 80 1.6
Age of the vine 0 70 1.3
Shelter 0 60 1.2
Table 2.2 Classification of Douro vineyards (to be interpreted together with Table 2.1) (Fletcher, 1978)
Class Scoring
A Over 1 200 points
B 1 001 to 1 200 points
C 801 to 1 000 points
D 601 to 800 points
E 401 to 600 points
F 201 to 400 points
The altitude of vineyards in the DDR is considered to be the most important quality-determining enviromental factor, and is given the largest weight in percentage points. Altitude affects the mesoclimate directly. The temperature is lower and the humidity higher on the hillsides at higher altitude, in comparison with low-elevation terrace sites situated near the Douro River (Mateus et al., 2002b). The lower altitude and thus warmer, drier vineyards receive the highest points. Productivity is not only affected by the climate, but also by the soil and grape varietal and is considered to be linked to grape quality. The most points are awarded to an average production of 600 litres and less, per 1 000 vines (approximately 0.9 kg per vine). Thus the lowest production receives the most points. Average productions of more than 1 000 litres per 1 000 vines are penalised.

10
Soils also play a large part in the determination of the potential quality of the grapes. Schistose soils are recognised as the best soils in the DDR and are awarded the highest points because of their ability to restrain Touriga Naçional’s naturally vigorous growth. To the contrary, granite soils on the edge of the DDR border do not have the same ability to restrain the inherent vigorous growth and are therefore penalised. The DDR is subdivided into different climatic regions and each section has a point value. The points for each section are generally based on climatic conditions, and in particular rainfall and temperature. The contribution of slope and aspect depends on the sub-region, but, in general, southern aspects and the steepest slopes are preferred. Southern aspects in the northern hemisphere have more sunlight interception, while the steeper slopes have good drainage, which aids in restraining the growth. Grape quality in the DDR is found to be negatively influenced by strong winds, especially cold strong winds, thus the more sheltered the vineyards the better quality the grapes produced. In Australia, winds stronger than 3-4 m.s-1 have been found to result in stomatal closure and consequently to limit CO2 uptake and photosynthesis (Freeman et al., 1982). The less dense, older grapevines are recognised as the best and are awarded the most points. Touriga Naçional is one of the recommended black grape varieties and will score the highest point as varietal (Fletcher, 1978). This unique method is used for allocating licenses for making fortified wine (Guichard et al., 2004). All wine made from vineyards classified “A” (Table 2.2) are allowed to produce port wines. The other classifications receive the right to produce other regional appellations and a small amount of port wines, with the remainder of the crop being directed towards table wines (Fletcher, 1978).
2.3 The influence of dominant environmental factors on the growth vigour of
grapevines
The characteristics of soil and, in particular, its water retention capacity, together with the climate as affected by topography, are the principle factors that contribute to Touriga Naçional’s growth vigour in the DDR. These factors influence port wine’s unique characteristics (Guichard et al., 2004).
2.3.1 Soil
The DDR border that was originally drawn in 1757 was based on the pre-Ordovician geological epoch schistose clay (Guichard et al., 2004). Most of the DDR soils are schistose-sandstone, but granite starts to dominate towards the outer boundaries of the region (Fletcher, 1978). The schistose clay soil of the DDR is a poorer, rockier soil. It usually contains a thin (9 cm to 25 cm) layer of clay/sandy loam-textured soil with a high percentage of broken rock to ensure good drainage (Guichard et al., 2004). This restrains Touriga Naçional’s natural vigorous growth. The stony surface absorbs more heat during the day and radiates the heat gradually at night, which helps control extreme temperatures and modifies the grapevine microclimate. In shale-derived soils, heat penetrates more easily (Fletcher, 1978). Cultivation practices and terraces create their own individual micro-environment for the vineyards, with a limited soil volume that is found on original consolidated rock (Oliveira, 1993). The soils have little organic matter (0.6-1.6%), a low soil pH of 4.6 to 5.5, and low potassium and phosphorous contents (Guichard et al., 2004).

11
Lateral roots are found mainly below 45 cm. This is where most of the soil water is stored in the mid-growing season, since little or no moisture is found on the surface horizon because of the extreme temperatures that cause the soil water from the surface layers to evaporate quickly at the start of the growing season (Oliveira, 1993). All grapevines can withstand water deficits for considerable periods of time. Predawn leaf water potential ranges between -0.2 and -0.3 MPa for Vila Real (Baixo Cargo) and Pinhão (Cima Cargo) respectively at véraison, while Almendra (Douro Superior), where the soil water availability is lower, has a predawn leaf water potential of -0.6 MPa. At ripeness, the predawn leaf water potential of Pinhão and Almendra was lower, at -0.7 and -0.8 MPa respectively, due to a higher depletion of soil water (Moutinho-Pereira et al., 2004). The soil characteristics are not the only factors that influence the plant water status. Each of the sub-regions mentioned above has a different mesoclimate, which is determined by topographic factors, and this also has a great impact on plant water status and on the growth vigour of the grapevine.
2.3.2 Climate
Topographic factors, such as location, landscape, altitude, slope, aspect and shelter, determine the mesoclimate of a particular vineyard. Growth vigour can cause canopy density and is the main factor that influences microclimate (Fletcher, 1978). The most notable aspects of the Douro macro climate are the extremes in temperature throughout the year. In winter, the temperatures often fall several degrees below zero, whilst in July and August temperatures can rise above 40°C (Guichard et al., 2004). The DDR is subdivided in three sub-regions (Fig. 2.1) according to climatic differences (Fig. 2.2) (Guichard et al., 2004). Baixa Corgo has a strong maritime influence and is situated in the most westerly part of the valley. Cima Corgo is in the centre of the region and is considered to be the best suited for the production of port wine. Douro Superior is situated in a semi-arid, Mediterranean environment with a very high potential for the production of either fortified or natural wines of very high quality (Linddell, 1992). Average summer temperatures decrease from east to west, while rainfall follows the inverse pattern (Oliveira, 1993).
Figure. 2.1. Sub-regions of the DDR based on climatic differences: Baixo Corgo (left), Cima Corgo (centre) and Douro Superior (right) (www.rozes.pt/UK/portwine/douro.jpg)

12
Figure. 2.2 Mean temperature (lines) and monthly precipitation (columns) for the period 1931-1960 in the three sub-regions of the DDR. Almendra (AL) in the Douro Superior sub-region, Pinhão (PI) in the Cima Corgo sub-region, and Vila Real (VR) in the Baixo Corgo sub-region (Moutinho- Pereira et al., 2004)
The landscape of steep hills next to the Douro River serves as a protective barrier against the damp Atlantic winds (Fletcher, 1978). A series of high mountains, Marão and Montemuro, on the north and south banks of the Douro act as a shield against the cold northerly winds (Guichard et al., 2004; Fletcher, 1978). The wind tunnels formed by the valleys create significant mesoclimatic variation from one vineyard to another (Guichard et al., 2004). This leads to climatic conditions that are peculiar to the Douro alone, and to the possibility of per vineyard quality scoring (Fletcher, 1978). Most of the vineyards in the Douro are situated on hillsides. Altitude can strongly affect the climatic conditions, since it impacts directly on temperature, humidity and other environmental factors, and in turn affects grapevine vigour and grape maturation. The temperature is lower and the humidity higher on the hillsides at higher altitude, in comparison to low-elevation terrace sites situated near the Douro River (Mateus et al., 2002b). A higher altitude combined with a steep slope and schistose clay soil gives good drainage to the soils and, at the same time, a low water-holding capacity. All these factors create a water-stressed environment, mainly during the summer. On the low-elevation terraces next to the Douro River the temperature and humidity will be more constant. Although the vineyards will experience water deficits, they will not be as severe as on the high terraces. This will result in increased grapevine vigour compared to the terraces at a higher elevation. Water deficits, in moderation, are beneficial and reduce the soil potential, but severe stress can have negative impacts on the physiology of the grapevine and berry quality as a result of impacts on various metabolic processes, especially with regard to phenolic and terpene compounds (Oliveira, 1993).

13
Severe stress, not only affects the berry composition, but will also affect the yield of the current season and the productivity of the next season (Oliveira, 1993) because the bunch primordia develop 15 months prior to harvest (Smart & Robinson, 1991). The aspect of the slope is important for sunlight interception. The more sunlight intercepted, the warmer the slope and thus the vineyard. Southern aspects have the highest temperature and the most sunlight interception, and are commonly known as the best aspect in the DDR (Fletcher, 1978). The vigour of the grapevine determines canopy microclimate. Increased vegetative growth results in increased pruning weights and an increased leaf-area index. Canopy density will be higher and bunch exposure will be less (Oliveira et al., 2003). Bunch exposure is important for metabolic processes, especially for the synthesis of phenolic components such as anthocyanins and terpene compounds such as carotenoids.
2.4 The influence of climate on the physiology of the vine
Grapevines are complex biological systems that are affected by environmental aspects. Physiology is the science of regulatory and control processes such as photosynthesis, respiration and the formation of secondary compounds in the berry. Photosynthesis is an energy-fixing reaction on which all life depends. It involves the oxidation of water and the reduction of carbon dioxide to form organic compounds such as carbohydrates. During the process of respiration, in contrast, electrons are removed from carbon compounds and are combined with oxygen to form carbon dioxide and water and energy is released simultaneously for use in metabolic reactions (Kriedemann, 1968). Photosynthesis is affected by light intensity, cultivation practices, site and leaf age. In general, the optimal temperature for photosynthesis can be considered to be between 20 and 30°C. There will be a decline in photosynthetic activity at temperatures above 35°C and no activity at temperatures between 45 and 50°C (Kriedemann, 1968). Suboptimal photosynthetic activity will lead to a decrease in berry sugar content. Temperature increases up to 33°C have been found to have a positive effect on sugar accumulation in the grapes skins and flesh (Coombe, 1987). Wind speeds of 3 to 4 m/s can also affect photosynthesis and transpiration negatively through the closing of stomata (Freeman et al., 1982). Seasonal changes in the leaf water potential of Touriga Naçional show a similar pattern, of high at véraison and low at harvest, as the net carbon dioxide assimilation rate, stomatal conductance, mesophyll conductance to carbon dioxide and transpiration rate. A gradual downwards response of photosynthesis to water deficit was found during the season from véraison to harvest (Moutinho-Pereira et al., 2004). The reduced photosynthesis can influence the formation of the precursors of berry components negatively and, under severe water deficit, can have a negative impact on berry composition and wine quality. Partial stomatal closure is induced under moderate deficit conditions. Under severe stress conditions, it was found that metabolic adjustments, such as reducing osmotic potential to restrict leaf water losses, were made (Moutinho-Pereira et al., 2004). The leaves of vines under severe stress were found to be up to 2°C hotter than those under moderate to low stress because of the low transpiration rate (Moutinho-Pereira et al., 2004). Leaf temperatures under stressed conditions in the DDR can reach as much as 9°C above air temperature (Oliveira, 1993). But for Touriga Naçional vines, differences between leaf and air temperature at ripening show up to 1.2°C higher leaf temperatures in the morning period under severely stressed conditions compared to low stress conditions. At véraison, differences of only about 1°C are found in the morning. At midday, a difference of about 1°C higher leaf temperature than air temperature has been found for stressed Touriga Naçional grapevines at ripening, and about 2°C higher leaf temperatures at

14
véraison (Moutinho-Pereira et al., 2004). Diurnal variation in intrinsic water-use efficiency (WUE) was monitored and no variation was found for Touriga Naçional vines planted in areas with limited summer stress conditions during the day, but vines planted under moderate summer stress conditions exhibited a significant increase in WUE throughout the day. This suggests a higher drought-avoiding strategy relative to the vines under severe stress conditions (Moutinho-Pereira et al., 2004). At harvest time, intrinsic WUE that decreased from morning to midday was not found to recover in the afternoon. This behaviour at ripening, when environmental stress conditions are more severe, could suggest that the lower assimilation rate is related to stomatal closure. The limitations for photosynthesis under the low and moderate stress conditions were caused to a greater extent by stomatal limitations, while mesophyll limitations were also responsible for the summer decline in net assimilation rate under conditions of severe stress (Moutinho-Pereira et al., 2004). Touriga Naçional can thus be considered an isohydric variety. Under severe water stress conditions, such as experienced in the DDR during the summer of a dry year (e.g. 1992), grapevines will withdraw their water from their fruits as a last resort. In some of the more sensitive varieties, unlike Touriga Naçional, the grapevine will start shedding leaves. Grapevines can also control the size and number of clusters of fruit produced according to the water availability of the season. Exposure to severe water stress during induction will also have negative effects on production in the following season, because grapevines are a perennial crop (Oliveira, 1993). Secondary compounds in the berry are also affected by the reduced photosynthetic rate because carbohydrates will be broken down by respiration. Furthermore, primary metabolites of respiration are precursors of colour and aroma compounds and will have an influence on berry composition and quality.
2.5 The influence of climate on berry composition and quality
Phenolic components consist of flavonoids, anthocyanins and tannins (Timberlake & Bridle, 1976). Proanthocyanidins are a family of polyphenol compounds that contribute to astringency, bitterness and colour and are composed of chains of flavan-3-ol units (Timberlake & Bridle, 1976). Polyphenol composition depends largely on climate. Anthocyanin accumulation in the Touriga Naçional berries can be influenced by humidity and temperature, among other factors (Mateus et al., 2001a). Optimal temperatures for anthocyanin accumulation in grape berries are commonly considered to be in the range of 15 to 25ºC during the day, and 10 to 20ºC during the night. Temperatures above 35ºC or below 15ºC, as well as excess humidity and irrigation, tend to decrease the anthocyanin content (Kliewer & Torres, 1972). A well-exposed canopy will also increase colour development in red grapes (the enzyme responsible for anthocyanin formation, namely phenylalanine ammonia lyase, is light dependant) (Hunter et al., 1991). In one study, the anthocyanidin monoglucoside (AMG) content of Touriga Naçional berries during the period véraison to harvest was studied over three consecutive years. The AMG that was measured by HPCL analysis shown that malvidin-3-glucoside and its respective acylated esters (acetyl, coumaroyl and caffeoyl esters) were the most relevant anthocyanins in Touriga Naçional grape skins (Mateus et al., 2001b). The AMGs started to increase from véraison until a maximum concentration was reached between 40 and 60 days after véraison, and then decreased until harvest. In general, physiological maturity was achieved a few days after the maximum level of AMGs was reached. When higher and lower terrace sites were compared at harvest, the high altitude site, which presented a lower temperature during the maturation period, appeared to have a higher accumulation of AMGs in the grape skins (Mateus et al.,

15
2002a). When the red colour of the grape skins was analysed by measuring the absorbance at 520 nm (A520), it was also found that the colour intensity of the grapes from the vineyards with a higher altitude (300 to 350 m above sea level) was higher than those from the lower altitude (100 to 150 m above sea level) over a period of three years (Mateus et al., 2002a). In 1997, which had the lowest average temperature of the three years, the accumulation of AMGs in the berries was lower for the high-altitude vineyards when compared with the lower altitude vineyards. The red colour intensity showed the same trend in 1997 (Mateus et al., 2002a). The flavan-3-ol components, precursors of anthocyanin, were also found to be higher at the lower altitude vineyards, with higher temperatures and humidity in 1997 (Mateus et al., 2001a). It must be remembered that colour is not the only attribute of quality in grape berry skin. Although a well-exposed canopy will be associated with increased colour development in the berry, it will not necessarily affect the phenolics in the skins (Hunter et al., 1991). Carotenoids are C40 terpenoid compounds and are known as precursors of C13- norisoprenoids, such as α- and β-ionone or β-damascenone (Oliveira et al., 2006), which are responsible for the typical aroma of some varieties. Carotenoids are classified into carotenes (hydrocarbon carotenoids) and xanthophyll (oxygenated carotenoids). The carotenoids neochrome a and b, (9’Z)-neoxanthin and violaxanthin have been identified in port grape varieties. Carotenoid-like structures, (9Z)-lutein and (9’Z)-lutein, were also identified. The compounds that appeared in the highest amounts were lutein, β-carotene (Mendes-Pinto et al., 2005; Oliveira et al., 2006), chlorophyll b, pheophytin a and pheophytin b (Mendes-Pinto et al., 2005). No chlorophyll a was detected with the RP-HPCL in the grape berry of Touriga Naçional (Mendes-Pinto et al., 2005). β-Carotene and lutein are converted into neoxanthin, violaxanthin and luteoxanthin, and these compounds are then degraded into smaller molecules, called norisoprenoids, which are then glycosylated (Oliveira et al., 2006). Variety, terroir, sunlight exposure, soil water retention capacity as well as ripening stage affect carotenoid concentration in the grapes (Baumes et al., 2002; Oliveira et al., 2003). Light has one of the largest effects on carotenoid content (Oliveira et al., 2003). In general, the highest concentrations of carotenoids are found in grapes produced in hot regions. However, at maturity, grapes exposed to direct sunlight seem to have lower carotenoid concentrations than grapes that are protected from the direct sun (Oliveira et al., 2004). Bunches exposed to direct sunlight during the day can be up to 15°C warmer than the ambient air temperature (Smart et al., 1977). Soil water retention capacity is considered to be important because it influences canopy density through growth vigour and thus determines canopy and bunch shading (Oliveira et al., 2003). Irrigation results in reduced levels of carotenoids in grapes when the vines are planted in soils with a lower soil water retention capacity. However, in soils with a higher water-retention capacity, it seems that irrigation does not have any effect on the carotenoid concentration (Oliveira et al., 2003). Irrigation also contributes to a higher photosynthetic activity, and therefore higher sugar accumulation than in water-stressed vines (Oliveira et al., 2003). The higher photosynthetic activity can be due to a prolonging of the period of photosynthetic activity by slowing leaf senescence. This effect can contribute to a lower rate of sugar transport towards the berries in stressed vines. Berry size increases with higher sugar concentration (Oliveira et al., 2003). So, it seems likely that it is possible to produce grapes with higher weight and sugar levels, together with similar carotenoid content on irrigated soils with a higher soil water retention capacity. Carotenoid concentration has also been found to be affected by altitude. Altitude affects climatic conditions since it impacts directly on temperature and humidity. Higher altitudes have a lower temperature and higher humidity (Mateus et al., 2002b). Three sites of Touriga Naçional at different altitudes (90 m, 155 m and 210 m) were compared. At grape maturation,

16
the carotenoid, lutein and β-carotene concentrations of grapevines growing at 155 m altitude were significantly higher than in the other two plots (Oliveira et al., 2004), suggesting that moderate temperatures on the middle slope are optimal for carotenoid accumulation. Carotenoid content, especially lutein and β-carotene contents, has been found to decrease as sugar (ºB) increases. Chlorophyll a has also shown a decrease (Oliveira et al., 2003). This result was not only found for Touriga Naçional, but is in agreement with results from other varieties (Razungle et al., 1996).
2.6 The influence of berry composition and quality on wine quality
The presence of polyphenols in grapes is essential for wine and port-style wine quality, and for bottle ageing of vintage ports (Mateus et al., 2001a). Touriga Naçional is used to produce top-quality port wines (vintage port) because of its phenolic composition (anthocyanins and flavanols). Colour is a major quality attribute of port wine, which is why anthocyanin development during ripening is considered to be extremely important. The colour intensity and stability of the wine not only depends on the anthocyanin concentration, but also on intra- and intermolecular co-pigmentation and self-association of the anthocyanins (Mateus et al., 2002a; Mateus et al., 2001b). If the grape skin results of the AMGs and absorbency (Mateus et al., 2001b) are taken into consideration independently, it seems that the climatic factors at the low altitude (i.e. warmer and more humid) appear to be unfavourable for the formation of red colour in the grapes, although the opposite appears to be true when looking at the resulting wines. Wines made from lower-altitude grapes appear to have greater colour intensity (Abs 520 and Abs 620 nm). In some of the literature it was found that the original proportions of grape skin anthocyanins, namely malvidin-3-glucoside and its coumaroyl ester, were not always similar, but could be two to three times lower in the grape skin than in the resulting wines (Timberlake & Bridle, 1976). Furthermore, the proanthocyanidins depend mainly on their grape extraction rate during fermentation. There also were higher levels of low molecular procyanidin oligomers (PC) in wines made from the lower altitude grapes (Mateus et al., 2001b). Previous work has shown that colour can be affected by additional, subtle phenomena involving anthocyanins (Timberlake & Bridle, 1976). The interaction between the low-molecular PC and AMGs may occur through co-pigmentation phenomena. Further interaction may occur through direct condensation, or involving ethyl bridges between anthocyanins and PC components (Mateus et al., 2002a; Mateus et al., 2001b). All the above can explain why the evaluation panel appreciated the wine made from the lower altitude grapes, despite the fact that it had a lower content of AMGs compared with the wines made from the higher altitude grapes (Mateus et al., 2001a; Mateus et al., 2001b). The wines from the lower altitude had a higher astringency according to the panellists involved in the sensory evaluation (Mateus et al., 2001b). Tannins give structure to port wines. There are two types of tannins: hydrolysable tannins and condensed tannins. Hydrolysable tannins are not found naturally in grapes. Ellagic acid, found in wines, originates from the barrels, staves or commercial oenological tannins. On the other hand, gallic acid forms in the skin and seeds of grape berries (Ribereau-Gayon et al., 1998). Condensed tannins in grapes and wine are complex polymers of flavan-3-ols or catechins. (+)-Catechin and (-)-epicatechin are the basic structural units (Ribereau-Gayon et al., 1998). In Touriga Naçional wines, the levels of catechin monomers ((+)-catechin, (-)-epicatechin, (-)-epicatechin O-gallate) appear to be different between high and low altitudes, with the total catechin higher at lower altitudes. (+)-Catechin is shown to be the major monomer at low

17
altitudes, while (-)-epicatechin is dominant at high altitude (Mateus et al., 2001b). The implications of this phenomenon are still unclear, but the higher total catechin is essential for prolonged bottle ageing in quality port wines. Port wine was also analysed for carotenoids, and lutein and β-carotene were found to be present in the highest quantities. In aged port, compared to young ports, the β-carotene/lutein ratio was higher. This suggests that lutein degrades quicker than β-carotene during wine ageing (Mendes-Pinto et al., 2005). Chlorophylls have not been detected in port wines. Carotenoids are potential precursors of aroma compounds. 2,2,6-Trimethylcyclohexanone (TCH), β-ionone, 1,1,6-trimethyl-1,2-dihydronaphthalene (TDN) and β-damascenone are chlorophyll derivatives that have been identified in port wines (Mendes-Pinto et al., 2005). TDN is responsible for kerosene-like flavours in wines. β-Ionone can be described as having a violet-like aroma in wine and is formed by β-carotene degradation or by its sugar precursor hydrolysis. Free terpenols, namely linalool, α-terpineol, nerol and geraniol, are responsible for the floral-like aromas and are also found in high amounts in Touriga Naçional wines (Oliveira et al., 2006). The high content of terpenols and β-ionone in Touriga Naçional wines explains the characteristic floral and violet aromas of these wines. Bergamot-like descriptors are currently employed to rate higher quality Touriga Naçional wines. Linalool and linalyl acetate were identified in recent studies as the free terpenols responsible for the bergamot-like, orange-like and violet aromas (Guedes de Pinho et al., 2007). In a sensory descriptive analysis of Touriga Naçional wines, plum brandy, dry raisin, wild fruits, mulberry and cherry aroma were characterised (Falqué et al., 2004).
2.7 Conclusions
Touriga Naçional is one of the highest quality Portuguese red grape varieties. It produces high quality port wine as well as table wines. Excellent quality Touriga Naçional wines have a dark black/purple colour, great extract, high elegant tannin content and intensive aromatics, with typical plum brandy, dry raisin, wild fruits, mulberry and cherry aromas. In order to achieve this, the most suitable terroir for Touriga Naçional is soils that restrain the natural vigour of the vine. Soils with moderate to low water-holding capacity, in association with low rainfall, result in water deficits during the growing season and are considered optimal to restrict growth vigour. A steep, southern middle slope is ideal in the northern hemisphere, as it provides high temperatures and sunlight interception. High temperatures (25-30°C) during the day and cooler temperatures during the night (10-20°C) are optimal for photosynthesis and colour development. Temperatures above 40°C for long periods of time are sub-optimal, and temperatures of between 25 and 35°C at midday are considered optimal for port wine production. Mean temperatures at the lower altitude sites in the DDR are on average in the range of 29 to 33ºC during the berry-ripening stage and are considered to be optimal for Touriga Naçional. A well-exposed canopy will also increase colour development, but will not have an effect on total phenolics. Variety, terroir, sunlight exposure, soil water retention capacity as well as ripening stage affect the carotenoid concentration in grapes. Moderate temperatures on a low to middle slope positions with high sunlight interception are not only ideal for colour development, but also optimum for carotenoid accumulation in Touriga Naçional berries. This contributes to the flavour and aromas of the grape berry and, in the end, of the wine. Light has one of the largest effects on carotenoid content, which is why sunlight interception on a southern slope is so important. In general, the highest concentrations of carotenoids are found in grapes produced in hot regions, but not in grape berries that are directly in the sun.

18
Touriga Naçional grapes have the characteristic of high total acidity and low pH values that are good for wine quality. A low pH adds more of the red flavylium cation to wine. Wines from lower altitude grapes in the DDR appear to have greater colour intensity, as well as higher astringency. Precursors from carotenoids are responsible for kerosene and violet-like flavours, floral-like aromas and bergamot-like descriptors, which give the character of plum brandy, dry raisin, wild fruits, mulberry and cherry aroma that is desirable in the DDR. Touriga Naçional wines and port wines in South Africa, particularly in Calitzdorp, have typical dry apricot, plum, raisin, wild fruits, mulberry, “fynbos” and cherry aromas.
2.8 References
Baumes, R., Wirth, J., Bureau, S., Gunata, Y. & Razungles, A..2002. Biogeneration of C13-norisoprenoid compounds: experiments supportive for an apo-carotenoid pathway in grapevines. Anaytical. Chimica. Acta 458(1), 3-14.
Coombe, B.G. 1987. Influence of temperature on composition and quality of grapes. Acta Horticulturae 206, 23-35.
Falqué, E., Ferreira, A.C., Hogg, T. & Guedes-Pinho, P., 2004. Determination of aromatic descriptors of Touriga Nacional wines by sensory descriptive analysis. Flavour and Fragrance Journal 19, 298-302.
Fletcher, W. 1978. Port. An introduction to its history and delights. Sotheby, London and New York.
Freeman, B.M., Kliewer, W.M. & Stern, P., 1982. Influence of windbreaks and climatic region on diurnal fluctuation of leaf water potential, stomatal conductance, and leaf temperature of grapevines. Am. J. Enol. Vitic. 33, 233-236.
Goldfarb, A. 2007. A visit to Prager Port Works: has the ship finally come in for California Port-style wines? Appellation America. http://wine.appellationamerica.com/wine-review/369/Prager-California-Port-Wines.html (Retrieved 30/09/2009).
Goussard, P.G. 2008. Druifkultivars vir wynbereiding in Suid-Afrika. Cape Town, Cheviot Publishing.
Guedes de Pinho, P., Falqué, E., Castro, M., Oliveira e Silva, H., Machado, B. & Ferreira, A.C.S., 2007. Further insights into floral character of Touriga Nacional wines. Journal of Food Science 72(6), S396-S401.
Guichard, F., Pereira, G.M., Guimaraens, D., Peixoto, F., De Almeida, A.R., Silva Lopes, T., Sandman, G. & Carvalho, M., 2004. Port wine. Instituto dos Vinhos do Douro e do Porto.
Higgs, D. 2009. Australian wine from alternative grape varieties. Touriga Nacional wine variety. VinoDiversity. http://www.vinodiversity.com/touriga-nacional.html (Retrieved 30/09/2009).
Hunter, J.J., De Villiers, O.T. & Watts, J.E., 1991. The effect of partial defoliation on quality characteristics of Vitis vinifera L. cv. Cabernet Sauvignon grapes II. Skin, skin sugar, and wine quality. Am. J. Enol. Vitic. 46, 306-314.
Kliewer, W.M. & Torres, R.E., 1972. Effect of controlled day and night temperature on grape coloration. Am. J. Enol. Vitic. 23, 71-77.
Kriedemann, P.E. 1968. Photosynthesis in vine leaves as a function of light intensity, temperature, and leaf age. Vitis 7, 213-220.
Linddell, A. 1992. Port wine quintas of the Douro. Sotheby, London.
Mateus, N., De Pascual-Teresa, S., Rivas-Gonzalo, J.C., Sanos-Buelga, C. & De Freitas, V., 2002a. Structural diversity of anthocyanin-derived pigments in port wines. Food Chemistry 76, 335-342.
Mateus, N., Machado, J.M. & De Freitas, V., 2002b. Development changes of anthocyanins in Vitis vinifera grapes grown in the Douro Valley and concentration in respective wines. J. Sci. Food Agric. 82, 1689-1695.
Mateus, N., Marques, S., Goncalves, A.C., Machado, J.M. & De Freitas, V., 2001a. Proanthocyanidin composition of red Vitis vinifera varieties from the Douro Valley during ripening: influence of cultivation altitude. Am. J. Enol. Vitic. 52, 115-121.
Mateus, N., Proenca, S., Ribeiro, P., Machado, J.M. & De Freitas, V., 2001b. Grape and wine polyphenolic composition of red Vitis vinifera varieties concerning vineyard altitude. Cienc. Tecnol. Aliment. 3(2), 102-110.
Mendes-Pinto, M.M., Ferreira, A.C.S., Caris-Veyrat, C. & De Pinho, P.G., 2005. Carotenoids, chlorophyll and chlorophyll-derived compounds in grape and port wines. J. Agric. Food Chem. 53, 10034-10041.

19
Moutinho-Pereira, J.M., Correia, C.M., Goncalves, B.M., Bacelar, E.A. & Torres-Pereira, J.M., 2004. Leaf gas exchange and water relations of grapevines grown in three different conditions. Photosynthetica 42(1), 81-86.
Oliveira, C., Barbosa, A., Silva Ferreira, A.C., Guerra, J. & De Pinho, P.G., 2006. Carotenoid profile in grape related to aromatic compounds in wines from Douro region. Journal of Food Science 71(1), S1-S6.
Oliveira, C., Ferreira, A.C., Costa, P., Guerra, J. & Guedes de Pinho, P., 2004. Effect of some viticultural parameters on the grape carotenoid profile. J. Agric. Food Chem. 52, 4178-4184.
Oliveira, C., Silva Ferreira, A.C., Pinto, M.M., Hogg, T., Alves, F. & Guedes de Pinho, P., 2003. Carotenoid compounds in grapes and their relationship to plant water status. J. Agric. Food Chem. 51, 5967-5971.
Oliveira, M. 1993. Plant water stress under low rainfall, high temperature summer conditions in Portugal. NATO ASI Series, 16, Interacting stresses on plants in a changing climate. Springer-Verlag, Berlin.
Razungles, A., Babic, I., Sapis, J., Bayonove, C., 1996. Particular behavoir of epoxy xanthophylls during veraison and maturation of grape. J. Agric. Food Chem. 44, 3821-3825.
Ribereau-Gayon, P., Glories, Y., Maujean, A. & Dubourdieu, D., 1998. Handbook of enology. Volume 2: The chemistry of wine stabilization and treatments. John Wiley & Sons, Chichester, New York, Weinheim, Brisbane, Singapore and Toronto.
Smart, R. & Robinson, M., 1991. Sunlight into wine. Winetitles, Adelaide.
Smart, R.E., Dry, P.R. & Bruer, D.R.G., 1977. Field temperature for grape berries and implications for fruit composition. In: Proc. Int. Symp. Qual. Vint., 14-21 February 1977, Cape Town, South Africa. pp. 227-231.
Stevenson, T. 1988. Sotheby’s world wine encyclopaedia. Dorling Kindersley, London.
Timberlake, C.F. & Bridle, P., 1976. Interactions between anthocyanins, phenolic compounds and acetaldehyde and their significance in red wines. American Journal of Enology and Viticulture, 27, 97-105.
Turner, P. & Creasy, G.L., 2003. Terroir: competing definitions and applications. Wine Industry Journal 18, 48-55.
Van Wyk, G. & Le Roux, F., 2009. Statistics of Wine-grape vines as on 30 November 2008. SAWIS. http://www.sawis.co.za/info/download/Artikel_2009_Wingerdstand_Eng.pdf (Retrieved 30/09/2009).

CChhaapptteerr 33
Materials and Methods

21
Chapter 3: Materials and Methods
3.1 Experimental vineyard
Two Vitis vinifera L. cv. Touriga Naçional commercial vineyards in the Calitzdorp District in the Little Karoo Region of the Western Cape province of South Africa were selected. Each vineyard was divided into two separate management blocks based on their empirically determined quality of production. The commercial vineyard at Vlakte consisted of eleven-year-old ungrafted Touriga Naçional grapevines under flood irrigation. Vine rows were orientated approximately north to south on a west-facing slope. The upper site is 222 m above sea level and the lower site is at 219 m. The other Touriga Naçional vineyard, at Doringbos, was grafted on Righter 110 (Vitis Berlandieri var. Rességuier no 2 x Vitis Rupestris var. Martin) and micro-irrigation was used to irrigate the grapevines. The vine rows at Doringbos were orientated east to west on a southern slope. The upper site is 230 m above sea level and the lower site 225 m. All the grapevines were trained on a seven-wire Perold trellis system with two sets of moveable wires. The first set of wires was 20 cm from the cordon wires and thereafter spaced at 30 cm. The grapevines were spaced 2.7 m x 1.5 m. The grapevines were pruned to two-bud spurs with about 16 buds per metre cordon. The canopies were suckered to two shoots per spur at 10 cm shoot length, shoot positioned and tipped/topped during the pre-véraison period. The grapevines were irrigated once between flowering and harvest, as deemed necessary during the season, to avoid excessive water stress.
3.2 Treatment and experimental layout
Five vineyard rows were randomly selected in each of the four management blocks. Within each row, three experimental plots of five grapevines each were allocated randomly. These grapevines were used for measurements of growth and functioning under standard management practices. Fifty percent crop reduction is the standard practice in these vineyards, but it is a drastic management practice for any vineyard. The 50% crop reduction was considered to be a control, and a further, less drastic treatment of 25% crop reduction was applied. At pea-size, bunches per 2 m cordon were counted randomly in the vineyard and yield estimations were calculated using bunch weights of the previous years. Crop reduction was done at two stages based on the bunch numbers. The first crop reduction was done just prior to véraison. For the control, four bunches were examined at a time and the bunch on the weakest shoot was removed. A similar action was performed for the 25% crop reduction, but in this case the bunch on the weakest shoot was removed for every eight bunches. The second crop reduction was done at 80% véraison and, once again, four (50% crop reduction) and eight (25% crop reduction) bunches were examined and the one that was not completely coloured was cut off. The previously described layout was copied for the treatment. An additional five plots of fifteen grapevines each were laid out randomly in each of the four management blocks, as described above.

22
3.3 Climatic parameters
Climate data (temperature, relative humidity, rainfall, wind speed and evapotranspiration) were obtained from a meteorological station situated 150 m from Lower Doringbos. A Tinytag ultra datalogger (TGU-1500) was situated at 2 m above ground level in a gill screen in the grapevine canopy at each management block. Temperature and relative humidity were recorded hourly, and the daily and monthly means were calculated.
3.4 Vineyard measurements
The phenological stages of budburst, flowering, véraison and harvest-ripe were monitored and noted during the season of 2007/2008.
3.4.1 Soil analyses and root distribution
Three profile pits, 1.2 m x 1 m and 1 m deep, were dug 40 cm from the trunk of the grapevine, parallel to the vineyard row in the management block. The represented grapevine was determined ramdamly from among the experimental grapevines. Soil profiles were described by a professional soil scientist. The profile wall method (Bohm, 1979.) was used to note root distribution on a grid of 10 cm x 10 cm. The roots were classified into five diameter categories: smaller than 1 mm, between 1 mm and 2 mm, between 2 mm and 5 mm, between 5 mm and 7 mm and thicker than 7 mm. Composite soil samples were collected in each profile pit at three different soil depths, namely 0-10 cm, 10-40 cm and 40-100 cm. The macro- and micro-element content, pHKCl and clay percentage were determined by an independent laboratory for each sample.
3.4.2 Canopy and leaf measurements
Canopy characteristics were determined by means of non-destructive and destructive measurements. A trained panel of three judges scored the quality of the canopy by means of a score card at véraison (Smart & Robinson, 1991). This panel was calibrated with respect to the size and colour of the leaves. The point quadrat method was used to determine the canopy density (Smart & Robinson, 1991). The rod insertions were done randomly into the canopy in the bunch zone at the different plots. A total of 150 insertions were performed for each experimental plot. Destructive measurements were performed just after harvest. Three shoots per plot were selected randomly and the leaves of the primary and lateral shoots were removed and separated. These leaves were then counted and their area was determined using a Delta-T leaf area meter (Delta-T Devices, Cambridge, UK).
3.4.3 Physiological measurements
Diurnal leaf water potential was measured in each of the experimental plots during flowering, bunch closure/berry pea-size and ripening. Diurnal leaf water potential cycles commenced one hour before sunrise and ended one hour after sunset. There were two-hour intervals between measurements. Leaf water potential was measured with the aid of a pressure chamber (Scholander et al., 1965). Primary shoot leaves from the middle of the shoot that had been exposed to the sun during the day were sampled. Three leaves from separate shoots were cut

23
from the selected grapevine in each row using a sharp blade. The pressure chamber was mounted on the back of a quad bike and taken into the vineyard rows. Diurnal leaf transpiration flow was measured every two hours with a Decagon Steady State Diffusion Porometer (Model SC-1; Decagon Devices, Pullman, WA) for each of the experimental plots during flowering, bunch closure/berry pea-size and ripening. These measurements were performed in conjunction with the diurnal leaf water potential cycles. Three leaves from different shoots were sampled from the middle of the primary shoot that was exposed to the sun during the day for each row. Measurements were performed after sunrise until just before sunset.
3.4.4 Cane measurements
Each grapevine within the experimental plots was pruned to six two-bud spurs per metre cordon in July 2007 and 2008. The pruning mass, cane mass, cane length, internode length and node number were determined simultaneously. The pruning mass per vine was weighed using a Micron electronic platform scale. The number of canes per grapevine were counted and the mean cane weight was determined. Four canes were selected randomly from each grapevine and their cane length and node number were determined. The mean internode length was calculated.
3.4.5 Berry analyses
Berry sampling of 100 berries per plot was performed every two weeks from véraison to harvest according to a standard sampling protocol. The berries were sampled randomly from the inside and outside of the canopy, as well as from the top and bottom of the bunch. Berry volume and mass, total soluble solids, titratable acidity and pH were determined immediately, and 50 berries were refrigerated at -40°C for 6 months for anthocyanin and tannin analyses after transport to the labarotory (360 km). Berry mass was determined by weighing (UWE, AQM 1500, microscale) 50 berries and the berry volume was determined by using 50 berries to displace water in a measuring cylinder. The total soluble solids (TSS) were measured by a refractometer (ATAGO pocket refractometer). A pH meter was used to determine the pH of the must and the acidity was measured by using an automatic titrator with 1N NaOH to titrate to an end point of pH 7. Anthocyanin determination: Fifty frozen berries were defrosted, weighed and homogenised with an IKA Ultra Turrax T18 basic blender for four minutes. After the berries had been homogenised, the homogenate was weighed. Anthocyanin determination was performed according to the method describe by Iland et al. (1996) by weighing one gram of homogenate and extracting it in 10 ml of 50% ethanol for one hour. The supernatant was then centrifuged at 3 050 rpm for ten minutes. 1 mL supernatant was diluted in 10 mL 1M HCl and was left for three hours. After three hours the absorbance values were read at 520 nm and 280 nm in quartz cuvets. The total anthocyanin concentration was expressed as mg of malvidin-3-glucoside per g berry weight or mg of malvidin-3-glucoside per berry (Somers & Evans, 1977; Iland et al., 2000). The total phenolics was expressed as absorbance units (au) per g berry weight or as au per berry. The anthocyanin content was calculated using the following formulas:

24
(g) berries 50 ofweight
1x
(g)extration for taken
homogenate ofweight
(g) berries 50
ofweighit
x100
(ml) voloume
extract Final
xfactordilution xHCl280A
ht)berry weig gram
per units e(absorbanc
htberry weig gram
per phenolics Total
50
1x
(g)extration for taken
homogenate ofweight
(g) berries 50
ofweighit
x100
(ml) voloume
extract Final
xfactordilution xHCl280A
berry)per units e(absorbanc
berryper phenolics Total
(g) berries 50 ofweight
1000x
(g)extration for taken
homogenate ofweight
(g) berries 50
ofweighit
x100
(ml) voloume
extract Final
xfactordilution x500
HCl520A
ht)berry weig gramper
nsanthocyani of s(milligram
htberry weig gramper Colour
50
1000x
(g)extration for taken
homogenate ofweight
(g) berries 50
ofweighit
x100
(ml) voloume
extract Final
xfactordilution x500
HCl520A
berry)per nsanthocyani
of s(milligram
berryper Colour
Tannin determination: A (+)-catechin standard curve was first prepared with (+)-catechin samples from 50 μL to 300 μL of standard catechin solution and then adjusting the volume to 875 μL with buffer C (25g of sodium dodecyl sulphate, 25 ml of triethanolamine and filled with distilled water to a final volume of 100 mL and adjusted to a pH of 9.4 with 2N HCl). A total of 125 μL of ferric chloride reagent was then added and the solution was mixed. A zero tannin sample with 785 μL buffer C and 125 μL of ferric chloride reagent was prepared simultaneously. The absorbance of the zero tannin was subtracted from the absorbance obtained from the standard tannin samples and the wine samples. The standard samples and the zero tannin were incubated for 10 minutes and the absorbance read with a spectrophotometer at 510 nm. The equation for the standard curve was calculated. The absorbance of the wine samples was substituted in the equation. Grape samples: The bovine serum albumin (BSA) method was adapted from Hagerman and Butler (1978). The 50 frozen berries were defrosted, weighed and homogenised with an IKA Ultra Turrax T18 basic blender for four minutes. Tannin determination was performed by weighing one gram of homogenate and extracting it in 10 mL 50% ethanol for one hour. The supernatant was then centrifuged at 3 050 rpm for ten minutes. The total volume of extraction was noted. Five hundred μL of supernatant were mixed with one millilitre of BSA protein in a micro-tube. BSA protein was prepared fresh every morning by making a solution out of 1 mg of BSA to 1 ml of buffer A. Buffer A was prepared with 6.0 ml glacial acetic acid and 4.97 g of NaCl, and it was filled up with distilled water to a final volume of 500 ml and than adjusted to a pH of 4.9 with NaOH pellets (Heredia et al., 2006). The supernatant and BSA protein were left to react at room temperature. After 15 minutes the solution was centrifuged at 14 000 rpm for five minutes to pellet the tannin-protein precipitate. The supernatant was removed from the pellet and washed with 2 x 1 mL buffer A. A total of 250 μL of buffer A was than added to the pellet and centrifuged at 14 000 rpm for one minute. The supernatant was then discarded and 875 μL of buffer C was added to the pellet and left for 10 min at room temperature. After incubation, the supernatant was vortexed until the pellet dissolved and, after a further 10-minute waiting period, the absorbance (background)

25
was determined at 510 nm. The spectrophotometer was zeroed with distilled water for back reading. Then 125 μL FeCl3 was added to the solution and, after 10 min incubation, the absorbance at 510 nm (1 cm plastic cuvet) was determined (final reading). The spectrophotometer was zeroed with 875 μL of buffer C and 125 μL of ferric chloride reagent for the final reading. The amount of protein-precipitable tannin in the sample was calculated as the final absorbance minus the background, and expressed in catechin equivalents by comparison with a standard curve: The 510 nm absorbance = (((Final reading) - (Blanc))-((Background)*0.875)*2) The 510 nm absorbance was then substituted in the standard curve equation as y to determine x as berry tannin (mg/L): y = mx + c. Corrected berry tannin (mg/L) = (berry tannin (final extraction volume/10))/(weight of homogenate taken from extraction/1))
10
1
(g)extration for
homogenate ofweight
(mL) volume
extration Final
]2)875.0A()A[(A(mg/L) tannin grape BackBlancFinal
m
c
3.5 Microvinification
Standard port-style and winemaking procedures were carried out, on a small scale, at Boplaas Winery in Calitzdorp for three of the repetitions (selected randomly) for each treatment in each management block. The grapes were destemmed, crushed and inoculated with BDX yeast (Lallemand). SO2 and NH4 were added to the must and fermentation took place in twenty-litre plastic containers at a temperature of 23°C. The cap was punched down four times a day to extract colour, flavours and tannins. The wine was fermented until dry, pressed and then it was inoculated with Lactoenos 450 PreAc malolactic bacteria from Laffort. After malolactic fermentation, the wines were racked and bottled unfiltered. The port-style wine was fermented until 11°B, pressed and fortified by adding wine spirits to 18% alcohol. It was then racked and bottled unfiltered.
3.6 Wine analyses
Wine analyses, with the exception of the anthocyanin and tannin determination, were performed after bottling by an independent laboratory. Alcohol (% v/v), residual sugar (g/L), pH, total acidity (g/L), volatile acidity (g/L), free and total sulphur (aspiration method) (mg/L) were determined. Anthocyanin determination: First 100 μL each of wine or port-style wine was diluted in 10 mL of 1M HCL and was left for three hours. After three hours the absorbance values were read in quartz cuvets at 520 nm and 280 nm. Tannin determination: The bovine serum albumin (BSA) method was adapted from Hagerman and Butler (1978). For this, 500 μL of wine or port-style wine was mixed with one mL of BSA protein in a micro-tube. The procedure described for berry analyses was then followed. The amount of tannin in the wine was calculated as the final absorbance minus the background, and expressed in catechin equivalents by comparison with a standard curve: The A520 = (((Final reading) - (Blanc))-((Background)*0.875)*2) The A520 absorbance was then substituted in the standard curve equation as y and x was determined as wine tannin (mg/L): y = mx + c.

26
m
c
]2)875.0A()A[(A(mg/L) tannin wine BackBlancFinal
3.7 Sensory analyses
Sensory analyses were performed for the wines and port-style wines approximately nine months after harvest. Triangle tests were used to compare the upper and lower parts of each farm and the crop reduction treatment effect within each management block. Each comparison was performed within a separate layout. The panellists were also asked whether the odd wine or port-style wine was better or worse than the others. This was considered to be equivalent to a paired preference test. Three samples were presented simultaneously to the judges – two samples were from the same treatment and one was from the other treatment. The six possible serving orders were randomised across all judges, with each judge being presented with three combinations (a total of 30 evaluations for each comparison), and the wine sample from each treatment was chosen randomly for each serving. The wines were coded with three-digit codes using a table of random numbers. The panel consisted of ten judges: two of these judges were Cape Wine Masters (specialising in port-style wines), three were wine and port-style winemakers, and five were wine and port-style wine consumers. All were experienced in wine evaluation. Water and crackers were provided and all evaluations were conducted at private tables. The Roessler table for triangle tests (one-tailed) was used to determine the minimum number of correct judgements to establish significance at the 0.05 probability level. For the thirty evaluations, 15 correct judgements were needed. The Roessler table for paired preference tests (two-tailed) was used to determine the minimum number of agreeing judgments necessary to establish significance at the 0.05 probability level. N was considered to be the number of correct responses in the triangle test. If a judge used a no-preference option, the no-preference judgements were split proportionally to the preference split.
3.8 Statistical analyses
All statistical analyses were performed using Statistica 8. For those cases where repeated measurements were done over time or at different depths, repeated measures ANOVA were done using the mixed model approach. In the other cases, two-way factorial ANOVA was done. A 5% significance level was used to determine significant differences (StatSoft, 2008).
3.9 References
Bohm, W. 1979. Methods of studying root systems. Springer-Verlag, Berlin.
Hagerman, A.E. & Butler, L.G., 1978. Protein precipitation method for the quantitative determination of tannins. J. Agric. Food Chem. 26, 809-812.
Heredia, T.M., Adams, D.O., Fields, K.C., Heldl, P.G. & Harbertson, J.F., 2006. Evaluation of a comprehensive red wine phenolics assay using a microplate reader. Am. J. Enol. Vitic. 57, 4.
Iland, P.G., Cynkar, W., Francis, I.L., Williams, P.J. & Coombe, B.G., (1996). Optimisation of methods for the determination of total and red-free glucosyl glucose in black grape berries of Vitis vinifera. Australian Journal of Grape and Wine Research 2, 171-178.
Iland, P., Ewart, A., Sitters, J., Markides, A. & Bruer, N., 2000. Techniques for chemical analysis and quality monitoring during winemaking. Patrick Iland Wine Promotion, Campbelltown.

27
Scholander, P.F., Hammel, H.Y., Bradstreet, E.D. & Hermmingsen, E.A., 1965. Sap pressure in vascular plants. Science 148, 339-346.
Smart, R. & Robinson, M., 1991. Sunlight into wine. Winetitles, Adelaide.
Somers, T.C. & Evans, M.E., 1977. Spectral evaluation of young red wines: anthocyanin equilibria, total phenolics, free and molecular SO2, '‘chemical age’. Journal of the Science of Food and Agriculture 28, 279-287.
StatSoft, Inc. (2008). STATISTICA (data analysis software system), version 8.0. www.statsoft.com.

CChhaapptteerr 44
Research results

28
Chapter 4: Research results
4.1 Climatic parameters
There are different methods for the quantification and comparison of temperature. The summation of thermal time or growing degree days (GDD) (Amerine & Winkler, 1944) and the mean temperature of the warmest month are probably the most widely used methods. The cumulative GDD was adapted to South Africa conditions by Le Roux in 1974 (De Villiers et al., 1996). The GDDs are summated over the growing season from September to March. According to this index, Calitzdorp (1980-1990) falls within region V. Based on this potential estimation, Calitzdorp should produce high-volume wines, late varieties and dessert-style wines. As February is the warmest month during ripening, the mean February temperature (MFT) was used as a climatic indicator (De Villiers et al., 1996). The MFT and relative humidity (Table 4.1) reveal a 2.28°C difference between Upper Doringbos (Upper DB) and Lower Doringbos (Lower DB), and a 0.57°C difference between Upper Vlakte and Lower Vlakte.
Table 4.1 Mean February temperature and mean relative humidity in February measured at the four management blocks in 2008
Management block Month Mean temp (°C) Mean RH% Upper Doringbos Feb 24.86 63.09 Lower Doringbos Feb 22.58 66.88 Upper Vlakte Feb 24.53 62.00 Lower Vlakte Feb 23.96 64.96 Weather station Feb 23.67 62.33
According to the MFT, Upper DB, Upper Vlakte and Lower Vlakte fall under the hot description. This means that wines with a low acidity and high pH can be expected to be produced in these vineyards. In contrast, Lower DB, with a mean February temperature of 22.6°C, falls within the moderate temperature range. This implies that the vines can deliver high-quality red table wines with high acid, low pH and outstanding varietal character. When the MFT is compared to the mean July temperatures of the Douro Demarcated Region (DDR) (see Fig. 2.2), it is seen that Almendra, in sub-region Douro Superior to the east of the DDR, has a mean July temperature of higher than 25°C. At Pinhão, in the sub-region of Cima Corgo (in the centre of the DDR), and at Vila Real, in the sub-region of Baixo Cargo, the mean July temperatures are ±25°C and ±22°C respectively (Moutinho-Pereira et al., 2004). The Douro Superior, with the highest temperatures, is recognised as the sub-region that consistently delivers the highest quality grapes for port wine production in the DDR. The monthly mean temperature (January 2008 until November 2008) for the two experimental sites at Doringbos (Fig. 4.1) and the two experimental sites at Vlakte (Fig. 4.2) reveals that the higher sites are on average hotter than the lower sites.

29
Upper DB Lower DB
1 2 3 4 5 6 7 8 9 10 11
Month
10
12
14
16
18
20
22
24
26
Te
mpe
rtu
re (
o C)
Figure. 4.1 Monthly mean temperatures for the period from January 2008 to November 2008 at the two management sites on Doringbos (DB) farm. Data for Lower DB for April 2008 are missing.
Upper Vlakte Lower Vlakte
1 2 3 4 5 6 7 8 9 10 11
Month
10
12
14
16
18
20
22
24
26
Te
mpe
ratu
re (
o C)
Figure. 4.2 Monthly mean temperatures for the period from January 2008 to November 2008 at the two
management sites on Vlakte farm.

30
Upper DB Lower DB
40 50 60 70 80 90 100 110 120
Days after anthesis
0
200
400
600
800
1000
Cu
mm
ula
tive
gro
win
g d
eg
ree
da
ys 908.46
984.98
Veraison
Figure. 4.3 Cumulative growing degree days for Upper and Lower Doringbos as calculated starting on 10 December (49 days after anthesis).
Upper Vlakte Lower Vlakte
0 20 40 60 80 100 120
Days after anthesis
0
200
400
600
800
1000
1200
Cu
mm
ula
tive
gro
win
g d
eg
ree
da
ys
1333.36
1276.59
Veraison
Figure. 4.4 Cumulative growing degree days for Upper and Lower Vlakte as calculated starting on 2 November (eight and nine days after anthesis respectively).
The cumulative GDD over the period of grape development and ripening was calculated for each management site using data from the Tinytag dataloggers. Upper and Lower DB were calculated from 10 December 2007 (49 days after anthesis) until the harvest date of 12 and 14

31
February 2008 respectively (Fig. 4.3), and Upper and Lower Vlakte were calculated from 2 November 2007 (eight and nine days after anthesis) until 14 and 15 February respectively (Fig. 4.4). The difference in starting dates for accumulation is due to missing data at Doringbos for November 2007. The cumulative growing degree days start to differ between Upper and Lower DB from 54 days after anthesis. Upper DB has less cumulative growing degree (Fig. 4.3) than Lower DB. Only for November until January does Upper DB have lower temperatures than those of Lower DB (Fig. 4.1). For February, the hottest month in the year, the mean temperature at Upper DB is 2.28°C higher that that of Lower DB (Table 4.1). The cumulative growing degree days may be fewer at Upper DB than at Lower DB for the period pre-véraison until harvest ripeness, but the phenological stages are one to two days earlier for Upper DB than Lower DB (see Section 4.3). This could be the result of better canopy and bunch exposure during this period. The cumulative growing degree days for Vlakte show only a slight difference after 66 days after anthesis. Only a day difference is seen for the phenological stages from flowering until harvest-ripe, with Upper Vlakte earlier than Lower Vlakte (see Section 4.3).
20-25 oC Upper DB 25-30 oC Upper DB 20-25 oC Lower DB 25-30 oC Lower DB
40 50 60 70 80 90 100 110 120
Days after anthesis
0
100
200
300
400
500
Cum
ulat
ive
hour
s
25-30 oC
20-25 oC
511
465
308
293
Figure. 4.5 Cumulative hours of temperatures from 20-25°C and 25-30°C at Upper and Lower Doringbos.
The optimum temperature range for photosynthesis is between 20 and 30°C (Kriedemann, 1968), but is approximately 25°C during the whole growth season (Kriedemann, 1977). There were no significant differences between the two adjacent blocks at Doringbos or at Vlakte for the temperature range of 20 to 30°C. The differences at Vlakte (Fig. 4.6) for both temperature ranges (20 to 25°C and 25 to 30°C) are too small to be significant, with only three hours’ difference between the two. However, at Doringbos (Fig. 4.5) it seems that Lower Doringbos has a greater amount of time within the optimal range for berry metabolism (20 to 25°C). Colour development is considered to be optimal between 20 and 25°C. Some authors consider optimal temperature for anthocyanin accumulation in the grape berries of some varieties to be a 15 to

32
25°C day temperature and 10 to 20°C night temperature (Kliewer & Torres, 1972). All night temperatures fall to between 10 and 20°C in the growing season (data not shown).
20-25 oC Lower Vlakte 25-30 oC Lower Vlakte 20-25 oC Upper Vlakte 25-30 oC Upper Vlakte
0 20 40 60 80 100 120
Days after anthesis
0
100
200
300
400
500
600
Cum
ulat
ive
hour
s
20-25 oC
25-30 oC
645
642
419
416
Figure. 4.6 Cumulative hours of temperatures between 20 and 25°C and 25 and 30°C at Upper and Lower Vlakte.

33
1 2 3 4 5 6 7 8 9 10 11 12
Month
5
10
15
20
25
30
35
40
Me
an
Ra
in (
mm
)
Figure 4.7 The mean monthly rainfall measured at the Calitzdorp historical weather station over the period of 1980-1990 (Month 1 = January)
Calitzdorp has a very low annual rainfall of 233 mm. The mean monthly rainfall for the period from 1980 to 1990 is given in Fig. 4.7. This necessitates some irrigation of the grapevines (at least once between flowering and harvest). Annual rainfall in the DDR is much higher, with Vila Real in the west recording 1 018 mm, Pinhão recording 658 mm and Almendra in the east recording only 437 mm (Moutinho-Pereira et al., 2004).
Table 4.2 Mean and maximum monthly wind speed, and mean evapotranspiration for 2008 measured by the meteorological station situated 150 m from Lower Doringbos
Month Mean wind speed
(m/s)/day Max wind speed
(m/s)/day Mean evapotranspiration
(mm)/day January 1.3 2.2 5.6
February 1.2 1.9 5.4
March 1.0 1.7 4.3
April 0.7 1.7 3.1
May 1.0 3.8 2.5
June 0.8 2.6 1.7
July 1.2 4.4 2.4
August 1.0 3.9 2.6
September 1.7 3.8 3.8
October 1.4 2.2 4.4
November 1.6 2.4 5.0
December 1.6 2.7 5.8

34
The prevailing wind did not influence the climate on the experimental sites significantly and therefore did not influence the vineyards at the experimental sites. Wind speeds of 3 to 4 m/s will affect photosynthesis and transpiration negatively through the closing of stomata (Freeman et al., 1982). The maximum wind speeds in the growing season only reached 3.8 m/s in September and 2.7 m/s in December, but remained below 2.4 m/s for the remainder of the season (Table 4.2). In 2008, for the only four days that the maximum wind speed exceeded 3 m/s, the winds were mainly warm north-westerlies. Monthly mean evapotranspiration was highest in the hottest months, December, January and February, as expected, with values of 5.8 mm, 5.6 mm and 5.4 mm respectively (Table 4.2).
4.2 Soil description and analyses
One soil profile description for each of the four management blocks is provided in Tables 4.2 to 4.5. The soil chemical analyses showed no deficiencies or toxicities and did not differ dramatically between profiles (data not showen). There were no significant differences between the three replicated soil profiles dug at each of the four management blocks. The only differences between replicates appeared to be related to the depths of each horizon, which differed slightly. Many studies under different cultivation conditions in South Africa have shown that grapevine roots are predominantly located in the 800/1 000 mm soil zone (Hunter & Le Roux, 1992; Hunter et al., 1995; Hunter, 1998a) and the soil profile was thus studied to a depth of 1 000 mm. There were differences between the two experimental sites at Doringbos as well as at Vlakte. Upper DB (Table 4.3) had a slightly lower clay percentage of 10% in horizon B, compared to the 14% clay in horizon B of Lower DB (Table 4.4). Lower DB had shallower soil with an 80% stone fraction that started at a depth of 600 mm, whereas the Upper DB stone fraction only started at a depth of 1 000 mm. Upper Vlakte (Table 4.5) had a clay percentage of 14% in horizon B, while Lower Vlakte (Table 4.6) had 10% clay in Horizon B.

35
Table 4.3 Upper Doringbos soil profile description (Described by Braham Oberholzer and Margaux Nel, 1 July 2008)
Profile no: Upper DB 1 Soil form: Oakleaf 2210
Horizon Depth (mm)
Description
A 0-100 Reddish brown, fine sandy loam, loose porosity and with no structure, pH 8.1, 16% clay
B1 100-600 Reddish brown, fine sandy loam, hard crumbly structure, pH 8.2, 10% clay
B2 600-1000 Yellowish red brown, medium sandy loam, high % free lime, 10% clay
C >1000 80% stone fraction, coarse quartzite sandstone
Table 4.4 Lower Doringbos soil profile description (Described by Braham Oberholzer and Margaux Nel, 1 July 2008)
Profile no: Lower DB 1 Soil form: Oakleaf 2210
Horizon Depth (mm)
Description
A 0-100 Reddish brown, fine sandy loam, new cutanic, pH 7.9, 10% clay
B1 100-500 Reddish brown, fine loamy sand, medium crumbly structure, 14% clay
B2 500-600 Free lime with the absence of sandstone, pH 7.7, 14% clay
C >600 80% stone fraction, coarse quartzite sandstone
Table 4.5 Upper Vlakte soil profile description (Described by Braham Oberholzer and Margaux Nel, 2 July 2008)
Profile no: Upper Vlakte 1 Soil form: Oakleaf 2220 dominant Augrabies subdominant
Horizon Depth (mm)
Description
A 0-100 Yellowish brown, fine sandy loam, pH 8.2, 10% clay
B1 100-600 Yellowish brown, fine sandy loam, loose structure, 14 clay %
B2 600-1000 14% clay, high % free lime
No stone fraction
Table 4.6 Upper Vlakte soil profile description (Described by Braham Oberholzer and Margaux Nel, 2 July 2008)
Profile no: Lower Vlakte 1 Soil form: Oakleaf 2220 dominant Augrabies subdominant
Horizon Depth (mm)
Description
A 0-100 Yellowish brown, sandy loam, pH 8, 10% clay
B1 100-400 Yellowish brown, sandy loam, very loose structure
B2 >400 10% clay, loamy sand with a high % free lime and pH 8.3
No stone fraction

36
Root distribution
upper lower
Farm: DB
-100 -80 -60 -40 -20
Depth (cm)
-40
-20
0
20
40
60
80
100
120
140N
umbe
r of
roo
t con
tact
s pe
r 10
0 cm
2 sm
alle
rth
an 2
mm
dia
met
er
Farm: Vlakte
-100 -80 -60 -40 -20
Depth (cm)
Figure 4.8 Distribution of roots (diameter < 2 mm) to a depth of 100 cm in the four management blocks (Vertical bars denote 0.95 confidence intervals) (August 2007; p = 0.802).
upper lower
Farm: DB
-100 -80 -60 -40 -20
Depth (cm)
-40
-20
0
20
40
60
80
100
120
140
Num
ber
of r
oots
con
tact
s pe
r 10
0 cm
2 with
adi
amet
er g
reat
er th
an 2
mm
Farm: Vlakte
-100 -80 -60 -40 -20
Depth (cm)
Figure 4.9 Distribution of roots (diameter > 2 mm) to a depth of 100 cm in the four management blocks (Vertical bars denote 0.95 confidence intervals) (August 2007; p = 0.839).
Maximum root formation occurs just after bud break and in the post-harvest period (Conradie, 1981). In August at the time of these analyses, just before bud burst, very little root growth occurs (Hunter, 1998b). Lower and Upper DB showed a good, even distribution of roots with a diameter smaller than 2 mm (Fig. 4.8), as well as roots with a diameter greater than 2 mm (Fig. 4.9), over 10 to 100 cm soil depth. The 80% coarse quartzite sandstone fraction did not have any influence on the lower DB root growth, otherwise there should have been a decline in root density at 60 cm soil depth. On the contrary, for Upper and Lower Vlakte most roots were found

37
at a shallow (10 to 50 cm) soil depth. The highest density of roots with a diameter smaller than 2 mm and greater than 2 mm was at a depth of 40 cm for Upper and Lower Vlakte. Good soil preparation at a depth of 90 cm was done before planting and no physical or chemical restriction was found at a depth of 40 cm that could have influenced the root growth (data not shown). The Touriga National of Upper and Lower Vlakte is grown on its own roots and ungrafted vines normally have shallower root system development than grafted vines (B. Oberholzer, VinPro soil scientist, personal communication, 2008). The Touriga Naçional grapevines at upper DB had more roots than those at Lower DB up to 60 cm and then again at 100 cm depth, whereas the grapevines at Upper Vlakte had fewer roots than those at Lower Vlakte between 40 cm and 100 cm depth.
4.3 Vineyard measurements
The phenological stages budburst, flowering, véraison and harvest-ripe were noted during the 2007/8 season (Table 4.7), and budburst and flowering during the 2008/9 season. At budburst there were already differences between the upper and lower management sites of the farms. Upper Doringbos was a day earlier than Lower Doringbos in 2007/8 and three days earlier in 2008/9. The Upper Vlakte site was two days earlier than Lower Vlakte for 2007/8 and 2008/9. At flowering, the differences seemed to be smaller, and at véraison there was only one day difference, with the upper parts of the vineyards being earlier than the lower sites. At harvest-ripe, Upper Doringbos was two days earlier than Lower Doringbos, and Upper Vlakte was one day earlier than Lower Vlakte. The upper parts of the experimental sites generally experienced higher temperatures than the lower parts, as well as having better canopy and bunch exposure (discution in section 4.3.1 and sata shown in Table 4.9 and 4.10). This is why the upper sites’ phenological stages were earlier than those of the lower sites.
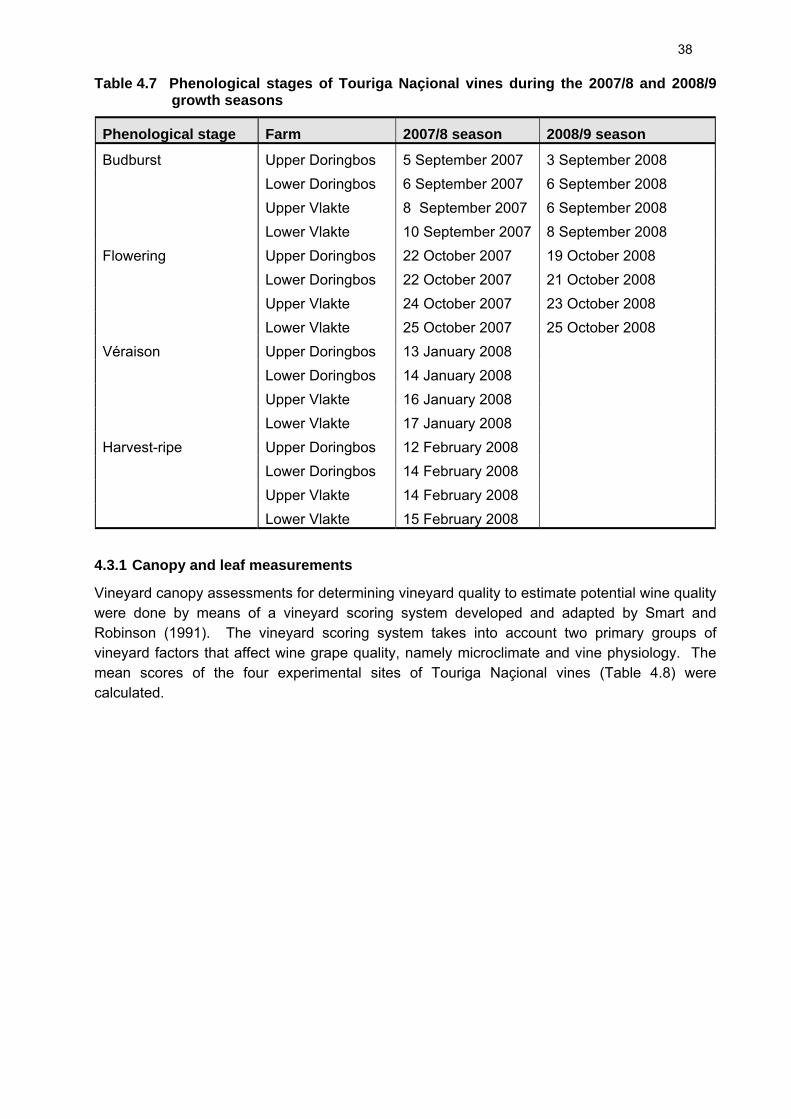
38
Table 4.7 Phenological stages of Touriga Naçional vines during the 2007/8 and 2008/9 growth seasons
Phenological stage Farm 2007/8 season 2008/9 season
Budburst Upper Doringbos 5 September 2007 3 September 2008
Lower Doringbos 6 September 2007 6 September 2008
Upper Vlakte 8 September 2007 6 September 2008
Lower Vlakte 10 September 2007 8 September 2008
Flowering Upper Doringbos 22 October 2007 19 October 2008
Lower Doringbos 22 October 2007 21 October 2008
Upper Vlakte 24 October 2007 23 October 2008
Lower Vlakte 25 October 2007 25 October 2008
Véraison Upper Doringbos 13 January 2008
Lower Doringbos 14 January 2008
Upper Vlakte 16 January 2008
Lower Vlakte 17 January 2008
Harvest-ripe Upper Doringbos 12 February 2008
Lower Doringbos 14 February 2008
Upper Vlakte 14 February 2008
Lower Vlakte 15 February 2008
4.3.1 Canopy and leaf measurements
Vineyard canopy assessments for determining vineyard quality to estimate potential wine quality were done by means of a vineyard scoring system developed and adapted by Smart and Robinson (1991). The vineyard scoring system takes into account two primary groups of vineyard factors that affect wine grape quality, namely microclimate and vine physiology. The mean scores of the four experimental sites of Touriga Naçional vines (Table 4.8) were calculated.

39
Table 4.8 Vineyard scorecard (Smart & Robinson, 1991)
Parameter score
Canopy gaps 40% 10 about 50% or more 8 about 30% 6 About 20% 4 about 10% or less 0
Leaf size slightly small 10 average 8 slightly large 6 very large 2 very small 2
Leaf colour leaves green, healthy, slightly dull and pale 10 leaves dark green, shiny, healthy 6 leaves yellowish green, healthy 6 leaves with mild nutrient deficiency symptoms 6 unhealthy leaves, with marked necrosis or chlorosis 2
Canopy density about 1 or less 10 about 1.5 8 about 2 4 more than 2 2
Fruit exposure about 60% or more exposed 10 about 50% 8 about 40% 6 about 30% 4 about 20% or less 2
Shoot length about 10-20 nodes 10 about 8-10 nodes 6 about 20-25 nodes 6 less than about 8 nodes 2 more than about 30 nodes 2
Lateral growth limited or zero lateral growth 10 moderate vigour lateral growth 6 very vigorous growth 2
Growing tips about 5% or less 10 about 10% 8 about 20% 6 about 30% 4 about 40% 2 about 50% or more 0

40
Table 4.9 Vineyard scorecard for quality assessment of the four management blocks. The scores of three judges were taken into account and an mean score is noted.
Upper DB Lower DB Upper Vlakte Lower Vlakte
Canopy gaps 8.7 6 6 6 Leaf size 8.7 7.3 9.3 8
Leaf colour 10 6 10 7.3 Canopy density 8 4 8.7 5.3 Fruit exposure 8.7 8.7 10 8 Shoot length 10 10 10 10
Lateral growth 6 4.7 8.7 6 Growing tips 9.3 8 9.3 8
Total out of 80 69 55 72 59
% 87 68 90 73
Table 4.10 Vineyard point quadrat method for quality assessment of the four management blocks
Upper DB Lower DB Upper Vlakte Lower Vlakte
% Gaps 22 13.3 22 15.3 Leaf layer number 1.3 1.9 1.4 1.8 % Interior leaves 19.3 28.9 16.3 31.8
% Interior bunches 30.5 57.2 53.4 46
High-quality canopies are frequently associated with low vigour and low yield because they have open canopies with good leaf and fruit exposure. It is actually the microclimate in open canopies with good leaf and fruit exposure that is more essential for canopy quality, and not necessarily the lower vigour and yield (Smart & Robinson, 1991). The vigour of the canopy is reflected in leaf size, leaf colour, lateral growth, and the percentage of active growing tips at véraison. The canopy gaps, canopy density and fruit exposure are related to canopy microclimate, while the leaf size, leaf colour, shoot length, lateral growth and the presence of active growing tips represent the physiological status. Canopy microclimate influences leaf activity as well as the export of photoassimilates (Hunter & Visser, 1988). The canopy of Upper DB, with 22% gaps, gives sufficient leaf area available to support grape development, optimal sunlight interception and sunlight penetration into the interior of the canopy (Hunter & Visser, 1989). The 22% gaps, mean leaf layer number of 1.3 and 69.5% exposed fruit of Upper DB are considered to be of higher quality with a better microclimate than Lower DB. Lower DB has 13.3% gaps, a mean leaf layer number of 1.9 and 42.8% of sunlight-exposed fruits (Table 4.10). The point quadrat system corresponds with the vineyard scorecard with respect to the leaf layer and percentage exposed bunches. However, this was not the case for the percentage gaps in the canopy. The point quadrat was done independently and only a day after the judges scored the vineyard. There are also expected grapevine physiological differences between Upper and Lower DB. Upper DB had slightly small to average sized, dull but healthy leaves with moderate vigour, lateral growth and about 5% growing tips at véraison. On the contrary, Lower DB had slightly large to average leaves that were dark green, shiny and healthy, with vigorous lateral growth and about 10% active growing tips at véraison (Table 4.9). Although the shoot lengths of Upper

41
and Lower DB were similar, ranging from 10 to 20 nodes due to a shoot-trimming action at véraison, there was increased lateral growth at Lower DB after véraison compared to Upper DB (data not shown). Similar results were obtained at Vlakte (Table 4.10). Upper Vlakte had 22% gaps, a leaf layer number of 1.4 and 46.6% exposed bunches, while Lower Vlakte had 15.3% gaps, but a leaf layer number of 1.8 and 54% exposed bunches. The vineyard scorecard method corresponded with the point quadrat with respect to the mean leaf layer number and the bunch exposure, but not with respect to the percentage gaps. Upper and Lower Vlakte, according to the vineyard scorecard method, had 30% gaps (Table 4.9). There were also expected grapevine physiological differences between Upper and Lower Vlakte. Upper Vlakte had slightly small sized and somewhat dull but healthy leaves, with limited lateral growth and ca. 5 to 10% active growing tips at véraison. On the contrary, Lower Vlakte had an average leaf size, and leaves were dark green and healthy with moderately vigorous lateral growth and ca. 10% active growing tips at véraison (Table 4.9). Overall the vineyard scorecard reveals that the grapevine canopies at the upper sites of DB and Vlakte are of better quality than that those at the lower sites.
Farm DB Farm Vlakte
Upper Lower700
800
900
1000
1100
1200
1300
1400
1500
Mea
n pr
imar
y le
af s
urfa
ce a
rea
per
shoo
t (cm
2 )
a a
a
b
Figure. 4.10 Mean primary leaf area per shoot (cm2) at the four management sites (Vertical bars denote 0.95 confidence intervals) (p = 0.067).
Table 4.11 Mean primary and secondary leaf area (cm2) for the four experimental sites
Upper DB Lower DB Upper Vlakte Lower Vlakte
Mean primary leaf area (cm2) 123 122 108 131 Mean secondary leaf area (cm2) 58 58 41 51
The mean primary leaf area per shoot (Fig. 4.10) shows a significant difference between Upper and Lower Vlakte. The mean primary leaf area (Table 4.11) of Upper Vlakte (108 cm2) and

42
Lower Vlakte (131 cm2) falls within the optimal parameters, those for moderately vigorous growth of 80-160 cm2 (Smart & Robinson, 1991). In contrast, there is no significant difference between Upper and Lower DB in terms of mean primary leaf area per shoot (Fig. 4.10). Upper DB (123 cm2) and Lower DB (122 cm2) also fall within the moderately vigorous category (Table 4.11).
Farm DB Farm VlakteUpper Lower
400
600
800
1000
1200
1400
1600
1800
2000
2200
Me
an
La
tera
l L
ea
f s
urf
ac
e a
rea
pe
r s
ho
ot
(cm
2)
a
b
a
ab
Figure. 4.11 Mean lateral leaf area per shoot (cm2) at the four management sites (Vertical bars denote 0.95 confidence intervals) (p = 0.76061).
In contrast to what was determined with the aid of the score card, no significant differences were found in terms of lateral leaf area between the management blocks at each of the farms (Fig. 4.11). The values for mean lateral leaf area (Table 4.11) suggests vigorous growth (Smart & Robinson, 1991) for Upper DB, Lower DB and Lower Vlakte, while Upper Vlakte had a value of 41 cm2, which falls just short of the parameters for moderately vigorous growth. A shoot length of between 120 cm and 160 cm is considered to be optimum for ripening two bunches if they are sufficiently exposed to sunlight (Archer, 2001). At a shoot length of 120 cm, a total soluble solids content (ºB) of 24.5, a total titratable acidity of 7.4 g/L and a pH of 3.3 is expected for red grape varieties such as Cabernet Sauvignon/R99 (Archer, 2001).

43
4.3.2 Leaf water potential measurements
Upper Vlakte Lower Vlakte Upper DB Lower DB
Nov Dec Feb
Month
500
550
600
650
700
750
800
850
900
950
1000
1050
1100
1150
Leaf
wat
er p
oten
tial (
-kP
a)
Nov Dec Feb
Month
A B
Figure. 4.12 Leaf water potential for the four management blocks over the period of a day in November, December and February (Vertical bars denote 0.95 confidence intervals) (p = 0.22827). A: 50% crop reduction. B: 25% crop reduction.
The mean leaf water potential (average of diurnal values) for November and February was considerably higher (less negative) than that in December (Fig. 4.12). The measurements in December were taken just after a 50 mm irrigation cycle. The only significant differences in these mean values for the two crop-reduction treatments were at Upper Vlakte in February. The 50% crop-reduction treatment for February had a more negative water potential, thus greater water deficit, than that of the 25% crop-reduction treatment. After further inspection of the diurnal leaf water potential of the grapevines at Upper Vlakte (Figure 4.15 and 4.16), it was seen that, for December, the 50% crop reduction starts (predawn) and ends (after sunset) off with more negative values of -830 kPa and -812 kPa, whereas the 25% crop reduction starts with -712 kPa and ends with -632 kPa. These results do not coincide with those of other studies (Bravdo et al., 1985), which suggests that when the crop load is reduced in a vineyard subjected to a high water stress situation, the degree of water stress will be reduced and thus leaf water potential values will increase. Furthermore, the only significant differences between the two management sites were at Vlakte. Upper Vlakte had more negative water potential than Lower Vlakte for the 50% crop reduction (control) in February. This is expected because the lower site is expected to be better supplied with water than the upper site, due to the natural drainage. A fourth order ANOVA showed that, even if there were no significant differences for the main diurnal value, there were significant differences between the two management blocks at Doringbos (Fig. 4.13 and Fig 4.14) and Vlakte (Fig. 4.15 and Fig. 4.16) at certain times during the day for the two treatments. When each measurement time is taken into consideration, it can be seen that, during December, the predawn leaf water potential is considerably higher (less negative), even though the leaf water potential reached similar values as determined in November.

44
Upper DB Lower DB
November
03
:45
08
:00
12
:00
16
:00
20
:00
T ime
0
200
400
600
800
1000
1200
1400
1600
1800
Le
af
wa
ter
po
ten
tia
l (-
kP
a)
December
03
:45
08
:00
12
:00
16
:00
20
:00
T ime
February0
3:4
5
08
:00
12
:00
16
:00
20
:00
T ime
50% Crop reduction treatment
Figure. 4.13 Leaf water potential over November, December and February for the two management sites at Doringbos with a 50% crop reduction treatment (Vertical bars denote 0.95 confidence intervals) (p = 0.01456).
Upper DB Lower DB
November
03
:45
08
:00
12
:00
16
:00
20
:00
T ime
0
200
400
600
800
1000
1200
1400
1600
1800
Le
af
wa
ter
po
ten
tia
l (-
kP
a)
December
03
:45
08
:00
12
:00
16
:00
20
:00
T ime
February
03
:45
08
:00
12
:00
16
:00
20
:00
T ime
25% Crop reduction treatment
Figure. 4.14 Leaf water potential over November, December and February for the two management sites at Doringbos with a 25% crop reduction treatment (Vertical bars denote 0.95 confidence intervals) (p = 0.01456).

45
Predawn leaf water potential measures plant water status at zero plant water flux, and predawn plant water status is considered to be in equilibrium with soil water status, thus predawn leaf water measurements provide information on root zone soil water potential. Daily leaf water measurements, on the other hand, reflect local leaf water demand, soil water availability, internal plant hydraulic conductivity and stomatal regulation (Begg & Turner, 1970). In November, post-flowering, significant differences in leaf water potential were noticed between the two management sites at Doringbos at midday (12:00), 16:00 and after sunset (20:00). Lower DB had a more negative leaf water potential than Upper DB for the 25% (Fig. 4.14) and 50% crop reduction (Fig. 4.13) at midday. The drastic increase in leaf water potential at midday for upper DB could be because of stomatal closure (stomatal regulation) over the hottest part of the day. In contrast, at 16:00, Upper DB had a more negative leaf water potential than Lower DB for both crop-reduction treatments. This is expected because the lower site should be better supplied with water than the upper site due to natural drainage. After sunset, Lower DB once again had a more negative leaf water potential than Upper DB, but at predawn there was no significant difference. After the irrigation cycle in December, significant differences in plant water status between the two management sites at Doringbos were determined at predawn (03:45) and 08:00. Grapevines at Upper DB with 25% crop reduction (Fig. 4.14) had a more negative leaf water potential than those at Lower DB at predawn. This is expected because of natural drainage. At 08:00, the grapevines with 50% crop reduction at Upper DB (Fig. 4.13) had a more negative leaf water potential than those at Lower DB, while the inverse was found for the 25% crop-reduction treatment. In February, close to harvest, a significant difference in plant water status was measured between the two management sites at Doringbos at predawn (03:45), midday (12:00), 16:00 and after sunset (20:00). At predawn, Lower DB had a more negative water potential than Upper DB for the 25% crop-reduction (Fig. 4.14) treatment. The inverse is expected because, as a result of natural drainage, the lower sites should have more available water and lower water stress. From the soil descriptions (Section 4.2), it is clear that Upper DB has deeper soil, as well as more roots per 100 cm2 at 40 cm and 100 cm soil depth than Lower DB. This could be one of the reasons why the grapevines at Lower DB had higher water stress than Upper DB, because the grapevines at Upper DB, with their larger root surface, were able to access the soil water reserves more easily at night. Upper DB had a less negative leaf water potential at midday for the 50% crop reduction (Fig. 4.13). At 16:00, the 50% crop reduction revealed a more negative value for leaf water potential at Lower DB than Upper DB. A similar pattern was seen after sunset (20:00). Although no pattern is clear, it would appear that Upper DB tended to have slightly higher water deficits than Lower DB in the morning, until midday and into the early afternoon. Plant water status appeared to be affected to a certain extent by crop load, but this would appear to be dependent on the management block.

46
Upper Vlakte Lower Vlakte
November
03
:45
08
:00
12
:00
16
:00
20
:00
T ime
0
200
400
600
800
1000
1200
1400
1600
1800
Le
af
wa
ter
po
ten
sia
l (-
kP
a)
December
03
:45
08
:00
12
:00
16
:00
20
:00
T ime
February0
3:4
5
08
:00
12
:00
16
:00
20
:00
T ime
50% Crop reduction treatment
Figure. 4.15 Leaf water potential over November, December and February for the two management sites at Vlakte with a 50% crop-reduction treatment (Vertical bars denote 0.95 confidence intervals) (p = 0.01456).
Upper Vlakte Lower Vlakte
November
03
:45
08
:00
12
:00
16
:00
20
:00
T ime
0
200
400
600
800
1000
1200
1400
1600
1800
Le
af
wa
ter
po
ten
tia
l (-
kP
a)
December
03
:45
08
:00
12
:00
16
:00
20
:00
T ime
February
03
:45
08
:00
12
:00
16
:00
20
:00
T ime
25% Crop reduction treatment
Figure. 4.16 Leaf water potential over November, December and February for the two management sites at Vlakte with a 25% crop-reduction treatment (Vertical bars denote 0.95 confidence intervals) (p = 0.01456).

47
In November, just after flowering, significant differences were found between the two management sites at Vlakte, for both crop-reduction treatments, at predawn (03:45), 08:00, midday (12:00) and 16:00. At predawn, Upper Vlakte had a significantly more negative leaf water potential (greater water deficit) than Lower Vlakte for the 25% crop-reduction (Fig. 4.16) treatment, while the reverse was found at 08:00 for the same crop-reduction treatment. The predawn measurement is expected because of natural drainage that occurs from the upper site towards the lower site. Because the daily leaf water potential reflects a combination of factors, such as leaf water demand, soil water availability, internal plant hydraulic conductivity and stomatal regulation, it could be that the higher clay percentage in the soil of the Upper Vlakte site provides a buffer in the more severely stressed situation (25% crop-reduction treatment) to meet the water demand during the day. This could also explain why Lower Vlakte, with 25% crop reduction (Fig. 4.16), had a more negative leaf water potential than Upper Vlakte at 16:00. At midday, Upper Vlakte with 50% crop reduction (Fig. 4.15) showed more intense water deficits with significantly more negative leaf water potential values than at Lower Vlakte. This could be because of natural drainage and the lower soil water content at the Upper site. In December, after the irrigation cycle of 50 mm, the only significant difference for leaf water potential values was found at midday. At 25% crop reduction (Fig. 4.16), Upper Vlakte had more negative values than Lower Vlakte. Since the diurnal leaf water potential was taken after an irrigation cycle there was no severe water stress, other than some natural water drainage from the upper site towards the lower site. This is why the most negative values of the midday leaf water potential are lower and the upper site had a more negative water potential than the lower site. Close to harvest, in February, significant differences were found at 8:00, midday (12:00), 16:00 and after sunset (20:00). The February diurnal leaf water potential cycle is very similar to that of November for Upper Vlakte. Leaf water potential values of the grapevines at Upper Vlakte were significantly more negative at 08:00 for both treatments, as well as at midday for the 50% crop-reduction (Fig. 4.15) treatment. This is expected because of natural drainage. The inverse was found at midday for the 25% crop-reduction (Fig. 4.16) treatment. This could be explained by the higher clay percentage in the soil of the Upper Vlakte site, which serves as a buffer, in the more severely stressed situation (25% crop reduction treatment), so as to provide water to the grapevines during the day, similarly to what happened in November. At 16:00 and 20:00 the leaf water potential values of grapevines at Upper Vlakte were significantly higher for the 50% crop-reduction (Fig. 4.15) treatment then those at Lower Vlakte. The opposite was expected because the smaller crop load is supposed to relieve the water stress in the vine. The predawn leaf water potential for Touriga Naçional in Almendra (severe summer stress) in Douro at véraison and ripeness reached values of -600 kPa and -800 kPa respectively. At midday the leaf water potential went to -1 700 kPa and -1 800 kPa at véraison and harvest respectively (Moutinho-Pereira et al., 2004). Leaf water potential that reaches values lower than -1 300 kPa normally leads to negative stomatal responses, such as stomatal closure, caused by water deficits (Schultz, 1996; Escalona et al., 1999). Pinhão, with moderate summer stress, showed a predawn leaf water potential of -300 kPa and -500 kPa for véraison and ripeness respectively. In the four experimental sites at Calitzdorp, with moderate to severe summer stress, predawn leaf water potential values of -600 and -700 kPa were measured at ripeness, and the grapevines reached a similar level of stress as those of Almendra in Douro Superior.

48
4.3.3 Stomatal conductance measurements
Upper Vlakte Lower Vlakte Upper DB Lower DB
November December February0
50
100
150
200
250
300
350
400
450S
tom
ata
l co
nd
uct
an
ce (
mm
ol m
-2 s-1
)
Figure. 4.17 Stomatal conductance for November, December and February for the four management sites. Values are means of the two hourly diurnal measurements (Vertical bars denote 0.95 confidence intervals) (p < 0.0001).
Stomatal conductance gives a good indication of the transpiration rate of the grapevine. The mean stomatal conductance (average of diurnal values) of each management block for November, December and February was compared (Fig. 4.17). No significant differences were noted in November and December for the two management sites at Doringbos, but in February the stomatal conductance at Upper DB (154.14 mmol m-2s-1) was significantly higher than that of Lower DB (92.57 mmol m-2s-1). Upon further investigation of the diurnal values of February for the different crop-reduction treatments (Fig 4.21), it becomes clear that February does not follow similar patterns to November (Fig 4.19) and December (Fig 4.20). The two management sites at Vlakte differed significantly during December and February, with significantly lower values being recorded at Upper Vlakte than at Lower Vlakte. The lower transpiration rate at Upper Vlakte reflected the increased grapevine water deficits at this site. Authors have repeatedly shown that water deficits decrease the stomatal conductance and photosynthetic rate of grapevine leaves (Naor & Wample, 1995; Schultz, 1996). At harvest, Upper Vlakte had a mean diurnal stomatal conductance of 122.64 mmol m-2s-1, while Lower Vlakte had mean values of 214.94 mmol m-2s-1 (Fig. 4.17). In the DDR, stomatal conductance measurements were compared under conditions of low, moderate and severe summer stress. Under the low summer stress conditions, stomatal conductance reached values of 580 mmol m-2s-1 at véraison and 420 mmol m-2s-1 at harvest. Under moderate stress conditions at véraison and ripeness, the stomatal conductance values were 150 mmol m-2s-1 and 110 mmol m-2s-1 respectively. Under severe summer stress conditions, the stomatal conductance could be less than 100 mmol m-2s-1 at véraison and at

49
ripeness (Moutinho-Pereira et al, 2004). DDR values are higher in the beginning of the season because of high rainfall in the summer, while the values decrease significantly at véraison and at ripeness because of water deficit increases to similar values than those of the experimental sites. Although the leaf water potential gives a better indication of water deficit, stomatal conductance, which follows a similar pattern to that of leaf water potential, can confirm this tendency.
Upper Vlakte Lower Vlakte Upper DB Lower DB
08:00 10:00 12:00 14:00 16:00 18:00
Time
0
50
100
150
200
250
300
350
400
450
Sto
mat
al c
ondu
ctan
ce (
mm
ol -2
s-1)
Figure. 4.18 Stomatal conductance over a mean day period of a single day in November, December and February for the four management blocks (Vertical bars denote 0.95 confidence intervals) (p = 0.036).
The stomatal conductance over a mean day period (averaged for measurement dates in November, December and February) for the four management blocks (Fig. 4.18) revealed no significant difference between Upper and Lower Doringbos during the day. There were significant differences for the two management sites at Vlakte. Upper Vlakte stomatal conductance was significantly lower than that of Lower Vlakte. Stomatal conductance over the duration of a day was done in November, December and February for the four experimental sites (Fig. 4.19-Fig. 4.24). Third- and fourth-order statistical interaction analysis for this data was not possible because of missing data due to bad weather and instrument failure during November and February. It was not possible to perform additional measurements as the apparatus could not be repaired timeously and the ful impact of data loss was not realised before harvest.

50
November
Upper DB (50% CR) Upper DB (25% CR) Lower DB (50% CR) Lower DB (25% CR)
Time
150
200
250
300
350
400
450
500
550
600
Sto
ma
tal
co
nd
uc
tan
ce
(m
mo
l m
-2 s
-1)
8:00 10:00 12:00 18:0016:0014:00
Figure 4.19: Stomatal conductance over the duration of a day in November for the two management sites at Doringbos (CR = crop reduction)
December
Upper DB (50% CR) Upper DB (25% CR) Lower DB (50% CR) Lower DB (25% CR)
Time
100
150
200
250
300
350
400
450
Sto
mat
al c
ondu
ctan
ce (
mm
ol m
-2 s-1
)
12:0010:008:00 18:0016:0014:00
Figure 4.20: Stomatal conductance over the duration of a day in December for the two management sites at Doringbos (CR = crop reduction)

51
February
Upper DB (50% CR) Upper DB (25% CR) Lower DB (50% CR) Lower DB (25% CR)
Time
60
80
100
120
140
160
180
200
220
240
260
Sto
ma
tal
co
nd
uc
tan
ce
(m
mo
l m
-2 s
-1)
12:0010:008:00 16:0014:00
Figure 4.21: Stomatal conductance over the duration of a day in February for the two management sites at Doringbos (CR = crop reduction). The 18:00 time interval was not measured because of excessive wind.
Stomatal conductance is affected by temperature and humidity (Freeman et al., 1982). Stomatal conductance over the duration of a day follows a typical pattern, from low in the morning, reaching a peak in the afternoon (12:00) and gradually decreasing in the late afternoon. This is typical for most varieties in the beginning of the growing season, when water deficits are low (Medrano et al., 2002). This is seen for Doringbos in November (just after pea-size) (Fig. 4.19) and December (after the 50 mm irrigation) (Fig 4.20). Midday (12:00) measurements in November for Doringbos (Fig 4.19) revealed that there were no differences between crop loads in the upper parts of the experimental sites, but there was a difference at the lower experimental site, with Lower DB (25% CR) tending to have a higher stomatal conductance than Lower DB (50% CR). These differences could not be verified statistically because of missing data due to instrument failure and bad weather. Whilst measuring stomatal conductance in December at 10:00 in the 50% crop-reduction plot at DB, unexpected cloud cover resulted in lower figures than those at 8:00. Stomata are affected by a large range of stimuli, such as temperature, wind, overcast conditions and water deficits, to name a few (Freeman et al., 1982). In February, at ripeness, the soil water potential was low and the grapevine experienced water deficits; stomata would be expected to close under these conditions, which is why the stomatal conductance values remained very low during the whole day (Fig 4.21). Similar results were found in the DDR with Touriga Naçional, where stomatal conductance started at 200 mmol m-2 s-1 in the morning and decreased during midday to below 100 mmol m-2 s-1 for the rest of the day (Moutinho-Pereira et al., 2004). The same trends were observed for the Lower DB 25% and 50% crop-reduction treatments. For the Upper DB grapevines with 50% crop reduction, the stomatal conductance tended to be higher at first (10:00), before showing the same downwards pattern during midday, while late-afternoon values tended to increase slightly. Stomatal conductance at Upper DB for the 25% crop reduction was almost constant throughout the day.

52
Similar trends were obtained for the Vlakte experimental sites. In November (Fig. 4.22), values for Upper Vlakte (50% CR) and Lower Vlakte (50% CR) were typically low in the morning, peaking at 12:00 and decreasing slightly in the afternoon, with Upper DB (50% CR) tending to have higher stomatal conductance at midday than Lower Vlakte (50% CR). Upper Vlakte (25% CR) stayed constant until 12:00 and then decreased. Lower Vlakte (25% CR) started at 360 mmol m-2 s-1 and decreased through midday until the late afternoon. In December (Fig. 4.23), after the 50 mm irrigation, conductance values at Upper Vlakte tended to be lower than those at Lower Vlakte. Upper Vlakte also peaked at 10:00, while Lower Vlakte peaked at 12:00. Although only small differences between the crop-reduction treatments in the upper and lower experimental sites were observed at Vlakte, the 25% crop reduction tended to have a slightly higher stomatal conductance. At ripeness stage (February) (Fig. 4.24), the conductance values at Upper Vlakte (25% and 50% CR) were relatively constant, with the 25% CR tending to have higher stomatal conductance values. The Lower Vlakte stomatal conductance trends were higher than those of Upper Vlakte, while Lower Vlakte (25% CR) had a higher trend than Lower Vlakte (50% CR). Some authors have reported that stomatal conductance is a better indicator of vine water status and soil water content than leaf water potential (Medrano et al., 2002). However, as shown by other authors, predawn leaf water potential is a better indicator of soil water potential than stomatal conductance (Sousa et al., 2006). As seen above, the stomatal conductance did not have a typical pattern, and leaf water potential appeared to be a better indicator of soil water content than stomatal conductance.
November
Upper Vlakte (50% CR) Upper Vlakte (25% CR) Lower Vlakte (50% CR) Lower Vlakte (25% CR)
Time
50
100
150
200
250
300
350
400
Sto
ma
tal
co
nd
uc
tan
ce
(m
mo
l m
-2 s
-1)
8:00 18:0016:0014:0012:0010:00
Figure 4.22: Stomatal conductance over the duration of a day in November for the two management sites at Vlakte (CR = crop reduction). 10:00 measurements are missing because of overcast weather conditions.

53
December
Upper Vlakte (50% CR) Upper Vlakte (25% CR) Lower Vlakte (50% CR) Lower Vlakte (25% CR)
Time
100
150
200
250
300
350
400
450
Sto
ma
tal
co
nd
uc
tan
ce
(m
mo
l m
-2 s
-1)
8:00 10:00 12:00 16:00 18:0014:00
Figure 4.23: Stomatal conductance over the duration of a day in December for the two management sites at Vlakte (CR = crop reduction)
February
Upper Vlakte (50% CR) Upper Vlakte (25% CR) Lower Vlakte (50% CR) Lower Vlakte (25% CR)
Time
80
100
120
140
160
180
200
220
240
260
280
300
320
340
360
380
400
Sto
ma
tal
co
nd
uc
tan
ce
(m
mo
l m
-2 s
-1)
16:0012:00 14:0010:00
Figure 4.24: Stomatal conductance over the duration of a day, at two-hour intervals in February for the two management sites at Vlakte, as well as for the crop-reduction (CR) treatments (25% CR) and the control (50% CR). The 8:00 and 18:00 measurements are missing because of excessive wind.

54
4.3.4 Cane measurements
Farm DB Farm Vlakte
Lower Upper400
500
600
700
800
900
1000
1100
1200
1300
1400
1500
1600
1700
Pru
nin
g m
ass
per
vin
e (g
ram
)
b
a
a
c
Figure. 4.25 Pruning mass per vine for the four management sites in 2007 (Vertical bars denote 0.95
confidence intervals) (p = 0.04391).
The ideal pruning mass for a vine with in-row spacing of 1.5 m is 0.45 to 0.9 kg/vine (Smart & Robinson, 1991). Similar results were found for Cabernet Sauvignon at Nietvoorbij in Stellenbosch, with an ideal pruning mass of 0.5 to 1 kg/vine (Hunter et al., 1995). No specific thresholds are available for Touriga Naçional. The mean pruning weight determined in 2007 (Fig. 4.25) for Upper Vlakte (0.669 kg/vine) and Lower Vlakte (0.862 kg/vine) falls within this range. Upper DB (0.934 kg/vine) falls just above the ideal margin, while Lower DB (1.394 kg/vine) is higher than the ideal pruning weight and indicates a potentially dense canopy. The 2008 season (Fig. 4.26) appeared to be more vigorous and only Upper Vlakte (0.919 kg/vine) fell within the ideal range. Lower Vlakte (1.150 kg/vine), Upper DB (1.644 kg/vine) and Lower DB (1.958 kg/vine) were all above the ideal margin. In 2007 (Fig. 4.25) there were significant differences between the two management sites at DB as well as the two management sites at Vlakte, with the lower sites being more vigorous than the upper sites. A similar trend is seen for 2008 (Fig. 4.26), but only the two management sites at DB differed significantly.
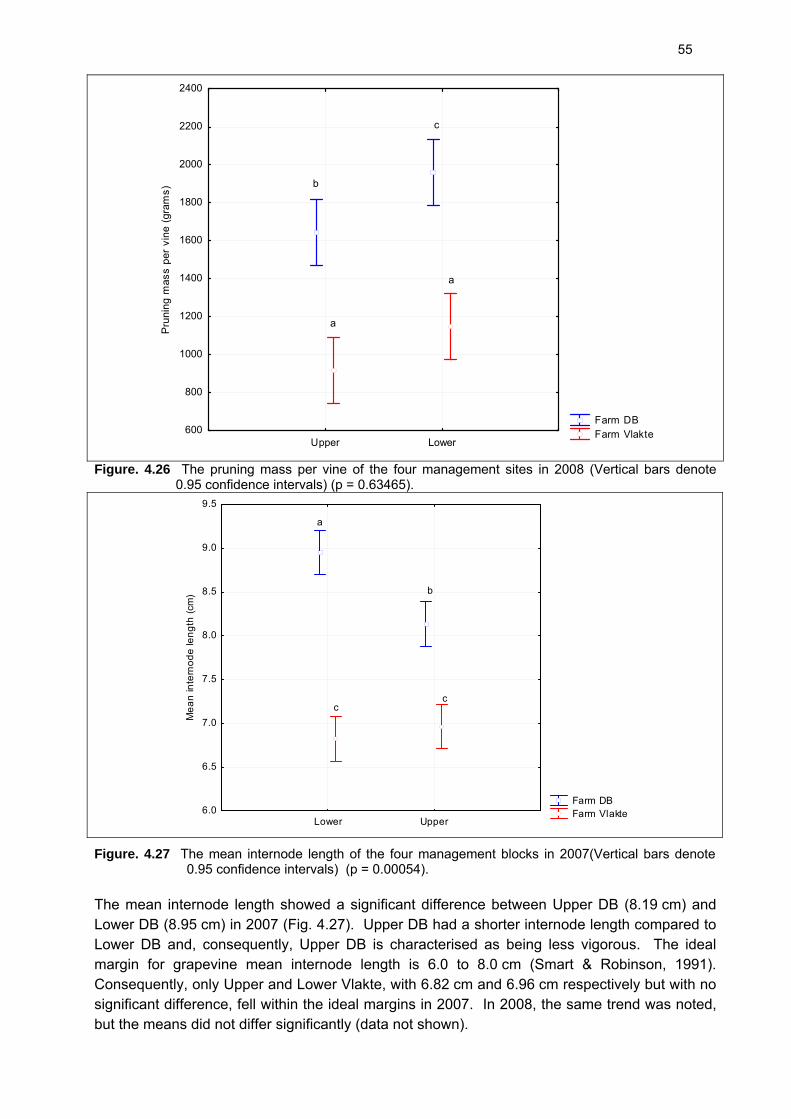
55
Farm DB Farm Vlakte
Upper Lower600
800
1000
1200
1400
1600
1800
2000
2200
2400
Pru
nin
g m
ass
per
vin
e (
gra
ms)
b
c
a
a
Figure. 4.26 The pruning mass per vine of the four management sites in 2008 (Vertical bars denote 0.95 confidence intervals) (p = 0.63465).
Farm DB Farm Vlakte
Lower Upper6.0
6.5
7.0
7.5
8.0
8.5
9.0
9.5
Me
an
inte
rno
de
len
gth
(cm
)
a
b
cc
Figure. 4.27 The mean internode length of the four management blocks in 2007(Vertical bars denote 0.95 confidence intervals) (p = 0.00054).
The mean internode length showed a significant difference between Upper DB (8.19 cm) and Lower DB (8.95 cm) in 2007 (Fig. 4.27). Upper DB had a shorter internode length compared to Lower DB and, consequently, Upper DB is characterised as being less vigorous. The ideal margin for grapevine mean internode length is 6.0 to 8.0 cm (Smart & Robinson, 1991). Consequently, only Upper and Lower Vlakte, with 6.82 cm and 6.96 cm respectively but with no significant difference, fell within the ideal margins in 2007. In 2008, the same trend was noted, but the means did not differ significantly (data not shown).

56
4.3.5 Berry analyses
Berry size is widely acknowledged as a factor that affects wine grape quality. Berry volume at harvest depends on many factors, which can modify berry growth at any stage of berry development. The main factors include environmental conditions (Dokoozlian & Kliewer, 1996), mineral nutrition (Ussahatanonta et al., 1996), crop load (Dokoozlian & Kliewer, 1995), leaf area (Candolfi-Vasconcellos & Koblet, 1990) and water status (Medrano et al., 2003). Berry volume was determined at the two management site at Doringbos (Fig 4.28) and the two management sites at Vlakte (Fig. 4.29). There were no significant differences between the berry size (volume) of the 25% and 50% crop reductions, nor were there significant differences between the upper and lower parts of the farms at harvest. Previous work reported that, with an increase in leaf area, berry volume also increases (Candolfi-Vasconcellos & Koblet, 1990). Leaf area (see Section 4.3.1) showed no significant difference at DB, but although the Lower Vlakte site had a significantly higher leaf area than that of the upper site (Table 4.11), no significant differences were found in berry volume. Similarly, for berry mass (data not shown) there were no significant differences between the crop-reduction treatments and the upper and lower sites on the two different farms. The bunch mass was determined by the producer at Boplaas for the four difference sites from 2004 until 2008, and there were differences between the two management sites of DB and Vlakte. A mean bunch mass of 163 g and 220 g for Upper and Lower Vlakte and a mean bunch mass of 185 g and 217 g for Upper and Lower DB was found over this period. No berry mass and berry number per bunch calculations were done by the farmer, only an observation by the farmer that the berries were smaller on the upper sites that on the lower sites. However, this was not verified by my results and further investigation is needed.
Table 4.12 The berry weight per 50 berries (g), berry weight (g), bunch weight and berry number per bunch for 2008 harvest.
Farm Treatment Mean berry weight per 50 berries (g)
Mean berry weight (g)
Mean bunch weight (g)
Mean berry no per bunch
(calculated)
Upper DB 50% CR 85.25 1.7 185 109
Upper DB 25% CR 87.16 1.7 185 109
Lower DB 50% CR 85.83 1.7 217 128
Lower DB 25% CR 89.89 1.8 217 121
Upper Vlakte 50% CR 88.13 1.8 163 91
Upper Vlakte 25% CR 94.3 1.9 163 86
Lower Vlakte 50% CR 84.83 1.7 220 129
Lower Vlakte 25% CR 87.67 1.8 220 122
By means of calculations for the 2008 harvest (Table 4.12) it is clear that the difference in bunch weight does not necessary lie in the smaller berries of the management sites but the berry number of the management sites. Future investigation is needed to verify that the grapevine from the upper management sites have fewer berries per bunch than those of the lower sites on DB and Vlakte farms.

57
Upper DB Lower DB
25% Crop reduction
1 2 3 4 5 6 7
Date
20
30
40
50
60
70
80
90
100
110
Vol
ume/
50 b
erri
es (
ml)
50% Crop reduction
1 2 3 4 5 6 7
Date
Figure. 4.28 The volume of 50 berries from Upper Doringbos (DB) and Lower DB from véraison until harvest for the 25% crop reduction and the 50% crop reduction. Dates of measurement: 1 (7 December 2007), 2 (14 December 2007), 3 (21 December 2007), 4 (4 January 2008), 5 (11 January 2008), 6 (22 January 2008) and 7 (31 January 2008) (x-axis not according to scale). (Vertical bars denote 0.95 confidence intervals) (p = 0.90881)
Upper Vlakte Lower Vlakte
25% Crop reduction
1 2 3 4 5 6 7
Date
20
30
40
50
60
70
80
90
100
110
Vol
ume/
50 b
erri
es (
ml)
50% Crop reduction
1 2 3 4 5 6 7
Date
Figure. 4.29 The volume of 50 berries from Upper Vlakte and Lower Vlakte from véraison until harvest for the 25% crop reduction and the 50% crop reduction. Dates of measurements: 1 (7 December 2007), 2 (14 December 2007), 3 (21 December 2007), 4 (4 January 2008), 5 (11 January 2008), 6 (22 January 2008) and 7 (31 January 2008) (x-axis not according to scale). (Vertical bars denote 0.95 confidence intervals) (p = 0.90881)

58
Grape anthocyanin determination The anthocyanin (Fig. 4.30) and total phenolic (Fig. 4.31) content of the grape skin was calculated.
50% CR 25% CR
Farm: Upper DB
Dat
e20
08/0
1/16
2008
/01/
22
2008
/01/
31
col
our
mg/
g be
rry
wei
ght
Farm: Lower DB
Dat
e20
08/0
1/16
2008
/01/
22
2008
/01/
31
Farm: Upper Vlakte
Dat
e20
08/0
1/16
2008
/01/
22
2008
/01/
31
Farm: Lower Vlakte
Dat
e20
08/0
1/16
2008
/01/
22
2008
/01/
31
-0.02
0.00
0.02
0.04
0.06
0.08
0.10
0.12
0.14
Figure. 4.30 Colour per gram berry weight (mg/g berry weight) was measured at 520 nm absorbance and calculated from véraison until harvest in 2008 at the four .management blocks (CR = crop reduction). (Vertical bars denote 0.95 confidence intervals) (p = 0.93182)
There were no significant differences between the anthocyanin (mg per g berry weight) for the 25% and 50% crop-reduction treatment, except for Upper DB on 16 January. Lower Vlakte (25% CR treatment) showed significant differences in comparison to Upper Vlakte on 16 January and on 22 January for the 50% crop reduction. No further significant differences were found (Fig. 4.30). The only significant differences were obtained over time in relation to normal berry development, as can be expected. The small differences between means could possibly be ascribed to the large variance between measurements as a result of large differences between the replications, as seen in Fig. 4.30. In the future, bigger grape samples, up to 250 berries, could rule out the large variance between measurements. However, Lower Vlakte tended to have lower values than Upper Vlakte across all measurement dates for both crop-reduction treatments, and Lower DB tended to have lower values across all measurement dates for the 50% crop-reduction treatment. The Touriga Naçional anthocyanin measurements from DDR cannot be compared directly with those of Calitzdorp Touriga Naçional grapes, because the grape extracts were prepared differently. In the DDR the grape skins were removed and 1.0 g of skin was extracted according to the procedure describe by Darné and Madero-Tamargo (Mateus et al., 2002). The skin extracts were then adjusted to a final volume of 100 mL and a pH of 4.0 (Mateus et al., 2002). However, a similar tendency was found in the DDR, in that berries from the upper sites had

59
higher anthocyanin per gram berry weight than those from the lower sites.
50% CR 25% CR
Farm: Upper DB
Dat
e20
08/0
1/16
2008
/01/
22
2008
/01/
31
Tot
al p
heno
lics
per
gram
ber
ry w
eigh
t
Farm: Lower DB
Dat
e20
08/0
1/16
2008
/01/
22
2008
/01/
31
Farm: Upper Vlakte
Dat
e20
08/0
1/16
2008
/01/
22
2008
/01/
31
Farm: Lower VlakteD
ate
2008
/01/
16
2008
/01/
22
2008
/01/
31
0.06
0.08
0.10
0.12
0.14
0.16
0.18
Figure. 4.31 Total phenolics (absorbance units, au) per gram berry weight were measured at 280 nm absorbance and calculated from véraison until harvest in 2008 for the four management blocks. The two crop reduction (CR) treatments (50% and 25%) were compared (Vertical bars denote 0.95 confidence intervals) (p = 0.945).
No significant differences were found for the total phenolic absorbance units per berry weight, except on 22 January, when the Upper Vlakte 50% crop reduction was significantly higher than that of Lower Vlakte (Fig. 4.31). The small differences between means could possibly be ascribed to the large variance between measurements, as a result of large differences between the replications. However, the two lower sites of the vineyards (Lower DB and Lower Vlakte) tended to have lower values than the two upper sites of the vineyards (Upper DB and Upper Vlakte) for the 50% crop-reduction treatment. The 50% crop-reduction treatment at Vlakte tended to have higher total phenolic absorbance units per berry weight values at harvest for both experimental sites when compared to the 25% crop-reduction treatment. The 50% crop reduction also tended to have the highest values prior to harvest, except at Lower DB. Mean values of 1.12 au/g berry for Merlot and Shiraz and 1.28 au/g berry for Cabernet Sauvignon were determined in different regions of Australia (Cynkar et al., 2004). In comparison, the 0.12 au/g berry weight from Calitzdorp is extremely low. These low values over all the samples could be the result of the sampling process, because the samples had to travel 360 km to the university before being frozen at -40°C. However, these values can also be affected by environmental differences (Sivilotti et al., 2005) and varietal differences (Cynkar et al., 2004), and further studies are necessary for Touriga Naçional. Grape tannin determination No significant differences were found for the tannin content (mg/L) for the 25% and 50% crop-reduction treatments for the four experimental blocks. Nor were there any significant differences between the two management sites at DB (Fig. 4.32) or the two sites at Vlakte (Fig

60
4.33). The small differences between means could possibly be ascribed to the large variance between measurements as a result of large differences between the replications. In the future, bigger grape samples, up to 250 berries, could rule out the large variance between measurements.
Upper DB Lower DB
50% Crop reduction
2008/01/162008/01/22
2008/01/31
Date
40
60
80
100
120
140
160
180
200
220
240
260
Ta
nn
in (
mg
/l)
25% Crop reduction
2008/01/162008/01/22
2008/01/31
Date
Farm: DB
Figure. 4.32 The tannin (mg/L) content at the two management sites at Doringbos (DB) for the 25% and 50% crop-reduction treatments, at three date intervals: 10 January 2008 (véraison), 22 January 2008 and 31 January 2008 (Vertical bars denote 0.95 confidence intervals) (p = 0.863).
Upper Vlakte Lower Vlakte
50% Crop reduction
2008/01/162008/01/22
2008/01/31
Date
40
60
80
100
120
140
160
180
200
220
240
260
Ta
nn
in (
mg
/l)
25% Crop reduction
2008/01/162008/01/22
2008/01/31
Date
Farm: Vlakte
Figure. 4.33 The tannin (mg/L) content at the two management sites at Vlakte for the 25% and 50% crop- reduction treatments, at three date intervals: 10 January 2008 (véraison), 22 January 2008 and 31 January 2008 (Vertical bars denote 0.95 confidence intervals) (p = 0.864).

61
Table 4.13 The pH, acidity (g/L), and sugar (ºB) from grapes at 50% and 25% crop reduction (CR) from the four management blocks at harvest ripeness.
Farm Treatment Mean pH Mean Acidity (g/L)
Mean sugar(ºB)
Upper DB 50% CR 4.2 4.5 26.4
Upper DB 25% CR 4.15 5 26.1
Lower DB 50% CR 4.2 4.5 25.5
Lower DB 25% CR 4.15 5.1 25.5
Upper Vlakte 50% CR 3.8 5.1 26.2
Upper Vlakte 25% CR 3.9 5.5 25.6
Lower Vlakte 50% CR 3.9 4.6 25.6
Lower Vlakte 25% CR 3.85 5 25.6
Grape analyses at harvest ripeness reveals that there are no trends for the pH of the grapes, but the mean acidity reveals that 50% CR had a lower acidity for all management sites. No trends were found for the mean acidity for the upper and lower sites of DB and Vlakte. Neither were there any trends for the sugar levels at the management sites. The mean pH and acidity of the grapes is very similar to that of the wine and Port-style wine (section 4.4 Wine and port-style wine analyses), this is because of no tartaric acid addition.
4.4 Wine and port-style wine analyses
The wine and port wine were made from the two different crop-reduction treatments (25% and 50% crop reduction) for each of the four management blocks (Tables 4.14 and 4.15).

62
Table 4.14 The pH, titratable acidity, tannin, colour and total phenolics of wine of Touriga Naçional made from grapes at 50% and 25% crop reduction (CR) from the four management blocks
Farm Treatment Mean pH Mean total acidity (g/L)
Mean colour (mg/L)
Mean total phenolics (au/L)
Mean tannin (mg/L)
Upper DB 50% CR 4.24 a1 4.72 ab 23.48 a 58.59 ac 154.98 a
Upper DB 25% CR 4.20 a 5.07 ac 22.65 ac 58.17 ac 156.75 a
Lower DB 50% CR 4.17 a 4.48 b 20.51 ab 55.50 abc 131.07 a
Lower DB 25% CR 4.12 a 5.32 cd 18.45 b 50.08 b 37.42 c
Upper Vlakte 50% CR 3.86 b 5.23 cd 22.42 ac 57.23 ac 290.67 b
Upper Vlakte 25% CR 3.94 b 5.65 d 22.08 ac 58.27 ac 326.87 b
Lower Vlakte 50% CR 3.94 b 4.74 ab 22.60 ac 58.62 c 339.50 b
Lower Vlakte 25% CR 3.87 b 5.18 acd 19.93 bc 54.94 abc 330.88 b 1Means in each column followed by the same letter do not differ significantly.
Table 4.15 The pH, titratable acidity, tannin, colour and total phenolics of port-style wine of Touriga Naçional made from grapes at 50% and 25% crop reduction (CR) from the four management blocks.
Farm Treatment Mean pH Mean total acidity (g/L)
Mean colour (mg/L)
Mean total phenolics (au/L)
Mean Tannin (mg/L)
Upper DB 50% CR 4.20 ab1 4.50 ab 19.98 ac 53.90 a 80.46 a
Upper DB 25% CR 4.10 ac 4.99 c 18.41 a 50.79 a 86.59 a
Lower DB 50% CR 4.26 b 4.38 a 20.11 ac 53.12 a 87.23 a
Lower DB 25% CR 4.21 ab 4.88 bc 20.18 ab 52.62 a 116.29 a
Upper Vlakte 50% CR 3.74 e 4.35 a 22.41 bcd 54.23 a 174.40 a
Upper Vlakte 25% CR 3.89 d 4.34 a 22.00 bcd 54.57 a 213.95 a
Lower Vlakte 50% CR 3.96 d 4.95 bc 19.33 ad 53.03 a 225.16 a
Lower Vlakte 25% CR 3.99 cd 4.73 abc 18.49 a 52.61 a 253.55 a 1Means in each column followed by the same letter do not differ significantly. There are no significant differences between the mean pH of the wine (Table 4.14) from the two management sites at Doringbos and the two sites at Vlakte, nor is there any significant difference between the two crop-reduction treatments across the four management blocks. However, the pH values from Upper DB tended to be slightly higher than those from Lower DB. For the port-style wines (Table 4.15), the lower management blocks at DB and Vlakte tended to have slightly higher pH values than the upper management blocks. There were significant differences between the pH of the Upper Vlakte treatments, with the 25% crop reduction pH being higher than that of the 50% crop reduction. There were also significant differences between the two management sites at Vlakte for the 50% crop-reduction treatment, with the pH of the upper site being lower than that of the lower site. Wines from the 50% crop-reduction treatment at Lower DB had a significantly lower titratable acidity than those from the 25% crop-reduction treatment. No other differences were

63
found between the crop-reduction treatments. Wines from the 50% crop-reduction treatment at Upper Vlakte had a significantly higher titratable acidity than those from Lower Vlakte. No other differences were found between the sites. At DB the 50% crop-reduction treatment produced port-style wines with significantly lower titratable acidity than the 25% crop-reduction treatment. There were also significant differences between the two management sites for the 50% crop reduction at Vlakte farm, with the titratable acidity at Upper Vlakte being lower than that of Lower Vlakte. No further significant differences were found for the mean titratable acidity. Crop load had an effect on the total acidity of the wine and port-style wine, with the 25% crop reduction having higher acidity than the 50% crop reduction. The higher crop load of the 25% crop-reduction treatment could delay ripening stage compared to the 50% crop reduction. The 25% crop reduction could take longer to achieve full ripeness. This was not confirmed with the grape analyses at full ripeness because there were no trends found for pH or sugar leves (Table 4.13) but the acidity of the 50% CR treatment was lower than that of the 25% CR for all management sites. Anthocyanin determination in wines
25% Crop reduction 50% Crop reduction
Port-style
Fa
rm
Lo
we
r D
B
Up
pe
r D
B
Lo
we
r V
lakt
e
Up
pe
r V
lakt
e
44
46
48
50
52
54
56
58
60
62
64
66
Me
an
to
tal p
he
no
lics
28
0n
m
Wine
Fa
rm
Lo
we
r D
B
Up
pe
r D
B
Lo
we
r V
lakt
e
Up
pe
r V
lakt
e
Figure. 4.34 Mean total phenolics (absorbance units) for port-style wine and wine, made from the four management blocks with two crop-reduction treatments (Vertical bars denote 0.95 confidence intervals) (p = 0.474).
Mean total phenolics for the wine and port-style wine (Fig. 4.34) were determined with a spectrophotometer at an absorbance of 280 nm. The Lower Doringbos wines had significantly lower total phenolics than those of Upper Doringbos for the 25% crop reduction, but not for the port-style wines. There was no further significant difference between the wine and the port-style wines. Crop load tended to have an effect on total phenolics, with the values for the 25% crop reduction tending to be lower than those for the 50% crop reduction (control) for all experimental sites except Upper Vlakte. These differences were clearer for the wine than for the port-style wine.

64
25% Crop reduction 50% Crop reduction
Port-style wine
Fa
rmL
ow
er
DB
Up
pe
r D
B
Lo
we
r V
lakt
e
Up
pe
r V
lakt
e
15
16
17
18
19
20
21
22
23
24
25
26
27
Me
an
an
tho
cya
nin
(m
g/L
) 5
20
nm
wine
Fa
rmL
ow
er
DB
Up
pe
r D
B
Lo
we
r V
lakt
e
Up
pe
r V
lakt
eFigure. 4.35 Mean colour for port-style wine and wine, made from the four management blocks with two crop-reduction treatments (Vertical bars denote 0.95 confidence intervals) (p = 0.770).
The mean colour of the wine and the port-style wine (Fig. 4.35) was determined with a spectrophotometer at an absorbance of 520 nm. There were no significant differences found for the wine from the four management blocks, except for the two management sites with a 50% crop reduction at Doringbos. The anthocyanins in the wine from Lower DB were significantly lower than that from Upper DB, according to the t-test. For the port-style wines there were no significant differences in anthocyanins, except for Upper Vlakte, which was significant higher than Lower Vlakte for the 25% crop-reduction treatment. The wines and port-style wines from the upper sites tended to have a higher colour content than those from the lower sites, except for the port-style wines from DB and the 50% crop-reduction wine from Vlakte. The 50% crop reduction also tended to be slightly higher for the wine and port-style wines (less obvious) from Vlakte and Doringbos when compared to the 25% crop-reduction treatment. For young port-style wines, mean total pigments, expressed as A520 in 1 M HCl, were 37.3 for the period 1977 to 1983 in the DDR (Bakker et al., 1986). Calitzdorp port-style wines measured lower values, of 19.98 and 20.11 for Upper and Lower DB (control) and 22.41 and 19.33 for Upper and Lower Vlakte (control) respectively (Table 4.15 and Fig. 4.35). Tannin determination in wines The mean tannin content of the wine (Fig. 4.36) and port-style wine (Fig. 4.37) was determined with the bovine serum albumin (BSA) method. Lower Doringbos with the 25% crop-reduction treatment showed an abnormally low mean tannin of 37.42 mg/L, which is the only cause of significant differences in the wine tannin content. The Upper Vlakte and DB experimental sites tended to have higher wine tannin contents than Lower Vlakte and DB in both the wines and the port-style wines. It seemed that crop load did not have an effect on the tannin content of the wine or port-style wine.

65
50% Crop reduction 25% Crop reduction
Lower DBUpper DB
Lower VlakteUpper Vlakte
Farm
-100
-50
0
50
100
150
200
250
300
350
400
450
Mea
n T
ann
in (
mg/
L)
Figure. 4.36 Mean tannin for wine made from the four management blocks with two crop-reduction treatments (Vertical bars denote 0.95 confidence intervals) (p = 0.095).
25% Crop reduction 50% Crop reduction
Lower DBUpper DB
Lower VlakteUpper Vlakte
Farm
-50
0
50
100
150
200
250
300
350
400
Mea
n T
ann
in (
mg
/L)
Figure. 4.37 Mean tannin for port-style wine made from the four management blocks with two crop- reduction treatments (Vertical bars denote 0.95 confidence intervals) (p = 0.687).

66
4.5 Sensory analyses
Table 4.16 Results of sensory analysis by means of triangle test (n = 30)
Compared triangle test Style
Number of tests in
which the odd wine
was identified
correctly (out of 30)
Number of tests in
which the wine in
brackets was preferred
Upper DB 25% and 50% CR Wine 16 * 13 * (50% CR)
Upper DB 25% and 50% CR Port 18 * 17 * (50% CR)
Lower DB 25% and 50% CR Wine 19 * 17 * (50% CR)
Lower DB 25% and 50% CR Port 18 * 16 * (50% CR)
Upper and Lower DB Wine 20 * 16 (Upper DB)
Upper and Lower DB Port 23 * 22 * (Upper DB)
Upper Vlakte 25% and 50% CR Wine 8 n/a
Upper Vlakte 25% and 50% CR Port 13 n/a
Lower Vlakte 25% and 50% CR Wine 9 n/a
Lower Vlakte 25% and 50% CR Port 19 * 18 * (50% CR)
Upper Vlakte and Lower Vlakte Wine 18 * 10 (Upper Vlakte)
Upper Vlakte and Lower Vlakte Port 21 * 17 * (Upper Vlakte)
* significant at p = 0.05 Out of the total number of 30 evaluations for each triangle test, a minimum of 15 correctly identified odd-one-out wines and port-style wines was considered to be significant at p<0.05. The panellists were also asked whether the odd wine or port-style wine was better or worse than the other two. This was considered to be equivalent to a paired preference test, using correct answers in the triangle test as n. If a judge used a “no preference option”, the “no preference judgements” were split proportionally to the preference split. Sensory analyses by means of a triangle test for the wine and port-style wines (Table 4.16) showed significant differences for both the wine and port-style wine between the two crop-reduction treatments at each of the management sites at Doringbos. The 50% crop reduction was considered to be of significantly higher quality than the 25% crop reduction. There also were significant differences between the upper and lower sites of Doringbos, with the upper being considered better than the lower site. For the Lower Vlakte port wines, a significant difference was found between the two treatments, with the 50% crop-reduction treatment being considered better than the 25% crop reduction. The Upper Vlakte port-style wine was also considered to be significantly better than the port-style wine from the lower site. Although there were significant differences between the sensory analyses, the chemical analyses of the wines and port-style wines did not show many significant differences between the four management blocks. The panellists were asked to comment on colour, tannin and the aroma characteristics of the wines that differed. The overall feeling was that the upper experimental sites had more colour, better tannin and more appealing aromas of violets, berries and apricots than the lower experimental sites. No descriptive analyses were done in this experiment, but this should be considered in further studies, as the results may indicate what carotenoid compounds and concentrations of the compounds may be responsible for the

67
differences in aroma. Research has been done on the carotenoid profiles of grapes in relation to aromatic compounds in wines from the DDR (Oliveira et al., 2006) and it was found that Touriga Naçional wines had a higher content, compared to the other Portuguese varieties, of terpenols and β-ionone, which, in part, could explain the floral and violet aroma characteristics that the panellists noted during the sensorial analysis. Compounds such as 2,2,6-trimethylcyclohexanone (TCH), β-ionone, 1,1,6-trimethyl-1,2-dihydronaphthalene (TDN) and β-damascenone have also been identified in port wines (Mendes-Pinto et al., 2005). Free terpenols, linalool, α-terpineol, nerol and geraniol are responsible for the floral-like aromas and are also found in high amounts in Touriga Naçional wines (Oliveira et al., 2006). Most of these components were analysed using HPLC and identified through comparison with commercially available standards (Mendes-Pinto et al., 2005; Oliveira et al., 2006). Higher concentrations of terpenols and β-ionone are expected to be found in the wines made from grapes from the upper experimental sites, not only because of the comments given by the panellist during the sensorial analyses, but also because the better light conditions in the grapevine canopy are expected to increase the concentrations of monoterpenes (Marais et al., 1999) and C13-norisoprenoids (Marais, 1992). In contrast, carotenoids decrease with sunlight exposure, while terpene and carotenoid contents decrease with ripening (Marais, 1992). The upper management sites have a good sunlight/shade balance, which should allow low levels of TDN (kerosene flavours) but still sufficient floral-like flavours. In future, the wines and port-style wines could also be scored on the 20-point wine evaluation score cards that are used universally in the wine industry to see the difference in colour (3 points), aroma (7 points) and taste (10 points), or by means of an unstructured line scale that can be used for a generic descriptive analysis of the wine.
4.6 References
Amerine, M.A. & Winkler, A.J., 1944. Composition and quality of must and wine of Californian grapes. Hilgardia 15, 493-675.
Archer, E., 2001. Die verband tussen stokvormingpraktyke en druifgehalte. Wynboer Tegnies 145, 19-20.
Bakker, J., Bridle, P., Timberlake, C.F. & Arnold, G.M., 1986. The colour, pigment and phenol content of young port wines: effects of cultivar, season and site. Vitis 25, 40-52.
Begg, J.E. & Turner, N.C., 1970. Water potential gradients in field tobacco. Plant Physiology 46, 343-346.
Bravdo, B., Hepner, Y., Loinger, C., Cohen, S., and Tabacman, H., 1985. Effect of Crop Levels and Crop Load on Growth, Yield, Must and Wine Composition, and Quality of Cabernet Sauvignon. Am. J. Enol. Vitic., Vol 36, No. 2:125-131.
Bravdo, B., Hepner, Y., Loinger, C., Cohen, S. & Tabacman, H., 1985. Effect of crop levels and crop load on growth, yield, must and wine composition, and quality of Cabernet Sauvignon. Am. J. Enol. Vitic. 36(2), 125-131.
Candolfi-Vasconcellos. M.C. & Koblet, W., 1990. Yield, fruit quality, bud fertility and starch reserve as a function of leaf removal in Vitis vinifera – evidence of compensation and stress recovering. Vitis 29, 199-221.
Conradie, W.J., 1981. Seasonal uptake of nutrients by Chenin blanc in sand culture: II. Phosphorous, potassium, calcium and magnesium. S. Afr. J. Enol. Vitic. 2, 7-13.
Cynkar, W.V., Cozzoline, D., Dambergs, R.G., Janik, L. & Gishen, M., (2004). The effects of homogenisation method and freezing on the determination of quality parameters in red grape berries of Vitis vinifera. Australian Journal of Grape and Wine Research 10(3), 236-242.
De Villiers, F.S., Schmidt, A., Theron, J.C.D. & Taljaard, R. 1996. Onderverdeling van die Wes-Kaapse wybougebiede volgens bestaande klimaatskriteria. Wynboer Tegnies 78, 10-12.

68
Dokoozlian, N.K. & Kliewer, W.M., 1995. The light environment within grapevine canopies. II. Influence of leaf area density on fruit zone light environment and same canopy assessment parameters. Am. J. Enol. Viticult. 26, 219-226.
Dokoozlian, N.K. & Kliewer, W.M., 1996. Influence of light on grape berry growth and composition varies during fruit development. J. Am. Soc. Hort. Sci. 121, 869-874.
Escalona, J.M., Flexas, J. & Medrano, H., 1999. Stomatal and non-stomatal limitations of photosynthesis under water stress in field-grown grapevines. Aust. J. Plant Physiol. 26, 421-433.
Freeman, B.M., Kliewer, W.M. & Stern, P., 1982. Influence of windbreaks and climatic region on diurnal fluctuation of leaf water potential, stomatal conductance, and leaf temperature of grapevines. Am. J. Enol. Vitic. 33, 233-236.
Hunter, J.J., 1998a. Plant spacing implications for grafted grapevines I. Soil characteristics, root growth, dry matter partitioning, dry matter composition and soil utilisation. S. Afr. J. Enol. Vitic. 19, 25-34.
Hunter, J.J., 1998b. Plant spacing implications for grafted grapevines II. Soil water, plant water relations, canopy physiology, vegetative and reproductive characteristics, grape composition, wine quality and labour requirements. S. Afr. J. Enol. Vitic. 19, 25-34.
Hunter, J.J. & Le Roux, D.J., 1992. The effect of partial defoliation on development and distribution of roots of Vitis vinifera L. cv. Cabernet Sauvignon grafted onto rootstock 99 Richter. Am. J. Enol. Vitic. 43, 71-78.
Hunter, J.J., Ruffner, H.P., Volschenk, C.G. & Le Roux, D.J., 1995. Partial defoliation of Vitis vinifera cv. Cabernet Sauvignon/99 Richter: effect on root growth, canopy efficiency, grape composition, and wine quality. Am. J. Enol. Vitic. 46, 306-314.
Hunter, J.J. & Visser, J.H., 1988. The effect of partial defoliation, leaf position and developmental stage of the vine on the photosynthetic activity of Vitis vinifera L. cv. Cabernet Sauvignon. S. Afr. J Enol. Vitic. 9(2), 9-15.
Hunter, J.J. & Visser, J.H., 1989. The effect of partial defoliation, leaf position and developmental stage of the vine on leaf chlorophyll concentration in relation to the photosynthetic activity and light intensity in the canopy of Vitis vinifera L. cv. Cabernet Sauvignon. S. Afr. J. Enol. Vitic. 10, 67-73.
Kliewer, W.M. & Torres, R.E., 1972. Effect of controlled day and night temperatures on grape coloration. Amer. J. Enol. Viticulture 23(2), 71-77.
Kriedemann, P.E., 1968. Photosynthesis in vine leaves as a function of light intensity, temperature, and leaf age. Vitis 7, 213-220.
Kriedemann, P.E., 1977. Vineleaf photosynthesis. In: Proc. Int. Symp. Qual. Vint., 14-21 February 1977, Cape Town, South Africa. pp. 67-87.
Marais, J., 1992. Factors affecting the development of 1,1,6-trimethyl-1,2-dihydronaphthalene in Vitis vinifera L. cv. Weisser Riesling grapes and wine. Ph.D. Agric dissertation, University of Stellenbosch, Stellenbosch, Republic of South Africa.
Marais, J., Hunter, J.J., and Haasbroek, P.D., 1999. Effects of canopy microclimate, season and region on Sauvignon blanc grape composition and wine quality. S. Afr. J. Enol. Vitic. 20, 19-30.
Mateus, N., Machado, J.M. & De Freitas, V., 2002. Development changes of anthocyanins in Vitis vinifera grapes grown in the Douro Valley and concentration in respective wines. J. Sci. Food Agric. 82, 1689-1695.
Medrano, H., Escalona, H.J.M., Bota, J., Gulias, J. & Flexas, J., 2002. Regulation of photosynthesis of C3 plants in response to progressive drought, stomatal conductance as a reference parameter. Ann. Bot. 89, 895-905.
Medrano, H., Escalona, H.J.M., Cifre, J., Bota, J. & Flexas, J., 2003. A ten-year study on the physiology of two Spanish grapevine cultivars under field conditions: effects of water availability from leaf photosynthesis to grape yield and quality. Funct. Plant Biol. 30, 607-619.
Mendes-Pinto, M.M., Ferreira, A.C.S., Caris-Veyrat, C. & De Pinho, P.G., 2005. Carotenoids, chlorophyll and chlorophyll-derived compounds in grape and port wines. J. Agric. Food Chem. 53, 10034-10041.
Moutinho-Pereira, J.M., Correia, C.M., Goncalves, B.M., Bacelar, E.A. & Torres-Pereira, J.M. 2004. Leaf gas exchange and water relations of grapevines grown in three different conditions. Photosynthetica 42(1), 81-86.
Noar, A., Wample, R.L. 1995. A rapid field method for measuring net assimilation rate-stomatal conductance relationship: a feasibility test using grapevine leaves. Scientia Horticulturae, 60, 287-292.
Oliveira, C., Barbosa, A., Silva Ferreira, A.C., Guerra, J. & De Pinho, P.G., 2006. Carotenoid profile in grape related to aromatic compounds in wines from Douro region. Journal of Food Science 71(1), S1-S6.

69
Schultz, H.R., 1996. Water relations and photosynthetic responses of two grapevine cultivars of different geographical origin during water stress. In: Poni, S., Peterlunger, E., Iacono, F. & Intrieri, C. (eds). Proc. Workshop Strategies to Optimize Wine Grape Quality, Conegliano, Italy. pp. 251-266.
Sivilotti, P., Botetto, C., Paladin, M., and Peterlunger, E., 2005. Effect of Soil moisture availability on Merlot: From leaf water potential to grape composition. Am. J. Enol. Vitic. 56 (1): 9-17.
Smart, R. & Robinson, M., 1991. Sunlight into wine. Winetitles, Adelaide.
Sousa, T.A., Oliveira, M.T. & Pereira, J.M., 2006. Physiological indicators of plant water status of irrigated and non-irrigated grapevines grown in a low rainfall area of Portugal. Plant and Soil 282, 127-134.
Ussahatanonta, S., Jackson, D.I. & Rowe, R.N., 1996. Effects of nutrient and water stress on vegetative and reproductive growth in Vitis vinifera L. Am J. Grape Wine Res. 2, 64-69.

CChhaapptteerr 55
General discussion and conclusions

71
General discussion and conclusions
5.1 Introduction
The ultimate aims of the project were to determine the reasons for quality-related differences between two adjacent Touriga Naçional blocks in order to determine why the one block delivers reserve-quality wines and ports, and the other block only good quality wines and ports. This included the determination of differences in physiological performance between the four Touriga Naçional management blocks. In addition, an attempt was made to determine the qualitative effects on grape maturation of 50% and 25% crop reduction in the Touriga Naçional blocks.
5.2 General discussion
The growth potential of the grapevine is influenced by soil characteristics and climate. Although there were small differences between the soil chemical and physical analyses, there were differences in soil depth and clay percentage between the two management sites at each farm, and thus differences in soil water-holding capacity could be expected, especially in the light of the combined differences in stone content at Doringbos. Upper DB had a lower clay percentage but deeper soil, before the 80% stone fraction (coarse quartzite sandstone), than Lower DB. In contrast, Upper Vlakte had more clay and deeper soil (before the high percentage of free lime) than Lower Vlakte. Deeper soil and a higher clay percentage give the soil higher water-holding capacity and thus a bigger buffer against water stress. The soils have moderate to low water-holding capacity and, in association with the low rainfall of Calitzdorp, this results in water deficits during the growing season, which are considered beneficial for the timely arrestment of shoot growth. Lower and Upper DB had good, even distribution of roots with a diameter smaller than 2 mm, as well as of roots with a diameter greater than 2 mm, over 10 to 100 cm soil depth. In contrast, most of the roots at Upper and Lower Vlakte were found at a shallow (10 to 50 cm) soil depth. The highest density of roots with a diameter smaller than 2 mm and greater than 2 mm was at a depth of 40 cm at Upper and Lower Vlakte. The temperatures for the upper sites of the farms were on average hotter than for the lower sites. There was no significant difference between the two management sites for the number of hours at the optimum temperature range for photosynthesis (20 to 30°C). Although the differences at Vlakte are small, Lower Doringbos would appear to have a greater amount of time within the optimal range for berry metabolism (20 to 25°C) than Upper Doringbos. The plant water status, as measured by means of the leaf water potential and stomatal conductance, revealed that the grapes in the upper experimental sites of DB and Vlakte tended to have slightly higher water deficits than those of the lower experimental sites. With the slightly higher temperature at the upper experimental sites and moderate to low water-holding capacity, it is no surprise that the upper sites of both farms had less vegetative growth. Lower pruning mass, shorter internodes and a higher score on the vineyard scorecard are attributes of less vigorous growth. The lower sites were considered to be more vigorous, with a higher pruning mass, longer internodes and a lower score on the vineyard scorecard. Plant water status appeared to be affected to a certain extent by crop load, but this would appear to be dependent on management block.

72
High-quality grapes are typically associated with a low yield, small bunches, small berries and low-vigour canopies, because vineyards with low yield and low vigour have open canopies with good leaf and fruit exposure (Smart & Robinson, 1991). The berry analyses in relation to the two crop reductions of 50% (control) and 25% revealed no significant differences between the four management sites for anthocyanin and tannin contents. Lower Vlakte tended to have lower anthocyanin values in the grapes than Upper Vlakte across all measurement dates for both crop-reduction treatments. This could be explained by the more exposed canopy of the Upper Vlakte site, which would be expected to increase colour development in the grapes due to the light dependency of the enzyme responsible for colour development (Hunter et al., 1991). Lower DB tended to have lower values of anthocyanins across all measurement dates for the 50% crop-reduction treatment. Lower values of total phenolics were found for the two lower management blocks of the vineyards at DB and Vlakte. The tannin content in the grapes showed no obvious trends between the sites on each farm and this could possibly be ascribed to large variances between measurements. No significant differences were found in the analysis of the wine and port-style wine, but some trends were identified and there were significant differences at the sensory tasting. The sensory analyses for the wine and port-style wine revealed a larger significant difference between the four management blocks than the chemical analyses revealed. Significant differences were found between the two crop-reduction treatments at each of the two management sites at Doringbos for the wine and port-style wine. The 50% crop reduction was significantly better than the 25% crop reduction treatment at Doringbos. There also were significant differences between the upper and lower sites of Doringbos, with the upper site better than the lower site. In relation to the Lower Vlakte port-style wines there were significant differences between the two treatments, with the 50% crop-reduction treatment being better than the 25% crop reduction. Upper Vlakte was also significantly better than the lower sites for the port-style wine. The upper experimental sites seem to be of higher quality than the lower experimental sites, and the 50% crop reduction also seems to be of a better quality that the 25% crop reduction.
5.3 Perspectives and future research
Further in-depth studies can be done by means of HPLC to determine anthocyanidin monoglucosides to establish not only the total anthocyanins, but also the different types of anthocyanins in grapes, as well as in the wines and port-style wines. Anthocyanins that have previously been identified in Touriga Naçional grape skins in the DDR at different concentrations in relation to each other are delphinidin-, cyanidin-, petunidin-, peonidin- and malvidin-3-glucoside, with their respective acylated esters (acetyl, coumaroyl and caffeoyl esters) (Mateus et al., 2001). The anthocyanin that was found in the highest amounts was malvidin-3-glucoside for Touriga Naçional in the DDR (Mateus et al., 2001). The colour intensity and stability of the wine not only depends on the anthocyanin concentration, but also on intra- and intermolecular co-pigmentation and self-association of the anthocyanins (Mateus et al., 2002; Mateus et al., 2001). Furthermore, the proanthocyanidins depend mainly on their grape extraction rate during fermentation (Timberlake & Bridle, 1976). Interaction between the low molecular procyanidin dimers and total anthocyanidin monoglucosides may occur through co-pigmentation phenomena. Further interaction may occur through direct condensation or involving ethyl bridges between anthocyanins and procyanidin dimer components (Mateus et al., 2002; Mateus et al., 2001).

73
More detailed bunch analyses can be done in the future to determine if the difference in bunch weight that was measured over the years on the farm is not because of bunch composition rather than berry weight. Only berry mass and volume were determined, as that was where it was expected the differences were, as a result of anecdotal data, and it was also expected to be related to colour and quality differences. Following the data, it would have been better to have done more detailed bunch analyses, and these should be done in the future. HPLC profiles of the Touriga Naçional grapes can be obtained to determine carotenoids, chlorophyll and chlorophyll derivatives. Compounds such as lutein, β-carotene and chlorophyll b have been isolated from grapes in the DDR and high amounts have been described in the literature (Mendes-Pinto et al., 2005). These compounds could also be analysed in the Little Karoo Touriga Naçional grapes to discover the levels at which they are present and whether they may contribute to the flavour and aroma of the grapes and, ultimately, the wine and port-style wines. Glycoside precursors such as linanol, α-terpineol, nerol, geraniol, α-ionone, β-ionone and TDN could also be determined by gas chromatography-mass spectrometry (GC-MS) to help determine the aroma profile of Touriga Naçional in the Little Karoo. These suggested future studies are aimed at the sensory and colour descriptors that were noted by the sensory panel but not in the analyses of the grapes or the wine and Port-style wines used in the current study.
5.4 Conclusions
The ultimate aims of this study, viz. to determine reasons for quality-related differences between two adjacent Touriga Naçional blocks in the Little Karoo region of South Africa, in the Calitzdorp district, and to determine differences in physiological performance between the four Touriga Naçional management blocks, have been met. Significant differences were found between the two adjacent Touriga Naçional blocks, especially between the vigour of the adjacent blocks. The upper sites of the blocks that delivered the reserve-quality port-style wines experienced a higher water deficit because of the moderate soil water capacity and higher temperatures than the lower sites. The higher water deficit had a restraining effect on the Touriga Naçional vines and the upper sites had lower vigour. The lower vigour had a positive effect on the canopy of the vines, giving more leaf and bunch exposure, which in turn had a positive effect on the quality of the wine and port-style wine. The ultimate aim of determining the qualitative effects of 50% and 25% crop reduction in the Touriga Naçional blocks on grape maturation has been met; however, it appears that although crop load had an effect it is dependent on the management block and deserves further study. The 50% crop reduction also had a significant positive effect on the sensory analyses, but not a significant effect on the chemical analyses. Further studies should be done to evaluate the long-term effect of the crop-reduction treatment. In-depth chemical and sensorial analyses could also be done to determine the reasons for the differences that were found with the triangle test. In the future, the Darné and Madero-Tamargo grape extract method should be used, not because the method that was used in this study was insufficient, but because the Calitzdorp Touriga Naçional berry colour and total phenolics could not be compared to those of the DDR due to the different grape extract methods that were used. The HPLC method to determine the anthocyanidin monoglucosides (AMGs) of the skin extracts could also be explored. Calitzdorp terroir has a similar effect on Touriga Naçional compared to the DDR terroir. It is not only the climate that is similar, with long warm summer days and cool nights, but also the

74
soil combined with the low rainfall, which gives the same restraining effect. The restrained vigour and low yield are further encouraged by the slightly elevated slope with good drainage, which also promotes good leaf and bunch exposure In Calitzdorp, Touriga Naçional planted on soils with a depth limitation and situations with higher temperatures, resulting in a higher water deficit, and more limited growth will produce grapes for higher quality wine and port-style wine. The effects of crop reduction on wine quality would appear to be dependent on individual vineyard characteristics and deserves further study.
5.5 References
Hunter, J.J., De Villiers, O.T. & Watts, J.E., 1991. The effect of partial defoliation on quality characteristics of Vitis vinifera L. cv. Cabernet Sauvignon grapes II. Skin, skin sugar, and wine quality. Am. J. Enol. Vitic. 46, 306-314.
Mateus, N., De Pascual-Teresa, S., Rivas-Gonzalo, J.C., Sanos-Buelga, C. & De Freitas, V., 2002. Structural diversity of anthocyanin-derived pigments in port wines. Food Chemistry 76: 335-342.
Mateus, N., Proenca, S., Ribeiro, P., Machado, J.M. & De Freitas, V., 2001. Grape and wine polyphenolic composition of red Vitis vinifera varieties concerning vineyard altitude. Cienc. Tecnol. Aliment. 3(2), 102-110.
Mendes-Pinto, M.M., Ferreira, A.C.S., Caris-Veyrat, C. & De Pinho, P.G., 2005. Carotenoids, chlorophyll and chlorophyll-derived compounds in grape and port wines. J. Agric. Food Chem. 53, 10034-10041.
Smart, R. & Robinson, M., 1991. Sunlight into wine. Winetitles, Adelaide.
Timberlake, C.F. & Bridle, P., 1976. Interactions between anthocyanins, phenolic compounds and acetaldehyde and their significance in red wines. American Journal of Enology and Viticulture, 27, 97-105.