total white blood cell counts for persons ages 1-74 years
TRANSCRIPT

Total White Blood Cell Counts for Persons Ages 1-74 Years With Differential Leukbcyte Counts for Ad&s Ages 25-74 Years: United States, 1971-75
This report presents white blood cell count findings for persons ages 1-74 years and differential leukocyte count findings for adults ages 25-74 years, by age, sex, and race, from the first National Health and Nutrition Examination Survey: United States, 1971-75
Data From the National Health Survey Series 11, No. 220
DHHS Publication No. (PHS) 82-1670
U.S. Department of Health and Human Services Public Health Service Office of Health Research, Statistics,
and Technology National Center for Health Statistics Hyattsville, Md. January 1982


National Center for Health Statistics
DOROTHY P. RICE, Directo~
ROBERT A. ISRAEL, Deputy Director
JACOB J. FELDMAN, Ph. D., Associate Director for Analysisand Epidemiology
GAIL F. FISHER, Ph. D., Associate Director for theCooperative Health Statistics System
GARRIE J, LOSEE, Associate Director for Data Processingand Services
ALVAN O. ZARATE, Ph. D., Assistant Director forInternational Statistics
E. EARL BRYANT, Associate Director for Interview and
Examination Statistics
ROBERT C. HUBER, Associate Director for Management
MONROE G, SIRKEN, Ph. D., Associzte Director for Researchand Methodolo~
PETER L. HURLEY, Associate Director for Vital and Health
Cizre Statistics
ALICE HAYWOOD, information Officer
Interview and Examimtion Statistics Program
E. EARL BRYANT, Associate Director
MARY GRACE KOVAR, Spectil Assistant for Data Policyand Analysis
Division of Health Examination Statistics
ROBERT S. MURPHY, Director
SIDNEY ABR4114M, Chiefi Nutritional Statistics Branch
KURT R. MAURER, Acting Chief Survey Planning and
Development Branch
Division of Data Services
JAMES C. JACKS, Ph.D., Director
DAVID L. LARSON, ChieJ Health Examination FieldOperations Branch
Centers for Disease ControlCenter for Infectious DiseasesHematology Division
BRUCE L. EVATT, M.D., Director
O. W. VAN ASSENDELFT, M.D., Ph.D., Chief
General Hematology Branch
Cooperarl”onof the U.S.Bureau of the Census
In accordance with specifications established by the NationalCenter for Health Statistics, the U.S. Bureau of the Census, under acontractual agreement, participated in the design and selection of thesample and carried out the first stage of the field interviewing andcertain parts of the statistical processing.

Acknowledgments
The authors would like to aclmowledge the work of CarolWilliams and Laurel MacDowell, formerly of the Health Exam-ination Field Operations Branch, Division of Data Services,National Center for Health Statistics, for their assistance in thepreparation of this manuscript. Tne authors are also gratefulfor the advice of Marguerite Candler Ballard, M-S., M.D.,Centers for Disease Control.
..11I

Contents
Acknowledgments . . . . . . . . . . . . . . . . . . . . . . . . . . . . . . . . . . . . . . . . . . . . . . . . . . . . . . . . . . . . . . . . . . . . . . . .
Introduction . . . . . . . . . . . . . . . . . . . . . . . . . . . . . . . . . . . . . . . . . . . . . . . . . . . . . . . . . . . . . . . . . . . . . . . . . . . .
Highlights . . . . . . . . . . . . . . . . . . . . . . . . . . . . . . . . . . . . . . . . . . . . . . . . . . . . . . . . . . . . . . . . . . . . . . . . . . .
Data collection . . . . . . . . . . . . . . . . . . . . . . . . . . . . . . . . . . . . . . . . . . . . . . . . . . . . . . . . . . . . . . . . . . . . . . . .
Source ofdata, . . . . . . . . . . . . . . . . . . . . . . . . . . . . . . . . . . . . . . . . . . . . . . . . . . . . . . . . . . . . . . . . . . . . . . . . .
Background . . . . . . . . . . . . . . . . . . . . . . . . . . . . . . . . . . . . . . . . . . . . . . . . . . . . . . . . . . . . . . . . . . . . . . . . . .
Procedures . . . . . . . . . . . . . . . . . . . . . . . . . . . . . . . . . . . . . . . . . . . . . . . . . . . . . . . . . . . . . . . . . . . . . . . . . . .
Data base . . . . . . . . . . . . . . . . . . . . . . . . . . . . . . . . . . . . . . . . . . . . . . . . . . . . . . . . . . . . . . . . . . . . . . . . . . . .
Findings . . . . . . . . . . . . . . . . . . . . . . . . . . . . . . . . . . . . . . . . . . . . . . . . . . . . . . . . . . . . . . . . . . . . . . . . . . . . . .
White blood cellcount . . . . . . . . . . . . . . . . . . . . . . . . . . . . . . . . . . . . . . . . . . . . . . . . . . . . . . . . . . . . . . . . . . .
Smoking andthewhite bloodcell count . . . . . . . . . . . . . . . . . . . . . . . . . . . . . . . . . . . . . . . . . . . . . . . . . . . . . . .
Differential leukocytecount . . . . . . . . . . . . . . . . . . . . . . . . . . . . . . . . . . . . . . . . . . . . . . . . . . . . . . . . . . . . . . .
Discussion . . . . . . . . . . . . . . . . . . . . . . . . . . . . . . . . . . . . . . . . . . . . . . . . . . . . . . . . . . . . . . . . . . . . . . . . . . .
References . . . . . . . . . . . . . . . . . . . . . . . . . . . . . . . . . . . . . . . . . . . . . . . . . . . . . . . . . . . . . . . . . . . . . . . . . . . . .
Listofdetailed tables . . . . . . . . . . . . . . . . . . . . . . . . . . . . . . . . . . . . . . . . . . . . . . . . . . . . . . . . . . . . . . . . . . . . . .
Appendixes
1. Statistical notes . . . . . . . . . . . . . . . . . . . . . . . . . . . . . . . . . . . . . . . . . . . . . . . . . . . . . . . . . . . . . . . . . . . . .
Il. Definitions ofcertain termsused inthis repoti . . . . . . . . . . . . . . . . . . . . . . . . . . . . . . . . . . . . . . . . . . . . . . . .
111. Data collection methodology. . . . . . . . . . . . . . . . . . . . . . . . . . . . . . . . . . . . . . . . . . . . . . . . . . . . . . . . . . . .
lV. Quality control . . . . . . . . . . . . . . . . . . . . . . . . . . . . . . . . . . . . . . . . . . . . . . . . . . . . . . . . . . . . . . . . . . . . .
1.
2.
3.
4.
5.
6.
7.
8.
9.
10.
Estimated mean white blood cell count bysex, age, and examination sample: United States, 197”
Estimated meanwhile blood cell count bvraceand age: Unitd States, l97l-74. . . . . . . . . . .
Estimated mean white blood cell count formales byraceand age: United States, l97l-74 . . . . .
-75 . . . . . . . . . . . . . .
. . . . . . . . . . . . . . . .
. . . . . . . . . . . . . . . .Estimated mean white blood cell count for females by race andage: United States, 1971-74 . . . . . . . . . . . . . . . . . . . .
Estimated mean white blood cell count forwhite personsbysexand age: LJnited States, 1971-74 . . . . . . . . . . . . . . . .
Estimated mean white blood cell count for black persons bysexand age: United States, l97l-74. . . . . . . . . . . . . . . . .
Estimated mean percent ofsegmented neutrophils and lymphocytes byrace and age: United Statesr 1971-75. . . . . . . . .
Estimated mean number of segmented neutrophils and lymphocytes for white persons by sex and age: United Statesr
1971-75 . . . . . . . . . . . . . . . . . . . . . . . . . . . . . . . . . . . . . . . . . . . . . . . . . . . . . . . . . . . . . . . . . . . . . . . . . . .
Estimated mean number of segmented neutrophils and Lymphocytes for black persons by sex and age: United States,
1971-75 . . . . . . . . . . . . . . . . . . . . . . . . . . . . . . . . . . . . . . . . . . . . . . . . . . . . . . . . . . . . . . . . . . . . . . . . . . .
Estimated percent distribution of the U.S. population ages 25-74 years by mean number of segmented neutrophils:
United States, 1971-75 . . . . . . . . . . . . . . . . . . . . . . . . . . . . . . . . . . . . . . . . . . . . . . . . . . . . . . . . . . . . . . . . .. .
...Ill
1
1
1
3
3
3
3
5
5
8
8
10
14
16
27
33
34
36
4
6
6
7
7
8:
10
11
11
12

11. Estimated percent distribution of the U.S. population ages 25-74 years by mean number of lymphocytes: United States,
1971-75 . . . . . . . . . . . . . . . . . . . . . . . . . . . . . . . . . . . . . . . . . . . . . . . . . . . . . . . . . . . . . . . . . . . . . . . . . . . 12
List of Text Tables
A. Estimated mean number and mean percent of leukocytes by type of leukocyte, according to age: United State!s,
1971-75 . . . . . . . . . . . . . . . . . . . . . . . . . . . . . . . . . . . . . . . . . . . . . . . . . . . . . . . . . . . . . . . . . . . . . . . . . . . 5
B. Percent distribution of the U.S. population by mean number of white blood cells, according to age: United State:s,
1971-74, . . . . . . . . . . . . . . . . . . . . . . . . . . . . . . . . . . . . . . . . . . . . . . . . . . . . . . . . . . . . . . . . . . . . . . . . . . 8
C. Number of examined persons, mean number, and mean percent of white blood cells, segmented neutrophils, and lympho-
cytesfor adults ages25-74 years by race, sex, and smoking status: United States, 1971-75 . , , . . . , . . , . , . . . . . . . , 9
D. Number of smears and percent distribution by type of leukocyte, according to technologist number. . . . . . . . . . . . . . , 13
Symbols
--- Data not available
,,. Category not applicable
Quantity zero
0.0 Quantity more than zero b,ut less than
0.05
z Quantity more than zero but less than
500
*Figure does not meet standards of
reliability or precision (more than
30-percent relative standard error)
# Figure suppressed tocomply with
confidentiality requirements

Total White Blood Cell Counts
for Persons Ages 1-74 Years
With Differential Leukocyte Counts
for Adults Ages 25-74 Yearsby Cornelia R. McGrathr M.T. (ASCP),a Dale C. Hitchcock,b
and Onno W. van Assendelft, M. D., Ph. D.a
Introduction
Highlights
During the first National Health and NutritionExamination Survey, over 21,000 white blood cellcounts were performed on examinees 1-74 years ofage, and approximately 5,500 differential leukocytecounts were performed on a subsarnple of examinees25-74 years of age. The data obtained have beenexpanded by appropriate weighting factors to repre-sent the U.S. civilian noninstitutionalized population.The results have been reviewed for race, sex, andage differences.
Mean values, standard enors of the mean, andpercent distributions have been estimated for thewhite blood cell counts. The white population wasfound to have a higher white blood cell count thanthe black population has. Children less than 6 yearsof age have higher white blood cell counts than olderpersons have.
Percent and absolute numbers of bands, seg-mented neutrophils, lymphocytes, monocytes, eosin-ophils, and basophils are also presented in this report.The white population was found to have a highermean segmented neutrophil value both in percent andabsolute number than the black population has. Thishigher neutrophil value accounts for most of thehigher total white blood cell count in the white popu-lation. Black adults have a higher mean percent oflymphocytes than their white counterparts have.
Data collection
The National Center for Health Statistics collects,analyzes, and disseminates data on the health of theU.S. population. One major program is the NationalHealth Examination Survey, in which extensive exam-
a Centers for Disease Control.bDivislon of Health Examination Statistics-
inations of a sample of the U.S. population are con-ducted, using mobile examination centers.
Between 1959 and 1970, three National HealthExamination Survey programs, or cycles, were con-ducted; each one airned at a specific segment of theU.S. civilian noninstitutionalized population. Cycle I(1959-62) was directed at the 18-79-year age group,with a focus on certain clmonic diseases. Cycles II andIII (1963-65 and 1966-70) were concerned with chil-dren ages 6-11 years and youths ages 12-17 years,respectively. These two pro~ams studied growth anddevelopment by using selected tests and instrumentsand screened the target populations for such condi-tions as heart disease, ear-nose-throat conditions, andneuromuscular abnormalities. Descriptionsl-3 andfindings from the three programs have been publishedby the National Center for Health Statistics.
In 1969, the Department of Health and HumanServices (then known as the Department of Health,Education, and Welfare) established a continuing na-tional surveillance system to measure the nutritionalstatus of the U.S. population and to monitor changesin this status. The task of developing the program wasassigned to the National Center for Health Statistics.Consequently, the National Health Examination Sur-vey was expanded into the first National Health andNutrition Examination Survey and was redesigned tomeasure aspects of the health and nutritional statusof the U.S. population.
As in the three earlier programs, the first NationalHealth and Nutrition Examination Survey used spe-cially equipped mobile examination centers. Thecenters served as standardized environments in whichteams of specially trained medical and technical per-sonnel conducted the examinations. Three sets ofthree trailers were constructed as mobile examinationcenters. They were drawn by detachable truck trac-tors when moving from one sample location toanother. At each examination site, the three trailerswere set up side by side and were connected by en-closed passageways to form the mobile examinationcenter.
1

The field staff consisted of three elements. Thefirst was the team from the U.S. Bureau of the Census,usually consisting of 8-16 interviewers and a super-visor. The Census personnel administered householdquestionnaires to gather demographic information,and they also administered medical history question-naires used during the final phase of the survey. Thesecond element consisted of administrative personnel:field operation managers, their assistants, and spe-cially trained health interviewers employed early inthe survey to administer health history questionnairesand to make examination appointments. These inter-viewers later augmented the efforts of the Census in-terviewers who became responsible for those tasks.The third element was the examining staff that oper-ated within the mobile examination center. Thisgroup included a physician, a nurse, a dermatologist,an ophthalmologist, a dentist, two dietary inter-viewers, two health technicians, one laboratory tech-nician, and a receptionist-coordinator. Further detailsregarding the mobile examination center and the fieldstaff have been published.4-8
The findings in this report are derived from a setof nationwide probability samples that totaled ap-proximately 32,000 people ages 1-74 years from thecivilian noninstitutionalized population of the coter-minous United States. The survey began in April1971, and the nutritional component was completedin June 1974. The sample was selected so that certainpopulation groups thought to be at high risk of mal-nutrition (persons with low incomes, preschool chil-dren, women of childbearing age, and the elderly)were oversampled at predetermined rates. Although amajor emphasis of the survey was placed on nutrition,a subsample of persons ages 25-74 years received amore detailed health examination. After the nutritionsurvey was completed, the detailed examination givento adults was continued through October 1975, Thisextension of the survey is referred to as the augmen-tation portion.
Examinations were conducted in 65 diffwentlocations (referred to as “stands”) across the UnitedStates during the nutrition phase of the surwy, and inthe augmentation phase there were an addition~al 35stands. The differential leukocyte count findings inthis report are derived from the detailed examinationof adults in the 25-74-year age group, and the whiteblood cell count findings are based on persons whoreceived the nutrition examination. Out of 28,043persons selected for the nutrition examination sam-ple, 27,753 were interviewed, and 20,749 were ex-amined, yielding a net response rate of nearly 75percent. For the detailed examination sample, aninitial sample of 9,881 persons, selected during boththe nutrition and augmentation phases, resulted in9,742 intemiews and 6,913 examinations, yielding aresponse rate of 71 percent. A more detailed descrip-tion of the sample design and estimation proceduresis in appendix I.
Information was obtained by means of a house-hold interview; a general medical history; a 24-hourdietary recall interview; a food frequency interview;a food program questionnaire; a general medicalexamination; dental, dermatological, and ophthal-mological examinations; anthropometric measure-ment; hand-wrist X-rays (ages 1-17 years only); and24 hematological, blood chemistry, and urologicallaboratory determinations.
Also, data were gathered on the detailed examina-tion sample of adults by the following methods: asupplemental medical history questionnaire; supple-mental questionnaires concerning arthritis and respi-rat ory and cardiovascular conditions (when ap plica-ble); a health care needs questionnaire; a generalwell-being questionnaire; an extended medical exami-nation; X-rays of the chest, hip, and knee joints; andaudiometry, electrocardiography, goniometry, spi-rometry, pulmonary diffusion, and tuberculin tests,along with additional laboratory determinations,including the differential leukocyte count.
2

Source of data
phocytosis is an essential criterion necessary toBackground
This report presents normative data for whiteblood cell (WBC) counts and differential leukocytecounts, based on findings from NHANES I. Thesefindings will be compared in a future publication,which will present similar data from the secondNational Health and Nutrition Examination Survey(NHANES II).
The total WBC count includes several cell types;various physiological and pathological processesaffect specific types. The WBC and differential countsperhaps provide more information in less time at lesscost than any other laboratory test. The test resultsmay guide the ordering of subsequent analyses, thusavoiding needless and often costly tests. While theWBC count has limited vulue in screening ambulatorypatients in terms of sensitivity and specificity and haslimited predictive value, the test is valuable in detect-ing acute disorders such m appendicitis or for follow-ing the course of an acute disease process. When com-bined with patient histories and examinations, WBCand differential leukocyte counts can add valuablesupporting evidence for the diagnoses of numerousdiseases.
Certain rare hereditary diseases, such as Alder’sanomaly, May-Hegglin anomaly, and Chediak-Higashidisease, have characteristic white blood cell abnormal-ities. A more common finding of increased neutroph%with a shift toward less mature forms is consistentwith acute bacterial infections, toxemia of pregnancy,and certain myeloprolifcrative disorders. Increasednuclear lobulation of the segmented neutrophils withmacrocytosis is indicative of megaloblastic anemia,whereas hypolobulation is indicative of the Pelger-HuEt anomaly. Increased numbers of eosinophils arefound in hypersensitivity states and in parasitemiawith visceral involvement. Monitoring the eosinophilcount guides adrenocortiml steroid therapy in asthma.Lymphocytosis with atypical lymphocytes is found inchildren, especially those with tial diseases withaccompanying exanthemata. Absolute atypical lym-
~onfm the diagnosis of infectious mononucleosis.Marked elevated WBC counts with increased lym-phocytes and smudge cells in middle-aged and olderpersons is highly suggestive of chronic lymphocyticleukemia.
Procedures
Blood was drawn from exarninees by venipunctureusing evacuated tubes. h ethylene diaminetetra-acidic acid-containing (EDTA) sample (1.25 mg/ml)was used for the hematologjcal laboratory determina-tions. Samples were collected by fmgerstick fromthose persons, primarily children ages 1-3 yearn, onwhom venipunctures were unsuccessful. Two peri-pheral blood smears, two white blood cell-hemoglobindilutions, and two hematocrit tubes were collectedfrom succeeding drops of blood.
White blood cell counts were determined induplicate in the mobile examination center’s labora-tories on the Coulter Fn. The peripheral blood slideswere stained and sent to the Hematology Divisionof the Centers for Disease Control for differentialleukocyte counts. Further description of the methodsare in appendix III.
Data base
Of the 6,913 adults in the detailed examinationsample, a differential leukocyte count was performedon 5,854 slides, and the WBC count was consideredsatisfactory for 6,273 persons. If either the WBC ordifferential leukocyte count was missing for anexamined person, then that person was excludedfrom the analysis, leaving 5,491 persons as the basisfor all differential leukocyte counts in this report.Possible bias due to missing information is discussedin appendix I.
Since WBC counts were also available for personsexamined in the nutrition examination sample ofNHANES I, these data were included in this report.
3

‘This means that the WBC findings presented in thisstudy are based on more than 18,000 sample persons,including those under 25 years of age, instead ofbeing based only on the 6,273 adults from thedetailed examination sample. However, a differentialleukocyte count was not done on nutrition examina-tion sample persons unless they also were in thedetailed examination sample. Figure 1 demonstratesthe expected similarity of the results of the WBC
counts for persons in the detailed examination sampleand in the nutrition examination sample.
For the black population in particular, the use ofthe larger nutrition sample has the effect of raisingthe number of persons for the WBC estimates by afactor of 5 (from about 800 to approximately 4,CIOO),thus increasing the reliability of the estimates forthis segment of the population.
—
-=-= Male, nutrition examination semple
_ = _ Maler detailed examination sample
. . ● . . . . . Female, nutrition examination sample
9 — — Female, detailed examination sample
14
8 — “.>●> .. 9....●m\ ●. . . . . .
“m>. ●m...9”””mm ~~fl
J . ..*~dti
m.\\4d4@
o 7 —
xIn=~
;&Ij
f
z
5 —
oI 1 I I I I I
10 20 30 40 50 60 70
Age in years
SOURCE: First National Health and Nutrition Examination Survey nutrition examination sample, 1971-74; detailed examinationsample, 1971-75.
—
Figure 1. Estimated mean white blood cell count by sex, age, and examination sample: United States, 1971-75

The white blood cell (WBC) and differential leu-kocyte count data from the nutrition examinationsample (197 1-74) and the detailed examination sam-ple (197 1-75) are presented in tables 1-11. Table Ahighlights findings for the overall target population.The data have been weighted to represent the U.S.civilian noninstitutionalized population in terms ofage, sex, and race. The classification of race was doneby observation; the interviewer classified exarnineesas “black, “ “white.” or “other.” A separate statisticalanalysis has not been presented for people of “other”races in this report because they were insufficientlyrepresented in the sample. The data have been in-cluded under the designation “white” (see appen-dix II for definition).
White blood cell count
There are differences in the mean WBC count be-tween racial groups, between sexes, and among age
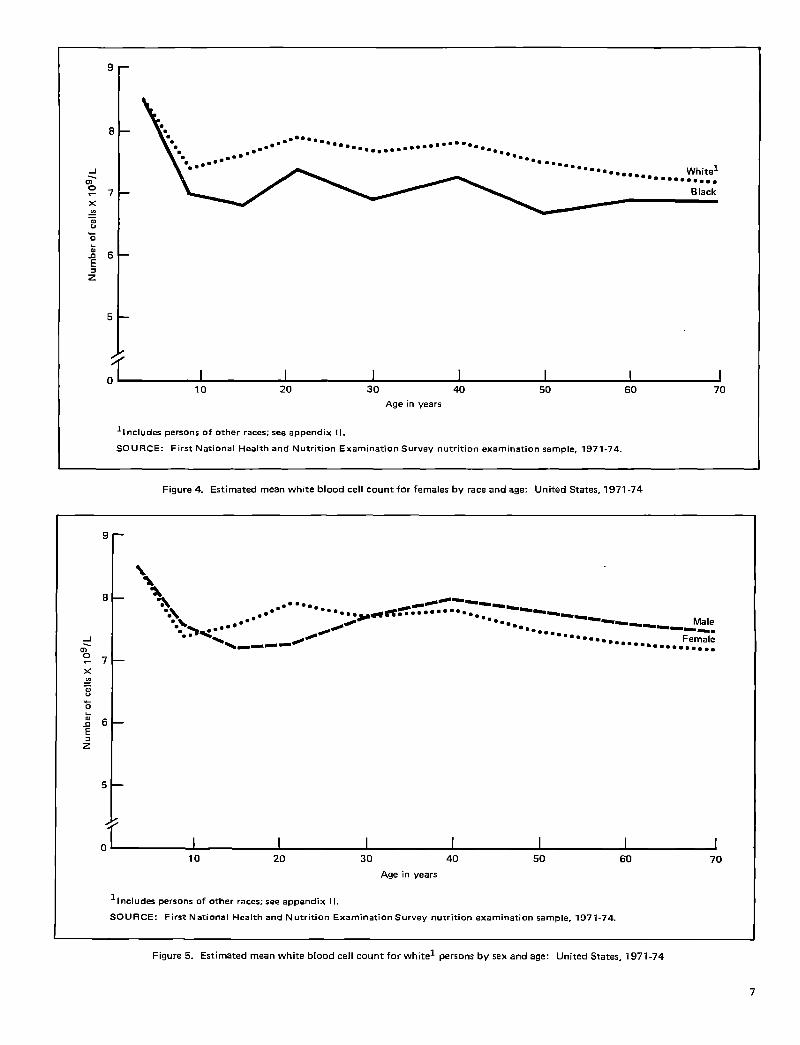
groups within race-sex groups (table 1). The whitepopulation was found to have higher WBC countsthan the black population. This was observed in bothsexes at all ages (figure 2). The WBC counts for whitemales were significantly higher than were counts forblack males in all age groups except for those ages12-17 and 18-24 years (figure 3). Counts for whitefemales were significantly higher than were counts forblack females for those ages 12-17, 25-34, and 45-54years (figure 4). When compared by sex, 12-24-year-old white females had counts that were significantlyhigher than were those for white males of the sameage. Only at ages 65-74 years did white males havesignificantly higher counts than white females had(figure 5). Counts for black females were signifi-cantly higher than were those for black males only atages 55-64 years (figure 6).
Table 1 shows that children of all races whowere under 6 years old had a higher WBC count thanolder persons had. The mean WBC count for the
Table A, Estimated mean number and mean percent of Ieukmytes by type of leukocyte, according to age: United States, 1971-75
TotalType of leukocyte
A.qe white bloodTotalcell count Lymphocytes Monocytes Eosinophils
neutrophik T
Number of cells X 109/L
l-5years . . . . . . . . . . . . . . . . . . . . . . . . . . . . . . . . . . . . . . . . . 8.49 . . .
6-n years, . . . . . . . . . . . . . . . . . . . . . . . . . . . . . . . . . . . . . . .
. . . . . . ..-
7,42 .-.
12-17 years . . . . . . . . . . . . . . . . . . . . . . . . . . . . . . . . . . . . . . .
. . . --- ---
7.27 . . .
l&24 years . . . . . . . . . . . . . . . . . . . . . . . . . . . . . . . . . . . . . . .
. . . . . . . . .
7.60 . . .
25-44 years . . . . . . . . . . . . . . . . . . . . . . . . . . . . . . . . . . . . . . .
. . . . . . ---
7.73 4.53 2.74 0.26 0.2045-74 years . . . . . . . . . . . . . . . . . . . . . . . . . . . . . . . . . . . . . . . 7.50 4.40 2.64 0.26 0.19
Percent of 100 cells
l-5years . . . . . . . . . . . . . . . . . . . . . . . . . . . . . . . . . . . . . . . . . . . .6-n years . . . . . . . . . . . . . . . . . . . . . . . . . . . . . . . . . . . . . . . . . . .
. . . . . . . . . . . .-..
12-17 years . . . . . . . . . . . . . . . . . . . . . . . . . . . . . . . . . . . . . . .-.. .-. ---
. . . ..-18-24 years . . . . . . . . . . . . . . . . . . . . . . . . . . . . . . . . . . . . . . . . . .
. . . . . . . . .. . .
25-44 years . . . . . . . . . . . . . . . . . . . . . . . . . . . . . . . . . . . . . . . . . .. . . . . . . . .
58.6 35.4 3.4 2.646-74 years . . . . . . . . . . . . . . . . . . . . . . . . . . . . . . . . . . . . . . . . . . 58.7 35.2 3.5 2.5
I Neutrophil statisticscombine bandad and segmented forms.
SOURCE: First National Health and Nutrition Examination Survey. Total while blood cell count data are from the nutrition examination sample,1971-74, and differential leukocyte data are from the detailed examination sample, 1971-75.
5

9 —
\
8 —
__.__.@”--” -------- --- Wh itel
J -9-- ----m;.-7 —x Blackgzu
z:
6 —f
z.
5 —
// Y
o- 1 I I I I I I10 20 30 40 50 60 70
Age in years
1 I ncl~,je~ ~erSOnS of other races; see appendix 11.
SOURCE: First National Health and Nutrition Examination Survey nutrition examination sample, 1971-74.
Figure 2. Estimated mean white blood cell count by race and age: United States, 1971-74
9-
\\\
8-\\
~------
*\#ti/
---
\
/@ --~ Whitel
%--- -----
J -\\----@@“@4
m.?7x ‘\. .+ /-\.\ */*~ -—--”.
e=$ \ Black
z\
‘6 — \f .0”
2
5 —
/
o I I I I 1 I [10 20 30 40 50 60 7CI
Age in years
llnclud~ ~arsons of othar races; see appendix 11.
SOURCE: First National Health and Nutrition Examination Survey nutrition examination sample, 1971-74.
Figure 3. Estimated mean white blood cell count for males by race and age: United States, 1971-74
6
9 —
8 —
..............● mJm;-7 — Black
x.=wu%S
6 —f
5
5
// /
o I I I 1 I I I10 20 30 40 50 60 70
Age in Vears
llnclud=per~on~af other races; see aPPendix ‘1.
SOURCE: First NaIional Health and Nutrition Examination SurveV nutrition examination sample, 1971-74.
Figure4. Estimated mean white blood celIcount for females bymce and age: United States, 1971-74
9 -
\
a
8 — %% .* ...*“.\\
d@---.*.- ●“”-..
..9//
*se===. = ● ““”=... ------... ---
●.><; ““●.*. Male
// ●. . . .J
-------●=...
m; -----~Female●= . . 9 . . . . . . . . . . . . . .
r7 —
x.=EziiD6E
2
5 —
./ ,
0 I I I I I
10 20 30 40 50 60 70
Age in years
1, “clude~ ~er~ons of other races; see appendix 11.
SOURCE: First National Health and Nutrition Examination Survey nuwition examination sample, 1971-74.
Figure 5. Estimated mean white blood cell count for whitel persons by sex and age: United States, 1971-74
7

Female
~
5
0 I I I I I I I
10 20 30 40 50 60 70
Age in years
SOURCE: First National Health and Nutrition Examination Survey nutrition examination sample, 1971-74.
Figure 6. Estimated mean white blood cell count for black persons by sex and age: United States, 1971-74
white population appears to decrease with age forboth males and females, but the decrease is not sta-tistically significant between each of the age groupsemployed in this study, This decrease in the meanWBC count is supported by previous studies.g-ll Themean WBC count for males was significantly lowerfor those ages 65-74 years than was the mean WBCcount for those ages 25-34 years. For white females,the mean WBC count for those ages 65-74 yearswas significantly lower than was the mean WBC countfor both the 25-34- and the 35-44-year age groups.
Table 1 also shows that the black population hasa significantly lower mean WBC count than theirwhite counterparts have, which Broun also found. 12Black males appear to have a lower observed meanWBC count than black females have, and the differ-ence is greatest and statistically significant for the55-64-year age group.
Table B shows the percent distribution of theU.S. population whose WBC counts are in the ex-tremes of the WBC distribution and the percent ofthe population whose WBC counts fall into the broadrange of 5.0-11.4 X 10g/ L cells. Tables 2-5 show per-cent distributions of WBC counts for males andfemales by race and age.
Smoking and the white blood cell count
Smokers were found to have significantly elevatedWBC counts for both races and both sexes (table C).
8
Table B. Parcent distribution of the U.S. population by mean nurnkr
of white blood cells, according to age: United States, 1971-74
Age
A/umber of cells X 10g/L1-5 6-17 18-44 45-74
years years years Vews
Percent distribution
2.0-13 .0 and over . . . . . . 100.0 100,0 100.0 100.0
2.0-3 .9 . . . . . . . . . . . . . . . . . 0.8 1.1 0.8 II .34.0-4 .4 . . . . . . . . . . . . . . . 0.9 3.1 1,7 11.94.5-4 .9 . . . . . . . . . . . . . . . . . 2.0 4.6 3.6 3.7
5.0-11 .4 . . . . . . . !........ 84,0 87.6 89,0 89.5
11.5-11 .9 . . . . . . . . . . . . . 2.8 1.2 1.5 (1.9
12.0-12 .9 . . . . . . . . . . . . . . . 4.2 1.2 1.5 11.6
13. Oand over . . . . . . . . . . . . 5.2 1.2 2.0 11.2
SOURCE: First National Health and Nutrition Examination Surveynutrition examination sample, 1971-74.
Present smokers averaged 1.0 X 10g/ L more whitecells than former smokers or persons who had neversmoked averaged (see appendix II for definitions ofthese terms). Fisch and Freedman and Helmanl 3-14have shown that the WBC count increases progi-es-sively with ticreasing intensity of exposure to t obaiccosmoke.
Differential leukocyte count
The differential leukocyte count data obtainedduring NHANES I are presented in tables 16-9.

~m
C9m
mm
qqmm
mm.
..
..
.
Lno
-m0-o-a
mm
mm
mm
Lqlq
mm
mm.
..
.
mC
Dm
oo-q
*eel
-.m
F-
m0501
..
..
..
..
..
..
..
.
u-lLoo
Lni-m
0.0.
mm
T-
mm
mZ
.zzr-
mm
mr-en
m-.
m.
m-o
mm
mu-l
mm
..
..
..
..
..
..
..
.
*O*
mm
m.--
r-m0
.-mm
fsN
mq-.
m-m
mIn
mm
m“
Lo
..
..
..
..
..
..
..
..
..
.
..
..
..
..
..
..
..
..
..
..
..
..
..
..
..
..
..
..
..
..
..
..
..
..
..
..
..
..
..
..
..
..
..
..
..
..
..
..
..
..
..
..
.
..
..
..
..
..
..
..
..
.
..
..
..
,...
..
..
..
..
..
..
..
..
..
..
..
..
.
..
..
..
..
A:::
~..-m:::
..
i:::s:::
..
..
..
9

Differential leukocyte count statistics are based onreadings of more than 5,400 peripheral blood smearsprepared from blood drawn from adults who re-ceived the detailed examination.
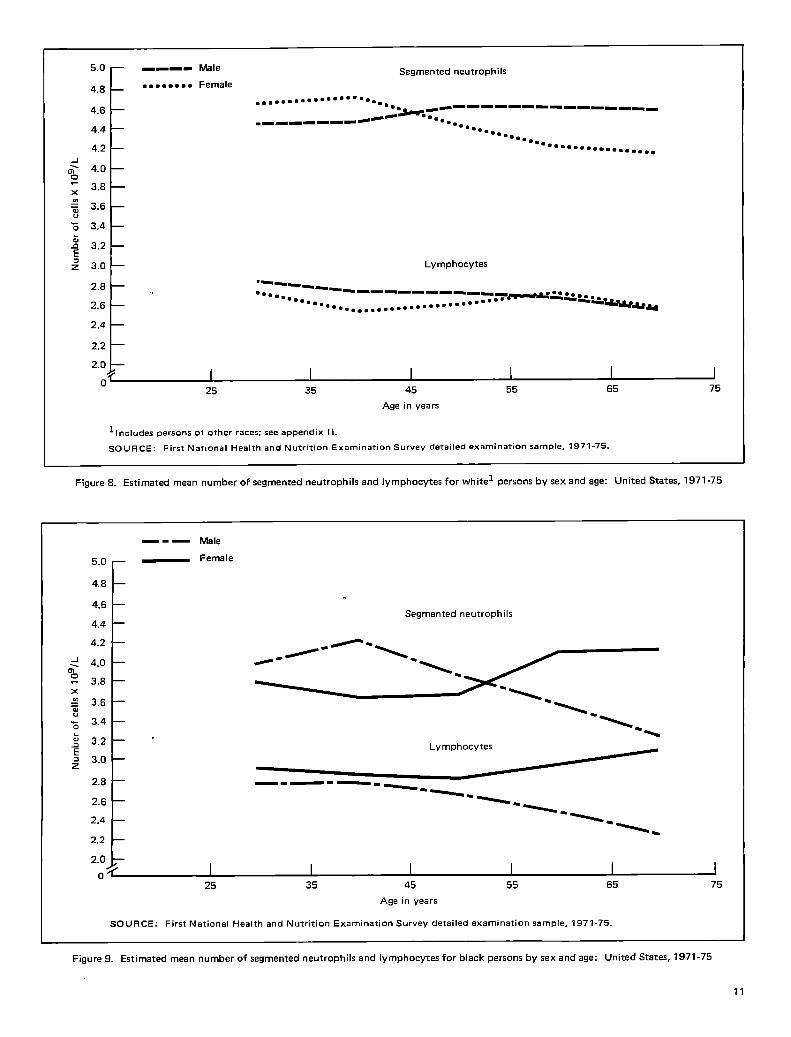
Two differences should be noted. First, there wasa difference in mean values with respect to both abso-lute numbers and percents for segmented neutrophilsbetween races, with the white population having sig-nificantly higher values. The black population, how-ever, had higher lymphocyte numeric values (table 8)and a significantly higher mean percent of lympho-cytes (figure 7). Second, a difference (in terms of sex)was observed with changes in age. Before about age50, white females have a higher segmented neutrophilmean and a lower lymphocyte mean than white malesof comparable age. After age 50, the mean numberof segmented neutrophils decreases for females, butthe mean for males remains relatively constant withthe increase in age. White females ages 25-34 yearshave a significantly higher mean number of segmentedneutrophils than white females ages 65-74 years(figure 8).
For the black population, the reverse of the aboverelationship for the white population is seen. Males
have a higher number of segmented neutrophils thanhave females up to about age 50, after which themean for females becomes higher and the mean formales decreases with age (figure 9). The sex differ-ence in the number of segmented neutrophils for eachgroup is not significant for either race. In the 45-54-,55-64-, and 65-74-year age groups, white males h;aveamean number of segmented neutrophils that is signifi-cantly higher than the numbers for their black coun-terparts. White females have a significantly highermean number of segmented neutrophils for the agegroups 25-34 years, 35-44 years, and 45-54 yearsthan have black females. This relationship continuesfor the older age groups, but the differences are notstatistically significant, Tables 10 and 11 show sum-mary information about the distribution of seg-mented neutrophils and lymphocytes in the adultpopulation, and figures 10 and 11 graphically sum-marize this kformation.
Discussion
Much has been published over the decades aboutthe variability of a single 100-white-cell differential
---- Whitel male
● 9= ● D--D Whitel female
— -— Black male
65 — _ Black female
Segmented neutrophils
60 — . ...””. ..*m . . . .. a..
●. . . .. . . . . . --------------
--tie 0-- . . . .
..---- m9-““= ” - =........ . . . . . . . . . . .
co 55 — ,. —-—-~= -~-~- ~-—-~. -wc1
o0
; 50 —
E8&n 45 Lymphocytes
c
z
40 — ~.~”- —- —-— .— -_—-—-
--- ..=”” =~. o.. ..m .- m..--- -9-.- m...
. . ..O --- . ..*..
35 — ●. . . .●. . . . .mm . . . . . ..”~ ------- --------
/ 5/
o I I I I I I25 35 45 55 65 75
Age in years
11 “c,ude~ ~er~ons of other races; see appendix 11.
SOURCE: First National Health and Nutrition Examination Survey detailed examination sample, 1971-75.
Figure 7. Estimated mean percent of segmented neutrophils and lymphocytes by race and age: United States, 1971-75
10
5.0
E
---- Male Segmented neutrophils
4.8 . . . ..D. m Female
1.........OO. = •.~.. ●. .
4.6 -:-.~m ------------------------- ...
4.4 ●. . . .●=...
●..*4.2 “*- * = . . . . . . . . . ...
Jm; 4.0
; 3,8
+ 3.6vz 3.4
$ 3.2
z 3.0
2,8
2.6F-
Lymphocytes
“----- ------- -------=*. O●m... . . ~“=z~. .
●.*. m. . . . . . ...””””.””...”””-wu~
2,41-
2.2t
q- 10
25 35 45 55 65 75
Age in years
lln=ludeS perSonsot other races; See aPPendix II.
sOURCE: First National Health and Nutrition Examination Survey detail ed examination sample, 1971-75.
Figure8. Estimatd mean number ofsagmented neutrophils andlymphocytes forwhitelpersons bysex and age: Unitad States, 1971-75
5.0 —
4.8
4.6
4.4
4.2
4.0
3,8
3.6
3.4 —
3.2 —
3.0 —
2.8 —
2.6 —
2.4
2.2
—-— Male
— Female
.
Segmented neutrophils
4-
Lymphocytes
—“—-—-~.
~-~.\.
\--.
2.o~
o~ I I I
25 35 45 55 65 75
Age in years
SOURCE: First National Health and Nutrition Examination Survey detailed examination sample, l97l-75.
Figure9. Estimated mean number ofsegmented neutrophils andlymphocytes for black persons bysex and age: United States, 1971-75
11

20
15
10
5
L-II — —
—
—
—
—
1
o.5- 1.0- 1,5- 2.0- 2.5- 3.0- 3.5- 4.0- 4.5- 5.0- 5.5- 6.0- 6.5- 7.0- 7.5- 8.0- 8.5- 9.0- 9.5- 10.00.9 1,4 1.9 2.4 2.9 3.4 3.9 4.4 4.9 5,4 5,9 6.4 6.9 7.4 7.9 8.4 8.9 9.4 9.9 and over
Number of cells X 10g/L
SOURCE: First National Health and Nutrition Examination Survey detailed examination sample, 1971-75.
Figure lO. Estimated yrcentdistribution of the U. S.populatlon ages 25-74 years bymeannumber ofsegmented neutrophils: United States, l!)71-75
25r
0.4 0.9 1.4 1.9 2.4 2,9 3.4 3.9 4.4 4.9 5.4 5.9 6.4 6.9
Number ofcells X 109/L
SOURCE: First National Health and Nutrition Examination Survey detailed examination sample, 1971-75.
Figure 1.1. Estimated parcent distribution of the U.S. population ages 25-74 years bymean number of lymphocytes: United States, 1971-75
1:2

count. Many factors influence the observed WBCcount.1 5 Statland and Winkel published a study onthe physiological variability y of leukocytes in healthysubjects.1 G Goldner and Mannl T published 95-percentconfidence curves, and Rumke and coworkers 8 pub-lished an article that explained the required differ-ence in percents that must be found in counts of 100or 200 cells for a change in counts to be regarded assignificant at a 5 .O-percent or a 2.5-percent confi-dence level. The present study, however, presents theresults of approximately 5,500 single 100-white-celldifferential counts.
In comparing the mean values with those foundin the literature (Bain and England,l g Cecil andLoeb,20 Dacie and Lewis,21 Documents Geigi,zgGradwohl,23 Miale,24 Wintrobe,25 and Zacharskiet al.2G), the following should be noted: In theNHANES I study, fewer juvenile neutrophils (bandforms) have been found, and the mean value formonocytes is lower than the mean value generally in-dicated in the literature. The lower monocyte valuesmay be attributable to technical difficulties, as notedby Dacie,zT such as excessively thick preparations orsmears that were not margin free.
Because five different technologists were involved
in performing differential leukocyte counts duringthe course of the survey, the mean values each ob-tained have been calculated for the different celltypes. Table D shows that one technologist (num-ber 4) counted more band forms, and another (num-ber 3) obtained appreciably higher monocyte countsthan any of the others. On the whole, however, meanvalues of all cell types obtained by all five technolo-gists compared favorably. Promyelocytes, myelocytes,and metamyelocytes were reported in 2, 1, and 1smears respectively and were excluded from analysis.
A single-channel electronic cell counter that isproperly calibrated and mainttied is recognized asthe best available method for routine cell counting.28Differences were minimal because only three instru-ments, operated by teams of two technicians, wereemployed in the mobile examination centers, AU in-struments were monitored concurrently with thesame lots of commercial control material.
White blood cell counts and differential leukocytecounts have also been performed on examined per-sons in the second National Health and Nutrition Ex-amination Survey (NHANES II), 1976-80. When datafrom NHANES II are analyzed, differential leukocytecount findings from the two surveys will be compared.
Table D. Number of smears and percent distribution by type of leukocyte, according to technologist number
Type of leukocyte
Technologist number Numberof smears Total Segmented Band
IaukocytesLymphocytes Monocytes Eosinophits
neutrophils neutrophifsBasophils
Percent distribution
1 826 100.0 50.972::::::::::::::::::::;
0.14 36.09 2.53 2.182,466
0.29100.0 57.95
30.32 37.47 2.19
9732.05
100.00.32
. . . . . . . . . . . . . . . . . . . . . 58.804
0.16 32.57 6.08 2.04794 100.0
0.55. . . . . . . . . . . . . . . . . . . . . 56.80 0.48 36.95 3.49 2.19
5 7950.32
. . . . . . . . . . . . . . . . . . . . . 100.0 59.04 0.06 36.28 2.91 1.55 0.42
SOURCE: First National Health and Nutrition Examination Survey detailed examination sample, 1971-75.
000
13

References
lNational Center for Health Statistics: Plan and initial pro-gram of the Health Examination Survey. Vital and Healthfi’tati~tics, PHS Pub. No. 1000-Series l-No, 4. Public HealthService. Washington. U.S. Government Printing Office, July1965.
2National Center for Health Statistics: Plan, operation, andresponse results of a program of children’s examinations. Vitaland Health Statistics. Series l-No. 5. DHEW Pub. No. (HSM)73-1251. Health Services and Mental Health Administration.Washington. U.S. Government Printing Office, Oct. 1967.
3National Center for Health Statistics: Plan and operation ofa Health Examination Survey of U.S. youths, 12-17 years ofage. Vital and Health Statistics. PHS No. 1000-Series l-No. 8.Public Health Service. Washington. U.S. Government PrintingOffice, Sept. 1969,
4National Center for Health Statistics: Plan and operation ofthe Health and Nutrition Examination Survey, United States,1971-1973. Vital and Health Statistics. Series 1-Nos. 10a and10b. DHEW Pub. No. (HSM) 73-1310. Health Services andMental Health Administration. Washington. U.S. GovernmentPrinting Office, Feb. 1973.
5National Center for Health Statistics: Plan and operation ofthe HANES I Augmentation Survey of adults 25-74 years:United States, 1974-1975, by A. Engle, R. Murphy, K. Maurer,and E. Collins. Vital and Health Statistics. Series 1-No. 14.DHEW Pub. No. (PHS) 78-1314, Public Health Service. Wash-ington. U.S. Government Printing Office, June 1978.
6 National Center for Health Statistics: HANES, examinationstaff procedures manual for the Health and Nutrition Exami-nation Survey, 1971-1973. NCHS Instruction Manual, Part15a. Health Services and Mental Health Administration. Wash-ington. U.S. Government Printing Office, June 1972.
7National Center for Health Statistics: Field staff operationsmanual. JVCHS Instruction Manual, Part 15b. Health Servicesand Mental Health Administration. Washington. U.S. Govern-ment Printing Office, Sept. 1972.
‘National Center for Health Statistics: Examination staff pro-cedures manual for the Health Examination Survey, 1974-1975. NCHS Instruction Manual, Part 15c. Health ResourcesAdministration. Washington. U.S. Government Printing Office,Apr. 1975.
‘Allan R. N., and Alexander, M. K.: A sex difference in leuco-cyte c&nt. J. Clin. Pathol. 21 (6): 691-694, Nov. 1968.
l°Cruickshank, J. T., and Alexander, M. K.: The effect of age,sex, parity, hemoglobin level and oral contraceptive prepara-tions on the normal Ieucocyte count. Br. J. Haematol. 18(5):541-549, May 1970.
llTibblin E. et al.: Hemoglobin concentrations and periph-eral bloo~ cell counts in women. Stand. J. Haernatol. 22!(1):5-16, Jan. 1979.
12Brownj G. O., Jr., and Herbig, M. S.: Leukopenia in Negroes.N. Engl. J. Med. 275(25): 1410-1413, Dec. 1966.
13Fisch, I. R., and Freedman, S, H.: Smoking, oral contracep-tives, and obesity effects on white blood cell count. J/i MA.234(5): 500-506, NOV. 1975.
14Helman, N, and Rubenstein, L. S.: The effect of age, sex,
and smoking on erythrocytes and leukocytes. Am. J. Clin.Pathol. 63(l): 35-44, Jan, 1975.
15Panek, E,, and Steinmetz, J.: The effect of sex, deviationfrom ideal weight and sampling time on blood constituents inpresumably healthy subjects. Clin, Chim. Acts. 92(3): 343-351,Mar. 1979.
16Statland, B. E., and Winkel, P.: Physiological variability ofleukocytes in healthy subjects, in J. A. Koepke, cd., Differen-tial Leukocyte Counting. Chicago. College of American Pathol-ogists, 1979. pp. 23-27.
17Goldnerj F. M,, and Mann, W. N.: Statistical error of differ-ential white count. Guy’s Hospital Reports. 88( 1): 54-65, Jan.1938.
18Riimke, C. L. et al.: Normal values and least significant dif-ferences for differential leukocyte counts. J. Chron, Dis. 28(11/12): 661-668, Dec. 1975.
19Bain, B. J., and England, J. M.: Normal haematologicalvalues: Sex difference in neutrophil count. Br. Med. J. 1(S95 3):306-309, Feb. 1975.
20Cecil, R, L., and Loeb, R, F.: Textbook of Medicine, 13thed. Philadelphia. W. B. Saunders Co., 1971.
21Dacie, J. V., and Lewis, S. M.: Practical Hematology, 4th ed.London. Churchill Livingstone, 1970.
22Documenta Geigi: Wissenschaftliche Tabellen, 7th ed. Basel.Ciba-Geigi, 1968,
23Gradwolil: Clinical Laboratory Methods and Diagnosis, 7thed. St. Louis. C. V. Mosby Co,, 1970.
24Miale, J. B.: Laboratory Medicine: Hematology, 4th ed, St.Louis. C. V. Mosby Co., 1972,
25Wintrobe M, M.: Clinical Hematology, 6th ed. Philadelphia.Lea and Fe;iger, 1967.
26Zacharski, L. R. et al.: Leukocyte counts in healthy adults.Am. J. Clin. Pathol. 45(2): 148-150, Aug. 1971.27Dacie, J. v-: practical Hematology, 1st ed. London. J. & A.
Churchill Ltd., 1950.
14

28Standing Committee on Blood Counting, in Proceedings ofAdvances in Haeinatology Jfethods, Calibration and Control.Berlin. International Committee for Standardization in Hemat-ology, 1979.
29National Center for Health Statistics: The HANES StudyFinal Report, by the Institute for Survey Research. HSM-1 10-73-376, Health Services and ,Mental Health Administration.Philadelphia. Temple University, Apr. 1975.
30Department of Health, Education, and Welfare: A Compan”-son and Anal.vsis of Examined and Unexamined Persons onJfedical History Characteristics for the First Round of theHealth and Nutrition E.rumination Study, by Westat, Inc.HSM-I 10-73-371. Health Services and Mental Health Adminis-tration. Rockville, Md. Division of Health Examination Statis-tics, Jan. 1974.
3lNational Center for Health Statistics: Factors related toresponse in a health examination survey: United States, 1960-
1962. Vital and Health Statistics. Series 2-No. 36. DHEW Pub.No. (HSM) 73-1263. Health Services and Mental Health Ad-mi.nist ration. Washington. U.S. Government Printing Office,Aug. 1969.
32Wesley L. Schaible, Ph. D.: Memorandum to Arthur J.McDowell, Director, Division of Health Examination Statis-tics. Unpublished document.
331nstruction Manual for the Coulter Counter Model Fn.Hialeah, Fla. Coulter Electronics, Dec. 1970.
341nstruction Manual for the Coulter Diluter II. Pub. No.4201031. Hialeah, Fla. Coulter Electronics, Apr. 1972.
350perating Manual Hems-Tek Slide Stainer Hems-Tek Stain-Pak. Elkhart, Ind. Miles Laboratories, Inc., July 1967.
36Romanowsky, D.: Zur frage der parasitologic und therapieder malaria. St. Petersb. Med. Wschr. 16:297 and 307, 1891.
15
List of detailed tables
1. Number of examined persons, estimated mean white blood
cell count, and standard error of the mean by examination
sample, race, sex, and age: United States, 1971-75, . .
:2. Percent distribution of white males by estimated number of
white blood cells, according to age: United States, 1971-74. .
3. Percent distribution of white females by estimated number of
white blood cells, according to age: United States, 1971-74. .
4. Percent distribution of black males by estimated number of
white blood cells, according to age: United States, 1971-74.
!5. Percent distribution of black females by estimated number of
white blood cells, according to age: United States, 1971-74.
6. Estimated meen number and mean percent of leukocytes for
white persons by type of leukocyte, according to sex and
age: United States, 1971 -75, . . . . . . . . . . . . . . . . . .
7.
17
8.
18
18 9.
1910.
19
11.
20
Estimated standard error of mean number and mean percent
of Ieu kocvtes for white persons by tvpe of Ieukmrt% =%
andage: United States, 1971-75 . . . . . . . . t . . . . . 21
Estimated maan number and mean percent of Ieu kocytes for
black persons by type of leukocyte, according to sex and age:
United States, 1971 -75 . . . . . . . . . . . . . . . . . . . . . . . 22
Estimated standard error of mean number and mean percent
of Ieu kocytes for black persons by typa of leukocyte, sex,
andaga; United States, 1971-75 . . . . . . . . . . .. . 23
Number of examined persons, estimated mean number of seg
mented neutrophils, standard deviation, and selacted per.
centiles by race, sex, and age: United States, 1971-75 . . . , , 24
Number of examined persons, estimated mean number of
lymphocytes, standard deviation, and selected percentiles by
race, sex, and age: United States, 1971-75. . . . . . . . ~~ 25
‘16

Table 1. Number of examind persons, estimeted mean white blood cell count, and standard error of the mean by examination sample, race,sex, and age: United States, 1971-75
Nutr;tion examination sample Detailed examirrarion sample
White 1 Black White 1 Black
Sex and ageNumber
Number StandardNumber
Number StandardNumber
Number StandardNumber Numbar
of0 f cells
of ofStandard
error ofof
of cells error 0 f of cellsexamined
error ofexamined
of cells error of
x 109IL the mean X 1091L the meanexamined
personsX 1091L the mean
examinedpersons persons
x 1091L the meanpersons
Both saxes
l-74years . .
l-5years . . . . .
Gllvears . . . . .12-17 years . .18-24 years . .25-34 years .35-44 years . .45-54 years . .55-64 years .65-74 years . .
Male
7-74 years , . . .
l-5years . . . . . .13-l lyears . . . . .12-17 years .IB-24 years .25-34 years . . . .35-44 years .46-54 years . . . .55-64 years . . . .65-74 years . . .
Female
l-74 years . . .
l-5 years . . . .6-n years ., .,.12-17 years . . .18.24 years . . . .25-34 years . . .3544 yaars .45-54 years . .55-64 years . .65-74 years . . .
14,820
1,8351,3851,4371,6082,0501,7041,207
9502,564
6,331
95369272359162751056S457
1,210
8,489
882693714
1,0971,4231,194
639493
1.354
7.7
8.57.57.47.77.77.97.67.57.4
7.7
8.57.67.27,37.7S.o7,87.67.5
7.7
8,57.47.67.97.77,87.57.37.2
0.05
0.090.080,000.07O.OB0.110.110.090.08
0.07
0.110.090.120.110.110.200.140,130.09
0.05
0.100.130,070,090.090,090.110.110.09
3,577
612450445402403367227169502
1,460
302225219116108
76llB66
238
2,109
310225226286295291109103264
7.0
0.37.06.77.26.67.76.96.56.7
6.9
8.17.16.67,06.67,07.15,86.4
7.1
8.57.06.67.46.97.36.76.96.9
0.08 5,509
0.160.120.180.240.13 1,2650.21 9710.13 1,2840.22 1,0380.23 951
0.10 2,530
0,210.180,2B0.320.19 5500.32 4290.19 5900.28 5000.12 461
0.10 2,979
0.230.160.170.2B0.19 7150,32 5420,22 6940.28 5380,38 490
7.6
7.87.77.67.57.3
7.7
7.87.87.77.77.6
7.5
7.87.77.57.37.1
0.Q6
0.110.120.100.120.10
0,08
0.120.180.130.190.19
0.07
0.170.170.130.130.12
768
160135187133153
339
6649905876
429
9486977577
6.9
7.17.06.86.96.0
6.0
7.17.36.86.35,8
7.0
7.06.86.77.37.5
0.14
0.230.360.250.280.50
0.24
0.390.630.470.390,43
0.19
0.320.450.300.420.81
1,ncludes ~er~ons of other races; see appendix 11.
SOURCE: First National Health and Nutrition Examination Survey nutrition examination sampler 1971.74; detailed examination sampler 1971-75.
17

Table 2. Percent distribution of whitel males by estimated number of white blood calls, according to age: United States, 1971-74
Number of cells X 109/L
Age
7-5 6-11 12-17 18-24 25-34 3544 45-54 55-64 65-74years years years years years years years years years
Percent distribution
l_lnder 2.0-14.0 Andover...,.. . . . . . . . . . . . . . . . . . . . . . . 100.0 100.0 100.0 100.0 100.0 100.0 100.0 100.0 100.0
:2.0-2 .9 . . . . . . . . . . . . . . . . . . . . . . . . . . . . . . . . . . . . . . . - - - - - - - 0.3 0.1:3.0-3.9 . . . . . . . . . . . . . . . . . . . . . . . . . . . . . . . . . . . . . . . 1.2 0,5 1.1 0.7 0.3 0.4 1.3 1.3 0.94,0-4.9 , . . . . . . . . . . . . . . . . . , . . . . . . . . . . . . . . 3.2 5.9 8,5 4.8 4.5 2.9 2.4 4.5 3.7!5.0-5,9, . . . . . . . . . . . . . . . . . . . . . . . . . . . . . . . . . . . . . . 9.2 18.2 23.0 19,8 15.5 13.8 13.5 13.2 15.6(6.0.6.9 . . . . . . . . . . . . . . . . . . . . . . . . . . . . . . . . . . . . . . 17.7 21.1 18.5 19.0 18.3 22.0 22.8 17.9 20.97.0-7,9 . . . . . . . . . . . . . . . . . . . . . . . . . . . . . . . . . . . . . . . 17.3 16.3 19.7 20.7 20.7 18.1 19.3 22.1 21.38.0-8.9 . . . . . . . . . . . . . . . . . . . . . . . . . . . . . . . . . . . . . . . ‘i5.5 14.5 14.0 18.1 17.7 14.5 17.6 18.8 18.89.0-9.9 . . . . . . . . . . . . . . . . . . . . . . . . . . . . . . . . . . . . . . . 11.8 13.3 8.5 10.8 13.4 12.9 11.7 11.1 9.710.0-10.9, . . . . . . . . . . . . . . . . . . . . . . . . . . . . . . . . . . . . 7.6 5.1 2.2 2.5 4.1 7.7 5.3 5.6 4.611.0-11.9, . . . . . . . . . . . . . . . . . . . . . . . . . . . . . . . . . . . . 5.7 2.2 1.8 1.4 3.2 3.5 1.0 3.1 2.712.0-12.9 . . . . . . . . . . . . . . . . . . . . . . . . . . . . . . . . . . . . . 4.5 0.9 1.5 1.3 1.4 2.0 3.3 1.0 0.713.0-13.9 . . . . . . . . . . . . . . . . . . . . . . . . . . . . . . . . . . . . . 3,7 0.6 0.6 0.4 0.4 1.1 0.5 0.8 0.514.0 Andover . . . . . . . . . . . . . . . . . . . . . . . . . . . . . . . . . . . 2.7 1.3 0.5 0.5 0.7 1.1 1.2 0.1 0.4
llncludes persons of other races; sae appendix Il.
SOURCE: First National Health and Nutrition Examination Survey nutrition examination sampla,1971-74.
Table3. Percent distribution ofwhitel females byestimated number ofwhite blood cells, according toage: United States, 1971-74
Age
Numberofce//sX 10g/L7-5 6-11 12-17 18-24 25-34 35-44 45-54 55-64 65-74
years years years years years years years years years
Percent distribution
Under2.0-14.0and over... . . . . . . . . . . . . . . . . . . . . . . . . . 100.0 100.0 100.0 100.0 100.0 100.0 100.0 100.0 100.0
2.0-2.9 . . . . . . . . . . . . . . . . . . . . . . . . . . . . . . . . . . - - - 0.0 0.4 - - 0.0 -
3.0-3.9 . . . . . . . . . . . . . . . . . . . . . . . . . . . . . . . . . . . . . . . 0.5 0.7 0.7 0.3 0.5 0.7 0.8 1.1 0.5
4.0-4.9 . . . . . . . . . . . . . ...’.. . . . . . . . . . . . . . . . . . . . . . 2.2 6.1 5.1 3.1 5.2 5.6 5.1 5.2 7.4
5.0-5.9 . . . . . . . . . . . . . . . . . . . . . . . . . . . . . . . . . . . . . . . 9.5 17.9 10.8 11.5 13.2 12.8 16.7 17.1 19.8
6.0-6.9 . . . . . . . . . . . . . . . . . . . . . . . . . . . . . . . . . . . . . . . 13.7 22.1 26.2 19.2 21.0 18.3 23.6 24.8 22.2
7.0-7.9 . . . . . . . . . . . . . . . . . . . . . . . . . . . . . . . . . . . . . 17.3 20.2 17.9 22.7 19.1 19.1 19.6 19.8 20.6
8.0-8.9 . . . . . . . . . . . . . . . . . . . . . . . . . . . . . . . . . . . . . . . 20.9 12.6 16.5 16.4 ‘17.0 ‘17.9 13,0 15.0 15.0
9.0-9.9 . . . . . . . . . . . . . . . . . . . . . . . . . . . . . . . . . . . . . . . 13.4 10.9 14.2 12.1 12.0 13.1 9.4 9.8 8.9
10.0-10.9 . . . . . . . . . . . . . . . . . . . . . . . . . . . . . . . . . . . . . 7.9 3.9 5.1 6.2 4.7 4.9 5.9 2.5 2.5
11,0-11.9 . . . . . . . . . . . . . . . . . . . . . . . . . . . . . . . . . . . . . 6.5 3.5 1.8 4.6 3.5 3.8 2.4 2.4 1.4
12.0-12.9 . . . . . . . . . . . . . . . . . . . . . . . . . . . . . . . . . . . . . 4.1 0.8 1.6 1.3 1.7 1.5 2.4 1.1 0.9
13.0-13.9 . . . . . . . . . . . . . . . . . . . . . . . . . . . . . . . . . . . . . 2.0 0.8 0.0 1.7 0.7 1.1 1.0 1.3 0.2
14.0and over . . . . . . . . . . . . . . . . . . . . . . . . . . . . . . . . . . 2.0 0.6 0.2 0.9 1.1 1.3 0.1 - 0.6
ll”clude~parso”s Of Other races; see appendix ll.
SOURCE: First National Health and Nutrition Examination Survey nutrition examination sample, 1971-74.
18

Table4. Percent distribution of black males byestimated num&rof white blood cellsraccording to age: United States, 1971-74
Age
Number of cells X 1091L7-5 6-11 72-17 18-24 25-34 35-44 45-54 55-64 65-74
years years years years years years years years years
Under 2.0-14.0 and over . . . . . . . . . . . . . . . . . . . . . . . . . . . 100.0 100.0 100.0
2.0-2.9 . . . . . . . . . . . . . . . . . . . . . . . . . . . . . . . . . . . . . . . - - 1.63.0-3.9 . . . . . . . . . . . . . . . . . . . . . . . . . . . . . . . . . . . . . . . 0.3 1.4 4.14.04.9 . . . . . . . . . . . . . . . . . . . . . . . . . . . . . . . . . . . . . . . 4.1 14.4 17.55,0-5.9 . . . . . . . . . . . . . . . . . . . . . . . . . . . . . . . . . . . . . . . 15.5 19.9 22.36.0-6,9 . . . . . . . . . . . . . . . . . . . . . . . . . . . . . . . . . . . . . . . 20.7 19.0 20.17.0-7.9. . . . . . . . . . . . . . . . . . . . . . . . . . . . . . . . . . . . . . . 19.9 12.1 10.48.0-8.9 . . . . . . . . . . . . . . . . . . . . . . . . . . . . . . . . . . . . . . . 11.8 14.3 14.19.0-9.9 . . . . . . . . . . . . . . . . . . . . . . . . . . . . . . . . . . . . . . . 11.5 10.4 5.810.0-10.9 . . . . . . . . . . . . . . . . . . . . . . . . . . . . . . . . . . . . . 5.7 3.6 2.111.0-11.9 . . . . . . . . . . . . . . . . . . . . . . . . . . . . . . . . . . . . . 2.4 2.8 1.212.0-12.9 . . . . . . . . . . . . . . . . . . . . . . . . . . . . . . . . . . . . . 4.0 2.0 0.313.0-13.9 . . . . . . . . . . . . . . . . . . . . . . . . . . . . . . . . . . . . . 2.4 - -14.0 Andover . . . . . . . . . . . . . . . . . . . . . . . . . . . . . . . . . . . 1.7 0.5
Percent distribution
100.0 100.0 100.0
3.1 4.1 1.18.9 10.2 15.3
20.0 33.1 22.633.9 17.0 23.0
8.5 11.4 5.210.7 13.8 17.9
3.8 7.5 9.45.2 1.5 0.93.3 1.1 -
0.41.6
2.5 0.2 2.8
100.0 100.0 100.0
1.9 0.41.0 3.2 6.19.0 25.9 19.9
19.2 30.2 24.423.4 20.2 15.111.8 7.4 13.621.5 4.7 8.6
9.5 5.2 4.73.1 - 4.91.4 - 1.9
1.2 0.2
0.2
SOURCE: First National Haalth and Nutrition Examination Survay nutrition examination sample, 1971-74.
Table5. Percent distribution of black females byestimatad number ofwhite blood cells, according to age: United States, 1971-74
Age
Numberofcells X 109/L1-5 6-71 12-17 18-24 25-34 3544 45-54 55-64 65-74
years years years years years years years years years
Under 2,0-14.Oandover . . . . . . . . . . . . . . . . . . . . . . . . . . . 100.0 100.0 100.0
2.0-2.9 . . . . . . . . . . . . . . . . . . . . . . . . . . . . . . . . . . . . . . . - - -3.0-3.9 . . . . . . . . . . . . . . . . . . . . . . . . . . . . . . . . . . . . . . . 1.2 3.8 2.94.0-4.9 . . . . . . . . . . . . . . . . . . . . . . . . . . . . . . . . . . . . . . . 4.2 14.2 15.05.0-5.9 . . . . . . . . . . . . . . . . . . . . . . . . . . . . . . . . . . . . . . . 9.3 23.5 77.76.0-6.9 . . . . . . . . . . . . . . . . . . . . . . . . . . . . . . . . . . . . . . . 18.7 15.1 21.37.0-7.9 . . . . . . . . . . . . . . . . . . . . . . . . . . . . . . . . . . . . . . . 17.4 15.2 17.58.0-8.9 . . . . . . . . . . . . . . . . . . . . . . . . . . . . . . . . . . . . . . . 16.8 8.0 13.39.0-9.9, . . . . . . . . . . . . . . . . . . . . . . . . . . . . . . . . . . . . . . 8.9 10.0 3.810.0-10.9 . . . . . . . . . . . . . . . . . . . . . . . . . . . . . . . . . . . . 10.8 4.4 6.211,0-11.9 . . . . . . . . . . . . 6.0 3.1 1.312.0-12.9.............:: :::::::::::::::::::::: 3.4 1.8 0.513.0-13.9 . . . . . . . . . . . . . . . . . . . . . . . . . . . . . . . . . . . . . 0,1 - -14.0 Andover . . . . . . . . . . . . . . . . . . . . . . . . . . . . . . . . . . . 3.1 0.9 0.3
Percent distribution
100.0 100.0 100.0
0.2 1.20.8 1.5 2.9
16.1 15.9 9.011.3 21.9 18.522.4 16.7 23.816.8 12.4 18.614.5 13.7 10.3
9.6 8.7 6.63.3 4.3 4.52.2 0.8 1.20.9 1.3 2.90.9 0.7 0.31.2 1.1 1.5
100.0 100.0
2.1 2.69.5 20.6
26.8 16.524.4 11.018.2 15.311.7 14.2
1.5 12.33.0 6.82.7 0.3
0.4
100.00.24.3
18,122.119.513.1
9.16.43.40.80.50.32.0
SOURCE: First National Health and Nutrition Examination Survey nutrition examination sampla, 1971-74.
19

Table6. Estimated mean number andmean percent of leukocytes forwhitel persons bytypeof leukocyte, according tosax and age:
United States, 1971-75
Sex and age
Type of leukocyteTotal —
leukocytes Segmented BandLymphocytes Monocytes Ecsinophils Basophils
neu trophils neutrophils
Eothsexes, 25-74 years . . . . . . . . . . . . . . .
Male
25-74 years......,.. . . . . . . . . . . . . . .
25-34 years . . . . . . . . . . . . . . . . . . . . . . .35-44 years . . . . . . . . . . . . . . . . . . . . . . .
45-54 years . . . . . . . . . . . . . . . . . . . . . . .55-64 years, . . . . . . . . . . . . . . . . . . . . . .65-74 years . . . . . . . . . . . . . . . . . . . . . . .
Female
25-74 yaars . . . . . . . . . . . . . . . . . . . . . . .
25-34 years . . . . . . . . . . . . . . . . . . . . . . .35-44 years . . . . . . . . . . . . . . . . . . . . . . .4.5-54years, ,. .,..., . . . . . . . . . . . . . .55-64yaars . . . . . . . . . . . . . . . . . . . . . . .
65-74years . . . . . . . . . . . . . . . . . . . . . . .
!30thsexes, 25-74years, . . . . . . . . . . . . . .
Male
;25-74years . . . . . . . . . . . . . . . . . . . . . . .
25-34years . . . . . . . . . . . . . . . . . . . . . . .35-44years . . . . . . . . . . . . . . . . . . . . . . .45-54years, . . . . . . . . . . . . . . . . . . . . . .55-64years, . . . . . . . . . . . . . . . . . . . . . .65-74years . ., . . . . . . . . . . . . . . . . . . . .
Female
25-i’4years . . . . . . . . . . . . . . . . . . . . . . .
25-34years . . . . . . . . . . . . . . . . . . . . . . .35-44years . . . . . . . . . . . . . . . . . . . . . . .45-54years, . . . . . . . . . . . . . . . . . . . . . .55-64yaars . . . . . . . . . . . . . . . . . . . . . . .65-74years . . . . . . . . . . . . . . . . . . . . . . .
7.6
7.7
7.87.87.77.77.6
7,5
7.87.77.57.37,1
. . .
. . .
. . .
. . .,... . .. . .
. . .
. . .
. . .
. . .
. . .
. . .
4.51
4.54
4.484.474.614.614.59
4.48
4.684,714.474.234.16
58.9
58.5
57.157.959.260.159.6
59.2
59.160.959.457,558.5
Number ofcells X 109/L
0.02 2,69 0.22
0.02 2.74 0.24
0.02 2.86 0.240.02 2,75 0.240.02 2.72 0.240,02 2.68 0,220,03 2.56 0,24
0.02 2.65 0.20
0.03 2.74 0.200.02 2.56 0.180.01 2.62 0.210.01 2.73 0.220.02 2.58 0.20
Percent of 100 cells
0.2 35.9 2.9
0,3 35.8 3.1
0.3 37.3 3.10.2 36,3 3.20.3 35.2 3.00.2 34.6 2.90.3 34.2 3.3
0.2 35.9 2.7
0.4 35.9 2.60.3 34.5 2.40.2 35.7 2.8
0.2 37.6 2.90.2 36.4 2.9
0.15
0<17
0.170.170.170.150.18
0.14
0.150.140,130.130.13
2.0
2<2
2.22.22.22.02.4
1.9
2.01.81.8
1.81.9
O.c)l
0.(11
0.[110.010.010,010.01.
0.01
0.(110.(110.010.[)10.01
all
C1.1
Cl,l0,1C1.1c),10.1
().1
(),10.1().10.1().1
‘Irscludes persons of other races; see appendix 11,
SOURCE: First National Health and Nutrition Examination Survey detailed examination sample, 1971-75.
;20
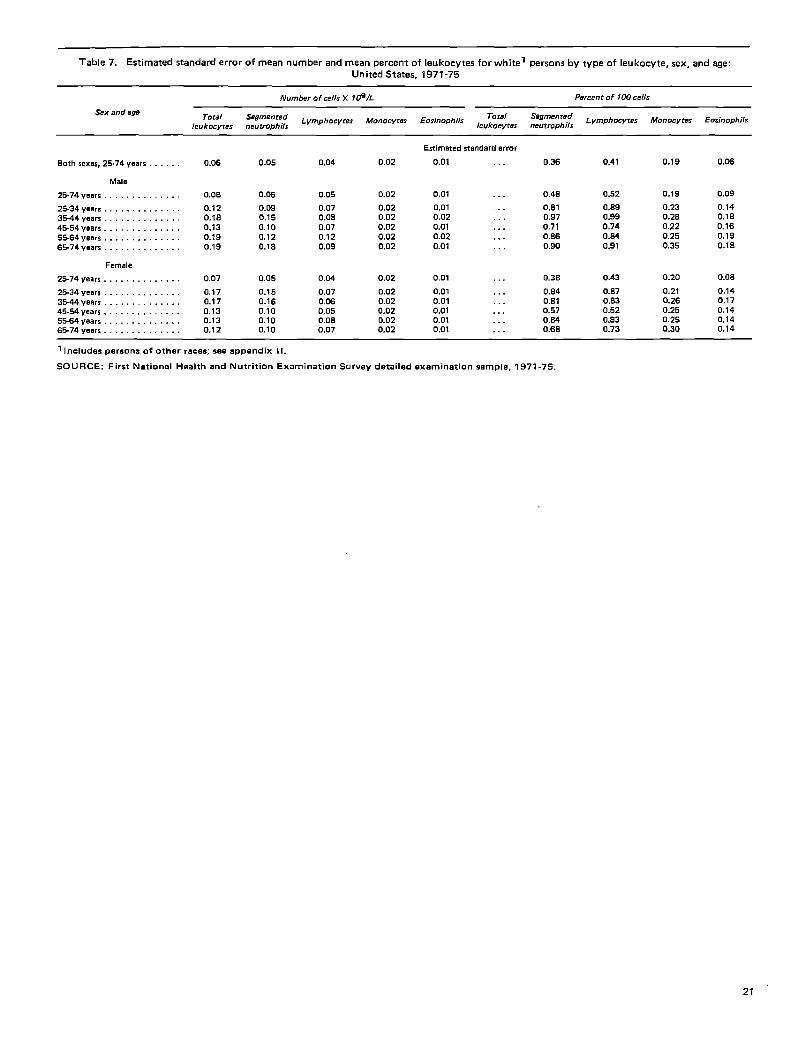
Table7. Estimated standard error ofmeannumber endmean percent ofleukocytes forwhite' parsons by type of Leukocyte, sex, and age:
United States, 1971-75
Number of .4s X 1091L Percent of 100 cells
Sex and ageTotal Segmented Lymphocytes Monocyres Eosinophils
Toral SqmanredIeukowres neutrophils leukocytes
Lymphocytesneutrophils
Monocytes Eosinophils
Estimated standard error
Both sexes,25.74 yaars . . . . . . 0.06 0.05 0.04 0.02 0.01 . . 0.36 0.41 0.19 0.06
Main
25-74 vnOrs . . . . . . . . . . . . . . 0.00 0.06 0.05 0.02 0,01 . . . 0.40 0.52 0.19 0.09
25-34 yaars . . . . . . . . . . . . . . 0.12 0.09 0.07 0.02 0,01 0,81 O.ae 0.23 0.14
3544y0ars . %. . . . . . . . . . . . 0.18 0,15 0.0s 0.02 0.02 0,97 0.99 0.2s O.l B
45-54 v8.ars. . . . . . . . . . . . . .
. .0.13 0,10 0.07 0,02 0.01 0.71 0.74 0.22 0,16
55-64 verb . . . . . . . . . . . . . .
.0.19 0.12 0.12 0.02 0.02 0.86 0..E4 0.25 0,19
6574vmn . . . . . . . . . . . . . .
. . .0,19 0.18 0.09 0,02 0.01 0.90 0.91 0.35 0.18
Female
2574vears . . . . . . . . . . . . . . 0.07 0.05 0.04 0,02 0.01 . 0.38 0.43 0.20 0.08
25-34 vcars . . . . . . . . . . . . . . 0,17 0.15 0.07 0.02 0.01 0.84 0.87 0.21 0.14
3544vears . . . . . . . . . . . . . .. .
0.17 0.16 O.m 0.02 0.01 0.81 0.83 0.26 0.17
45-54 years . . . . . . . . . . . . . ..
0.13 0.10 0.05 0.02 0.01 0.57 0.52 0.25 0,14
5564v0ars . . . . . . . . . . . . . . 0.13 0.10 0.08 0.02 0.01 o.a4 0.s3 0.25 0,146574vaars . . . . . . . . . . . . . .
. . .0.12 0.10 0,07 0.02 0,01 . 0.68 0.73 0.30 0.14
1 lncl”de~ persons Of other races; sea appendix 11-
SOURCE: First National Health and Nutrition Examination Survey detailed examination sample, 1971-75.
21
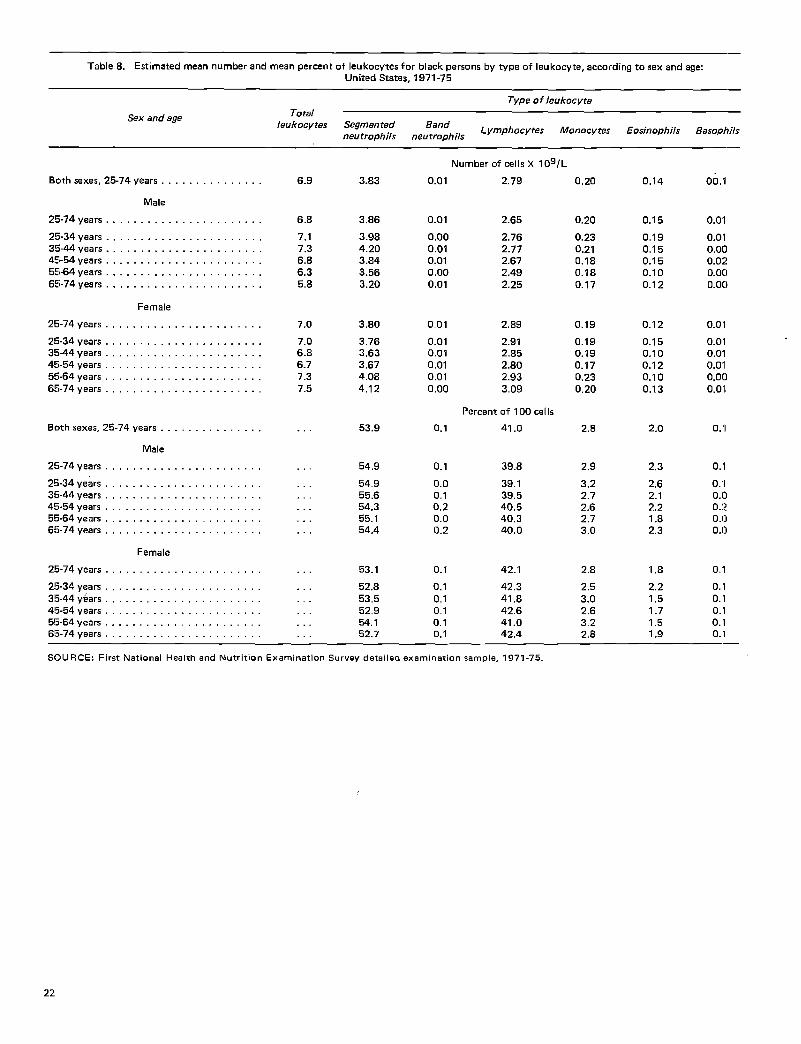
Table 8. Estimated mean number and mean percent of leukocytes for black persons by type of leukocyte, according to sex and age:United Statas, 1971-75
Sex and age
Type of leukocyte
Total —
leukocytes Segmented BandLymphocytes Monocytes
neu trophilsEosinophils
neutroph [IsBasophils
Both sexes, 25-74 years.,..........,..
Male
25.74 years . . . . . . . . . . . . . . . . . . . . . . .
2~.34years . . . . . . . . . . . . . . . . . . . . . . .
35-44 years . . . . . . . . . . . . . . . . . . . . . . .4~.54years . . . . . . . . . . . . . . . . . . . . . . .s~-gayears . . . . . . . . . . . . . . . . . . . . . . .
6~.j’4 years . . . . . . . . . . . . . . . . . . . . . . .
Female
25-74vears . . . . . . . . . . . . . . . . . . . . . .
25-34vears . . . . . . . . . . . . . . . . . . . . . . .3544years . . . . . . . . . . . . . . . . . . . . . . .as-sayears . . . . . . . . . . . . . . . . . . . . . .
55-64years . . . . . . . . . . . . . . . . . . . . . . .
65-74years . . . . . . . . . . . . . . . . . . . . . . .
Both sexes, 25-74years . . . . . . . . . . . . . . .
Male
25-74vaars . . . . . . . . . . . . . . . . . . . . . . .
25-34vears . . . . . . . . . . . . . . . . . . . . .35-44years . . . . . . . . . . . . . . . . . . . . . . .45-54vears ..,......,.. . . . . . . . . . . .55-64years . . . . . . . . . . . . . . . . . . . . . . .65-74vears . . . . . . . . . . . . . . . . . . . .
Female
2!j-74vears . . . . . . . . . . . . . . . . . . . . . . .
25-34years . ., . . . . . . . . . . . . . . . . . . .3!5-44&ars . . . . . . . . . . . . . . . . . . . . .45-54years . . . . . . . . . . . . . . . . . . . . . .
55-64vears . . . . . . . . . . . . . . . . . . . .65-74vears . . . . . . . . . . . . . . . . . . . . . . .
6.9
6.8
7.17.36.86.35,8
7.0
7.06.86.77.37.5
. .
. .
. . .
. . .,... .
. . .
. . .
.,..
. .
. . .
Number ofcells X 10g/L
3.83 0.01 2.79
3.86 0.01 2.65
3.98 0.00 2.764.20 0.01 2.773.84 0.01 2.673.56 0.00 2.493.20 0.01 2.25
3.80 0.01 2.89
3,76 0.01 2.913.63 0.01 2.853,67 0,01 2.804.08 0,01 2.934.12 0,00 3.09
Percent of 100 cells
53.9 0.1 41.0
54,9 0.1 39.8
54,9 0.0 39.155.6 0,1 39,554.3 0,2 40,555.1 0.0 40,354.4 0.2 40.0
53.1 0.1 42.1
52.8 0.1 42.353,5 0.1 41.852,9 0.1 42.654,1 0,1 41.052.7 0.1 42,4
0,20 0.14
0.20 0.15
0.23 0.190.21 0,150.18 0.150.18 0.100.17 0.12
0.19 0.12
0.19 0.150.19 0.100.17 0.120.23 0.100,20 0.13
2.8 2.0
2.9 2,3
3.2 2.62.7 2.12.6 2.22.7 1.83.0 2.3
2.8 1,8
2.5 2.23.0 1,5
2.6 1.73.2 1.52,8 1.9
00,1
0.01
0.01O.ocl0.02!O.oclO.ocl
0.01
0.010.010.010.000.011
0.’1
0.’1
0.’10.()(l.:?0.00.()
0,’1
0.10.10.10.10.1
SIEllJRCE: First National Health and Nutrition Examination SurveVdetailed examination sample, 1971-75.

Table9. Estimated standard error ofmeannumber andmean percent of Leukocytes for black persons by type of Leukocyte, sex, and age:United States, 1971-75
Number of.ells X 1091L Percent of 100 cells
Sex and ageTo raf segmented
Lk’mphocvtes Monocytes EosinophilsTotal Segmented
IeukocyresLvmphocvtes Monocvtes Eosmophils
neutrophils leukocytes neutrophiis
Estimated standard error
Both sexes, 2.574 years 0,14 0.10 0.08 0.02 0.01 . . . 0.76 0.75 0.34 0.1 B
Male
2574 years . . . . . . . . . . . . . . O 24 0.20 0,10 0,03 0,02 . 1.19 1.15 0,43 0.26
2E-34yean . . . . . . . . . . . . . . 0.39 0.33 0,18 0.05 0.05 . . 2.15 2.12 0.77 0.493544years . . . . . . . . . . . . . . 0,63 0.52 0.21 0.05 0.03 . . 2.76 2.77 0.59 0.4545-54 years . . . . . . . . . . . . . . 047 0.40 0.19 0.05 0.03 . . 2.72 2.73 0.655564 Years . . . . . . . . . . . . . .
0.400.39 0.39 0.16 0.04 0,03 . . . 3.25 2.34
65-74 vears . . . . . . . . . . . . . .0.79 0.60
043 0.36 0,17 0.04 0.03 . . 2.39 2.25 0.65 0.62
Female
25-74 war5 . . . . . . . . . . . . . . 0.19 0.14 0:11 0.03 0.01 . 0.90 0,91 0.37 0.20
25-34 years . . . . . . . . . . . . . . 0.32 0.27 0.17 0.04 0.03 . . 2.12 1.953544years . . . . . . . . . . . . . .
0.42 0.440.45 0.20 0.21 0.05 0.02 ,.. 1.2B 1.25 0.75 0,34
4E&4vears. . . . . . . . . . . . . . 0.30 0.24 0.16 0.03 0.03 . 2.01 2.17 0.49 0,315564 years . . . . . . . . . . . . . . 0.42 0.35 0.17 0.08 0.03 . 1.70 1,39 1.0265-74 vears . . . . . . . . . . . . . .
0,430,81 0.75 0.34 0,05 0.03 3.40 3.55 0.78 0.49
SOURCE: First National Health and Nutrition Examination Survey detailed examination sample, 1971-75.
23

Table 10. Number of examined persons, estimated mean number of segmented neutrophils, standard deviation, and selectedpercentiles by race, sex, and age: United States, 1971-75
Number of NumberStandard
PercentileRace, sex, and age examined of cells
deviationpersons X 10g/L 5th 10th 25th 50th 75th 90th 95th
White7
Both sexes
25-34 yaars . . . . . . . . . . . . . . . . . . . . . . . . . . .35-44 years . . . . . . . . . . . . . . . . . . . . . . . . . . .45-54years . . . . . . . . . . . . . . . . . . . . . . . . . . .55434years . . . . . . . . . . . . . . . . . . . . . . . . . . .65-74years . . . . . . . . . . . . . . . . . . . . . . . . . . .
Male
25-34years . . . . . . . . . . . . . . . . . . . . . . . . . .
35-44years . . . . . . . . . . . . . . . . . . . . . . . . . . .45-54years . . . . . . . . . . . . . . . . . . . . . . . . . . .55434vears . . . . . . . . . . . . . . . . . . . . . . . . . . .65-i’4vears . . . . . . . . . . . . . . . . . . . . . . . . . . .
Female
25-34vears . ., ...,..,. . . . . . . . . . . . . . . .35-44years . . . . . . . . . . . . . . . . . . . . . . . . . .45-54years . . . . . . . . . . . . . . . . . . . . . . . . . . .55-64years . . . . . . . . . . . . . . . . . . . . . . . . . . .!65-74vears . . . . . . . . . . . . . . . . . . . . . . . . . . .
Black
Both sexes
;25-34yaars . . . . . . . . . . . . . . . . . . . . . . . . . . .35-44vears . . . . . . . . . . . . . . . . . . . . . . . . . . .,45-54vears . . . . . . . . . . . . . . . . . . . . . . . . . . .55-64years . . . . . . . . . . . . . . . . . . . . . . . . . . .65-74vears . . . . . . . . . . . . . . . . . . . . . . . . . . .
Male
Z25-34vears . . . . . . . . . . . . . . . . . . . . . . . . . . .135-44yeers . . . . . . . . . . . . . . . . . . . . . . . . . . .45-54years . . . . . . . . . . . . . . . . . .55-64vears . . . . . . . . . , . . . . . . . . . .65-74years . . . . . . . . . . . . . . . . . . . . . . . . . .
Female
t25-34years . . . . . . . . . . . . . . . . . . . . . . . . . .35-44years . . . . . . . . . . . . . . . . . . . . . . . . .45-54years . . . . . . . . . . . . . . . . . , .!~5.64years . . . . . . . . . . . . - . . .
65-74years . . . . . . . . . . . . . . . . . . . . . . . . . .
1,095833
1,132895832
484
363510427399
611470622468433
146128172117141
6147825372
8581906469
4,584.594.544.404.34
4.484.474.614.614.59
4.674.714.474.234.16
3.863.893.753.863.73
3.984.203.843.563.20
3.763.633.674.084.12
1.651.731.441.411.58
1.441.57
1.381.431.95
1.821.851.491.361,20
1.501.591.641.592.61
1.351.831.731.361.37
1.611.321.57
1.703.18
2.40 2.79 3.52 4.37 5.46 6.54 7.302.42 2.79 3.41 4.31 5.45 6.71 7.542,56 2.86 3.48 4.36 5.34 6.41 7.142.41 2.77 3.42 4.18 5,22 6.26 6.782.54 2.86 3.36 4.09 4.99 5.97 6.65
2.39 2.72 3.48 4.31 5.46 6.45 7.062,54 2.80 3.30 4.14 5.24 6.46 7.562.75 3.00 3.63 4.47 5.33 6.32 7.032.62 3.01 3.59 4.47 5.51 6.36 7.062.70 2.97 3.49 4.21 5.24 6.04 6.94
2.52 2.80 3.54 4.40 5.44 6.72 7.672.22 2.65 3.54 4.46 5.62 6.92 7.502.40 2.78 3.34 4.28 5.36 6.53 7.342,34 2.65 3.34 4.05 4.94 6.07 6.722.51 2.78 3.29 3.98 4.76 5.82 6.56
2.01 2,20 2.60 3.67 4.62 6.54 6.321.82 2.15 2.73 3.72 4.77 5.56 6.131.53 1,89 2.55 3.40 4.56 5.98 6.831.85 1.94 2.50 3.64 5.25 5.82 6.491.65 1.79 2.35 3.11 4.42 5.88 6,50
2,32 2.38 2.84 3.75 4.81 5.62 6.341.54 2.17 2.89 3.94 5,32 5.57 6.591.80 1.89 2.57 3.40 4.66 6.49 6.871.69 1.88 2.37 3.25 4.35 5.38 5.781.70 1.72 2.11 2.70 3.93 5.12 5.60
1.97 2.01 2.48 3.53 4.54 5.20 5.631.83 1,97 2.67 3.52 4.24 5.21 5.79
1.38 1.89 2.53 3.59 4.51 5.31 6.04
1.86 1.91 2.52 3.77 5.36 6.00 6.711.53 1.92 2.44 3.38 4.78 6.16 6.55
llnclude~ persons of other races; see appendix Il.
SOURCE: First National Health and Nutrition Examination Survaydatailed examination sample, 1971-75.
24

Table Il. Number ofexamined persons, estimated mean numbarof lymphocytes, Sandard deviation, andselwtad parcentilasbyrace, sex, and age: United States, 1971-75
Number of NumberStandard
PercentileR=e, sex, and age examined of cells
deviationpersons X 10g/L 5tfl lotfl 25th 50th 75th 90th 95th
Whitel
Both sexes
25-34 years3544 years45-54 years
55-64 years65-74 years
1,095833
1,132895832
484363510427399
611470622468433
146128172117141
6147825372
8581906469
2.802.652.672.712.57
2.862.752.722.682.56
2.742.562.622.732.58
2.642.812.742.742.73
2.762.772.672.492.25
2.912.842.802.933,09
0.890.910.871.360.96
0.870.960.901.730.90
0.900.840.840.911,01
0.930,930.820.821.30
0.830,790.820.770.74
1.001.040.810.811.49
1.541.381.461.391.29
1.801.591.651.631.53
2.17 2.66 3.33 3.93 4.321.98 2.54 3.20 3.77 4.222.01 2.55 3.21 3.84 4,25
2.03 2.56 3.23 3.85 4.371.94 2.44 3.07 3.74 4.16
. . . . . . . . . . . . . . . . . . . . . . . . . . .
. . . . . . . . . . . . . . . . . . . . . . . . . . .
... ..,. . . . . . . . . . . . . . . . . . . . .
. . . . . . . . . . . . . . . . . . . . . . . . . . .
. . . . . . . . . . . . . . . . . . . . . . . . . . .
Male
25-34 years35-44 years45-54 ~ears55-64 years66-74 years
1.591.301.451.351.20
1.851.541.641.581.45
2.24 2.76 3.41 3.94 4.302.05 2.65 3.32 3.95 4.542.03 2.64 3.27 4.05 4.381.96 2.50 3.20 3.78 4.251.95 2.46 3.06 3.77 4.16
. . . . . . . . . . . . . . . . . . . . . . . . . . .
... ,.. . . . . . . . . . . . . . . . . . . . . .
. . . . . . . . . . . . . . . . . . . . . . . . . . .
. . . . . . . . . . . . . . . . . . . . . . . . . . .
. . . . . . . . . . . . . . . . . . . . . . . . . . .
Female
1.481.401.481.451.35
2.10 2.60 3.26 3.88 4,341.92 2.47 3.00 3.68 3.961.98 2.50 3.10 3.74 4.172.08 2.61 3.24 3.97 4.451.94 2.38 3.12 3.71 4,17
25-34 years35-44 years45-54 years55-64 yaars65-74 years
1.771.621.651.671.58
... ..., .,, . . . . . . . . . . . . . . . . .
... ..,. . . . . . . . . . . . . . . . . . . . .,., ... ,. .,.. . . . . . . . . . . . . . . .. . . . . . . . . . . . . . . . . . . . . . . . . . .. . . . . . . . . . . . . . . . . . . . . . . . . . .
Black
Both saxes
1.491.181.551.651.25
1.831.711.731.791.43
2.26 2.55 3.43 4.35 4.532.21 2.75 3.30 3.91 4.452.12 2.61 3.33 3.88 4.242.12 2.60 3.32 3.78 4.131.83 2.42 3.31 4.24 5.23
25-34 years36-44 years45-54 yea rs55-64 years65-74 years
. . . . . . . . . . . . . . . . . . . . . . . . ,,.
. . . . . . . . . . . . . . . . . . . . . . . . . . .
. . . . . . . . . . . . . . . . . . . . . . . . . . .
. . . . . . . . . . . . . . . . . . . . . . . . . . .
. . . . . . . . . . . . . . . . . . . . . . . . . . .
Male
25-34 years35-44 yaars45-54 yaars55-64 years65-74 years
1.651.771.451.351.20
1.801.941.591.751.26
2.26 2.55 3.22 3.70 4.482.23 2.66 2.97 3.63 3.932.11 2.55 3.33 3.82 4.082.01 2.37 2.70 3.49 3.671.53 2.28 2.74 3.25 3.39
. . . . . . . . . . . . . . . . . . . . . . . . . . .
. . . . . . . . . . . . . . . . . . . . . . . . . . .
. . . . . . . . . . . . . . . . . . . . . . . . . . .
. . . . . . . . . . . . . . . . . . . . . . . . . . .
. . . . . . . . . . . . . . . . . . . . . . . . . . .
Famale
1.941.251.901.871.50
2.17 2.58 3.67 4.41 4.582.06 2.91 3.55 4.21 4.692.12 2.65 3.30 3.96 4.402.35 3.00 3.44 3.97 4.182.02 2.71 3.79 4.91 5.49
25-34 years3544years45-54years55-64 years65-74years
1.441.111.641.731.28
Ilncludas persons of other races; seeappandix Il.
SOURCE: First National Health and Nutrition Examination Survey detail ed examination sample, 1971-75,
25

Appendixes
.
Contents
u. Statistical notes . . . . . . . . . . . . . . . . . . . . . . . . . . . . . . . . . . . . . . . . . . . . . . . . . . . . . . . . . . . . . . . . . . . . . . .
The survey design . . . . . . . . . . . . . . . . . . . . . . . . . . . . . . . . . . . . . . . . . . . . . . . . . . . . . . . . . . . . . . . . . . .
Derivation ofestimates. ..,., . . . . . . . . . . . . . . . . . . . . . . . . . . . . . . . . . . . . . . . . . . . . . . . . . . . . . . . . . .
Nonresponse . . . . . . . . . . . . . . . . . . . . . . . . . . . . . . . . . . . . . . . . . . . . . . . . . . . . . . . . . . . . . . . . . . . . . . .
Missing data . . . . . . . . . . . . . . . . . . . . . . . . . . . . . . . . . . . . . . . . . . . . . . . . . . . . . . . . . . . . . . . . . . . . . . .
Small numbers.......,.. . . . . . . . . . . . . . . . . . . . . . . . . . . . . . . . . . . . . . . . . . . . . . . . . . . . . . . . . . . .
Reliability ofestimates, . . . . . . . . . . . . . . . . . . . . . . . . . . . . . . . . . . . . . . . . . . . . . . . . . . . . . . . . . . . . . . .
Utilization ofstandarderrors. . . . . . . . . . . . . . . . . . . . . . . . . . . . . . . . . . . . . . . . . . . . . . . . . . . . . . . . . . . .
Il. Definitions ofcertainterms used in this report . . . . . . . . . . . . . . . . . . . . . . . . . . . . . . . . . . . . . . . . . . . . . . . . . .
[11. Data collection methodology. . . . . . . . . . . . . . . . . . . . . . . . . . . . . . . . . . . . . . . . . . . . . . . . . . . . . . . . . . . . . .
White blood cell counts . . . . . . . . . . . . . . . . . . . . . . . . . . . . . . . . . . . . . . . . . . . . . . . . . . . . . . . . . . . . . . .
Peripheral blood smears: Cell-typing criteria . . . . . . . . . . . . . . . . . . . . . . . . . . . . . . . . . . . . . . . . . . . . . . . . . .
lV. Quality control . . . . . . . . . . . . . . . . . . . . . . . . . . . . . . . . . . . . . . . . . . . . . . . . . . . . . . . . . . . . . . . . . . . . . . .
Review ofwhite bloodcell count data . . . . . . . . . . . . . . . . . . . . . . . . . . . . . . . . . . . . . . . . . . . . . . . . . . . . . .
Peripheral bloodsmears . . . . . . . . . . . . . . . . . . . . . . . . . . . . . . . . . . . . . . . . . . . . . . . . . . . . . . . . . . . . . . .
List of Appendix Tables
1. Sample locations of the first National Health and Nutrition Examination Survey by region, county, and State . . , . . . . .
Il. Population estimates forexamination locationa l-65 by sex, racer and age at examination: United States, 1971-74 . . . . .
Ill, Population estimates forexamination locationa l-100 by sex, race, and age at examination: United States, 1971-75 . . . .
27
27
28
28
31
31
31
32
33
34
34
34
36
36
36
29
3030
26

Appendix I
Statistical Notes
The survey design
The sampling plan for the first 65 stands, or loca-tions, of the fnst National Health and Nutrition Ex-amination Survey (NHANES I) followed a stratifiedmultistage probability design in which a sample of thecivilian noninstit utiomdized population ages 1-74years of the coterminous United States was selected.Excluded from the selection were persons residing inAlaska and Hawaii and those within the coterminousUnited States who were confined to institutions orresiding on American Indian reservation lands. Suc-cessive elements dealt with in the process of samplingwere the primary sampling unit (PSU), census enu-meration district, segment (a cluster of households),household, eligible pmsons, and finally, samplepersons.
The starting points in the first stage of this designwere the 1960 decennid census lists of addresses andthe nearly 100 PSU’S into which the entire UnitedStates was divided by the U.S. Bureau of the Census.Each PSU is either a st~ndard metropolitan statisticalarea (SMSA), a single county, or two or three con-tiguous counties. The 1’SU’S were grouped into 357strata for use in the Health Interview Survey and werethen collapsed into 40 superstrata for use in Cycles 11and 111 of the Health Examination Survey andNHANES I.
Fifteen of the 40 superstrata contained a singlelarge metropolitan are~ with a population of morethan 2 million. The 15 large metropolitan areas wereselected for the sample with certainty. The 25 non-certainty strata were classified into 4 broad popula-tion density groups in each region. Then a controlledselection technique was used to select 2 PSU’S fromeach of the 25 noncertainty superstrata with theprobability of selection of a PSU proportionate to its1960 population. Thus, proportionate representationof specified State groups and rate-of-population-change classes was maintained in the sample. In thismanner a total first-stage sample of 65 PSU’S wasselected. These 65 sample PSU’S, or stands, are the
areas within which a sample of persons would be se-lected for examination over the 3-year survey period.
Although the 1970 census data were used as theframe for selecting the sample of PSU’S when they be-came available, the calendar of operations requiredthat 1960 census data be used for 44 of the 65 standsin the NHANES I sample. Census enumeration dis-tricts (ED’s) in each PSU were divided into segmentsof an expected six housing units each. In urban ED’sthe segments were clusters of six addresses from the1960 census listing books. For ED’s not having usableaddresses, area sampling was employed and, conse-quently, the segment size varied. To make the samplerepresentative of the current population of the UnitedStates, the address or list segments were supplementedby a sample of housing units that had been con-structed since 1960.
Within each PSU a systematic sample of segmentswas selected. The ED’s that fell into the sample werecoded into one of two economic classes. The fustclass, identified as the “poverty stratum,” was com-posed of current poverty areas that had been identi-fied by the U.S. Bureau of the Census in 1970 (pre-1970 census). plus other ED’s in the PSU with a meanincome of less than $3,000 in 1959 (based on 1960census data). The second economic class, the “non-poverty stratum, “ included all ED’s not designated asbelonging to the poverty stratum.
All sample segments classified as being in thepoverty stratum were retained in the sample. Forthose sample segments in nonpoverty stratum ED’s,the selected segments were divided into eight randomsubgroups and one of the subgroups was chosen toremain in the NHANES I sample. This procedure per-mits separate analyses with adequate reliability ofthose classified as being below the poverty level andthose classified as being above the poverty level.
After the sample segments had been identified, alist of all current addresses within the segment bound-aries was made. and a person in each of the house-holds was interviewed to determine the age and sex of
27

each household member and to gather other demo-graphic and socioeconomic information required forthe survey.
In selecting the persons in sample segments to beexamined in NHANES I, all household members ages1-74 years in each segment were listed on a sampleselection worksheet with each household in the seg-ment listed serially. The number of household mem-bers in each of the six age-sex groups shown belowwere listed on the worksheet under the appropriateage-sex-group column, The sample selection work-sheets were then ordered by segment number, and asystematic random sample of persons in each age-sexgroup was selected to be examined by using thefollowing sampling rates:
Age Sampling rate
l-5 years . . . . . . . . . . . . . . . . . . . . . . 1126-19 years . . . . . . . . . . . . . . . . . . . . . 1/420-44 years (male) . . . . . . . . . . . . . . . . 1/4
20-44 years (female) . , . . . , . . , . . . . . . 1/2
45-64 veals . . . . . . . . . . . . . . . . . . . . 1/4
65-74 vears . . . . . . . . . . . . . . . . . . . . 1/1
The persons selected for the 65-stand nutritioncomponent of NHANES I constitute a representativesample of the target population and include 28,043persons ages 1-74 years, of whom 20,749, or nearly74 percent, were examined. When adjustments aremade for differential sampling for high risk groups,the response rate becomes 75.2 percent.
The subsample of adults ages 25-74 years who re-ceived the detailed examination in addition to themore general nutrition examination was chosen sys-te matically after a random start, This group com-prised one-fifth of the total sample of adults ages 25-74 years and was selected in accordance with thefollowing rates:
Age
ResultantRate appliedto nutrition
effectivesampling
samplerate
25-44 veers (mele) . . . . , . . . 2/5 1/1025-44 years (female) . . . . . . 1/5 1/1045-64 years . . . . . . . . . . . . . 3/5 3/2065-74 years . . . . . . . . . . . . . 114 1/4
The continuation of the detailed medical exami-nation from 1974 to 1975 is referred to as theNHANES I augmentation survey of adults. The sam-ple design had two basic requirements: The sampleof persons selected for examination in survey loca-tions 66-100 would constitute a national probabilitysample of the target population, and, when consid-ered jointly with those persons receiving the detailedexamination in NHANES I survey locations 1-65, thesample would be a 100-PSU national probabilitysample, Table I is a list of the sample locations at
which examinations were conducted during thesurvey.
The PSU’S for the augmentation survey wereselect ed by the same process used earlier at the begin-ning of NHANES I (described earlier4 ). The finalsampling stage involved the random selection of oneof every two adults ages 25-74 years who were eligi-ble for the sample.
All the data presented in this report are based on“weighted” observations. That is, data recorded foreach sample person are inflated to characterize thesubuniverse from which that sample person wasdrawn.
Derivation of estimates
Because the design of NHANES I is a multistageprobability sample, complex procedures must be usedin the derivation of estimates. Three basic operationsare involved, the results of which are presented separ-ately in tables II and III for the nutrition examina-tion sample and the detailed examination sample,respectively.
Inflation by the reciprocal of the probability ofselection. –The probability of selection is the productof the probabilities of selection from each step ofselection in the design (PSU, segment, and sampleperson).
Nonresponse adjustment. -The estimates are in-flated by a multiplication factor calculated withineach PSU for each of five selected income groups(less than $3,000; $3,000-$6,999; $7,000-$ 9,9!99;$10,000-$ 14,999; and $15,000 and over). The Iuu-merator of these factors consists of the sum of theweights for sample persons resulting from the recipro-cal of the probability of selection, and the denomina-tor consists of the sum of the weights for examinedpersons also resulting from the reciprocal of theprobability of selection,
Poststratification by age-sex-race. –The estimatesare ratio adjusted within age-sex-race cells to an inde-pendent estimate, provided by the U.S. Bureau of theCensus, of the population of each cell as of the mlid-point of the survey. The effect of the ratio-estimatingprocess is to make the sample more closely represent-ative of the U.S. civilian noninstitutionalized popula-tion by age, sex, and race, which thereby reducessampling variance.
More detailed descriptions of the survey designand selection technique have been published.’~’5
Nonresponse
In any health examination survey, after thesample is identified and the sample persons are re-quested to participate in the examination, the surveymeets one of its more severe problems: Usually, asizable number of sample persons will not participate
NOTE: A list of references follows the text.
28

Table 1. Sample locations of the first National Health and Nutrition Examination Survey by ragion, county, and State
Region, coun W, 7 and state
Northeast
Essex, Morris, Union, Somerset, Hudson, Middlesex, N.J.Nassau, Queens, Suffolk, N.Y.Bronx, N.Y.Kings, Richmond, N.Y.Westchester, Rockland, N. Y.: Bergen, Passaic, N,J.Bucks, Chestar, Delaware, Montgome~, Philadelphia, Pa.Philadelphia, Pa.: Camden, Gloucester, Burlington, N.J.Essexr Middlesex, Norfolk, Plymouth, Suffolk, Mass.Allegheny, Beaver, Washington, Westmoreland, Pa.Albany, Schenectady, Rensselaer, Saratoga, N.Y.Lackawanna, Pa.Holyoke, Chicopee, Springfield, Mass.Bristol, Newport, Providence, Kent, Washington, R.1.Hartford, Tolland, Corm.Chemung, Tioga, Tompkins, N.Y.Mercer, Pa.Bedford, Fulton, Pa.Monroe, N.Y.Blair, Pa.Middlesexr New Haven, Corm.Warren, N.Y.
Midwest
Lake, Porter, Cook, Will, Kane, Ill.Cook, DuPage, Kane, Lake, McHenry, II 1.Macomb, Oakland, Wayne, Mich.
Milwaukee, Waukesha, Wis.Hennepinr Ramsey, Anoka, Dakota, Washington. Minn.Lake, Cuyahoga, OhioFranklin, OhioBuchanan, Mo.Cass, N. Dak.: Clay, Minn.Jefferson, St. Charles, St. Louis, Me.: Madison, St. Clair, Ill.Bay, Mich.DeKalb-Stueben, Ind.: Branch, Mich.Cass, St. Joseph, Mich.Fayette, Rossr OhioLaPorte, Marshall, Starke, Ind.Boone, Greene, IowaHoward, Iowa: Fillmore, Minn.Cass, Clay, Jackson, Platte, Mo.Marion, I nd.Montgomeryr Greene, Miami, OhioJackson, Mich.Jefferson, Leavenwotihr Kans.: Platt, Mo.Brown, Clinton, OhioRusk. Wis.
South
St. Bernard, Jefferson, Orleans, La.Washington, D. C.: Fairfaxr Arlington, Vs.: Prince Georges, Montgomery,
Md.Richland, Lexington, S.C.Knox. Anderson, Blount, Term.Roanoke, Va.Chatham, Ga.Hillsborough, Pinellas, Fla.Palm Beach, Fla.Natchitoches, La.Lamarr Marion, Miss.Cabarrus, Stanley, Union, N.C.Hancock, Hamblen, Hawkins, Claiborne, Term.Barbour, Ala.Bullock, Jenkins, Ga.Sussax, Del.: Worcester, Md.Fayette, W. Va.Greenville, S.C.New Castle, Del.Jefferson, Ala.Volusia, Fla.Edgefield, Saluda, S.C.Clay, Calhoun, Roane, W. Va.
West
Orange, Los Angeles, Calif.Los Angeles, Cal if.Alameda, Contra-Costa, San Mateo, San Francisco, Solano, Cal if.
ColIin, Denton, Dallas, Ellisr Tex.Bexar, Tex.Pima, Ariz.Douglas, Nebr.: Pottawattamie, IowaSan Diego, Calif.Fresno, Calif.Monterey, Calif.Clallum, San Juan, Wash.Grant, Wash.Gila, Ariz.Avoyal Ies, La.Ottertail, Minn.Adams, Arapahoe, Denver, Jefferson, Boulder, Colo.Sacramento, Calif.Hunt, Rains, Tex.Mason, Thurston, Wash.Greeley, Nance, Nebr.Camadian, Cleveland, Oklahoma, Okla.
‘ County, parish, or borough
in the examination. Whether or not an individual par-ticipates is determined by many factors, some of themuncontrollable, and, therefore, the outcome maybe reasonably treated as a random event with a par-ticular probability of occurrence. If the probabilitiesof participation were known and were greater thanzero for all persons, then the examined persons wouldconstitute a probability sample from which unbiasedestimates of the target population could be derived.In this situation, the effect of nonparticipation wouldonly be to reduce the sample size, thereby increasingthe sampling errors of examination findings. In prac-tice, however, a potential for bias due to nonresponseexists because the exact probabilities are neverknown. A further potential for bias exists if: (1) a
sizable proportion of sample persons have a zeroprobability of participation, that is, they would neveragree to participate in an examination survey of thesame procedures and inducements, and (2) these per-sons differ from other sample persons with respect tocharacteristics under examination. It is for thesereasons that intensive efforts were made in NHANES Ito develop and implement procedures and induce-ments that would reduce the number of nonrespond-ents and thereby reduce the potential of bias due tononresponse. These procedures and inducements arediscussed elsewhere.4
NOTE: A list of references follows the text.
29

Table 11. Population estimates for examination locations 1-65 by sex, race, and age at examination: United States, 1971-74
Estimated population
Age at examina tion Male FemaleTotal
All races White 1 Black All races White I Black
l-74years . . . . . . . . . . . . . . . . . . . . . 193,976,381 94,239,866 82,740,899 10,413,986 99,736,515 86,867,546 11 ,99!9,935
I year . . . . . . . . . . . . . . . . . . . . . . . . 3,313,458 1,693,074 1,401,508 280,212 1,620,3842-3 years . . . . . . . . . . . . . . . . . . . . . .
1,327,6576,963,162 3,553,765
257,2892,997,707 479,362 3,409,397
4-5years . . . . . . . . . . . . . . . . . . . . . .2,872,581 50!5,442
6,672,346 3,378,503 2,866,374 485,872 3,293,&?36-7years . . . . . . . . . . . . . . . . . . . . . .
2,755,016 511,1347,193,663 3,652,322 3,060,888 573,867 3,541,341
8-9years . . . . . . . . . . . . . . . . . . . . . .2,951,927 5716,578
7,696,597 3,880,396 3,279,649 586,419 3,816,20110-n years . . . . . . . . . . . . . . . . . . . .
3,257,936 53!3,855
8,465,793 4,381,730 3,732,593 563,823 4,064,063 3,424,07012-14years . . . . . . . . . . . . . . . . . . . . 12,335,321
61’7,7936,312,519 5,397,061 879,377 6,022,802
15-17years . . . . . . . . . . . . . . . . . . . .5,122,189 8315,252
12,318,434 6,207,169 5,311,596 812,321 6,111,265 5,233,091 85:3,29418-19years . . . . . . . . . . . . . . . . . . . . 7,352,200 3,673,321 3,206,467 404,04520-24years . . . . . . . . . . . . . . . . . . . .
3,678,879 3,158,930 504,41717,325,038 8,109,775 7,094,036 866,201 9,215,263
25-34years . . . . . . . . . . . . . . . . . . . .7,972,486 1,07:3,358
26,936,001 13,002,514 11,594,115 1,231,79335-44 years . . . . . . . . . . . . . . . . . . . .
13,933,487 12,160,578 1,646,33722,268,477 10,675,731 9,515,530 1,004,953 11,592,746 10,111,458 1,3113,050
45-54years . . . . . . . . . . . . . . . . . . . . 23,313,316 11,150,110 10,039,124 1,056,837 12,163,206 10,879,16755-64 years . . . . . . . . . . . . . . . . . . . .
1,23”7,45919,049,001 9,072,586 8,274,948 702,647 9,976,415 9,037,157 87’1,098
165-74 years . . . . . . . . . . . . . . . . . . . . 12,773,574 5,496,351 4,969,903 486,257 7,277,223 6,603,303 65’1,579
llncl~desperaonsof mher races; see appendix Il.
NOTE: The numbars in this table constitute estimates and closely approximate the U.S. population as estimated by the U.S. Bureau of the Census asof November 1972.
SOURCE: First National Health and Nutrition Examination Survey nutrition examination sample, 1971-74.
Table Ill. Population estimates forexamination locations l-l OObysex, race, andage at examination: United Statesr 1971-75
Estimated population
Age at examination Male Female
TotalAll races White I Black All races White I Black
Z25-74years . . . . . . . . . . . . . . . . . . . . 106,639,033 50,586,997 45,303,260 4,693,184 56,052,036 49,582,632 5,963,002
;25-34Vears . . . . . . . . . . . . . . . . . . . . 28,296,796 13,663,092 12,122,508 1,302,502 14,633,704:35-44 years . . . . . . . . . . . . . . . . . . . .
12,712,842 1,736,49822,302,278 10,761,322 9,578,852 1,023,520 ‘1T,540,956 10,003,331 1,391,510
45-54 years . . . . . . . . . . . . . . . . . . . . 23,548,824 11,288,375 10,131,455 1,095,092 12,260,449 10,921,890 1,26;!,609!j5.64 years . . . . . . . . . . . . . . . . . . . . 19,345,852 9,191,996 8,336,468 768,237 10,153,856 9,164,012 90~,874
65-74 years . . . . . . . . . . . . . . . . . . . . 13,145,283 5,682,212 5,133,977 503,833 7,463,071 6,780,557 666,511
‘Ilnclude sper$onsof other races; see aPPendiX Il.
NOTE: The numbers in this table constitute estimates and closely approximate the U.S. population as estimated by the U.S. Bureau of the Celnsusasof February 1974.
SOURCE: First National Health and Nutrition Examinatiorr Survey detailed examination sample, 1971-75.
Despite these intensive efforts, 26 percent of thesample persons from the 65-location nutrition exami-nation sample and 30 percent of the sample personsfrom the 100-location detailed examination samplewere not examined. Consequently, the potential fora sizable bias does exist in the estimates in this publi-cation. From what is known about the nonrespond-ents and the nature of nonresponse, it is believed thatthe likelihood of sizable bias is small.
Efforts have been made using data from NHANESI and from an earlier sumey to examine possiblehealth-related differences between examined and non-examined persons. Reasons for nonparticipation inNHANES I were investigated29 on a sample of 325
NOTE: A list of references follows the text.
30
persons (209 examined persons, 35 persons whet hadmade appointments for the examination but whonever came to the mobile examination center for theexamination, and 81 persons who refused to partici-pate in the survey). The sample persons for this studycame from four stand locations: St. Louis, Monterey,New York, and Philadelphia. They were asked to indi-cate why they did not choose to be examined. Theprimary reasons given were that they had no need fora physical (48 percent), or that the examination timeswere inconvenient because of work schedules or c]therdemands (15 percent). Only 6 percent of those per-sons not examined in NHANES I indicated that theyrefused the examination because of sickness, and3 percent based theix refusal on fears of possiblefindings.

Data on both examined and nonexamined (but Missing datainterviewed) persons were analyzed30 by using infor-mation from the first 35 stands of NHANES I. Forthe health characteristics compared, the two groupswere quite similar. For example, 20 percent of theexamined persons reported that a doctor had toldthem they had arthritis, compared with 17 percent ofthe unexamined persons. Similarly, 18 percent ofboth the examined and the nonexamined persons hadbeen told by a doctor that they had high blood pres-sure. Twelve percent of both groups reported thatthey were on a special diet, and 6 percent of bothgroups said that they regularly used medication fornerves,
A study31 of factors relating to response in ahealth examination survey, based on data from CycleI of the Health Examination Survey,30 showed that36 percent of the unexamined people in that surveyviewed themselves as being in exceIIent health, com-pared with 31 percent of the examined people. Aself-appraisal of being in poor health was made by5 percent of the nonexamined persons and by 6 per-cent of those who were examined. Additionally, adifferent study of Cycle I datas 2 showed that com-parisons between two extreme groups-those whoparticipated in the survey with no persuasion andthose who participated onIy after a great deal of per-suasion–indicated that differences between the twogroups generally had little effect on estimates basedon numerous selected examination and questionnaireitems. This was interpreted as evidence that no largebias exists between the two groups for the items in-vestigated and was offered as further support for thebelief that little bias is introduced to the findings be-cause of differences in health characteristics betweenexamined and nonexamined persons.
As noted earlier, the data in this report are basedon weighted observations, and one of the componentsof the weight assigned to an examined person was anadjustment for nonresponse. Because the probabilitiesof participation are not known for sample pelsons inNHANES I, a procedure was adopted that multipliesthe reciprocal of the probability of selection of sam-ple persons by a factor that brings estimates based onexamined persons up to a level that would have beenachieved if all sample persons had been examined.This nonresponse adjustment factor is the ratio of thesum of sampling weights for all sample persons withina relatively homogeneous class defined by age, sex,and income within each stand to the sum of samplingweights for all responding sample persons within the’same homogeneous class from the same stand. Ifhomogeneous groups can be defined that are alsohomogeneous with respect to the characteristicsunder study, the procedure can be effective in re-ducing the potential bias from nonresponse.
NOTE: A list of references follows the text.
Examination surveys are subject to the loss ofinformation not orLIy through the failure to examineall sample persons, but also from the failure to obtainand record all items of information for examined per-sons (item nonresponse). In the case of Laboratoryfindings, missing data can result from such occur-rences as equipment failure, laboratory accidents,poor specimen preparation, and loss of specimens inthe mail between the examination locations andtesting laboratories.
Differential leukocyte count data are not availablefor 1,059 persons, or 15.3 percent of the 6,913 adultswho received the detailed examination during the100-location sample. White blood cell (WBC) countsfor 2,072 sample persons could not be reported fromthe NHANES I nutrition examination sample (stands1-65), and the counts for an additional 280 personswere discarded during quality control procedures dis-cussed in appendix IV.
After inspecting the age, sex, and race character-istics of that portion of the sample for whom WBCand/or differential leukocyte count data are missing,and after comparing these characteristics with thoseof the larger portion of the sample for which data areavailable, the assumption was made that the missingdata accounts for little bias because of the nonsys-tematic nature of the reasons for missing laboratorydata. Consequently, the weighted estimates that ap-pear in this report as means or percents reflect animputation for missing data; that is, the findings arepresented as if information had been gathered for allsample persons.
Small numbers
In tables 2-5 magnitudes are shown for cells forwhich the sample size is so small that the samplingerror may be several times as great as the statisticitself. In such instances the numbers have been in-cluded to convey an overall impression.
Reliability of estimates
Since the statistics presented in this report arebased on a sample, they will differ somewhat fromthe figures that would have been obtained if the sur-vey had been conducted on the complete population.In other words, the statistics are subject to samplingvariability y.
The standard en-or is primarily a measure of sam-pling variability, but it may also include part of thevariation that arises in the measurement process. Thestandard errors presented in tables 1, 7, and 9 havebeen calculated by a technique referred to as balancedrepeated replication. The need for this specializedtechnique for estimating standard errors arises becauseof the complexity of the sample design of NHANES I.
31

Estimates of standard errors are themselves subject toerrors that may be large if the number of cases whichthe estimates are based is small.
Utilization of standard errors
Two examples can illustrate the use of the stand-ard errors presented in tables 1, 7, and 9.
The first example demonstrates the use of thestandard error in testing the difference between esti-mated mean white blood cell (WBC) counts for twopopulation groups: white males ages 65-74 years andblack males in the same age group. A z statistic willbe computed as follows:
MeanStandard
Population group WBCerror of
(F)mean(o~)
White males ages 65-74 yearsl . . . 7.6 0.19Black males ages 25-74 yearsz . . 5.8 0.43
1 From tables 6 and 7,
2From tables B and 9,
First an approximation of the standard error ofthe difference between the two mean values is calcu-lated as follows:
Standard error of difference:
m
~yl - F2 = [(0.19)+ (o.43)1~ = 0.47.
Then the z statistic is computed as follows:
21 -22z– cr~1_y2
or
7.6- 5.8 = 383z=
0.47 “ “
As a matter of convenience, in this study a di~ffer-ence between two means was considered signifi~cantwhen z was equal to or greater than 2.00. Since z isgreater than 2.00 (z = 3.83), the difference betweenmean WBC counts for white and black males ages25-74 years is considered significant at the 95-percentconfidence limit.
In the second example, the standard error is, em-ployed to construct a confidence interval around theestimated mean WBC count for white males age;s 65-74 years as follows:
MeanStandard
Population group WBCerror of
(z)mean
(OF)
White males ages 65-74 years . 7.6 0.19
A 95-percent confidence interval is constructlsd asfollows :
or
7.6 ~ 1.96 (0.19),
which results in a confidence interval of 7.2-8.0.In other words, the probability that the popula-
tion value for the estimated mean WBC count forwhite males ages 65-74 years lies between 7.2 and 8.0is 95 percent.
32
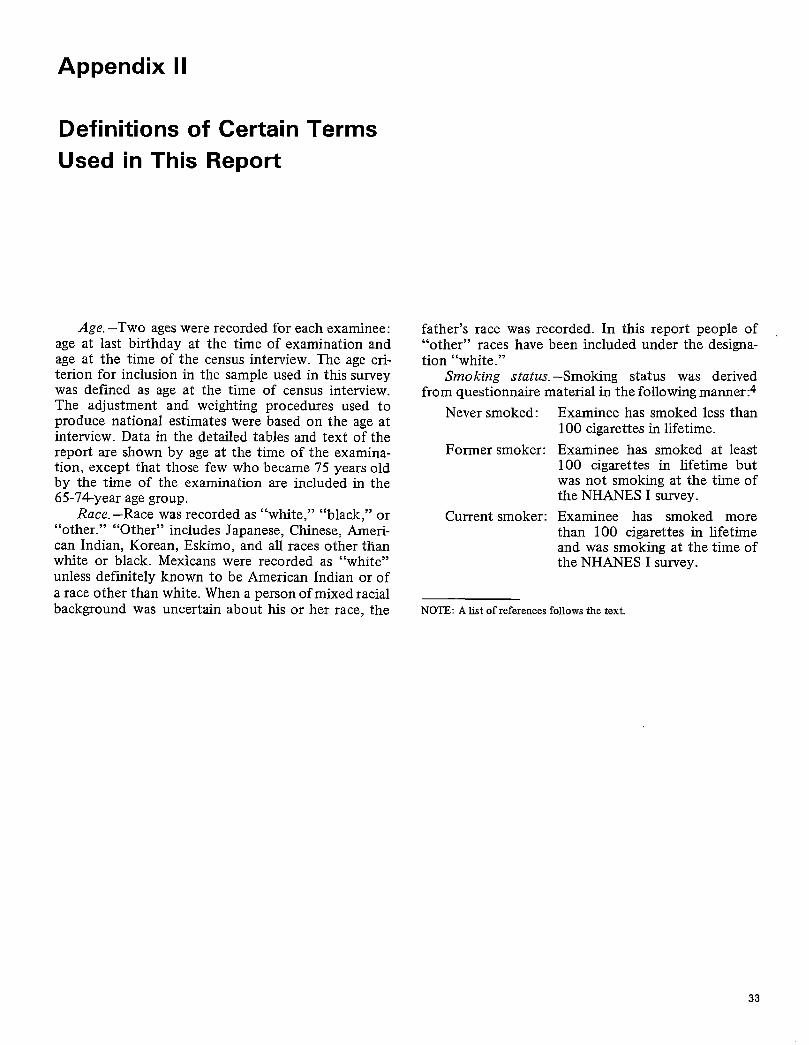
Appendix II
Definitions of Certain Terms
Used in This Report
Age. –Two ages were recorded for each exarninee:age at last birthday at the time of examination andage at the time of the census interview. The age cri-terion for inclusion in the sample used in this surveywas defined as age at the time of census interview.The adjustment and weighting procedures used toproduce national estimates were based on the age atinterview. Data in the detailed tables and text of thereport are shown by age at the time of the examina-tion, except that those few who became 75 years oldby the time of the examination are included in the65-74-year age group.
Race. –Race was recorded as “white,” “black,” or“other. “ “Other” includes Japanese, Chinese, Ameri-can Indian, Korean, Eskimo, and all races other thanwhite or black. Mexicans were recorded as “white”unless definitely known to be American Indian or ofa race other than white. When a person of mixed racialbackground was uncertain about his or her race, the
father’s race was recorded. In this report people of“other” races have been included under the designa-tion “white.”
Smoking status. –Smoking status was derivedfrom questionnaire material in the following manner:4
Never smoked:
Former smoker:
Current smoker:
Examinee has smoked less than100 cigarettes in lifetime.
Examinee has smoked at least100 cigarettes in lifetime butwas not smoking at the time ofthe NHANES I survey.
Examinee has smoked morethan 100 cigarettes in lifetimeand was smoking at the time ofthe NHANES I survey.
NOTE: A list of references follows the text.
33

Appendix Ill
Data Collection Methodology
White blood cell counts
White blood cell (WBC) counts were determinedin duplicate on the Coulter Fn, operated according tothe Coulter instruction manual,33 In the Coulter Fn,particles suspended in an electrolyte solution areforced by a mercury siphon through an aperture of100 microns. A current flows between an electrodeinside the aperture tube and a second electrode out-side the tube. As a particle passes through the aper-ture, an equal volume of electrolyte is displaced, andthe resistance in the path of the current changes, Thisproduces a voltage drop, the magnitude of which isproportional to the volume of the particle. The volt-age pulses are fed into a threshold circuit, which dif-ferentiates them by generating count pulses for onlythe particles that exceed the threshold level, thuscounting the number of particles in passage. A correc-tion factor for coincidence must be employed forcounts over 10,000.
Forty pL of blood were aspirated by a CoulterDiluter 1134 and dispersed into 20 UL of Isoton for a1 :500 dilution. Six drops of Zapoglobin were addedto the 1 :500 dilution, and the instrument count forwhite cells was performed. Corrections were made forreadouts above 10,000 with the Coulter coincidencechart. The (corrected) readout was multiplied by theappropriate factor to obtain the WBC count in N X109 /L (or, N X 103 /pL). Duplicate dilutions weretested, and results had to agree within a strict toler-ance level. Additionally, samples with mean valuesbelow 3.0 or above 15.0 X 10⁹/L were retested, andthe results were called to the attention of the person’sexamining physician.
The Coulter counter was monitored daily withcommercially available control materials. Backgroundcounts were less than 100, and maintenance was per-formed at each location, or stand. If the technicianhad reason to suspect that the instrument was notperforming correctly (for example, because of nearby
NOTE: A list of references follows the text.
34
electrical interference) he or she was instructed. tonote this on the laboratory recording form.
Personnel from the Hematology Division, Centersfor Disease Control (CDC) visited the mobile van:s toensure that procedures were properly performed.Duplicate peripheral blood smears were made fromblood presemed with EDTA by the wedge techniquewithin an hour after the sample was collected. Smearswere air dried and stained by using an Ames Hema-Tek slide stainer equipped with the Hems-Tek slainpack;3 5 this modified polychrome methylene bluestain is based on the original stain proposed byRomanowsky.36 During the time span covered, fivequalified medical technologists performed the 100-cell differential leukocyte counts. All data were re-ported to the National Center for Health Statistics(NCHS) for coding and storing on computer tapes.Abnormal results reported to NCHS were also for-warded to the examinee’s physician.
Peripheral blood smears: Cell-typing criteria
Although some degree of subjectivity on the partof the technologist performing the differential leuko-cyte count cannot be denie”d, in general, the followingterms and cell-typing criteria were adhered to:
Blast (myeloblast): With a‘ large round or cwalnucleus and nongranular darkblue staining cytoplasm. Nonuclear folds, fine purple-redchromatin strands, usuallyone or more nucleoli.
Promyelocyte: Resembling myeloblast Ibutwith primary bluish-to-purplegranules of various sizes andshapes in the cytoplasm.
Myelocyte: With round, oval, or flat-tened, nonindented, non-folded, nonlobulated nucleuswith ill-defined chroma!tin

strands. Lightly stained red- Eosinophils:dish secondary granules haveappeared among the darklystained primary ones.
Metamyelocyte: With indented or bean-shaped Basophils:nucleus in which the chroma-tin is more clumped. The pri-mary granules have disap-peared.
Band forms (stab neutrophils): With nuclei in- Mono cyte:dented but not yet clearlyseparated into interconnectedlobes.
Segmented forms (polymorphonuclear neutro-phds) : With clearly lobulated nuclei.
The lobes are interconnectedby means of tkeadlike fda-ments or strips, within themargins of which no nuclearchromatin is visible. Thechromatin within the lobes islumped and darkly stained.
With bright red-orange spher-ical granules and a nucleussegmented into two to threelobes.
With predominantly darkblue, densely stained granulesof various sizes, unevenly dis-tributed and also overlyingthe nucleus.
With bluish-gray cytoplasmand numerous small dustlikegranules causing an opaque,ground-glass-like appearance.The nucleus may be round,oval, indented, or lobulated,with brairdike convolutions.
Lymphocyte: Pale to bright blue staining,abundant or sparse cyto-plasm and rounded nucleuswith dense, clumped chroma-tin. No within-lymphocytedifferentiation was reported,such as atypical or reactive.
35

Appendix IV
Quality Control
Review of white blood cell count data
Mean white blood cell (WBC) counts by standswere calculated, graphed, and examined. Mean valuesat each stand were computed and examined forplausibility and were compared with preliminaryresults from NHANES II. All WBC counts less than3.3 X 109/L or greater than 14,2 X 10g/L werereviewed for transcription or keypunch errors. Dailyruns were evaluated in conjunction with conditions inthe mobile examination centers. Data from daily runswere excluded if the equipment malfunctioned andwhen control values were outside the limits of themanufacturer’s expected results. Data were also ex-cluded if manual dilutions caused shifts in the mean.Of the 23,808 cases for evaluation, 2,292 weremissing, primarily because of equipment failure, and280 were excluded because of questionable quality.
Peripheral blood smears
Quality control in the usual sense could not beimplemented on a daily basis because the stainedslides were accumulated at each survey location andsent to the Centers for Disease Control (CDC) aboutonce a month. In CDC’S Hematology Division theslides were classified as satisfactory and read, or theywere reported as unsatisfactory. If unsatisfactoryslides were received recurrently, additional onsitetraining was given to the technicians. If differentialresults were outside the accepted normal values,25 anadditional 100 whit e blood cells were classified. Inaddition, the morphologic evaluations of the slideswere compared with Coulter results.
All differential results were computer checked toascertain that the sum of the frequencies of the dif-ferent cell types totaled 100, and discrepant resultswere checked for transcription or keypunch errors. Ifno errors were found, the differential leukocyte countwas redone.
All results were further checked for plausibilityyaccording to the following criteria. 18>25 When url-common cell types including blast cells, promyelcl-cytes, myelocytes, and metamyelocytes were re-ported, the results were verified. If the percents ofother cell types reported fell outside the acceptableranges, these results were also reviewed. The accepta-ble ranges are as follows:
Cell type Acceptable range
Band neutrophils . . . . . . . . . . . . . . . 0-10 percent
Segmented neutrophils. . . . . . . . . 27-85 percent
Eosinophils . . . . . . . . . . . . . . ,.. , 0-12 percent
Basophils . . . . . . . . . . . . . . . . . . . . 0-3 percent
Monocytes . . . . . . . . . . . . . . . . . . . 0-12 percentLymphocytes . . . . . . . . . . . . . . . . . 10-70 percent
A computer reject-listing of 65 results was obtained.A number of transcription or keypunch errors werefound, one case of chronic lymphocytic leukemia andlone case of chronic myelocytic leukemia were identi-fied, and 47 results were verified– 15 by 200-cellldifferential counts. Of 6,913 persons examined in the100 stands, satisfactory slides were obtained for5,854 persons (85 percent). The 1,059 examinees forwhom data are not presented were excluded for thefollowing reasons: no slide obtained, slide obtainedbut not read because of poor cell distribution, slidebroken in the mail, or slide lost in the mail. Thelargest IOSSwas from poor slide preparation, as men-tioned earlier. This necessitated excluding all slidesfrom three entire stands.
NOTE: A list of references follows the text.
36

al and Health Statistics series descriptions
SERIES 1. Programs and Collection Procedures.-Reports describing
the general programs of the National Center for Health Statistics and its offices and divisions and the data col- lection methods used. They also include definitions and other material necessary for understanding the data.
long-term care, ambulatory care, hospital care, and family planning services.
SERIES 2. Data Evaluation and Metbods Research.-Studies of new statistical methodology including experimental tests of new survey methods, studies of vital statistics collection
methods, new analytical techniques, objective evaluations of reliability of collected data, and contributions to sta-
tistical theory.
SERIES 14. Data on Health Resources: Manpower end Fecilities- Statistics on the numbers, geographic distribution, and characteristics of health resources including physicians,
dentists, nurses, other health occupations, hospitals,
nursing homes, and outpatient facilities.
SERIES 15. Data From Special Surveys.-Statistics on health and health-related topics collected in special surveys that
are not a part of the continuing data systems of the
National Center for Health Statistics. SERIES 3. Analytical and Epidemiological Studies.-Reports pre-
senting analytical or interpretive studies based on vital and health statistics, carrying the analysis further than
the expository types of reports in the other series.
SERIES 4. Documents and Committee Reports.-Final reports of
major committees concerned with vital and health sta- tistics and documents such as recommended model vital
registration laws and revised birth and death certificates.
SERIES 20. Data on Mortality.-Various statistics on mortality other than as included in regular annual or monthly reports.
Special analyses by cause of death, age, and other demo- graphic variables; geographic and time series analyses;
and statistics on characteristics of deaths not available
from the vital records based on sample surveys of those
records.
SERIES 10. Data From the National Health Interview Survey.-Statis- tics on Illness, accidental injuries, disability, use of hos-
pital, medical, dental, and other servrces, and other health-related topics, all based on data collected in the continuing national household Interview survey.
SERIES 11. Data From the National Health Examination Survey and the National Health and Nutrition Examination Survey.- Data from direct examination, testing, and measurement
of national samples of the civilian nonrnstitutionalized
population provide the basis for (1) estimates of the
medrcally defined prevalence of specific diseases in the
United States and the distributions of the population
with respect to physical, physiological, and psycho- logical characteristics and (2) analysis of relationships
among the various measurements wrthout reference to
an explicit finite universe of persons.
SERIES 12. Data From the Institutionalized Population Surveys.-Dis- continued in 1975. Reports from these surveys are in- cluded in Series 13.
SERIES 13. Data on Health Resources Utilization.-Statistics on the utilization of health manpowr and facilities providing
SERIES 21. Data on Natality, Marriage, and Divorce.-Various sta- tistics on natality, marriage, and divorce other than as
included in regular annual or monthly reports. Special
analyses by demographic variables; geographic and time series analyses; studies of fertility; and statistics on characteristics of births not available from the vital records based on sample surveys of those records.
SERIES 22. Data From the National Mortality and Natality Surveys.- Discontinued in 1975. Reports from these sample surveys
based on vital records are included in Series 20 and 21,
respectively.
SERIES 23. Data From the National Survey of Family Growth.- Statistics on fertility, family formation and dissolution,
family planning, and related maternal and infant health topics derived from a periodic survey of a nationwide probability sample of ever-married women 1544 years of age.
For a list of titles of reports published in these series, write to:
Scientific and Technical Information Branch National Center for Health Statistics Public Health Service
Hyattsville. Md. 20782