“total quality. control” describes only part of what the ... · pdf...
TRANSCRIPT

“Total quality. control” describes only part of what the Japanese mean by company-wide quality control
bY L.P. Sullivan
APANESE-STYLETOTALQUALUYCCMTROL (TQC)isdifferent than traditional U.S. TQC, and therefore Japanese
managers have coined the pfuase “company-wide quality control” (CWQC) to distinguish this difference. The Japanese use TQC to reter to a I~~TGVJ~~ cxxe?t. Kaoru Ishikawa de- fines TQC as the “system for integrating quality technologies into V&i+G;lS fr;nctiX!;! rlq::-tn?nt5 !i.c., engineering, production, sales, and se. rvirre! to xhieve customer satis- faction.” By contrast, ishlksjm ccrines CWQC as a means to “provide good and low cost products, dividing the bene- fit among consumers, employers, and stockholders while im- proving the quality of people’s lives.“’
In addition, the Japanese !?ave developed a specification for CWQC. It appears in Japan Industrial Standard Z8101-1981, as the definition of quality control: “a sys- tem of means to economicaily produce goods or services which satisfy customers’ requirements.” Further, the stan- dard states that “implementng quaiity control effectively necessitates the cooperation of all people in the company,
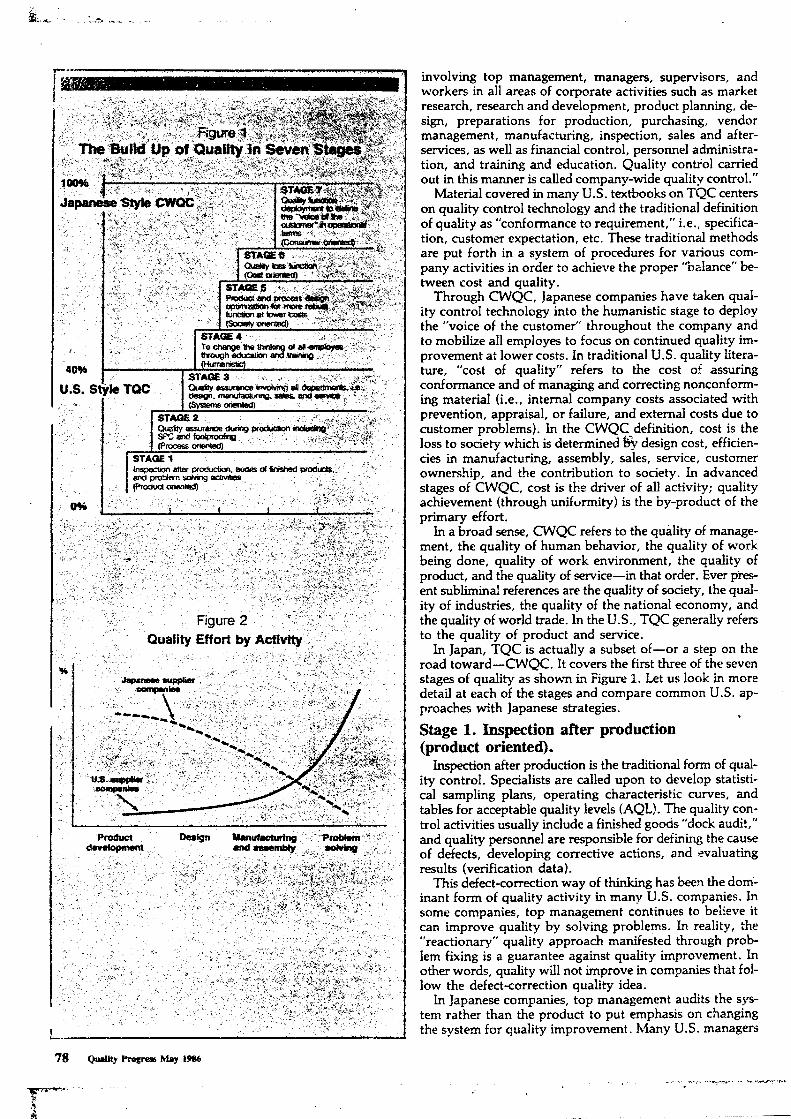
involving top management, managers, supervisors, and workers in all areas of corporate activities such as market research, research and development, product planning, de- sign, preparations for production, purchasing, vendor management, manufacturing, inspection, sales and after- services, as well as financial control, personnel administra- tion, and training and education. Quality control carried out in this manner is called company-wide quality control.”
Material covered in many U.S. textbooks on TQC centers on quality control technology and the traditional definition of quality as “conformance to requirement,” i.e., specifica- tion, customer expectation, etc. These traditional methods are put forth in a system of procedures for various com- pany activities in order to achieve the proper ‘balance” be- tween cost and quality.
Through CWQC, Japanese companies have taken qual- ity control technology into the humanistic stage to deploy the “voice of the customer” throughout the company and to mob&e all employes to focus on continued quality im- provement at lower costs. In traditional U.S. quality iitera- ture, “cost of quality” refers to the cost of assuring conformance and of managing and correcting nonconfonn- ing material (i.e., internal company costs associated with prevention, appraisal, or failure, and external costs due to customer problems). In the CWQC definition, <cost is the loss to society which is determined b$ design cost, efficien- cies in manufacturing, assembly, sales, service, customer ownership, and the contribution to society. In advanced stages of CWQC, cost is the driver of all activity; quality achievement (through uniformity) is the by-product of the primary effort.
In a broad sense, CWQC refers to the quality of manage- ment, the quality of human behavior, the quality of work being done, quality of work environment, the quality of product, and the quality of service-in that order. Ever pies- ent subliminal references are the quality of society, the qual- ity of industries, the quality of the national economy, and the quality of world trade. In the U.S., TQC generally refers to the quality of product and service.
In Japan, TQC is actually a subset of-or a step on the road toward-CWQC. It covers the first three of the seven stages of quality as shown in Figure 1. Let us look in more detail at each of the stages and compare common U.S. ap- proaches with Japanese strategies. . Stage 1. Inspection after production (product oriented).
Inspection after production is the traditional form of qual- ity control. Specialists are called upon to develop statisti- cal sampling plans, operating characteristic curves, and tables for acceptable quality levels (AQL). The quality con- trol activities usually include a finished goods “dock audit,” and quality personnel are responsible for defining the cause of defects, developing corrective actions, and evaluating results (verification data).
This defect-correction way of thinking has been the dam: inant form of quality activity in many U.S. companies. In some companies, top management continues to believe it can improve quality by solving problems. In reality, the “reactionary” quality approach manifested through prob- lem fixing is a guarantee against quality improvement. In other words, quality will not improve in companies that fol- low the defect-correction quality idea.
In Japanese companies, top management audits the sys- tem rather than the product to put emphasis on changing the system for quality improvement. Many U.S. managers
) ..- _.. .~...~~.,~.. .I a..-,“_l.” .T.~ : .

are obsessed with auditing the finished product, which en- courages a never-ending reactionary cycle to correct prob-
ems. Quality assurance by inspection never deals with the abnormalities of the process, since they are always hidden. As a result of this thinking, U.S. managers never really get around to changing the process.
The questions management asks are very important in mobilizing efforts to improve quality. A traditional man- ager might ask subordinates to “list the top ten customer problems and give me a corrective-action plan on each.” This leads the whole organization on a witch-hunt to determine causal factors and corrective actions. By asking a different question-‘What is the process capability and what are you doing to reduce variability?“--the manager can lead the or- ganization in a direction that will result in quality im- provement.
One of the important things to learn from Japanese com- panies is the way in which management directs CWQC ef- fort. Figure 2 illustrates the difference between U.S. companies and Japanese companies in this regard. The graph shows the relative quality involvement at various stages in the product cycle (product development, design, manufac-
Iring, and problem solving). The majority of quality ef- lort in U.S. companies is directed toward problem solving, with a limited amount of quality effort in the product devel- opment and design stages. The opposite is true in Japanese companies.
Stage 2. Quality control during production (process oriented).
Quality assurance during production is based primarily on statistical process control, which is now very popular. Some U.S. companies are making significant productivity gains through the use of SPC while other companies are not improving at all. Why is this?
There seem to be two major inhibitors preventing more aggressive improvement by U.S. companies: l Improper use of SPC methods. l Lack of knowledge in product and process design optimi- zation. Both of these inhibitors can be mitigated through education and training, which rr@st begin with top management. Ele- lnents of education and the knowledge required for prod-
:t and process design optimization will be covered below; in the remaining portion of this section, we will talk about the first inhibitor: improper use of SPC.
ln the auto industry -no matter what company you talk with-everyone will say, ‘We have SPC.” Many of these people are unaware of the many pitfalls to proper use of SPC. SPC in the Shewhart sense is different from SPC nor- mally practiced in U.S. companies. ln fact, many of the ap- plications we see today have very little value with regard to quality improvement.
The most common and also the most serious pitfall is the idea that SPC is a technique or method to control process output. When you talk with production operators who use control charts and ask them the purpose of control limits, etc., they will frequently say things like, “Our job is to watch the process. When parts go outside of the control limits or begin to trend toward the control limit, we make process adjustments to center the process. As long as we keep the process output within the control limits, we are OK (i.e., perfect quality).”
This kind of thinking doesn’t fully recognize the power di control charts. ln the Shewhart sense, the power of a con- trol chart lies in its ability to help identify the causes of varia-
. . .
: :, -.
: .,’ I ; i ‘:
.-- 1. .t
. ..y. lL .,
i_.. *,,
Three Points of Quality -# . . . _ .; ‘, > . 1 -._ 1.T~ -., -
l Experience in the field (customer defects or warranty cost) is not a good method to measure qdity. Efforts to define and correct field problems can be better rewarded by improving process capa- biliti& and reducing variation. Although we must
. correct major field problems that come to us, we shouId not look for minor probIems’ as a way of improving quality. The design intent should be ex- pressed as target values, not as engineering or manufacturing tolerances. Designs must be “robust” against environment, deterioration in product, and part-to-part variability.
2 0 f It is important in quality improvement to evaluate the system of product development. ‘Most problems can be prevented during product devel- opment through product ,and process design optimi- zation. Also, through design optimization, companies should focus on “what the customer likes” about the product rather than “fixing what he doesn’t like (i.e., probIem solving).”
As a result of design optimizing effort, customers’ affection for the product should increase during service. Continual quality improvement and cost reduction can only be realized in this manner.
3 c Engineering optimization with confirmato- ry experimentation is different than product test- ing. The “voice of the customer” must be deployed horizontally (not vertically) through the total com- pariy. The result of horizontaI deployment can only be evaluated through confirmatory experimenta- tion. Product testing is for verification after the product has been designed and built. l If there are many changes during product devel- opment (and late changes), product quality is usual- ly bad and cost will be high. 8 If there are few changes during product develop- ment, product quality will be either very bad or very good. l If there are few changes during product develop- ment and no confirmatory experimentation, prod- uct quality most likely will be bad and cost will be high. l If there are few changes during product develop ment with many confirmatory experiments, prod- uct quality most Iikely will be good and costs will be low.
., . .

_ _ -. *a bII- __.. -. -._-. L_. I. . ,,1
Figure 3 The Weave of Quality
i President
voice of the
CUStOlTW St&i I
I
! rrW”cl
1 1 Phnlnc If mn I
I 1 1 I I I I ( CWOC Promotm Achvm,
I I i i I ’ Eoucaten and Trmng
I t I I i I i I I I 1 i Ouality Function Deployment
I
1 i I 1 I I I I ’
IF-- Management Audll
I I i 1 i I .’ I I I I 1
OC Rasaarch Group I
-e ,
1OOs(-
75*-
509(-
259b-
P%-
1
Figure 4 Japanese Quality Evolution
Quality contribution due to inspection
contribution :
due lo process and product design
_ ” -. . ^
bility and to separate common causes from special causes in such a way that workers, engineers, and management can
change the process to reduce variability. Therefore, it is im- portant and desirable to have some points outside of the con- trol limits because these points represent causes of variability that management can react to. If there are no points out of limits, there will be no action to improve.
The Shewhart rule for a process in control is to have two thirds of the points within one third of the limits and some points outside of the limits-we always want some points outside of the limit. When we see control charts with all points within limits and close to the average, we know the people in charge do not understand the full power of these statistical methods.
Any process can be made to look in control by changing the sampling method used. The whole idea is to try differ- ent sampling schemes to achieve the Shewhart result -two thirds of the values within one third of the limits, with some points outside the limits. The next step is to change the process, thereby bringing all points within limits, and then resample to show some points out of limits. The main-advantage is to constantly reduce variability by improving the process capability which is reflected in changes taking place in con- trol limits (wide to narrow).
Stage 3. Quality assurance involving all departments (systems oriented).
The systems-oriented approach to quality has been popu- lar for many years in U.S. companies. In some cases the company structure has been changed to reflect this think- ing: Separate organizations have been created to perform a systems engineering function and interact with (or pull to- gether) the various activities associated with design, manufacturing, and assembly. Conceptually, this is a good idea but success has been limited due to a management fo- cus on problem solving (discussed earlier) and the lack of statistical knowledge. Quality teams formed to foster inter- action with design, manufacturing, and assembly have been very effective at resolving major problems, but they have been less effective in mob&zing effort for continual quality improvement.
In many U.S. companies there is a rather significant in- hibition to more successful use of the quality team concept: strong vertical departments with separate performance ob- jectives. Kaoru Ishikawa has pointed out that U.S. compa- nies are typically very strong vertically and somewhat weak horizontally; this characteristic effectively prevents the nat- ural development of CWQC. U.S. companies are organized into separate functional departments and quality control is usually identified with manufacturing and assembly activi- ties. In Japanese companies the horizontal interaction is very strong with quality control evident in all activities, as shown in Figure 3.
Ishikawa likened this characteristic difference to the weav- ing of cloth, where it is important to have a horizontal weave equal to the vertical weave. In local areas of the cloth where you desire extra strength (i.e., elbow and knee) it is neces- sary to increase weave patterns both horizontally and ver- tically. When looking at the weave of U.S. companies, we often see strong vertical organizations which tend to weaken horizontal interaction. As Ishikawa mentioned, cars are built horizontally and he is often puzzled by what he sees as weak horizontal structures. The essence of Japanese style CWQC is to deploy the “voice of the customer” horizontally-not vertically-throughout the company. We will discuss this in more detail under Stage 7.

.” , . f.
1 .I’ i2.d ._ ._ . . ,- -
Stages 1, 2. and 3 make up what the Japanese refer to as the quaiity control technology aspect of CWQC. In the U.S., . as we have seen, this is called TQC. Many U.S. companies have demonstrated considerable quality improvement in re- cent years through the use of TQC. U.S. management deserves a great deal of credit for this. But a nagging prob- lem in today’s market is less a quality issue and more a cost issue: many U.S.-made products simply cannot compete in cost with Japanese imports. This is a very serious problem and one that is cleverly addressed (by the Japanese) through CWQC. The remaining stages in CWQC have contributed greatly to Japanese quality but they also have played a sig- nificant role in reducing costs. In fact, the driving force be- hind the development of these methods in Japan has been cost improvement to be more competitive in world markets.
Stage 4. Education and training (humanistic aspect of quality).
The Japanese always talk about both education and train- ing, and the majority of their effort is on education. They un- derstand that only through education can you change the way oepple think; training is done merely to improve skills. Japa- tese executives realize the limitations of formal education
through universities, and therefore they put great effort into continuing education to change the thought process of all em- ployes. “If you hire people on the basis of how smart they are,” this line of thought holds, “then all you ever get from them is what they started with. On the other hand if you hire people on the basis of how they think, you always get more from them by expanding their knowledge through education.”
In U.S. companies it is rare to educate people after univer- sity graduation-beyond a few seminars here and there-while in Japan, education, contiiual education, is part of the work process. Education and training in Japanese companies absorb on the average eight hours per week for every employe, with half on company time and the other half on the employe’s time. This includes the development and presentation of case studies for quality and cost improvement.
I believe that the single most important contributing factor to Japanese successes in world markets is their system for ~&~h~trai$rtp$ employes on a continuing basis. This
axmuze the human contribution-the most rowerful resource in any company. On a recent study mis-
sion to Japan, we spent considerable time with Masao Nemo- to, the president of Toyoda Gosei. Nemoto told us that in Japan, personal capability is more important than process capability, and the main job of management is to improve the personal capability of all employes through education and training. Each employe has an annual task to improve his knowledge in specific areas of quality technology, and results are measured on a performance chart. Employes are told that improving themselves is their most important job; “process and product improvement will flow automatically from per- sonal improvement,” Nemoto believes.
One might wonder how education and training are reflected in lower manufacturing costs. There are two ways in which this happens. The ,&t is through product and process design optimization, where a different level of technical knowledge is needed (Stages 5-Y). The second and less obvious impact is on the organizational span of control. In the Japanese way of thinking, employes at all levels can operate more indepen- dently if they are properly educated and trained. This has a direct impact on the number of employes and on the number
i organizational levels between line workers and top manage- ment, which we refer to as span of control. There have been many very good studies to report the differences in span of
control between U.S. and Japanese companies. Efforts to co:jy the Japanese structure, however, have not been too successful.
Education and training in Japanese plants are major reasons why they can operate efficiently with a large span of control. Everybody knows his or her job, workers have flexibility (through skills training) to move quickly to a different job, and very little supervision is required; the workers are trained to be independently responsive to changing conditions. Ishika- wa told us that the ideal span of control is 100 workers for , each supervisor, although he admitted that this goal has not yet been achieved in Japanese plants. He also stressed that ideal levels can never be achieved without continuing education and training. We know how manufacturing cost can be reduced by increasing the span of control; now we can see how to achieve this while improvii quality at the same time.
One education tid training strategy commonly used is for technical training to be done by the manager rather than by separate trainers. Top management trains their immediate -+
c,tic”
subordinates who train their immediate subordinates and so on. Managers sometimes try to avoid this task and convenient- ly plan to be absent; nevertheless, top management requires them to train so they must do it sooner or later. One can see some real bertefits in this since managers must know the ma- terial in order to train. Also, subordinates recognize true management commitment and credibility through this system. This strategy has been adopted in some American companies, including Xerox Corp.
Another very important aspect of education and training in Japanese companies is job rotation for executives and managers. This greatly enhances broad knowledge and also helps to facilitate horizontal interaction (weave of the cloth) by developing common understanding of interdepartmental issues. It is not unUsual for d sales executive to rotate with piant managers or for design engineers to rotate with purchas- , ing agents. In U.S. companies, job rotation is generally intra- functional which tends to limit knowledge to vertical specialty areas and inhibit horizontal interaction. The Japaese concept of education and training goes beyond traditional quality tech- nology and centers on changing the way people think through education and expanded job knowledge.
Without intense education and training, CWQC cannot de- velop. Stage 4, therefore, is really the first step in the sequence of developing CWQC; the next stages are impossible without it.
Stage 5. Product and process design optimization for more robust function (society oriented).
Design optimization is a very powerful way to assure iow cost and high quality. One of the most significant develop- ments to come out of Japan has been the methods of design optimization developed by Genichi Taguchi, who received the Deming Prize in 1960 for the development of practical statiiti- cal theory. Donald P. Clausing from MIT and Xerox Corp. has described the Taguchi method as follows. ‘The Japanese are welI known for their ability to engineer quality into basic designs. A definition of quality that comes from Japan looks at this nebulous and elusive term as the characteristic that avoids a loss to society from the time the product is shipped. The loss is measured in terms of yen or dollars and is linked to the hard technology of the product. Through this defini- tion, the Japanese engineer becomes ‘bilingua!’ as prescribed by J.M. Juran. The loss function allows the engineer to speak the language of things and money.
“Because the Japanese all speak the same quality language, quality is not a problem reserved for the QA or QC depart-

ment nor only the manufacturing division. Quality is infused into all aspects of a product’s life and an inherent philosophy that is integrated throughout the entire corporate structure.
‘We in the USA have a tendency to exclude Quality Con- trol from our R&D engineering activities. This behavior emerges from a belief that QC equates with only control charts and process control. The Japanese have, through the efforts of Genichi Tag&i, built quality methods into the engineer- ing process. Taguchi’s methods are more than techniques of experimental design and analysis. He has a complete and in- tegrated system to develop specifications, engineer to these specifications and manufacture the product to specification.“2
The thinking behind Taguchi Methods and steps to follow are outlined below.3
1. The external customer will buy a product that is: l Desirable to own and meets intended purpose (custo- mer affection for product must increase during service). l Functional and robust against environment (changes in temperature, humidity, road conditions, etc., that cause functional variation), deterioration (changes in product due to wear, looseness, etc., that cause functional varia- tion), and variation (differences between products that cause functional variation). l better than competitive products for features and style, and for cost to buy and cost to own.
2. Objectives of external customer are achieved through: l Optimizing product and process design for improved quality at lower cost. l Use of the quality loss function to quantify quality im- provement in terms of cost and for use in tolerance design. l Quality function deployment-“voice of the customer” deployed through internal customers in planning, prod- uct design, process design, production, and sales and service.
3. Steps: 8 System development. l Parameter design. l Tolerance design.
4. Me+hods: l Orthogonal arrays. l Linear graphs. l Quality loss function.
5. Concepts: l The result of the analysis does not need to be the best (statistical validity or optimum level) but it needs to be better, quicker (i.e., 50% result in 10 days is worth more than 90% result in 200 days). l SmaIl incremental improvement over a large number of products and processes has greater cumulative effect than larger improvement on known problems.
Let us look at an ITT case study involving Taguchi methods. Tlnis case study originated as a cost improvement project on automotive wire harness assemblies. The process in question was a resistance welding operation for splicing together com- mon electrica! circuits. Design cost included a destructive pull test of five splices per hour which cost $300,000 per year in four plants. A study to o?timize the existing process with 11 parameters was developed using Taguchi orthogonal array L27. The alternative would have been to develop ultrasonic weiding, which would have required a new process with the associated capital expendities and facility investment. Results of this process optimization study were available in about four -lays of analytical work by two e,ngineers. The confirmatory rxpetiment added another day. After optimizing the process, the strength of the weld splice exceeded the wire core strength.
Two things happened as a result.
82 Quality Prqy-es May 1986
l ITT was able to discontinue the pull test at cost savings of $300,000 per year. This improvement is being applied by all Ford wire harness suppliers; anticipated savings are $1 mil- lion per year.
l Quality improved. Even though the specification was be- ing met at an 8 sigma level, there was a low-frequency latent failure rate caused by assembly plant operators pulling the har- ness through sheet metal sealing grommets. These latent failures have now been eliminated since the weld splice strength exceeds the wire core strength. One can see where cost is the driver to optimize product and process design, while quality is the windfall benefit. (See Figure 4.)
Stage 6. The Taguchi loss function (cost oriented).
Clausing offers a definition of quality in terms of the loss function. “Quality loss is the financial loss imparted to society after a product is shipped [including internal costs, whether the product is shipped or not]. It is measured in monetary units and is related to quantifiable product characteristics. Two products that are designed to perform the same function may both meet specifications, but can impart different losses to soci- ety. Therefore merely meeting specifications is a poor meas- ure of quality. Q
“Taguchi defines quality loss via his loss function. He unites the financial loss with the functional specification through a quadratic relationship . . .“4 The real power in the loss function is its impact on changing the way we think about quality and the methcds we use to fund quality im- provements that normally do not meet the traditional pay- back guidelines.
The loss function formula is as follows: Loss = K (mean squared deviation)
That is, L(y)=K(y-m2). In this formula, L equals the loss to society caused by deviation from the nominal. K is a con- stant developed by the individual company intending to use the loss function; it is a composite cost made up-ideally-of all internal costs, warranty and field costs, the cost to cus- tomers, and the cost to society. For a company just starting to use the quality loss function, it is not important that K represent the full loss to society; in fact, attempting to de- velop such a full cost will almost certainly prevent the loss function from ever being used. When starting out, a com- pany should limit itself to its internal costs, along with war- ranty and field costs; as the company gains experience, it can begin to try to quantify the loss to customers and the loss to society.
What is ‘loss to society”? An example may help clarify the concept. Japanese farmers use sheets of vinyl to protect crops from storms. A Japan Industrial Standard spelled out the limits for the product. A manufacturer of vinyl sheet- ing worked to reduce variation in the production process, resulting in a very narrow distribution. The manufacturer then centered that distribution at the low end of the specifi- cation limit, producing a sheeting that was very uniform, but just barely within tolerance limits. The manufacturer reduced costs by doing this.
The result was three losses. First, the product tore because it could not withstand the wind; the vinyl sheeting itself was the first loss. Second, farmers suffered losses as a result of crop damage. Third, the reduction in the supply of crops caused prices to rise, resulting in a loss to society, which had to absorb the additional cost.
The result of the loss function calculation will be that, in such situations, the loss to society is always greater than the manufacturer’s gain. The Japanese call such a manufac-

- turer “worse than a thief”: If a thief steals $10, he gains the &ire $10; but the manufacturer will take more from soci-
.:ty than the manufacturer will gain by deviating from the nominal. (Upon receiving complaints, the Japanese vinyl sheeting association specified and agreed to adhere to an average thickness of one millimeter-the nominal.)
As is clear from this example, the loss function is built on a definition of quaiity as “uniformity around a target val- ue.” Specification limits are, for this purpose, irrelevant. Why? Because we are interested in the overall loss caused by a product and that loss becomes greater the more the product deviates from the target value-regardless of wheth- er it is within spec. This is very clear when we look at “toler- ance stack up.” Think of a car door as the car is being assembled. To produce a door with a tight fit and a good appearance, operators must join together many individual parts. But if one part is at the high end of the spec limit, and the adjacent part is at the low end of its limit, the two parts may not fit weIl together. The result is special (finesse) work to get everything to fit. When all parts are manufac- tured around a target value, this problem does not arise.5 4 recent study by Ford showed that transmissions with parts
oser to target values functioned better and operated more quietly than those with parts “within specification” but spread farther from the target value.
The loss function offers a way to quantify the benefits achieved by reducing variability around the target. It can help justify a decision to invest $5o,oo0 improving a proc- ess that is already capable of meeting spec. As we can see in this case, the concept of conformance to spec becomes a barrier to quality improvement.
More and more Japanese companies are using the loss function to justify quality improvement. At Nippondenso, for example, the estimated savings from three quality im- provement projects was calculated by traditional methods and then by using the loss function. According to the tradi- tional method, the three projects-improvements in a ma- chine rotor shaft outer diameter machining process, a method plate boring process, and a material shaft press fit process-would have saved a total of 8,576,OOO yen. Loss function calculations,? however, revealed a savings of 85,460,OOO yen-almost a tenfold increase.
The loss function has the unique advantage of overcom- .,tg the cost controi system which is an internal company inhibitor to quality improvement. Most U.S. companies are managed by financially oriented executives who have im- posed financial pay-back guidelines which improvement ac- tions must meet. These guidelines have often prevented quality improvement. By using the loss function, however, we can often justify the investment in improved quality.
The loss function can also help set priorities for quality improvement, as another example from Nippondenso shows. The company analyzed improvement opportunities for 43 characteristics in nine processes. Thirty-six had capa- bility greater than 8 sigma, five from 6 sigma to 8 sigma, and two below 6 sigma. The conventional defect-oriented method of quality improvement would have emphasized ef- fort on the seven processes with capability levels less than 8 sigma. The loss function analysis revealed that the top pri- ority for improvement should be a process with the 10 sig- ma process capability because that process showed the highest loss. Normally, in a U.S. company, a process oper- *&ion with 10 sigma capability would never receive quality
.provement priority. However, the Japanese think differ- ently; to them, quality means low cost as well as uniformi- ty around target values.
This is a very important concept. U.S. companies muc’ . be competitive in cost as well as quality. Therefore, prod-
uct and process designs must be cptimized to improve both cost and quality; this refers to all products and all processes -not just those with obvious quality deficiencies. This concept can be translated into operation through the Taguchi loss function.
Stage 7. Quality function deployment to define the “voice of the customer” in operational terms (consumer oriented).
QFD is a design approach that brings quality control to product development. It is a formal mechanism for assur- ing that “the voice of the customer” is heard throughout development, It also identifies specific means for assuring that customer requirements are achieved by all functional activities of a company.
The customers’ needs expressed in their own words-“the voice of the customer”-are original information which of- ten must be translated into technical language. If the cus- tomer is a manufacturer of industrial goods, that manufacturer can generally identify its.own primary re- quired quality characteristics. The buying public, howev- er, often mentions second- or third-level requirements when asked what it wants. For example, airline passengers might say that they want to arrive on time or to eat well prepared food (second- or third-level requirements) and say nothing about the safety of the flight (obviously a primary require- ment). Because consumers’ requirements are incompkte, companies must fill in the gaps revealed by the required quality matrix. The companies often must work back from second- or third-level requirements to primary ones.
Various tables trace the way QFD is implemented in the stages of development and production. Although the tables are very complicated, their mission is simple: to establish a systematic way of assigning responsibilities to deploy the voice of the customer and to translate these requirements into design and manufacturing parameters. What is impor- tant is to incorporate QFD activities as a part of CWQC activities and carry them out systematically and continual- ly as routine functions. Only on such a basis can these tools prove effective. The determination of projected quality values at the time of new product development involves cor- porate product strategy. Conflicting design requirements also call for high level corporate strategy. Both activities require the positive involvement of top management. (QFD will be explained in more detail in next month’s Quality Progress. )
Footnotes 1. These definitions are taken from a paper by Kaoru Ishikawa
entitled “What Is Company-Wide Quality Control?” This paper was presented to Ford executives in May 1983.
2. This material is taken from a paper by Donald P. Clausing, “Quality Engineering-By Design.” The paper was presented at the 40th Annual Rochester Section Qua!ity Control Cenierence on March 6, 1984.
3. For more detail on Taguchi methods, see the October 198.5 issue of The Journnl of Quality Technology.
3. For a more complete discussion of this subject, see L.P. SuI- liven, “Reducing Variability: A New Approach to Quality,” July 1984, pp. 15-21.
5. Ibid. About the Author
Lawrence P. Sullivan is manager of reliability, warranty, and SQA, Bodv and Assembly Operations, Ford Motor Co., Dearborn, Mich. He;s also chairman of American Supplier Institute.