total maximum daily loads for selected streams in the middle ohio river … · 2013-01-23 ·...
TRANSCRIPT

Total Maximum Daily Loads for Selected Streams in the Middle Ohio River South
and Middle Ohio River North Watersheds, West Virginia
December 2012

ii
CONTENTS
Acronyms, Abbreviations, and Definitions ............................................................................... vii
Executive Summary .......................................................................................................................x
1.0 Report Format ....................................................................................................................1
2.0 Introduction ........................................................................................................................1
2.1 Total Maximum Daily Loads ...................................................................................1
2.2 Water Quality Standards ..........................................................................................4
3.0 Watershed Description and Data Inventory....................................................................5
3.1 Watershed Description .............................................................................................5
3.2 Data Inventory .........................................................................................................9
3.3 Impaired Waterbodies ............................................................................................11
4.0 Biological Impairment and Stressor Identification .....................................................23
4.1 Introduction ............................................................................................................23
4.2 Data Review ...........................................................................................................24
4.3 Candidate Causes/Pathways...................................................................................24
4.4 Stressor Identification Results ...............................................................................26
5.0 Metals Source Assessment ...............................................................................................30
5.1 Metals Point Sources..............................................................................................315.1.1 Mining Point Sources .................................................................................345.1.2 Non-mining Point Sources .........................................................................355.1.3 Construction Stormwater Permits ..............................................................355.1.4 Municipal Separate Storm Sewer Systems (MS4) .....................................38
5.2 Metals Nonpoint Sources .......................................................................................405.2.1 Abandoned Mine Lands .............................................................................405.2.2 SMCRA Bond Forfeiture Sites ..................................................................405.2.3 Sediment Sources .......................................................................................43
6.0 Fecal Coliform Source Assessment .................................................................................45
6.1 Fecal Coliform Point Sources ................................................................................456.1.1 Individual NPDES Permits ........................................................................456.1.2 Overflows ...................................................................................................456.1.3 Municipal Separate Storm Sewer Systems (MS4) .....................................456.1.4 General Sewage Permits ............................................................................46
6.2 Fecal Coliform Nonpoint Sources .........................................................................46

Middle Ohio River South and North Watersheds TMDL Report
iii
6.2.1 On-site Treatment Systems ........................................................................466.2.2 Urban/Residential Runoff ..........................................................................506.2.3 Agriculture .................................................................................................506.2.4 Natural Background (Wildlife) ..................................................................50
7.0 Sediment Source Assessment ..........................................................................................51
8.0 Modeling Process .............................................................................................................51
8.1 Model Selection .....................................................................................................51
8.2 Model Setup ...........................................................................................................528.2.1 General MDAS Configuration ...................................................................528.2.2 Iron and Sediment Configuration ...............................................................568.2.3 Fecal Coliform Configuration ....................................................................57
8.3 Hydrology Calibration ...........................................................................................58
8.4 Water Quality Calibration ......................................................................................58
8.5 Modeling Technique for Biological Impairments with Sedimentation Stressors ..59
8.6 Allocation Strategy ................................................................................................628.6.1 TMDL Endpoints .......................................................................................628.6.2 Baseline Conditions and Source Loading Alternatives .............................63
8.7 TMDLs and Source Allocations ............................................................................668.7.1 Total Iron TMDLs ......................................................................................668.7.2 Fecal Coliform Bacteria TMDLs ...............................................................718.7.3 Seasonal Variation .....................................................................................738.7.4 Critical Conditions .....................................................................................738.7.5 TMDL Presentation ...................................................................................73
9.0 TMDL Results ..................................................................................................................76
10.0 Future Growth .................................................................................................................96
10.1 Iron .........................................................................................................................96
10.2 Fecal Coliform Bacteria .........................................................................................97
11.0 Public Participation .........................................................................................................98
11.1 Public Meetings .....................................................................................................98
11.2 Public Notice and Public Comment Period ...........................................................98
12.0 Reasonable Assurance .....................................................................................................98
12.1 NPDES Permitting .................................................................................................98
12.2 Watershed Management Framework Process ......................................................100
12.3 Public Sewer Projects ..........................................................................................100
12.4 AML Projects .......................................................................................................101

Middle Ohio River South and North Watersheds TMDL Report
iv
13.0 Monitoring Plan .............................................................................................................102
13.1 NPDES Compliance.............................................................................................102
13.2 Nonpoint Source Project Monitoring ...................................................................102
13.3 TMDL Effectiveness Monitoring ........................................................................102
14.0 References .......................................................................................................................103
FIGURES
Figure I-1. Examples of a watershed, TMDL watershed, and subwatersheds .............................. ix
Figure 2-1. Hydrologic groupings of West Virginia’s watersheds ................................................ 3
Figure 3-1. Extent of the Middle Ohio River South TMDL Watersheds in West Virginia ........... 7
Figure 3-2. Extent of the Middle Ohio River North TMDLWatersheds in West Virginia ............ 8
Figure 3-3. 21 Middle Ohio River South TMDL watersheds ...................................................... 12
Figure 3-4. 9 Middle Ohio River North TMDL watersheds ........................................................ 13
Figure 4-1. Conceptual model of candidate causes and potential biological effects ................... 25
Figure 4-2. Location of the sediment reference stream, Big Run (WVOMN-13-CG-2) ............. 27
Figure 5-1. Metals point sources in the Middle Ohio River South .............................................. 32
Figure 5-2. Metals point sources in the Middle Ohio River North watersheds ........................... 33
Figure 5-3. Construction stormwater permits in the Middle Ohio River South watershed ......... 36
Figure 5-4. Construction stormwater permits in the Middle Ohio River North watershed ......... 37
Figure 5-5. MS4 jurisdictions in the Middle Ohio River South watershed ................................. 39
Figure 5-6. Metals non-point sources in the Middle Ohio River South watershed ..................... 41
Figure 5-7. Metals non-point sources in the Middle Ohio River North watershed ..................... 42
Figure 6-1. Failing septic flows in the Middle Ohio River South watershed .............................. 48
Figure 6-2. Failing septic flows in the Middle Ohio River North watershed .............................. 49
Figure 8-1. Middle Ohio River South TMDL watersheds and subwatershed delineation ........... 54

Middle Ohio River South and North Watersheds TMDL Report
v
Figure 8-2. Middle Ohio River North TMDL watersheds and subwatershed delineation ........... 55
Figure 8-3. Conceptual diagram of stream channel components used in the bank erosion model............................................................................................................................................... 57
Figure 8-4. Shrewsbury Hollow fecal coliform observed data .................................................... 59
Figure 8-5. Annual precipitation totals for the West Union (WV9458) weather station ............. 64
Figure 8-6. Example of baseline and TMDL conditions for total iron ........................................ 66
Figure 8-7. Flowchart of the total iron allocation methodology .................................................. 68
TABLES
Table 2-1. Applicable West Virginia water quality criteria ........................................................... 5
Table 3-1. Modified landuse for the Middle Ohio River South and North TMDL watersheds ..... 9
Table 3-2. Datasets used in TMDL development ........................................................................ 10
Table 3-3. Waterbodies and impairments for which TMDLs have been developed in the Middle Ohio River South watershed. ................................................................................................ 14
Table 3-4. Waterbodies and impairments for which TMDLs have been developed in the Middle Ohio River North watershed. ................................................................................................ 18
Table 4-1. Significant stressors of biologically impaired streams in the Middle Ohio River South watersheds ............................................................................................................................. 27
Table 4-2. Significant stressors of biologically impaired streams in the Middle Ohio River North watersheds ............................................................................................................................. 29
Table 8-1. Sediment loadings using different modeling approaches in Middle Ohio River South and Middle Ohio River North watersheds. ........................................................................... 60
Table 8-2. TMDL Endpoints ........................................................................................................ 63
Table 8-3. Concentrations used in representing permitted conditions for active mining ............ 64
Table 8-4. Combined sewer overflows in the Middle Ohio River North watershed ................... 72
Table 9-1. Iron TMDLs in the Middle Ohio River South Watershed .......................................... 76
Table 9-2. Iron TMDLs in the Middle Ohio River North Watershed .......................................... 80

Middle Ohio River South and North Watersheds TMDL Report
vi
Table 9-3. Fecal coliform bacteria TMDLs in Middle Ohio River South Watershed ................. 84
Table 9-4. Fecal coliform bacteria TMDLs in Middle Ohio River North Watershed ................. 87
Table 9-5. Biological TMDLs in Middle Ohio River South Watershed ...................................... 90
Table 9-6. Biological TMDLs in Middle Ohio River North Watershed ...................................... 94

Middle Ohio River South and North Watersheds: TMDL Report
vii
ACRONYMS, ABBREVIATIONS, AND DEFINITIONS
7Q10 7-day, 10-year low flow AD Acid Deposition AMD acid mine drainage AML abandoned mine land AML&R [WVDEP] Office of Abandoned Mine Lands & Reclamation BMP best management practice BOD biochemical oxygen demand BPH [West Virginia] Bureau for Public Health CFR Code of Federal Regulations CSGP Construction Stormwater General Permit CSO combined sewer overflow CSR Code of State Rules DEM Digital Elevation Model DMR [WVDEP] Division of Mining and Reclamation DNR West Virginia Division of Natural Resources DO dissolved oxygen DWWM [WVDEP] Division of Water and Waste Management ERIS Environmental Resources Information System GIS geographic information system gpd gallons per day GPS global positioning system HAU home aeration unit LA load allocation µg/L micrograms per liter MDAS Mining Data Analysis System mg/L milligrams per liter mL milliliter MF membrane filter counts per test MPN most probable number MOS margin of safety MRLC Multi-Resolution Land Characteristics Consortium MS4 Municipal Separate Storm Sewer System NED National Elevation Dataset NLCD National Land Cover Dataset NOAA-NCDC National Oceanic and Atmospheric Administration, National Climatic Data Center NPDES National Pollutant Discharge Elimination System NRCS Natural Resources Conservation Service OOG [WVDEP] Office of Oil and Gas POTW publicly owned treatment works SI stressor identification

Middle Ohio River South and North Watersheds TMDL Report
viii
SMCRA Surface Mining Control and Reclamation Act SRF State Revolving Fund SSO sanitary sewer overflow STATSGO State Soil Geographic database TMDL Total Maximum Daily Load TSS total suspended solids USDA U.S. Department of Agriculture USEPA U.S. Environmental Protection Agency USGS U.S. Geological Survey UNT unnamed tributary WLA wasteload allocation WVDEP West Virginia Department of Environmental Protection WVDOH West Virginia Division of Highways WVSCI West Virginia Stream Condition Index WVU West Virginia University
Watershed
A general term used to describe a drainage area within the boundary of a United States Geologic Survey’s 8-digit hydrologic unit code. Throughout this report, the Middle Ohio River South watershed and Middle Ohio River North watershed refer to the tributary streams that eventually drain to the Ohio River south and north of the confluence of the Little Kanawha River (Figure I-1). The term “watershed” is also used more generally to refer to the land area that contributes precipitation runoff that eventually drains to tributaries of the Ohio River.
TMDL Watershed
This term is used to describe the total land area draining to an impaired stream for which a TMDL is being developed. This term also takes into account the land area drained by un-impaired tributaries of the impaired stream, and may include impaired tributaries for which additional TMDLs are presented. This report addresses 166 (includes modeled impaired streams) impaired streams contained within 21 TMDL watersheds in the Middle Ohio River South watershed, and 160 (includes modeled impaired streams) impaired streams contained within 9 TMDL watersheds in the Middle Ohio River North watershed.
Subwatershed
The subwatershed delineation is the most detailed scale of the delineation that breaks each TMDL watershed into numerous catchments for modeling purposes. In the Middle Ohio River South watershed, the 21 TMDL watersheds have been subdivided into 486 modeled subwatersheds. In the Middle Ohio River North watershed, the 9 TMDL watersheds have been subdivided into 434 modeled subwatersheds. Pollutant sources, allocations and reductions are presented at the subwatershed scale to facilitate future permitting actions and TMDL implementation.

Middle Ohio River South and North Watersheds TMDL Report
ix
Figure I-1. Examples of a watershed, TMDL watershed, and subwatersheds
®
0 1 2 3 40.5Miles
Subwatershed
Cow Creek TMDL Watershed
Middle Ohio River North Watershed

Middle Ohio River South and North Watersheds: TMDL Report
x
EXECUTIVE SUMMARY
This report includes Total Maximum Daily Loads (TMDLs) for 166 impaired streams in the Middle Ohio River South watershed and 160 impaired streams in the Middle Ohio River North watershed.
A TMDL establishes the maximum allowable pollutant loading for a waterbody to comply with water quality standards, distributes the load among pollutant sources, and provides a basis for actions needed to restore water quality. West Virginia’s water quality standards are codified at Title 47 of the Code of State Rules (CSR), Series 2, and titled Legislative Rules, Department of Environmental Protection: Requirements Governing Water Quality Standards. The standards include designated uses of West Virginia waters and numeric and narrative criteria to protect those uses. The West Virginia Department of Environmental Protection routinely assesses use support by comparing observed water quality data with criteria and reports impaired waters every two years as required by Section 303(d) of the Clean Water Act (“303(d) list”). The Act requires that TMDLs be developed for listed impaired waters.
The subject impaired streams are included on West Virginia’s 2010 Section 303(d) List. Documented impairments are related to numeric water quality criteria for total iron and fecal coliform bacteria. Certain waters are also biologically impaired based on the narrative water quality criterion of 47 CSR 2–3.2.i, which prohibits the presence of wastes in state waters that cause or contribute to significant adverse impacts on the chemical, physical, hydrologic, and biological components of aquatic ecosystems.
Impaired waters were organized into 21 TMDL watersheds in the Middle Ohio River South watershed and 9 TMDL watersheds in the Middle Ohio River North watershed. For hydrologic modeling purposes, impaired and unimpaired streams in these TMDL watersheds were further divided into smaller subwatershed units for modeling. There were 486 subwatersheds in the Middle Ohio River South model, and 434 subwatersheds in the Middle Ohio River North model. The subwatershed delineation provided a basis for georeferencing pertinent source information, monitoring data, and presentation of the TMDLs.
The Mining Data Analysis System (MDAS) was used to represent linkage between pollutant sources and instream responses for fecal coliform bacteria and total iron. The MDAS is a comprehensive data management and modeling system that is capable of representing loads from nonpoint and point sources in the watershed and simulating instream processes.
Point and nonpoint sources contribute to the fecal coliform bacteria impairments in the watershed. Failing on-site systems, direct discharges of untreated sewage, and precipitation runoff from agricultural and residential areas are significant nonpoint sources of fecal coliform bacteria. Point sources of fecal coliform bacteria include the effluents of sewage treatment facilities, collection system overflows from publicly owned treatment works (POTWs), and stormwater discharges from Municipal Separate Storm Sewer Systems (MS4s).

Middle Ohio River South and North Watersheds TMDL Report
xi
Iron impairments are also attributable to both point and nonpoint sources. Nonpoint sources of iron include abandoned mine lands (AML), roads, oil and gas operations, timbering, agriculture, urban/residential land disturbance and streambank erosion. Iron point sources include the permitted discharges from mining activities, and stormwater contributions from Municipal Separate Storm Sewer Systems (MS4), construction sites and non-mining industrial facilities. The presence of individual source categories and their relative significance varies by subwatershed. Because iron is a naturally-occurring element that is present in soils, the iron loading from many of the identified sources is associated with sediment contributions.
Historically, WVDEP based biological integrity assessment on a rating of the stream’s benthic macroinvertebrate community using the multimetric West Virginia Stream Condition Index (WVSCI). Recent legislative action (Senate Bill 562) directed the agency to develop and secure legislative approval of new rules to interpret the narrative criterion for biological impairment found in 47 CSR 2-3.2.i. A copy of the legislation may be viewed at: http://www.legis.state.wv.us/Bill_Text_HTML/2012_SESSIONS/ RS/pdf_bills/SB562%20SUB1%20enr%20PRINTED.pdf
In response to the legislation, WVDEP is developing an alternative methodology for interpreting the narrative criterion for biological impairment, which will be used in the future once approved. However, the comprehensive monitoring, source tracking and stressor identification completed in this project demonstrates that the biological stress can be resolved by pollutant reductions that are needed to attain existing numeric water quality criteria. As such, biological impairment TMDLs are being presented herein to resolve the existing 303(d) listed impairments.
The first step in TMDL development for biologically impaired waters is stressor identification (SI). Section 4 discusses the SI process. SI was followed by stream-specific determinations of the pollutants for which TMDLs must be developed. Organic enrichment and/or sedimentation were identified as causative stressors for the biologically impaired streams addressed in this effort.
Organic enrichment was identified as a significant biological stressor in many waters. All such waters also demonstrated violations of the numeric criteria for fecal coliform bacteria. It was determined that implementation of fecal coliform TMDLs would remove untreated sewage and significantly reduce animal wastes, thereby reducing the organic and nutrient loading causing the biological impairment.
Where sedimentation was identified as a significant stressor, sediment TMDLs were initially developed within the MDAS using a reference watershed approach. The MDAS was configured to examine upland sediment loading and streambank erosion and depositional processes. Load reductions for sediment-impaired waters were projected based upon the sediment loading present in an unimpaired reference watershed. For all of those waters, a strong, positive correlation between iron and total suspended solids (TSS) was identified and iron TMDLs are presented. It was universally determined that the sediment reductions necessary for the attainment of iron water quality criteria exceed those necessary to address biological stress from sedimentation. As such, the iron TMDLs serve as surrogates for the biological impairments caused by sedimentation.

Middle Ohio River South and North Watersheds TMDL Report
xii
This report describes the TMDL development and modeling processes, identifies impaired streams and existing pollutant sources, discusses future growth and TMDL achievability, and documents the public participation associated with the process. It also contains a detailed discussion of the allocation methodologies applied for various impairments. Various provisions attempt to ensure the attainment of criteria throughout the watershed, achieve equity among categories of sources, and target pollutant reductions from the most problematic sources. Nonpoint source reductions were not specified beyond natural (background) levels. Similarly, point source wasteload allocations were no more stringent than numeric water quality criteria.
Applicable TMDLs are displayed in Section 9 of this report. Accompanying spreadsheets provide TMDLs and allocations of loads to categories of point and nonpoint sources that achieve the total TMDL. Also provided is an ArcGIS Viewer Project that allows for the exploration of spatial relationships among the source assessment data. A Technical Report is also available that describes the detailed technical approaches used in the process and displays the data upon which the TMDLs are based.

Middle Ohio River South and North Watersheds: TMDL Report
1
1.0 REPORT FORMAT
This report describes the overall total maximum daily load (TMDL) development process for the Middle Ohio River South and Middle Ohio River North watersheds, identifies impaired streams, and outlines the source assessment for all pollutants for which TMDLs are presented. It also describes the modeling and allocation processes and lists measures that will be taken to ensure that the TMDLs are met. The applicable TMDLs are displayed in Section 9 of this report. The report is supported by a GIS project that provides further details on the data and allows the user to explore the spatial relationships among the source assessment data. An ArcGIS Viewer Project has been made available to allow users to magnify streams and view other features of interest. In addition to the TMDL report, a CD is provided that contains spreadsheets (in Microsoft Excel format) that display detailed source allocations associated with successful TMDL scenarios. A Technical Report is also included that describes the detailed technical approaches used in the process and displays the data upon which the TMDLs are based.
2.0 INTRODUCTION
The West Virginia Department of Environmental Protection (WVDEP), Division of Water and Waste Management (DWWM), is responsible for the protection, restoration, and enhancement of the State’s waters. Along with this duty comes the responsibility for TMDL development in West Virginia.
2.1 Total Maximum Daily Loads
Section 303(d) of the federal Clean Water Act and the U.S. Environmental Protection Agency’s (USEPA) Water Quality Planning and Management Regulations (at Title 40 of the Code of Federal Regulations [CFR] Part 130) require states to identify waterbodies that do not meet water quality standards and to develop appropriate TMDLs. A TMDL establishes the maximum allowable pollutant loading for a waterbody to achieve compliance with applicable standards. It also distributes the load among pollutant sources and provides a basis for the actions needed to restore water quality.
A TMDL is composed of the sum of individual wasteload allocations (WLAs) for point sources, and load allocations (LAs) for nonpoint sources and natural background levels. In addition, the TMDL must include a margin of safety (MOS), implicitly or explicitly, that accounts for the uncertainty in the relationship between pollutant loads and the quality of the receiving waterbody. TMDLs can be expressed in terms of mass per time or other appropriate units. Conceptually, this definition is denoted by the following equation:
TMDL = sum of WLAs + sum of LAs + MOS
WVDEP is developing TMDLs in concert with a geographically-based approach to water resource management in West Virginia—the Watershed Management Framework. Adherence to the Framework ensures efficient and systematic TMDL development. Each year, TMDLs are

Middle Ohio River South and North Watersheds TMDL Report
2
developed in specific geographic areas. The Framework dictates that in 2011 TMDLs should be pursued in Hydrologic Group C, which includes the Middle Ohio River South and Middle Ohio River North watersheds. Figure 2-1 depicts the hydrologic groupings of West Virginia’s watersheds; the legend includes the target year for finalization of each TMDL.
WVDEP is committed to implementing a TMDL process that reflects the requirements of the TMDL regulations, provides for the achievement of water quality standards, and ensures that ample stakeholder participation is achieved in the development and implementation of TMDLs. A 48-month development process enables the agency to carry out an extensive data generating and gathering effort to produce scientifically defensible TMDLs. It also allows ample time for modeling, report finalization, and frequent public participation opportunities.
The TMDL development process begins with pre-TMDL water quality monitoring and source identification and characterization. Informational public meetings are held in the affected watersheds. Data obtained from pre-TMDL efforts are compiled, and the impaired waters are modeled to determine baseline conditions and the gross pollutant reductions needed to achieve water quality standards. WVDEP then presents a status update meeting which reviews general TMDL concepts, water quality standards, and the progress of TMDL development for the impaired streams within the project watershed. The Draft TMDL is advertised for public review and comment, and a third informational meeting is held during the public comment period. Public comments are addressed, and the Draft TMDL is submitted to USEPA for approval.

Middle Ohio River South and North Watersheds: TMDL Report
3
Figure 2-1. Hydrologic groupings of West Virginia’s watersheds

Middle Ohio River North and South Watersheds: TMDL Report
4
2.2 Water Quality Standards
The determination of impaired waters involves comparing instream conditions to applicable water quality standards. West Virginia’s water quality standards are codified at Title 47 of the Code of State Rules (CSR), Series 2, titled Legislative Rules, Department of Environmental Protection: Requirements Governing Water Quality Standards. These standards can be obtained online from the WVDEP Internet page: http://www.dep.wv.gov/WWE/Programs/wqs/Pages/default.aspx.
Water quality standards consist of three components: designated uses; narrative and/or numeric water quality criteria necessary to support those uses; and an antidegradation policy. Appendix E of the Standards contains the numeric water quality criteria for a wide range of parameters, while Section 3 of the Standards contains the narrative water quality criteria.
Designated uses include: propagation and maintenance of aquatic life in warmwater fisheries and troutwaters, water contact recreation, and public water supply. In various streams in the Middle Ohio River South and Middle Ohio River North watersheds, warmwater fishery aquatic life use impairments have been determined pursuant to the exceedance of the iron numeric water quality criteria. Water contact recreation and/or public water supply use impairments have also been determined in various waters pursuant to exceedances of numeric water quality criteria for fecal coliform bacteria and total iron.
All West Virginia waters are subject to the narrative criteria in Section 3 of the Standards. That section, titled “Conditions Not Allowable in State Waters,” contains various general provisions related to water quality. The narrative water quality criterion at Title 47 CSR Series 2 – 3.2.i prohibits the presence of wastes in state waters that cause or contribute to significant adverse impacts to the chemical, physical, hydrologic, and biological components of aquatic ecosystems. This provision is the basis for “biological impairment” determinations. Biological impairment signifies a stressed aquatic community, and is discussed in detail in Section 4.
The numeric water quality criteria applicable to the impaired streams addressed by this report are summarized in Table 2-1. The stream-specific impairments related to both numeric and narrative water quality criteria are displayed in Table 3-3.
TMDLs presented herein are based upon the water quality criteria that are currently effective. If the West Virginia Legislature adopts Water Quality Standard revisions that alter the basis upon which the TMDLs are developed, then the TMDLs and allocations may be modified as warranted. Any future Water Quality Standard revision and/or TMDL modification must receive EPA approval prior to implementation.

Middle Ohio River North and South Watersheds: TMDL Report
5
Table 2-1. Applicable West Virginia water quality criteria
POLLUTANT
USE DESIGNATION
Aquatic Life Human Health
Warmwater Fisheries Troutwaters Contact
Recreation/Public Water Supply
Acutea Chronicb Acutea Chronicb
Iron, total (mg/L) -- 1.5 -- 1.0 1.5 Fecal coliform bacteria Human Health Criteria Maximum allowable level of fecal coliform content for Primary
Contact Recreation (either MPN [most probable number] or MF [membrane filter counts/test]) shall not exceed 200/100 mL as a monthly geometric mean based on not less than 5 samples per month; nor to exceed 400/100 mL in more than 10 percent of all samples taken during the month.
a One-hour average concentration not to be exceeded more than once every 3 years on the average. b Four-day average concentration not to be exceeded more than once every 3 years on the average.
Source: 47 CSR, Series 2, Legislative Rules, Department of Environmental Protection: Requirements Governing Water Quality Standards.
3.0 WATERSHED DESCRIPTION AND DATA INVENTORY
3.1 Watershed Description
The following describes the watersheds represented in this TMDL effort, including the Middle Ohio River South and the Middle Ohio River North. Land areas draining directly into the Ohio River are not represented in this TMDL. Those areas are un-shaded along the Ohio River shown in Figures 3-1 and 3-2.
The Middle Ohio River South watershed (U.S. Geological Survey [USGS] 8-digit hydrologic unit code 05030202) encompasses 1,390 square miles (625 square miles modeled) along the Ohio River on the West Virginia-Ohio border (Figure 3-1). This watershed is comprised of the drainage area of tributary streams joining the Ohio River between the Little Kanawha River and the Kanawha River. The watershed lies in Mason, Jackson, Wood Counties, along with small portions of Wirt and Roane Counties. The Ohio River mainstem meanders between West Virginia and Ohio in a generally southwestward direction. The major tributaries within the watershed are Oldtown Creek, Mill Creek, and Sandy Creek. Cities and towns in the vicinity of the area of study are Point Pleasant, Ripley, Ravenswood, Parkersburg and Vienna.
The highest point in the modeled portion of the Middle Ohio River South watershed is 1,221 feet on Garnes Knob southwest of Kenna, WV. The lowest point in the modeled portion of the Middle Ohio River South watershed is 538 feet at the confluence of the Crooked Creek and the Ohio River in Point Pleasant. The average elevation of the modeled portion of the Middle Ohio River South watershed is 748 feet. The total population living in the subject watersheds of the Middle Ohio River South watershed is estimated to be 62,000 people.
The Middle Ohio River North watershed (U.S. Geological Survey [USGS] 8-digit hydrologic unit code 05030201) encompasses 1,800 square miles (849 square miles modeled) along the

Middle Ohio River North and South Watersheds: TMDL Report
6
Ohio River on the West Virginia-Ohio border (Figure 3-2). This watershed is comprised of the drainage area of tributary streams joining the Ohio River between Fish Creek and the Little Kanawha River. The watershed lies in Pleasants, Tyler, Doddridge, and Wetzel Counties, along with a small portion of Marshall County. The major tributaries within the watershed are Middle Island Creek and Fishing Creek. Cities and towns in the vicinity of the area of study are New Martinsville, West Union, and St. Marys.
The highest point in the modeled portion of the Middle Ohio River North watershed is 1,669 feet on an unnamed ridgetop where the county boundaries of Wetzel, Harrison, and Doddridge Counties converge. The lowest point in the modeled portion Middle Ohio River North watershed is 582 feet at the confluence of the Cow Creek and the Ohio River below the Willow Island Lock and Dam. The average elevation of the modeled portion of the Middle Ohio River North watershed is 1010 feet. The total population living in the subject watersheds the Middle Ohio River North watershed is estimated to be 38,000 people.

Middle Ohio River North and South Watersheds: TMDL Report
7
Figure 3-1. Extent of the Middle Ohio River South TMDL Watersheds in West Virginia
^
^
^^
^^
§̈¦77
£¤33
§̈¦77
§̈¦77
¬«2
£¤21
Mason
Wood
Jackson
Wirt
Roane
Putnam
City of Vienna
City of Ripley
City of HartfordTown of New Haven
Town of North Hills
City of Point Pleasant
®
0 5 10 15 202.5Miles
^ Towns
Ohio River Mainstem
Major Roads
County Boundary Line
Middle Ohio River South Watershed

Middle Ohio River North and South Watersheds: TMDL Report
8
Figure 3-2. Extent of the Middle Ohio River North TMDLWatersheds in West Virginia
^
^
^
^ ^
^
¬«16
¬«20
£¤50
¬«18
Ritchie
Tyler
Wetzel
Marshall
Doddridge
Harrison
Pleasants
Lewis
Wood
Wirt
Ma
rio
n
Gilmer
City of Belmont
City of St. Marys
Town of Pine Grove
Town of Smithfield
Town of West Union
Town of Middlebourne
®
0 5 10 15 202.5Miles
^ Towns
Ohio River Mainstem
Major Roads
County Boundary Line
Middle Ohio River North Watershed

Middle Ohio River North and South Watersheds: TMDL Report
9
Landuse and land cover estimates were originally obtained from vegetation data gathered from the National Land Cover Dataset (NLCD) 2001. The Multi-Resolution Land Characteristics Consortium (MRLC) produced the NLCD coverage. The NLCD database for West Virginia was derived from satellite imagery taken during the early 2000s, and it includes detailed vegetative spatial data. Enhancements and updates to the NLCD coverage were made to create a modeled landuse by custom edits derived primarily from WVDEP source tracking information and 2003 aerial photography with 1-meter resolution. Additional information regarding the NLCD spatial database is provided in Appendix E of the Technical Report.
Table 3-1 displays the landuse distribution in the Middle Ohio River South watershed (486 modeled subwatersheds) and the Middle Ohio River North watershed (434 modeled subwatersheds), derived from NLCD as described above. The dominant landuse in both watersheds is forest, which constitutes 74.9 and 90.2 percent of the total landuse area of South and North watersheds, respectively. Other important modeled landuse types are grassland (11.9 and 3.7 percent), urban/residential (5.5 and 3.4 percent), and agriculture (7.3 and 2.3 percent). Individually, all other land cover types comprise less than one percent of the total watershed area.
Table 3-1. Modified landuse for the Middle Ohio River South and North TMDL watersheds
Landuse Type
Middle Ohio River South Middle Ohio River North
Acres Square Miles
Percentage Acres Square Miles
Percentage
Forest 299,438 467.9 74.9% 490,463 766.4 90.2%
Grassland 47,602 74.4 11.9% 20,266 31.7 3.7%
Urban/Residential 21,962 34.3 5.5% 18,622 29.1 3.4%
Agriculture 29,086 45.5 7.3% 12,478 19.5 2.3%
Water 1,256 2.0 0.3% 1573 2.5 0.3%
Wetland 174 0.3 <0.1% 28 0.04 <0.1%
Barren 35 0.05 <0.1% 22 0.03 <0.1%
Mining 101 0.2 <0.1% 32 0.05 <0.1%
AML 44 0.07 <0.1% 0 0 0%
Total Area 399,698 625 100% 543,484 849 100%
Note: < equals “less than”
3.2 Data Inventory
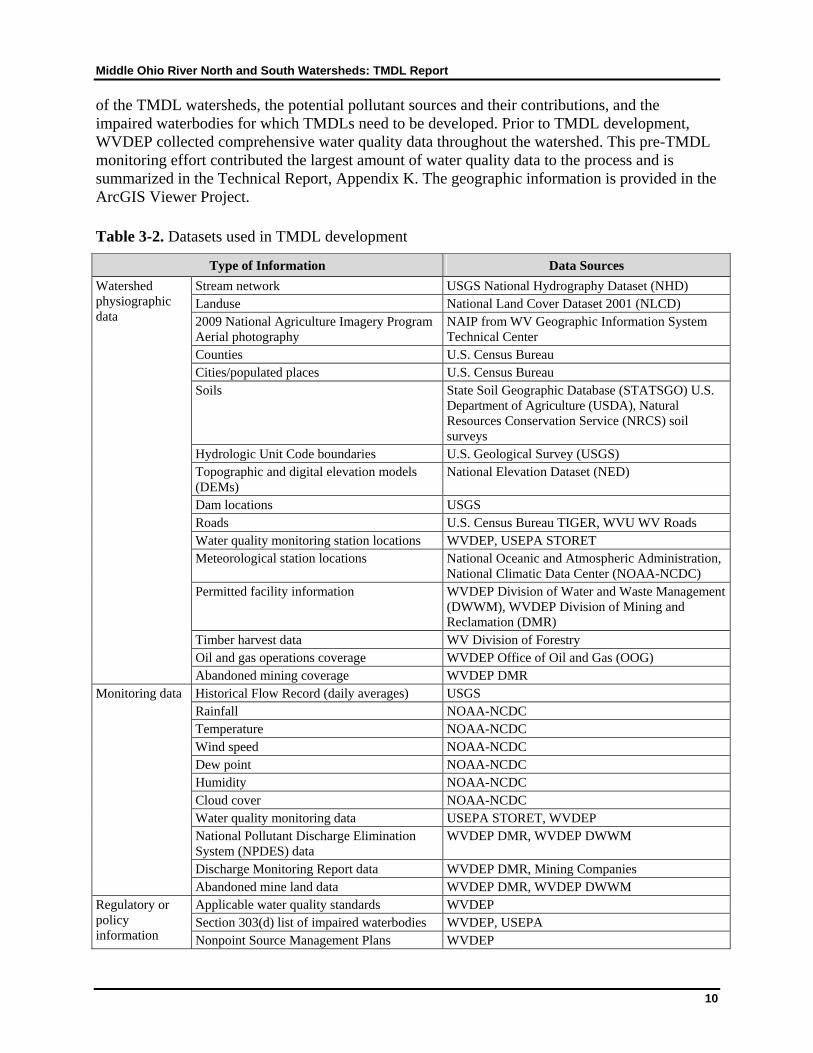
Various sources of data were used in the TMDL development process. The data were used to identify and characterize sources of pollution and to establish the water quality response to those sources. Review of the data included a preliminary assessment of the watershed’s physical and socioeconomic characteristics and current monitoring data. Table 3-2 identifies the data used to support the TMDL assessment and modeling effort. These data describe the physical conditions
Middle Ohio River North and South Watersheds: TMDL Report
10
of the TMDL watersheds, the potential pollutant sources and their contributions, and the impaired waterbodies for which TMDLs need to be developed. Prior to TMDL development, WVDEP collected comprehensive water quality data throughout the watershed. This pre-TMDL monitoring effort contributed the largest amount of water quality data to the process and is summarized in the Technical Report, Appendix K. The geographic information is provided in the ArcGIS Viewer Project.
Table 3-2. Datasets used in TMDL development
Type of Information Data Sources
Watershed physiographic data
Stream network USGS National Hydrography Dataset (NHD) Landuse National Land Cover Dataset 2001 (NLCD) 2009 National Agriculture Imagery Program Aerial photography
NAIP from WV Geographic Information System Technical Center
Counties U.S. Census Bureau Cities/populated places U.S. Census Bureau Soils State Soil Geographic Database (STATSGO) U.S.
Department of Agriculture (USDA), Natural Resources Conservation Service (NRCS) soil surveys
Hydrologic Unit Code boundaries U.S. Geological Survey (USGS) Topographic and digital elevation models (DEMs)
National Elevation Dataset (NED)
Dam locations USGS Roads U.S. Census Bureau TIGER, WVU WV Roads Water quality monitoring station locations WVDEP, USEPA STORET Meteorological station locations National Oceanic and Atmospheric Administration,
National Climatic Data Center (NOAA-NCDC) Permitted facility information WVDEP Division of Water and Waste Management
(DWWM), WVDEP Division of Mining and Reclamation (DMR)
Timber harvest data WV Division of Forestry Oil and gas operations coverage WVDEP Office of Oil and Gas (OOG) Abandoned mining coverage WVDEP DMR
Monitoring data Historical Flow Record (daily averages) USGS Rainfall NOAA-NCDC Temperature NOAA-NCDC Wind speed NOAA-NCDC Dew point NOAA-NCDC Humidity NOAA-NCDC Cloud cover NOAA-NCDC Water quality monitoring data USEPA STORET, WVDEP National Pollutant Discharge Elimination System (NPDES) data
WVDEP DMR, WVDEP DWWM
Discharge Monitoring Report data WVDEP DMR, Mining Companies Abandoned mine land data WVDEP DMR, WVDEP DWWM
Regulatory or policy information
Applicable water quality standards WVDEP Section 303(d) list of impaired waterbodies WVDEP, USEPA Nonpoint Source Management Plans WVDEP

Middle Ohio River North and South Watersheds: TMDL Report
11
3.3 Impaired Waterbodies
WVDEP conducted extensive water quality monitoring throughout the Middle Ohio River South and Middle Ohio River North watersheds from July 2008 through June 2009. The results of that effort were used to confirm the impairments of waterbodies identified on previous 303(d) lists and to identify other impaired waterbodies that were not previously listed.
In this TMDL development effort, modeling at baseline conditions demonstrated additional pollutant impairments to those identified via monitoring. The prediction of impairment through modeling is validated by applicable federal guidance for 303(d) listing. WVDEP could not perform water quality monitoring and source characterization at frequencies or sample location resolution sufficient to comprehensively assess water quality under the terms of applicable water quality standards, and modeling was needed to complete the assessment. Where existing pollutant sources were predicted to cause noncompliance with a particular criterion, the subject water was characterized as impaired for that pollutant. TMDLs were developed for impaired waters in 21 TMDL watersheds in Middle Ohio River South (Figure 3-3) and 9 TMDL watersheds in Middle Ohio River North (Figure 3-4). The impaired waters for which TMDLs have been developed are presented in Table 3-3. The table includes the TMDL watershed, stream code, stream name, and impairments for each stream.

Middle Ohio River North and South Watersheds: TMDL Report
12
Figure 3-3. 21 Middle Ohio River South TMDL watersheds
®
0 5 10 15 202.5Miles
Ohio River Mainstem
Middle Ohio River South
TMDLSHEDS
Big Run
Briscoe Run
Broad Run
Cedar Run
Crooked Creek
Lee Creek
Little Broad Run
Little Mill Creek
Little Sandy Creek
Mill Creek
Mill Run
Oldtown Creek
Pond Creek
Pond Run
Sandy Creek (OMS-30)
Sandy Creek (OMS-57)
Sliding Hill Creek
Spring Creek
Tenmile Creek
Washington Run
West Creek

Middle Ohio River North and South Watersheds: TMDL Report
13
Figure 3-4. 9 Middle Ohio River North TMDL watersheds
®
0 5 10 15 202.5Miles
Ohio River Mainstem
Middle Ohio River North
TMDLSHEDS
Bull Creek
Cow Creek
Cow Hollow Run
Fishing Creek
French Creek
Middle Island Creek
Proctor Creek
Sugarcamp Run
Williams Run

Middle Ohio River North and South Watersheds: TMDL Report
14
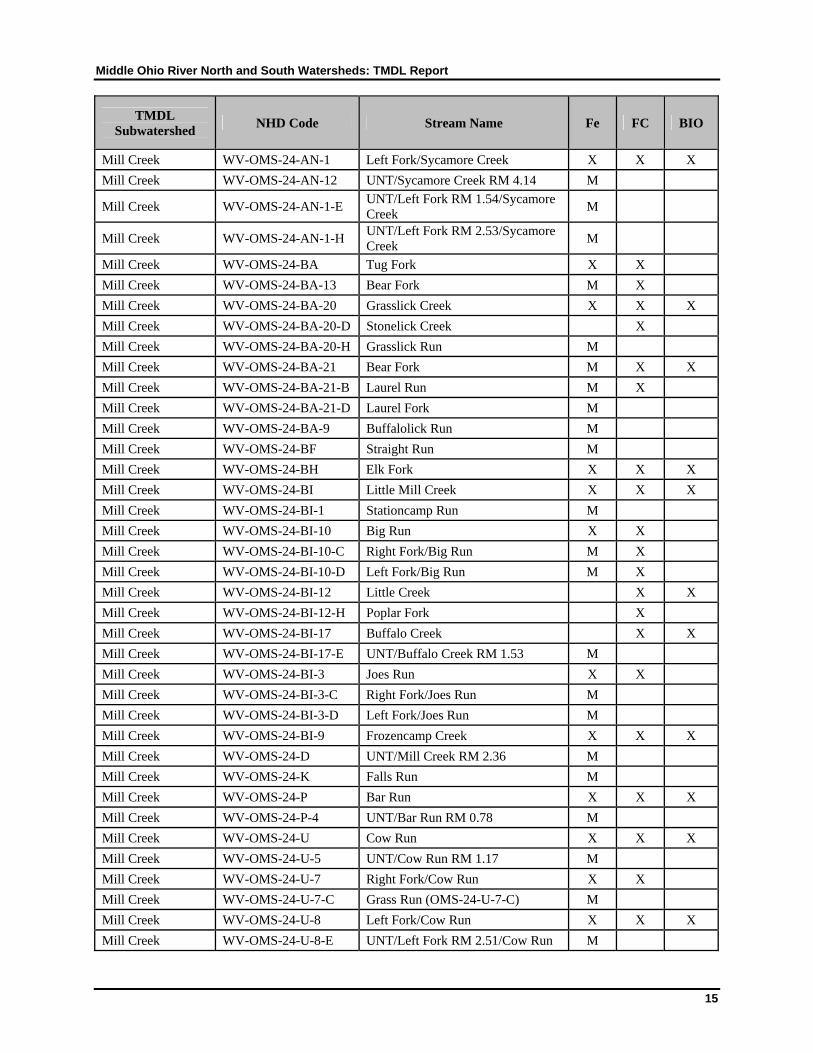
Table 3-3. Waterbodies and impairments for which TMDLs have been developed in the Middle Ohio River South watershed.
TMDL Subwatershed
NHD Code Stream Name Fe FC BIO
Crooked Creek WV-OMS-1 Crooked Creek X X
Sliding Hill Creek WV-OMS-11 Sliding Hill Creek X X X
Sliding Hill Creek WV-OMS-11-A UNT/Sliding Hill Creek RM 1.25 X X X
Sliding Hill Creek WV-OMS-11-A-1 UNT/UNT RM 1.12/Sliding Hill Creek RM 1.35
M
Sliding Hill Creek WV-OMS-11-A-5 UNT/UNT RM 3.75/Sliding Hill Creek RM 1.35
M
Broad Run WV-OMS-12 Broad Run X X
Broad Run WV-OMS-12-A Seaman Run M
Broad Run WV-OMS-12-G UNT/Broad Run RM 5.39 M
Broad Run WV-OMS-12-H UNT/Sliding Hill Creek RM 1.2 M
Little Broad Run WV-OMS-13 Little Broad Run X X X
West Creek WV-OMS-14 West Creek X X
West Creek WV-OMS-14-A UNT/West Creek RM 1.59 M
West Creek WV-OMS-14-B UNT/West Creek RM 1.69 M
West Creek WV-OMS-14-E UNT/West Creek RM 3.08 M
Crooked Creek WV-OMS-1-A UNT/Crooked Creek RM 1.53 M
Crooked Creek WV-OMS-1-B UNT/Crooked Creek RM 2.03 M
Crooked Creek WV-OMS-1-C UNT/Crooked Creek RM 4.34 M
Crooked Creek WV-OMS-1-F UNT/Crooked Creek RM 6.52 M
Crooked Creek WV-OMS-1-G UNT/Crooked Creek RM 8.05 M
Oldtown Creek WV-OMS-2 Oldtown Creek X X X
Little Mill Creek WV-OMS-23 Little Mill Creek X X X
Little Mill Creek WV-OMS-23-K UNT/Little Mill Creek RM 5.93 M
Little Mill Creek WV-OMS-23-L Right Fork/Little Mill Creek M
Mill Creek WV-OMS-24 Mill Creek X X X
Mill Creek WV-OMS-24-A Lick Run (OMS-24-A) M
Mill Creek WV-OMS-24-A-10 UNT/Lick Run RM 4.74 M
Mill Creek WV-OMS-24-AF Parchment Creek X X X
Mill Creek WV-OMS-24-AF-11 Grass Run X X
Mill Creek WV-OMS-24-AF-17 Cox Fork X X X
Mill Creek WV-OMS-24-AF-17-A UNT/Cox Fork RM 0.86 M
Mill Creek WV-OMS-24-AF-24 Kessel Run (OMS-24-AF-24) M
Mill Creek WV-OMS-24-AF-27 Wolfe Creek X X X
Mill Creek WV-OMS-24-AF-6 Johns Run M
Mill Creek WV-OMS-24-AF-9 Bull Run M
Mill Creek WV-OMS-24-AN Sycamore Creek X X X
Middle Ohio River North and South Watersheds: TMDL Report
15
TMDL Subwatershed
NHD Code Stream Name Fe FC BIO
Mill Creek WV-OMS-24-AN-1 Left Fork/Sycamore Creek X X X
Mill Creek WV-OMS-24-AN-12 UNT/Sycamore Creek RM 4.14 M
Mill Creek WV-OMS-24-AN-1-E UNT/Left Fork RM 1.54/Sycamore Creek
M
Mill Creek WV-OMS-24-AN-1-H UNT/Left Fork RM 2.53/Sycamore Creek
M
Mill Creek WV-OMS-24-BA Tug Fork X X
Mill Creek WV-OMS-24-BA-13 Bear Fork M X
Mill Creek WV-OMS-24-BA-20 Grasslick Creek X X X
Mill Creek WV-OMS-24-BA-20-D Stonelick Creek X
Mill Creek WV-OMS-24-BA-20-H Grasslick Run M
Mill Creek WV-OMS-24-BA-21 Bear Fork M X X
Mill Creek WV-OMS-24-BA-21-B Laurel Run M X
Mill Creek WV-OMS-24-BA-21-D Laurel Fork M
Mill Creek WV-OMS-24-BA-9 Buffalolick Run M
Mill Creek WV-OMS-24-BF Straight Run M
Mill Creek WV-OMS-24-BH Elk Fork X X X
Mill Creek WV-OMS-24-BI Little Mill Creek X X X
Mill Creek WV-OMS-24-BI-1 Stationcamp Run M
Mill Creek WV-OMS-24-BI-10 Big Run X X
Mill Creek WV-OMS-24-BI-10-C Right Fork/Big Run M X
Mill Creek WV-OMS-24-BI-10-D Left Fork/Big Run M X
Mill Creek WV-OMS-24-BI-12 Little Creek X X
Mill Creek WV-OMS-24-BI-12-H Poplar Fork X
Mill Creek WV-OMS-24-BI-17 Buffalo Creek X X
Mill Creek WV-OMS-24-BI-17-E UNT/Buffalo Creek RM 1.53 M
Mill Creek WV-OMS-24-BI-3 Joes Run X X
Mill Creek WV-OMS-24-BI-3-C Right Fork/Joes Run M
Mill Creek WV-OMS-24-BI-3-D Left Fork/Joes Run M
Mill Creek WV-OMS-24-BI-9 Frozencamp Creek X X X
Mill Creek WV-OMS-24-D UNT/Mill Creek RM 2.36 M
Mill Creek WV-OMS-24-K Falls Run M
Mill Creek WV-OMS-24-P Bar Run X X X
Mill Creek WV-OMS-24-P-4 UNT/Bar Run RM 0.78 M
Mill Creek WV-OMS-24-U Cow Run X X X
Mill Creek WV-OMS-24-U-5 UNT/Cow Run RM 1.17 M
Mill Creek WV-OMS-24-U-7 Right Fork/Cow Run X X
Mill Creek WV-OMS-24-U-7-C Grass Run (OMS-24-U-7-C) M
Mill Creek WV-OMS-24-U-8 Left Fork/Cow Run X X X
Mill Creek WV-OMS-24-U-8-E UNT/Left Fork RM 2.51/Cow Run M

Middle Ohio River North and South Watersheds: TMDL Report
16
TMDL Subwatershed
NHD Code Stream Name Fe FC BIO
Spring Creek WV-OMS-25 Spring Creek X X
Spring Creek WV-OMS-25-B UNT/Spring Creek RM 2.21 M
Cedar Run WV-OMS-28 Cedar Run X X
Cedar Run WV-OMS-28-D Stedman Run M
Cedar Run WV-OMS-28-F UNT/Cedar Run RM 2.11 M
Oldtown Creek WV-OMS-2-A UNT/Oldtown Creek RM 2.00 M
Oldtown Creek WV-OMS-2-D Turkey Run X X X
Oldtown Creek WV-OMS-2-F Potter Creek X
Oldtown Creek WV-OMS-2-G Robinson Run X X
Oldtown Creek WV-OMS-2-G-1 UNT/Robinson Run RM 2.42 M X X
Oldtown Creek WV-OMS-2-G-3 UNT/Robinson Run RM 3.33 X X
Oldtown Creek WV-OMS-2-I UNT/Oldtown Creek RM 11.50 M
Oldtown Creek WV-OMS-2-J Rayburn Creek M
Oldtown Creek WV-OMS-2-K UNT/Oldtown Creek RM 13.95 M
Oldtown Creek WV-OMS-2-M Trace Fork X X
Oldtown Creek WV-OMS-2-M-1 UNT/Trace Fork RM 0.72 M
Oldtown Creek WV-OMS-2-M-2 UNT/Trace Fork RM 1.59 M
Oldtown Creek WV-OMS-2-M-4 UNT/Trace Fork RM 2.97 M
Oldtown Creek WV-OMS-2-N Fallentimber Branch M
Oldtown Creek WV-OMS-2-O UNT/Oldtown Creek RM 18.16 M
Oldtown Creek WV-OMS-2-R UNT/Oldtown Creek RM 19.38 M
Oldtown Creek WV-OMS-2-S UNT/Oldtown Creek RM 20.03 M
Sandy Creek WV-OMS-30 Sandy Creek X X X
Sandy Creek WV-OMS-30-G Straight Fork X
Sandy Creek WV-OMS-30-K Crooked Fork X X X
Sandy Creek WV-OMS-30-K-1 Cockle Run M
Sandy Creek WV-OMS-30-M Cherrycamp Run M
Sandy Creek WV-OMS-30-O Trace Fork X X
Sandy Creek WV-OMS-30-P Beatty Run X X X
Sandy Creek WV-OMS-30-R Left Fork/Sandy Creek X X X
Sandy Creek WV-OMS-30-R-1 Copper Fork X X X
Sandy Creek WV-OMS-30-R-11 Drift Run M
Sandy Creek WV-OMS-30-R-15 Nesselroad Run X X X
Sandy Creek WV-OMS-30-R-15-F Redbush Run X X
Sandy Creek WV-OMS-30-R-15-L Maulecamp Run X X
Sandy Creek WV-OMS-30-R-18 McGraw Run M
Sandy Creek WV-OMS-30-R-29 Lockhart Fork X X
Sandy Creek WV-OMS-30-R-6 Sarvis Fork M
Sandy Creek WV-OMS-30-R-8 Turkey Fork X X

Middle Ohio River North and South Watersheds: TMDL Report
17
TMDL Subwatershed
NHD Code Stream Name Fe FC BIO
Sandy Creek WV-OMS-30-S Right Fork/Sandy Creek X X X
Sandy Creek WV-OMS-30-S-11 Biglick Run M X
Sandy Creek WV-OMS-30-S-22 Fallentimber Run M X
Sandy Creek WV-OMS-30-S-23 Rush Run M
Sandy Creek WV-OMS-30-S-24 Cabin Run X X
Sandy Creek WV-OMS-30-S-26 Brushy Fork (OMS-30-S-26) M
Little Sandy Creek WV-OMS-32 Little Sandy Creek M X
Little Sandy Creek WV-OMS-32-E Roadfork Run X X
Little Sandy Creek WV-OMS-32-I Claylick Run (OMS-32-I) M
Washington Run WV-OMS-35 Washington Run X X X
Mill Run WV-OMS-4 Mill Run X X X
Pond Creek WV-OMS-44 Pond Creek X X X
Pond Creek WV-OMS-44-AI Joshus Fork X X
Pond Creek WV-OMS-44-E Long Run (OMS-44-E) M
Pond Creek WV-OMS-44-F Little Pond Creek X X
Pond Creek WV-OMS-44-F-2 Jesse Run X X
Pond Creek WV-OMS-44-F-2-A UNT/Jesse Run RM 0.44 X
Pond Creek WV-OMS-44-F-2-B Left Fork/Jesse Run M
Pond Creek WV-OMS-44-F-2-C Right Fork/Jesse Run M
Pond Creek WV-OMS-44-F-5 Lamps Run M
Pond Creek WV-OMS-44-X Jerrys Run X X
Lee Creek WV-OMS-46-A South Fork/Lee Creek X X X
Lee Creek WV-OMS-46-A-1 Middle Fork/South Fork/Lee Creek M X
Lee Creek WV-OMS-46-A-13 Willow Run M X
Lee Creek WV-OMS-46-B North Fork/Lee Creek X X X
Lee Creek WV-OMS-46-B-24 Woodyards Run X X
Lee Creek WV-OMS-46-B-24-G UNT/Woodyards Run RM 2.03 M
Lee Creek WV-OMS-46-B-25 UNT/North Fork RM 10.17/Lee Creek
M
Lee Creek WV-OMS-46-B-30 Long Run (OMS-46-B-30) M
Lee Creek WV-OMS-46-B-31 Gunners Run X X
Lee Creek WV-OMS-46-B-6 UNT/North Fork RM 2.61/Lee Creek
M
Mill Run WV-OMS-4-A UNT/Mill Run RM 1.77 M
Mill Run WV-OMS-4-B UNT/Mill Run RM 1.81 M
Mill Run WV-OMS-4-C UNT/Mill Run RM 2.22 M
Mill Run WV-OMS-4-D UNT/Mill Run RM 3.13 M
Sandy Creek WV-OMS-57 Sandy Creek X X X
Sandy Creek WV-OMS-57-D Vaughts Run X X X
Sandy Creek WV-OMS-57-K UNT/Sandy Creek RM 3.91 M

Middle Ohio River North and South Watersheds: TMDL Report
18
TMDL Subwatershed
NHD Code Stream Name Fe FC BIO
Sandy Creek WV-OMS-57-L UNT/Sandy Creek RM 4.06 M
Sandy Creek WV-OMS-57-M UNT/Sandy Creek RM 4.41 M
Sandy Creek WV-OMS-57-O UNT/Sandy Creek RM 4.97 M X X
Tenmile Creek WV-OMS-6 Tenmile Creek X X X
Pond Run WV-OMS-65 Pond Run X X X
Pond Run WV-OMS-65-A Little Pond Run X X X
Briscoe Run WV-OMS-66 Briscoe Run X X X
Big Run WV-OMS-69 Big Run X X
Big Run WV-OMS-69-A UNT/Big Run RM 0.20 M
Big Run WV-OMS-69-B Williams Creek X X
Big Run WV-OMS-69-F Plum Run X X
Big Run WV-OMS-69-J Hogland Run X X X
Cow Creek WV-OMS-6-A UNT/Tenmile Creek RM 2.68 M
Tenmile Creek WV-OMS-6-C UNT/Tenmile Creek RM 4.13 M X
Tenmile Creek WV-OMS-6-D UNT/Tenmile Creek RM 5.33 X X
Cow Creek WV-OMS-6-I UNT/Tenmile Creek RM 8.02 M
Note:RM is River Mile
UNT is unnamed tributary.
FC refers to fecal coliform bacteria impairment
BIO refers to a biological impairment M indicates Modeled Fe impairment identified through modeling.
Table 3-4. Waterbodies and impairments for which TMDLs have been developed in the Middle Ohio River North watershed.
TMDL Subwatershed
NHD Code Stream Name Fe FC BIO
Middle Island Creek WV-OMN-13 Middle Island Creek X X X
Middle Island Creek WV-OMN-13-AI Allen Run X X
Middle Island Creek WV-OMN-13-AN Sheets Run M
Middle Island Creek WV-OMN-13-AP Buffalo Run M X
Middle Island Creek WV-OMN-13-AP-2 UNT/Buffalo Run RM 0.99 M X
Middle Island Creek WV-OMN-13-AP-2-E UNT/UNT RM 1.63/Buffalo Run RM 0.99
X
Middle Island Creek WV-OMN-13-AT Buffalo Run (OMN-13-AT) M
Middle Island Creek WV-OMN-13-AX Shrivers Run X
Middle Island Creek WV-OMN-13-BA Allen Run X
Middle Island Creek WV-OMN-13-BF Sancho Creek X
Middle Island Creek WV-OMN-13-BF-3 Little Sancho Creek M X
Middle Island Creek WV-OMN-13-BK Point Pleasant Creek X X
Middle Island Creek WV-OMN-13-BK-15 Willow Fork X X

Middle Ohio River North and South Watersheds: TMDL Report
19
TMDL Subwatershed
NHD Code Stream Name Fe FC BIO
Middle Island Creek WV-OMN-13-BK-15-B Buck Run X
Middle Island Creek WV-OMN-13-BK-21 Peach Fork X X
Middle Island Creek WV-OMN-13-BK-21-A UNT/Peach Fork RM 0.42 X X
Middle Island Creek WV-OMN-13-BK-4 Pursley Creek X X X
Middle Island Creek WV-OMN-13-BK-4-J Badger Run M
Middle Island Creek WV-OMN-13-BK-5 Elk Fork X X
Middle Island Creek WV-OMN-13-BK-5-F Big Run (OMN-13-BK-5-F) M
Middle Island Creek WV-OMN-13-BK-5-L Mudlick Run M X
Middle Island Creek WV-OMN-13-BK-5-L-1 Middle Fork/Mudlick Run M
Middle Island Creek WV-OMN-13-BK-6 Coallick Run X
Middle Island Creek WV-OMN-13-BK-8 Tenmile Run M
Middle Island Creek WV-OMN-13-BK-8-B Wolfpen Run (OMN-13-BK-8-B) M
Middle Island Creek WV-OMN-13-BM Gorrell Run M X X
Middle Island Creek WV-OMN-13-C Broad Run (OMN-13-C) M
Middle Island Creek WV-OMN-13-CA Muddy Creek M
Middle Island Creek WV-OMN-13-CG Indian Creek X X
Middle Island Creek WV-OMN-13-CG-10 Walnut Fork M X
Middle Island Creek WV-OMN-13-CG-2 Big Run M X
Middle Island Creek WV-OMN-13-CG-20 Stackpole Run M
Middle Island Creek WV-OMN-13-CH McElroy Creek X X X
Middle Island Creek WV-OMN-13-CH-10 Pratt Run M
Middle Island Creek WV-OMN-13-CH-13 Sandy Run M
Middle Island Creek WV-OMN-13-CH-16 Flint Run M X
Middle Island Creek WV-OMN-13-CH-16-B Little Flint Run M X
Middle Island Creek WV-OMN-13-CH-16-B-4
UNT/Little Flint Run RM 1.96 M
Middle Island Creek WV-OMN-13-CH-16-K Israel Fork M
Middle Island Creek WV-OMN-13-CH-16-M Neds Run M
Middle Island Creek WV-OMN-13-CH-16-V East Run M
Middle Island Creek WV-OMN-13-CH-19 Elklick Run M
Middle Island Creek WV-OMN-13-CH-22 Riggins Run M
Middle Island Creek WV-OMN-13-CH-33 Talkington Fork M X
Middle Island Creek WV-OMN-13-CH-34 Robinson Fork M X
Middle Island Creek WV-OMN-13-CH-34-A Little Battle Run (OMN-13-CH-34-A)
M
Middle Island Creek WV-OMN-13-CH-34-B Big Battle Run M X X
Middle Island Creek WV-OMN-13-CH-34-B-4
Little Battle Run (OMN-13-CH-34-B-4)
M
Middle Island Creek WV-OMN-13-CH-34-L Skelton Run M
Middle Island Creek WV-OMN-13-CH-35 Pike Fork M X

Middle Ohio River North and South Watersheds: TMDL Report
20
TMDL Subwatershed
NHD Code Stream Name Fe FC BIO
Middle Island Creek WV-OMN-13-CH-35-B Sycamore Fork M X
Middle Island Creek WV-OMN-13-CI Wheeler Run M
Middle Island Creek WV-OMN-13-CM Jefferson Run M
Middle Island Creek WV-OMN-13-CO Purgatory Run M
Middle Island Creek WV-OMN-13-CZ Camp Mistake Run M X
Middle Island Creek WV-OMN-13-CZ-3 UNT/Camp Mistake Run RM 0.96
M
Middle Island Creek WV-OMN-13-DA Arnold Creek X X
Middle Island Creek WV-OMN-13-DA-1 Short Run M
Middle Island Creek WV-OMN-13-DA-12 Wilhelm Run M X X
Middle Island Creek WV-OMN-13-DA-16 Claylick Run M X
Middle Island Creek WV-OMN-13-DA-18 Middle Run M
Middle Island Creek WV-OMN-13-DA-19 Left Fork/Arnold Creek M X
Middle Island Creek WV-OMN-13-DA-20 Right Fork/Arnold Creek X X
Middle Island Creek WV-OMN-13-DA-4 Long Run M X
Middle Island Creek WV-OMN-13-DD Nutter Fork M
Middle Island Creek WV-OMN-13-DD-3 Wolfpen Run (OMN-13-DD-3) M
Middle Island Creek WV-OMN-13-DG UNT/Middle Island Creek RM 67.32
X X
Middle Island Creek WV-OMN-13-DO Bluestone Creek M X
Middle Island Creek WV-OMN-13-DS Jockeycamp Run M
Middle Island Creek WV-OMN-13-DV Meathouse Fork X X X
Middle Island Creek WV-OMN-13-DV-13 Toms Fork X
Middle Island Creek WV-OMN-13-DV-13-C Little Toms Fork M
Middle Island Creek WV-OMN-13-DV-13-C-1
Webley Fork M
Middle Island Creek WV-OMN-13-DV-15 Redlick Run M
Middle Island Creek WV-OMN-13-DV-16 Brushy Fork X X
Middle Island Creek WV-OMN-13-DV-17 Snake Run X
Middle Island Creek WV-OMN-13-DV-19 Indian Fork M X
Middle Island Creek WV-OMN-13-DV-19-D Little Indian Fork M
Middle Island Creek WV-OMN-13-DV-21 Beech Lick M
Middle Island Creek WV-OMN-13-DV-30 Laurel Run (OMN-13-DV-30) M
Middle Island Creek WV-OMN-13-DV-31 Big Isaac Creek M X
Middle Island Creek WV-OMN-13-DV-4 Georgescamp Run M
Middle Island Creek WV-OMN-13-DV-9 Lick Run X X
Middle Island Creek WV-OMN-13-DW Buckeye Creek M X
Middle Island Creek WV-OMN-13-DW-17 Buffalo Calf Fork M X
Middle Island Creek WV-OMN-13-DW-21 Greenbrier Creek M
Middle Island Creek WV-OMN-13-DW-4 Morgans Run (OMN-13-DW-4) M

Middle Ohio River North and South Watersheds: TMDL Report
21
TMDL Subwatershed
NHD Code Stream Name Fe FC BIO
Middle Island Creek WV-OMN-13-DW-9 Buckeye Run X X X
Middle Island Creek WV-OMN-13-DW-9-H UNT/Buckeye Run RM 3.35 X X
Middle Island Creek WV-OMN-13-G Fishpot Run M
Middle Island Creek WV-OMN-13-H Willow Island Creek M
Middle Island Creek WV-OMN-13-L McKim Creek M X X
Middle Island Creek WV-OMN-13-L-11 Panther Run M
Middle Island Creek WV-OMN-13-L-15 Rock Run M
Middle Island Creek WV-OMN-13-L-31 Josephs Fork M
Middle Island Creek WV-OMN-13-L-7 Shawnee Run M
Middle Island Creek WV-OMN-13-N Wolf Run (OMN-13-N) M
Middle Island Creek WV-OMN-13-R Bogart Run X
Middle Island Creek WV-OMN-13-V Sugar Creek M X X
Middle Island Creek WV-OMN-13-V-20 Walnut Run M
Middle Island Creek WV-OMN-13-V-23 South Fork/Sugar Creek M
Sugarcamp Run WV-OMN-25 Sugarcamp Run X X
Cow Hollow Run WV-OMN-36 Cow Hollow Run M X X
Fishing Creek WV-OMN-45 Fishing Creek X X
Fishing Creek WV-OMN-45-A Doolin Run M X X
Fishing Creek WV-OMN-45-AA Crow Run M X
Fishing Creek WV-OMN-45-AC Piney Fork M
Fishing Creek WV-OMN-45-AC-10 Fluharty Fork M
Fishing Creek WV-OMN-45-AC-13 UNT/Piney Fork RM 5.40 M
Fishing Creek WV-OMN-45-AE Shenango Creek M
Fishing Creek WV-OMN-45-AG South Fork/Fishing Creek X X X
Fishing Creek WV-OMN-45-AG-15 Arches Fork X X X
Fishing Creek WV-OMN-45-AG-15-I Slabcamp Run X X
Fishing Creek WV-OMN-45-AG-16 Fallen Timber Run X X X
Fishing Creek WV-OMN-45-AG-19 Price Run X X X
Fishing Creek WV-OMN-45-AG-19-F Buck Run M X
Fishing Creek WV-OMN-45-AG-19-G Pickenpaw Run M
Fishing Creek WV-OMN-45-AG-19-I Tenmile Run M
Fishing Creek WV-OMN-45-AG-19-J Glade Fork M
Fishing Creek WV-OMN-45-AG-22 Morgan Run M
Fishing Creek WV-OMN-45-AG-23 Stout Run X
Fishing Creek WV-OMN-45-AG-27 Trader Fork M X
Fishing Creek WV-OMN-45-AG-5 Upper Run M X
Fishing Creek WV-OMN-45-AG-7 Buffalo Run X X X
Fishing Creek WV-OMN-45-AG-8 Richwood Run M X
Fishing Creek WV-OMN-45-AH North Fork/Fishing Creek X X

Middle Ohio River North and South Watersheds: TMDL Report
22
TMDL Subwatershed
NHD Code Stream Name Fe FC BIO
Fishing Creek WV-OMN-45-AH-10 Fourmile Run M
Fishing Creek WV-OMN-45-AH-14 Willey Fork M X
Fishing Creek WV-OMN-45-AH-14-B Big Run (OMN-45-AH-14-B) M
Fishing Creek WV-OMN-45-AH-14-C Rockcamp Run M
Fishing Creek WV-OMN-45-AH-14-N Morgan Run M X
Fishing Creek WV-OMN-45-AH-2 Barker Run M
Fishing Creek WV-OMN-45-AH-25 Mobley Run M
Fishing Creek WV-OMN-45-AH-29 Wiley Fork (OMN-45-AH-29) M
Fishing Creek WV-OMN-45-AH-6 Betsy Run M
Fishing Creek WV-OMN-45-AH-8 Maud Run M X
Fishing Creek WV-OMN-45-H Little Fishing Creek X X X
Fishing Creek WV-OMN-45-H-20 Scheidler Run M X
Fishing Creek WV-OMN-45-H-24 Rush Run X
Fishing Creek WV-OMN-45-H-32 Honey Run M
Fishing Creek WV-OMN-45-O Hupp Run M
Fishing Creek WV-OMN-45-U State Run X
Fishing Creek WV-OMN-45-V Money Run M
Fishing Creek WV-OMN-45-Y Brush Run X X
Williams Run WV-OMN-47 Williams Run M X
Proctor Creek WV-OMN-49 Proctor Creek M
Proctor Creek WV-OMN-49-L UNT/Proctor Creek RM 5.96 M
Proctor Creek WV-OMN-49-O Mud Run (OMN-49-O) M
Bull Creek WV-OMN-4-K Atward Run X
Cow Creek WV-OMN-6 Cow Creek M X
Cow Creek WV-OMN-6-C Sled Run M
Cow Creek WV-OMN-6-F Limestone Run M
Cow Creek WV-OMN-6-K Sharps Run M
French Creek WV-OMN-9 French Creek M X
French Creek WV-OMN-9-D Henry Camp Run M
French Creek WV-OMN-9-I Long Run (OMN-9-I) M
French Creek WV-OMN-9-K Alum Cave Run M
French Creek WV-OMN-9-N Schultz Run M
French Creek WV-OMN-9-Q Left Fork/French Creek M X
French Creek WV-OMN-9-R Right Fork/French Creek M X Note:
RM is River Mile
UNT is unnamed tributary.
FC refers to fecal coliform bacteria impairment
BIO refers to a biological impairment M indicates Modeled Fe impairment identified through modeling.

Middle Ohio River North and South Watersheds: TMDL Report
23
4.0 BIOLOGICAL IMPAIRMENT AND STRESSOR IDENTIFICATION
Initially, TMDL development in biologically impaired waters requires identification of the pollutants that cause the stress to the biological community. Sources of those pollutants are often analogous to those already described: mine drainage, untreated sewage, and sediment. The Technical Report discusses biological impairment and the stressor identification (SI) process in detail.
4.1 Introduction
Historically, WVDEP based biological integrity assessment on a rating of the stream’s benthic macroinvertebrate community using the multimetric West Virginia Stream Condition Index (WVSCI). Recent legislative action (Senate Bill 562) directed the agency to develop and secure legislative approval of new rules to interpret the narrative criterion for biological impairment found in 47 CSR 2-3.2.i. A copy of the legislation may be viewed at: http://www.legis.state.wv.us/Bill_Text_HTML/2012_SESSIONS/RS/pdf_bills/SB562%20SUB1%20enr%20PRINTED.pdf
In response to the legislation, WVDEP is developing an alternative methodology for interpreting the narrative criterion for biological impairment, which will be used in the future once approved. However, the comprehensive monitoring, source tracking and stressor identification completed in this project demonstrates that the biological stress can be resolved by pollutant reductions that are needed to attain existing numeric water quality criteria. As such, biological impairment TMDLs are being presented herein to resolve the existing 303(d) listed impairments. Stressor identification results are presented in Section 4.4 and additional details are provided in the Technical Report and in Technical Report Appendix B.
The WVSCI (WVSCI; Gerritsen et al., 2000) is composed of six metrics that were selected to maximize discrimination between streams with known impairments and reference streams. In general, streams with WVSCI scores of fewer than 60.6 points, on a normalized 0–100 scale, are considered biologically impaired. Initially, TMDL development in biologically impaired waters requires identification of the pollutants that cause the stress to the biological community detail.
USEPA developed Stressor Identification: Technical Guidance Document (Cormier et al., 2000) to assist water resource managers in identifying stressors and stressor combinations that cause biological impairment. Elements of the SI process were used to evaluate and identify the significant stressors to the impaired benthic communities. In addition, custom analyses of biological data were performed to supplement the framework recommended by the guidance document. The general SI process entailed reviewing available information, forming and analyzing possible stressor scenarios, and implicating causative stressors. The SI method provides a consistent process for evaluating available information. TMDLs were established for the responsible pollutants at the conclusion of the SI process. As a result, the TMDL process established a link between the impairment and benthic community stressors.

Middle Ohio River North and South Watersheds: TMDL Report
24
4.2 Data Review
WVDEP generated the primary data used in SI through its pre-TMDL monitoring program. The program included water quality monitoring, benthic sampling, and habitat assessment. In addition, the biologists’ comments regarding stream condition and potential stressors and sources were captured and considered. Other data sources were: source tracking data, WVDEP mining activities data, NLCD 2001 landuse information, Natural Resources Conservation Service (NRCS) State Soil Geographic database (STATSGO) soils data, National Pollutant Discharge Elimination System (NPDES) point source data, and literature sources.
4.3 Candidate Causes/Pathways
The first step in the SI process was to develop a list of candidate causes, or stressors. The candidate causes responsible for biological impairments are listed below:
Metals contamination (including metals contributed through soil erosion) causes toxicity
Acidity (low pH) causes toxicity
Basic (high pH >9) causes toxicity
Increased ionic strength causes toxicity
Organic enrichment (e.g. sewage discharges and agricultural runoff cause habitat alterations
Increased metals flocculation and deposition causes habitat alterations (e.g., embeddedness)
Increased total suspended solids (TSS)/erosion and altered hydrology cause sedimentation and other habitat alterations
Altered hydrology causes higher water temperature, resulting in direct impacts
Altered hydrology, nutrient enrichment, and increased biochemical oxygen demand (BOD) cause reduced dissolved oxygen (DO)
Algal growth causes food supply shift
High levels of ammonia cause toxicity (including increased toxicity due to algal growth)
Chemical spills cause toxicity
A conceptual model was developed to examine the relationship between candidate causes and potential biological effects. The conceptual model (Figure 4-1) depicts the sources, stressors, and pathways that affect the biological community.

Middle Ohio River North and South Watersheds: TMDL Report
25
Figure 4-1. Conceptual model of candidate causes and potential biological effects
Mining LoggingUrbanization/ Development
Point Sources(non-mining)
Agriculture
CSOs
MetalsContamination
IncreasedTSS/erosion
NutrientEnrichment
Oil & GasDevelopment
AMD
Toxicity
Shift in Macroinvertebrate Community
Increased Sedimentationand/or Turbidity
Acidity(low pH)
or high pH
Altered Hydrology,Riparian Impacts,
Channelization, etc.
Higher WaterTemperature
Reduced DO
AlgalGrowth
Organic Enrichment /
Increased BOD
Food Supply Shift
High Ammonia (NH3 +NH4)
IncreasedpH
Chemical Spills
Increases Toxicity
Habitat Alterations,Reduced Interstitial Spacing,
Smothering, ReducedComplexity, Behavioral
Changes, etc.
High Sulfates/ High Chlorides/Ionic Strength
Potential sources are listed in top-most rectangles. Potential stressors and interactions are in ovals. Candidate causes are numbered (1) through (12). Note that some causes have more than one stressor or more than one associated step.
12,34
8
9
10
11
12
WV Biological TMDLs WV Biological TMDLs –– Conceptual Model of Candidate CausesConceptual Model of Candidate Causes
6
7
5
5
5

Middle Ohio River South and North Watersheds: TMDL Report
26
4.4 Stressor Identification Results
The SI process determined the significant causes of biological impairment. Biological impairment was linked to a single stressor in some cases and multiple stressors in others. The SI process identified the following stressors for the biologically impaired waters in the Middle Ohio River South and Middle Ohio River North watersheds:
Organic enrichment (the combined effects of oxygen-demanding pollutants, nutrients, and the resultant algal and habitat alteration)
Sedimentation
After stressors were identified, WVDEP determined the pollutants for which TMDLs were required to address the impairment.
Where the SI process identified organic enrichment as the cause of biological impairment, data also indicated violations of the fecal coliform water quality criteria. The predominant sources of both organic enrichment and fecal coliform bacteria in the watershed are inadequately treated sewage and runoff from agricultural landuses. WVDEP determined that implementation of fecal coliform TMDLs would remove untreated sewage and significantly reduce loadings in agricultural runoff and resolve the biological impairment in these streams. Therefore, fecal coliform TMDLs will serve as a surrogate where organic enrichment was identified as a stressor.
WVDEP initially pursued the development of TMDLs directly for sediment to address the sedimentation biological stressor. The intended approach involved selection of a reference stream with an unimpaired biological condition, prediction of the sediment loading present in the reference stream, and use of the area-normalized sediment loading of the reference stream as the TMDL endpoint for sediment impaired waters.
Big Run (WV-OMN-13-CG-2) was selected as the achievable reference stream for both the Middle Ohio River South and Middle Ohio River North watersheds as it shares similar landuse, ecoregion and geomorphologic characteristics with the sediment impaired streams. The location of Big Run is shown in Figure 4-2.

Middle Ohio River South and North Watersheds: TMDL Report
27
Figure 4-2. Location of the sediment reference stream, Big Run (WVOMN-13-CG-2)
All of the biologically impaired waters for which sedimentation was identified as a significant stressor are also impaired pursuant to total iron water quality criteria and the TMDL assessment for iron included representation and allocation of iron loadings associated with sediment. In each stream, the sediment loading reduction necessary for attainment of water quality criterion for iron exceeds that which was determined to be necessary using the reference approach. As such, the iron TMDLs are acceptable surrogates for biological impairments from sedimentation. See Section 8.5 for further description of the correlation between sedimentation and iron.
Identified stressors and TMDLs developed for streams in the Middle Ohio River South and Middle Ohio River North watersheds are presented in Table 4-1 and Table 4-2, respectively.
Table 4-1. Significant stressors of biologically impaired streams in the Middle Ohio River South watersheds
NHD-Code Stream Name Significant Stressors TMDLs Developed
WV-OMS-2 Oldtown Creek organic enrichment, sedimentation fecal coliform, total iron
WV-OMS-2-D Turkey Run organic enrichment, sedimentation fecal coliform, total iron
WV-OMS-2-F Potter Creek sedimentation total iron
WV-OMS-2-G-1 UNT/Robinson Run RM 2.42 organic enrichment, sedimentation fecal coliform, total iron
WV-OMS-4 Mill Run organic enrichment fecal coliform
Sediment Reference StreamBig Run Watershed
0 5 10 15 20 252.5Miles
/

Middle Ohio River South and North Watersheds: TMDL Report
28
NHD-Code Stream Name Significant Stressors TMDLs Developed
WV-OMS-6 Tenmile Creek organic enrichment, sedimentation fecal coliform, total iron
WV-OMS-6-D UNT/Tenmile Creek RM 5.33 sedimentation total iron
WV-OMS-11 Sliding Hill Creek organic enrichment, sedimentation fecal coliform, total iron
WV-OMS-11-A UNT/Sliding Hill Creek RM 1.25 organic enrichment, sedimentation fecal coliform, total iron
WV-OMS-13 Little Broad Run organic enrichment, sedimentation fecal coliform, total iron
WV-OMS-23 Little Mill Creek organic enrichment, sedimentation fecal coliform, total iron
WV-OMS-24 Mill Creek organic enrichment, sedimentation fecal coliform, total iron
WV-OMS-24-P Bar Run organic enrichment, sedimentation fecal coliform, total iron
WV-OMS-24-U Cow Run organic enrichment, sedimentation fecal coliform, total iron
WV-OMS-24-U-8 Left Fork/Cow Run organic enrichment, sedimentation fecal coliform, total iron
WV-OMS-24-AF Parchment Creek organic enrichment, sedimentation fecal coliform, total iron WV-OMS-24-AF-17 Cox Fork organic enrichment, sedimentation fecal coliform, total iron WV-OMS-24-AF-27 Wolfe Creek organic enrichment, sedimentation fecal coliform, total iron
WV-OMS-24-AN Sycamore Creek organic enrichment, sedimentation fecal coliform, total iron WV-OMS-24-AN-1
Left Fork/Sycamore Creek organic enrichment, sedimentation fecal coliform, total iron
WV-OMS-24-BA-20 Grasslick Creek organic enrichment, sedimentation fecal coliform, total iron WV-OMS-24-BA-21 Bear Fork organic enrichment fecal coliform
WV-OMS-24-BH Elk Fork organic enrichment fecal coliform
WV-OMS-24-BI Little Mill Creek organic enrichment, sedimentation fecal coliform, total iron
WV-OMS-24-BI-9 Frozencamp Creek organic enrichment, sedimentation fecal coliform, total iron WV-OMS-24-BI-12 Little Creek organic enrichment, sedimentation fecal coliform, total iron WV-OMS-24-BI-17 Buffalo Creek organic enrichment, sedimentation fecal coliform, total iron
WV-OMS-25 Spring Creek organic enrichment, sedimentation fecal coliform, total iron
WV-OMS-28 Cedar Run organic enrichment, sedimentation fecal coliform, total iron
WV-OMS-30 Sandy Creek organic enrichment, sedimentation fecal coliform, total iron
WV-OMS-30-K Crooked Fork organic enrichment, sedimentation fecal coliform, total iron
WV-OMS-30-O Trace Fork organic enrichment, sedimentation fecal coliform, total iron
WV-OMS-30-P Beatty Run organic enrichment, sedimentation fecal coliform, total iron
WV-OMS-30-S Right Fork/Sandy Creek organic enrichment, sedimentation fecal coliform, total iron
WV-OMS-30-R Left Fork/Sandy Creek organic enrichment, sedimentation fecal coliform, total iron
WV-OMS-30-R-1 Copper Fork organic enrichment, sedimentation fecal coliform, total iron
WV-OMS-30-R-8 Turkey Fork organic enrichment, sedimentation fecal coliform, total iron
WV-OMS-30-R-15 Nesselroad Run organic enrichment, sedimentation fecal coliform, total iron

Middle Ohio River South and North Watersheds: TMDL Report
29
NHD-Code Stream Name Significant Stressors TMDLs Developed
WV-OMS-35 Washington Run organic enrichment, sedimentation fecal coliform, total iron
WV-OMS-44 Pond Creek organic enrichment, sedimentation fecal coliform, total iron
WV-OMS-44-F-2 Jesse Run sedimentation total iron
WV-OMS-46-A South Fork/Lee Creek organic enrichment, sedimentation fecal coliform, total iron
WV-OMS-46-B North Fork/Lee Creek organic enrichment, sedimentation fecal coliform, total iron
WV-OMS-46-B-31 Gunners Run organic enrichment, sedimentation fecal coliform, total iron
WV-OMS-57 Sandy Creek organic enrichment, sedimentation fecal coliform, total iron
WV-OMS-57-D Vaughts Run organic enrichment, sedimentation fecal coliform, total iron
WV-OMS-57-O UNT/Sandy Creek RM 4.97 organic enrichment fecal coliform
WV-OMS-65 Pond Run organic enrichment, sedimentation fecal coliform, total iron
WV-OMS-65-A Little Pond Run organic enrichment, sedimentation fecal coliform, total iron
WV-OMS-66 Briscoe Run organic enrichment, sedimentation fecal coliform, total iron
WV-OMS-69 Big Run organic enrichment, sedimentation fecal coliform, total iron
WV-OMS-69-F Plum Run organic enrichment, sedimentation fecal coliform, total iron
WV-OMS-69-J Hogland Run organic enrichment, sedimentation fecal coliform, total iron
Table 4-2. Significant stressors of biologically impaired streams in the Middle Ohio River North watersheds
NHD-Code Stream Name Significant Stressors TMDLs Developed
WV-OMN-13 Middle Island Creek organic enrichment, sedimentation fecal coliform, total iron
WV-OMN-13-L McKim Creek organic enrichment fecal coliform
WV-OMN-13-V Sugar Creek organic enrichment fecal coliform
WV-OMN-13-BF Sancho Creek sedimentation total iron
WV-OMN-13-BK Point Pleasant Creek organic enrichment, sedimentation fecal coliform, total iron
WV-OMN-13-BK-4 Pursley Creek organic enrichment, sedimentation fecal coliform, total iron WV-OMN-13-BK-21 Peach Fork organic enrichment, sedimentation fecal coliform, total iron
WV-OMN-13-BM Gorrell Run organic enrichment fecal coliform
WV-OMN-13-CG Indian Creek organic enrichment, sedimentation fecal coliform, total iron
WV-OMN-13-CH McElroy Creek organic enrichment, sedimentation fecal coliform, total iron WV-OMN-13-CH-34-B Big Battle Run organic enrichment fecal coliform WV-OMN-13-DA-12 Wilhelm Run organic enrichment fecal coliform WV-OMN-13-DA-20
Right Fork/Arnold Creek organic enrichment, sedimentation fecal coliform, total iron
WV-OMN-13-DV Meathouse Fork organic enrichment, sedimentation fecal coliform, total iron

Middle Ohio River South and North Watersheds: TMDL Report
30
NHD-Code Stream Name Significant Stressors TMDLs Developed
WV-OMN-13-DW-9 Buckeye Run organic enrichment, sedimentation fecal coliform, total iron
WV-OMN-36 Cow Hollow Run organic enrichment fecal coliform
WV-OMN-45-A Doolin Run organic enrichment fecal coliform
WV-OMN-45-H Little Fishing Creek organic enrichment, sedimentation fecal coliform, total iron
WV-OMN-45-AG South Fork/Fishing Creek organic enrichment, sedimentation fecal coliform, total iron
WV-OMN-45-AG-7 Buffalo Run organic enrichment, sedimentation fecal coliform, total iron WV-OMN-45-AG-15 Arches Fork organic enrichment, sedimentation fecal coliform, total iron WV-OMN-45-AG-16 Fallen Timber Run organic enrichment, sedimentation fecal coliform, total iron WV-OMN-45-AG-19 Price Run organic enrichment, sedimentation fecal coliform, total iron
5.0 METALS SOURCE ASSESSMENT
This section identifies and examines the potential sources of iron impairments in the Middle Ohio River South and Middle Ohio River North watersheds. Sources can be classified as point (permitted) or nonpoint (non-permitted) sources.
A point source, according to 40 CFR 122.3, is any discernible, confined, and discrete conveyance, including but not limited to any pipe, ditch, channel, tunnel, conduit, well, discrete fissure, container, rolling stock, concentrated animal feeding operation, landfill leachate collection system, and vessel or other floating craft from which pollutants are or may be discharged. The NPDES program, established under Clean Water Act Sections 318, 402, and 405, requires permits for the discharge of pollutants from point sources. For purposes of this TMDL, NPDES-permitted discharge points are considered point sources.
Nonpoint sources of pollutants are diffuse, non-permitted sources. They most often result from precipitation-driven runoff. For the purposes of these TMDLs only, WLAs are given to NPDES-permitted discharge points, and LAs are given to discharges from activities that do not have an associated NPDES permit, such as bond forfeiture sites and AML. The assignment of LAs to AML and bond forfeiture sites does not reflect any determination by WVDEP or USEPA as to whether there are, in fact, unpermitted point source discharges within these landuses. Likewise, by establishing these TMDLs with mine drainage discharges treated as LAs, WVDEP and USEPA are not determining that these discharges are exempt from NPDES permitting requirements.
The physiographic data discussed in Section 3.2 enabled the characterization of pollutant sources. As part of the TMDL development process, WVDEP performed additional field-based source tracking activities to supplement the available source characterization data. WVDEP staff recorded physical descriptions of pollutant sources and the general stream condition in the

Middle Ohio River South and North Watersheds: TMDL Report
31
vicinity of the sources. WVDEP collected global positioning system (GPS) data and water quality samples for laboratory analysis as necessary to characterize the sources and their impacts. Source tracking information was compiled and electronically plotted on maps using GIS software. Detailed information, including the locations of pollutant sources, is provided in the following sections, the Technical Report, and the ArcGIS Viewer Project.
5.1 Metals Point Sources
Metals point sources are classified by the mining- and non-mining-related permits issued by WVDEP. The following sections discuss the potential impacts and the characterization of these source types, the locations of which are displayed in Figure 5-1 and Figure 5-2.

Middle Ohio River South and North Watersheds: TMDL Report
32
(Note: permits in close proximity appear to overlap in the figure)
Figure 5-1. Metals point sources in the Middle Ohio River South
"!;Î"!;Î
"!;Î"!;Î"!;Î "!;Î
"!;Î"!;Î
"!;Î"!;Î"!;Î"!;Î
"!;Î "!;Î"!;Î"!;Î"!;Î"!;Î"!;Î"!;Î"!;Î"!;Î"!;Î"!;Î"!;Î"!;Î"!;Î"!;Î
"!;Î "!;Î"!;Î"!;Î"!;Î
"!;Î
"!;Î"!;Î"!;Î
"!;Î"!;Î
"!;Î"!;Î"!;Î
"!;Î"!;Î"!;Î
"!;Î"!;Î"!;Î "!;Î"!;Î
"!;Î
"!;Î"!;Î"!;Î
"!;Î
"!;Î
"!;Î"!;Î
"!;Î"!;Î
"!;Î"!;Î"!;Î"!;Î"!;Î"!;Î
"!;Î"!;Î"!;Î
"!;Î"!;Î"!;Î
[i[i[i[i[i [i[i[i[i [i
[i
®
0 5 10 15 202.5Miles
Ohio River Mainstem
Streams
Metals Impaired Streams
[i Mining_Outlets_9_8_10_comment_Join_SWS
"!;Î NPDES Outlets- OWR Non-Mining Metals
Middle Ohio River South
TMDLSHEDS
Big Run
Briscoe Run
Broad Run
Cedar Run
Crooked Creek
Lee Creek
Little Broad Run
Little Mill Creek
Little Sandy Creek
Mill Creek
Mill Run
Oldtown Creek
Pond Creek
Pond Run
Sandy Creek (OMS-30)
Sandy Creek (OMS-57)
Sliding Hill Creek
Spring Creek
Tenmile Creek
Washington Run
West Creek

Middle Ohio River South and North Watersheds: TMDL Report
33
(Note: permits in close proximity appear to overlap in the figure)
Figure 5-2. Metals point sources in the Middle Ohio River North watersheds
[i
"!;Î"!;Î "!;Î
"!;Î
"!;Î
"!;Î
"!;Î"!;Î"!;Î"!;Î
"!;Î "!;Î"!;Î"!;Î
"!;Î"!;Î"!;Î"!;Î"!;Î"!;Î"!;Î"!;Î"!;Î
"!;Î
"!;Î"!;Î
"!;Î"!;Î"!;Î"!;Î"!;Î"!;Î"!;Î"!;Î"!;Î"!;Î
"!;Î"!;Î
"!;Î"!;Î
®
0 5 10 15 202.5Miles
Ohio River Mainstem
Streams
Metals Impaired Streams
"!;Î NPDES Outlets- OWR Non-Mining Metals
[i NPDES Outlets- Mining Metals
Middle Ohio River North
TMDLSHEDS
Bull Creek
Cow Creek
Cow Hollow Run
Fishing Creek
French Creek
Middle Island Creek
Proctor Creek
Sugarcamp Run
Williams Run

Middle Ohio River South and North Watersheds: TMDL Report
34
5.1.1 Mining Point Sources
The Surface Mining Control and Reclamation Act of 1977 (SMCRA, Public Law 95-87) and its subsequent revisions were enacted to establish a nationwide program to protect the beneficial uses of land or water resources, protect public health and safety from the adverse effects of current surface coal mining operations, and promote the reclamation of mined areas left without adequate reclamation prior to August 3, 1977. SMCRA requires a permit for development of new, previously mined, or abandoned sites for the purpose of surface mining. Permittees are required to post a performance bond that will be sufficient to ensure the completion of reclamation requirements by a regulatory authority in the event that the applicant forfeits its permit. Mines that ceased operations before the effective date of SMCRA (often called “pre-law” mines) are not subject to the requirements of the SMCRA.
SMCRA Title IV is designed to provide assistance for the reclamation and restoration of abandoned mines; whereas Title V states that any surface coal mining operations must be required to meet all applicable performance standards. Some general performance standards include the following:
Restoring the affected land to a condition capable of supporting the uses that it was capable of supporting prior to any mining
Backfilling and compacting (to ensure stability or to prevent leaching of toxic materials) to restore the approximate original contour of the land, including all highwalls
Minimizing disturbances to the hydrologic balance and to the quality and quantity of water in surface water and groundwater systems both during and after surface coal mining operations and during reclamation by avoiding acid or other toxic mine drainage
Untreated mining-related point source discharges from deep, surface, and other mines may have low pH values (i.e. acidic) and contain high concentrations of metals (iron and aluminum). Mining-related activities are commonly issued NPDES discharge permits that contain effluent limits for total iron, total manganese, total suspended solids, and pH. Many permits also include effluent monitoring requirements for total aluminum and some, more recently issued permits include aluminum water quality based effluent limits. WVDEP’s Division of Mining and Reclamation (DMR) provided a spatial coverage of the mining-related NPDES permit outlets. The discharge characteristics, related permit limits, and discharge data for these NPDES outlets were acquired from West Virginia’s ERIS database system. The spatial coverage was used to determine the location of the permit outlets. Additional information was needed, however, to determine the areas of the mining activities. WVDEP DMR also provided spatial coverage of the mining permit areas and related SMCRA Article 3 and NPDES permit information. WVDEP DWWM personnel used the information contained in the SMCRA Article 3 and NPDES permits to further characterize the mining point sources. Information gathered included type of discharge, pump capacities, and drainage areas (including total and disturbed areas). Using this information, the mining point sources were then represented in the model and assigned individual WLAs for metals.

Middle Ohio River South and North Watersheds: TMDL Report
35
There are four mining-related NPDES permits, with twelve associated outlets in the metals impaired watersheds of the Middle Ohio River South and the Middle Ohio River North watersheds. Some permits include multiple outlets with discharges to more than one TMDL watershed. A complete list of the permits and outlets is provided in Appendix F of the Technical Report. Figure 5-1 illustrates the extent of the mining NPDES outlets in the watershed.
5.1.2 Non-mining Point Sources
WVDEP DWWM controls water quality impacts from non-mining activities with point source discharges through the issuance of NPDES permits. WVDEP’s OWR NPDES GIS coverage was used to determine the locations of these sources, and detailed permit information was obtained from WVDEP’s ERIS database. Sources may include the process wastewater discharges from water treatment plants and industrial manufacturing operations, and stormwater discharges associated with industrial activity.
There are 48 modeled non-mining NPDES permits in the watersheds of metals impaired streams, which are displayed in Figure 5-1. Thirty-nine of the non-mining permits regulate stormwater associated with industrial activity, highways, or municipalities and implement stormwater benchmark values of 100 mg/L TSS and/or 1.0 mg/L total iron. Five additional individual industrial permits represent stormwater or discharges. The remaining non-mining NPDES permits are for three wastewater plants and one solid waste landfill. The solid waste landfill is permitted with multiple outlets, one of which, listed as WV0077038-001, is an emergency overflow that has infrequent discharges, so no flow data or permit limits exist. This outlet has thus been assigned criterion end of pipe. A complete list of the permits, outlets, and limits is provided in Appendix F of the Technical Report.
5.1.3 Construction Stormwater Permits
The discharges from construction activities that disturb more than one acre of land are legally defined as point sources and the sediment introduced from such discharges can contribute iron. WVDEP issues a General NPDES Permit (permit WV0115924) to regulate stormwater discharges associated with construction activities with a land disturbance greater than one acre. These permits require that the site have properly installed best management practices (BMPs), such as silt fences, sediment traps, seeding/mulching, and riprap, to prevent or reduce erosion and sediment runoff. The BMPs will remain intact until the construction is complete and the site has been stabilized. Individual registration under the General Permit is usually limited to less than one year.
When data were compiled, there were 59 active construction sites with a total disturbed acreage of 623 acres registered under the Construction Stormwater General Permit (CSGP) in the watersheds of metals impaired waters (Figure 5-3 and Figure 5-4).

Middle Ohio River South and North Watersheds: TMDL Report
36
(Note: permits in close proximity appear to overlap in the figure)
Figure 5-3. Construction stormwater permits in the Middle Ohio River South watershed
"!;Î
"!;Î
"!;Î
"!;Î
"!;Î
"!;Î
"!;Î
"!;Î
"!;Î
"!;Î
"!;Î
"!;Î
"!;Î
"!;Î
"!;Î
"!;Î
"!;Î
"!;Î
"!;Î
"!;Î
"!;Î
"!;Î
"!;Î
"!;Î
"!;Î
"!;Î
"!;Î
"!;Î
"!;Î
"!;Î"!;Î
"!;Î
"!;Î
"!;Î"!;Î
"!;Î
"!;Î "!;Î
"!;Î
"!;Î
"!;Î
"!;Î
"!;Î
"!;Î
"!;Î
"!;Î
"!;Î
"!;Î
"!;Î
®
0 5 10 15 202.5Miles
Ohio River Mainstem
Streams
Metals Impaired Streams
"!;Î Construction Stormwater GP Registrations
Middle Ohio River South
TMDLSHEDS
Big Run
Briscoe Run
Broad Run
Cedar Run
Crooked Creek
Lee Creek
Little Broad Run
Little Mill Creek
Little Sandy Creek
Mill Creek
Mill Run
Oldtown Creek
Pond Creek
Pond Run
Sandy Creek (OMS-30)
Sandy Creek (OMS-57)
Sliding Hill Creek
Spring Creek
Tenmile Creek
Washington Run
West Creek

Middle Ohio River South and North Watersheds: TMDL Report
37
(Note: permits in close proximity appear to overlap in the figure)
Figure 5-4. Construction stormwater permits in the Middle Ohio River North watershed
"!;Î
"!;Î
"!;Î
"!;Î
"!;Î
"!;Î
"!;Î
"!;Î
"!;Î
"!;Î
®
0 5 10 15 202.5Miles
Ohio River Mainstem
Streams
Metals Impaired Streams
"!;Î Construction Stormwater GP Registrations
Middle Ohio River North
TMDLSHEDS
Bull Creek
Cow Creek
Cow Hollow Run
Fishing Creek
French Creek
Middle Island Creek
Proctor Creek
Sugarcamp Run
Williams Run

Middle Ohio River South and North Watersheds: TMDL Report
38
5.1.4 Municipal Separate Storm Sewer Systems (MS4)
Runoff from residential and urbanized areas during storm events can be a significant sediment source. USEPA’s stormwater permitting regulations require public entities to obtain NPDES permit coverage for stormwater discharges from MS4s in specified urbanized areas. As such, their stormwater discharges are considered point sources and are prescribed WLAs.
The Parkersburg, Vienna, and Williamstown urbanized areas overlap Middle Ohio River South TMDL watersheds. These cities and the West Virginia Division of Highways (DOH) have MS4 permits in the modeled portion of the watershed. The City of Parkersburg’s MS4 falls within a small portion of the Pond Run TMDL watershed. The City of Vienna’s MS4 drains to significant acreage within the Pond Run and Briscoe Run TMDL watersheds. The Town of Willamstown’s MS4 drains to a small portion of the Big Run TMDL watershed. DOH MS4 area occurs within and between the MS4 boundaries of all three cities, as well as portions of the Sandy Creek TMDL watershed.
MS4 source representation was based upon precipitation and runoff from landuses determined from the modified NLCD 2001 landuse data, the jurisdictional boundary of the cities, and the transportation-related drainage areas for which DOH has MS4 responsibility. In certain areas, urban/residential stormwater runoff may drain to both CSO and MS4 systems. WVDEP consulted with local governments and obtained information to determine drainage areas to the respective systems and best represent MS4 pollutant loadings. The location and extent of the four MS4 jurisdictions are shown in Figure 5-5.

Middle Ohio River South and North Watersheds: TMDL Report
39
Figure 5-5. MS4 jurisdictions in the Middle Ohio River South watershed
®
0 5 10 15 202.5Miles
Ohio River Mainstem
Streams
Metals Impaired Streams
Municipal Separate Storm Sewer System (MS4)
Williamstown
Parkersburg
DOH
Vienna

Middle Ohio River South and North Watersheds: TMDL Report
40
5.2 Metals Nonpoint Sources
In addition to point sources, nonpoint sources can contribute to water quality impairments related to metals. AML may contribute acid mine drainage (AMD), which produces low pH and high metals concentrations in surface and subsurface water. Similarly, facilities that were subject to the Surface Mining Control and Reclamation Act of 1977 (SMCRA, Public Law 95-87) during active operations and subsequently forfeited their bonds and abandoned operations can be a significant source of metals. Also, land disturbing activities that introduce excess sediment are considered nonpoint sources of metals.
5.2.1 Abandoned Mine Lands
WVDEP’s Office of Abandoned Mine Lands & Reclamation (AML&R) was created in 1981 to manage the reclamation of lands and waters affected by mining prior to passage of SMCRA in 1977. AML&R’s mission is to protect public health, safety, and property from past coal mining resources. The AML program is funded by a fee placed on coal mining. Allocations from the AML fund are made to state and tribal agencies through the congressional budgetary process.
The Office of AML&R identified locations of AML in the Middle Ohio River South and Middle Ohio River North watersheds from their records. In addition, source tracking efforts by WVDEP DWWM and AML&R identified additional AML sources (discharges, seeps, portals, and refuse piles). Field data, such as GPS locations, water samples, and flow measurements, were collected to represent these sources and characterize their impact on water quality. Based on this work, AML does not represent a significant area in the watershed, but identified seeps do contribute to iron impairments in a small number of impaired streams for which TMDLs are presented. Disturbed area and identified seeps are displayed on Figure 5-6 and Figure 5-7.
5.2.2 SMCRA Bond Forfeiture Sites
Mining permittees are required to post a performance bond to ensure the completion of reclamation requirements. When a bond is forfeited, WVDEP assumes the responsibility for the reclamation requirements. The Office of Special Reclamation in WVDEP’s Division of Land Restoration provided bond forfeiture site locations and information regarding the status of land reclamation and water treatment activities. There were no sites with unreclaimed land disturbance or unresolved water quality impacts to represent. There were no sites with ongoing water treatment activities. Further, there were no unreclaimed bond forfeiture sites located in the metals impaired TMDL watersheds.

Middle Ohio River South and North Watersheds: TMDL Report
41
Figure 5-6. Metals non-point sources in the Middle Ohio River South watershed
%2%2%2
%2
È)È)
È) È)
È)
È)
È)
È) È)
È)È)
È)
È)
È)È)
È) È)
È)
È)
È)
È)È)È)È)
È)
È)
È)
È)È)
È)È)
È)
È)
È)
È)
È)
È)
È)È)
È)È)
È)
È)
È)
È)
È)È)È)
È) È)
È)È)
È)
È)
È)
È)
È) È)
È)
È)
È)
È)
È)
È)
È)
È)
È)
È)
È)
È)
È)
È)È)
È)
È)
È)È)È)
È)
È)
È)
È)
È)
È)
È) È)
È)
È)
È)
È)
È)
È)
È)
È)
È)
È)
È)
È)
È)
È)
È)
È)
È)
È)
È)
È)
È)
È)
È)
È)
È)
È)È)
È)È)
È)
È)
È)
È)
È)
È)
È)È)
È)È)
È)
È)
È)È)
È)
È)
È)
È)
È)
È)
È)È)
È)
È)È)
È)È)È)
È)
È)
È)
È)
È)È)
È)
È)
È)
È)
È) È)
È)
È)
È) È)
È)
È)
È) È)
È)
È)
È) È)
È)
È)
È)
È)
È)
È)
È)È)
È)
È)
È)
È)
È)
È)
È)
È)
È)È)
È)
È)
È)
È)
È)
È)
È)
È)
È)
È)
È)
È)
È)
È)È)
È)
È)
È)
È)
È)
È)
È)
È)
È)
È)È)
È)È)
È)
È)
È)È)
È)
È)
È)
È)
È) È)
È)
È)
È)
È)
È)
È)
È)È)È)
È)
È)
È)
È)
È) È)
È)
È)È)È)
È)
È) È)
È)
È)
È)È)È)È)È)
È)
È)
È)
È)È)È)
È)
È)È)
È)
È)
È)È)
È)
È)
È)
È)
È)È)
È)
È)
È)È)
È)
È)
È)È)
È)È)È)È)È)È)
È)È)
È)È)
È)È)
È)
È)
È)
È)
È)
È)
È)È)
È) È)
È)È)È)
È)È)
È)
È)
È)È)
È)È)È)
È)
È)
È)
È)È)
È)È)
È)
È)
È)È)
È)
È)
È)
È)È)
È)
È)
È)
È)
È)
È)
È)
È)È)
È)
È)
È)
È)
È)È)È)
È)
È)
È)
È)
È)
È)
È)
È)
È)
È)È)
È)
È)
È)È)
È)È)
È)È)È)È)
È)
È)
È)
È)
È)
È)
È)È)
È)È)
È)È)
È)È)È)
È)
È)
È)
È)È)
È)
È)
È)
È) È)
È)È)
È)È)
È)È)
È)È)
È)È)
È)
È)È)È)È)
È)È)
È)
È)È)È)
È)
È)È)
È)
È)
È)
È)
È)
È)
È) È)
È)È)
È)
È)
È)
È) È) È)
È)
È)
È) È)
È) È)
È)È)
È)
È)
È)
È)
È)
È)
È)
È)
È)
È)
È)
È)
È)
È)
È)
È)
È)
È)È)
È)È)
È)È)È)
È)È)È)È)È)
È)
È)È)
È)
È)È)
È)
È)
È)
È)
È)
È) È)
È)È)
È)
È)
È)È)
È)
È)
È) È)È)
È)
È)È)È)
È)
È)
È)
È)
È)
È)
È)È)È)È)È)
È)
È)
È)È)
È)
È)
È)È)È) È) È)È)
È)È)
È)
È)
È)
È)
È)È)
È)
È)
È)
È)
È)È)È) È)
È)È)
È)È)
È)
È)
È)
È)È)
È)
È)
È)
È)
È)
È)
È)
È)È)
È)È)
È)
È)È)
È)
È) È)
È)È)È)
È)È)È)
È)
È)
È)
È)
È)È)
È)
È)
È)
È)È)
È)
È)
È)
È)
È) È)
È)
È)
È)
È)È)
È)
È)
È)
È)
È)
È)
È)È)
È)È)
È)
È)
È)
È)È)È)
È)
È)È)
È)
È)
È)È)
È)
È)È)
È)
È)
È)
È)
È)È)È)È)
È)
È)
È)
È)
È)
È)
È)È)
È)
È)È)
È)
È)
È)
È)
È)È)
È)È)
È)
È)
È)
È)È)
È)È)
È)
È)
È)
È)
È)
È)
È)
È)
È)È)
È)
È)È)
È)È)È)È)È)È)È)
È)
È)
È)
È)
È)
È)
È)
È)
È)
È)
È) È)È)È)
È)
È)
È)È)
È)È)
È)
È)
È)È)
È)
È)
È)
È)
È)
È)
È)
È)
È)
È)
È)
È)
È)
È)È)
È)
È)
È)
È)È) È)
È)
È)
È)
È)
È)
È)
È)
È)
È)
È)È)È)
È)È)
È)
È)È)
È)
È)È)
È)È)
È)È)
È)
È)
È)È)
È)
È)È)
È)È)
È)È)
È)
È)
È)
È)
È)
È)È)È)
È)
È)
È)
È)
È)
È)
È)
È)È)
È)
È)
È)
È)
È)È)
È)È)È)È)È)
È)È)
È)
È)
È)
È)
È)È)
È)
È)
È)
È)
È)È)
È)
È)
È)
È)
È)
È)
È)È)
È)
È)È)
È)
È)
È)
È)
È)
È)
È)
È)
È)
È)
È)
È)
È)È)
È)
È)
È)
È)
È)
È)È)
È)
È)
È)È)
È)
È)
È)È)
È)
È)
È)
È)È)
È)
È)
È)
È)
È)
È)
È)
È)
È) È)
È)
È)È)È)
È)
È)
È)
È)
È)
È)
È)
È)È)È)
È)
È)
È)
È)
È)
È)
È)
È)È)È)
È)
È)È)È)
È)
È)
È)È)È)
È)
È)È)
È)
È)È)È)È)
È)
È)
È)
È)È)
È)È)
È)
È)
È)
È)
È)
È)
È)
È)
È)
È)
È)
È)
È)È)
È)È)
È)
È)
È)
È)
È)
È)
È)
È)
È)
È)
È)
È)
È)
È)
È)
È)
È)
È)
È)
È)
È)
È)
È)
È)
È)
È)
È)
È)
È)
È)
È)È)
È)È)È)
È)
È)
È)
È)
È)
È)
È)
È)
È)
È)
È)
È)
È)
È)
È)
È)
È)
È)
È)
È)
È)È)
È)
È)
È)
È) È) È)
È)
È)
È)
È)
È)
È)
È)
È)
È)È)
È)
È)
È)
È)
È)
È)
È)
È)
È)
È)
È)È)
È)
È)
È)
È)
È)
È)È)
È)È)
È)
È) È)
È)È) È)
È)
È)
È)
È)
È)È) È)
È)
È)
È)
È)
È)
È)È)
È)
È)
È)
È)
È)È)
È)
È)
È)
È)È)
È) È)È)È) È)
È)
È)
È)
È)
È)
È)È)
È)
È)
È)
È)
È)
È)È) È)È) È)È)
È)È)
È)
È)
È)
È)
È)
È) È)
È)È)
È)
È)
È)
È) È)È)
È)
È)
È)
È)È)
È)
È)È)
È)
È)
È)
È) È)
È)
È)
È)
È)
È)
È)
È)
È)
È)È)È)
È)È)
È) È)
È)È)È)
È)
È) È)
È)
È)
È)
È)
È)
È)È)
È)
È)
È)
È)
È)
È)
È) È)
È)È)È)
È)
È)È)
È)
È)È)
È)
È)
È)
È)
È) È)È)
È)È)
È)È)
È)È)È)È)
È)
È)
È)
È)
È)È)
È)
È)
È)
È)
È)
È)
È)
È)
È)
È)È)
È)È)
È)
È)È)
È)
È)
È)
È)
È)È)
È)
È)È)
È)
È)
È)
È)
È)
È)È)
È) È)
È)
È)
È)
È)È)
È)È)
È)
È)È)
È)
È)
È)È)
È)
È)È)
È)
È)È)
È)
È)
È)
È)
È)È)È)
È)È)
È)
È)
È)
È)
È)È)È)
È)
È)
È)È)
È)
È)
È)
È)
È)
È)È)
È)
È)
È)
È)
È)
È)
È)
È)
È) È)
È)
È)È)
È)
È)È)
È)
È)È)
È)
È)
È)È) È)
È)
È)
È)È)
È)
È)È)
È)È)
È)È)
È)È)
È)
È) È)
È)
È)È)
È)
È)È)
È)
È)
È)
È)È)È)
È)
È)È)
È)
È)È)
È)
È)
È)
È)È)
È)
È)
È)
È)
È)
È)È)
È)
È)
È)È)
È)
È)È)
È)
È) È)
È)
È)
È)È)
È)
È)È)
È)È)È)
È)
È)
È)È)
È)
È)
È)
È)
È)
È)
È)
È)
È)
È)
È)
È)È)È)
È)È)
È)È)
È)
È)È) È)È)È)È)È)
È)
È)
È)
È)
È)
È)È)
È)
È)
È) È)
È)
È)
È) È)
È)
È)
È)
È)
È)
È)
È)
È)
È)
È)È)
È)
È)
È)È)È)
È)
È)
È)
È)È)
È)
È)
È)È)
È) È)È)
È)È)È)
È)
È)
È)
È)
È)
È)
È)
È)È)
È)
È)
È)È)
È)
®
0 5 10 15 202.5Miles
Ohio River Mainstem
È) Oil & Gas Wells
%2 AML Seeps
AML Highwalls
AML Areas
Streams
Metals Impaired Streams
Middle Ohio River South
TMDLSHEDS
Big Run
Briscoe Run
Broad Run
Cedar Run
Crooked Creek
Lee Creek
Little Broad Run
Little Mill Creek
Little Sandy Creek
Mill Creek
Mill Run
Oldtown Creek
Pond Creek
Pond Run
Sandy Creek (OMS-30)
Sandy Creek (OMS-57)
Sliding Hill Creek
Spring Creek
Tenmile Creek
Washington Run
West Creek

Middle Ohio River South and North Watersheds: TMDL Report
42
Figure 5-7. Metals non-point sources in the Middle Ohio River North watershed
È)
È)
È)
È)
È)
È)
È)
È)È)È)
È)
È)È)
È)
È)
È)
È)
È)È)
È)
È)È)
È)
È)È)
È)
È)È)
È)
È)È)
È)È) È) È)
È)È)È)
È)
È)È)
È)È) È)
È)È)
È)
È)È)È)
È)
È)È)
È)È)È) È)
È)
È)
È)
È)È)
È)
È)
È)
È)
È)È)
È)È) È)
È)È)È)
È)È)
È)
È)
È)È)È)È)
È)
È)
È)
È)
È)È)
È) È)È)
È)È)
È)
È)
È)
È)È)
È)
È)
È)
È)
È)
È)È)È)
È)
È)
È)È)È)
È)
È)È) È) È)È)
È)
È)
È)
È)È)
È)
È)È)È) È)È) È) È)
È)
È)
È)È) È)È)È)È)
È)
È)È)È)
È)
È)
È)
È)
È)
È)
È)
È)È)
È)
È)È)È)
È)
È)È)
È)È)
È) È)È)È)
È)
È)
È)
È)
È)
È)
È)È)
È)
È)
È)
È)È)È)
È)È)
È)
È)È)È)
È)
È)
È)
È)
È)
È)È)
È)
È)
È)
È)
È)
È)
È)
È)
È)
È)
È)
È)
È)
È)
È)
È)
È)
È)
È)
È)È)È)È)
È)È)
È)
È)
È)È)È)
È)
È)È)
È)
È)
È)È)È)
È)È)È)È)
È)
È)È)È)È)È)
È)È)
È)È)
È)
È)È)È)
È)
È)
È)È)
È)
È)
È)
È)
È) È)È)
È)
È)
È)
È)
È)
È)
È)
È)
È)
È)
È)
È)È)
È)
È)
È)È)
È)
È)È)
È)
È)
È)È)
È)
È)
È)
È)
È)
È)
È)
È)È)
È)È)
È)È)È)
È)È)
È)
È)È)
È)È)
È)
È) È)
È)
È)È)
È)
È)
È)
È)
È)
È)
È)È)
È)
È)
È)È)
È)
È)
È)
È)
È)
È)
È)È)
È)
È)È)
È)È)
È)
È)È)È)È)
È)
È)È)
È)
È)
È)
È)
È)
È)
È)
È)
È)
È)
È)
È)È)
È)
È)
È)È)È)
È)
È)
È)
È) È)È) È)È)È)
È)
È)
È)È)
È) È)
È)
È)
È)
È)
È)
È)
È)
È)
È)
È)
È)
È)
È)
È)
È)
È)
È)
È)
È)
È)
È)
È)
È)
È)
È)
È)
È)
È)
È)
È)
È)
È)
È)
È)
È)
È)
È)È)
È)
È)
È)
È)
È)
È)
È)
È)
È)
È)
È)
È)
È)
È)
È)
È)
È)
È)
È)
È)
È)È)
È)
È)È)
È)È)
È)
È)
È)
È)
È)
È)
È)
È)
È)
È)È)È)È)
È)
È)
È)
È)
È)
È)
È)
È)
È)
È)
È)
È)È)
È)
È)
È)
È)
È)
È)
È)
È)È)
È)
È)
È)
È)
È)
È)
È)
È)
È)
È)
È)È)
È)
È)
È)
È)È)
È)
È)
È)
È)
È)È)È)
È)
È)
È)
È)
È)
È) È)
È)
È)
È)
È)
È)
È)
È)È)
È)
È)
È)
È)
È)
È)
È)
È)
È)
È)
È)
È)
È)
È)
È) È)
È)
È)
È)È)
È)
È)
È)
È)È)
È)
È)
È)
È)È)
È)
È)È)
È)
È)
È)
È)
È)
È)
È)
È) È)È)
È)
È)
È)
È)È)È)È)
È)
È)
È)
È)
È)
È)
È)
È)
È)È)
È) È)È)
È)
È)
È)È)È)
È)
È)
È)
È)
È)È)È)
È)È)
È)
È)
È)È)
È)
È)
È)
È)È) È)
È)È)
È)
È)
È)
È)
È)
È)È)
È)È)È)
È)È)
È)
È)
È)
È)È)
È)
È)
È)
È)
È)È)È)
È)
È)
È)
È) È)
È)
È)
È)
È)
È)
È)
È)
È)
È)
È)È)È)
È)
È)
È)
È)È)
È) È) È)È)
È)
È)
È)È)
È)
È)
È)È)
È)
È)
È)
È)
È)
È)
È)
È)
È) È)
È)
È)
È)È)È)
È)
È)È)È)È)
È)
È)
È)È)
È)È)
È)
È)
È)
È)
È)
È)
È)È)
È)
È)
È)
È)
È)
È)
È)
È)
È)
È)
È)
È)È)
È)
È)
È)
È)
È)
È)È)
È)
È)È)
È)
È)
È)È)
È)
È)È)È)
È)È)
È)È)
È)È) È)È)
È)
È)
È) È)
È)È)
È) È)
È)
È)
È)
È) È) È)È)È) È)
È)È)È)
È)
È)È) È)
È)
È)
È)
È)
È)
È)È)
È)
È)
È)
È)È)
È)È)È)
È)
È)È)È)È)È)
È)È)
È)È)
È)
È)
È)
È)
È)
È)
È)È)
È)
È)È)
È)
È)È)
È)È)È) È)È)
È)
È)
È)
È)È)
È)
È)È)
È)
È)È)
È)
È)
È) È)È)
È)È)
È)È)
È)È)
È)
È)
È)È)
È)
È)
È)
È)
È)
È)
È)È) È)
È)
È)
È)
È)
È)
È)È)È)È)È) È)
È)
È)È)
È)
È)
È)È)È)È)È)
È)È)
È)
È)
È)
È)
È)
È)
È)
È)
È)
È)È)
È)È)
È)
È)È)
È)
È)È)
È)È)
È)
È)È)È)
È)È)
È)
È) È)
È)
È)
È)
È)
È)È)
È)È) È)
È)È)
È)
È)
È)
È)
È)
È)
È)
È)
È)È)
È)
È)
È)
È)
È)È)
È)
È)
È)
È)
È)
È)
È)
È)
È)
È)
È)
È)
È)
È)
È)È)
È)
È)È)
È)È)
È)È)È)È)È)È)
È)
È)
È)È)
È)È)
È)
È)
È)
È)
È)È)
È)
È)
È)
È)
È)
È)
È)È)
È)
È)
È)
È)
È)
È)È)
È)
È)
È) È)
È)
È)
È)
È)
È)
È)
È)
È)È) È)
È)
È)
È)
È)
È)
È)
È)È)
È)
È)È)
È)
È)
È)
È)
È)
È)
È)
È)È)È)
È)
È)
È)È)
È)
È)
È)
È)
È)
È)
È)
È)
È)
È)
È)È)
È)
È)È)È)
È)
È)
È)È)
È)È)
È)È)
È)È)
È)
È)
È)
È)È)
È)
È)
È)
È)
È)
È)
È)
È)
È)
È)È)
È)
È)
È)
È)
È)
È)
È)
È)
È)
È)
È)
È)
È)
È)
È)
È)È)
È)
È)
È)È)
È)È)
È)
È)
È)
È)
È)
È)
È)
È)
È)
È)
È)
È)È)È)
È)È)È)
È)
È)
È)
È)È)È)
È)
È)
È)
È)
È)
È)
È)
È)
È)È)
È)
È)È)
È)
È)
È)
È)
È)
È)
È)
È)
È)
È)
È)È)
È)
È)È)
È)
È)È)
È)
È)
È)È)È)
È)
È)
È)È)
È)
È)
È)
È)
È)
È)È)
È)
È)
È)
È)
È)
È)
È)
È)
È)
È)
È)
È)
È)
È)
È)
È)
È)È)
È)
È)
È)È) È)
È)È)
È)
È)
È)È)
È) È)
È)
È)È)
È)
È)È)
È)
È)
È)
È)
È)È)
È)È)È)
È)
È)È)
È)È)
È)
È)
È)
È)
È)
È)
È)
È)
È)
È)
È)
È)
È)
È)
È)
È)
È)
È)
È)È)È) È)
È)È)
È)
È)
È)È)È)
È)È)È)
È)
È)È)
È)È)
È)
È)
È)
È)
È) È)È) È)
È)
È)
È)
È)
È)
È)
È) È)
È)È)
È) È)
È)
È)
È)
È) È)
È)
È)
È)
È)
È)È)
È)
È)
È)
È)
È)
È)
È)
È)
È)
È)È)
È)
È)
È)
È)
È)
È)
È)È)
È)
È)
È)
È)
È)
È)È)
È)È)
È)
È)
È)
È)
È)È)
È)
È)È) È)
È)
È)
È)
È)
È)
È) È)
È)
È)
È)
È)
È)
È)È)
È)
È)
È)È)
È)
È)
È)
È)
È)
È)
È)
È)
È)È)
È)
È)È)
È)
È)
È)
È)
È)
È)
È)
È)
È)
È)È)È)
È)
È)
È)
È)È)È)È)È)
È)
È)
È)
È)
È)
È)È)
È)È)
È) È)
È)
È)È)
È)
È)
È)
È)È)
È)
È)
È)
È)
È)
È)
È)
È)
È)È)
È) È)
È)È)
È)
È)
È)
È)
È)
È)
È)
È)
È)
È) È)È)
È)
È)
È)
È)
È)
È) È)
È)
È)
È)
È)
È)
È)
È)
È)
È) È)
È)
È)
È)
È)
È)
È)È)
È)È)
È)È)
È)
È)
È) È)È)
È)
È)
È)
È)
È)
È)
È) È)
È)
È)È)
È)
È) È)
È)
È)È)È)
È)
È)
È)
È)
È)È)
È)
È)
È)
È)
È)
È)
È)
È)È)È) È)È)
È)
È)
È) È)
È)
È)È)
È)
È)
È)
È)
È) È)
È)
È)È)È)
È)
È)
È)È)È)È)
È)È)
È)
È)
È)È)È)È)È)
È)
È)
È)È)È)
È)
È)È)
È)
È)
È)È)
È)
È)È)
È)È)
È)
È)È)
È)
È)
È)
È)È)
È)
È)
È)
È)
È)
È)È)È)
È) È)
È)
È)
È)
È)
È)
È)È)
È)
È)
È)È) È)
È)È)
È)
È) È)
È)È)
È)
È)
È)
È)
È)
È)
È)È)
È)
È)È)
È)
È)
È)
È)
È)È)È)È)
È)È)È)
È)
È)
È)È)
È)
È)È)
È)
È)
È)
È)
È)È)È)
È)
È)È)
È)
È)È)
È)È)È)È)
È)È)
È)È)È)
È)
È)
È)
È)
È)
È)È)
È)
È)
È)È)
È)È)
È)
È)
È)
È)È)È)
È)È)
È) È)
È)
È)È)
È)
È) È)
È)
È) È)
È)
È)
È)
È)È)
È)
È)
È)È)È)È)È)
È)
È)È)È)
È)È)
È)
È)È)È)È)
È)
È)È)
È)È)
È)È)È)
È)
È)
È)
È)È)
È)
È)
È)È)
È)È)
È)
È)È)
È)È)
È)È) È)
È)
È)
È)
È)
È)
È)È)È)È)
È)
È) È)
È)
È)
È)
È)È)È)
È)È)È)
È)È)
È)È)È)È)È)È)È)
È)È)È)
È)
È)È)
È)
È)È)
È)
È)È)
È) È)È)È)È)È)
È)
È)
È)
È)
È)
È)
È)
È)È)
È)È)
È)È)È)È)È) È)È)
È)
È)
È)È)È)È)
È)
È)
È)
È)
È)È)
È)
È)
È)È)
È)È)
È)
È)
È)È)
È)È)
È)È)È)
È)
È)
È)È)
È)
È)
È)È)È)
È)
È)È)
È)
È)
È)È)
È)
È)
È)
È)È)
È)È)
È)
È)
È)
È) È)
È)
È) È)È)
È)
È)
È)
È)
È)
È)
È)
È)
È)È)
È)
È)
È)
È)
È)
È) È)È)È)È)È)
È)
È)
È)
È)È)
È)È)È)
È)
È)È)
È)
È)
È)
È)
È)
È)
È)
È)È) È)
È)È)
È)È)
È)È)
È)È)È)
È)
È)È)
È)
È)
È)
È)È)
È)
È)
È)
È)È)
È)È)
È)
È)
È)È)
È)
È)
È) È)
È)
È)
È)
È)È)
È)
È)
È)
È)
È)È)
È)È)È) È)È)È)
È)
È)
È)È)
È)
È)È)
È)
È)
È)È)È)È)È)È) È)È)È)È) È)È)
È)
È)
È)
È)
È)È)È)È)
È)
È)
È)
È)
È)
È)
È)È)
È)
È)
È) È)
È)
È)
È)È) È)
È)
È)
È)
È)
È) È)È)È)
È)
È)
È)
È) È) È)È)
È)
È)
È)È)
È)
È)È)
È)
È)
È)È)
È)È)
È)
È)
È)È)È)È)
È)
È)
È)
È)
È) È)È)
È)
È)
È)
È)È)È)
È)
È)
È)È)
È)È)
È)
È)È)
È)
È)È)
È)
È)
È)
È)È)
È)
È)
È)È)È)È)
È)
È)
È)
È)
È)
È)È)È) È)
È)
È)
È)
È)
È)
È)
È)
È)
È)
È)
È)
È)
È)È)È)È)
È)
È)È)
È)È)È)È)È)
È)
È)
È)
È)È)
È)
È)
È)
È)
È)È)È)
È) È)
È)
È)
È)È)
È)
È)È)
È)
È)
È)
È)È)
È)
È)
È)È)È)
È)È)
È)È)
È)È)
È)
È)
È)
È)
È)
È)È)
È)È)
È)È) È)
È) È)È)
È)
È)
È)
È)
È)
È)È)
È)
È)È)È)È)È)
È)
È)
È)
È)
È)È)È)
È)
È)
È)
È)
È)
È)
È)È)È)È)È)
È)
È)
È)
È)È)
È)
È)
È)
È)
È)È)È)
È)
È)
È)
È)È)È)
È)
È)
È)
È)È)È)È)
È)
È)
È)È)
È)
È)È)
È)
È)È)È)
È)
È)
È)
È)È)È)
È)È) È)
È)È)È)È)
È)
È)È)È)È)È)È)
È)
È)
È)
È)
È)È)È)
È)
È)È)
È)
È)
È)
È)È)
È)
È)
È)È)
È)
È)
È)
È)
È)È)È)È)
È)
È)È)È)È)È)
È)È)
È)
È)È)È) È)È)
È)È)
È)
È)
È)
È)
È)È)
È)
È)È)
È)
È)
È)
È)
È)È)
È)È)È)
È)
È)
È)È)È)
È)
È)
È)
È)È)
È)
È)
È)
È)
È)
È)
È)
È)
È)È)
È)
È)È)
È)
È)È)
È)
È)È)
È)
È)
È)È)
È)È)
È)
È) È)È) È)
È)
È)È) È)
È)È)
È)È)È)
È)È)
È)
È)
È)
È)
È)
È)
È)
È)
È)
È)È)
È)È)È)
È)
È) È)È)
È) È)
È)
È)
È)
È)
È)È)
È)
È)
È)
È)
È)
È)È)È) È)
È)È)
È)
È) È) È)
È)
È)È)È)
È)È)È)È)È)
È)È)È)È)
È)
È)
È)È)È)È)È)È)
È)È)
È)
È)
È)È)È)
È)
È)
È)
È)
È)È)
È)È)
È)
È)È)
È)
È)
È)
È)È)È)È)È)È)È)
È)È)
È)È)È)
È)È)È)
È)
È)È)
È)
È)
È)
È)È)
È)È)
È)
È)
È)
È)
È)È)
È)È)
È)
È)È)
È)È)È)
È)
È)
È)
È)
È)
È)
È)
È)
È)
È)
È)
È)
È)
È)
È)È)
È)
È)È)
È) È)
È)
È)
È)
È)
È)
È)
È)
È)
È)
È)
È)
È)
È) È)
È)
È)È)
È)
È)
È)
È)
È)
È)
È)
È)È)È)È)È)
È)
È)
È)
È)È)È)
È)
È)
È)È)
È)È)
È)
È)
È)
È)È)È) È)È)
È)
È)
È)
È)È)È)
È)
È)
È)È)
È)
È)
È)
È)
È)
È)
È)
È)
È)
È) È)
È)
È)È)
È)
È)
È)
È)
È)È)
È)
È)È)
È)È) È)
È)
È)
È)
È)
È)È)
È)
È)
È)
È)
È)
È)
È)
È)
È)
È)
È)
È)È)
È)
È)È)È)
È)
È)È)È)
È)
È)
È)
È)È)
È)
È)È)È)
È)
È)
È)È)
È)È) È)È)È)
È)È)
È)
È)
È)È)
È)
È)
È)
È)È) È)
È)
È)È)È)È)
È)
È)
È)È)È)È) È)È)È)
È)
È)
È)È)È) È)È)È)È)È)
È)È)È)È)
È)
È)
È)
È)
È)
È)
È)
È)
È)
È)
È)
È)
È)
È)
È)
È)
È)
È)
È)È)
È)
È)
È)
È)È)
È)
È)È) È)
È)
È)È)È)È)
È)È)
È)
È)
È)
È)
È)
È)
È)È)
È)
È)
È)
È)
È)
È)
È)
È)
È)
È)
È)
È)
È)È) È)
È)
È)
È)
È)
È)
È)
È)
È)È)
È)
È)
È)
È)
È)È)
È)È)
È)
È)
È)
È) È)È)
È)
È)
È)
È)
È)
È)È)
È)
È)È)
È)
È)
È)
È)
È)
È)
È)
È)
È)
È)
È)
È)
È)
È)
È)
È)
È)
È)È)
È)È)
È)È)È)
È)È)
È)È)
È)
È)
È)
È)
È) È)
È)
È)
È)
È)
È)
È)
È)
È)È)
È)
È)
È)È)
È)
È)
È)
È)
È)
È)
È)È)
È)
È)
È)
È)
È)
È)
È)È)
È)È)
È)È)
È)È)
È)
È)
È)
È)
È)
È)È)
È)
È)
È)È)
È)
È)
È)
È)
È)
È)
È)
È)
È)
È) È)
È)
È)
È)
È)
È) È)È)
È)È)
È)
È)
È)È)
È)
È) È)
È)
È)
È)
È)
È)
È)
È)È)
È)È)È)È)
È)
È)
È)
È)
È)
È)È)
È)È)
È)
È)
È)
È)
È)
È)
È)
È)
È)È)
È)
È)È)
È)
È)
È)
È)
È)
È)È)
È)È)È)
È)È)È)
È)
È)È)
È) È)È)
È)
È)
È)
È)
È)È)È)
È)È)È)È)
È) È)
È)È)
È)
È) È)È)È)È)È)È)È)
È)
È)È)
È)È)
È)
È)È)È)
È)
È)È)È)È)È)È)È)
È)È)È)
È)È)È)È) È)È)
È)
È)
È)
È)
È)È)È) È)È)È) È)È)
È)È)
È)
È)
È)È)
È) È)
È)
È)
È)
È)
È)
È)
È)
È)È) È) È)È)
È)
È)È)
È)È)
È)
È)
È)È)
È)
È)
È)
È)
È)
È) È)
È)
È)
È)
È)È)
È)
È)
È)
È)È)
È)
È)È)
È)
È)
È)
È)
È)
È)
È)È)
È)
È)È)
È)
È)
È)
È)
È)
È)È)
È)È)
È)È)È)
È) È)È)
È)
È)
È)
È)
È)
È)È)
È)
È)È)È)
È)
È)
È)
È)È)È)
È)
È)È)
È)
È)
È)È)È)
È)
È)
È)
È)È)
È)È)
È)
È)
È)È)
È)È)È)
È)
È) È)È)
È)È)
È)
È) È)
È)
È)
È)
È)
È)È)È)È)
È)È)È)
È)È)
È)
È)È)
È)
È)
È)
È)
È)È)
È)
È)
È)
È)
È)
È)
È)
È)
È) È)È)
È)
È)È)È)
È)
È)
È)
È)
È)È)È)
È)
È)
È)È)
È)
È)
È)
È)
È)
È)È) È)È)È)
È)È)È)
È)
È)È)
È)È)È)
È)
È)È)
È)
È)
È)
È)
È)
È)È)
È)È)È)
È)
È)
È)
È)
È)È)È)
È)
È)
È) È)È)È)
È)
È)È)
È)È)
È) È) È)
È)È)
È)È)
È)È)È)
È) È)È)È)
È)
È)
È)È)
È)È)
È)È)
È)È)
È)
È)
È)È)
È)
È)È)È)È)
È)
È)
È)
È)
È)
È)È)
È)È)È)È)
È)
È)
È)
È)
È)È)È)È)È)
È)
È) È)È)
È)
È)
È)
È)
È)
È) È)
È)
È)
È)
È)
È)
È)
È)
È)È)
È)
È)
È)È)
È)
È)
È) È)
È)
È)
È)È)È)È)È)
È) È)
È)
È)È)È)
È)
È)È)
È)
È)È)
È)È)
È)
È)
È)
È)
È)
È)
È)
È)
È)
È) È)
È)
È)
È)
È)È)È)
È)
È)È)
È)
È) È)
È)È)
È)
È)
È)
È)
È)
È)
È)
È)
È)È)
È)
È)
È)È)
È)
È)
È)
È)È)
È)
È)
È)È)
È)
È) È)
È) È)
È)
È)
È)
È)
È)È)È) È)
È) È)
È)
È)
È)È)
È)È)
È)
È)
È)
È)
È)
È)
È) È)
È)
È)
È)
È)
È)
È)È)
È)
È)
È)
È)
È)
È)È)
È)
È)
È)
È)È)
È)
È)
È)È)
È)
È)
È)
È)
È)È)È)
È)È)È)
È)
È)È)È) È)È)È) È) È)
È)È)
È)
È)
È) È)
È)
È)
È)
È)
È)È)È)
È)
È)
È)
È) È)
È)
È)È)
È)
È)
È)
È)
È)
È)
È)
È)
È)
È)
È)
È)
È)
È)
È)È)
È)
È)
È)
È)
È)
È)
È)
È)È) È)
È)
È)
È)
È)
È)
È) È)
È)
È)
È)
È)È) È)È)
È)È)
È)
È)
È)È)
È) È)È)
È)
È)
È)
È)
È)È)
È)È)
È)
È)
È)
È)
È)È)È)
È)
È)
È)
È) È) È)È)
È)
È) È)
È)
È)È)
È)È)
È)
È) È)È)
È)
È)
È)È)È)
È)
È)È)
È)
È)È)
È)
È)
È)
È)È)
È) È)
È)È)È)
È)
È)È)
È)
È)
È)
È)
È)
È)
È) È)È)È)
È)
È)È)È)
È)È)
È)
È)È)
È)
È)
È)È)
È)
È)È)
È)
È) È)È)
È)
È)
È)È)
È)
È)
È)
È)
È)È)È)
È)
È)
È)
È)
È)
È)
È)È)
È)
È)È)È)È)
È)
È)
È)
È)
È)È)È)
È)È)È)
È)
È)
È)
È)
È)
È)
È)È)È)È)È)È)È)È)È)È)È)È)È)È)È)
È)
È)È)
È)È)
È)
È)
È)
È)
È)
È)
È)
È)
È)
È)È)È)
È)
È)
È)
È)
È) È)
È)È)
È)È)È)
È)
È)
È)
È)
È)È)
È)
È)
È)
È)
È)
È)È)
È)
È)È)È)È)È)È)È)È)È)È)È)È)È)È)È)È)È)È)È)È) È)È)È)È)È)È) È)È)
È)È)È)
È)
È)È)
È)
È)
È)
È)
È)
È)
È)
È)
È)
È)
È)È)
È)
È) È)
È)È)
È)
È)
È)È)
È)
È)È)È)È)
È)È)
È) È)È)È)
È)
È)È)
È)È)È)È)È)
È)
È) È)
È)
È)
È)
È)
È)È)È)
È)È)
È)
È)
È)È)È)È)È)
È)È)È)
È)
È)È)
È)È)
È)È)È)
È)È)È)
È)
È)
È)
È)
È)È)
È)
È)
È)
È)È)
È)È)È) È)È)
È)
È)
È)
È)
È)
È)
È)
È)
È)
È)
È)
È)
È)
È)
È)È)
È)È)È)
È)È)
È)
È)È)
È)
È)
È)
È)
È)
È)È)È)
È)
È)
È)
È)È)È)È)È)
È)
È)È)È)
È)È)
È)
È)È)
È)
È)
È)È)È)
È)
È)
È)
È)
È) È)È)
È)
È)
È)
È)È)
È)
È)
È)
È)
È)
È)
È)È) È)
È)È)
È)
È)
È)È)È) È)È)
È) È)
È)
È)
È)È)È)È)
È)
È)
È)
È)È)È)
È)È)
È)
È)È)
È)È)È)È)
È)
È)
È)È)
È)
È)
È)È)È)È)È)
È)
È)È)
È)È)È) È)
È)
È)È)È)
È)
È)È)
È)
È)
È)È)È)
È)
È)
È)
È)È)
È)È)
È)
È)È)
È)È)
È)È)
È)
È)È)
È)È)
È)
È)È)È)
È)
È)
È)È)È)
È)
È) È)
È) È)È)È)
È)
È)
È)
È)
È)
È)
È)
È)
È)È) È)È)
È)
È)
È)
È)È)È)
È)
È)
È)
È)
È)È)
È)
È)È)
È)
È)È)È)È)
È)
È)È)È)È)È)
È)È)
È)
È)
È)È) È)
È)È)È)
È)
È)È)È)È)
È)
È)È)
È)È)È)È)È)
È)È)È)È)
È)È)
È)È)È)
È)È)
È)È)
È)È)È)
È)È)
È)È)
È) È)È)È)
È)
È)È)
È)
È)
È)
È)È)È)È)
È)È)
È)
È)È)
È) È)
È)
È)
È)
È)
È)
È)
È)
È)
È)È) È)
È)
È) È)
È)
È)
È)È)
È)
È)È)
È) È)
È)È)È)È)È)
È)
È)
È)È)È)È)È)
È)
È)
È)
È)
È)
È)È)È)È)
È)È)
È)È)
È)È)
È)
È)
È)
È)
È)
È)
È)
È)
È)È)
È)È)
È)
È)È)È)
È)È)È)È)
È)È)
È)È)
È)
È)È)
È)
È)È)È)È)
È)
È)
È)
È)
È)È)È)
È)
È)È)È)
È)È)
È)
È)È)È)
È)
È)È)
È)
È)È)È)
È)È) È)
È)È)È)
È)È)
È)
È)È)
È)È)È)
È)
È)
È)
È)È)È)
È)
È)È)
È)È)
È)È)
È)
È)È)
È)
È)È)
È)
È)
È)
È)
È)
È)
È)
È)
È)È)
È)
È)
È)
È)È)È)È)
È)
È)
È)È)È)
È)
È)È)
È)
È)
È)
È)
È)
È)È)È)È)
È)È)
È)
È)
È)È)È)
È)
È)È)È)
È)
È)
È)È)È)
È)
È)È)È)È)
È)
È)È)
È)
È)È)
È)È)
È)
È)
È)
È)È)
È)
È)
È)
È)È)
È)
È)
È)
È)È)È)
È)È)
È)
È)
È)È)
È)
È)È)
È)È)
È)
È)È)
È)
È)
È)È)È)
È)
È)È)È)
È)
È)
È)
È)
È)
È)È)
È)
È)
È)
È)
È)
È)È)
È)
È)È)
È)
È)È)È)È)È) È)È)
È)È)
È)
È)
È)
È)
È)È)
È)È)
È)È)È)È)
È)
È)
È)
È)
È)È)
È)
È)
È)È)È)È)
È)È)
È)
È)È)
È)È)È)
È)
È)È)
È)
È)È)È)
È)
È)È)
È)È)È) È)
È)È)
È)È)È)
È)
È)
È)È)
È)
È)
È)
È)
È)È)
È)
È)
È)
È)
È)
È)È)È)È)
È)È)È)È)
È)È)
È)
È)È)È)
È)
È)
È)
È)È)
È)È)È)
È)È)
È)
È)
È)È)
È)
È)È)È)
È)
È)
È)È)
È)È) È)È)È)È)
È)
È)È)È)È)È)
È)È)È)
È)
È)
È)
È)
È)
È)
È)
È)
È)È)
È)È)
È)È)
È)È)
È)
È)È)
È)
È)È) È)
È)È)È)È)
È)
È)
È)È)È)È)
È)
È)È)È)
È)
È)
È)È)È)
È)
È) È)
È)
È)
È)
È)
È)È)È)È)
È)È)È)È)È)
È)È)
È)
È)È)
È)
È)È)
È)È)È)
È)È)
È)
È)
È)
È)È)
È)
È)
È)
È)
È)È)
È)
È)È)
È)
È)È)È)È)
È)
È)È)
È)È)È)
È)
È)
È)
È)
È)
È)
È)È)È)
È)
È)
È) È)
È)
È) È)
È)
È)È)
È)È)
È)È)
È)
È)È)
È)
È)È)
È)
È)
È)È)
È)
È)
È)È)È)È)È)È)
È)
È)È)
È)
È)È)
È)È)
È)È)
È) È)
È)È)È)
È) È)
È)È)È)
È)È)È)
È)
È)
È)
È)È)È)
È)
È)
È)
È) È)È)
È)È)È)È)È)È) È)
È)È)
È)
È)
È)
È)
È)
È)È)
È)È)
È)
È)
È)
È)
È)
È)È)È)
È)
È)
È)È)
È)
È)È)È)È)È)
È)È)
È)
È)
È) È)È)È)È)
È)
È)È)
È)
È)
È)
È)
È)È)
È)
È)È)
È)
È)
È)
È)
È)
È)È)È)È)
È)È)
È)È)È)
È)È)È)
È)
È)
È)
È)
È)È)È)
È)È)È)
È)
È)
È)
È)È)È)
È)È)È)
È)
È)
È)
È)È)
È)È)
È)
È)È)È)È)
È)
È)
È)
È)
È)
È)È)
È)
È)
È)È)
È)È)È)
È)È)È)È)È)È)
È)
È)
È)È)È)
È)
È)
È)
È)
È)È)
È)È)
È)È)È)
È)È)È)
È)È)
È)
È)
È)È)È)È)
È)È)
È)È)È)È)
È)
È)
È)
È)
È)
È)È)È)
È)
È)
È)È)
È)
È)È) È)
È)
È)
È)È)
È)
È)È)È)
È)È)
È)È)È)
È)È)È)
È)È)È)
È)
È)
È)È)È)
È)
È)
È)
È)
È)
È)
È)È)È)
È)
È)
È)
È)
È)È)È)È)È)
È)
È)È)
È)
È)
È)È)È)
È)
È)
È)È)È)
È)È)È)
È)È)
È)È)
È)
È)
È)
È)È)
È)
È)
È)È)
È)È)È)È)È)
È)
È)
È)È)
È)
È)È) È)È)
È)È)È)È)È)
È)
È)È)
È)
È)È)
È)
È)
È)
È)È)
È)
È)
È)
È)È)
È)
È)È)
È)È)È)È)
È)
È)
È)
È)
È)
È)
È) È)
È) È)
È)
È)È)
È)
È)
È)
È)È)
È)
È)
È)
È)
È)
È)
È)
È)È)
È)
È)
È)
È)
È)È)
È)È)
È)
È)È)
È)
È)È)
È)È) È)È) È)È)È) È)È)È)È)È)È)È)È)È) È)È)
È)È)È)È) È)
È)È)
È)
®
0 5 10 15 202.5Miles
Ohio River Mainstem
Streams
Metals Impaired Streams
È) Oil & Gas Wells
Middle Ohio River North
TMDLSHEDS
Bull Creek
Cow Creek
Cow Hollow Run
Fishing Creek
French Creek
Middle Island Creek
Proctor Creek
Sugarcamp Run
Williams Run

Middle Ohio River South and North Watersheds: TMDL Report
43
5.2.3 Sediment Sources
Land disturbance can increase sediment loading to impaired waters. The control of sediment-producing sources has been determined necessary to meet water quality criteria for total iron during high-flow conditions. Nonpoint sources of sediment include forestry operations, oil and gas operations, roads, agriculture, stormwater from construction sites less than one acre, and stormwater from urban and residential land in non-MS4 areas. Additionally, streambank erosion represents a significant sediment source throughout the watershed. Upland sediment nonpoint sources are summarized below.
Forestry The West Virginia Bureau of Commerce’s Division of Forestry provided information on forest industry sites (registered logging sites) in the metals impaired TMDL watersheds. This information included the harvested area (29,158 acres) and the subset of land disturbed by roads and landings (1,013 acres) for 364 registered logging sites, as well as 7.7 acres of burned forest, in the metals impaired TMDL watersheds.
West Virginia recognizes the water quality issues posed by sediment from logging sites. In 1992, the West Virginia Legislature passed the Logging Sediment Control Act. The act requires the use of best management practices (BMPs) to reduce sediment loads to nearby waterbodies. Without properly installed BMPs, logging and associated access roads can increase sediment loading to streams. According to the Division of Forestry, illicit logging operations represent approximately 2.5 percent of the total harvested forest area (registered logging sites) throughout West Virginia. These illicit operations do not have properly installed BMPs and can contribute sediment to streams. This rate of illicit activity has been represented in the model.
Oil and Gas The WVDEP Office of Oil and Gas (OOG) is responsible for monitoring and regulating all actions related to the exploration, drilling, storage, and production of oil and natural gas in West Virginia. It maintains records on more than 40,000 active and 25,000 inactive oil and gas wells, and manages the Abandoned Well Plugging and Reclamation Program. The OOG also ensures that surface water and groundwater are protected from oil and gas activities.
Oil and gas data incorporated into the TMDL model were obtained from the WVDEP OOG GIS coverage. There are 6,349 oil and gas related wells either active or under-construction (8,761.6 acres) in the metals impaired TMDL watersheds addressed in this report. Runoff from unpaved access roads to these wells and the disturbed areas around the wells contribute sediment to adjacent streams (Figure 5-4).
Roads Heightened stormwater runoff from paved roads (impervious surface) can increase erosion potential. Unpaved roads can contribute sediment through precipitation-driven runoff. Roads that traverse stream paths elevate the potential for direct deposition of sediment. Road construction and repair can further increase sediment loads if BMPs are not properly employed.

Middle Ohio River South and North Watersheds: TMDL Report
44
Information on roads was obtained from various sources, including the 2009 TIGER/Line shapefiles from the U.S. Census Bureau and the WV Roads GIS coverage prepared by WVU. Unpaved roads that were not included in either GIS coverage were digitized from topographic maps.
Agriculture Agricultural activities can contribute sediment loads to nearby streams. Agricultural landuses (e.g., pasture and cropland) account for approximately 7.3 percent and 2.3 percent of the modeled land area in metals impaired TMDL watersheds in the Middle Ohio River South and North, respectively. Agricultural runoff can contribute excess sediment loads when farming practices allow soils to be washed into the stream. Upland loading representation was based on precipitation and runoff, in which accumulation rates were developed using source tracking information regarding number of livestock, proximity and access to streams, and overall runoff potential. Sedimentation/iron impacts from agricultural landuses are also indirectly reflected in the streambank erosion allocations.
Streambank Erosion Streambank erosion has been determined to be a significant sediment source across the watershed. WVDEP conducted a special bank erosion pin study that formed the foundation for representation of the baseline streambank sediment and iron loadings.
The sediment loading from bank erosion is considered a nonpoint source and LAs are assigned. The streambank erosion modeling process is discussed in Section 8.2.2.
Other Land-Disturbance Activities Stormwater runoff from residential and urban landuses in non-MS4 areas is a significant source of sediment in parts of the watershed. Outside urbanized area boundaries, these landuses are considered to be nonpoint sources and load allocations are prescribed. The modified NLCD 2001 landuse data were used to determine the extent of residential and urban areas not subject to MS4 permitting requirements and source representation was based upon precipitation and runoff.
The NLCD 2001 landuse data also classifies certain areas as “barren” land. In the model configuration process, portions of the barren landuse were reclassified to account for other known sources (abandoned mine lands, mining permits, etc.). The remainder is represented as a specific nonpoint source category in the model.
Construction activities disturbing less than one acre are not subject to construction stormwater permitting. While not specifically represented in the model, their impact is indirectly accounted for in the loading rates established for the urban/residential landuse category.

Middle Ohio River South and North Watersheds: TMDL Report
45
6.0 FECAL COLIFORM SOURCE ASSESSMENT
6.1 Fecal Coliform Point Sources
Publicly and privately owned sewage treatment facilities and home aeration units are point sources of fecal coliform bacteria. Combined sewer overflows (CSOs) and discharges from MS4s are additional point sources that may contribute loadings of fecal coliform bacteria to receiving streams. The following sections discuss the specific types of fecal coliform point sources that were identified in the Middle Ohio River South and Middle Ohio River North watersheds.
6.1.1 Individual NPDES Permits
WVDEP issues individual NPDES permits to both publicly owned and privately owned wastewater treatment facilities. Publicly owned treatment works (POTWs) are relatively large facilities with extensive wastewater collection systems, whereas private facilities are usually used in smaller applications such as subdivisions and shopping centers.
In the subject watersheds of the Middle Ohio River South, 6 individual permits (issued to 5 individual POTWs) discharge treated effluent at 6 outlets. In the subject watersheds of the Middle Ohio River North, 3 individually permitted POTWs discharge treated effluent at 3 outlets. Two additional privately owned sewage treatment plants operating under an individual NPDES permit discharge treated effluent at 2 outlets. No mining bathhouse facilities discharge to TMDL streams in the Middle Ohio River South or Middle Ohio River North TMDL watersheds.
These sources are regulated by NPDES permits that require effluent disinfection and compliance with strict fecal coliform effluent limitations (200 counts/100 mL [geometric mean monthly] and 400 counts/100 mL [maximum daily]). Compliant facilities do not cause fecal coliform bacteria impairments because effluent limitations are more stringent than water quality criteria.
6.1.2 Overflows
CSOs are outfalls from POTW wastewater systems that carry untreated domestic waste and surface runoff. CSOs are permitted to discharge only during precipitation events. Sanitary sewer overflows (SSOs) are unpermitted overflows that occur as a result of excess inflow and/or infiltration to POTW separate sanitary collection systems. Both types of overflows contain fecal coliform bacteria. Ten CSO outlets in the subject watersheds of the Middle Ohio River North are associated with the POTWs operated by the Town of West Union (5), and the City of New Martinsville (5). Upon review of existing source data, no SSO discharges were noted within the TMDL watersheds.
6.1.3 Municipal Separate Storm Sewer Systems (MS4)
Runoff from residential and urbanized areas during storm events can be a significant fecal coliform source. USEPA’s stormwater permitting regulations require public entities to obtain NPDES permit coverage for stormwater discharges from MS4s in specified urbanized areas. As such, MS4 stormwater discharges are considered point sources and are prescribed WLAs.

Middle Ohio River South and North Watersheds: TMDL Report
46
MS4 entities and their areas of responsibility are described in Section 5.1.4 and displayed in Figure 5-5. MS4 source representation is based upon precipitation and runoff from landuses determined from the modified NLCD 2001 landuse data, the jurisdictional boundary of the cities, and the transportation-related drainage areas for which DOH has MS4 responsibility. In certain areas, urban/residential stormwater runoff may drain to both CSO and MS4 systems. WVDEP consulted with local governments and obtained information to determine drainage areas to the respective systems and best represent MS4 pollutant loadings.
6.1.4 General Sewage Permits
General sewage permits are designed to cover similar discharges from numerous individual owners and facilities throughout the state. General Permit WV0103110 regulates small, privately owned sewage treatment plants (“package plants”) that have a design flow of 50,000 gallons per day (gpd) or less. Within the state, package plants are tracked with a registration number beginning with WVG55. General Permit WV0107000 regulates HAUs. HAUs are small sewage treatment plants primarily used by individual residences where site considerations preclude typical septic tank and leach field installation. HAUs are tracked with a registration number beginning with WVG41. Both general permits contain fecal coliform effluent limitations identical to those in individual NPDES permits for sewage treatment facilities. In the areas draining to streams for which fecal coliform TMDLs have been developed for the Middle Ohio River South, 28 facilities are registered under the “package plant” general permit and 101 are registered under the “HAU” general permit. In the Middle Ohio River North, 10 facilities are registered under the “package plant” general permit and 64 are registered under the “HAU” general permit.
6.2 Fecal Coliform Nonpoint Sources
6.2.1 On-site Treatment Systems
Failing septic systems and straight pipes are significant nonpoint sources of fecal coliform bacteria. Information collected during source tracking efforts by WVDEP yielded an estimate of 13,125 homes in the Middle Ohio River South and 14,101 homes in the Middle Ohio River North that are not served by centralized sewage collection and treatment systems. Estimated septic system failure rates across the watershed range from 3 percent to 28 percent.
Due to a wide range of available literature values relating to the bacteria loading associated with failing septic systems, a customized Microsoft Excel spreadsheet tool was created to represent the fecal coliform bacteria contribution from failing on-site septic systems. WVDEP’s pre-TMDL monitoring and source tracking data were used in the calculations. To calculate loads, values for both wastewater flow and fecal coliform concentration are needed.
To calculate failing septic wastewater flows, the TMDL watersheds were divided into four septic failure zones. During the WVDEP source tracking process, septic failure zones were delineated by soil characteristics (soil permeability, depth to bedrock, depth to groundwater and drainage capacity) as shown in United States Department of Agriculture (USDA) county soil survey maps. Two types of failure were considered, complete failure and periodic failure. For the purposes of

Middle Ohio River South and North Watersheds: TMDL Report
47
this analysis, complete failure was defined as 50 gallons per house per day of untreated sewage escaping a septic system as overland flow to receiving waters and periodic failure was defined as 25 gallons per house per day. Figure 6-1 and Figure 6-2 show the failing septic flows represented in the model by subwatershed.

Middle Ohio River South and North Watersheds: TMDL Report
48
Figure 6-1. Failing septic flows in the Middle Ohio River South watershed
®
0 5 10 15 202.5Miles
Ohio River Mainstem
Failing Septic Flows
GPD_ACRE
0.000000 - 0.286122
0.286123 - 0.610495
0.610496 - 1.224221
1.224222 - 2.460309
2.460310 - 4.600010
Middle Ohio River South

Middle Ohio River South and North Watersheds: TMDL Report
49
Figure 6-2. Failing septic flows in the Middle Ohio River North watershed
®
0 5 10 15 202.5Miles
Ohio River Mainstem
Failing Septic Flows
GPD_ACRE
0.000000 - 0.286122
0.286123 - 0.610495
0.610496 - 1.224221
1.224222 - 2.460309
2.460310 - 4.600010
Middle Ohio River North

Middle Ohio River South and North Watersheds: TMDL Report
50
Once failing septic flows were modeled, a fecal coliform concentration was determined at the TMDL watershed scale. Based on past experience with other West Virginia TMDLs, a base concentration of 10,000 counts per 100 ml was used as a beginning concentration for failing septic systems. This concentration was further refined during model calibration. A sensitivity analysis was performed by varying the modeled failing septic concentrations in multiple model runs, and then comparing model output to pre-TMDL monitoring data. Additional details of the failing septic analyses are elucidated in the Technical Report.
For the purposes of this TMDL, discharges from activities that do not have an associated NPDES permit, such as failing septic systems and straight pipes, are considered nonpoint sources. The decision to assign LAs to those sources does not reflect a determination by WVDEP or USEPA as to whether they are, in fact, non-permitted point source discharges. Likewise, by establishing these TMDLs with failing septic systems and straight pipes treated as nonpoint sources, WVDEP and USEPA are not determining that such discharges are exempt from NPDES permitting requirements.
6.2.2 Urban/Residential Runoff
Stormwater runoff from residential and urbanized areas that are not subject to MS4 permitting requirements can be a significant source of fecal coliform bacteria. These landuses are considered to be nonpoint sources and load allocations are prescribed. The modified NLCD 2001 landuse data were used to determine the extent of residential and urban areas not subject to MS4 permitting requirements and source representation was based upon precipitation and runoff.
6.2.3 Agriculture
Agricultural activities can contribute fecal coliform bacteria to receiving streams through surface runoff or direct deposition. Grazing livestock and land application of manure result in the deposition and accumulation of bacteria on land surfaces. These bacteria are then available for wash-off and transport during rain events. In addition, livestock with unrestricted access can deposit feces directly into streams.
Agricultural landuses were determined to be present in approximately 7.3 percent and 2.3 percent of the modeled subwatersheds in the Middle Ohio River South and Middle Ohio River North, respectively. Source tracking efforts identified pastures and feedlots near impaired segments that have localized impacts on instream bacteria levels. Source representation was based upon precipitation and runoff, and source tracking information regarding number of livestock, proximity and access to stream, and overall runoff potential were used to develop accumulation rates.
6.2.4 Natural Background (Wildlife)
A certain “natural background” contribution of fecal coliform bacteria can be attributed to deposition by wildlife in forested areas. Accumulation rates for fecal coliform bacteria in forested areas were developed using reference numbers from past TMDLs, incorporating wildlife estimates obtained from West Virginia’s Division of Natural Resources (DNR). In addition, WVDEP conducted storm-sampling on a 100 percent forested subwatershed (Shrewsbury

Middle Ohio River South and North Watersheds: TMDL Report
51
Hollow) within the Kanawha State Forest, Kanawha County, West Virginia to determine wildlife contributions of fecal coliform. These results were used during the model calibration process. On the basis of the low fecal accumulation rates for forested areas, the storm water sampling results, and model simulations, wildlife is not considered to be a significant nonpoint source of fecal coliform bacteria in the watershed.
7.0 SEDIMENT SOURCE ASSESSMENT
Excess sediment has been identified as a significant stressor in relation to the biological impairments of a number of streams in the Middle Ohio River South and Middle Ohio River North watersheds. In all of the subject waters, it was determined that the sediment reductions necessary to ensure attainment of the iron water quality criteria exceed those that would be needed to address biological impairment through a reasonably achievable sediment reference approach. Therefore, the iron TMDLs are an appropriate surrogate in place of sediment TMDLs. Sediment sources considered in the TMDL model are described in detail in Section 5.2.2.
8.0 MODELING PROCESS
Establishing the relationship between the instream water quality targets and source loadings is a critical component of TMDL development. It allows for the evaluation of management options that will achieve the desired source load reductions. The link can be established through a range of techniques, from qualitative assumptions based on sound scientific principles to sophisticated modeling techniques. Ideally, the linkage will be supported by monitoring data that allow the TMDL developer to associate certain waterbody responses with flow and loading conditions. This section presents the approach taken to develop the linkage between sources and instream response for TMDL development in the Middle Ohio River South and Middle Ohio River North watersheds.
8.1 Model Selection
Selection of the appropriate analytical technique for TMDL development was based on an evaluation of technical and regulatory criteria. The following key technical factors were considered in the selection process:
Scale of analysis
Point and nonpoint sources
Metals and fecal coliform bacterial impairments are temporally variable and occur at low, average, and high flow conditions
Total iron loadings and instream concentrations are related to sediment
Time-variable aspects of land practices have a large effect on instream metals and bacteria concentrations

Middle Ohio River South and North Watersheds: TMDL Report
52
Metals and bacteria transport mechanisms are highly variable and often weather-dependent
The primary regulatory factor that influenced the selection process was West Virginia’s water quality criteria. According to 40 CFR Part 130, TMDLs must be designed to implement applicable water quality standards. The applicable water quality criteria for iron and fecal coliform bacteria in West Virginia are presented in Section 2, Table 2-1. West Virginia numeric water quality criteria are applicable at all stream flows greater than the 7-day, 10-year low flow (7Q10). The approach or modeling technique must permit representation of instream concentrations under a variety of flow conditions to evaluate critical flow periods for comparison with criteria.
The TMDL development approach must also consider the dominant processes affecting pollutant loadings and instream fate. In the Middle Ohio River South and Middle Ohio River North watersheds, an array of point and nonpoint sources contributes to the various impairments. Most nonpoint sources are rainfall-driven with pollutant loadings primarily related to surface runoff, but some, such as AML seeps and inadequate onsite residential sewage treatment systems, function as continuous discharges. Similarly, certain point sources are precipitation-induced while others are continuous discharges. While loading function variations must be recognized in the representation of the various sources, the TMDL allocation process must prescribe WLAs for all contributing point sources and LAs for all contributing nonpoint sources.
The Mining Data Analysis System (MDAS) was developed specifically for TMDL application in West Virginia to facilitate large scale, data intensive watershed modeling applications. The MDAS is a system designed to support TMDL development for areas affected by nonpoint and point sources. The MDAS component most critical to TMDL development is the dynamic watershed model because it provides the linkage between source contributions and instream response. The MDAS is used to simulate watershed hydrology and pollutant transport as well as stream hydraulics and instream water quality. It is capable of simulating different flow regimes and pollutant loading variations. A key advantage of the MDAS’ development framework is that it has no inherent limitations in terms of modeling size or upper limit of model operations. In addition, the MDAS model allows for seamless integration with modern-day, widely available software such as Microsoft Access and Excel. Sediment, total iron, and fecal coliform bacteria were modeled using the MDAS.
8.2 Model Setup
Model setup consisted of configuring the following two separate MDAS models: iron/sediment, and fecal coliform bacteria.
8.2.1 General MDAS Configuration
Configuration of the MDAS model involved subdividing the TMDL watersheds into subwatershed modeling units connected by stream reaches. Physical characteristics of the

Middle Ohio River South and North Watersheds: TMDL Report
53
subwatersheds, weather data, landuse information, continuous discharges, and stream data were used as input. Flow and water quality were continuously simulated on an hourly time-step.
In the Middle Ohio River South, 21 TMDL watersheds were broken into 486 separate subwatershed units, based on the groupings of impaired streams shown in Figure 8-1. In the Middle Ohio River North, 9 TMDL watersheds were broken into 434 separate subwatershed units, based on the groupings of impaired streams shown in Figure 8-2. The TMDL watersheds were divided to allow evaluation of water quality and flow at pre-TMDL monitoring stations. This subdivision process also ensures a proper stream network configuration within the basin.

Middle Ohio River South and North Watersheds: TMDL Report
54
Figure 8-1. Middle Ohio River South TMDL watersheds and subwatershed delineation
®
0 5 10 15 202.5Miles
Ohio River Mainstem
Middle Ohio River South
TMDLSHEDS
Big Run
Briscoe Run
Broad Run
Cedar Run
Crooked Creek
Lee Creek
Little Broad Run
Little Mill Creek
Little Sandy Creek
Mill Creek
Mill Run
Oldtown Creek
Pond Creek
Pond Run
Sandy Creek (OMS-30)
Sandy Creek (OMS-57)
Sliding Hill Creek
Spring Creek
Tenmile Creek
Washington Run
West Creek

Middle Ohio River South and North Watersheds: TMDL Report
55
Figure 8-2. Middle Ohio River North TMDL watersheds and subwatershed delineation
®
0 5 10 15 202.5Miles
Ohio River Mainstem
Middle Ohio River North
TMDLSHEDS
Bull Creek
Cow Creek
Cow Hollow Run
Fishing Creek
French Creek
Middle Island Creek
Proctor Creek
Sugarcamp Run
Williams Run

Middle Ohio River South and North Watersheds: TMDL Report
56
8.2.2 Iron and Sediment Configuration
The modeled landuse categories contributing metals via precipitation and runoff include forest, pasture, cropland, wetlands, barren, residential/urban impervious, and residential/urban pervious. These sources were represented explicitly by consolidating existing NLCD 2001 landuse categories to create modeled landuse groupings. Several additional landuse categories were created to account for landuses either not included in the NLCD 2001 and/or representing recent land disturbance activities (i.e. abandoned mine lands, harvested forest and skid roads, oil and gas operations, paved and unpaved roads, and active mining). The process of consolidating and updating the modeled landuses is explained in further detail in the Technical Report. In addition, non-sediment related land-based iron sources were modeled using representative average concentrations for the surface, interflow and groundwater portions of the water budget. AML seeps were also identified by WVDEP’s source tracking efforts and modeled as direct, continuous-flow sources in the model.
Sediment-producing landuses and bank erosion are sources of iron because this metal is associated with sediment. Statistical analyses using pre-TMDL monitoring data collected in the TMDL watersheds were performed to establish the correlation between sediment and metals concentrations and to evaluate the spatial variability of this correlation. The results were then applied to the sediment from sediment-producing landuses and bank erosion to calculate the iron loads delivered to the streams.
Generation of upland sediment loads depends on the intensity of surface runoff. It also varies by landuse and the characteristics of the soil. Surface sediment sources were modeled as soil detachment and sediment transport by landuse. Soil erodibility and sediment washoff coefficients varied among soil types and landuses and were used to simulate sediment erosion by surface runoff. Sediment delivery paths modeled were surface runoff erosion, and streambank erosion. Streambank erosion was modeled as a unique sediment source independent of other upland-associated erosion sources.
The MDAS bank erosion model takes into account stream flow and bank stability using the following methodology. Each stream segment has a flow threshold above which streambank erosion occurs. This threshold is estimated as the flow that occurs at bank full depth. The bank erosion rate per unit area is a function of bank flow volume above the specified threshold and the bank erodible area. The bank scouring process is a power function dependent on high-flow events, defined as exceeding the flow threshold. . Bank erosion rates increase with flow above the threshold.
The wetted perimeter and reach length represent ground area covered by water (Figure 8-3). The erodible wetted perimeter is equal to the difference between the actual wetted perimeter and wetted perimeter during threshold flow conditions. The bank erosion rate per unit area was multiplied by the erodible perimeter and the reach length to obtain an estimate of sediment mass eroded corresponding to the stream segment.

Middle Ohio River South and North Watersheds: TMDL Report
57
Figure 8-3. Conceptual diagram of stream channel components used in the bank erosion model
Another important variable in the prediction of sediment yield is bank stability as defined by coefficient for scour of the bank matrix soil (kber) for the reach. In order to understand the bank stability for the Middle Ohio River South and Middle Ohio River North watersheds, the WVDEP conducted a bank erosion pin study. Observed data from the erosion pin study were processed to calculate the annual sediment loading from streambank erosion in the studied streams segments. Both quantitative and qualitative assessments indicated that vegetative coverage was the most important factor controlling bank stability. Overall bank stability was initially characterized by assessing and rating bank vegetative cover from aerial photography on a subwatershed basis. The bank vegetative cover was scored and each level was associated with a kber value.
The bank erosion component of the watershed model was then run using various kber values and the modeled loads were compared with the calculated loads from the pin study. Using the pin study streams as reference, the kber values were assigned to subwatersheds through a process that compared stream size, slope, and riparian condition as assessed through aerial photography.
The Technical Report provides more detailed discussions on the technical approaches used for sediment modeling, including the pin study.
8.2.3 Fecal Coliform Configuration
Modeled landuse categories contributing bacteria via precipitation and runoff include pasture, cropland, urban/residential pervious lands, urban/residential impervious lands, grassland, forest, barren land, and wetlands. Other sources, such as failing septic systems, straight pipes, and discharges from sewage treatment facilities, were modeled as direct, continuous-flow sources in the model.
The basis for the initial bacteria loading rates for landuses and direct sources is described in the Technical Report. The initial estimates were further refined during the model calibration. A variety of modeling tools were used to develop the fecal coliform bacteria TMDLs, including the

Middle Ohio River South and North Watersheds: TMDL Report
58
MDAS, and a customized spreadsheet to determine the fecal loading from failing residential septic systems identified during source tracking efforts by the WVDEP. Section 6.2.1 describes the process of assigning flow and fecal coliform concentrations to failing septic systems.
8.3 Hydrology Calibration
Hydrology and water quality calibration were performed in sequence because water quality modeling is dependent on an accurate hydrology simulation. Typically, hydrology calibration involves a comparison of model results with instream flow observations from USGS flow gauging stations throughout the watershed. USGS gauging station 03114500 Middle Island Creek at Little, WV was the only USGS flow gauging station in the Middle Ohio River North watershed with data records adequate for hydrology calibration. The Middle Ohio River South watershed did not have a stream gauging station within the modeled portion of the watershed. Hydrologic parameters calibrated for Middle Ohio River North were used in the Middle Ohio River South model because the two watersheds share similar geology and hydrology.
Hydrology calibration was based on observed data from that station and the landuses present in the watersheds from January 1, 2003 to October 31, 2006. Key considerations for hydrology calibration included the overall water balance, the high- and low-flow distribution, storm flows, and seasonal variation. The hydrology was validated for the time period of January 1, 1999 to November 30, 2008. As a starting point, many of the hydrology calibration parameters originated from the USGS Scientific Investigations Report 2005-5099 (Atkins, 2005). Final adjustments to model hydrology were based on flow measurements obtained during WVDEP’s pre-TMDL monitoring in the Middle Ohio River South and Middle Ohio River North watersheds. A detailed description of the hydrology calibration and a summary of the results and validation are presented in the Technical Report.
8.4 Water Quality Calibration
After the model was configured and calibrated for hydrology, the next step was to perform water quality calibration for the subject pollutants. The goal of water quality calibration was to refine model parameter values to reflect the unique characteristics of the watershed so that model output would predict field conditions as closely as possible. Both spatial and temporal aspects were evaluated through the calibration process.
The water quality was calibrated by comparing modeled versus observed pollutant concentrations. The water quality calibration consisted of executing the MDAS model, comparing the model results to available observations, and adjusting water quality parameters within reasonable ranges. Initial model parameters for the various pollutant parameters were derived from previous West Virginia TMDL studies, storm sampling efforts, and literature values. Available monitoring data in the watershed were identified and assessed for application to calibration. Monitoring stations with observations that represented a range of hydrologic conditions, source types, and pollutants were selected. The time-period for water quality calibration was selected based on the availability of the observed data and their relevance to the current conditions in the watershed.

Middle Ohio River South and North Watersheds: TMDL Report
59
WVDEP also conducted storm monitoring on Shrewsbury Hollow in Kanawha State Forest, Kanawha County, West Virginia. The data gathered during this sampling episode was used in the calibration of fecal coliform and to enhance the representation of background conditions from undisturbed areas. The results of the storm sampling fecal coliform calibration are shown in Figure 8-4.
Sediment calibration consisted of adjusting the soil erodibility and sediment washoff parameters by soil types and by landuse, and the coefficient of scour for bank-erosion. Initial values for these parameters were based on available landuse-specific storm-sampling monitoring data. Initial values were adjusted so that the model’s suspended solids output closely matched observed instream data in watersheds with predominately one type of source.
Figure 8-4. Shrewsbury Hollow fecal coliform observed data
8.5 Modeling Technique for Biological Impairments with Sedimentation Stressors
The SI process discussed in Section 4 indicated a need to reduce the contribution of excess sediment to some of the biologically impaired streams. Initially, a “reference watershed” TMDL development approach was pursued. The approach was based on selecting a non-impaired watershed that shares similar landuse, ecoregion, and geomorphologic characteristics with the impaired watershed. Stream conditions in the reference watershed are assumed to be
0
200
400
600
800
1000
1200
1400
1600
1800
-120 -60 0 60 120 180 240 300 360 420 480 540 600Fec
al C
olif
orm
(co
un
ts/1
00m
l)
Elapsed Time (minutes)
Water Quality Calibration - Fecal Coliform BacteriaForested Reference Site (Shrewsbury Hollow)
Modeled Fecal Coliform Observed Fecal Coliform

Middle Ohio River South and North Watersheds: TMDL Report
60
representative of the conditions needed for the impaired streams to attain their designated uses, and the normalized loading associated with the reference stream is used as the TMDL endpoint for the impaired streams. Given these parameters and a non-impaired biological score, Big Run (WV-OMN-13-CG-2) was selected as the reference watershed. The location of the reference watershed is shown in Figure 4-2.
All of the sediment-impaired streams exhibited impairments pursuant to total iron water quality criteria. Upon finalization of modeling based on the reference watershed approach, it was determined that sediment reductions necessary to ensure compliance with iron criteria are greater than those necessary to correct the biological impairments associated with sediment. As such, the iron TMDLs presented for the subject waters are appropriate surrogates for necessary sediment TMDLs. For affected streams, Table 8-1 contrasts the sediment reductions necessary to attain iron criteria with those needed to resolve biological impairment under the reference watershed approach. Please refer to the Technical Report for details regarding the reference watershed approach.
Table 8-1. Sediment loadings using different modeling approaches in Middle Ohio River South and Middle Ohio River North watersheds.
NHD Code Stream Name Allocated Sediment Load Iron TMDL
(tons/yr)
Allocated Sediment Load Reference
Approach (tons/yr)
WV-OMS-11 Sliding Hill Creek 94.83 605.54
WV-OMS-11-A UNT/Sliding Hill Creek RM 1.25 50.59 334.27
WV-OMS-13 Little Broad Run 16.40 152.00
WV-OMS-2 Oldtown Creek 402.09 2704.89
WV-OMS-23 Little Mill Creek 97.68 775.75
WV-OMS-24 Mill Creek 2605.94 15021.99
WV-OMS-24-AF Parchment Creek 352.21 2394.01
WV-OMS-24-AF-17 Cox Fork 46.30 344.90
WV-OMS-24-AF-27 Wolfe Creek 41.75 301.14
WV-OMS-24-AN Sycamore Creek 132.95 920.32
WV-OMS-24-AN-1 Left Fork/Sycamore Creek 61.66 429.82
WV-OMS-24-BA-20 Grasslick Creek 257.73 1733.13
WV-OMS-24-BI Little Mill Creek 353.00 2688.70
WV-OMS-24-BI-12 Little Creek 45.04 354.48
WV-OMS-24-BI-17 Buffalo Creek 24.69 232.70
WV-OMS-24-BI-9 Frozencamp Creek 84.03 700.92
WV-OMS-24-P Bar Run 14.54 108.21
WV-OMS-24-U Cow Run 133.19 930.30
WV-OMS-24-U-8 Left Fork/Cow Run 58.82 413.87
WV-OMS-25 Spring Creek 17.65 102.20
WV-OMS-28 Cedar Run 33.80 199.47
WV-OMS-2-D Turkey Run 20.32 159.89

Middle Ohio River South and North Watersheds: TMDL Report
61
NHD Code Stream Name Allocated Sediment Load Iron TMDL
(tons/yr)
Allocated Sediment Load Reference
Approach (tons/yr)
WV-OMS-2-F Potter Creek 21.85 190.07
WV-OMS-2-G-1 UNT/Robinson Run RM 2.42 5.88 39.56
WV-OMS-30 Sandy Creek 1306.23 7919.16
WV-OMS-30-K Crooked Fork 81.00 581.13
WV-OMS-30-O Trace Fork 64.40 510.33
WV-OMS-30-P Beatty Run 20.00 157.18
WV-OMS-30-R Left Fork/Sandy Creek 513.13 3665.18
WV-OMS-30-R-1 Copper Fork 29.26 265.58
WV-OMS-30-R-15 Nesselroad Run 109.88 884.01
WV-OMS-30-R-8 Turkey Fork 78.27 611.24
WV-OMS-30-S Right Fork/Sandy Creek 211.02 1644.35
WV-OMS-35 Washington Run 29.31 228.99
WV-OMS-44 Pond Creek 412.39 2747.33
WV-OMS-44-F-2 Jesse Run 12.13 124.54
WV-OMS-46-A South Fork/Lee Creek 148.32 1137.16
WV-OMS-46-B North Fork/Lee Creek 347.37 2141.31
WV-OMS-46-B-31 Gunners Run 5.41 44.61
WV-OMS-57 Sandy Creek 108.04 638.46
WV-OMS-57-D Vaughts Run 22.63 128.85
WV-OMS-6 Tenmile Creek 108.74 681.87
WV-OMS-65 Pond Run 79.23 444.40
WV-OMS-65-A Little Pond Run 18.85 123.52
WV-OMS-66 Briscoe Run 25.13 163.17
WV-OMS-69 Big Run 223.25 1268.76
WV-OMS-69-F Plum Run 25.91 160.55
WV-OMS-69-J Hogland Run 29.24 179.61
WV-OMS-6-D UNT/Tenmile Creek RM 5.33 7.40 63.68
WV-OMN-13 Middle Island Creek 6547.28 36078.92
WV-OMN-13-BF Sancho Creek 185.02 1420.49
WV-OMN-13-BK Point Pleasant Creek 514.50 3872.25
WV-OMN-13-BK-21 Peach Fork 11.38 102.76
WV-OMN-13-BK-4 Pursley Creek 107.56 791.15
WV-OMN-13-CG Indian Creek 237.47 2068.76
WV-OMN-13-CH McElroy Creek 944.14 6797.14
WV-OMN-13-DA-20 Right Fork/Arnold Creek 30.62 294.70
WV-OMN-13-DV Meathouse Fork 564.74 4136.81
WV-OMN-13-DW-9 Buckeye Run 47.48 392.50
WV-OMN-45-AG South Fork/Fishing Creek 650.72 4566.24
WV-OMN-45-AG-15 Arches Fork 74.79 633.74

Middle Ohio River South and North Watersheds: TMDL Report
62
NHD Code Stream Name Allocated Sediment Load Iron TMDL
(tons/yr)
Allocated Sediment Load Reference
Approach (tons/yr)
WV-OMN-45-AG-16 Fallen Timber Run 28.85 245.35
WV-OMN-45-AG-19 Price Run 102.58 813.56
WV-OMN-45-AG-7 Buffalo Run 72.59 604.77
WV-OMN-45-H Little Fishing Creek 338.42 2620.85
8.6 Allocation Strategy
As explained in Section 2, a TMDL is composed of the sum of individual WLAs for point sources, LAs for nonpoint sources, and natural background levels. In addition, the TMDL must include a MOS, implicitly or explicitly, that accounts for the uncertainty in the relationship between pollutant loads and the quality of the receiving waterbody. TMDLs can be expressed in terms of mass per time or other appropriate units. Conceptually, this definition is denoted by the equation:
TMDL = sum of WLAs + sum of LAs + MOS
To develop the TMDLs for each of the impairments listed in Table 3-3 of this report, the following approach was taken:
Define TMDL endpoints
Simulate baseline conditions
Assess source loading alternatives
Determine the TMDL and source allocations
8.6.1 TMDL Endpoints
TMDL endpoints represent the water quality targets used to quantify TMDLs and their individual components. In general, West Virginia’s numeric water quality criteria for the subject pollutants and an explicit five percent MOS were used to identify endpoints for TMDL development.
The five percent explicit MOS was used to counter uncertainty in the modeling process. Long-term water quality monitoring data were used for model calibration. Although these data represented actual conditions, they were not of a continuous time series and might not have captured the full range of instream conditions that occurred during the simulation period. The explicit five percent MOS also accounts for those cases where monitoring might not have captured the full range of instream conditions.
An explicit margin of safety was not applied for total iron in certain subwatersheds where abandoned mine lands create an effluent dominated scenario. Within these scenarios, load

Middle Ohio River South and North Watersheds: TMDL Report
63
allocations are established at the value of the iron criterion and little uncertainty is associated with the source/water quality linkage. The TMDL endpoints for the various criteria are displayed in Table 8-2.
Table 8-2. TMDL Endpoints
Water Quality Criterion
Designated Use Criterion Value TMDL Endpoint
Total Iron Aquatic Life, warmwater fisheries
1.5 mg/L (4-day average)
1.425 mg/L (4-day average)
Fecal Coliform Water Contact Recreation and Public Water Supply
200 counts / 100 mL (Monthly Geometric Mean)
190 counts / 100 mL (Monthly Geometric Mean)
Fecal Coliform Water Contact Recreation and Public Water Supply
400 counts / 100 mL (Daily, 10% exceedance)
380 counts / 100 mL (Daily, 10% exceedance)
TMDLs are presented as average daily loads that were developed to meet TMDL endpoints under a range of conditions observed throughout the year. For most pollutants, analysis of available data indicated that critical conditions occur during both high- and low-flow events. To appropriately address the low- and high-flow critical conditions, the TMDLs were developed using continuous simulation (modeling over a period of several years that captured precipitation extremes), which inherently considers seasonal hydrologic and source loading variability.
8.6.2 Baseline Conditions and Source Loading Alternatives
The calibrated model provides the basis for performing the allocation analysis. The first step is to simulate baseline conditions, which represent existing nonpoint source loadings and point sources loadings at permit limits. Baseline conditions allow for an evaluation of instream water quality under the highest expected loading conditions.
Baseline Conditions for MDAS
The MDAS model was run for baseline conditions using hourly precipitation data for a representative six year simulation period (January 1, 1998 through December 31, 2003). The precipitation experienced over this period was applied to the landuses and pollutant sources as they existed at the time of TMDL development. Long-term hourly precipitation data available from the National Oceanic and Atmospheric Administration National Climatic Data Center (NOAA-NCDC) weather station West Union (WV9458) was used. Additional meteorological data (wind speed, potential evapotranspiration, cloud cover, temperature, and dewpoint) were available from the Parkersburg Airport (WBAN 03804) station. The data were applied to each subwatershed according to proximity.
Predicted instream concentrations were compared directly with the TMDL endpoints. This comparison allowed for the evaluation of the magnitude and frequency of exceedances under a range of hydrologic and environmental conditions, including dry periods, wet periods, and average periods. Figure 8-5 presents the annual rainfall totals for the years 1992 through 2008 at

Middle Ohio River South and North Watersheds: TMDL Report
64
the West Union (WV9458) weather station in West Virginia. The years 1998 to 2003 are highlighted to indicate the range of precipitation conditions used for TMDL development in the Middle Ohio River South and Middle Ohio River North watersheds.
Figure 8-5. Annual precipitation totals for the West Union (WV9458) weather station
Mining discharges that are influenced by precipitation were represented during baseline conditions using precipitation, drainage area and applicable effluent limitations. For non-precipitation-induced mining discharges, available flow and/or pump capacity information was used in conjunction with applicable effluent limitations. The metals concentrations associated with common effluent limitations are presented in Table 8-3. The concentrations displayed in Table 8-3 accurately represent existing WLAs for the majority of mining discharges. In the limited instances where existing effluent limitations vary from the displayed values, the outlets were represented at next higher condition. For example, existing iron effluent limits between 1.5 and 3.2 mg/L were represented at 3.2 mg/L.
Table 8-3. Concentrations used in representing permitted conditions for active mining
Pollutant Technology-based Permits Water Quality-based Permits
Iron, total 3.2 mg/L 1.5 mg/L
Certain non-mining discharges (stormwater associated with non-construction, industrial activity) were represented using precipitation, drainage area, and the stormwater benchmark iron value of 1.0 mg/L.
0
10
20
30
40
50
60
19
92
19
93
19
94
19
95
19
96
19
97
19
98
19
99
20
00
20
01
20
02
20
03
20
04
20
05
20
06
20
07
20
08
Year
To
tal
An
nu
al R
ain
fall
(in
)
Middle Ohio River South and North Watersheds: TMDL Report
65
A range of 0-1.0 percent of the total subwatershed area was allotted for concurrent construction activity under the CSGP. Baseline loadings were based upon precipitation and runoff and an assumption that proper installation and maintenance of required BMPs will achieve a TSS benchmark value of 100 mg/L.
Sediment producing nonpoint source and background loadings were represented using precipitation, drainage area, and the iron loading associated with their predicted sediment contributions.
Effluents from sewage treatment plants were represented under baseline conditions as continuous discharges, using the design flow for each facility and the monthly geometric mean fecal coliform effluent limitation of 200 counts/100 mL.
CSO outlets were represented as discreet point sources in the model. CSO flow and discharge frequency was derived from overflow data generated by the POTWs. This information was augmented with precipitation analysis and watershed modeling to develop model inputs needed to build fecal coliform loading values for a ten-year time series from which annual average fecal coliform loading values could be calculated. Under baseline conditions, West Union and New Martinsville CSO quality was represented as a concentration of 100,000 counts/100 mL to reflect baseline conditions for untreated CSO discharges.
MS4, nonpoint source and background loadings for fecal coliform were represented using drainage area, precipitation, and pollutant accumulation and wash-off rates, as appropriate for each landuse.
Source Loading Alternatives
Simulating baseline conditions allowed for the evaluation of each stream’s response to variations in source contributions under a variety of hydrologic conditions. This sensitivity analysis gave insight into the dominant sources and the mechanisms by which potential decreases in loads would affect instream pollutant concentrations. The loading contributions from the various existing sources were individually adjusted; the modeled instream concentrations were then evaluated.
Multiple allocation scenarios were run for the impaired waterbodies. Successful scenarios achieved the TMDL endpoints under all flow conditions throughout the modeling period. The averaging period and allowable exceedance frequency associated with West Virginia water quality criteria were considered in these assessments. In general, loads contributed by sources that had the greatest impact on instream concentrations were reduced first. If additional load reductions were required to meet the TMDL endpoints, less significant source contributions were subsequently reduced.
Figure 8-6 shows an example of model output for a baseline condition and a successful TMDL scenario.

Middle Ohio River South and North Watersheds: TMDL Report
66
Figure 8-6. Example of baseline and TMDL conditions for total iron
8.7 TMDLs and Source Allocations
8.7.1 Total Iron TMDLs
Source allocations were developed for all modeled subwatersheds contributing to the iron impaired streams of the Middle Ohio River South and Middle Ohio River North watersheds. In order to meet iron criterion and allow for equitable allocations, reductions to existing sources were first assigned using the following general rules:
1. The loading from streambank erosion was first reduced to the loading characteristics of the streams with the best observed streambank conditions, as determined by the bank erosion pin study.
2. The following land disturbing sources were equitably reduced to the iron loading associated with 100 mg/L TSS. Abandoned mine lands Barren Cropland Pasture Urban/MS4 Pervious Oil and gas Harvested Forest and Skid Roads
0.5
0.75
1
1.25
1.5
1.75
2
2.25
0 50 100 150 200 250 300 350
Simulation Period(Days)
Iro
n,
To
tal
(mg
/L)
Water Quality Criteria TMDL Target (WQ Criteria & 5%MOS)
Baseline Condition TMDL Condition

Middle Ohio River South and North Watersheds: TMDL Report
67
Burned Forest Unpaved Roads
3. Traditional Permits and AML seeps were reduced to water quality criterion end of pipe (1.5 mg/L iron).
In addition to reducing the streambank erosion and source contributions, activity under the CSGP was considered. Area based WLAs were provided for each subwatershed to accommodate existing and future registrations under the CSGP.
Initially, one percent of the subwatershed area was allocated for CSGP activity in each subwatershed; with the exception of the subwatersheds with the highest concentration of sediment-associated iron (slope group 4), in which an allowance of 0.5 percent of subwatershed area was assigned for CSGP activity.
After executing the above provisions, model output was evaluated to determine the criterion attainment status at all subwatershed pour points. Where the model indicated non-attainment with the total iron criterion, further reductions to CSGP activity area allowances were made in a stepwise approach until the criterion was achieved. Non-attaining headwater subwatersheds were set at zero percent. Next, the CSGP activity area allowances for all subwatersheds contributing to non-attaining downstream subwatersheds were incrementally reduced from 0.5 percent to 0.2 percent area allowances until the criterion was achieved.
After executing the reductions to CSGP areas, the model continued to indicate non-attainment at the pour points of a limited number of subwatersheds. In those subwatersheds, the iron loads from the dominant source were reduced below the associated 100 mg/l TSS threshold until the water quality criterion was met.
The flowchart presented in Figure 8-7 displays the total iron allocation methodology. The Initial Allocations Conditions are those listed in 1-3 above, in addition to the initial one percent and 0.5 percent CSGP area allowances.
Using this method ensured that contributions from all sources were weighted equitably and that cumulative load endpoints were met at the most downstream subwatershed for each impaired stream. Reductions in sources affecting impaired headwaters ultimately led to improvements downstream and effectively decreased necessary loading reductions from downstream sources. Nonpoint source reductions did not result in allocated loadings less than natural conditions. Permitted source reductions did not result in allocated loadings to a permittee that would be more stringent than water quality criteria.

Middle Ohio River South and North Watersheds: TMDL Report
68
Figure 8-7. Flowchart of the total iron allocation methodology

Middle Ohio River South and North Watersheds: TMDL Report
69
Wasteload Allocations
WLAs were developed for all point sources permitted to discharge iron under a NPDES permit. Because of the established relationship between iron and TSS, iron WLAs are also provided for facilities with stormwater discharges that are regulated under NPDES permits that contain TSS and/or iron effluent limitations or benchmarks values, MS4 facilities, and facilities registered under the General NPDES permit for construction stormwater.
Active Mining Operations WLAs are provided for all existing outlets of NPDES permits for mining activities, except those where reclamation has progressed to the point where existing limitations are based upon the Post-Mining Area provisions of Subpart E of 40 CFR 434. The WLAs for active mining operations consider the functional characteristics of the permitted outlets (i.e. precipitation driven, pumped continuous flow, gravity continuous flow, commingled) and their respective impacts at high and low flow conditions.
The federal effluent guidelines for the coal mining point source category (40 CFR 434) provide various alternative limitations for discharges caused by precipitation. Under those technology-based guidelines, effluent limitations for total iron and TSS may be replaced with an alternative limitation for “settleable solids” during certain magnitude precipitation events that vary by mining subcategory. The water quality-based WLAs and future growth provisions of the iron TMDLs preclude the applicability of the “alternative precipitation” iron provisions of 40 CFR 434. Also, the established relationship between iron and TSS requires continuous control of TSS concentration in permitted discharges to achieve iron WLAs. As such, the “alternative precipitation” TSS provisions of 40 CFR 434 should not be applied to point source discharges associated with the iron TMDLs.
In certain instances, prescribed WLAs may be less stringent than existing effluent limitations. However, the TMDLs are not intended to relax effluent limitations that were developed under the alternative basis of WVDEP’s implementation of the antidegradation provisions of the Water Quality Standards, which may result in more stringent allocations than those resulting from the TMDL process. Whereas TMDLs prescribe allocations that minimally achieve water quality criteria (i.e. 100 percent use of a stream’s assimilative capacity), the antidegradation provisions of the standards are designed to maintain the existing quality of high-quality waters. Antidegradation provisions may result in more stringent allocations that limit the use of remaining assimilative capacity. Also, water quality-based effluent limitations developed in the NPDES permitting process may dictate more stringent effluent limitations for discharge locations that are upstream of those considered in the TMDLs. TMDL allocations reflect pollutant loadings that are necessary to achieve water quality criteria at distinct locations (i.e., the pour points of delineated subwatersheds). In contrast, effluent limitation development in the permitting process is based on the achievement/maintenance of water quality criteria at the point of discharge.
Specific WLAs are not provided for “post-mining” outlets because programmatic reclamation was assumed to have returned disturbed areas to conditions that approach background. Barring unforeseen circumstances that alter their current status, such outlets are authorized to continue to discharge under the existing terms and conditions of their NPDES permit.

Middle Ohio River South and North Watersheds: TMDL Report
70
Discharges regulated by the Multi Sector Stormwater Permit
Certain registrations under the general permit for stormwater associated with industrial activity implement TSS and/or iron benchmark values. Facilities that are compliant with such limitations are not considered to be significant sources of sediment or iron. Facilities that are present in the watersheds of iron-impaired streams are assigned WLAs that allow for continued discharge under existing permit conditions.
Municipal Separate Storm Sewer System (MS4)
USEPA’s stormwater permitting regulations require municipalities to obtain permit coverage for stormwater discharges from MS4s. In the TMDL watersheds of the Middle Ohio River South there are four designated MS4 entities: the City of Parkersburg, the City of Vienna, the Town of Williamstown, and the West Virginia Division of Highways (DOH). Each entity will be registered under, and subject to, the requirements of General Permit Number WV0110625. The stormwater discharges from MS4s are point sources for which the TMDLs prescribe WLAs.
In the majority of the subwatersheds where MS4 entities have areas of responsibility, the urban, residential and road landuses strongly influence bank erosion. As such, portions of the baseline and allocated loads associated with bank erosion are included in the MS4 WLAs.
The subdivision of the bank erosion component between point and nonpoint sources, and where applicable, between multiple MS4 entities, is proportional to their respective drainage areas within each subwatershed. Model representation of bank erosion is accomplished through consideration of a number of inputs including slope, soils, imperviousness, and the stability of existing streambanks. Bank erosion loadings are most strongly influenced by upland impervious area and bank stability. The decision to include bank erosion in the MS4 WLAs results from the predominance of urban/residential/road landuses and impacts in MS4 areas. WVDEP’s assumption is that management practices will be implemented under the MS4 permit to directly address impacts from bank erosion. However, even if the implementation of stormwater controls on uplands is maximized, and the volume and intensity of stormwater runoff are minimized, the existing degraded stability of streambanks may continue to accelerate erosion. The erosion of unstable streambanks is a nonpoint source of sediment that is included in the MS4 allocations. Natural attenuation of legacy impacts cannot be expected in the short term, but may be accelerated by bank stabilization projects. The inclusion of the bank erosion load component in the WLAs of MS4 entities is not intended to prohibit or discourage cooperative bank stabilization projects between MS4 entities and WVDEP’s Nonpoint Source Program, or to prohibit the use of Section 319 funding as a component of those projects.
Construction Stormwater
Specific WLAs for activity under the CSGP are provided at the subwatershed scale and are described in Section 10. An allocation of 0 to 1.0 percent of subwatershed area was provided with loadings based upon precipitation and runoff and an assumption that required BMPs, if properly installed and maintained, will achieve a TSS benchmark value of 100 mg/L. In certain areas, the existing level of activity under the CSGP does not conform to the subwatershed allocations. In these instances the WVDEP, DWWM permitting program will require

Middle Ohio River South and North Watersheds: TMDL Report
71
stabilization and permit termination in the shortest time possible. Thereafter the program will maintain concurrently disturbed area as allocated or otherwise control future activity through provisions described in Section 10.
Load Allocations (LAs) LAs are made for the dominant nonpoint source categories as follows:
AML: loading from abandoned mine lands, including loads from disturbed land, highwalls, deep mine discharges and seeps
Sediment sources: loading associated with sediment contributions from barren land, harvested forest, oil and gas well operations, agricultural landuses and residential/urban/road landuses and streambank erosion in non-MS4 areas .
Background and other nonpoint sources: loading from undisturbed forest and grasslands (background loadings were represented but not reduced)
8.7.2 Fecal Coliform Bacteria TMDLs
TMDLs and source allocations were developed for impaired steams and their tributaries on a subwatershed basis throughout the watershed. As described in Section 8.7.1, a top-down methodology was followed to develop these TMDLs and allocate loads to sources.
The following general methodology was used when allocating loads to fecal coliform bacteria sources:
The effluents from all NPDES permitted sewage treatment plants were set at the permit limit (200 counts/100 mL monthly geometric mean)
Because West Virginia Bureau for Public Health regulations prohibit the discharge of raw sewage into surface waters, all illicit discharges of human waste (from failing septic systems and straight pipes) were reduced by 100 percent in the model
All CSO discharges were set at 200 counts/100ml to reflect USEPA’s position on bacteria water quality criteria and mixing zones as prescribed in an USEPA memo dated November 12, 2008, from Ephram S. King, Director of the Office of Science.
If further reduction was necessary, MS4s, and non-point source loadings from agricultural lands and residential areas were subsequently reduced until in-stream water quality criteria were met
Wasteload Allocations WLAs were developed for all facilities permitted to discharge fecal coliform bacteria, including MS4s, as described below.
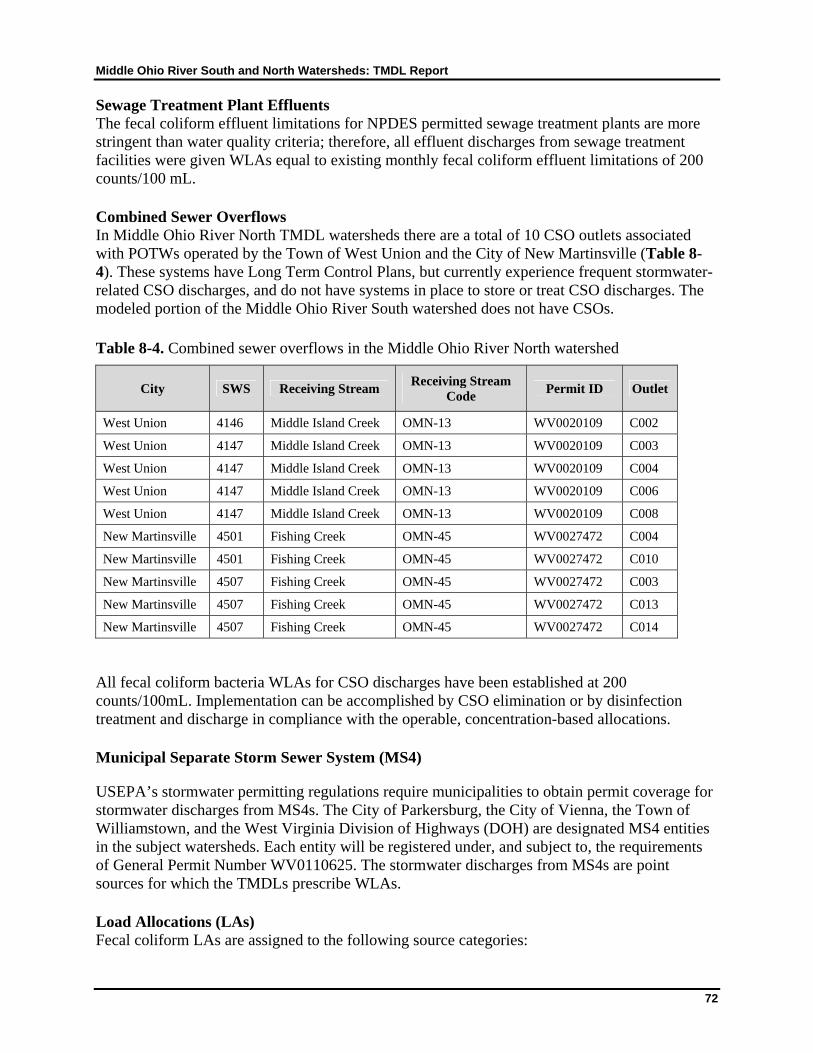
Middle Ohio River South and North Watersheds: TMDL Report
72
Sewage Treatment Plant Effluents The fecal coliform effluent limitations for NPDES permitted sewage treatment plants are more stringent than water quality criteria; therefore, all effluent discharges from sewage treatment facilities were given WLAs equal to existing monthly fecal coliform effluent limitations of 200 counts/100 mL.
Combined Sewer Overflows In Middle Ohio River North TMDL watersheds there are a total of 10 CSO outlets associated with POTWs operated by the Town of West Union and the City of New Martinsville (Table 8-4). These systems have Long Term Control Plans, but currently experience frequent stormwater-related CSO discharges, and do not have systems in place to store or treat CSO discharges. The modeled portion of the Middle Ohio River South watershed does not have CSOs.
Table 8-4. Combined sewer overflows in the Middle Ohio River North watershed
City SWS Receiving Stream Receiving Stream
Code Permit ID Outlet
West Union 4146 Middle Island Creek OMN-13 WV0020109 C002
West Union 4147 Middle Island Creek OMN-13 WV0020109 C003
West Union 4147 Middle Island Creek OMN-13 WV0020109 C004
West Union 4147 Middle Island Creek OMN-13 WV0020109 C006
West Union 4147 Middle Island Creek OMN-13 WV0020109 C008
New Martinsville 4501 Fishing Creek OMN-45 WV0027472 C004
New Martinsville 4501 Fishing Creek OMN-45 WV0027472 C010
New Martinsville 4507 Fishing Creek OMN-45 WV0027472 C003
New Martinsville 4507 Fishing Creek OMN-45 WV0027472 C013
New Martinsville 4507 Fishing Creek OMN-45 WV0027472 C014
All fecal coliform bacteria WLAs for CSO discharges have been established at 200 counts/100mL. Implementation can be accomplished by CSO elimination or by disinfection treatment and discharge in compliance with the operable, concentration-based allocations.
Municipal Separate Storm Sewer System (MS4)
USEPA’s stormwater permitting regulations require municipalities to obtain permit coverage for stormwater discharges from MS4s. The City of Parkersburg, the City of Vienna, the Town of Williamstown, and the West Virginia Division of Highways (DOH) are designated MS4 entities in the subject watersheds. Each entity will be registered under, and subject to, the requirements of General Permit Number WV0110625. The stormwater discharges from MS4s are point sources for which the TMDLs prescribe WLAs.
Load Allocations (LAs) Fecal coliform LAs are assigned to the following source categories:

Middle Ohio River South and North Watersheds: TMDL Report
73
Pasture/Cropland
Residential — loading associated with urban/residential runoff from non-MS4 areas
Background and Other Nonpoint Sources — loading associated with wildlife sources from all other landuses (contributions/loadings from wildlife sources were not reduced)
8.7.3 Seasonal Variation
Seasonal variation was considered in the formulation of the modeling analysis. Continuous simulation (modeling over a period of several years that captured precipitation extremes) inherently considers seasonal hydrologic and source loading variability. The metals and fecal coliform concentrations simulated on a daily time step by the model were compared with TMDL endpoints. Allocations that met these endpoints throughout the modeling period were developed.
8.7.4 Critical Conditions
A critical condition represents a scenario where water quality criteria are most susceptible to violation. Analysis of water quality data for the impaired streams addressed in this effort shows high pollutant concentrations during both high- and low-flow thereby precluding selection of a single critical condition. Both high-flow and low-flow periods were taken into account during TMDL development by using a long period of weather data that represented wet, dry, and average flow periods.
Nonpoint source loading is typically precipitation-driven and impacts tend to occur during wet weather and high surface runoff. During dry periods little or no land-based runoff occurs, and elevated instream pollutant levels may be due to point sources (Novotny and Olem, 1994). Also, failing on-site sewage systems and AML seeps (both categorized as nonpoint sources but represented as continuous flow discharges) often have an associated low-flow critical condition, particularly where such sources are located on small receiving waters.
8.7.5 TMDL Presentation
The TMDLs for all impairments are shown in Section 9 of this report. The TMDLs for iron are presented as average daily loads, in pounds per day. The TMDLs for fecal coliform bacteria are presented in average number of colonies per day. The biological TMDLs are handled using surrogate approaches where iron or fecal coliform loadings necessary to attain existing numeric criteria are presented. All TMDLs were developed to meet TMDL endpoints under a range of conditions observed over the modeling period. TMDLs and their components are also presented in the allocation spreadsheets associated with this report. The filterable spreadsheets also display detailed source allocations and include multiple display formats that allow comparison of pollutant loadings among categories and facilitate implementation.
The iron WLAs for active mining operations are presented both as annual average loads, for comparison with other pollutant sources, and equivalent allocation concentrations. The prescribed concentrations are the operable allocations and are to be implemented by conversion to monthly average and daily maximum effluent limitations using USEPA’s Technical Support Document for Water Quality-based Toxics Control (USEPA, 1991). The iron WLAs for CSGP

Middle Ohio River South and North Watersheds: TMDL Report
74
registrations and future growth allowances are presented as both annual average loads, for comparison with other sources, and equivalent area registered under the permit. The registered area is the operable allocation. The iron WLAs for non-construction sectors registered under the Multi Sector Stormwater Permit are presented both as annual average loads, for comparison with other pollutant sources, and equivalent allocation concentrations. The prescribed concentrations are operable, and because they are equivalent to existing effluent limitations/benchmark values, they are to be directly implemented.
The fecal coliform bacteria WLAs for sewage treatment plant effluents and CSOs are presented both as annual average loads, for comparison with other pollutant sources, and equivalent allocation concentrations. The prescribed concentrations are the operable allocations for NPDES permit implementation.
The WLAs for precipitation induced MS4 discharges are presented in terms of average daily loads (Fe) or average number of colonies per day (FC) and the percent pollutant reduction from baseline conditions. The “MS4 WLA Summary” tabs of the allocation spreadsheets contain the operable allocations. The “MS4 WLA Details” tabs on the allocation spreadsheets provide drainage areas of various land use types represented in the baseline condition (without BMPs) for each MS4 entity at the subwatershed scale. That information is intended to assist registrants under the MS4 General Permit in describing the management practices to be employed to achieve prescribed allocations.


Middle Ohio River North and South Watersheds: TMDL Report
76
9.0 TMDL RESULTS
Table 9-1. Iron TMDLs in the Middle Ohio River South Watershed
NHD Code Stream Name Metal LA
(lbs/day) WLA
(lbs/day) MOS
(lbs/day) TMDL
(lbs/day)
WV-OMS-1 Crooked Creek Iron 26.70 11.46 2.01 40.17
WV-OMS-1-A UNT/Crooked Creek RM 1.53 Iron 2.45 1.27 0.20 3.92
WV-OMS-1-B UNT/Crooked Creek RM 2.03 Iron 2.18 1.18 0.18 3.54
WV-OMS-1-C UNT/Crooked Creek RM 4.34 Iron 3.46 1.73 0.27 5.47
WV-OMS-1-F UNT/Crooked Creek RM 6.52 Iron 1.28 0.70 0.10 2.08
WV-OMS-1-G UNT/Crooked Creek RM 8.05 Iron 1.59 0.86 0.13 2.58
WV-OMS-2 Oldtown Creek Iron 165.29 11.77 9.32 186.37
WV-OMS-2-A UNT/Oldtown Creek RM 2.00 Iron 1.66 0.43 0.11 2.21
WV-OMS-2-D Turkey Run Iron 6.97 0.36 0.39 7.72
WV-OMS-2-F Potter Creek Iron 5.10 1.28 0.34 6.71
WV-OMS-2-G Robinson Run Iron 20.21 2.76 1.21 24.17
WV-OMS-2-G-1 UNT/Robinson Run RM 2.42 Iron 1.37 0.20 0.08 1.66
WV-OMS-2-G-3 UNT/Robinson Run RM 3.33 Iron 2.19 0.26 0.13 2.59
WV-OMS-2-I UNT/Oldtown Creek RM 11.50 Iron 1.85 0.24 0.11 2.21
WV-OMS-2-J Rayburn Creek Iron 7.77 NA 0.41 8.18
WV-OMS-2-K UNT/Oldtown Creek RM 13.95 Iron 2.83 0.31 0.17 3.30
WV-OMS-2-M Trace Fork Iron 16.15 1.11 0.91 18.17
WV-OMS-2-M-1 UNT/Trace Fork RM 0.72 Iron 1.38 0.15 0.08 1.61
WV-OMS-2-M-2 UNT/Trace Fork RM 1.59 Iron 2.11 NA 0.11 2.22
WV-OMS-2-M-4 UNT/Trace Fork RM 2.97 Iron 3.73 NA 0.20 3.93
WV-OMS-2-N Fallentimber Branch Iron 8.06 NA 0.42 8.48
WV-OMS-2-O UNT/Oldtown Creek RM 18.16 Iron 4.48 NA 0.24 4.71
WV-OMS-2-R UNT/Oldtown Creek RM 19.38 Iron 4.36 NA 0.23 4.59
WV-OMS-2-S UNT/Oldtown Creek RM 20.03 Iron 2.01 NA 0.11 2.12
WV-OMS-4 Mill Run Iron 15.02 2.38 0.92 18.31
WV-OMS-4-A UNT/Mill Run RM 1.77 Iron 1.73 NA 0.09 1.82
WV-OMS-4-B UNT/Mill Run RM 1.81 Iron 2.36 0.64 0.16 3.16
WV-OMS-4-C UNT/Mill Run RM 2.22 Iron 1.43 NA 0.08 1.50
WV-OMS-4-D UNT/Mill Run RM 3.13 Iron 0.62 0.21 0.04 0.86

Middle Ohio River North and South Watersheds: TMDL Report
77
NHD Code Stream Name Metal LA
(lbs/day) WLA
(lbs/day) MOS
(lbs/day) TMDL
(lbs/day)
WV-OMS-6 Tenmile Creek Iron 39.07 6.55 2.40 48.02
WV-OMS-6-A UNT/Tenmile Creek RM 2.68 Iron 1.21 NA 0.06 1.27
WV-OMS-6-C UNT/Tenmile Creek RM 4.13 Iron 0.55 0.16 0.04 0.75
WV-OMS-6-D UNT/Tenmile Creek RM 5.33 Iron 1.96 0.70 0.14 2.80
WV-OMS-6-I UNT/Tenmile Creek RM 8.02 Iron 2.91 0.75 0.19 3.85
WV-OMS-11 Sliding Hill Creek Iron 24.99 5.78 1.62 32.39
WV-OMS-11-A UNT/Sliding Hill Creek RM 1.25 Iron 15.75 3.77 1.03 20.54
WV-OMS-11-A-1 UNT/UNT RM 1.12/Sliding Hill Creek RM 1.35 Iron 4.68 1.33 0.32 6.32
WV-OMS-11-A-5 UNT/UNT RM 3.75/Sliding Hill Creek RM 1.35 Iron 0.30 0.11 0.02 0.44
WV-OMS-12 Broad Run Iron 20.17 4.20 1.28 25.65
WV-OMS-12-A Seaman Run Iron 2.23 0.60 0.15 2.98
WV-OMS-12-G UNT/Broad Run RM 5.39 Iron 3.09 0.66 0.20 3.95
WV-OMS-12-H UNT/Sliding Hill Creek RM 1.2 Iron 1.21 NA 0.06 1.28
WV-OMS-13 Little Broad Run Iron 2.80 5.27 0.42 8.49
WV-OMS-14 West Creek Iron 20.16 4.37 1.29 25.82
WV-OMS-14-A UNT/West Creek RM 1.59 Iron 0.77 0.23 0.05 1.05
WV-OMS-14-B UNT/West Creek RM 1.69 Iron 2.50 0.75 0.17 3.43
WV-OMS-14-E UNT/West Creek RM 3.08 Iron 1.35 0.57 0.10 2.02
WV-OMS-23 Little Mill Creek Iron 40.55 4.37 2.36 47.29
WV-OMS-23-K UNT/Little Mill Creek RM 5.93 Iron 2.11 NA 0.11 2.22
WV-OMS-23-L Right Fork/Little Mill Creek Iron 8.48 NA 0.45 8.93
WV-OMS-24 Mill Creek Iron 949.41 130.22 56.82 1136.45
WV-OMS-24-A Lick Run (OMS-24-A) Iron 11.31 3.07 0.76 15.13
WV-OMS-24-A-10 UNT/Lick Run RM 4.74 Iron 2.72 0.77 0.18 3.67
WV-OMS-24-D UNT/Mill Creek RM 2.36 Iron 0.72 0.19 0.05 0.96
WV-OMS-24-K Falls Run Iron 3.64 1.03 0.25 4.92
WV-OMS-24-P Bar Run Iron 4.67 0.73 0.28 5.68
WV-OMS-24-P-4 UNT/Bar Run RM 0.78 Iron 0.77 0.26 0.05 1.08
WV-OMS-24-U Cow Run Iron 34.95 8.09 2.27 45.31
WV-OMS-24-U-5 UNT/Cow Run RM 1.17 Iron 2.42 0.73 0.17 3.32
WV-OMS-24-U-7 Right Fork/Cow Run Iron 11.68 3.21 0.78 15.68
WV-OMS-24-U-7-C Grass Run (OMS-24-U-7-C) Iron 2.45 0.64 0.16 3.25
WV-OMS-24-U-8 Left Fork/Cow Run Iron 14.28 3.45 0.93 18.66
WV-OMS-24-U-8-E UNT/Left Fork RM 2.51/Cow Run Iron 3.87 1.07 0.26 5.20
WV-OMS-24-AF Parchment Creek Iron 119.32 19.58 7.31 146.22
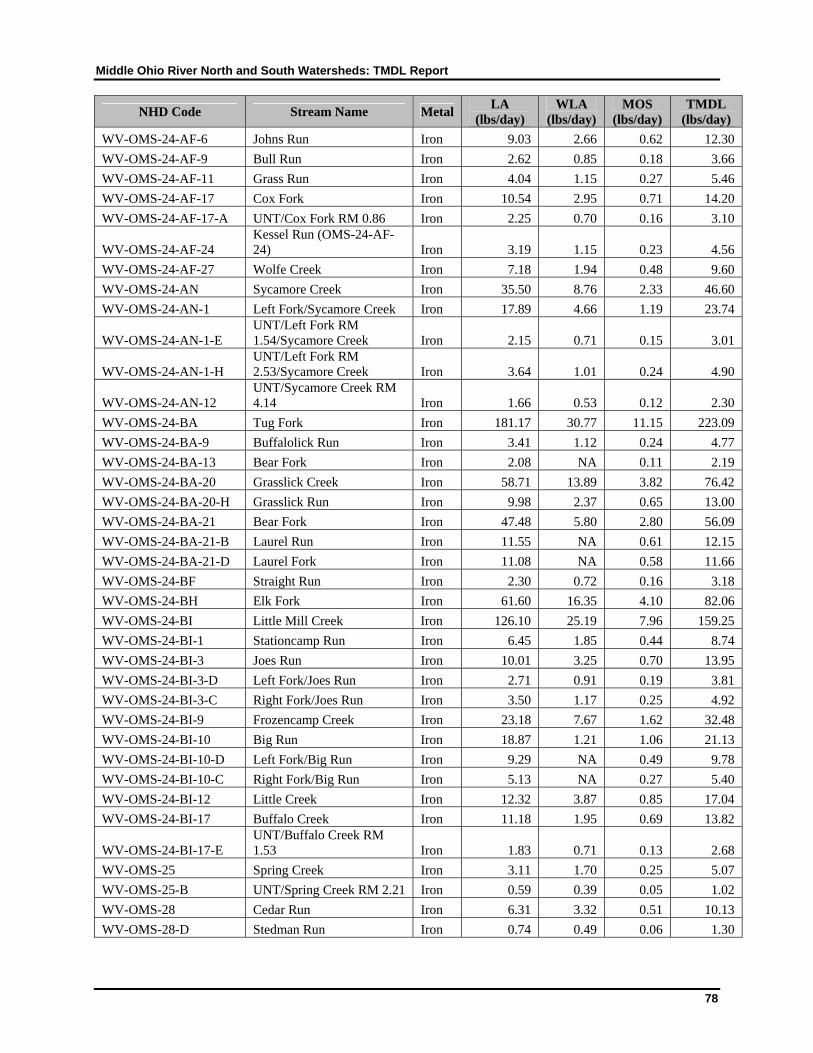
Middle Ohio River North and South Watersheds: TMDL Report
78
NHD Code Stream Name Metal LA
(lbs/day) WLA
(lbs/day) MOS
(lbs/day) TMDL
(lbs/day)
WV-OMS-24-AF-6 Johns Run Iron 9.03 2.66 0.62 12.30
WV-OMS-24-AF-9 Bull Run Iron 2.62 0.85 0.18 3.66
WV-OMS-24-AF-11 Grass Run Iron 4.04 1.15 0.27 5.46
WV-OMS-24-AF-17 Cox Fork Iron 10.54 2.95 0.71 14.20
WV-OMS-24-AF-17-A UNT/Cox Fork RM 0.86 Iron 2.25 0.70 0.16 3.10
WV-OMS-24-AF-24 Kessel Run (OMS-24-AF-24) Iron 3.19 1.15 0.23 4.56
WV-OMS-24-AF-27 Wolfe Creek Iron 7.18 1.94 0.48 9.60
WV-OMS-24-AN Sycamore Creek Iron 35.50 8.76 2.33 46.60
WV-OMS-24-AN-1 Left Fork/Sycamore Creek Iron 17.89 4.66 1.19 23.74
WV-OMS-24-AN-1-E UNT/Left Fork RM 1.54/Sycamore Creek Iron 2.15 0.71 0.15 3.01
WV-OMS-24-AN-1-H UNT/Left Fork RM 2.53/Sycamore Creek Iron 3.64 1.01 0.24 4.90
WV-OMS-24-AN-12 UNT/Sycamore Creek RM 4.14 Iron 1.66 0.53 0.12 2.30
WV-OMS-24-BA Tug Fork Iron 181.17 30.77 11.15 223.09
WV-OMS-24-BA-9 Buffalolick Run Iron 3.41 1.12 0.24 4.77
WV-OMS-24-BA-13 Bear Fork Iron 2.08 NA 0.11 2.19
WV-OMS-24-BA-20 Grasslick Creek Iron 58.71 13.89 3.82 76.42
WV-OMS-24-BA-20-H Grasslick Run Iron 9.98 2.37 0.65 13.00
WV-OMS-24-BA-21 Bear Fork Iron 47.48 5.80 2.80 56.09
WV-OMS-24-BA-21-B Laurel Run Iron 11.55 NA 0.61 12.15
WV-OMS-24-BA-21-D Laurel Fork Iron 11.08 NA 0.58 11.66
WV-OMS-24-BF Straight Run Iron 2.30 0.72 0.16 3.18
WV-OMS-24-BH Elk Fork Iron 61.60 16.35 4.10 82.06
WV-OMS-24-BI Little Mill Creek Iron 126.10 25.19 7.96 159.25
WV-OMS-24-BI-1 Stationcamp Run Iron 6.45 1.85 0.44 8.74
WV-OMS-24-BI-3 Joes Run Iron 10.01 3.25 0.70 13.95
WV-OMS-24-BI-3-D Left Fork/Joes Run Iron 2.71 0.91 0.19 3.81
WV-OMS-24-BI-3-C Right Fork/Joes Run Iron 3.50 1.17 0.25 4.92
WV-OMS-24-BI-9 Frozencamp Creek Iron 23.18 7.67 1.62 32.48
WV-OMS-24-BI-10 Big Run Iron 18.87 1.21 1.06 21.13
WV-OMS-24-BI-10-D Left Fork/Big Run Iron 9.29 NA 0.49 9.78
WV-OMS-24-BI-10-C Right Fork/Big Run Iron 5.13 NA 0.27 5.40
WV-OMS-24-BI-12 Little Creek Iron 12.32 3.87 0.85 17.04
WV-OMS-24-BI-17 Buffalo Creek Iron 11.18 1.95 0.69 13.82
WV-OMS-24-BI-17-E UNT/Buffalo Creek RM 1.53 Iron 1.83 0.71 0.13 2.68
WV-OMS-25 Spring Creek Iron 3.11 1.70 0.25 5.07
WV-OMS-25-B UNT/Spring Creek RM 2.21 Iron 0.59 0.39 0.05 1.02
WV-OMS-28 Cedar Run Iron 6.31 3.32 0.51 10.13
WV-OMS-28-D Stedman Run Iron 0.74 0.49 0.06 1.30

Middle Ohio River North and South Watersheds: TMDL Report
79
NHD Code Stream Name Metal LA
(lbs/day) WLA
(lbs/day) MOS
(lbs/day) TMDL
(lbs/day)
WV-OMS-28-F UNT/Cedar Run RM 2.11 Iron 0.61 0.32 0.05 0.98
WV-OMS-30 Sandy Creek Iron 490.45 70.60 29.53 590.58
WV-OMS-30-K Crooked Fork Iron 19.05 4.84 1.26 25.15
WV-OMS-30-K-1 Cockle Run Iron 1.17 0.33 0.08 1.58
WV-OMS-30-M Cherrycamp Run Iron 2.47 0.67 0.17 3.30
WV-OMS-30-O Trace Fork Iron 14.30 4.28 0.98 19.56
WV-OMS-30-P Beatty Run Iron 5.51 1.72 0.38 7.61
WV-OMS-30-S Right Fork/Sandy Creek Iron 74.51 11.48 4.53 90.52
WV-OMS-30-S-11 Biglick Run Iron 5.44 0.35 0.30 6.10
WV-OMS-30-S-22 Fallentimber Run Iron 6.16 2.05 0.43 8.64
WV-OMS-30-S-23 Rush Run Iron 4.33 1.68 0.32 6.33
WV-OMS-30-S-24 Cabin Run Iron 3.10 NA 0.16 3.27
WV-OMS-30-S-26 Brushy Fork (OMS-30-S-26) Iron 3.47 NA 0.18 3.65
WV-OMS-30-R Left Fork/Sandy Creek Iron 183.76 37.81 11.66 233.23
WV-OMS-30-R-1 Copper Fork Iron 13.19 2.11 0.81 16.11
WV-OMS-30-R-6 Sarvis Fork Iron 5.24 1.65 0.36 7.25
WV-OMS-30-R-8 Turkey Fork Iron 22.24 6.69 1.52 30.45
WV-OMS-30-R-11 Drift Run Iron 3.62 1.12 0.25 5.00
WV-OMS-30-R-15 Nesselroad Run Iron 33.76 8.18 2.21 44.15
WV-OMS-30-R-15-F Redbush Run Iron 3.50 1.17 0.25 4.91
WV-OMS-30-R-15-L Maulecamp Run Iron 4.96 NA 0.26 5.22
WV-OMS-30-R-18 McGraw Run Iron 3.10 1.09 0.22 4.41
WV-OMS-30-R-29 Lockhart Fork Iron 8.31 2.86 0.59 11.76
WV-OMS-32 Little Sandy Creek Iron 35.46 19.25 2.88 57.59
WV-OMS-32-E Roadfork Run Iron 6.34 3.57 0.52 10.43
WV-OMS-32-I Claylick Run (OMS-32-I) Iron 4.99 3.04 0.42 8.45
WV-OMS-35 Washington Run Iron 8.51 2.48 0.58 11.57
WV-OMS-44 Pond Creek Iron 119.75 19.49 7.33 146.57
WV-OMS-44-E Long Run (OMS-44-E) Iron 2.38 0.73 0.16 3.28
WV-OMS-44-F Little Pond Creek Iron 26.01 5.36 1.65 33.02
WV-OMS-44-F-2 Jesse Run Iron 6.63 0.16 0.36 7.15
WV-OMS-44-F-2-A UNT/Jesse Run RM 0.44 Iron 0.94 NA 0.05 0.99
WV-OMS-44-F-2-B Left Fork/Jesse Run Iron 2.55 NA 0.13 2.68
WV-OMS-44-F-2-C Right Fork/Jesse Run Iron 1.92 NA 0.10 2.02
WV-OMS-44-F-5 Lamps Run Iron 3.33 1.01 0.23 4.57
WV-OMS-44-X Jerrys Run Iron 8.49 NA 0.45 8.93
WV-OMS-44-AI Joshus Fork Iron 2.56 0.91 0.18 3.65
WV-OMS-46-A South Fork/Lee Creek Iron 56.95 8.67 3.45 69.08
WV-OMS-46-A-1 Middle Fork/South Fork/Lee Creek Iron 11.19 1.74 0.68 13.60
WV-OMS-46-A-13 Willow Run Iron 7.12 NA 0.37 7.50

Middle Ohio River North and South Watersheds: TMDL Report
80
NHD Code Stream Name Metal LA
(lbs/day) WLA
(lbs/day) MOS
(lbs/day) TMDL
(lbs/day)
WV-OMS-46-B North Fork/Lee Creek Iron 87.18 15.35 5.40 107.92
WV-OMS-46-B-6 UNT/North Fork RM 2.61/Lee Creek Iron 1.84 0.46 0.12 2.42
WV-OMS-46-B-24 Woodyards Run Iron 7.40 1.77 0.48 9.65
WV-OMS-46-B-24-G UNT/Woodyards Run RM 2.03 Iron 3.52 0.90 0.23 4.65
WV-OMS-46-B-25 UNT/North Fork RM 10.17/Lee Creek Iron 0.37 0.09 0.02 0.49
WV-OMS-46-B-30 Long Run (OMS-46-B-30) Iron 2.13 0.54 0.14 2.81
WV-OMS-46-B-31 Gunners Run Iron 0.93 0.28 0.06 1.28
WV-OMS-57 Sandy Creek Iron 27.14 7.48 1.82 36.45
WV-OMS-57-D Vaughts Run Iron 3.97 2.20 0.32 6.50
WV-OMS-57-K UNT/Sandy Creek RM 3.91 Iron 1.76 0.42 0.11 2.29
WV-OMS-57-L UNT/Sandy Creek RM 4.06 Iron 3.05 0.79 0.20 4.04
WV-OMS-57-M UNT/Sandy Creek RM 4.41 Iron 1.09 0.28 0.07 1.44
WV-OMS-57-O UNT/Sandy Creek RM 4.97 Iron 2.67 0.39 0.16 3.21
WV-OMS-65 Pond Run Iron 8.72 15.90 1.30 25.91
WV-OMS-65-A Little Pond Run Iron 2.69 4.23 0.36 7.28
WV-OMS-66 Briscoe Run Iron 4.18 2.54 0.35 7.07
WV-OMS-69 Big Run Iron 55.96 29.23 4.48 89.67
WV-OMS-69-A UNT/Big Run RM 0.20 Iron 2.61 0.73 0.18 3.52
WV-OMS-69-B Williams Creek Iron 4.32 3.57 0.42 8.31
WV-OMS-69-F Plum Run Iron 4.31 4.97 0.49 9.77
WV-OMS-69-J Hogland Run Iron 3.99 4.03 0.42 8.44
Table 9-2. Iron TMDLs in the Middle Ohio River North Watershed
NHD Code Stream Name Metal LA
(lbs/day) WLA
(lbs/day) MOS
(lbs/day) TMDL
(lbs/day)
WV-OMN-4-K Atward Run Iron 0.91 0.62 0.08 1.61
WV-OMN-6 Cow Creek Iron 29.55 15.88 2.39 47.82
WV-OMN-6-C Sled Run Iron 2.38 1.73 0.22 4.33
WV-OMN-6-F Limestone Run Iron 1.81 1.24 0.16 3.20
WV-OMN-6-K Sharps Run Iron 2.36 1.61 0.21 4.18
WV-OMN-9 French Creek Iron 98.78 15.73 6.03 120.53
WV-OMN-9-D Henry Camp Run Iron 5.52 NA 0.29 5.81
WV-OMN-9-I Long Run (OMN-9-I) Iron 9.69 NA 0.51 10.20
WV-OMN-9-K Alum Cave Run Iron 2.09 NA 0.11 2.20
WV-OMN-9-N Schultz Run Iron 5.56 NA 0.29 5.85
WV-OMN-9-Q Left Fork/French Creek Iron 18.81 6.36 1.33 26.50
WV-OMN-9-R Right Fork/French Creek Iron 10.68 3.46 0.74 14.89
WV-OMN-13 Middle Island Creek Iron 2710.99 247.95 155.73 3114.67
WV-OMN-13-C Broad Run (OMN-13-C) Iron 3.20 0.91 0.22 4.32
WV-OMN-13-G Fishpot Run Iron 2.16 0.68 0.15 2.99

Middle Ohio River North and South Watersheds: TMDL Report
81
NHD Code Stream Name Metal LA
(lbs/day) WLA
(lbs/day) MOS
(lbs/day) TMDL
(lbs/day)
WV-OMN-13-H Willow Island Creek Iron 2.65 0.81 0.18 3.64
WV-OMN-13-L McKim Creek Iron 81.99 20.32 5.38 107.69
WV-OMN-13-L-7 Shawnee Run Iron 4.76 1.49 0.33 6.58
WV-OMN-13-L-11 Panther Run Iron 5.21 1.82 0.37 7.40
WV-OMN-13-L-15 Rock Run Iron 7.53 2.46 0.53 10.52
WV-OMN-13-L-31 Josephs Fork Iron 4.92 1.44 0.34 6.70
WV-OMN-13-N Wolf Run (OMN-13-N) Iron 1.57 0.51 0.11 2.19
WV-OMN-13-V Sugar Creek Iron 46.42 8.18 2.87 57.48
WV-OMN-13-V-20 Walnut Run Iron 2.59 0.55 0.17 3.31
WV-OMN-13-V-23 South Fork/Sugar Creek Iron 3.40 0.97 0.23 4.60
WV-OMN-13-AI Allen Run Iron 4.61 NA 0.24 4.85
WV-OMN-13-AN Sheets Run Iron 4.00 1.01 0.26 5.27
WV-OMN-13-AP Buffalo Run Iron 21.17 3.50 1.30 25.97
WV-OMN-13-AP-2 UNT/Buffalo Run RM 0.99 Iron 11.85 1.41 0.70 13.96
WV-OMN-13-AT Buffalo Run (OMN-13-AT) Iron 5.42 1.24 0.35 7.01
WV-OMN-13-BF Sancho Creek Iron 58.16 12.61 3.72 74.49
WV-OMN-13-BF-3 Little Sancho Creek Iron 13.82 3.15 0.89 17.87
WV-OMN-13-BK Point Pleasant Creek Iron 168.62 30.05 10.46 209.12
WV-OMN-13-BK-4 Pursley Creek Iron 23.42 4.93 1.49 29.84
WV-OMN-13-BK-4-J Badger Run Iron 3.59 0.82 0.23 4.64
WV-OMN-13-BK-5 Elk Fork Iron 62.48 14.84 4.07 81.39
WV-OMN-13-BK-5-F Big Run (OMN-13-BK-5-F) Iron 3.43 1.10 0.24 4.76
WV-OMN-13-BK-5-L Mudlick Run Iron 8.19 1.93 0.53 10.65
WV-OMN-13-BK-5-L-1 Middle Fork/Mudlick Run Iron 3.38 0.98 0.23 4.59
WV-OMN-13-BK-8 Tenmile Run Iron 16.91 1.97 0.99 19.87
WV-OMN-13-BK-8-B Wolfpen Run (OMN-13-BK-8-B) Iron 4.47 1.39 0.31 6.17
WV-OMN-13-BK-15 Willow Fork Iron 8.02 1.88 0.52 10.42
WV-OMN-13-BK-21 Peach Fork Iron 3.97 0.69 0.25 4.91
WV-OMN-13-BK-21-A UNT/Peach Fork RM 0.42 Iron 1.31 NA 0.07 1.38
WV-OMN-13-BM Gorrell Run Iron 14.98 NA 0.79 15.77
WV-OMN-13-CA Muddy Creek Iron 9.86 2.29 0.64 12.79
WV-OMN-13-CG Indian Creek Iron 119.10 8.72 6.73 134.55
WV-OMN-13-CG-2 Big Run Iron 13.15 2.31 0.81 16.27
WV-OMN-13-CG-10 Walnut Fork Iron 12.53 0.01 0.66 13.20
WV-OMN-13-CG-20 Stackpole Run Iron 11.00 NA 0.58 11.57
WV-OMN-13-CH McElroy Creek Iron 402.32 50.50 23.83 476.65
WV-OMN-13-CH-10 Pratt Run Iron 3.96 1.06 0.26 5.28
WV-OMN-13-CH-13 Sandy Run Iron 8.46 2.15 0.56 11.17
WV-OMN-13-CH-16 Flint Run Iron 79.87 12.92 4.88 97.67
WV-OMN-13-CH-16-B Little Flint Run Iron 12.15 3.19 0.81 16.15
WV-OMN-13-CH-16-B- UNT/Little Flint Run RM Iron 3.97 1.09 0.27 5.33

Middle Ohio River North and South Watersheds: TMDL Report
82
NHD Code Stream Name Metal LA
(lbs/day) WLA
(lbs/day) MOS
(lbs/day) TMDL
(lbs/day) 4 1.96
WV-OMN-13-CH-16-K Israel Fork Iron 11.22 NA 0.59 11.81
WV-OMN-13-CH-16-M Neds Run Iron 3.60 NA 0.19 3.79
WV-OMN-13-CH-16-V East Run Iron 3.53 0.93 0.23 4.69
WV-OMN-13-CH-19 Elklick Run Iron 7.13 1.87 0.47 9.48
WV-OMN-13-CH-22 Riggins Run Iron 8.97 2.57 0.61 12.16
WV-OMN-13-CH-33 Talkington Fork Iron 12.28 2.89 0.80 15.96
WV-OMN-13-CH-35 Pike Fork Iron 22.21 4.13 1.39 27.73
WV-OMN-13-CH-35-B Sycamore Fork Iron 11.73 1.45 0.69 13.87
WV-OMN-13-CH-34 Robinson Fork Iron 84.80 7.78 4.87 97.45
WV-OMN-13-CH-34-A Little Battle Run (OMN-13-CH-34-A) Iron 4.14 NA 0.22 4.35
WV-OMN-13-CH-34-B Big Battle Run Iron 19.41 1.12 1.08 21.61 WV-OMN-13-CH-34-B-4
Little Battle Run (OMN-13-CH-34-B-4) Iron 3.73 NA 0.20 3.92
WV-OMN-13-CH-34-L Skelton Run Iron 10.38 NA 0.55 10.93
WV-OMN-13-CI Wheeler Run Iron 6.09 1.30 0.39 7.78
WV-OMN-13-CM Jefferson Run Iron 7.14 1.44 0.45 9.04
WV-OMN-13-CO Purgatory Run Iron 3.54 0.99 0.24 4.78
WV-OMN-13-CZ Camp Mistake Run Iron 16.84 0.47 0.91 18.22
WV-OMN-13-CZ-3 UNT/Camp Mistake Run RM 0.96 Iron 4.78 NA 0.25 5.03
WV-OMN-13-DA Arnold Creek Iron 126.03 12.40 7.29 145.72
WV-OMN-13-DA-1 Short Run Iron 6.37 1.64 0.42 8.43
WV-OMN-13-DA-4 Long Run Iron 20.40 1.56 1.16 23.11
WV-OMN-13-DA-12 Wilhelm Run Iron 10.33 NA 0.54 10.87
WV-OMN-13-DA-16 Claylick Run Iron 8.83 NA 0.46 9.29
WV-OMN-13-DA-18 Middle Run Iron 5.41 NA 0.28 5.70
WV-OMN-13-DA-19 Left Fork/Arnold Creek Iron 16.94 2.15 1.00 20.09
WV-OMN-13-DA-20 Right Fork/Arnold Creek Iron 14.50 1.70 0.85 17.05
WV-OMN-13-DD Nutter Fork Iron 13.84 3.48 0.91 18.24
WV-OMN-13-DD-3 Wolfpen Run (OMN-13-DD-3) Iron 2.57 0.71 0.17 3.46
WV-OMN-13-DG UNT/Middle Island Creek RM 67.32 Iron 1.36 NA 0.07 1.43
WV-OMN-13-DO Bluestone Creek Iron 17.37 2.20 1.03 20.59
WV-OMN-13-DS Jockeycamp Run Iron 2.60 0.60 0.17 3.37
WV-OMN-13-DW Buckeye Creek Iron 72.21 15.27 4.60 92.08
WV-OMN-13-DW-4 Morgans Run (OMN-13-DW-4) Iron 6.52 1.56 0.43 8.51
WV-OMN-13-DW-9 Buckeye Run Iron 13.64 3.47 0.90 18.01
WV-OMN-13-DW-9-H UNT/Buckeye Run RM 3.35 Iron 4.85 1.16 0.32 6.32
WV-OMN-13-DW-17 Buffalo Calf Fork Iron 6.76 1.84 0.45 9.05
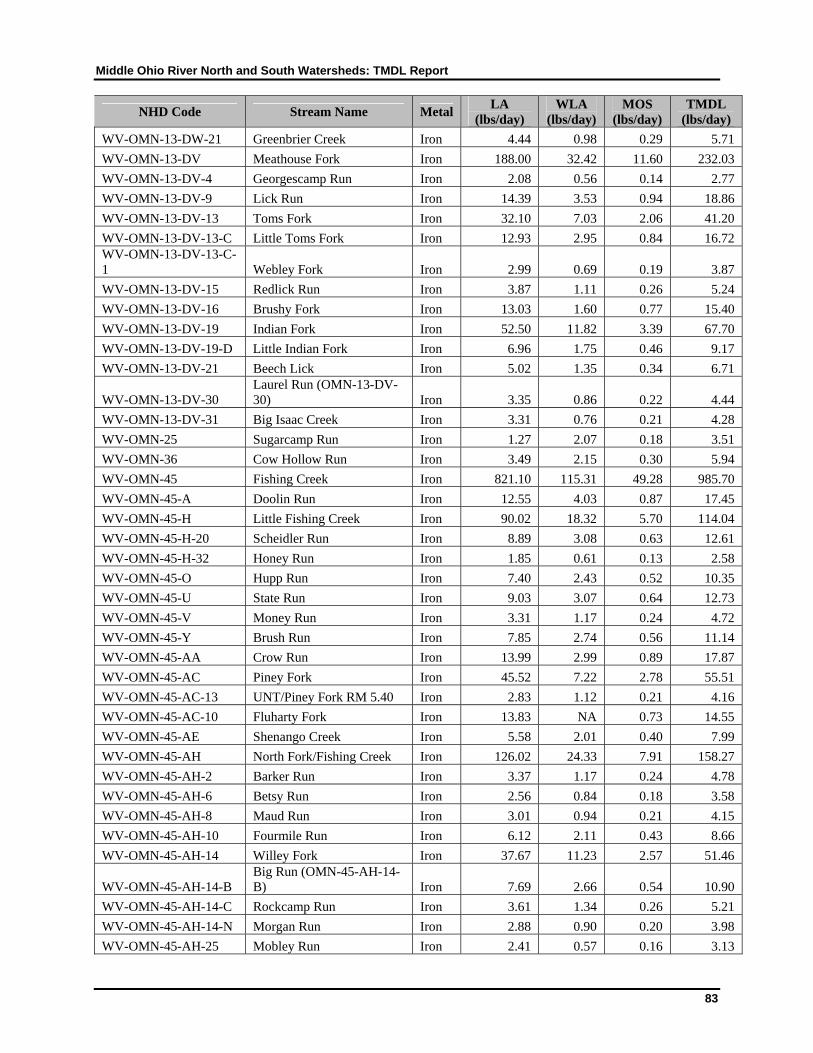
Middle Ohio River North and South Watersheds: TMDL Report
83
NHD Code Stream Name Metal LA
(lbs/day) WLA
(lbs/day) MOS
(lbs/day) TMDL
(lbs/day)
WV-OMN-13-DW-21 Greenbrier Creek Iron 4.44 0.98 0.29 5.71
WV-OMN-13-DV Meathouse Fork Iron 188.00 32.42 11.60 232.03
WV-OMN-13-DV-4 Georgescamp Run Iron 2.08 0.56 0.14 2.77
WV-OMN-13-DV-9 Lick Run Iron 14.39 3.53 0.94 18.86
WV-OMN-13-DV-13 Toms Fork Iron 32.10 7.03 2.06 41.20
WV-OMN-13-DV-13-C Little Toms Fork Iron 12.93 2.95 0.84 16.72 WV-OMN-13-DV-13-C-1 Webley Fork Iron 2.99 0.69 0.19 3.87
WV-OMN-13-DV-15 Redlick Run Iron 3.87 1.11 0.26 5.24
WV-OMN-13-DV-16 Brushy Fork Iron 13.03 1.60 0.77 15.40
WV-OMN-13-DV-19 Indian Fork Iron 52.50 11.82 3.39 67.70
WV-OMN-13-DV-19-D Little Indian Fork Iron 6.96 1.75 0.46 9.17
WV-OMN-13-DV-21 Beech Lick Iron 5.02 1.35 0.34 6.71
WV-OMN-13-DV-30 Laurel Run (OMN-13-DV-30) Iron 3.35 0.86 0.22 4.44
WV-OMN-13-DV-31 Big Isaac Creek Iron 3.31 0.76 0.21 4.28
WV-OMN-25 Sugarcamp Run Iron 1.27 2.07 0.18 3.51
WV-OMN-36 Cow Hollow Run Iron 3.49 2.15 0.30 5.94
WV-OMN-45 Fishing Creek Iron 821.10 115.31 49.28 985.70
WV-OMN-45-A Doolin Run Iron 12.55 4.03 0.87 17.45
WV-OMN-45-H Little Fishing Creek Iron 90.02 18.32 5.70 114.04
WV-OMN-45-H-20 Scheidler Run Iron 8.89 3.08 0.63 12.61
WV-OMN-45-H-32 Honey Run Iron 1.85 0.61 0.13 2.58
WV-OMN-45-O Hupp Run Iron 7.40 2.43 0.52 10.35
WV-OMN-45-U State Run Iron 9.03 3.07 0.64 12.73
WV-OMN-45-V Money Run Iron 3.31 1.17 0.24 4.72
WV-OMN-45-Y Brush Run Iron 7.85 2.74 0.56 11.14
WV-OMN-45-AA Crow Run Iron 13.99 2.99 0.89 17.87
WV-OMN-45-AC Piney Fork Iron 45.52 7.22 2.78 55.51
WV-OMN-45-AC-13 UNT/Piney Fork RM 5.40 Iron 2.83 1.12 0.21 4.16
WV-OMN-45-AC-10 Fluharty Fork Iron 13.83 NA 0.73 14.55
WV-OMN-45-AE Shenango Creek Iron 5.58 2.01 0.40 7.99
WV-OMN-45-AH North Fork/Fishing Creek Iron 126.02 24.33 7.91 158.27
WV-OMN-45-AH-2 Barker Run Iron 3.37 1.17 0.24 4.78
WV-OMN-45-AH-6 Betsy Run Iron 2.56 0.84 0.18 3.58
WV-OMN-45-AH-8 Maud Run Iron 3.01 0.94 0.21 4.15
WV-OMN-45-AH-10 Fourmile Run Iron 6.12 2.11 0.43 8.66
WV-OMN-45-AH-14 Willey Fork Iron 37.67 11.23 2.57 51.46
WV-OMN-45-AH-14-B Big Run (OMN-45-AH-14-B) Iron 7.69 2.66 0.54 10.90
WV-OMN-45-AH-14-C Rockcamp Run Iron 3.61 1.34 0.26 5.21
WV-OMN-45-AH-14-N Morgan Run Iron 2.88 0.90 0.20 3.98
WV-OMN-45-AH-25 Mobley Run Iron 2.41 0.57 0.16 3.13

Middle Ohio River North and South Watersheds: TMDL Report
84
NHD Code Stream Name Metal LA
(lbs/day) WLA
(lbs/day) MOS
(lbs/day) TMDL
(lbs/day)
WV-OMN-45-AH-29 Wiley Fork (OMN-45-AH-29) Iron 8.16 NA 0.43 8.59
WV-OMN-45-AG South Fork/Fishing Creek Iron 178.72 36.93 11.35 227.00
WV-OMN-45-AG-5 Upper Run Iron 9.57 NA 0.50 10.08
WV-OMN-45-AG-7 Buffalo Run Iron 13.09 3.95 0.90 17.94
WV-OMN-45-AG-8 Richwood Run Iron 11.83 3.77 0.82 16.43
WV-OMN-45-AG-15 Arches Fork Iron 14.46 4.54 1.00 19.99
WV-OMN-45-AG-15-I Slabcamp Run Iron 2.60 0.97 0.19 3.76
WV-OMN-45-AG-16 Fallen Timber Run Iron 7.60 2.73 0.54 10.87
WV-OMN-45-AG-19 Price Run Iron 24.67 7.98 1.72 34.37
WV-OMN-45-AG-19-F Buck Run Iron 3.45 1.36 0.25 5.07
WV-OMN-45-AG-19-G Pickenpaw Run Iron 4.55 1.49 0.32 6.36
WV-OMN-45-AG-19-J Glade Fork Iron 1.81 0.58 0.13 2.52
WV-OMN-45-AG-19-I Tenmile Run Iron 5.18 2.20 0.39 7.76
WV-OMN-45-AG-22 Morgan Run Iron 3.29 0.99 0.23 4.51
WV-OMN-45-AG-27 Trader Fork Iron 5.43 1.70 0.38 7.50
WV-OMN-47 Williams Run Iron 3.37 2.59 0.31 6.28
WV-OMN-49 Proctor Creek Iron 44.01 24.76 3.62 72.38
WV-OMN-49-L UNT/Proctor Creek RM 5.96 Iron 4.76 2.99 0.41 8.16
WV-OMN-49-O Mud Run (OMN-49-O) Iron 2.11 1.42 0.19 3.71
NA = not applicable; UNT = unnamed tributary; RM=river mile.
Table 9-3. Fecal coliform bacteria TMDLs in Middle Ohio River South Watershed
NHD Code Stream Name LA
(counts/day) WLA
(counts/day) MOS
(counts/day) TMDL
(counts/day)
WV-OMS-1 Crooked Creek 4.48E+10 1.42E+08 2.36E+09 4.73E+10
WV-OMS-2 Oldtown Creek 1.73E+11 1.78E+08 9.09E+09 1.82E+11
WV-OMS-2-D Turkey Run 8.29E+09 9.85E+07 4.42E+08 8.83E+09
WV-OMS-2-F Potter Creek 1.13E+10 NA 5.94E+08 1.19E+10
WV-OMS-2-G Robinson Run 2.40E+10 NA 1.26E+09 2.53E+10
WV-OMS-2-G-1 UNT/Robinson Run RM 2.42 2.62E+09 NA 1.38E+08 2.75E+09
WV-OMS-2-G-3 UNT/Robinson Run RM 3.33 2.18E+09 NA 1.15E+08 2.29E+09
WV-OMS-2-M Trace Fork (OMS-2-M) 1.98E+10 NA 1.04E+09 2.09E+10
WV-OMS-4 Mill Run 1.69E+10 NA 8.89E+08 1.78E+10
WV-OMS-6 Tenmile Creek 4.16E+10 NA 2.19E+09 4.38E+10
WV-OMS-6-C UNT/Tenmile Creek RM 4.13 1.47E+09 NA 7.76E+07 1.55E+09
WV-OMS-6-D UNT/Tenmile Creek RM 5.33 4.18E+09 NA 2.20E+08 4.40E+09
WV-OMS-11 Sliding Hill Creek 3.91E+10 NA 2.06E+09 4.11E+10

Middle Ohio River North and South Watersheds: TMDL Report
85
NHD Code Stream Name LA
(counts/day) WLA
(counts/day) MOS
(counts/day) TMDL
(counts/day)
WV-OMS-11-A UNT/Sliding Hill Creek RM 1.25 2.01E+10 NA 1.06E+09 2.11E+10
WV-OMS-12 Broad Run (OMS-12) 3.26E+10 7.58E+06 1.72E+09 3.44E+10
WV-OMS-13 Little Broad Run 1.18E+10 NA 6.19E+08 1.24E+10
WV-OMS-14 West Creek 3.00E+10 NA 1.58E+09 3.16E+10
WV-OMS-23 Little Mill Creek (OMS-23) 5.09E+10 NA 2.68E+09 5.36E+10
WV-OMS-24 Mill Creek 9.69E+11 7.05E+09 5.14E+10 1.03E+12
WV-OMS-24-P Bar Run 1.09E+10 NA 5.72E+08 1.14E+10
WV-OMS-24-U Cow Run 5.85E+10 9.09E+06 3.08E+09 6.16E+10
WV-OMS-24-U-7 Right Fork/Cow Run 2.56E+10 4.54E+06 1.35E+09 2.70E+10
WV-OMS-24-U-8 Left Fork/Cow Run 2.52E+10 NA 1.32E+09 2.65E+10
WV-OMS-24-AF Parchment Creek 1.55E+11 1.55E+08 8.16E+09 1.63E+11
WV-OMS-24-AF-11 Grass Run (OMS-24-AF-11) 1.33E+10 NA 6.99E+08 1.40E+10
WV-OMS-24-AF-17 Cox Fork 2.12E+10 8.33E+06 1.12E+09 2.24E+10
WV-OMS-24-AF-27 Wolfe Creek 1.73E+10 NA 9.11E+08 1.82E+10
WV-OMS-24-AN Sycamore Creek 6.41E+10 3.03E+07 3.38E+09 6.75E+10
WV-OMS-24-AN-1 Left Fork/Sycamore Creek 2.97E+10 1.14E+07 1.56E+09 3.13E+10
WV-OMS-24-BA Tug Fork 2.27E+11 9.52E+08 1.20E+10 2.40E+11
WV-OMS-24-BA-13 Bear Fork (OMS-24-BA-13) 4.12E+09 NA 2.17E+08 4.34E+09
WV-OMS-24-BA-20 Grasslick Creek 1.05E+11 9.52E+08 5.56E+09 1.11E+11 WV-OMS-24-BA-20-D Stonelick Creek 2.27E+10 NA 1.20E+09 2.39E+10
WV-OMS-24-BA-21 Bear Fork (OMS-24-BA-21) 6.66E+10 NA 3.51E+09 7.01E+10
WV-OMS-24-BA-21-B
Laurel Run (OMS-24-BA-21-B) 1.53E+10 NA 8.04E+08 1.61E+10
WV-OMS-24-BH Elk Fork (OMS-24-BH) 1.07E+11 NA 5.63E+09 1.13E+11
WV-OMS-24-BI Little Mill Creek (OMS-24-BI) 1.75E+11 6.20E+07 9.21E+09 1.84E+11
WV-OMS-24-BI-3 Joes Run 2.22E+10 3.79E+06 1.17E+09 2.34E+10
WV-OMS-24-BI-9 Frozencamp Creek 4.71E+10 1.14E+07 2.48E+09 4.96E+10
WV-OMS-24-BI-10 Big Run (OMS-24-BI-10) 2.66E+10 NA 1.40E+09 2.80E+10
WV-OMS-24-BI-10-D Left Fork/Big Run 1.33E+10 NA 7.01E+08 1.40E+10
WV-OMS-24-BI-10-C Right Fork/Big Run 6.78E+09 NA 3.57E+08 7.13E+09
WV-OMS-24-BI-12 Little Creek 2.33E+10 NA 1.23E+09 2.45E+10
WV-OMS-24-BI-12-H Poplar Fork 3.64E+09 NA 1.91E+08 3.83E+09
WV-OMS-24-BI-17 Buffalo Creek 1.64E+10 NA 8.64E+08 1.73E+10
WV-OMS-25 Spring Creek 5.86E+09 4.54E+06 3.09E+08 6.18E+09

Middle Ohio River North and South Watersheds: TMDL Report
86
NHD Code Stream Name LA
(counts/day) WLA
(counts/day) MOS
(counts/day) TMDL
(counts/day)
WV-OMS-28 Cedar Run 1.29E+10 1.82E+07 6.79E+08 1.36E+10
WV-OMS-30 Sandy Creek (OMS-30) 5.10E+11 6.61E+09 2.72E+10 5.44E+11
WV-OMS-30-G Straight Fork 3.05E+10 1.36E+08 1.61E+09 3.23E+10
WV-OMS-30-K Crooked Fork 3.56E+10 3.79E+06 1.87E+09 3.75E+10
WV-OMS-30-O Trace Fork (OMS-30-O) 3.12E+10 1.17E+08 1.65E+09 3.29E+10
WV-OMS-30-P Beatty Run 1.00E+10 NA 5.27E+08 1.05E+10
WV-OMS-30-S Right Fork/Sandy Creek 1.02E+11 7.58E+06 5.36E+09 1.07E+11
WV-OMS-30-S-11 Biglick Run 9.14E+09 NA 4.81E+08 9.62E+09
WV-OMS-30-S-22 Fallentimber Run (OMS-30-S-22) 1.08E+10 NA 5.66E+08 1.13E+10
WV-OMS-30-S-24 Cabin Run 3.93E+09 3.79E+06 2.07E+08 4.14E+09
WV-OMS-30-R Left Fork/Sandy Creek 2.33E+11 6.40E+07 1.22E+10 2.45E+11
WV-OMS-30-R-1 Copper Fork 1.73E+10 NA 9.11E+08 1.82E+10
WV-OMS-30-R-8 Turkey Fork 3.56E+10 7.58E+06 1.88E+09 3.75E+10
WV-OMS-30-R-15 Nesselroad Run 5.67E+10 NA 2.98E+09 5.97E+10
WV-OMS-30-R-15-F Redbush Run 9.12E+09 NA 4.80E+08 9.60E+09
WV-OMS-30-R-15-L Maulecamp Run 6.11E+09 NA 3.21E+08 6.43E+09
WV-OMS-30-R-29 Lockhart Fork 1.52E+10 3.79E+06 8.00E+08 1.60E+10
WV-OMS-32 Little Sandy Creek 8.16E+10 1.21E+07 4.30E+09 8.59E+10
WV-OMS-32-E Roadfork Run 1.55E+10 NA 8.14E+08 1.63E+10
WV-OMS-35 Washington Run 1.36E+10 8.33E+06 7.15E+08 1.43E+10
WV-OMS-44 Pond Creek 1.81E+11 1.52E+07 9.51E+09 1.90E+11
WV-OMS-44-F Little Pond Creek 4.99E+10 NA 2.63E+09 5.25E+10
WV-OMS-44-F-2 Jesse Run 8.35E+09 NA 4.40E+08 8.79E+09
WV-OMS-44-F-2-A UNT/Jesse Run RM 0.44 1.71E+09 NA 8.97E+07 1.79E+09
WV-OMS-44-X Jerrys Run 1.11E+10 NA 5.84E+08 1.17E+10
WV-OMS-44-AI Joshus Fork 4.82E+09 3.79E+06 2.54E+08 5.07E+09
WV-OMS-46-A South Fork/Lee Creek 6.81E+10 3.79E+06 3.58E+09 7.17E+10
WV-OMS-46-A-1 Middle Fork/South Fork/Lee Creek 1.35E+10 NA 7.12E+08 1.42E+10
WV-OMS-46-A-13 Willow Run 8.61E+09 NA 4.53E+08 9.06E+09
WV-OMS-46-B North Fork/Lee Creek 1.32E+11 1.14E+07 6.95E+09 1.39E+11
WV-OMS-46-B-24 Woodyards Run 1.54E+10 7.58E+06 8.10E+08 1.62E+10
WV-OMS-46-B-31 Gunners Run 2.52E+09 NA 1.33E+08 2.65E+09
WV-OMS-57 Sandy Creek (OMS-57) 4.11E+10 1.86E+08 2.17E+09 4.35E+10
WV-OMS-57-D Vaughts Run 8.74E+09 1.68E+08 4.69E+08 9.37E+09
WV-OMS-57-O UNT/Sandy Creek RM 4.97 4.58E+09 NA 2.41E+08 4.83E+09

Middle Ohio River North and South Watersheds: TMDL Report
87
NHD Code Stream Name LA
(counts/day) WLA
(counts/day) MOS
(counts/day) TMDL
(counts/day)
WV-OMS-65 Pond Run 1.48E+10 2.03E+10 1.85E+09 3.70E+10
WV-OMS-65-A Little Pond Run 3.04E+09 9.45E+09 6.58E+08 1.32E+10
WV-OMS-66 Briscoe Run 1.00E+10 2.17E+09 6.41E+08 1.28E+10
WV-OMS-69 Big Run (OMS-69) 8.70E+10 5.45E+09 4.87E+09 9.73E+10
WV-OMS-69-B Williams Creek 8.20E+09 5.13E+09 7.02E+08 1.40E+10
WV-OMS-69-F Plum Run 1.20E+10 NA 6.31E+08 1.26E+10
WV-OMS-69-J Hogland Run 1.39E+10 NA 7.31E+08 1.46E+10 NA = not applicable; UNT = unnamed tributary; RM=river mile. “Scientific notation” is a method of writing or displaying numbers in terms of a decimal number between 1 and 10 multiplied by a power of 10. The scientific notation of 10,492, for example, is 1.0492 × 10⁴.
Table 9-4. Fecal coliform bacteria TMDLs in Middle Ohio River North Watershed
NHD Code Stream Name LA
(counts/day) WLA
(counts/day) MOS
(counts/day) TMDL
(counts/day)
WV-OMN-4-K Atward Run 2.57E+09 NA 1.35E+08 2.71E+09
WV-OMN-6 Cow Creek 5.25E+10 3.71E+08 2.78E+09 5.57E+10
WV-OMN-9 French Creek 1.07E+11 6.82E+07 5.65E+09 1.13E+11
WV-OMN-9-Q Left Fork/French Creek 3.49E+10 6.82E+07 1.84E+09 3.68E+10
WV-OMN-9-R Right Fork/French Creek 2.06E+10 NA 1.09E+09 2.17E+10
WV-OMN-13 Middle Island Creek 2.17E+12 3.89E+09 1.14E+11 2.29E+12
WV-OMN-13-L McKim Creek 1.45E+11 NA 7.64E+09 1.53E+11
WV-OMN-13-R Bogart Run 3.02E+09 NA 1.59E+08 3.18E+09
WV-OMN-13-V Sugar Creek 8.60E+10 NA 4.53E+09 9.06E+10
WV-OMN-13-AI Allen Run (OMN-13-AI) 4.77E+09 NA 2.51E+08 5.02E+09
WV-OMN-13-AP Buffalo Run (OMN-13-AP) 3.60E+10 NA 1.89E+09 3.79E+10
WV-OMN-13-AP-2 UNT/Buffalo Run RM 0.99 1.80E+10 NA 9.45E+08 1.89E+10
WV-OMN-13-AP-2-E UNT/UNT RM 1.63/Buffalo Run RM 0.99 3.59E+09 NA 1.89E+08 3.78E+09
WV-OMN-13-AX Shrivers Run 3.78E+09 NA 1.99E+08 3.98E+09
WV-OMN-13-BA Allen Run (OMN-13-BA) 2.87E+09 NA 1.51E+08 3.02E+09
WV-OMN-13-BF Sancho Creek 8.43E+10 NA 4.44E+09 8.88E+10
WV-OMN-13-BF-3 Little Sancho Creek 2.16E+10 NA 1.14E+09 2.28E+10
WV-OMN-13-BK Point Pleasant Creek 2.31E+11 1.59E+07 1.22E+10 2.43E+11
WV-OMN-13-BK-4 Pursley Creek 4.39E+10 4.54E+06 2.31E+09 4.62E+10
WV-OMN-13-BK-5 Elk Fork (OMN-13-BK-5) 8.27E+10 NA 4.35E+09 8.70E+10
WV-OMN-13-BK-5-L Mudlick Run 1.36E+10 NA 7.17E+08 1.43E+10
WV-OMN-13-BK-6 Coallick Run 3.16E+09 NA 1.66E+08 3.32E+09
WV-OMN-13-BK-15 Willow Fork 1.82E+10 3.79E+06 9.57E+08 1.91E+10

Middle Ohio River North and South Watersheds: TMDL Report
88
NHD Code Stream Name LA
(counts/day) WLA
(counts/day) MOS
(counts/day) TMDL
(counts/day)
WV-OMN-13-BK-15-B
Buck Run (OMN-13-BK-15-B) 9.56E+09 NA 5.03E+08 1.01E+10
WV-OMN-13-BK-21 Peach Fork 5.92E+09 NA 3.11E+08 6.23E+09 WV-OMN-13-BK-21-A UNT/Peach Fork RM 0.42 1.35E+09 NA 7.10E+07 1.42E+09
WV-OMN-13-BM Gorrell Run 1.63E+10 NA 8.59E+08 1.72E+10
WV-OMN-13-CG Indian Creek 1.26E+11 NA 6.64E+09 1.33E+11
WV-OMN-13-CG-2 Big Run (OMN-13-CG-2) 2.26E+10 NA 1.19E+09 2.38E+10
WV-OMN-13-CG-10 Walnut Fork 1.71E+10 NA 9.00E+08 1.80E+10
WV-OMN-13-CH McElroy Creek 4.16E+11 8.56E+07 2.19E+10 4.38E+11
WV-OMN-13-CH-16 Flint Run 9.90E+10 6.44E+07 5.21E+09 1.04E+11 WV-OMN-13-CH-16-B Little Flint Run 2.21E+10 NA 1.16E+09 2.33E+10
WV-OMN-13-CH-33 Talkington Fork 3.61E+10 NA 1.90E+09 3.80E+10
WV-OMN-13-CH-35 Pike Fork 3.38E+10 NA 1.78E+09 3.56E+10 WV-OMN-13-CH-35-B Sycamore Fork 1.56E+10 NA 8.23E+08 1.65E+10
WV-OMN-13-CH-34 Robinson Fork 8.67E+10 1.67E+07 4.56E+09 9.13E+10 WV-OMN-13-CH-34-B Big Battle Run 2.49E+10 NA 1.31E+09 2.62E+10
WV-OMN-13-CZ Camp Mistake Run 2.05E+10 NA 1.08E+09 2.16E+10
WV-OMN-13-DA Arnold Creek 1.33E+11 7.58E+06 7.01E+09 1.40E+11
WV-OMN-13-DA-4 Long Run (OMN-13-DA-4) 2.44E+10 NA 1.28E+09 2.56E+10
WV-OMN-13-DA-12 Wilhelm Run 1.24E+10 NA 6.53E+08 1.31E+10
WV-OMN-13-DA-16 Claylick Run (OMN-13-DA-16) 1.06E+10 7.58E+06 5.57E+08 1.11E+10
WV-OMN-13-DA-19 Left Fork/Arnold Creek 2.08E+10 NA 1.10E+09 2.19E+10
WV-OMN-13-DA-20 Right Fork/Arnold Creek 1.77E+10 NA 9.31E+08 1.86E+10
WV-OMN-13-DG UNT/Middle Island Creek RM 67.32 1.96E+09 NA 1.03E+08 2.06E+09
WV-OMN-13-DO Bluestone Creek 3.07E+10 NA 1.62E+09 3.23E+10
WV-OMN-13-DW Buckeye Creek 1.50E+11 1.04E+08 7.90E+09 1.58E+11
WV-OMN-13-DW-9 Buckeye Run 2.31E+10 2.27E+07 1.22E+09 2.44E+10 WV-OMN-13-DW-9-H
UNT/Buckeye Run RM 3.35 5.37E+08 NA 2.83E+07 5.65E+08
WV-OMN-13-DW-17 Buffalo Calf Fork 1.23E+10 NA 6.49E+08 1.30E+10
WV-OMN-13-DV Meathouse Fork (OMN-13-DV) 2.53E+11 4.24E+07 1.33E+10 2.66E+11
WV-OMN-13-DV-9 Lick Run (OMN-13-DV-9) 2.37E+10 NA 1.25E+09 2.50E+10
WV-OMN-13-DV-13 Toms Fork 6.09E+10 4.54E+06 3.21E+09 6.41E+10
WV-OMN-13-DV-16 Brushy Fork (OMN-13-DV-16) 1.75E+10 NA 9.22E+08 1.84E+10

Middle Ohio River North and South Watersheds: TMDL Report
89
NHD Code Stream Name LA
(counts/day) WLA
(counts/day) MOS
(counts/day) TMDL
(counts/day)
WV-OMN-13-DV-17 Snake Run 7.27E+09 NA 3.83E+08 7.65E+09
WV-OMN-13-DV-19 Indian Fork (OMN-13-DV-19) 2.99E+10 NA 1.58E+09 3.15E+10
WV-OMN-13-DV-31 Big Isaac Creek 6.43E+09 NA 3.38E+08 6.76E+09
WV-OMN-25 Sugarcamp Run 3.37E+09 NA 1.77E+08 3.55E+09
WV-OMN-36 Cow Hollow Run 9.05E+09 NA 4.76E+08 9.52E+09
WV-OMN-45 Fishing Creek 8.49E+11 9.47E+08 4.48E+10 8.95E+11
WV-OMN-45-A Doolin Run 2.72E+10 7.58E+06 1.43E+09 2.87E+10
WV-OMN-45-H Little Fishing Creek 1.58E+11 3.79E+06 8.31E+09 1.66E+11
WV-OMN-45-H-20 Scheidler Run 1.67E+10 NA 8.78E+08 1.76E+10
WV-OMN-45-H-24 Rush Run (OMN-45-H-24) 1.67E+10 NA 8.81E+08 1.76E+10
WV-OMN-45-U State Run 1.64E+10 NA 8.62E+08 1.72E+10
WV-OMN-45-Y Brush Run (OMN-45-Y) 1.48E+10 NA 7.77E+08 1.55E+10
WV-OMN-45-AA Crow Run 1.97E+10 NA 1.04E+09 2.07E+10
WV-OMN-45-AH North Fork/Fishing Creek 1.68E+11 NA 8.83E+09 1.77E+11
WV-OMN-45-AH-8 Maud Run 5.01E+09 NA 2.64E+08 5.27E+09
WV-OMN-45-AH-14 Willey Fork (OMN-45-AH-14) 6.07E+10 NA 3.20E+09 6.39E+10
WV-OMN-45-AH-14-N
Morgan Run (OMN-45-AH-14-N) 4.81E+09 NA 2.53E+08 5.06E+09
WV-OMN-45-AG South Fork/Fishing Creek 2.82E+11 7.88E+07 1.48E+10 2.97E+11
WV-OMN-45-AG-5 Upper Run 1.30E+10 NA 6.85E+08 1.37E+10
WV-OMN-45-AG-7 Buffalo Run (OMN-45-AG-7) 3.69E+10 NA 1.94E+09 3.88E+10
WV-OMN-45-AG-8 Richwood Run 2.78E+10 NA 1.46E+09 2.93E+10
WV-OMN-45-AG-15 Arches Fork 3.85E+10 NA 2.03E+09 4.06E+10 WV-OMN-45-AG-15-I Slabcamp Run 5.33E+09 NA 2.81E+08 5.61E+09
WV-OMN-45-AG-16 Fallen Timber Run (OMN-24-AG-16) 1.49E+10 NA 7.86E+08 1.57E+10
WV-OMN-45-AG-19 Price Run 4.97E+10 4.09E+07 2.62E+09 5.24E+10 WV-OMN-45-AG-19-F
Buck Run (OMN-45-AG-19-F) 5.10E+09 NA 2.68E+08 5.36E+09
WV-OMN-45-AG-23 Stout Run 4.12E+09 NA 2.17E+08 4.34E+09
WV-OMN-45-AG-27 Trader Fork 9.34E+09 NA 4.92E+08 9.83E+09
WV-OMN-47 Williams Run 6.88E+09 NA 3.62E+08 7.25E+09
WV-OMN-49 Proctor Creek 9.55E+10 9.47E+06 5.03E+09 1.01E+11

Middle Ohio River North and South Watersheds: TMDL Report
90
Table 9-5. Biological TMDLs in Middle Ohio River South Watershed
Stream Name (NHD_Code)
Biological Stressor Parameter LA WLA MOS TMDL Units
Sliding Hill Creek (WV-OMS-11)
Organic Enrichment Fecal Coliform 1.43E+13 NA 7.51E+11 1.50E+13 (counts/yr)
Sedimentation Iron 24.99 5.78 1.62 32.39 (lbs/day) UNT/Sliding Hill Creek
RM 1.25 (WV-OMS-11-A)
Organic Enrichment Fecal Coliform 7.32E+12 NA 3.86E+11 7.71E+12 (counts/yr)
Sedimentation Iron 15.75 3.77 1.03 20.54 (lbs/day)
Little Broad Run (WV-OMS-13)
Organic Enrichment Fecal Coliform 4.29E+12 NA 2.26E+11 4.52E+12 (counts/yr)
Sedimentation Iron 2.80 5.27 0.42 8.49 (lbs/day)
Oldtown Creek (WV-OMS-2)
Organic Enrichment Fecal Coliform 6.30E+13 6.50E+10 3.32E+12 6.64E+13 (counts/yr)
Sedimentation Iron 165.29 11.77 9.32 186.37 (lbs/day)
Little Mill Creek (WV-OMS-23)
Organic Enrichment Fecal Coliform 1.86E+13 NA 9.79E+11 1.96E+13 (counts/yr)
Sedimentation Iron 40.55 4.37 2.36 47.29 (lbs/day)
Mill Creek (WV-OMS-24)
Organic Enrichment Fecal Coliform 3.54E+14 2.57E+12 1.88E+13 3.75E+14 (counts/yr)
Sedimentation Iron 949.41 130.22 56.82 1136.45 (lbs/day)
Parchment Creek (WV-OMS-24-AF)
Organic Enrichment Fecal Coliform 5.66E+13 5.67E+10 2.98E+12 5.96E+13 (counts/yr)
Sedimentation Iron 119.32 19.58 7.31 146.22 (lbs/day)
Cox Fork (WV-OMS-24-AF-17)
Organic Enrichment Fecal Coliform 7.75E+12 3.04E+09 4.08E+11 8.16E+12 (counts/yr)
Sedimentation Iron 10.54 2.95 0.71 14.20 (lbs/day)
Wolfe Creek (WV-OMS-24-AF-27)
Organic Enrichment Fecal Coliform 6.32E+12 NA 3.32E+11 6.65E+12 (counts/yr)
Sedimentation Iron 7.18 1.94 0.48 9.60 (lbs/day)
Sycamore Creek (WV-OMS-24-AN)
Organic Enrichment Fecal Coliform 2.34E+13 1.11E+10 1.23E+12 2.46E+13 (counts/yr)
Sedimentation Iron 35.50 8.76 2.33 46.60 (lbs/day)
Left Fork/Sycamore Creek (WV-OMS-24-AN-1)
Organic Enrichment Fecal Coliform 1.08E+13 4.15E+09 5.71E+11 1.14E+13 (counts/yr)
Sedimentation Iron 17.89 4.66 1.19 23.74 (lbs/day)
Grasslick Creek (WV-OMS-24-BA-20)
Organic Enrichment Fecal Coliform 3.82E+13 3.47E+11 2.03E+12 4.06E+13 (counts/yr)
Sedimentation Iron 58.71 13.89 3.82 76.42 (lbs/day)

Middle Ohio River North and South Watersheds: TMDL Report
91
Stream Name (NHD_Code)
Biological Stressor Parameter LA WLA MOS TMDL Units
Bear Fork (WV-OMS-24-BA-21) Organic Enrichment Fecal Coliform 2.43E+13 NA 1.28E+12 2.56E+13 (counts/yr)
Elk Fork (WV-OMS-24-BH) Organic Enrichment Fecal Coliform 3.90E+13 NA 2.05E+12 4.11E+13 (counts/yr)
Little Mill Creek (WV-OMS-24-BI)
Organic Enrichment Fecal Coliform 6.39E+13 2.26E+10 3.36E+12 6.73E+13 (counts/yr)
Sedimentation Iron 126.10 25.19 7.96 159.25 (lbs/day)
Little Creek (WV-OMS-24-BI-12)
Organic Enrichment Fecal Coliform 8.51E+12 NA 4.48E+11 8.95E+12 (counts/yr)
Sedimentation Iron 12.32 3.87 0.85 17.04 (lbs/day)
Buffalo Creek (WV-OMS-24-BI-17)
Organic Enrichment Fecal Coliform 5.99E+12 NA 3.15E+11 6.31E+12 (counts/yr)
Sedimentation Iron 11.18 1.95 0.69 13.82 (lbs/day)
Frozencamp Creek (WV-OMS-24-BI-9)
Organic Enrichment Fecal Coliform 1.72E+13 4.15E+09 9.05E+11 1.81E+13 (counts/yr)
Sedimentation Iron 23.18 7.67 1.62 32.48 (lbs/day)
Bar Run (WV-OMS-24-P)
Organic Enrichment Fecal Coliform 3.97E+12 NA 2.09E+11 4.18E+12 (counts/yr)
Sedimentation Iron 4.67 0.73 0.28 5.68 (lbs/day)
Cow Run (WV-OMS-24-U)
Organic Enrichment Fecal Coliform 2.14E+13 3.32E+09 1.12E+12 2.25E+13 (counts/yr)
Sedimentation Iron 34.95 8.09 2.27 45.31 (lbs/day)
Left Fork/Cow Run (WV-OMS-24-U-8)
Organic Enrichment Fecal Coliform 9.18E+12 NA 4.83E+11 9.67E+12 (counts/yr)
Sedimentation Iron 14.28 3.45 0.93 18.66 (lbs/day)
Spring Creek (WV-OMS-25)
Organic Enrichment Fecal Coliform 2.14E+12 1.66E+09 1.13E+11 2.25E+12 (counts/yr)
Sedimentation Iron 3.11 1.70 0.25 5.07 (lbs/day)
Cedar Run (WV-OMS-28)
Organic Enrichment Fecal Coliform 4.70E+12 6.63E+09 2.48E+11 4.96E+12 (counts/yr)
Sedimentation Iron 6.31 3.32 0.51 10.13 (lbs/day)
Turkey Run (WV-OMS-2-D)
Organic Enrichment Fecal Coliform 3.03E+12 3.59E+10 1.61E+11 3.22E+12 (counts/yr)
Sedimentation Iron 6.97 0.36 0.39 7.72 (lbs/day) Potter Creek
(WV-OMS-2-F) Sedimentation Iron 5.10 1.28 0.34 6.71 (lbs/day)
UNT/Robinson Run RM 2.42 (WV-OMS-2-G-1)
Organic Enrichment Fecal Coliform 9.55E+11 NA 5.02E+10 1.00E+12 (counts/yr)
Sedimentation Iron 1.37 0.20 0.08 1.66 (lbs/day)

Middle Ohio River North and South Watersheds: TMDL Report
92
Stream Name (NHD_Code)
Biological Stressor Parameter LA WLA MOS TMDL Units
Sandy Creek (WV-OMS-30)
Organic Enrichment Fecal Coliform 1.86E+14 2.41E+12 9.92E+12 1.98E+14 (counts/yr)
Sedimentation Iron 490.45 70.60 29.53 590.58 (lbs/day)
Crooked Fork (WV-OMS-30-K)
Organic Enrichment Fecal Coliform 1.30E+13 1.38E+09 6.83E+11 1.37E+13 (counts/yr)
Sedimentation Iron 19.05 4.84 1.26 25.15 (lbs/day)
Trace Fork (WV-OMS-30-O)
Organic Enrichment Fecal Coliform 1.14E+13 4.29E+10 6.01E+11 1.20E+13 (counts/yr)
Sedimentation Iron 14.30 4.28 0.98 19.56 (lbs/day)
Beatty Run (WV-OMS-30-P)
Organic Enrichment Fecal Coliform 3.66E+12 NA 1.93E+11 3.85E+12 (counts/yr)
Sedimentation Iron 5.51 1.72 0.38 7.61 (lbs/day)
Left Fork/Sandy Creek (WV-OMS-30-R)
Organic Enrichment Fecal Coliform 8.49E+13 2.33E+10 4.47E+12 8.94E+13 (counts/yr)
Sedimentation Iron 183.76 37.81 11.66 233.23 (lbs/day)
Copper Fork (WV-OMS-30-R-1)
Organic Enrichment Fecal Coliform 6.31E+12 NA 3.32E+11 6.65E+12 (counts/yr)
Sedimentation Iron 13.19 2.11 0.81 16.11 (lbs/day)
Nesselroad Run (WV-OMS-30-R-15)
Organic Enrichment Fecal Coliform 2.07E+13 NA 1.09E+12 2.18E+13 (counts/yr)
Sedimentation Iron 33.76 8.18 2.21 44.15 (lbs/day)
Turkey Fork (WV-OMS-30-R-8)
Organic Enrichment Fecal Coliform 1.30E+13 2.77E+09 6.85E+11 1.37E+13 (counts/yr)
Sedimentation Iron 22.24 6.69 1.52 30.45 (lbs/day)
Right Fork/Sandy Creek (WV-OMS-30-S)
Organic Enrichment Fecal Coliform 3.72E+13 2.77E+09 1.96E+12 3.91E+13 (counts/yr)
Sedimentation Iron 74.51 11.48 4.53 90.52 (lbs/day)
Washington Run (WV-OMS-35)
Organic Enrichment Fecal Coliform 4.96E+12 3.04E+09 2.61E+11 5.22E+12 (counts/yr)
Sedimentation Iron 8.51 2.48 0.58 11.57 (lbs/day) Mill Run
(WV-OMS-4) Organic Enrichment Fecal Coliform 6.17E+12 NA 3.25E+11 6.49E+12 (counts/yr)
Pond Creek (WV-OMS-44)
Organic Enrichment Fecal Coliform 6.60E+13 5.53E+09 3.47E+12 6.95E+13 (counts/yr)
Sedimentation Iron 119.75 19.49 7.33 146.57 (lbs/day) Jesse Run
(WV-OMS-44-F-2) Sedimentation Iron 6.63 0.16 0.36 7.15 (lbs/day)
South Fork/Lee Creek (WV-OMS-46-A)
Organic Enrichment Fecal Coliform 2.49E+13 1.38E+09 1.31E+12 2.62E+13 (counts/yr)
Sedimentation Iron 56.95 8.67 3.45 69.08 (lbs/day)

Middle Ohio River North and South Watersheds: TMDL Report
93
Stream Name (NHD_Code)
Biological Stressor Parameter LA WLA MOS TMDL Units
North Fork/Lee Creek (WV-OMS-46-B)
Organic Enrichment Fecal Coliform 4.82E+13 4.15E+09 2.54E+12 5.07E+13 (counts/yr)
Sedimentation Iron 87.18 15.35 5.40 107.92 (lbs/day)
Gunners Run (WV-OMS-46-B-31)
Organic Enrichment Fecal Coliform 9.20E+11 NA 4.84E+10 9.68E+11 (counts/yr)
Sedimentation Iron 0.93 0.28 0.06 1.28 (lbs/day)
Sandy Creek (WV-OMS-57)
Organic Enrichment Fecal Coliform 1.50E+13 6.80E+10 7.94E+11 1.59E+13 (counts/yr)
Sedimentation Iron 27.14 7.48 1.82 36.45 (lbs/day)
Vaughts Run (WV-OMS-57-D)
Organic Enrichment Fecal Coliform 3.19E+12 6.13E+10 1.71E+11 3.42E+12 (counts/yr)
Sedimentation Iron 3.97 2.20 0.32 6.50 (lbs/day) UNT/Sandy Creek RM 4.97
(WV-OMS-57-O) Organic Enrichment Fecal Coliform 1.67E+12 NA 8.81E+10 1.76E+12 (counts/yr)
Tenmile Creek (WV-OMS-6)
Organic Enrichment Fecal Coliform 1.52E+13 NA 7.99E+11 1.60E+13 (counts/yr)
Sedimentation Iron 39.07 6.55 2.40 48.02 (lbs/day)
Pond Run (WV-OMS-65)
Organic Enrichment Fecal Coliform 5.40E+12 7.41E+12 6.74E+11 1.35E+13 (counts/yr)
Sedimentation Iron 8.72 15.90 1.30 25.91 (lbs/day)
Little Pond Run (WV-OMS-65-A)
Organic Enrichment Fecal Coliform 1.11E+12 3.45E+12 2.40E+11 4.80E+12 (counts/yr)
Sedimentation Iron 2.69 4.23 0.36 7.28 (lbs/day)
Briscoe Run (WV-OMS-66)
Organic Enrichment Fecal Coliform 3.66E+12 7.90E+11 2.34E+11 4.68E+12 (counts/yr)
Sedimentation Iron 4.18 2.54 0.35 7.07 (lbs/day)
Big Run (WV-OMS-69)
Organic Enrichment Fecal Coliform 3.18E+13 1.99E+12 1.78E+12 3.55E+13 (counts/yr)
Sedimentation Iron 55.96 29.23 4.48 89.67 (lbs/day)
Plum Run (WV-OMS-69-F)
Organic Enrichment Fecal Coliform 4.37E+12 NA 2.30E+11 4.60E+12 (counts/yr)
Sedimentation Iron 4.31 4.97 0.49 9.77 (lbs/day)
Hogland Run (WV-OMS-69-J)
Organic Enrichment Fecal Coliform 5.07E+12 NA 2.67E+11 5.34E+12 (counts/yr)
Sedimentation Iron 3.99 4.03 0.42 8.44 (lbs/day) UNT/Tenmile Creek RM 5.33
(WV-OMS-6-D) Sedimentation Iron 1.96 0.70 0.14 2.80 (lbs/day) NA = not applicable; UNT = unnamed tributary, RM= river mile.
“Scientific notation” is a method of writing or displaying numbers in terms of a decimal number between 1 and 10 multiplied by a power of 10. The scientific notation of 10,492, for example, is 1.0492 × 10⁴.

Middle Ohio River North and South Watersheds: TMDL Report
94
Table 9-6. Biological TMDLs in Middle Ohio River North Watershed
Stream Name (NHD_Code)
Biological Stressor Parameter LA WLA MOS TMDL Units
Middle Island Creek (WV-OMN-13)
Organic Enrichment Fecal Coliform 2.17E+12 3.89E+09 1.14E+11 2.29E+12 (counts/day)
Sedimentation Iron 2710.99 247.95 155.73 3114.67 (lbs/day) Sancho Creek
(WV-OMN-13-BF) Sedimentation Iron 58.16 12.61 3.72 74.49 (lbs/day)
Point Pleasant Creek (WV-OMN-13-BK)
Organic Enrichment Fecal Coliform 2.31E+11 1.59E+07 1.22E+10 2.43E+11 (counts/day)
Sedimentation Iron 168.62 30.05 10.46 209.12 (lbs/day)
Peach Fork (WV-OMN-13-BK-21)
Organic Enrichment Fecal Coliform 5.92E+09 NA 3.11E+08 6.23E+09 (counts/day)
Sedimentation Iron 3.97 0.69 0.25 4.91 (lbs/day)
Pursley Creek (WV-OMN-13-BK-4)
Organic Enrichment Fecal Coliform 4.39E+10 4.54E+06 2.31E+09 4.62E+10 (counts/day)
Sedimentation Iron 23.42 4.93 1.49 29.84 (lbs/day) Gorrell Run
(WV-OMN-13-BM) Organic Enrichment Fecal Coliform 1.63E+10 NA 8.59E+08 1.72E+10 (counts/day)
Indian Creek (WV-OMN-13-CG)
Organic Enrichment Fecal Coliform 1.26E+11 NA 6.64E+09 1.33E+11 (counts/day)
Sedimentation Iron 119.10 8.72 6.73 134.55 (lbs/day)
McElroy Creek (WV-OMN-13-CH)
Organic Enrichment Fecal Coliform 4.16E+11 8.56E+07 2.19E+10 4.38E+11 (counts/day)
Sedimentation Iron 402.32 50.50 23.83 476.65 (lbs/day) Big Battle Run
(WV-OMN-13-CH-34-B) Organic Enrichment Fecal Coliform 2.49E+10 NA 1.31E+09 2.62E+10 (counts/day) Wilhelm Run
(WV-OMN-13-DA-12) Organic Enrichment Fecal Coliform 1.24E+10 NA 6.53E+08 1.31E+10 (counts/day)
Right Fork/Arnold Creek (WV-OMN-13-DA-20)
Organic Enrichment Fecal Coliform 1.77E+10 NA 9.31E+08 1.86E+10 (counts/day)
Sedimentation Iron 14.50 1.70 0.85 17.05 (lbs/day)
Meathouse Fork (WV-OMN-13-DV)
Organic Enrichment Fecal Coliform 2.53E+11 4.24E+07 1.33E+10 2.66E+11 (counts/day)
Sedimentation Iron 188.00 32.42 11.60 232.03 (lbs/day)
Buckeye Run (WV-OMN-13-DW-9)
Organic Enrichment Fecal Coliform 2.31E+10 2.27E+07 1.22E+09 2.44E+10 (counts/day)
Sedimentation Iron 13.64 3.47 0.90 18.01 (lbs/day) McKim Creek
(WV-OMN-13-L) Organic Enrichment Fecal Coliform 1.45E+11 NA 7.64E+09 1.53E+11 (counts/day) Sugar Creek
(WV-OMN-13-V) Organic Enrichment Fecal Coliform 8.60E+10 NA 4.53E+09 9.06E+10 (counts/day)
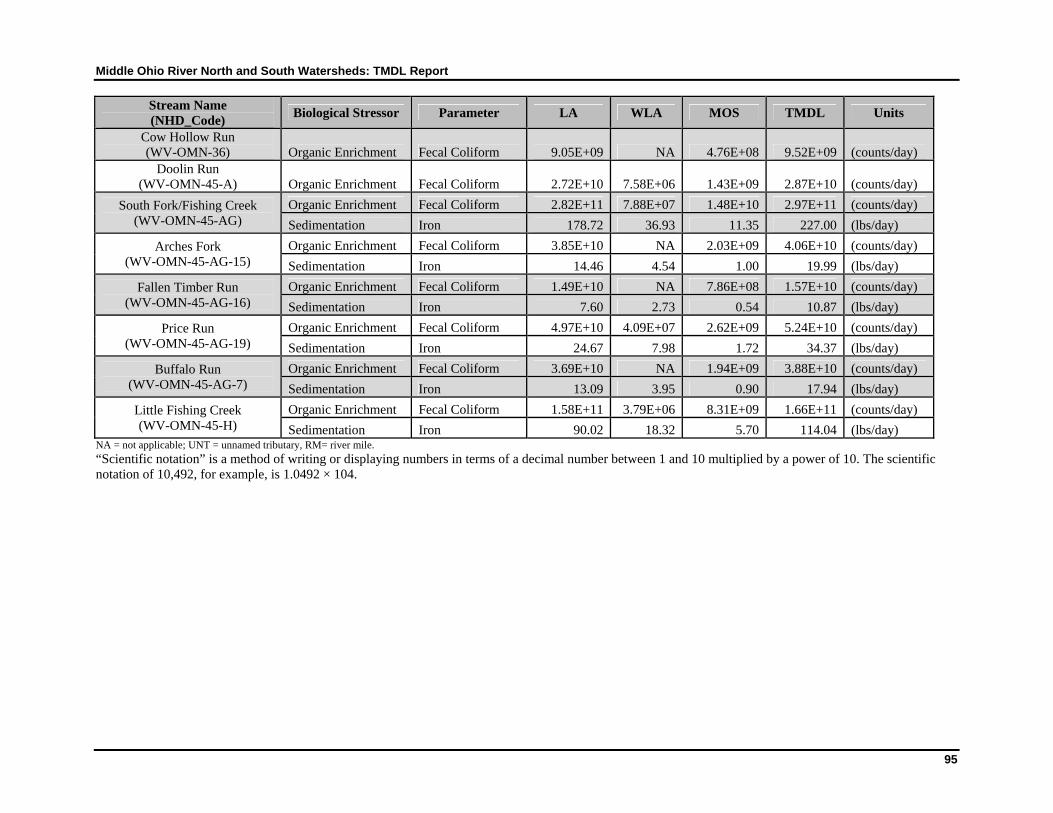
Middle Ohio River North and South Watersheds: TMDL Report
95
Stream Name (NHD_Code)
Biological Stressor Parameter LA WLA MOS TMDL Units
Cow Hollow Run (WV-OMN-36) Organic Enrichment Fecal Coliform 9.05E+09 NA 4.76E+08 9.52E+09 (counts/day)
Doolin Run (WV-OMN-45-A) Organic Enrichment Fecal Coliform 2.72E+10 7.58E+06 1.43E+09 2.87E+10 (counts/day)
South Fork/Fishing Creek (WV-OMN-45-AG)
Organic Enrichment Fecal Coliform 2.82E+11 7.88E+07 1.48E+10 2.97E+11 (counts/day)
Sedimentation Iron 178.72 36.93 11.35 227.00 (lbs/day)
Arches Fork (WV-OMN-45-AG-15)
Organic Enrichment Fecal Coliform 3.85E+10 NA 2.03E+09 4.06E+10 (counts/day)
Sedimentation Iron 14.46 4.54 1.00 19.99 (lbs/day)
Fallen Timber Run (WV-OMN-45-AG-16)
Organic Enrichment Fecal Coliform 1.49E+10 NA 7.86E+08 1.57E+10 (counts/day)
Sedimentation Iron 7.60 2.73 0.54 10.87 (lbs/day)
Price Run (WV-OMN-45-AG-19)
Organic Enrichment Fecal Coliform 4.97E+10 4.09E+07 2.62E+09 5.24E+10 (counts/day)
Sedimentation Iron 24.67 7.98 1.72 34.37 (lbs/day)
Buffalo Run (WV-OMN-45-AG-7)
Organic Enrichment Fecal Coliform 3.69E+10 NA 1.94E+09 3.88E+10 (counts/day)
Sedimentation Iron 13.09 3.95 0.90 17.94 (lbs/day)
Little Fishing Creek (WV-OMN-45-H)
Organic Enrichment Fecal Coliform 1.58E+11 3.79E+06 8.31E+09 1.66E+11 (counts/day)
Sedimentation Iron 90.02 18.32 5.70 114.04 (lbs/day) NA = not applicable; UNT = unnamed tributary, RM= river mile.
“Scientific notation” is a method of writing or displaying numbers in terms of a decimal number between 1 and 10 multiplied by a power of 10. The scientific notation of 10,492, for example, is 1.0492 × 10⁴.

Middle Ohio River North and South Watersheds: TMDL Report
96
10.0 FUTURE GROWTH
10.1 Iron
With the exception of allowances provided for CSGP registrations discussed below, this TMDL does not include specific future growth allocations for iron. However, the absence of specific future growth allocations does not prohibit the permitting of new or expanded activities in the watersheds of streams for which metals TMDLs have been developed. Pursuant to 40 CFR 122.44(d)(1)(vii)(B), effluent limits must be “consistent with the assumptions and requirements of any available WLAs for the discharge....” In addition, the federal regulations generally prohibit issuance of a permit to a new discharger “if the discharge from its construction or operation will cause or contribute to the violation of water quality standards.” A discharge permit for a new discharger could be issued under the following scenarios:
A new facility could be permitted anywhere in the watershed, provided that effluent limitations are based on the achievement of water quality standards at end-of-pipe for the pollutants of concern in the TMDL.
NPDES permitting rules mandate effluent limitations for metals to be prescribed in the total recoverable form. West Virginia water quality criteria for iron are in total recoverable form and may be directly implemented. As described previously, the alternative precipitation provisions of 40 CFR 434 that suspend applicability of TSS limitations cannot be applied to new discharges in iron TMDL watersheds.
Remining (under an NPDES permit) could occur without a specific allocation to the new permittee, provided that the requirements of existing State remining regulations are met. Remining activities will not worsen water quality and in some instances may result in improved water quality in abandoned mining areas.
Reclamation and release of existing permits could provide an opportunity for future growth provided that permit release is conditioned on achieving discharge quality better than the WLA prescribed by the TMDL.
Most traditional, non-mining point source discharges are assigned technology-based TSS effluent limitations that would not cause biological impairment. For example, NPDES permits for sewage treatment and industrial manufacturing facilities contain monthly average TSS effluent limitations between 30 and 100 mg/L. New point sources may be permitted in the watersheds of biologically impaired streams for which sedimentation has been identified as a significant stressor with the implementation of applicable technology based TSS requirements. If iron is identified as a pollutant of concern in a process wastewater discharge from a new, non-mining activity, then the discharge can be permitted if effluent limitations are based on the achievement of water quality standards at end-of-pipe for the pollutants of concern.

Middle Ohio River North and South Watersheds: TMDL Report
97
Subwatershed-specific future growth allowances have been provided for site registrations under the CSGP. The successful TMDL allocation provides subwatershed-specific disturbed areas that may be registered under the general permit at any point in time. The iron allocation spreadsheet also provides cumulative area allowances of disturbed area for the immediate subwatershed and all upstream contributing subwatersheds. Projects in excess of the acreage provided for the immediate subwatershed may also be registered under the general permit, provided that the total registered disturbed area in the immediate subwatershed and all upstream subwatersheds is less than the cumulative area provided. Furthermore, projects with disturbed area larger than allowances may be registered under the general permit under any of the following provisions:
o A larger total project area can be registered if the construction activity is authorized in phases that adhere to the future growth area allowances.
o All disturbed areas that will occur on non-background land uses can be registered without regard to the future growth allowances.
o Registration may be conditioned by implementing controls beyond those afforded by the general permit, if it can be demonstrated that the additional controls will result in a lower unit area loading condition than the 100 mg/l TSS expectation for typical permit BMPs and that the improved performance is proportional to the increased area.
10.2 Fecal Coliform Bacteria
Specific fecal coliform bacteria future growth allocations are not prescribed. The absence of specific future growth allocations does not prohibit new development in the watersheds of streams for which fecal coliform bacteria TMDLs have been developed, or preclude the permitting of new sewage treatment facilities.
In many cases, the implementation of the TMDLs will consist of providing public sewer service to unsewered areas. The NPDES permitting procedures for sewage treatment facilities include technology-based fecal coliform effluent limitations that are more stringent than applicable water quality criteria. Therefore, a new sewage treatment facility may be permitted anywhere in the watershed, provided that the permit includes monthly geometric mean and maximum daily fecal coliform limitations of 200 counts/100 mL and 400 counts/100 mL, respectively. Furthermore, WVDEP will not authorize construction of combined collection systems nor permit overflows from newly constructed collection systems.

Middle Ohio River North and South Watersheds: TMDL Report
98
11.0 PUBLIC PARTICIPATION
11.1 Public Meetings
Informational public meetings were held on May 27, 2008 and May 29, 2008 at St Marys High School and Ravenswood High School, respectively. The May 27 and May 29, 2008 meetings occurred prior to pre-TMDL stream monitoring and pollutant source tracking and included a general TMDL overview and a presentation of planned monitoring and data gathering activities. On August 30 and 31, 2011 additional meetings were held prior to the allocation of pollutant loads. These meetings also provided a description of the status of TMDL development.
A public meeting was held to present the Draft TMDLs on August 6, 2012 at the Pleasants County Library, 101 Lafayette St., St. Mary, WV. This meeting provided information to stakeholders that was intended to facilitate comments on the draft Middle Ohio River North watershed TMDLs. A second meeting was held to provide information and facilitate comments on the draft Middle Ohio River South watershed, on August 9, 2012, at the Ripley City Hall, 203 S. Church Street, Ripley, W.Va.
11.2 Public Notice and Public Comment Period
The availability of Draft TMDLs was advertised in various local newspapers between July 23 and July 27, 2012. Interested parties were invited to submit comments during the public comment period, which began on July 25, 2012 and ended on August 25, 2012. WVDEP did not receive any comments on the Draft TMDLs. The electronic documents were also posted on the WVDEP’s internet site at http://www.dep.wv.gov/WWE/watershed/TMDL/Pages/default.aspx
12.0 REASONABLE ASSURANCE
Reasonable assurance for maintenance and improvement of water quality in the affected watershed rests primarily with two programs. The NPDES permitting program is implemented by WVDEP to control point source discharges. The West Virginia Watershed Network is a cooperative nonpoint source control effort involving many state and federal agencies, whose task is protection and/or restoration of water quality.
12.1 NPDES Permitting
WVDEP’s Division of Water and Waste Management (DWWM) is responsible for issuing non-mining NPDES permits within the State. WVDEP’s Division of Mining and Reclamation (DMR) develops NPDES permits for mining activities. As part of the permit review process, permit writers have the responsibility to incorporate the required TMDL WLAs into new or reissued permits. New facilities will be permitted in accordance with future growth provisions described in Section 10.
Both the permitting and TMDL development processes have been synchronized with the Watershed Management Framework cycle, such that TMDLs are completed just before the

Middle Ohio River North and South Watersheds: TMDL Report
99
permit expiration/reissuance time frames. Permits for existing nonmining facilities in the Middle Ohio River South and Middle Ohio River North watersheds will be reissued beginning in July 2012 and the reissuance of mining permits will begin January 1, 2013.
The water quality impacts of construction activities registered under the permit are transient, and upland sediment loadings are minimized after construction is completed and the sites are stabilized. Concurrently disturbed area under the CSGP will adhere to the area based WLAs. Where existing registrations do not conform, the DWWM permitting program will require stabilization and permit termination in the shortest time possible. Thereafter the program will maintain concurrently disturbed area as allocated or otherwise control future activity through provisions described in Section 10.
The MS4 permitting program is being implemented to address stormwater impacts from urbanized areas. West Virginia has developed a General NPDES Permit for MS4 discharges (WV0110625). The cities of Parkersburg and Vienna, the Town of Williamstown and the West Virginia Department of Transportation, Division of Highways (DOH) are registered under the permit. The permit is based upon national guidance and is non-traditional in that it does not contain numeric effluent limitations, but instead proposes Best Management Practices that must be implemented. The MS4 permit is being reissued and in their application for registration under the reissued permit, MS4 entities must specifically describe management practices intended for implementation that will achieve the WLAs prescribed in applicable TMDLs. A mechanism to assess the effectiveness of the BMPs in achieving the WLAs must also be provided. The TMDLs are not intended to mandate imposition of numerical effluent limitations and/or discharge monitoring requirements for MS4s. Reasonable alternative methodologies may be employed for targeting and assessing BMP effectiveness in relation to prescribed WLAs. The “MS4 WLA Detailed” tabs on the allocation spreadsheets WLAs provide drainage areas of various land use types represented in the baseline condition (without BMPs) for each MS4 entity at the subwatershed scale. Through consideration of anticipated removal efficiencies of selected BMPs and their areas of application, it is anticipated that this information will allow MS4 permittees to make meaningful predictions of performance under the permit.
DWWM also implements a program to control discharges from CSOs. Specified fecal coliform WLAs for CSOs will be implemented in accordance with the provisions of the national Combined Sewer Overflow Control Policy and the state Combined Sewer Overflow Strategy. Those programs recognize that comprehensive CSO control may require significant resources and an extended period of time to accomplish. The WLAs prescribed for CSOs are necessary to achieve current fecal coliform water quality criteria. However, the TMDL should not be construed to supersede the prioritization and scheduling of CSO controls and actions pursuant to the national CSO program. Nor are the TMDLs intended to prohibit the pursuit of the water quality standard revisions envisioned in the national policy. TMDLs may be modified to properly implement future water quality standard revisions (designated use and/or criteria), if enacted and approved by USEPA.

Middle Ohio River North and South Watersheds: TMDL Report
100
12.2 Watershed Management Framework Process
The Watershed Management Framework is a tool used to identify priority watersheds and coordinate efforts of state and federal agencies with the goal of developing and implementing watershed management strategies through a cooperative, long-range planning effort.
The West Virginia Watershed Network is an informal association of state and federal agencies, and nonprofit organizations interested in the watershed movement in West Virginia. Membership is voluntary and everyone is invited participate. The Network uses the Framework to coordinate existing programs, local watershed associations, and limited resources. This coordination leads to the development of Watershed Based Plans to implement TMDLs and document environmental results.
The principal area of focus of watershed management through the Framework process is correcting problems related to nonpoint source pollution. Network partners have placed a greater emphasis on identification and correction of nonpoint source pollution. The combined resources of the partners are used to address all different types of nonpoint source pollution through both public education and on-the-ground projects.
Among other things, the Framework includes a management schedule for integration and implementation of TMDLs. In 2000, the schedule for TMDL development under Section 303(d) was merged with the Framework process. The Framework identifies a six-step process for developing integrated management strategies and action plans for achieving the state’s water quality goals. Step 3 of that process includes “identifying point source and/or nonpoint source management strategies - or Total Maximum Daily Loads - predicted to best meet the needed [pollutant] reduction.” Following development of the TMDL, Steps 5 and 6 provide for preparation, finalization, and implementation of a Watershed Based Plan to improve water quality.
Each year, the Framework is included on the agenda of the Network to evaluate the restoration potential of watersheds within a certain Hydrologic Group. This evaluation includes a review of TMDL recommendations for the watersheds under consideration. Development of Watershed Based Plans is based on the efforts of local project teams. These teams are composed of Network members and stakeholders having interest in or residing in the watershed. Team formation is based on the type of impairment(s) occurring or protection(s) needed within the watershed. In addition, teams have the ability to use the TMDL recommendations to help plan future activities. Additional information regarding upcoming Network activities can be obtained from the Nonpoint Source Program Basin Coordinator, Jennifer Pauer ([email protected]).
Presently, there are no Watershed Associations in the Middle Ohio River South and Middle Ohio River North watersheds.
12.3 Public Sewer Projects
Within WVDEP DWWM, the Engineering and Permitting Branch’s Engineering Section is charged with the responsibility of evaluating sewer projects and providing funding, where available, for those projects. All municipal wastewater loans issued through the State Revolving

Middle Ohio River North and South Watersheds: TMDL Report
101
Fund (SRF) program are subject to a detailed engineering review of the engineering report, design report, construction plans, specifications, and bidding documents. The staff performs periodic on-site inspections during construction to ascertain the progress of the project and compliance with the plans and specifications. Where the community does not use SRF funds to undertake a project, the staff still performs engineering reviews for the agency on all POTWs prior to permit issuance or modification. For further information on upcoming projects, a list of funded and pending water and wastewater projects in West Virginia can be found at http://www.wvinfrastructure.com/projects/index.php.
12.4 AML Projects
Within WVDEP, the Office of Abandoned Mine Lands and Reclamation (AML&R) manages the reclamation of lands and waters affected by mining prior to the passage of the Surface Mining Control and Reclamation Act (SMCRA) in 1977. Title IV of the act addresses adverse impacts associated with abandoned mine lands. Funding for reclamation activities is derived from fees placed on coal mined which are placed in a fund and annually distributed to state and tribal agencies.
Various abandoned mine land reclamation activities are addressed by the program as necessary to protect public health, safety, and property from past coal mining and to enhance the environment through the reclamation and restoration of land and water resources. Portions of the annual grant are also used to repair or replace drinking water supplies that were substantially damaged by pre-SMCRA coal mining and to administer the program.
In December 2006, Congress passed legislation amending SMCRA and the Title IV program and in November 2008, the Office of Surface Mining finalized rules to implement the amendments. After an initial ramp-up period, AML&R will realize significant increases in its annual reclamation funding and the flexibility to direct a larger portion of those funds to address water resource impacts from abandoned mine drainage (AMD).
Title IV now contains a “30 percent AMD set-aside” provision that allows a state to use up to 30 percent of its annual grant to address AMD problems. In determining the amount of money to set-aside, AML&R must balance its multiple areas of responsibility under the program and ensure that funding is available for perpetual operation and maintenance of treatment facilities. In regard to water resource impacts, project prioritization will consider treatment practicability and sustainability and will be accomplished under a methodology that provides for the efficient application of funds to maximize restoration of fisheries across AML impacted areas of the State.

Middle Ohio River North and South Watersheds: TMDL Report
102
13.0 MONITORING PLAN
The following monitoring activities are recommended:
13.1 NPDES Compliance
WVDEP’s DWWM and DMR have the responsibility to ensure that NPDES permits contain effluent limitations as prescribed by the TMDL WLAs and to assess and compel compliance. Permits will contain self-monitoring and reporting requirements that are periodically reviewed by WVDEP. WVDEP also inspects treatment facilities and independently monitors NPDES discharges. The combination of these efforts will ensure implementation of the TMDL WLAs.
13.2 Nonpoint Source Project Monitoring
All nonpoint source restoration projects should include a monitoring component specifically designed to document resultant local improvements in water quality. These data may also be used to predict expected pollutant reductions from similar future projects.
13.3 TMDL Effectiveness Monitoring
TMDL effectiveness monitoring should be performed to document water quality improvements after significant implementation activity has occurred where little change in water quality would otherwise be expected. Full TMDL implementation will take significant time and resources, particularly with respect to the abatement of nonpoint source impacts. WVDEP will continue monitoring on the rotating basin cycle and will include a specific TMDL effectiveness component in waters where significant TMDL implementation has occurred.

Middle Ohio River North and South Watersheds: TMDL Report
103
14.0 REFERENCES
Atkins, John T. Jr., Jeffery B. Wiley, Katherine S. Paybins. 2005. Calibration Parameters Used to Simulate Streamflow from Application of the Hydrologic Simulation Program-FORTRAN Model (HSPF) to Mountainous Basins Containing Coal Mines in West Virginia. Scientific Investigations Report 2005-5099. U.S. Department of the Interior, U.S. Geological Survey.
Cormier, S., G. Sutter, and S.B. Norton. 2000. Stressor Identification: Technical Guidance Document. USEPA-822B-00-25. U.S. Environmental Protection Agency, Office of Water and Office of Research and Development, Washington, DC.
Gerritsen, J., J. Burton, and M.T. Barbour. 2000. A Stream Condition Index for West Virginia Wadeable Streams. Tetra Tech, Inc., Owings Mills, MD.
Novotny, V., and H. Olem. 1994. Water Quality: Prevention, Identification, and Management of Diffuse Pollution. Van Nostrand Reinhold, New York, NY.
PADEP (Pennsylvania Department of Environmental Protection). 2000. Coal Mine Drainage Prediction and Pollution Prevention in Pennsylvania. Pennsylvania Department of Environmental Protection, Harrisburg, PA.
Scientific notation. Dictionary.com. The American Heritage® Dictionary of the English Language, Fourth Edition. Houghton Mifflin Company, 2004. http://dictionary.reference.com/browse/scientific notation (accessed: May 22, 2007).
USEPA (U.S. Environmental Protection Agency). 1991. Technical Support Document for Water Quality-based Toxics Control. USEPA/505/2-90-001. U.S. Environmental Protection Agency, Office of Water, Washington, DC.