total maximum daily loads for fecal coliform in …
TRANSCRIPT
TOTAL MAXIMUM DAILY LOADS FOR
FECAL COLIFORM IN SHELLFISH WATERS OF THE MURRELL’S INLET ESTUARY, SOUTH CAROLINA
HYDROLOGIC UNIT CODE: 03040207 (STATIONS 04-01, 04-01A, 04-02, 04-06, 04-08, 04-16, 04-26, 04-27)
JULY 2005
SCDHEC Technical Report Number: 025-05
Prepared for:
U.S. ENVIRONMENTAL PROTECTION AGENCY, REGION 4, ATLANTA, GEORGIA
AND
THE SOUTH CAROLINA DEPARTMENT OF HEALTH AND ENVIRONMENTAL CONTROL, BUREAU OF WATER
CONTRACT 68-C-02-111
Prepared by:
QQUUAANNTTIITTAATTIIVVEE EENNVVIIRROONNMMEENNTTAALL AANNAALLYYSSIISS,, LLLLCC
In compliance with the provisions of the Federal Clean Water Act, 33 U.S.C §1251 et.seq., as amended by the Water Quality Act of 1987, P.L. 400-4, the U.S Environmental Protection Agency is hereby establishing a Total Maximum Daily Load (TMDL) for Fecal Coliform for Murrell’s Inlet Estuary in the Pee Dee River Basin. Subsequent actions must be consistent with this TMDL.
James D. Giattina, Director Date Water Management Division
TMDL Development for the Murrell’s Inlet Estuary Table of Contents
FINAL - TRN: 025-05 April 2005
TABLE OF CONTENTS
LIST OF FIGURES................................................................................................................... II LIST OF TABLES..................................................................................................................... II ACRONYMS AND ABBREVIATIONS ................................................................................ IV SECTION 1 INTRODUCTION ............................................................................................. 1-1
1.1 Background.................................................................................................................1-1 1.2 Watershed Description ...............................................................................................1-3
SECTION 2 WATER QUALITY ASSESSMENT............................................................... 2-1 2.1 Assessment of Existing Water Quality Data ..............................................................2-1
SECTION 3 POLLUTANT SOURCE ASSESSMENT ....................................................... 3-1 3.1 Point Source Discharges.............................................................................................3-1
3.1.1 Permitted Dischargers ....................................................................................3-1 3.1.2 Municipal Separate Storm Sewer Systems (MS4s)........................................3-2 3.1.3 Marinas and Docking Facilities......................................................................3-2
3.2 Nonpoint Sources .......................................................................................................3-4 3.2.1 Urban and Suburban Runoff...........................................................................3-4 3.2.2 Agricultural Runoff ........................................................................................3-4 3.2.3 Individual Sewage Treatment and Disposal Systems (ISTDs).......................3-4
3.2.4 Wildlife.......................................................................................................................3-4 3.2.5 Boat Traffic ....................................................................................................3-5
3.3 Summary of Fecal Coliform Sources and Impaired WQM Stations ..........................3-5 SECTION 4 SOURCE LOAD ASSESSMENT .................................................................... 4-1
4.1 Model Development ...................................................................................................4-2 4.2 Model Calibration.......................................................................................................4-5
SECTION 5 TMDL CALCULATIONS................................................................................ 5-1 5.1 TMDLs .......................................................................................................................5-1 5.2 Critical Conditions......................................................................................................5-1 5.3 Waste Load Allocation ...............................................................................................5-2 5.4 Load Allocation ..........................................................................................................5-2 5.5 Margin of Safety.........................................................................................................5-4 5.6 Seasonal Variability....................................................................................................5-4 5.7 TMDL Calculations....................................................................................................5-4
SECTION 6 REFERENCES .................................................................................................. 6-1

TMDL Development for the Murrell’s Inlet Estuary Table of Contents
FINAL - TRN: 025-05 April 2005
APPENDICES Appendix A Fecal Coliform Data Collected at 303(d) Listed Stations Between September
2001 and August 2004
Appendix B Land Use and Sub-watershed Delineations for the Impaired Systems of Murrell’s Inlet
Appendix C Time Series of Predicted and Observed Salinity and Fecal Coliform Levels at Each 303(d) Listed Station (September 2001 through August 2004)
LIST OF FIGURES Figure 1-1 Murrell’s Inlet Estuary Watershed and 303(d) Listed Water Quality
Monitoring Stations ...........................................................................................1-2 Figure 1-2 Land Use Distribution within the Murrell’s Inlet Estuary Watershed ..............1-5 Figure 2-1 Fecal Coliform Levels as a Function of Salinity for the 303(d) Listed Stations
within Murrell’s Inlet: Individual Measurements..............................................2-3 Figure 2-2 Average Fecal Coliform Levels as a Function of Salinity for the 303(d) Listed
Stations within Murrell’s Inlet: By Salinity Bin................................................2-4 Figure 2-3 Fecal Coliform Levels as a Function of Precipitation for the 303(d) Listed
Stations within Murrell’s Inlet: Individual Measurements................................2-5 Figure 2-4 Average Fecal Coliform Levels as a Function of Precipitation for the 303(d)
Listed Stations within Murrell’s Inlet: By Precipitation Bin.............................2-6 Figure 3-1 Locations of Marinas and Docking Facilities within the Murrell’s Inlet Estuary3-3 Figure 4-1 Sources and Sinks of Fecal Coliform to the Murrell’s Inlet Estuary ................4-1 Figure 4-2 Cumulative Probability Distributions of Predicted and Observed Salinity
Levels for 303(d) Listed Stations in Murrell’s Inlet..........................................4-7 Figure 4-3 Spatial Distributions of Average Predicted and Observed Salinity Levels in the
Impaired Systems within Murrell’s Inlet...........................................................4-8 Figure 4-4 Cumulative Probability Distributions of Predicted and Observed Fecal
Coliform Levels for 303(d) Listed Stations in Murrell’s Inlet ..........................4-9 Figure 4-5 Spatial Distributions of Average Predicted and Observed Fecal Coliform
Levels in the Impaired Systems within Murrell’s Inlet ...................................4-10 Figure 5-1 Spatial Distributions of Average Predicted Post-Reduction Fecal Coliform
Levels in the Impaired Systems within Murrell’s Inlet .....................................5-3 Figure 5-2 Cumulative Probability Distributions of Observed and Post-Reduction Fecal
Coliform Levels for 303(d) Listed Stations within Murrell’s Inlet ...................5-5
LIST OF TABLES Table 1-1 Water Quality Monitoring Stations in the Murrell’s Inlet Estuary on the 2004
303(d) List for Fecal Coliform ..........................................................................1-3 Table 1-2 Land Use Distribution (in Acres) for the Sub-watersheds of the 303(d) Listed
Water Quality Monitoring Stations within the Murrell’s Inlet Estuary ............1-6
TMDL Development for the Murrell’s Inlet Estuary Table of Contents
FINAL - TRN: 025-05 April 2005
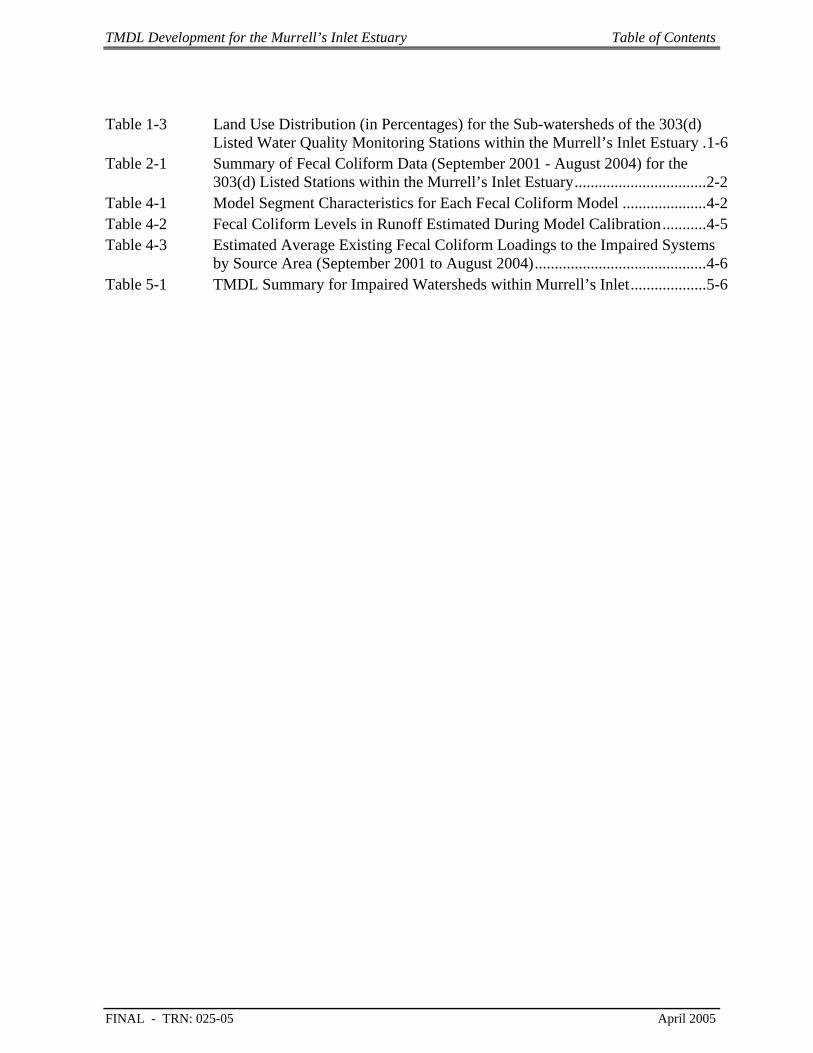
Table 1-3 Land Use Distribution (in Percentages) for the Sub-watersheds of the 303(d) Listed Water Quality Monitoring Stations within the Murrell’s Inlet Estuary .1-6
Table 2-1 Summary of Fecal Coliform Data (September 2001 - August 2004) for the 303(d) Listed Stations within the Murrell’s Inlet Estuary.................................2-2
Table 4-1 Model Segment Characteristics for Each Fecal Coliform Model .....................4-2 Table 4-2 Fecal Coliform Levels in Runoff Estimated During Model Calibration...........4-5 Table 4-3 Estimated Average Existing Fecal Coliform Loadings to the Impaired Systems
by Source Area (September 2001 to August 2004)...........................................4-6 Table 5-1 TMDL Summary for Impaired Watersheds within Murrell’s Inlet...................5-6
TMDL Development for the Murrell’s Inlet Estuary Acronyms and Abbreviations
TRN: 025-05 iv FINAL April 2005
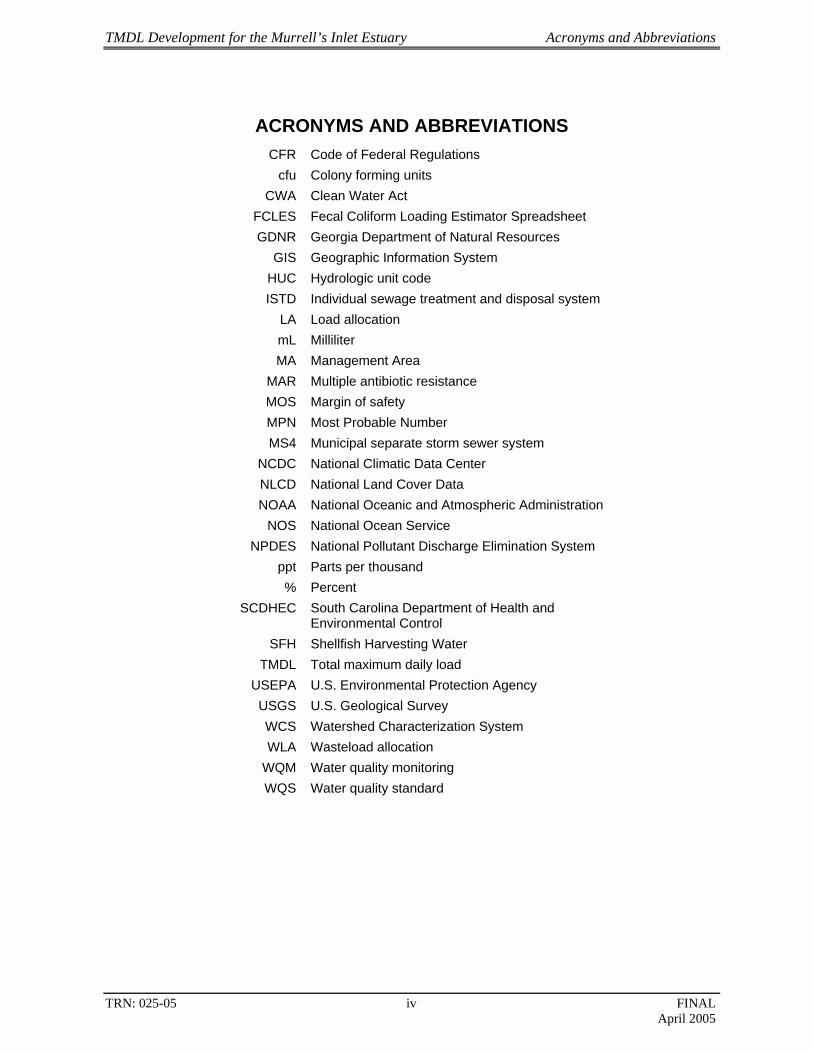
ACRONYMS AND ABBREVIATIONS CFR Code of Federal Regulations
cfu Colony forming units CWA Clean Water Act
FCLES Fecal Coliform Loading Estimator Spreadsheet GDNR Georgia Department of Natural Resources
GIS Geographic Information System HUC Hydrologic unit code ISTD Individual sewage treatment and disposal system
LA Load allocation mL Milliliter MA Management Area
MAR Multiple antibiotic resistance MOS Margin of safety MPN Most Probable Number MS4 Municipal separate storm sewer system
NCDC National Climatic Data Center NLCD National Land Cover Data NOAA National Oceanic and Atmospheric Administration
NOS National Ocean Service NPDES National Pollutant Discharge Elimination System
ppt Parts per thousand % Percent
SCDHEC South Carolina Department of Health and Environmental Control
SFH Shellfish Harvesting Water TMDL Total maximum daily load
USEPA U.S. Environmental Protection Agency USGS U.S. Geological Survey WCS Watershed Characterization System WLA Wasteload allocation
WQM Water quality monitoring WQS Water quality standard
TMDL Development for the Murrell’s Inlet Estuary Introduction
TRN: 025-05 1-1 FINAL April 2005
SECTION 1 INTRODUCTION
1.1 Background The State of South Carolina is required to develop total maximum daily loads (TMDLs)
for water bodies not meeting water quality standards (WQS) in accordance with Section 303(d) of the Clean Water Act (CWA) and the United States Environmental Protection Agency’s (USEPA’s) Water Quality Planning and Management Regulations (40 Code of Federal Regulations [CFR] Part 130). The TMDL process establishes the allowable loadings of pollutants or other quantifiable parameters for a waterbody based on the relationship between pollution sources and in-stream water quality conditions so that states can establish water quality-based controls to reduce pollution and restore and maintain the quality of water resources (USEPA 1991).
The South Carolina Department of Health and Environmental Control (SCDHEC) currently classifies approximately 571,010 acres of estuarine and riverine growing area habitat suitable for the cultivation and harvesting of molluscan shellfish (SCDHEC 2003c). For classification purposes, these habitat areas are divided into 25 Shellfish Management Areas (MAs). The Murrell’s Inlet system, which is the focus of this report, is located within MA 04.
Water quality standards for the State of South Carolina were promulgated in the South Carolina Pollution Control Act, Section 48-1-10 et seq. Chapter 61, R61-68 (SCDHEC 2004b). The waterbodies within the Murrell’s Inlet system are designated as Class Shellfish Harvesting Waters (SFH). Waters of this class are defined in Regulation 61-68, Water Classifications and Standards as:
Tidal saltwaters protected for shellfish harvesting and uses listed in Class SA and SB. Suitable for primary and secondary contact recreation, crabbing and fishing. Also suitable for the survival and propagation of a balanced indigenous aquatic community of marine fauna and flora.
South Carolina’s numeric criteria for fecal coliform bacteria in SFH are:
• Not to exceed a Most Probable Number (MPN) geometric mean of 14/100 milliliters (mL), and
• No more than 10 percent (%) of the samples exceed an MPN of 43/100 mL.
For the purposes of this report, these standards will be referred to herein as the geometric mean standard and the 10% exceedance standard, respectively.
The State of South Carolina has placed eight water quality monitoring (WQM) stations within the Murrell’s Inlet system (Hydrologic Unit Code [HUC] 03040207) on its 2004 Section 303(d) list due to fecal coliform impairments (SCDHEC 2004a; Figure 1-1 and Table 1-1). That is, fecal coliform levels at these locations exceed one or both water quality criteria for fecal coliform in shellfish harvesting waters. The presence of fecal coliform bacteria at these locations indicates that the water has been contaminated with the fecal material of humans and/or other warm-blooded animals, which may have originated from point and/or nonpoint sources of pollution.

TMDL Development for the Murrell’s Inlet Estuary Introduction
TRN: 025-05 1-2 FINAL April 2005
Figure 1-1 Murrell’s Inlet Estuary Watershed and 303(d) Listed Water Quality Monitoring Stations

TMDL Development for the Murrell’s Inlet Estuary Introduction
TRN: 025-05 1-3 FINAL April 2005
Table 1-1 Water Quality Monitoring Stations in the Murrell’s Inlet Estuary on the 2004 303(d) List for Fecal Coliform
SCDHEC WQM Station WQM Station Locations
SCDHEC Shellfish Water Classification
Main Creek (HUC 03040207020) 04-01 Main Creek at Atlantic Avenue Bridge Restricted
04-01A Main Creek at Stanley Drive Restricted 04-27 Main Creek, Opposite Entrance to Mt. Gilead Canal Conditionally Approved 04-02 Main Creek at Mickey Spillane’s Home Conditionally Approved
Garden City Canal (HUC 03040207020) 04-26 Garden City Canal at the “Old Boat Wreck” Restricted
Parsonage Creek (HUC 03040207020) 04-08 Parsonage Creek at Nance’s Dock Restricted 04-16 Parsonage Creek at Chicken Farm Ditch Restricted
Allston Creek (HUC 03040207020) 04-06 Allston Creek at Weston Flat Restricted
Six of the eight stations listed in Table 1-1 are classified as Restricted, indicating that
shellfish harvesting for direct marketing is not allowed due to unpredictable fluctuations in water quality at these locations. Shellfish harvesting at Restricted stations is allowed only by special permit for the purposes of depuration and relaying. Two stations (04-02 and 04-27) are classified as Conditionally Approved, meaning these stations are subject to temporary fluctuations in water quality that generally occur under known circumstances (e.g., excessive rainfall). Wet weather sources have been identified as the general cause of the impairments at these stations and, thus, current management practices in Murrell’s Inlet include the closure of shellfish stations after 1 inch of rainfall has occurred over a 24-hour period (SCDHEC 2003b).
The purpose of this report is to establish pollutant load allocations for the impaired waterbodies listed in Table 1-1. This information will assist SCDHEC develop and implement a management plan to mitigate fecal coliform bacteria loadings and facilitate the re-opening of the shellfish harvesting beds in these waterbodies.
1.2 Watershed Description The Murrell’s Inlet system is a saltwater, tidally-dominated waterbody situated in the Pee
Dee River Basin along the northeastern shoreline of South Carolina (SCDHEC 2003b). This system is comprised of small meandering creeks that are characterized by ebb and flood tidal deltas, intertidal mudflats, intertidal oyster reefs, and high marshes. The system extends from Garden City in Horry County south to Huntington State Beach Park in Georgetown County and contains approximately 3,108 acres (71%) of the habitat suitable for shellfish production that exists within MA 04. For this reason, Murrell’s Inlet is considered the most economically important shellfish producing area along the northern coast of South Carolina (SCDHEC 2003b).
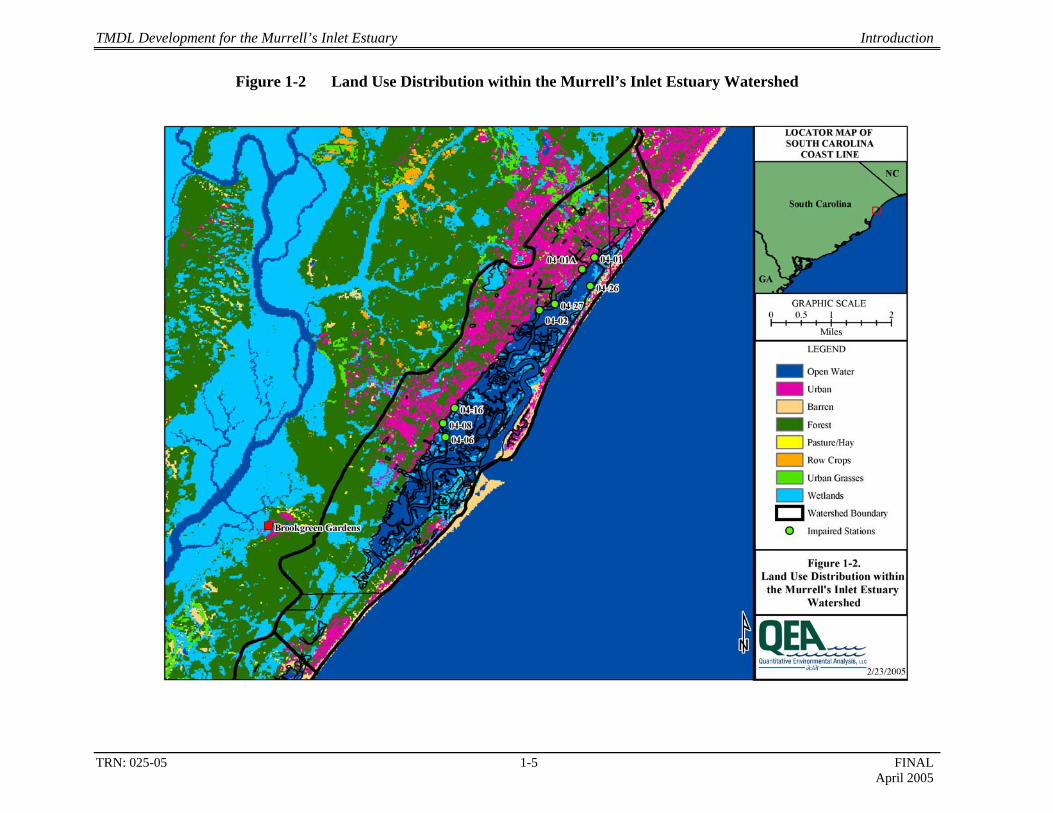
The Murrell’s Inlet system drains approximately 10,250 acres of land comprised of forest (31%), open water/beach (27%), urban buildup (24%), wetlands (16%), and urban/recreational grasses (2%) (Figure 1-2). Approximately 3,169 acres (31%) of the total watershed drain
TMDL Development for the Murrell’s Inlet Estuary Introduction
TRN: 025-05 1-4 FINAL April 2005
through the eight WQM stations listed on the 303(d) list. The general land use categories and associated acreages for the sub-watersheds draining through each of the WQM stations, as derived from 1992 United States Geological Survey (USGS) National Land Cover Data (NLCD) land use data, are presented in Table 1-2. The percentages that each land use constitutes within the respective sub-watersheds are presented in Table 1-3.
The estuary is approximately 5.5 nautical miles in length, has an average width of less than 1 nautical mile, and average main channel water depths of about 4 meters (SCDHEC 2003b). Salinity in the system is generally above 30 parts per thousand (ppt), as significant freshwater input to this area is generally limited to precipitation and resulting runoff. Annual precipitation for the region, as measured at Brookgreen Gardens (1993 to present), averages about 57 inches.
TMDL Development for the Murrell’s Inlet Estuary Introduction
TRN: 025-05 1-5 FINAL April 2005
Figure 1-2 Land Use Distribution within the Murrell’s Inlet Estuary Watershed

TMDL Development for the Murrell’s Inlet Estuary Introduction
TRN: 025-05 1-6 FINAL April 2005
Table 1-2 Land Use Distribution (in Acres) for the Sub-watersheds of the 303(d) Listed Water Quality Monitoring Stations within the Murrell’s Inlet Estuary
Acreages in Each Sub-Watershed Land Use Description 04-01 04-01A 04-27 04-02 04-26 04-16 04-08 04-06
Barren 41.7 2.8 0.4 0.8 66.8 0.6 0.0 0.6 Forest 352.9 148.4 63.0 54.4 1.4 89.8 66.7 89.2 Open water 17.7 60.6 80.0 43.3 63.0 6.2 3.0 65.0 Pasture/hay 14.3 7.2 2.0 0.4 0.8 1.0 0.0 1.0 Urban buildup 487.2 342.8 150.2 137.8 56.4 103.7 84.0 91.2 Urban grasses 59.2 52.8 4.4 2.8 2.6 0.8 2.4 2.0 Wetlands 103.5 24.2 6.8 9.3 44.6 27.4 10.5 16.7 Totals 1,076.5 638.8 306.8 248.8 235.6 229.5 166.6 265.7
Table 1-3 Land Use Distribution (in Percentages) for the Sub-watersheds of the 303(d) Listed Water Quality Monitoring Stations within the Murrell’s Inlet Estuary
Percentage in Each Sub-Watershed Land Use Description 04-01 04-01A 04-27 04-02 04-26 04-16 04-08 04-06
Barren 3.9 0.4 0.1 0.3 28.4 0.3 0.0 0.2 Forest 32.8 23.2 20.5 21.9 0.6 39.1 40.0 33.6 Open water 1.6 9.5 26.1 17.4 26.7 2.7 1.8 24.5 Pasture/hay 1.3 1.1 0.6 0.2 0.3 0.4 0.0 0.4 Urban buildup 45.3 53.7 49.1 55.3 24.0 45.3 50.5 34.3 Urban grasses 5.5 8.3 1.4 1.1 1.1 0.3 1.4 0.7 Wetlands 9.6 3.8 2.2 3.8 18.9 11.9 6.3 6.3 Totals 100.0 100.0 100.0 100.0 100.0 100.0 100.0 100.0
TMDL Development for the Murrell’s Inlet Estuary Water Quality Assessment
TRN: 025-05 2-1 FINAL April 2005
SECTION 2 WATER QUALITY ASSESSMENT
2.1 Assessment of Existing Water Quality Data A water quality assessment was performed for each impaired station using data obtained
from several sources, including:
• USEPA Watershed Characterization System (WCS) – land use type, stream characteristics, and locations of point source dischargers,
• USEPA STORET database – water quality monitoring information collected between September 2001 and August 2004,
• National Oceanic and Atmospheric Administration (NOAA) National Climactic Data Center (NCDC) – daily precipitation records for Brookgreen Gardens in Georgetown County, and
• NOAA National Ocean Service (NOS) – tide stage information.
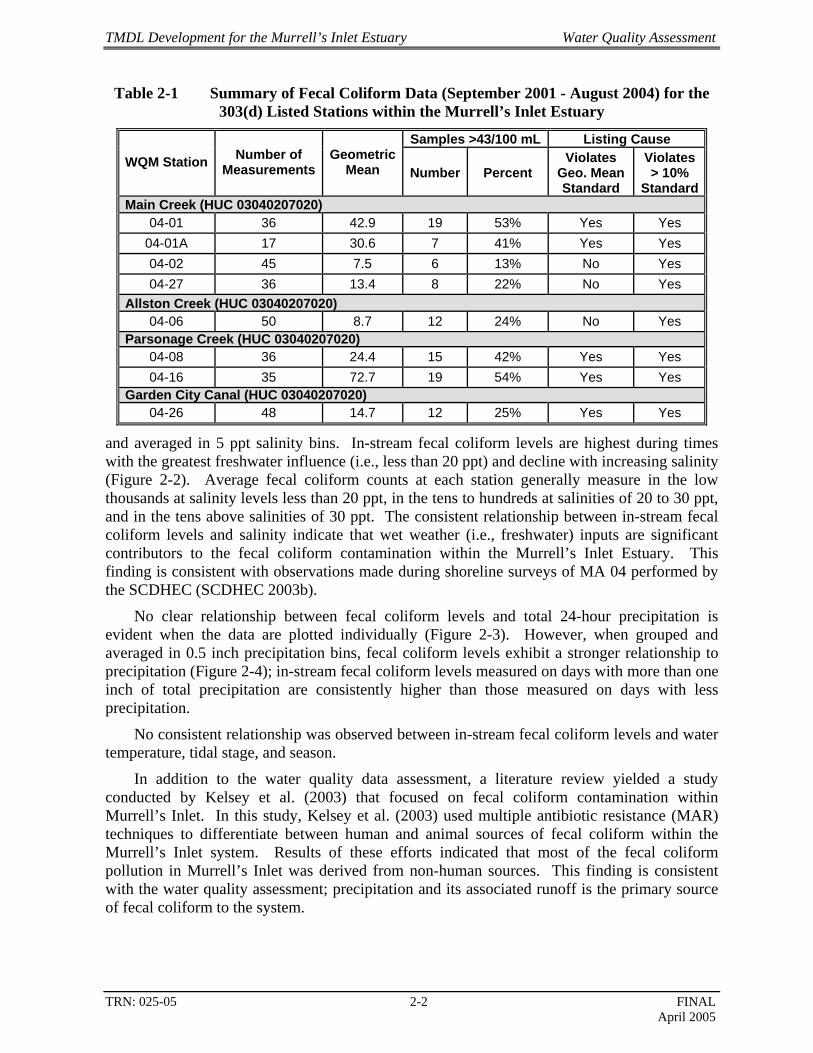
The water quality assessment focused on understanding: (1) which fecal coliform standard, the geometric mean or the no more than 10% exceedance, caused the listing; (2) the source(s) of the fecal coliform causing these exceedances; and (3) the relationships between measured fecal coliform levels and various environmental variables (e.g., precipitation, salinity). This assessment was performed using a weight-of-evidence approach. That is, all pertinent information was examined in a holistic fashion in order to understand water quality impacts associated with potential fecal coliform sources to and fecal coliform levels within the impaired systems; no one data set carried more weight than another. A summary of the water quality data collected for the three year period between September 2001 and August 2004 (since SCDHEC shellfish harvesting classifications are established using data from a three year period) and used in this assessment are provided for each impaired station in Table 2-1. Individual ambient fecal coliform bacteria measurements for each WQM station during this period are provided in Appendix A.
Eight stations within the Murrell’s Inlet system exceed the State’s water quality standards for fecal coliform (see Table 1-1). Five of the eight stations (04-01, 04-01A, 04-08, 04-16 and 04-26) are on the State’s Section 303(d) list because fecal coliform levels at these locations exceed both the geometric mean (i.e., 14/100 mL) and no more than 10% exceedance (43/100 mL) standards. The other three stations (04-02, 04-06, and 04-27) are listed as impaired because fecal coliform levels at these locations exceed the no more than 10% exceedance standard.
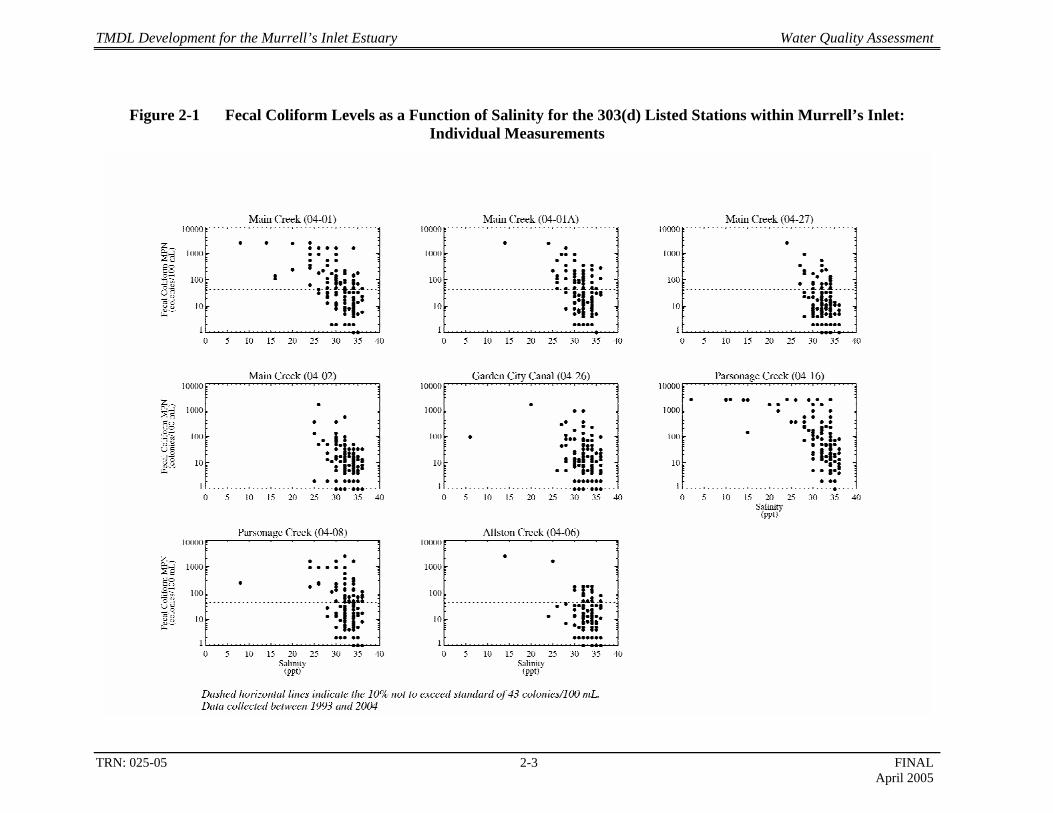
Relationships between measured in-stream fecal coliform levels and several environmental variables were examined to understand the conditions in which these fecal coliform exceedances occur. Environmental variables considered in this assessment included water temperature, tidal stage, total 24-hour precipitation, and salinity. Seasonal variations in fecal coliform levels were also examined. Individual fecal coliform measurements are presented as a function of salinity in Figure 2-1. Although variable, relationships between in-stream fecal coliform levels and salinity are evident. This trend is more evident in Figure 2-2, where in-stream fecal coliform measurements are grouped
TMDL Development for the Murrell’s Inlet Estuary Water Quality Assessment
TRN: 025-05 2-2 FINAL April 2005
Table 2-1 Summary of Fecal Coliform Data (September 2001 - August 2004) for the 303(d) Listed Stations within the Murrell’s Inlet Estuary
Samples >43/100 mL Listing Cause WQM Station Number of
Measurements Geometric
Mean Number Percent Violates
Geo. Mean Standard
Violates > 10%
StandardMain Creek (HUC 03040207020)
04-01 36 42.9 19 53% Yes Yes 04-01A 17 30.6 7 41% Yes Yes 04-02 45 7.5 6 13% No Yes 04-27 36 13.4 8 22% No Yes
Allston Creek (HUC 03040207020) 04-06 50 8.7 12 24% No Yes
Parsonage Creek (HUC 03040207020) 04-08 36 24.4 15 42% Yes Yes 04-16 35 72.7 19 54% Yes Yes
Garden City Canal (HUC 03040207020) 04-26 48 14.7 12 25% Yes Yes
and averaged in 5 ppt salinity bins. In-stream fecal coliform levels are highest during times with the greatest freshwater influence (i.e., less than 20 ppt) and decline with increasing salinity (Figure 2-2). Average fecal coliform counts at each station generally measure in the low thousands at salinity levels less than 20 ppt, in the tens to hundreds at salinities of 20 to 30 ppt, and in the tens above salinities of 30 ppt. The consistent relationship between in-stream fecal coliform levels and salinity indicate that wet weather (i.e., freshwater) inputs are significant contributors to the fecal coliform contamination within the Murrell’s Inlet Estuary. This finding is consistent with observations made during shoreline surveys of MA 04 performed by the SCDHEC (SCDHEC 2003b).
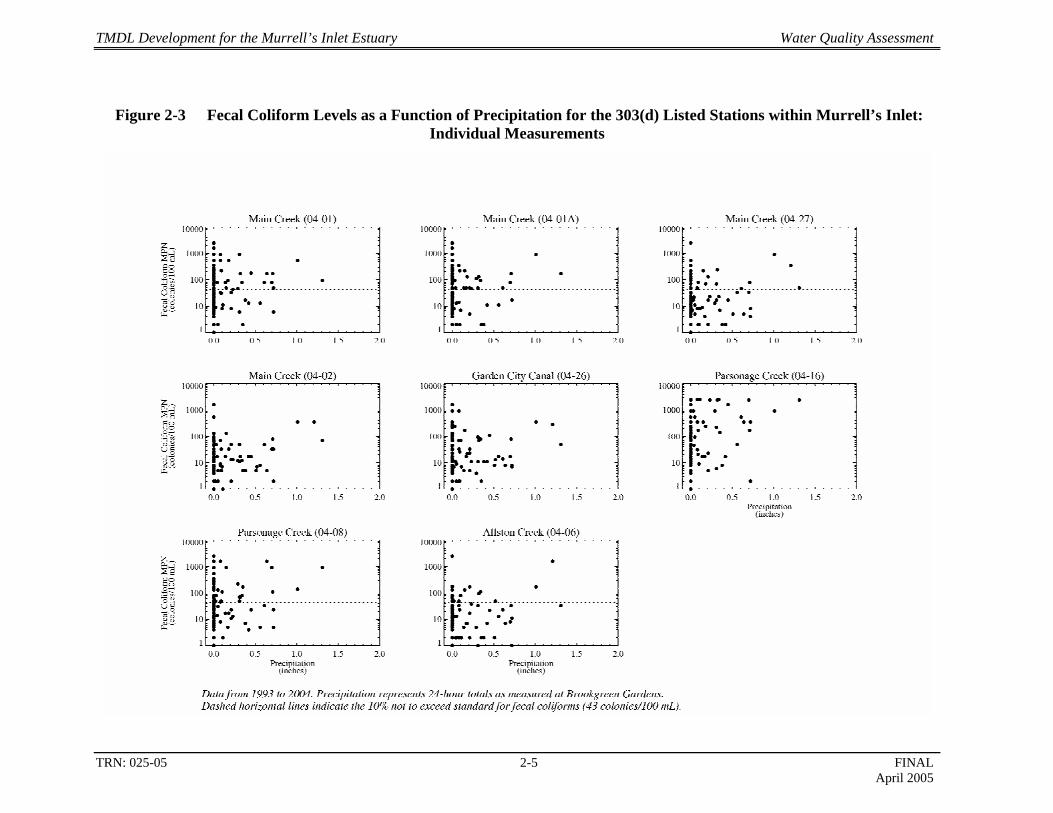
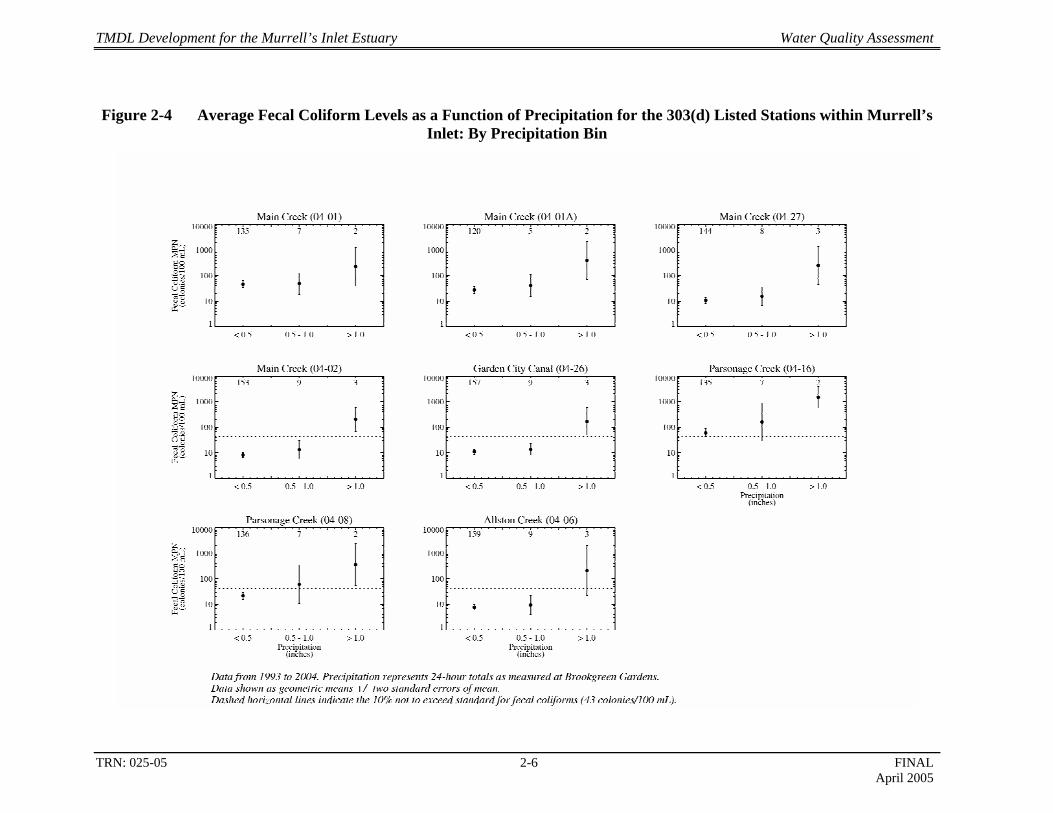
No clear relationship between fecal coliform levels and total 24-hour precipitation is evident when the data are plotted individually (Figure 2-3). However, when grouped and averaged in 0.5 inch precipitation bins, fecal coliform levels exhibit a stronger relationship to precipitation (Figure 2-4); in-stream fecal coliform levels measured on days with more than one inch of total precipitation are consistently higher than those measured on days with less precipitation.
No consistent relationship was observed between in-stream fecal coliform levels and water temperature, tidal stage, and season.
In addition to the water quality data assessment, a literature review yielded a study conducted by Kelsey et al. (2003) that focused on fecal coliform contamination within Murrell’s Inlet. In this study, Kelsey et al. (2003) used multiple antibiotic resistance (MAR) techniques to differentiate between human and animal sources of fecal coliform within the Murrell’s Inlet system. Results of these efforts indicated that most of the fecal coliform pollution in Murrell’s Inlet was derived from non-human sources. This finding is consistent with the water quality assessment; precipitation and its associated runoff is the primary source of fecal coliform to the system.
TMDL Development for the Murrell’s Inlet Estuary Water Quality Assessment
TRN: 025-05 2-3 FINAL April 2005
Figure 2-1 Fecal Coliform Levels as a Function of Salinity for the 303(d) Listed Stations within Murrell’s Inlet: Individual Measurements

TMDL Development for the Murrell’s Inlet Estuary Water Quality Assessment
TRN: 025-05 2-4 FINAL April 2005
Figure 2-2 Average Fecal Coliform Levels as a Function of Salinity for the 303(d) Listed Stations within Murrell’s Inlet: By Salinity Bin
TMDL Development for the Murrell’s Inlet Estuary Water Quality Assessment
TRN: 025-05 2-5 FINAL April 2005
Figure 2-3 Fecal Coliform Levels as a Function of Precipitation for the 303(d) Listed Stations within Murrell’s Inlet: Individual Measurements
TMDL Development for the Murrell’s Inlet Estuary Water Quality Assessment
TRN: 025-05 2-6 FINAL April 2005
Figure 2-4 Average Fecal Coliform Levels as a Function of Precipitation for the 303(d) Listed Stations within Murrell’s Inlet: By Precipitation Bin

TMDL Development for the Murrell’s Inlet Estuary Pollutant Source Assessment
TRN: 025-05 3-1 FINAL April 2005
SECTION 3 POLLUTANT SOURCE ASSESSMENT
Fecal coliform are bacteria that are present in the digestive tract of warm-blooded animals and are excreted in the feces. Although fecal coliform themselves do not generally pose a danger to humans and animals, their presence in waterbodies is indicative of other disease-causing bacteria and viruses. For this reason, fecal coliform bacteria are often used as indicators of the health of recreational, drinking and shellfish waters.
Fecal coliform bacteria enter surface water from both point and nonpoint sources. Point sources are discharges that originate from a single known location, such as pipes, outfalls and conveyance channels from either municipal or industrial wastewater treatment facilities. Facilities that discharge treated (removed) human waste are permitted through the National Pollutant Discharge Elimination System (NPDES) program, and are required to monitor fecal coliform bacteria in their effluent in accordance with their NPDES permit. Nonpoint sources are diffuse sources that originate and enter waterbodies from a relatively large area (i.e., cannot be attributable to a specific location). Nonpoint sources include various land activities that contribute fecal coliform bacteria to waterbodies as a result of runoff producing storm events. Potential point and nonpoint sources of fecal coliform contamination that may affect water quality within the Murrell’s Inlet estuary are discussed below.
As was done for the water quality assessment, the pollutant source assessment presented herein was performed using a weight-of-evidence approach. That is, all pertinent information was examined in a holistic fashion in order to understand water quality impacts associated with potential fecal coliform sources to the impaired systems; no one data set carried more weight than another.
3.1 Point Source Discharges Potential point sources of fecal contamination include permitted dischargers (e.g.,
wastewater and other NPDES-regulated dischargers), municipal separate storm sewer systems (MS4s), and marinas and docking facilities. Wastewater dischargers can contribute to fecal coliform pollution of a waterbody if disinfection processes at the facility are not properly maintained or the capacities of these systems are exceeded. MS4s collect stormwater runoff that may contain elevated levels of fecal coliform bacteria and convey this runoff directly to a waterbody during storm events. The accidental or intentional dumping of raw or poorly treated sewage in waters at marinas and docking facilities also can contribute to elevated fecal coliform levels within a waterbody.
3.1.1 Permitted Dischargers Two wastewater treatment facilities provide service to communities within MA 04: (1)
Grand Strand Water and Sewer Authority; and (2) Georgetown Water and Sewer Authority. Neither facility discharges directly within the Murrell’s Inlet estuary; however, both authorities manage lift stations within the watershed. Lift stations help in the transport of untreated and treated wastewater to the treatment and discharge locations outside of the watershed. The Grand Strand Water and Sewer Authority and Georgetown Water and Sewer Authority maintain approximately 45 and nine lift stations, respectively, within the watershed (Schwartz 2005; Hardy 2005).

TMDL Development for the Murrell’s Inlet Estuary Pollutant Source Assessment
TRN: 025-05 3-2 FINAL April 2005
Failure of these lift stations has the potential to adversely affect water quality in Murrell’s Inlet. In order to ensure adequate response in the event of lift station failure, the stations are provided with emergency power, audible and visual alarms, and telemetry systems which alert repair crews to any failure that could impact water quality. The lift stations within the Murrell’s Inlet watershed are not believed to be significant sources of fecal coliform contamination, as the SCDHEC has inspected the lift stations and has found them to be well maintained and in good working order (SCDHEC 2003b).
No NPDES-permitted dischargers exist in the Murrell’s Inlet estuary.
3.1.2 Municipal Separate Storm Sewer Systems (MS4s) In 1990, USEPA implemented the Phase I Stormwater NPDES program to regulate
discharges to local waterbodies associated with MS4s. These regulations categorized MS4s into three classifications, based on the populations each system serves: large; medium; or small. This phase of the program required large and medium MS4s to apply for NPDES permits; small MS4s were not regulated until 1999 when USEPA implemented the second phase (Phase II) of the program. Phase II extended regulation of the NPDES stormwater program to small MS4s (SCDHEC undated).
Two regulated small MS4s exist within the Murrell’s Inlet watershed: Horry County and Georgetown County. These municipalities were required to apply for stormwater NPDES permits on or before March 10, 2003 (SCDHEC undated), and develop a stormwater management program. The stormwater management programs are to be designed to reduce discharges of pollutants to the maximum extent practicable, protect water quality, and satisfy appropriate water quality requirements of the Clean Water Act.
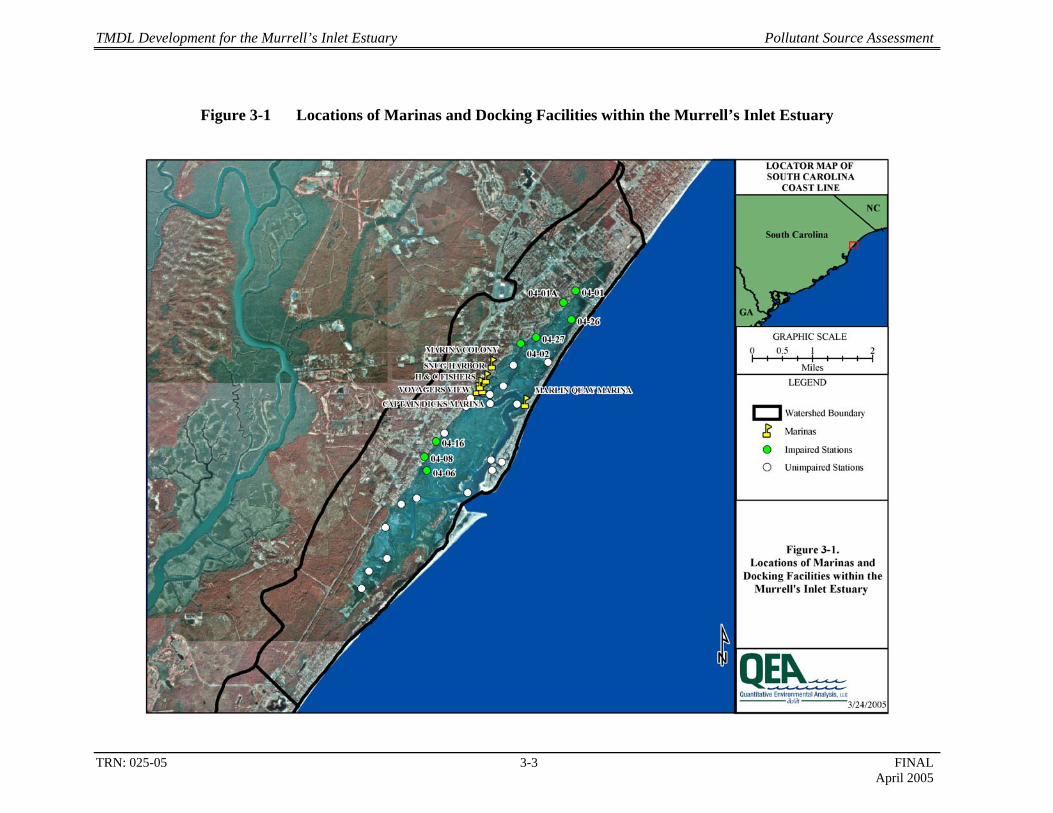
3.1.3 Marinas and Docking Facilities Several marinas and docking facilities are located within the Murrell’s Inlet Estuary
(Figure 3-1). However, as of March 2005 the Voyager’s View and H&C Fishers Marinas were closed (Shaw 2005). Boats are required to pump onboard septage out at designated pumping stations. Within Murrell’s Inlet, pumping stations exist at Captain Dick’s Marina. Septage collected at this pumping station by a septage hauler to a designated dumping ground (Shaw 2005).
The marinas are not believed to be significant sources of fecal contamination to Murrell’s Inlet. This is based on two observations: (1) the marinas are situated in and around several unimpaired WQM stations (i.e., stations where fecal coliform levels satisfy State water quality standards; see Figure 3-1), and (2) elevated fecal coliform levels are primarily observed during times of high freshwater inputs (precipitation in excess of 1 inch and low salinity; see Section 2). Additionally, marinas within Murrell’s Inlet are encompassed by a prohibited shellfish harvesting closure zone of approximately 1000 feet (SCDHEC 2004c).
TMDL Development for the Murrell’s Inlet Estuary Pollutant Source Assessment
TRN: 025-05 3-3 FINAL April 2005
Figure 3-1 Locations of Marinas and Docking Facilities within the Murrell’s Inlet Estuary
TMDL Development for the Murrell’s Inlet Estuary Pollutant Source Assessment
TRN: 025-05 3-4 FINAL April 2005
3.2 Nonpoint Sources Nonpoint sources are diffuse sources that originate and enter waterbodies from a relatively
large area (i.e., cannot be attributable to a specific location) and, thus, may originate from both rural and urbanized areas. Based on the land use distribution within the Murrell’s Inlet watershed, potential nonpoint sources of fecal coliform contamination include urban and suburban stormwater runoff, agricultural runoff, individual sewage treatment and disposal (ISTD) systems, wild and domestic animal populations, and boat traffic.
3.2.1 Urban and Suburban Runoff Stormwater runoff from urban and suburban areas not permitted under the MS4 program
has been identified as a significant problem within MA 04 due to the dense development of the surrounding area (SCDHEC 2003b). Undisturbed tracts of forested land exist within the watershed; however, an increase in the population density has resulted in the construction of single and multi-family housing developments, golf courses, shopping centers, and associated development (SCDHEC 2004c).
3.2.2 Agricultural Runoff Agricultural runoff is not considered a significant source of fecal coliform contamination
due to limited commercial crop production in the area and land use economics (SCDHEC 2004c).
3.2.3 Individual Sewage Treatment and Disposal Systems (ISTDs) Malfunctioning or improperly installed septic systems or ISTDs can serve as a source of
fecal coliform contamination to Murrell’s Inlet. ISTDs within MA 04 are generally being replaced by central sewer systems; however, three small areas bordering Main Creek in Murrell’s Inlet are not currently served by central sewer. Central sewer systems have less potential to impact shellfish harvesting waters than ISTDs, although occasional discharges of untreated wastewater to adjacent waterbodies can occur during system malfunctions (SCDHEC 2004c). A survey conducted by the State’s Division of Environmental Sanitation identified 119 active septic systems (of the 1869 visited), of which only two were described as malfunctioning (SCDHEC 2004c). Therefore, ISTDs are not believed to be significant sources of fecal coliform contamination to the system.
3.2.4 Wildlife Fecal coliform bacteria originating from domestic animals and wildlife accumulate on the
land surface and are transported to receiving waterbodies via runoff during precipitation events. The South Carolina Department of Natural Resources estimates that, where suitable habitat exists, there are between 15 and 30 white-tailed deer per square mile within the watershed (South Carolina Deer Density Map 2000). The watershed also contains suitable habitat for a wide variety of shorebirds. In addition, substantial populations of wildlife are supported within Brookgreen Gardens and Huntington Beach State Park. These areas support natural populations of rabbit, raccoon, opossum, rodents, songbirds, shorebirds and migratory waterfowl. Wildlife may be a significant source of fecal coliform, as runoff from these two areas discharges into the Murrell’s Inlet system (SCDHEC 2004c).
The predominant domestic animal populations within the watershed consist of dogs and cats, with a limited number of horses and goats (SCDHEC 2004c). Many of these animals spend at least a portion of their time outdoors and, therefore, can deposit fecal matter that is
TMDL Development for the Murrell’s Inlet Estuary Pollutant Source Assessment
TRN: 025-05 3-5 FINAL April 2005
then available to be washed into the waterbody during precipitation events. The national average for dog and cat ownership is 0.66 cats and 0.58 dogs per household (American Veterinary Medical Association 2004). Using these averages and the 1997 population estimates for the appropriate portions of Horry and Georgetown Counties located within the Murrell’s Inlet watershed, it is estimated that approximately 273 cats and 240 dogs reside within the watershed. Domestic pets are not believed to be a significant source of fecal coliform to the Murrell’s Inlet system.
3.2.5 Boat Traffic The number of marinas and docking facilities indicates there is substantial boat traffic in
Murrell’s Inlet. Onboard septage is required to be pumped out at marina pumping stations and discharge of onboard wastewater to the waterbodies in Murrell’s Inlet is strictly forbidden by law. Still illegal dumping of onboard septage is a potential source of fecal coliform to Murrell’ Inlet. However, correlations between fecal coliform levels and precipitation and salinity, coupled with the findings of the Kelsey et al. (2003) study, suggest that illegal dumping of onboard septage is not a significant source of contamination to the system.
3.3 Summary of Fecal Coliform Sources and Impaired WQM Stations The available water quality data indicate that five of the eight WQM stations are on the
Section 303(d) list due to exceedances of the geometric mean standard, while all eight stations violate the no more than 10% exceedance standard. Relationships between in-stream fecal coliform levels and salinity, in-stream fecal coliform levels and precipitation, and the lack of major point sources of fecal coliform pollution within the watershed, indicate that stormwater runoff from nonpoint sources are the primary contributors to fecal coliform contamination in the impaired waterbodies. Studies conducted by Kelsey et al. (2003) indicate that this fecal coliform contamination is derived primarily from animal, not human, sources.
TMDL Development for the Murrell’s Inlet Estuary Source Load Assessment
TRN: 025-05 4-1 FINAL April 2005
SECTION 4 SOURCE LOAD ASSESSMENT
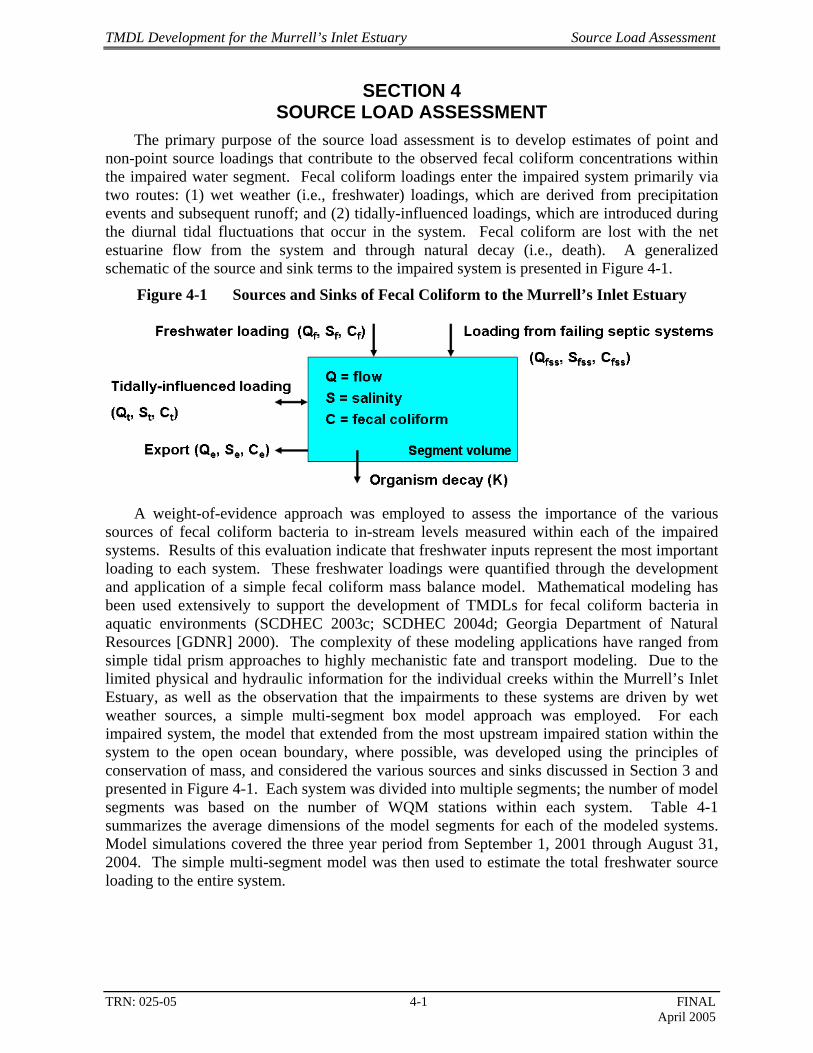
The primary purpose of the source load assessment is to develop estimates of point and non-point source loadings that contribute to the observed fecal coliform concentrations within the impaired water segment. Fecal coliform loadings enter the impaired system primarily via two routes: (1) wet weather (i.e., freshwater) loadings, which are derived from precipitation events and subsequent runoff; and (2) tidally-influenced loadings, which are introduced during the diurnal tidal fluctuations that occur in the system. Fecal coliform are lost with the net estuarine flow from the system and through natural decay (i.e., death). A generalized schematic of the source and sink terms to the impaired system is presented in Figure 4-1.
Figure 4-1 Sources and Sinks of Fecal Coliform to the Murrell’s Inlet Estuary
A weight-of-evidence approach was employed to assess the importance of the various
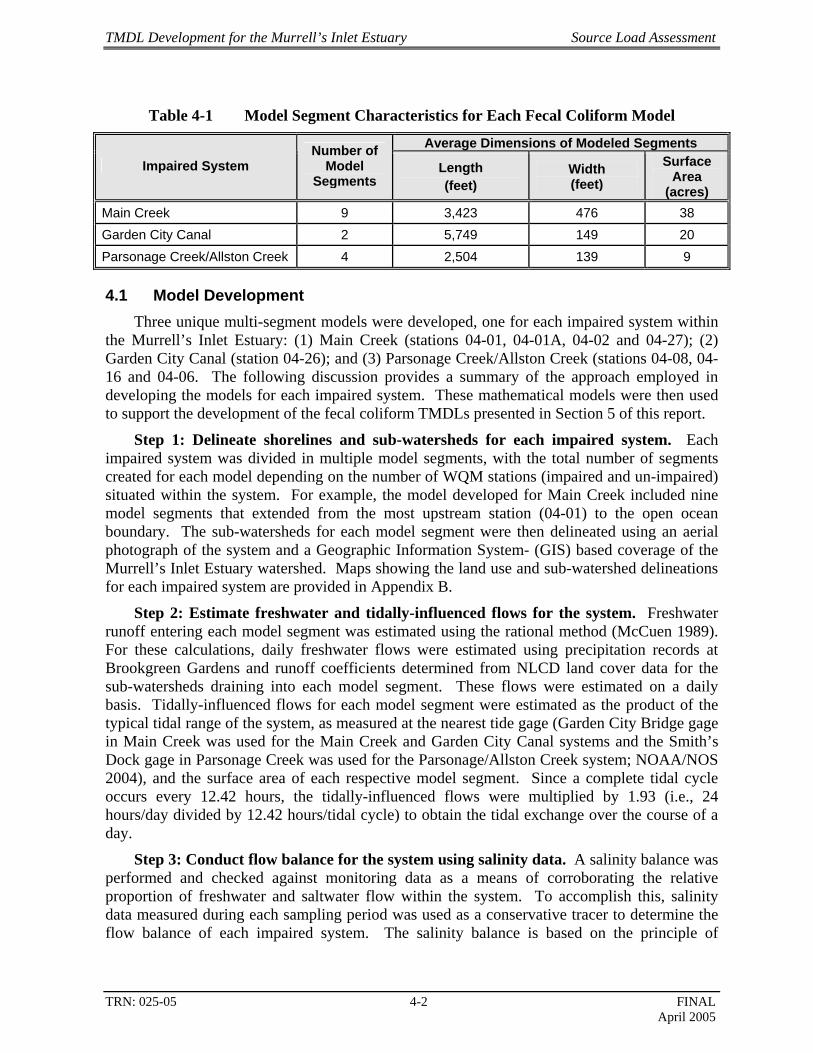
sources of fecal coliform bacteria to in-stream levels measured within each of the impaired systems. Results of this evaluation indicate that freshwater inputs represent the most important loading to each system. These freshwater loadings were quantified through the development and application of a simple fecal coliform mass balance model. Mathematical modeling has been used extensively to support the development of TMDLs for fecal coliform bacteria in aquatic environments (SCDHEC 2003c; SCDHEC 2004d; Georgia Department of Natural Resources [GDNR] 2000). The complexity of these modeling applications have ranged from simple tidal prism approaches to highly mechanistic fate and transport modeling. Due to the limited physical and hydraulic information for the individual creeks within the Murrell’s Inlet Estuary, as well as the observation that the impairments to these systems are driven by wet weather sources, a simple multi-segment box model approach was employed. For each impaired system, the model that extended from the most upstream impaired station within the system to the open ocean boundary, where possible, was developed using the principles of conservation of mass, and considered the various sources and sinks discussed in Section 3 and presented in Figure 4-1. Each system was divided into multiple segments; the number of model segments was based on the number of WQM stations within each system. Table 4-1 summarizes the average dimensions of the model segments for each of the modeled systems. Model simulations covered the three year period from September 1, 2001 through August 31, 2004. The simple multi-segment model was then used to estimate the total freshwater source loading to the entire system.
TMDL Development for the Murrell’s Inlet Estuary Source Load Assessment
TRN: 025-05 4-2 FINAL April 2005
Table 4-1 Model Segment Characteristics for Each Fecal Coliform Model
Average Dimensions of Modeled Segments Impaired System
Number of Model
Segments Length (feet)
Width (feet)
Surface Area
(acres) Main Creek 9 3,423 476 38 Garden City Canal 2 5,749 149 20 Parsonage Creek/Allston Creek 4 2,504 139 9
4.1 Model Development Three unique multi-segment models were developed, one for each impaired system within
the Murrell’s Inlet Estuary: (1) Main Creek (stations 04-01, 04-01A, 04-02 and 04-27); (2) Garden City Canal (station 04-26); and (3) Parsonage Creek/Allston Creek (stations 04-08, 04-16 and 04-06. The following discussion provides a summary of the approach employed in developing the models for each impaired system. These mathematical models were then used to support the development of the fecal coliform TMDLs presented in Section 5 of this report.
Step 1: Delineate shorelines and sub-watersheds for each impaired system. Each impaired system was divided in multiple model segments, with the total number of segments created for each model depending on the number of WQM stations (impaired and un-impaired) situated within the system. For example, the model developed for Main Creek included nine model segments that extended from the most upstream station (04-01) to the open ocean boundary. The sub-watersheds for each model segment were then delineated using an aerial photograph of the system and a Geographic Information System- (GIS) based coverage of the Murrell’s Inlet Estuary watershed. Maps showing the land use and sub-watershed delineations for each impaired system are provided in Appendix B.
Step 2: Estimate freshwater and tidally-influenced flows for the system. Freshwater runoff entering each model segment was estimated using the rational method (McCuen 1989). For these calculations, daily freshwater flows were estimated using precipitation records at Brookgreen Gardens and runoff coefficients determined from NLCD land cover data for the sub-watersheds draining into each model segment. These flows were estimated on a daily basis. Tidally-influenced flows for each model segment were estimated as the product of the typical tidal range of the system, as measured at the nearest tide gage (Garden City Bridge gage in Main Creek was used for the Main Creek and Garden City Canal systems and the Smith’s Dock gage in Parsonage Creek was used for the Parsonage/Allston Creek system; NOAA/NOS 2004), and the surface area of each respective model segment. Since a complete tidal cycle occurs every 12.42 hours, the tidally-influenced flows were multiplied by 1.93 (i.e., 24 hours/day divided by 12.42 hours/tidal cycle) to obtain the tidal exchange over the course of a day.
Step 3: Conduct flow balance for the system using salinity data. A salinity balance was performed and checked against monitoring data as a means of corroborating the relative proportion of freshwater and saltwater flow within the system. To accomplish this, salinity data measured during each sampling period was used as a conservative tracer to determine the flow balance of each impaired system. The salinity balance is based on the principle of
TMDL Development for the Murrell’s Inlet Estuary Source Load Assessment
TRN: 025-05 4-3 FINAL April 2005
conservation of mass; the mass of salt in each model segment (QeSe) must equal the mass of salt entering the model segment (in freshwater runoff [QfSf] and incoming tides [QtiSti]) minus the mass of salt leaving the model segment (in the outgoing tide [QtoSto]). The salinity balance calculation is represented mathematically as:
QeSe = QfSf + QtiSti - QtoSto (4-1) where: Qe = net estuarine (i.e., export) flow (L3 T-1)
Qf = freshwater flow (L3 T-1)
Qti = tidally-influenced flow into the model segment (L3 T-1)
Qto = tidally-influenced flow out of the model segment (L3 T-1)
Se = salinity of net estuarine flow (M L-3)
Sf = salinity of freshwater inputs (M L-3)
Sti = salinity of tidally-influenced flow into the model segment (M L-3)
Sto = salinity of tidally-influenced flow out of the model segment (M L-3)
The freshwater (Qf) and tidally-influenced (Qti and Qto) flows estimated in Step 2 above were used in the salinity balance. Salinity (Sf) in the freshwater flow was set to zero since this component is the direct result of precipitation. The average salinity measured at each of the WQM stations was used to define the initial salinity level in each model segments. A salinity of 35 ppt was assumed for the downstream boundary (i.e., ocean). The export flow (Qe) was computed as the sum of the freshwater and tidally-influenced flows (i.e., Qf + Qti - Qto). Using the above information, Equation 4-1 was solved for the salinity in the export flow (Se). The computed salinity levels were then compared to the salinity measurements collected at each WQM station within the system to ensure flows within the system were accurately represented.
Step 4: Conduct mass balance for fecal coliform. Upon corroboration of the salinity balance, a mass balance on fecal coliform within the system was computed. The number of fecal coliform in each model segment (QeCe) was computed as the number of fecal coliform entering the model segment (in the freshwater runoff from nonpoint source areas [QfCf], incoming tides [QtiCti], and seepage from failing septic systems [QfssCfss]) minus the number of fecal coliform leaving the model segment (lost due to decay [KVCe] and leaving in the outgoing tide [QtoCto]). The mass balance calculation is represented mathematically as:
QeCe = (QtiCti - QtoCto) + QfCf + QfssCfss - KVCe (4-2) where: Qe = net estuarine flow determined by the flow balance (L3 T-1)
Qti = tidally-influenced flow into the model segment (L3 T-1)
Qto = tidally-influenced flow out of the model segment (L3 T-1)
Qf = freshwater flow (L3 T-1)
Qfss = seepage flow from failing septic systems (L3 T-1)
Ce = fecal coliform level in net estuarine flow (M L-3)
Cti = fecal coliform level in tidally-influenced flow entering the model segment (M L-3)
Cto = fecal coliform level in tidally-influenced flow leaving the model segment
TMDL Development for the Murrell’s Inlet Estuary Source Load Assessment
TRN: 025-05 4-4 FINAL April 2005
(M L-3)
Cf = fecal coliform level in freshwater flow (M L-3)
Cfss = fecal coliform level in seepage flow from failing septic systems (M L-3)
K = fecal coliform decay rate (T-1)
V = volume of model segment (L3)
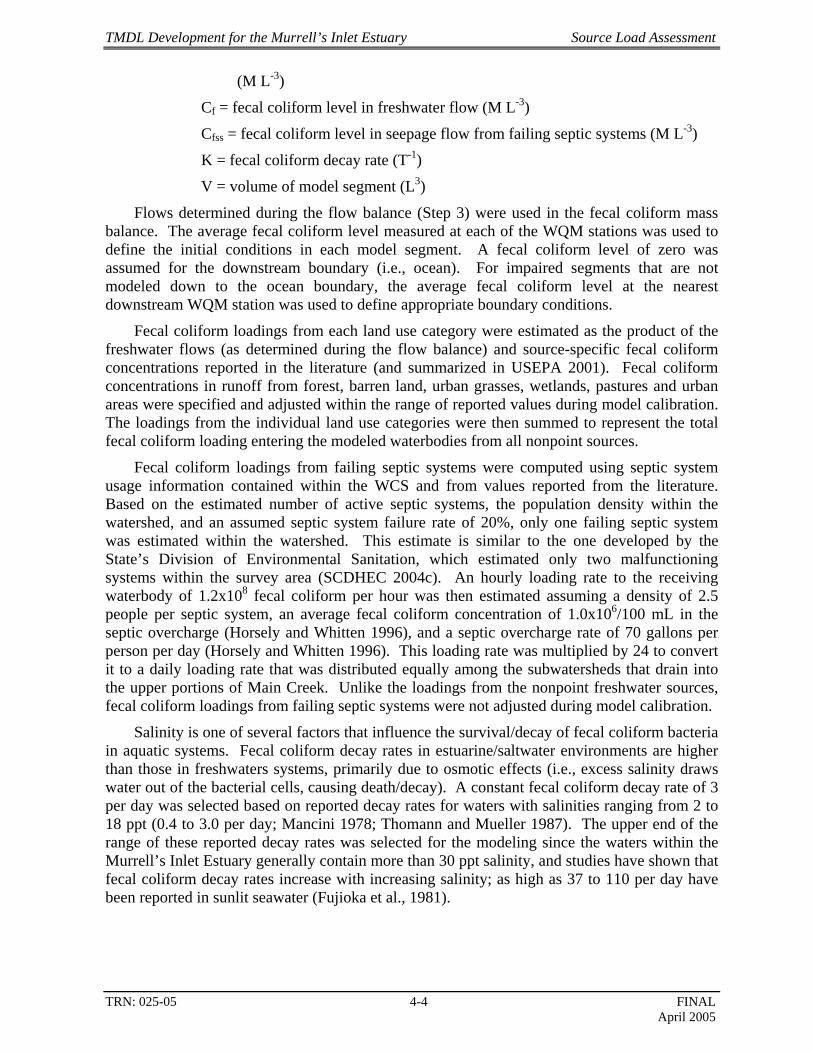
Flows determined during the flow balance (Step 3) were used in the fecal coliform mass balance. The average fecal coliform level measured at each of the WQM stations was used to define the initial conditions in each model segment. A fecal coliform level of zero was assumed for the downstream boundary (i.e., ocean). For impaired segments that are not modeled down to the ocean boundary, the average fecal coliform level at the nearest downstream WQM station was used to define appropriate boundary conditions.
Fecal coliform loadings from each land use category were estimated as the product of the freshwater flows (as determined during the flow balance) and source-specific fecal coliform concentrations reported in the literature (and summarized in USEPA 2001). Fecal coliform concentrations in runoff from forest, barren land, urban grasses, wetlands, pastures and urban areas were specified and adjusted within the range of reported values during model calibration. The loadings from the individual land use categories were then summed to represent the total fecal coliform loading entering the modeled waterbodies from all nonpoint sources.
Fecal coliform loadings from failing septic systems were computed using septic system usage information contained within the WCS and from values reported from the literature. Based on the estimated number of active septic systems, the population density within the watershed, and an assumed septic system failure rate of 20%, only one failing septic system was estimated within the watershed. This estimate is similar to the one developed by the State’s Division of Environmental Sanitation, which estimated only two malfunctioning systems within the survey area (SCDHEC 2004c). An hourly loading rate to the receiving waterbody of 1.2x10⁸ fecal coliform per hour was then estimated assuming a density of 2.5 people per septic system, an average fecal coliform concentration of 1.0x10⁶/100 mL in the septic overcharge (Horsely and Whitten 1996), and a septic overcharge rate of 70 gallons per person per day (Horsely and Whitten 1996). This loading rate was multiplied by 24 to convert it to a daily loading rate that was distributed equally among the subwatersheds that drain into the upper portions of Main Creek. Unlike the loadings from the nonpoint freshwater sources, fecal coliform loadings from failing septic systems were not adjusted during model calibration.
Salinity is one of several factors that influence the survival/decay of fecal coliform bacteria in aquatic systems. Fecal coliform decay rates in estuarine/saltwater environments are higher than those in freshwaters systems, primarily due to osmotic effects (i.e., excess salinity draws water out of the bacterial cells, causing death/decay). A constant fecal coliform decay rate of 3 per day was selected based on reported decay rates for waters with salinities ranging from 2 to 18 ppt (0.4 to 3.0 per day; Mancini 1978; Thomann and Mueller 1987). The upper end of the range of these reported decay rates was selected for the modeling since the waters within the Murrell’s Inlet Estuary generally contain more than 30 ppt salinity, and studies have shown that fecal coliform decay rates increase with increasing salinity; as high as 37 to 110 per day have been reported in sunlit seawater (Fujioka et al., 1981).
TMDL Development for the Murrell’s Inlet Estuary Source Load Assessment
TRN: 025-05 4-5 FINAL April 2005
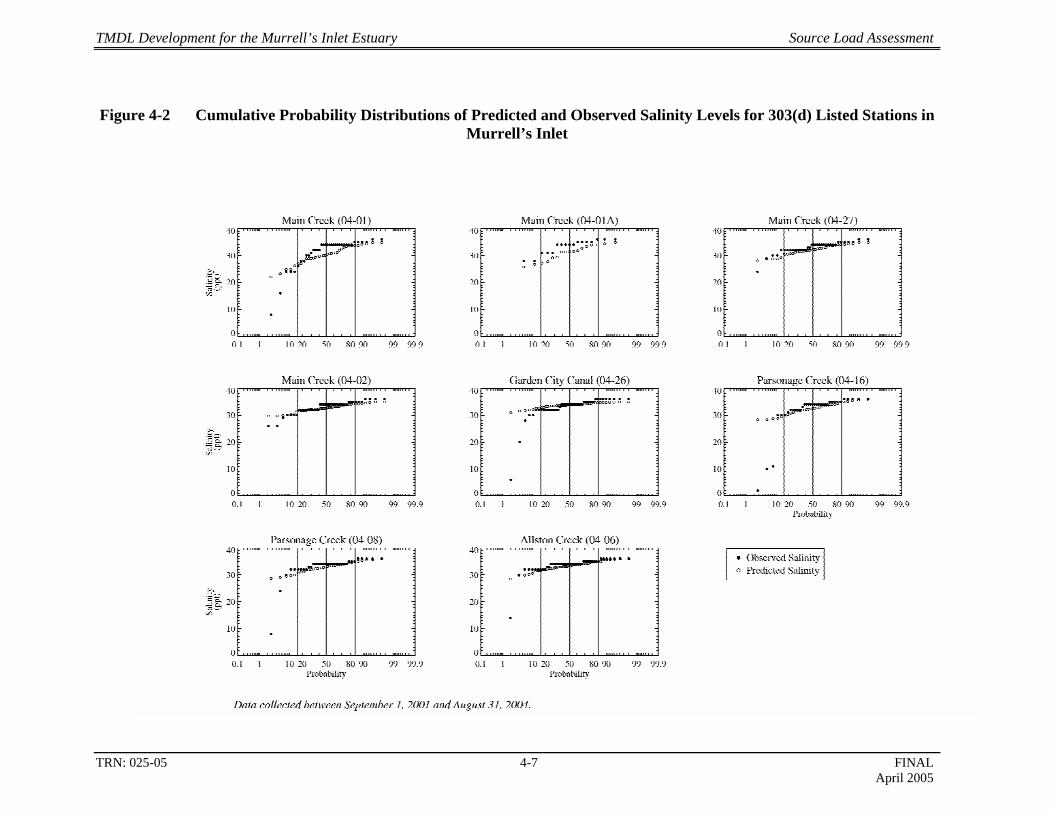
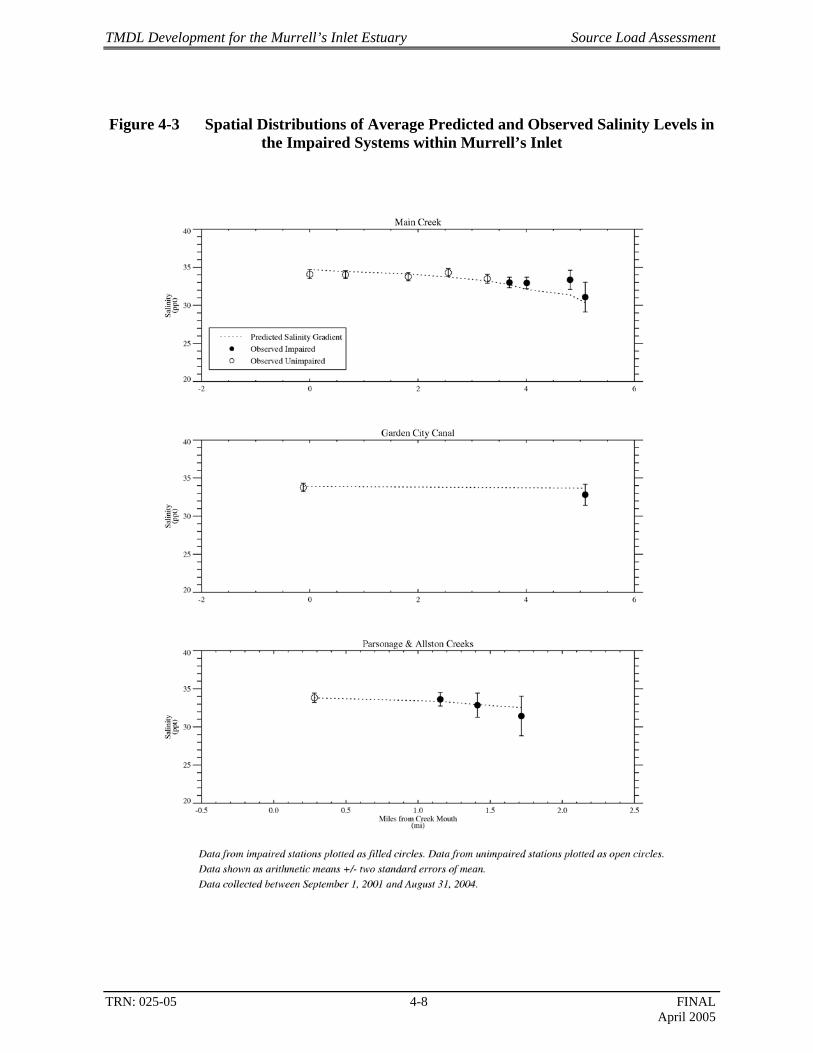
4.2 Model Calibration The first step to model calibration consisted of comparing predicted and observed salinities
to ensure that the freshwater flows within the system were accurately represented. Cumulative probability distributions of measured and predicted salinity levels for each impaired station are compared in Figure 4-2. Comparisons of the spatial distributions of average predicted and observed salinity for each impaired system are provided in Figure 4-3. These comparisons indicated that the flow balance for each system, as described in Step 3 above, yields salinities that compare well to the observed salinities, and captures the observed salinity gradient within each of the impaired systems. For this reason, the estimated freshwater flows to the system were deemed realistic and the flow balance was considered calibrated. Time series of observed and predicted salinity levels for each impaired WQM station are provided in Appendix C.
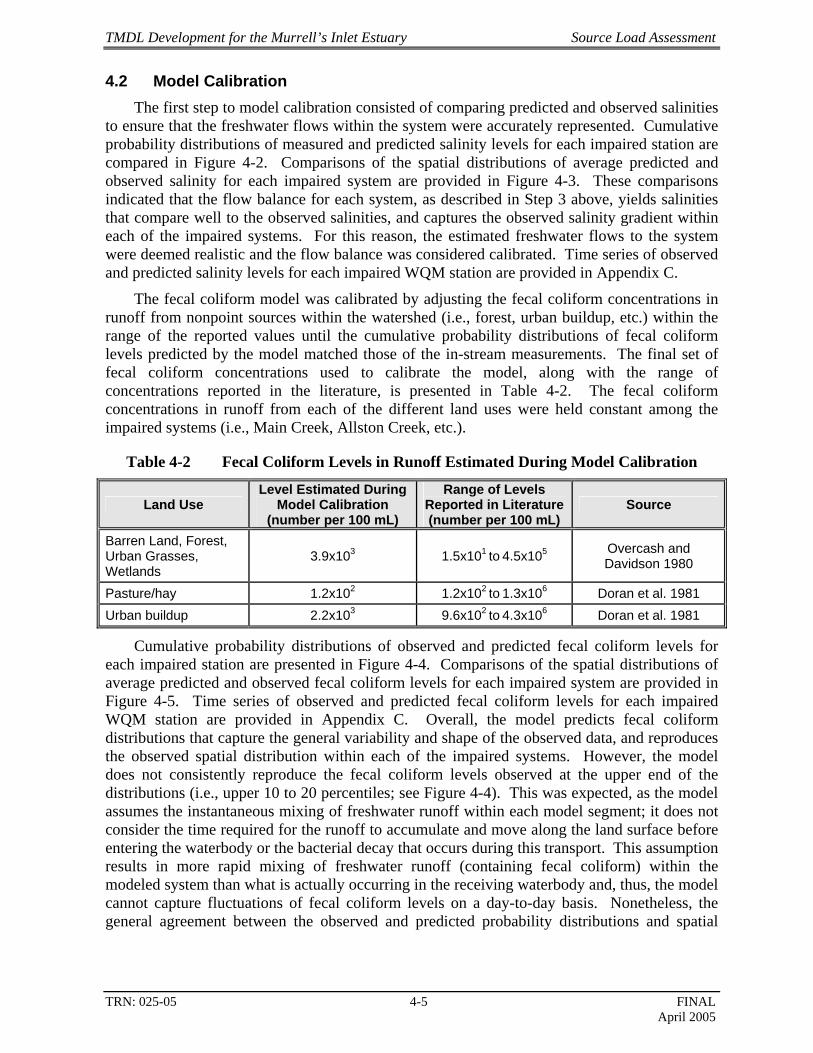
The fecal coliform model was calibrated by adjusting the fecal coliform concentrations in runoff from nonpoint sources within the watershed (i.e., forest, urban buildup, etc.) within the range of the reported values until the cumulative probability distributions of fecal coliform levels predicted by the model matched those of the in-stream measurements. The final set of fecal coliform concentrations used to calibrate the model, along with the range of concentrations reported in the literature, is presented in Table 4-2. The fecal coliform concentrations in runoff from each of the different land uses were held constant among the impaired systems (i.e., Main Creek, Allston Creek, etc.).
Table 4-2 Fecal Coliform Levels in Runoff Estimated During Model Calibration
Land Use Level Estimated During
Model Calibration (number per 100 mL)
Range of Levels Reported in Literature (number per 100 mL)
Source
Barren Land, Forest, Urban Grasses, Wetlands
3.9x10³ 1.5x101 to 4.5x10⁵ Overcash and Davidson 1980
Pasture/hay 1.2x10² 1.2x10² to 1.3x10⁶ Doran et al. 1981 Urban buildup 2.2x10³ 9.6x10² to 4.3x10⁶ Doran et al. 1981
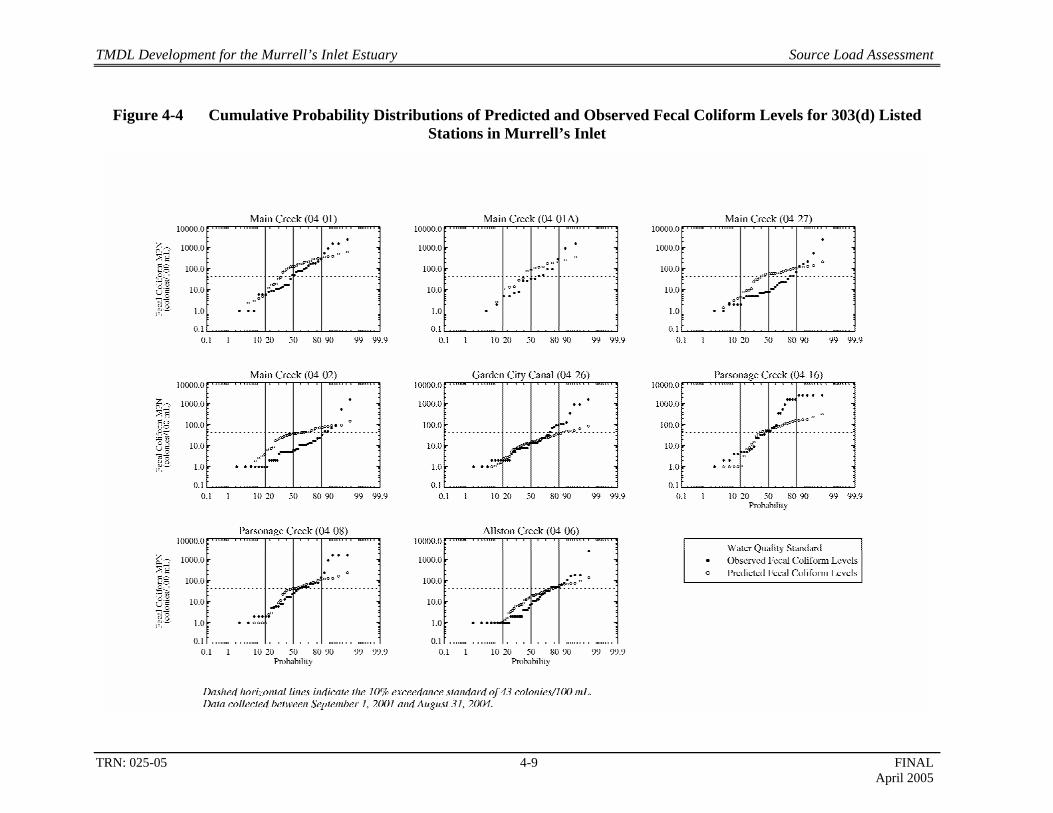
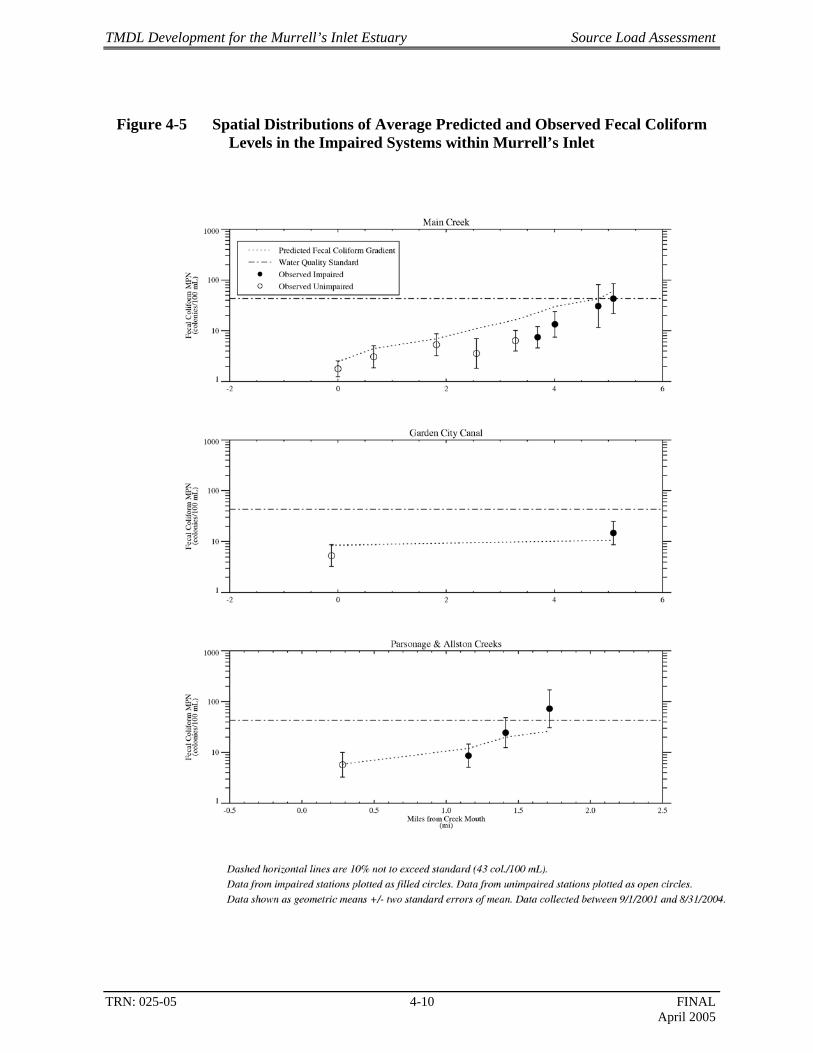
Cumulative probability distributions of observed and predicted fecal coliform levels for each impaired station are presented in Figure 4-4. Comparisons of the spatial distributions of average predicted and observed fecal coliform levels for each impaired system are provided in Figure 4-5. Time series of observed and predicted fecal coliform levels for each impaired WQM station are provided in Appendix C. Overall, the model predicts fecal coliform distributions that capture the general variability and shape of the observed data, and reproduces the observed spatial distribution within each of the impaired systems. However, the model does not consistently reproduce the fecal coliform levels observed at the upper end of the distributions (i.e., upper 10 to 20 percentiles; see Figure 4-4). This was expected, as the model assumes the instantaneous mixing of freshwater runoff within each model segment; it does not consider the time required for the runoff to accumulate and move along the land surface before entering the waterbody or the bacterial decay that occurs during this transport. This assumption results in more rapid mixing of freshwater runoff (containing fecal coliform) within the modeled system than what is actually occurring in the receiving waterbody and, thus, the model cannot capture fluctuations of fecal coliform levels on a day-to-day basis. Nonetheless, the general agreement between the observed and predicted probability distributions and spatial
TMDL Development for the Murrell’s Inlet Estuary Source Load Assessment
TRN: 025-05 4-6 FINAL April 2005
gradients indicates the model is a useful tool for evaluating achievement of the WQS under average conditions.
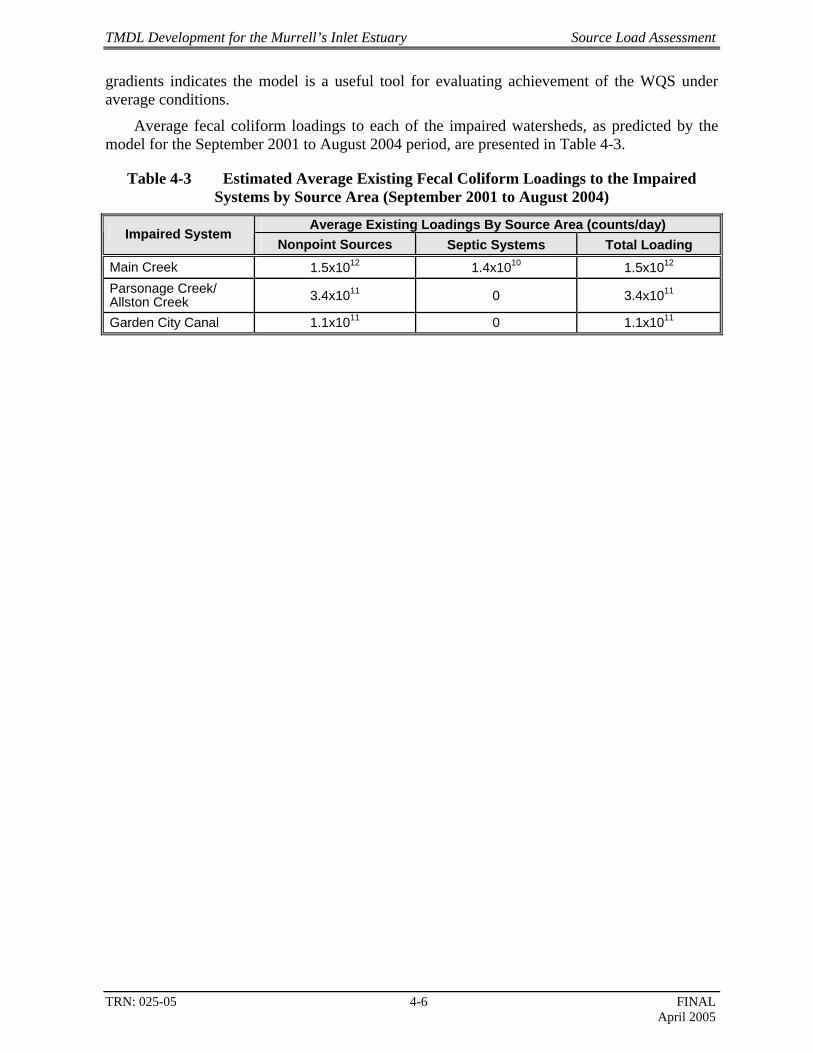
Average fecal coliform loadings to each of the impaired watersheds, as predicted by the model for the September 2001 to August 2004 period, are presented in Table 4-3.
Table 4-3 Estimated Average Existing Fecal Coliform Loadings to the Impaired Systems by Source Area (September 2001 to August 2004)
Average Existing Loadings By Source Area (counts/day) Impaired System
Nonpoint Sources Septic Systems Total Loading Main Creek 1.5x10¹² 1.4x10¹⁰ 1.5x10¹² Parsonage Creek/ Allston Creek 3.4x10¹¹ 0 3.4x10¹¹
Garden City Canal 1.1x10¹¹ 0 1.1x10¹¹
TMDL Development for the Murrell’s Inlet Estuary Source Load Assessment
TRN: 025-05 4-7 FINAL April 2005
Figure 4-2 Cumulative Probability Distributions of Predicted and Observed Salinity Levels for 303(d) Listed Stations in Murrell’s Inlet
TMDL Development for the Murrell’s Inlet Estuary Source Load Assessment
TRN: 025-05 4-8 FINAL April 2005
Figure 4-3 Spatial Distributions of Average Predicted and Observed Salinity Levels in the Impaired Systems within Murrell’s Inlet
TMDL Development for the Murrell’s Inlet Estuary Source Load Assessment
TRN: 025-05 4-9 FINAL April 2005
Figure 4-4 Cumulative Probability Distributions of Predicted and Observed Fecal Coliform Levels for 303(d) Listed Stations in Murrell’s Inlet
TMDL Development for the Murrell’s Inlet Estuary Source Load Assessment
TRN: 025-05 4-10 FINAL April 2005
Figure 4-5 Spatial Distributions of Average Predicted and Observed Fecal Coliform Levels in the Impaired Systems within Murrell’s Inlet
TMDL Development for the Murrell’s Inlet Estuary TMDL Calculations
TRN: 025-05 5-1 FINAL April 2005
SECTION 5 TMDL CALCULATIONS
5.1 TMDLs A TMDL is the maximum amount of pollutant that can be assimilated by a receiving
waterbody without exceeding WQS, and consists of the sum of individual waste load allocations (WLAs) for point sources and load allocations (LAs) for both non-point sources and background levels. In addition, the TMDL must include a margin of safety (MOS) to account for the uncertainty associated with the relationship between pollutant loading and receiving water quality. This relationship is illustrated mathematically in Equation 5-1.
TMDL = Σ WLA + Σ LA + MOS (5-1)
The objective of the TMDL is to estimate allowable pollutant loads and to allocate these loads to the known pollutant sources in the watershed so the appropriate control measures can be implemented and the WQS achieved. 40 CFR §130.2 (1) states that TMDLs can be expressed in terms of mass per time, toxicity, or other appropriate measure. For fecal coliform, TMDLs are expressed as colony forming units (cfu) per day, where possible, or as percent reductions, and represent the maximum 1-day load which the stream can assimilate and still maintain the water quality criterion.
TMDLs for each impaired watershed were developed by estimating the reductions in fecal coliform loadings predicted by the model (as described in Section 4) needed to achieve the geometric mean standard at each impaired station. Due to the tidal nature of the Murrell’s Inlet Estuary, which results in the upstream movement of fecal coliform bacteria through the system with the tidal flows, this evaluation was performed on a watershed basis. That is, a single percent reduction was assigned to a watershed having multiple impaired stations such that the prescribed reduction results in the attainment of water quality standards at all stations within the system. Similarly, cumulative probability distributions of the measured fecal coliform data for each of the impaired WQM stations were used to determine average percent reductions in instantaneous source loadings to the system needed to satisfy the not to exceed 10% standard. In both instances, an explicit MOS of 5% was assumed. The more stringent (i.e., higher) of the two percent reductions for each watershed was then selected in the final TMDL determination to ensure that both State standards will be achieved.
5.2 Critical Conditions USEPA regulations at 40 CFR 130.7(c) (1) require TMDLs to take into account critical
conditions for stream flow, loading and water quality parameters. Critical conditions are used in the TMDL evaluation to ensure that established uses of the stream are protected. Six of the eight stations within Murrell’s Inlet are classified as Restricted, five exceed the geometric mean standard of 14/100 mL, and all violate the not to exceed 10% standard of 43/100 mL. This suggests that critical conditions for fecal coliform at these locations occur over a range of flow conditions. Therefore, for the purposes of establishing TMDLs for the impaired stations, critical conditions were defined as periods of low tidal flows, which result in the least amount of dilution of fecal coliform entering the system. For the TMDL determination, the 10th
TMDL Development for the Murrell’s Inlet Estuary TMDL Calculations
TRN: 025-05 5-2 FINAL April 2005
percentile values of the daily tidally-influenced flows computed during the flow balance (from the NOS tide data) were used to define critical conditions.
5.3 Waste Load Allocation No NPDES-permitted dischargers exist in the Murrell’s Inlet Estuary and, therefore, the
WLA is zero. Two regulated small MS4s exist within the Murrell’s Inlet watershed: Horry County and Georgetown County. No MS4-specific fecal coliform stormwater data are available and, therefore, the WLA is expressed as a percent reduction goal. Each MS4 was assigned a percent reduction goal equal to the percent reduction goal identified in the LA for each WQM station (see Table 5-1). Since these municipalities will be covered under their respective NPDES Phase II stormwater permits, compliance with the terms of their individual MS4 permits will fulfill any obligations they have toward implementing this TMDL.
5.4 Load Allocation Nonpoint fecal coliform loading to the receiving streams of each WQM station originate
from various sources. These nonpoint source loadings were estimated using the mass balance approach described in Section 4. The fact that many of the WQM stations exceed the geometric mean standard indicates that evaluating mean source inputs (i.e., under mean conditions) via the mass balance approach may be sufficient to ascribe load allocations for many, but not all, of the affected waters. Model calibration results discussed in Section 4.2 indicate the model is limited in terms of its ability to address exceedances caused by instantaneous inputs to the stations where the no more than 10% exceedance standard is not met. Therefore, a two-pronged approach to the load allocation component of the TMDL determination was employed.
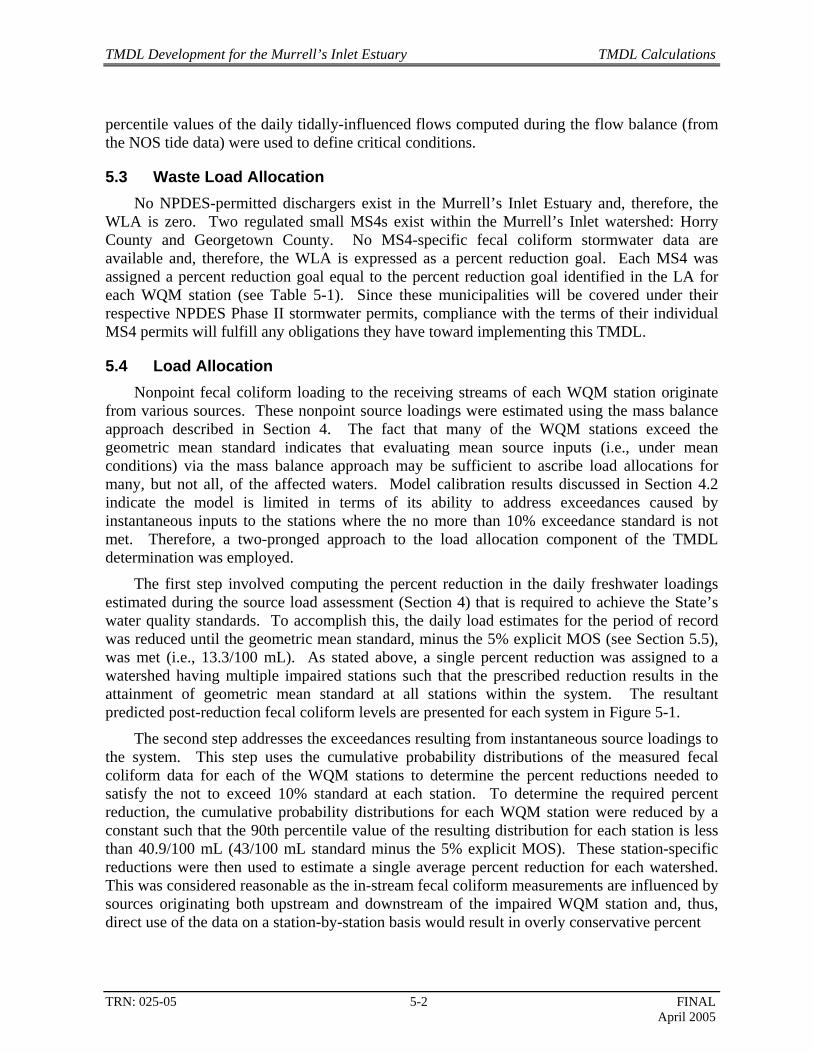
The first step involved computing the percent reduction in the daily freshwater loadings estimated during the source load assessment (Section 4) that is required to achieve the State’s water quality standards. To accomplish this, the daily load estimates for the period of record was reduced until the geometric mean standard, minus the 5% explicit MOS (see Section 5.5), was met (i.e., 13.3/100 mL). As stated above, a single percent reduction was assigned to a watershed having multiple impaired stations such that the prescribed reduction results in the attainment of geometric mean standard at all stations within the system. The resultant predicted post-reduction fecal coliform levels are presented for each system in Figure 5-1.
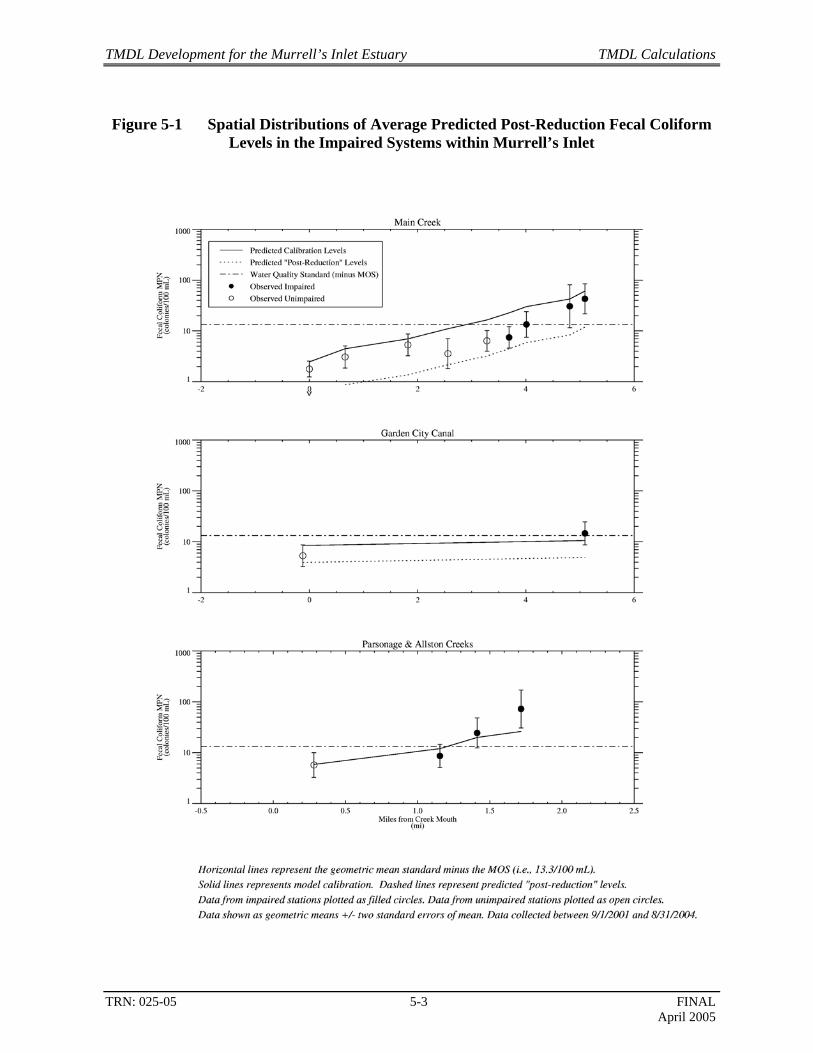
The second step addresses the exceedances resulting from instantaneous source loadings to the system. This step uses the cumulative probability distributions of the measured fecal coliform data for each of the WQM stations to determine the percent reductions needed to satisfy the not to exceed 10% standard at each station. To determine the required percent reduction, the cumulative probability distributions for each WQM station were reduced by a constant such that the 90th percentile value of the resulting distribution for each station is less than 40.9/100 mL (43/100 mL standard minus the 5% explicit MOS). These station-specific reductions were then used to estimate a single average percent reduction for each watershed. This was considered reasonable as the in-stream fecal coliform measurements are influenced by sources originating both upstream and downstream of the impaired WQM station and, thus, direct use of the data on a station-by-station basis would result in overly conservative percent
TMDL Development for the Murrell’s Inlet Estuary TMDL Calculations
TRN: 025-05 5-3 FINAL April 2005
Figure 5-1 Spatial Distributions of Average Predicted Post-Reduction Fecal Coliform Levels in the Impaired Systems within Murrell’s Inlet
TMDL Development for the Murrell’s Inlet Estuary TMDL Calculations
TRN: 025-05 5-4 FINAL April 2005
reductions needed to meet the not to exceed 10% standard. The cumulative probability distributions of the observed data, and the associated distributions of the “reduced” levels, are presented for each WQM station in Figure 5-2. Average percent reductions for each watershed are provided in Table 5-1.
This two-pronged approach results in two estimates of fecal coliform loading reductions for each watershed: one that satisfies the MPN geometric mean standard and one that satisfies the no more than 10% exceedance standard. In order to achieve both State standards for each watershed, the greater of the two percent reductions was selected for the load allocation component of the TMDL (see Table 5-1).
5.5 Margin of Safety Federal regulations (40 CFR §130.7(c)(1)) require that TMDLs include a MOS to account for the uncertainty associated with calculating the allowable fecal coliform pollutant loadings to ensure water quality standards are attained. USEPA (1991) guidance identifies two options for incorporating the MOS into the TMDL evaluation: (1) implicitly incorporate the MOS through the use of conservative assumptions (e.g., nonpoint source loadings are not subject to decay during transport from the basin and are instantaneously mixed with the receiving waterbody); and (2) explicitly specify a portion of the total TMDL as the MOS and use the remainder for allocation purposes. For the TMDLs in this report, an explicit MOS of 5% was used. Therefore, the water quality targets were set at 13.3/100 mL and 40.9/100 mL for the MPN geometric mean and not to exceed 10% standards, respectively. Other conservative assumptions were employed in the development of the TMDLs for these watersheds. Most notably, the more stringent of the two percent reductions required to satisfy each of the respective WQS was used to determine the TMDL for each watershed.
5.6 Seasonal Variability The fecal coliform model simulations extended for the three year period between
September 1, 2001 and August 31, 2004. Mass balance calculations were performed on a daily basis for the duration of the simulation period and, thus, captured the range of seasonal conditions (i.e., wet and dry periods) experienced within the system.
5.7 TMDL Calculations The fecal coliform TMDLs for the impaired watersheds covered in this report were derived
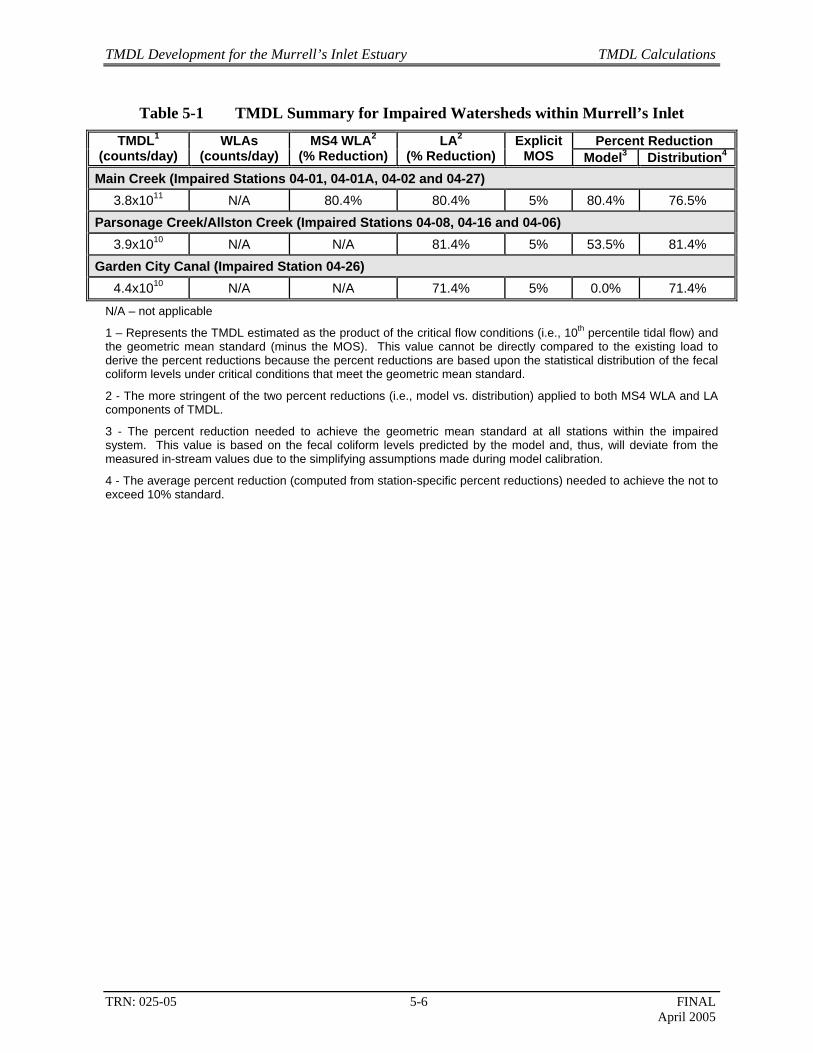
using a mass balance approach. A TMDL is expressed as the sum of all WLAs (point source loads), LAs (nonpoint source loads), and an appropriate MOS, which attempts to account for uncertainty concerning the relationship between effluent limitations and water quality. Equation 5-1 was used to determine the various components of the TMDL calculation for each impaired watershed. Results of these calculations are provided in Table 5-1.
TMDL Development for the Murrell’s Inlet Estuary TMDL Calculations
TRN: 025-05 5-5 FINAL April 2005
Figure 5-2 Cumulative Probability Distributions of Observed and Post-Reduction Fecal Coliform Levels for 303(d) Listed Stations within Murrell’s Inlet
TMDL Development for the Murrell’s Inlet Estuary TMDL Calculations
TRN: 025-05 5-6 FINAL April 2005
Table 5-1 TMDL Summary for Impaired Watersheds within Murrell’s Inlet
Percent Reduction TMDL1 (counts/day)
WLAs (counts/day)
MS4 WLA2 (% Reduction)
LA2
(% Reduction) Explicit
MOS Model3 Distribution4 Main Creek (Impaired Stations 04-01, 04-01A, 04-02 and 04-27)
3.8x10¹¹ N/A 80.4% 80.4% 5% 80.4% 76.5% Parsonage Creek/Allston Creek (Impaired Stations 04-08, 04-16 and 04-06)
3.9x10¹⁰ N/A N/A 81.4% 5% 53.5% 81.4% Garden City Canal (Impaired Station 04-26)
4.4x10¹⁰ N/A N/A 71.4% 5% 0.0% 71.4%
N/A – not applicable
1 – Represents the TMDL estimated as the product of the critical flow conditions (i.e., 10th percentile tidal flow) and the geometric mean standard (minus the MOS). This value cannot be directly compared to the existing load to derive the percent reductions because the percent reductions are based upon the statistical distribution of the fecal coliform levels under critical conditions that meet the geometric mean standard.
2 - The more stringent of the two percent reductions (i.e., model vs. distribution) applied to both MS4 WLA and LA components of TMDL.
3 - The percent reduction needed to achieve the geometric mean standard at all stations within the impaired system. This value is based on the fecal coliform levels predicted by the model and, thus, will deviate from the measured in-stream values due to the simplifying assumptions made during model calibration.
4 - The average percent reduction (computed from station-specific percent reductions) needed to achieve the not to exceed 10% standard.
TMDL Development for the Murrell’s Inlet Estuary References
TRN: 025-05 6-1 FINAL April 2005
SECTION 6 REFERENCES
American Veterinary Medical Association, 2004. Veterinary Market Statistics, 2004. http://www.avma.org/membshp/marketstats/formulas.asp.
Doran J.W., J.S. Schepers, and N.P. Swanson, 1981. Chemical and Bacteriological Quality of Pasture Runoff. Journal of Soil and Water Conservation 36(3):166-171.
Fujioka, R.S., H.H. Hashimoto, E.B. Siwak, and R.H.F. Young, 1981. Effect of Sunlight on Survival of Indicator Bacteria in Seawater. Appl. Environ. Micro. 41(3):690-696.
Georgia Department of Natural Resources (GDNR), 2000. Total Maximum Daily Load Evaluation of Fecal Coliform for Oquina Creek, Ochlockonee River Basin. Environmental Protection Division, Georgia.
Hardy, Edward (Georgetown Water and Sewer Authority). Personal Communication. March 2005.
Horsely and Whitten Inc., 1996. Identification and Evaluation of Nutrient and Bacterial Loadings to Maquoit Bay, New Brunswick and Freeport, Maine. Final Report. Casco Bay Estuary Project, Portland, ME.
Kelsey, R., G.I. Scott, D.E. Porter, B. Thompson, and L. Webster, 2003. Using Multiple Antibiotic Resistance and Land Use Characteristics to Determine Sources of Fecal Coliform Bacterial Pollution. Environ. Monit. Assess. 81(1-3):337-348.
Mancini, J.J., 1978. Numerical Estimation of Coliform Mortality Rates Under Various Conditions. Journal of Water Pollution Control Federation, 50 (11). p2477.
McCuen, R.H. 1989. Hydrologic Analysis and Design. Englewood Cliffs: Prentice Hall.
National Oceanic and Atmospheric Administration (NOAA) National Ocean Service (NOS), 2004. http://co-ops.nos.noaa.gov/tides04/tab2ec3a.html#64.
Overcash, M.R. and J.M. Davidson, 1980. Environmental Impact of Nonpoint Source Pollution. Ann Arbor, MI: Ann Arbor Science Publishers, Inc.
Schwartz, Lawrence (Grand Strand Water and Sewer Authority). Personal Communication. March 2005.
Shaw, Anastasia (South Carolina Department of Environmental Health and Control [SCDHEC]). Personal Communication. March 2005.
South Carolina Department of Environmental Health and Control (SCDHEC), undated. Regulated Small Municipal Separate Storm Sewer System (MS4).
http://www.scdhec.gov/water/html/swnsms4.html.
SCDHEC, 2003a. Total Maximum Daily Load Development for Twelve Mile Creek Watershed, South Carolina. June 2003.

TMDL Development for the Murrell’s Inlet Estuary References
TRN: 025-05 6-2 FINAL April 2005
SCDHEC, 2003b. Shellfish Management Area 04: 2003 Annual Update. Shellfish Sanitation Program, Water Monitoring, Assessment and Protection Division, Environmental Quality Control – Bureau of Water. July 2003.
SCDHEC, 2003c. 2003 Shellfish Growing Area Status Report. Shellfish Sanitation Program, Water Monitoring, Assessment and Protection Division, Environmental Quality Control – Bureau of Water. December 2003.
SCDHEC, 2004a. The State of South Carolina’s 2004 Integrated Report, Part I: Listing of Impaired Waters. http://www.scdhec.gov/water/pubs/303d2004.pdf.
SCDHEC, 2004b. Department of Health and Environmental Control, Chapter 61. Statutory Authority: 1976 Code Section 48-1-10 et seq. R.61-68, Water Classifications and Standards.
SCDHEC, 2004c. Shellfish Management Area 04: 2004 Annual Update. Shellfish Sanitation Program, Water Monitoring, Assessment and Protection Division, Environmental Quality Control – Bureau of Water. July 2004.
SCDHEC, 2004d. Total Maximum Daily Load Development for Fecal Coliform Bacteria, Lower Saluda River and Tributaries. Bureau of Water. September 2004.
Thomann, R.V. and J.A. Mueller, 1987. Principles of Surface Water Quality Modeling and Control. , New York: Harper & Row Publishers, Inc. p644.
United States Environmental Protection Agency (USEPA), 1991. Guidance for Water Quality-Based Decisions: The TMDL Process. Office of Water, EPA 440/4-91-001.
USEPA, 2001. Protocol for Developing Pathogen TMDLs, First Edition. Office of Water, EPA 841-R-00-002.
TMDL Development for the Murrell’s Inlet Estuary Appendix A
TRN: 025-05 A-1 FINAL April 2005
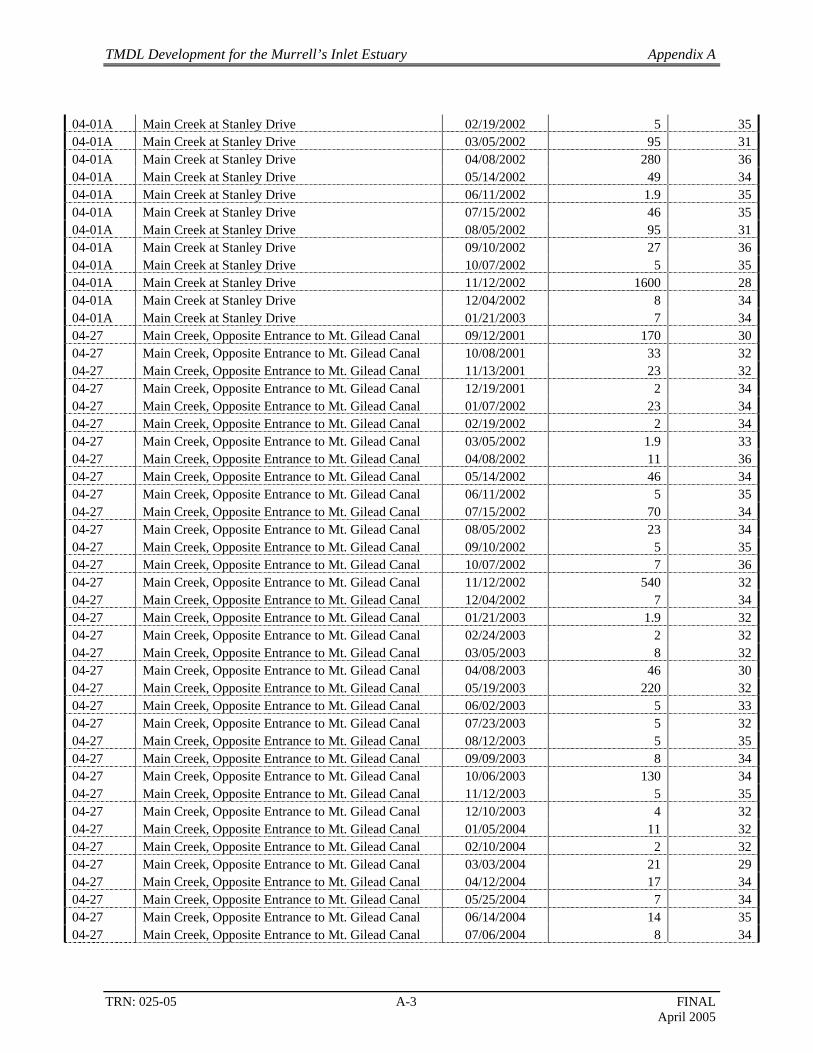
APPENDIX A FECAL COLIFORM DATA COLLECTED AT 303(D) LISTED STATIONS
BETWEEN SEPTEMBER 1, 2001 AND AUGUST 31, 2004
TMDL Development for the Murrell’s Inlet Estuary Appendix A
TRN: 025-05 A-2 FINAL April 2005
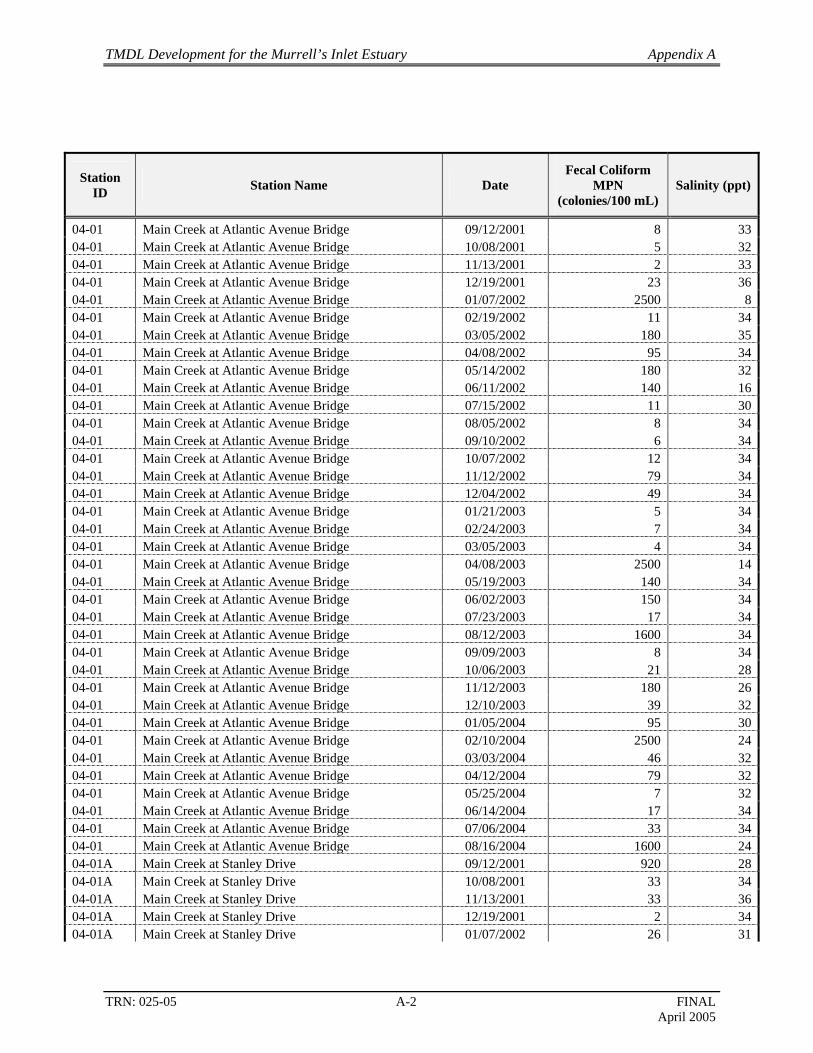
Station ID Station Name Date
Fecal Coliform MPN
(colonies/100 mL) Salinity (ppt)
04-01 Main Creek at Atlantic Avenue Bridge 09/12/2001 8 3304-01 Main Creek at Atlantic Avenue Bridge 10/08/2001 5 3204-01 Main Creek at Atlantic Avenue Bridge 11/13/2001 2 3304-01 Main Creek at Atlantic Avenue Bridge 12/19/2001 23 3604-01 Main Creek at Atlantic Avenue Bridge 01/07/2002 2500 804-01 Main Creek at Atlantic Avenue Bridge 02/19/2002 11 3404-01 Main Creek at Atlantic Avenue Bridge 03/05/2002 180 3504-01 Main Creek at Atlantic Avenue Bridge 04/08/2002 95 3404-01 Main Creek at Atlantic Avenue Bridge 05/14/2002 180 3204-01 Main Creek at Atlantic Avenue Bridge 06/11/2002 140 1604-01 Main Creek at Atlantic Avenue Bridge 07/15/2002 11 3004-01 Main Creek at Atlantic Avenue Bridge 08/05/2002 8 3404-01 Main Creek at Atlantic Avenue Bridge 09/10/2002 6 3404-01 Main Creek at Atlantic Avenue Bridge 10/07/2002 12 3404-01 Main Creek at Atlantic Avenue Bridge 11/12/2002 79 3404-01 Main Creek at Atlantic Avenue Bridge 12/04/2002 49 3404-01 Main Creek at Atlantic Avenue Bridge 01/21/2003 5 3404-01 Main Creek at Atlantic Avenue Bridge 02/24/2003 7 3404-01 Main Creek at Atlantic Avenue Bridge 03/05/2003 4 3404-01 Main Creek at Atlantic Avenue Bridge 04/08/2003 2500 1404-01 Main Creek at Atlantic Avenue Bridge 05/19/2003 140 3404-01 Main Creek at Atlantic Avenue Bridge 06/02/2003 150 3404-01 Main Creek at Atlantic Avenue Bridge 07/23/2003 17 3404-01 Main Creek at Atlantic Avenue Bridge 08/12/2003 1600 3404-01 Main Creek at Atlantic Avenue Bridge 09/09/2003 8 3404-01 Main Creek at Atlantic Avenue Bridge 10/06/2003 21 2804-01 Main Creek at Atlantic Avenue Bridge 11/12/2003 180 2604-01 Main Creek at Atlantic Avenue Bridge 12/10/2003 39 3204-01 Main Creek at Atlantic Avenue Bridge 01/05/2004 95 3004-01 Main Creek at Atlantic Avenue Bridge 02/10/2004 2500 2404-01 Main Creek at Atlantic Avenue Bridge 03/03/2004 46 3204-01 Main Creek at Atlantic Avenue Bridge 04/12/2004 79 3204-01 Main Creek at Atlantic Avenue Bridge 05/25/2004 7 3204-01 Main Creek at Atlantic Avenue Bridge 06/14/2004 17 3404-01 Main Creek at Atlantic Avenue Bridge 07/06/2004 33 3404-01 Main Creek at Atlantic Avenue Bridge 08/16/2004 1600 2404-01A Main Creek at Stanley Drive 09/12/2001 920 2804-01A Main Creek at Stanley Drive 10/08/2001 33 3404-01A Main Creek at Stanley Drive 11/13/2001 33 3604-01A Main Creek at Stanley Drive 12/19/2001 2 3404-01A Main Creek at Stanley Drive 01/07/2002 26 31
TMDL Development for the Murrell’s Inlet Estuary Appendix A
TRN: 025-05 A-3 FINAL April 2005
04-01A Main Creek at Stanley Drive 02/19/2002 5 3504-01A Main Creek at Stanley Drive 03/05/2002 95 3104-01A Main Creek at Stanley Drive 04/08/2002 280 3604-01A Main Creek at Stanley Drive 05/14/2002 49 3404-01A Main Creek at Stanley Drive 06/11/2002 1.9 3504-01A Main Creek at Stanley Drive 07/15/2002 46 3504-01A Main Creek at Stanley Drive 08/05/2002 95 3104-01A Main Creek at Stanley Drive 09/10/2002 27 3604-01A Main Creek at Stanley Drive 10/07/2002 5 3504-01A Main Creek at Stanley Drive 11/12/2002 1600 2804-01A Main Creek at Stanley Drive 12/04/2002 8 3404-01A Main Creek at Stanley Drive 01/21/2003 7 3404-27 Main Creek, Opposite Entrance to Mt. Gilead Canal 09/12/2001 170 3004-27 Main Creek, Opposite Entrance to Mt. Gilead Canal 10/08/2001 33 3204-27 Main Creek, Opposite Entrance to Mt. Gilead Canal 11/13/2001 23 3204-27 Main Creek, Opposite Entrance to Mt. Gilead Canal 12/19/2001 2 3404-27 Main Creek, Opposite Entrance to Mt. Gilead Canal 01/07/2002 23 3404-27 Main Creek, Opposite Entrance to Mt. Gilead Canal 02/19/2002 2 3404-27 Main Creek, Opposite Entrance to Mt. Gilead Canal 03/05/2002 1.9 3304-27 Main Creek, Opposite Entrance to Mt. Gilead Canal 04/08/2002 11 3604-27 Main Creek, Opposite Entrance to Mt. Gilead Canal 05/14/2002 46 3404-27 Main Creek, Opposite Entrance to Mt. Gilead Canal 06/11/2002 5 3504-27 Main Creek, Opposite Entrance to Mt. Gilead Canal 07/15/2002 70 3404-27 Main Creek, Opposite Entrance to Mt. Gilead Canal 08/05/2002 23 3404-27 Main Creek, Opposite Entrance to Mt. Gilead Canal 09/10/2002 5 3504-27 Main Creek, Opposite Entrance to Mt. Gilead Canal 10/07/2002 7 3604-27 Main Creek, Opposite Entrance to Mt. Gilead Canal 11/12/2002 540 3204-27 Main Creek, Opposite Entrance to Mt. Gilead Canal 12/04/2002 7 3404-27 Main Creek, Opposite Entrance to Mt. Gilead Canal 01/21/2003 1.9 3204-27 Main Creek, Opposite Entrance to Mt. Gilead Canal 02/24/2003 2 3204-27 Main Creek, Opposite Entrance to Mt. Gilead Canal 03/05/2003 8 3204-27 Main Creek, Opposite Entrance to Mt. Gilead Canal 04/08/2003 46 3004-27 Main Creek, Opposite Entrance to Mt. Gilead Canal 05/19/2003 220 3204-27 Main Creek, Opposite Entrance to Mt. Gilead Canal 06/02/2003 5 3304-27 Main Creek, Opposite Entrance to Mt. Gilead Canal 07/23/2003 5 3204-27 Main Creek, Opposite Entrance to Mt. Gilead Canal 08/12/2003 5 3504-27 Main Creek, Opposite Entrance to Mt. Gilead Canal 09/09/2003 8 3404-27 Main Creek, Opposite Entrance to Mt. Gilead Canal 10/06/2003 130 3404-27 Main Creek, Opposite Entrance to Mt. Gilead Canal 11/12/2003 5 3504-27 Main Creek, Opposite Entrance to Mt. Gilead Canal 12/10/2003 4 3204-27 Main Creek, Opposite Entrance to Mt. Gilead Canal 01/05/2004 11 3204-27 Main Creek, Opposite Entrance to Mt. Gilead Canal 02/10/2004 2 3204-27 Main Creek, Opposite Entrance to Mt. Gilead Canal 03/03/2004 21 2904-27 Main Creek, Opposite Entrance to Mt. Gilead Canal 04/12/2004 17 3404-27 Main Creek, Opposite Entrance to Mt. Gilead Canal 05/25/2004 7 3404-27 Main Creek, Opposite Entrance to Mt. Gilead Canal 06/14/2004 14 3504-27 Main Creek, Opposite Entrance to Mt. Gilead Canal 07/06/2004 8 34

TMDL Development for the Murrell’s Inlet Estuary Appendix A
TRN: 025-05 A-4 FINAL April 2005
04-27 Main Creek, Opposite Entrance to Mt. Gilead Canal 08/16/2004 2500 2404-02 Main Creek at Mickey Spillane's Home 09/12/2001 49 2604-02 Main Creek at Mickey Spillane's Home 10/08/2001 23 3204-02 Main Creek at Mickey Spillane's Home 11/13/2001 11 3204-02 Main Creek at Mickey Spillane's Home 12/19/2001 5 3404-02 Main Creek at Mickey Spillane's Home 01/07/2002 5 3404-02 Main Creek at Mickey Spillane's Home 02/19/2002 1.9 3404-02 Main Creek at Mickey Spillane's Home 03/05/2002 1.9 3404-02 Main Creek at Mickey Spillane's Home 04/08/2002 13 3604-02 Main Creek at Mickey Spillane's Home 05/14/2002 49 3404-02 Main Creek at Mickey Spillane's Home 06/11/2002 1.9 3404-02 Main Creek at Mickey Spillane's Home 07/15/2002 11 3404-02 Main Creek at Mickey Spillane's Home 08/05/2002 12 3204-02 Main Creek at Mickey Spillane's Home 09/10/2002 13 3504-02 Main Creek at Mickey Spillane's Home 09/25/2002 6 3604-02 Main Creek at Mickey Spillane's Home 10/07/2002 7 3504-02 Main Creek at Mickey Spillane's Home 10/28/2002 17 3204-02 Main Creek at Mickey Spillane's Home 11/05/2002 11 3604-02 Main Creek at Mickey Spillane's Home 11/12/2002 540 3204-02 Main Creek at Mickey Spillane's Home 11/24/2002 2 3404-02 Main Creek at Mickey Spillane's Home 12/04/2002 2 3404-02 Main Creek at Mickey Spillane's Home 12/30/2002 6 3404-02 Main Creek at Mickey Spillane's Home 01/21/2003 1.9 3004-02 Main Creek at Mickey Spillane's Home 02/24/2003 5 3204-02 Main Creek at Mickey Spillane's Home 03/05/2003 5 3204-02 Main Creek at Mickey Spillane's Home 03/30/2003 7 3004-02 Main Creek at Mickey Spillane's Home 04/08/2003 70 3004-02 Main Creek at Mickey Spillane's Home 04/21/2003 5 3004-02 Main Creek at Mickey Spillane's Home 05/19/2003 95 3204-02 Main Creek at Mickey Spillane's Home 06/02/2003 1.9 3404-02 Main Creek at Mickey Spillane's Home 07/23/2003 5 3204-02 Main Creek at Mickey Spillane's Home 08/12/2003 1.9 3504-02 Main Creek at Mickey Spillane's Home 09/09/2003 22 3404-02 Main Creek at Mickey Spillane's Home 09/14/2003 2 3404-02 Main Creek at Mickey Spillane's Home 10/06/2003 33 3604-02 Main Creek at Mickey Spillane's Home 10/20/2003 11 3404-02 Main Creek at Mickey Spillane's Home 11/12/2003 4 3504-02 Main Creek at Mickey Spillane's Home 12/10/2003 2 3204-02 Main Creek at Mickey Spillane's Home 01/05/2004 2 3404-02 Main Creek at Mickey Spillane's Home 02/10/2004 1.9 3204-02 Main Creek at Mickey Spillane's Home 03/03/2004 11 2904-02 Main Creek at Mickey Spillane's Home 04/12/2004 17 3504-02 Main Creek at Mickey Spillane's Home 05/25/2004 5 3404-02 Main Creek at Mickey Spillane's Home 06/14/2004 5 3504-02 Main Creek at Mickey Spillane's Home 07/06/2004 1.9 3404-02 Main Creek at Mickey Spillane's Home 08/16/2004 1600 2604-26 Garden City Canal at the "Old Boat Wreck" 09/12/2001 110 28
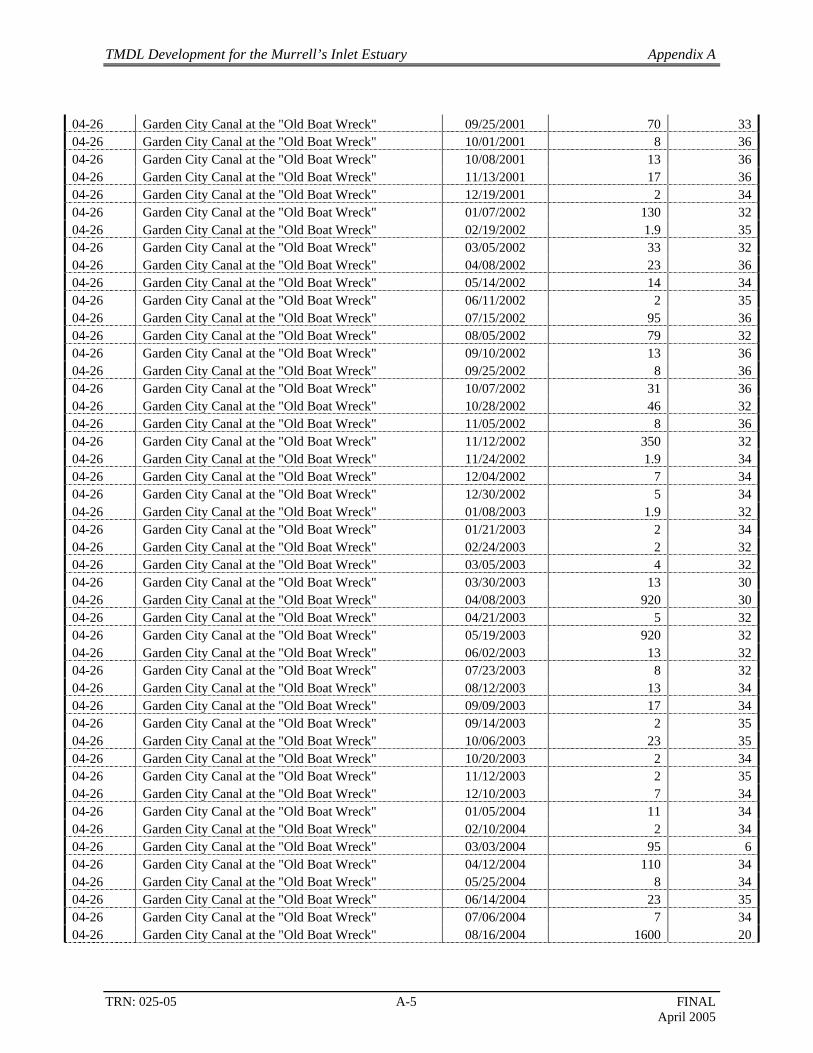
TMDL Development for the Murrell’s Inlet Estuary Appendix A
TRN: 025-05 A-5 FINAL April 2005
04-26 Garden City Canal at the "Old Boat Wreck" 09/25/2001 70 3304-26 Garden City Canal at the "Old Boat Wreck" 10/01/2001 8 3604-26 Garden City Canal at the "Old Boat Wreck" 10/08/2001 13 3604-26 Garden City Canal at the "Old Boat Wreck" 11/13/2001 17 3604-26 Garden City Canal at the "Old Boat Wreck" 12/19/2001 2 3404-26 Garden City Canal at the "Old Boat Wreck" 01/07/2002 130 3204-26 Garden City Canal at the "Old Boat Wreck" 02/19/2002 1.9 3504-26 Garden City Canal at the "Old Boat Wreck" 03/05/2002 33 3204-26 Garden City Canal at the "Old Boat Wreck" 04/08/2002 23 3604-26 Garden City Canal at the "Old Boat Wreck" 05/14/2002 14 3404-26 Garden City Canal at the "Old Boat Wreck" 06/11/2002 2 3504-26 Garden City Canal at the "Old Boat Wreck" 07/15/2002 95 3604-26 Garden City Canal at the "Old Boat Wreck" 08/05/2002 79 3204-26 Garden City Canal at the "Old Boat Wreck" 09/10/2002 13 3604-26 Garden City Canal at the "Old Boat Wreck" 09/25/2002 8 3604-26 Garden City Canal at the "Old Boat Wreck" 10/07/2002 31 3604-26 Garden City Canal at the "Old Boat Wreck" 10/28/2002 46 3204-26 Garden City Canal at the "Old Boat Wreck" 11/05/2002 8 3604-26 Garden City Canal at the "Old Boat Wreck" 11/12/2002 350 3204-26 Garden City Canal at the "Old Boat Wreck" 11/24/2002 1.9 3404-26 Garden City Canal at the "Old Boat Wreck" 12/04/2002 7 3404-26 Garden City Canal at the "Old Boat Wreck" 12/30/2002 5 3404-26 Garden City Canal at the "Old Boat Wreck" 01/08/2003 1.9 3204-26 Garden City Canal at the "Old Boat Wreck" 01/21/2003 2 3404-26 Garden City Canal at the "Old Boat Wreck" 02/24/2003 2 3204-26 Garden City Canal at the "Old Boat Wreck" 03/05/2003 4 3204-26 Garden City Canal at the "Old Boat Wreck" 03/30/2003 13 3004-26 Garden City Canal at the "Old Boat Wreck" 04/08/2003 920 3004-26 Garden City Canal at the "Old Boat Wreck" 04/21/2003 5 3204-26 Garden City Canal at the "Old Boat Wreck" 05/19/2003 920 3204-26 Garden City Canal at the "Old Boat Wreck" 06/02/2003 13 3204-26 Garden City Canal at the "Old Boat Wreck" 07/23/2003 8 3204-26 Garden City Canal at the "Old Boat Wreck" 08/12/2003 13 3404-26 Garden City Canal at the "Old Boat Wreck" 09/09/2003 17 3404-26 Garden City Canal at the "Old Boat Wreck" 09/14/2003 2 3504-26 Garden City Canal at the "Old Boat Wreck" 10/06/2003 23 3504-26 Garden City Canal at the "Old Boat Wreck" 10/20/2003 2 3404-26 Garden City Canal at the "Old Boat Wreck" 11/12/2003 2 3504-26 Garden City Canal at the "Old Boat Wreck" 12/10/2003 7 3404-26 Garden City Canal at the "Old Boat Wreck" 01/05/2004 11 3404-26 Garden City Canal at the "Old Boat Wreck" 02/10/2004 2 3404-26 Garden City Canal at the "Old Boat Wreck" 03/03/2004 95 604-26 Garden City Canal at the "Old Boat Wreck" 04/12/2004 110 3404-26 Garden City Canal at the "Old Boat Wreck" 05/25/2004 8 3404-26 Garden City Canal at the "Old Boat Wreck" 06/14/2004 23 3504-26 Garden City Canal at the "Old Boat Wreck" 07/06/2004 7 3404-26 Garden City Canal at the "Old Boat Wreck" 08/16/2004 1600 20
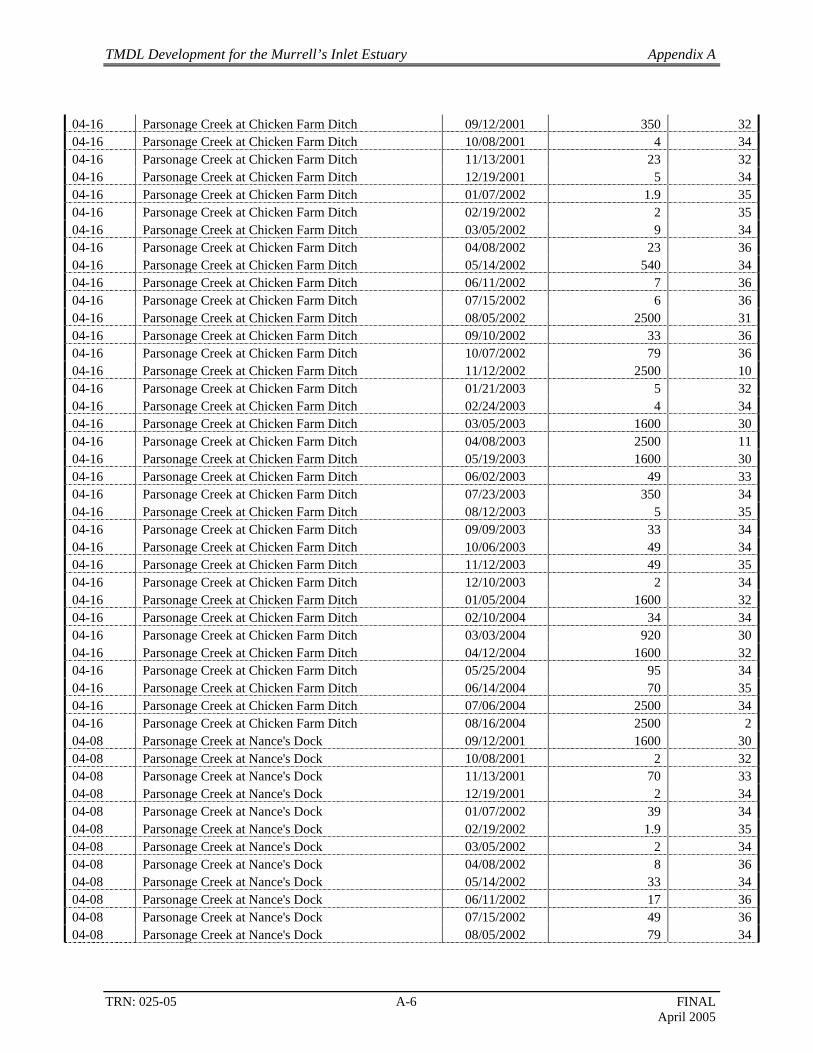
TMDL Development for the Murrell’s Inlet Estuary Appendix A
TRN: 025-05 A-6 FINAL April 2005
04-16 Parsonage Creek at Chicken Farm Ditch 09/12/2001 350 3204-16 Parsonage Creek at Chicken Farm Ditch 10/08/2001 4 3404-16 Parsonage Creek at Chicken Farm Ditch 11/13/2001 23 3204-16 Parsonage Creek at Chicken Farm Ditch 12/19/2001 5 3404-16 Parsonage Creek at Chicken Farm Ditch 01/07/2002 1.9 3504-16 Parsonage Creek at Chicken Farm Ditch 02/19/2002 2 3504-16 Parsonage Creek at Chicken Farm Ditch 03/05/2002 9 3404-16 Parsonage Creek at Chicken Farm Ditch 04/08/2002 23 3604-16 Parsonage Creek at Chicken Farm Ditch 05/14/2002 540 3404-16 Parsonage Creek at Chicken Farm Ditch 06/11/2002 7 3604-16 Parsonage Creek at Chicken Farm Ditch 07/15/2002 6 3604-16 Parsonage Creek at Chicken Farm Ditch 08/05/2002 2500 3104-16 Parsonage Creek at Chicken Farm Ditch 09/10/2002 33 3604-16 Parsonage Creek at Chicken Farm Ditch 10/07/2002 79 3604-16 Parsonage Creek at Chicken Farm Ditch 11/12/2002 2500 1004-16 Parsonage Creek at Chicken Farm Ditch 01/21/2003 5 3204-16 Parsonage Creek at Chicken Farm Ditch 02/24/2003 4 3404-16 Parsonage Creek at Chicken Farm Ditch 03/05/2003 1600 3004-16 Parsonage Creek at Chicken Farm Ditch 04/08/2003 2500 1104-16 Parsonage Creek at Chicken Farm Ditch 05/19/2003 1600 3004-16 Parsonage Creek at Chicken Farm Ditch 06/02/2003 49 3304-16 Parsonage Creek at Chicken Farm Ditch 07/23/2003 350 3404-16 Parsonage Creek at Chicken Farm Ditch 08/12/2003 5 3504-16 Parsonage Creek at Chicken Farm Ditch 09/09/2003 33 3404-16 Parsonage Creek at Chicken Farm Ditch 10/06/2003 49 3404-16 Parsonage Creek at Chicken Farm Ditch 11/12/2003 49 3504-16 Parsonage Creek at Chicken Farm Ditch 12/10/2003 2 3404-16 Parsonage Creek at Chicken Farm Ditch 01/05/2004 1600 3204-16 Parsonage Creek at Chicken Farm Ditch 02/10/2004 34 3404-16 Parsonage Creek at Chicken Farm Ditch 03/03/2004 920 3004-16 Parsonage Creek at Chicken Farm Ditch 04/12/2004 1600 3204-16 Parsonage Creek at Chicken Farm Ditch 05/25/2004 95 3404-16 Parsonage Creek at Chicken Farm Ditch 06/14/2004 70 3504-16 Parsonage Creek at Chicken Farm Ditch 07/06/2004 2500 3404-16 Parsonage Creek at Chicken Farm Ditch 08/16/2004 2500 204-08 Parsonage Creek at Nance's Dock 09/12/2001 1600 3004-08 Parsonage Creek at Nance's Dock 10/08/2001 2 3204-08 Parsonage Creek at Nance's Dock 11/13/2001 70 3304-08 Parsonage Creek at Nance's Dock 12/19/2001 2 3404-08 Parsonage Creek at Nance's Dock 01/07/2002 39 3404-08 Parsonage Creek at Nance's Dock 02/19/2002 1.9 3504-08 Parsonage Creek at Nance's Dock 03/05/2002 2 3404-08 Parsonage Creek at Nance's Dock 04/08/2002 8 3604-08 Parsonage Creek at Nance's Dock 05/14/2002 33 3404-08 Parsonage Creek at Nance's Dock 06/11/2002 17 3604-08 Parsonage Creek at Nance's Dock 07/15/2002 49 3604-08 Parsonage Creek at Nance's Dock 08/05/2002 79 34
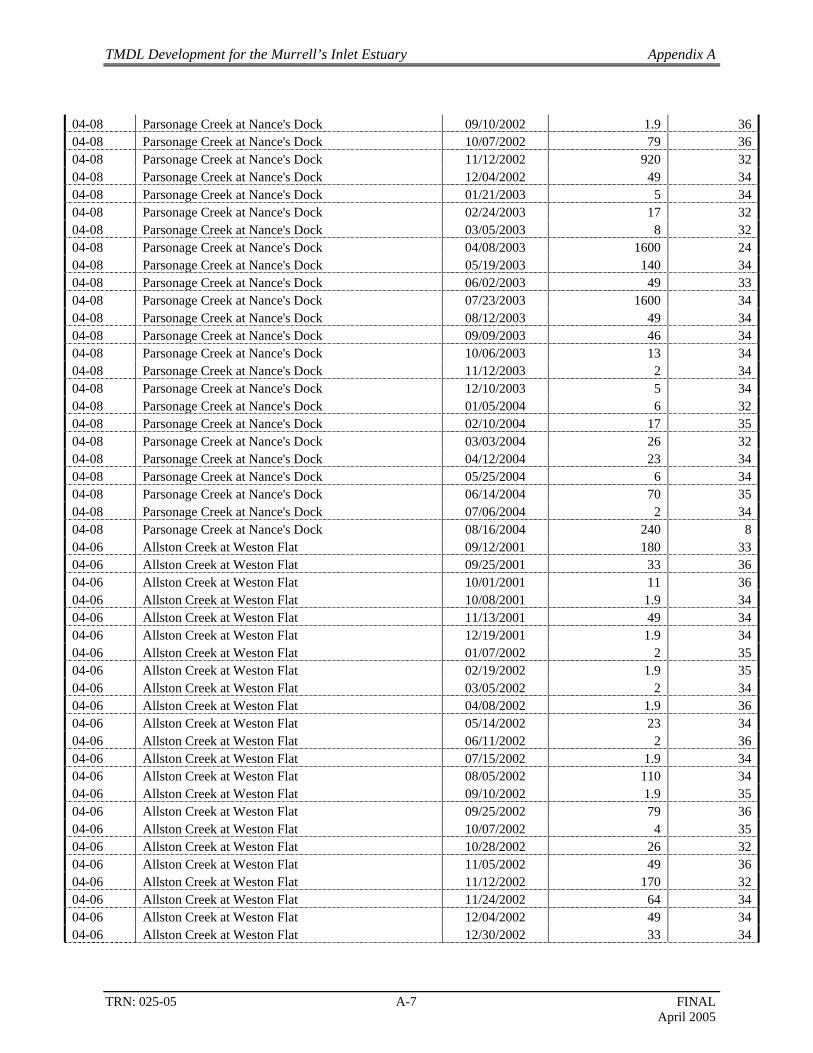
TMDL Development for the Murrell’s Inlet Estuary Appendix A
TRN: 025-05 A-7 FINAL April 2005
04-08 Parsonage Creek at Nance's Dock 09/10/2002 1.9 3604-08 Parsonage Creek at Nance's Dock 10/07/2002 79 3604-08 Parsonage Creek at Nance's Dock 11/12/2002 920 3204-08 Parsonage Creek at Nance's Dock 12/04/2002 49 3404-08 Parsonage Creek at Nance's Dock 01/21/2003 5 3404-08 Parsonage Creek at Nance's Dock 02/24/2003 17 3204-08 Parsonage Creek at Nance's Dock 03/05/2003 8 3204-08 Parsonage Creek at Nance's Dock 04/08/2003 1600 2404-08 Parsonage Creek at Nance's Dock 05/19/2003 140 3404-08 Parsonage Creek at Nance's Dock 06/02/2003 49 3304-08 Parsonage Creek at Nance's Dock 07/23/2003 1600 3404-08 Parsonage Creek at Nance's Dock 08/12/2003 49 3404-08 Parsonage Creek at Nance's Dock 09/09/2003 46 3404-08 Parsonage Creek at Nance's Dock 10/06/2003 13 3404-08 Parsonage Creek at Nance's Dock 11/12/2003 2 3404-08 Parsonage Creek at Nance's Dock 12/10/2003 5 3404-08 Parsonage Creek at Nance's Dock 01/05/2004 6 3204-08 Parsonage Creek at Nance's Dock 02/10/2004 17 3504-08 Parsonage Creek at Nance's Dock 03/03/2004 26 3204-08 Parsonage Creek at Nance's Dock 04/12/2004 23 3404-08 Parsonage Creek at Nance's Dock 05/25/2004 6 3404-08 Parsonage Creek at Nance's Dock 06/14/2004 70 3504-08 Parsonage Creek at Nance's Dock 07/06/2004 2 3404-08 Parsonage Creek at Nance's Dock 08/16/2004 240 804-06 Allston Creek at Weston Flat 09/12/2001 180 3304-06 Allston Creek at Weston Flat 09/25/2001 33 3604-06 Allston Creek at Weston Flat 10/01/2001 11 3604-06 Allston Creek at Weston Flat 10/08/2001 1.9 3404-06 Allston Creek at Weston Flat 11/13/2001 49 3404-06 Allston Creek at Weston Flat 12/19/2001 1.9 3404-06 Allston Creek at Weston Flat 01/07/2002 2 3504-06 Allston Creek at Weston Flat 02/19/2002 1.9 3504-06 Allston Creek at Weston Flat 03/05/2002 2 3404-06 Allston Creek at Weston Flat 04/08/2002 1.9 3604-06 Allston Creek at Weston Flat 05/14/2002 23 3404-06 Allston Creek at Weston Flat 06/11/2002 2 3604-06 Allston Creek at Weston Flat 07/15/2002 1.9 3404-06 Allston Creek at Weston Flat 08/05/2002 110 3404-06 Allston Creek at Weston Flat 09/10/2002 1.9 3504-06 Allston Creek at Weston Flat 09/25/2002 79 3604-06 Allston Creek at Weston Flat 10/07/2002 4 3504-06 Allston Creek at Weston Flat 10/28/2002 26 3204-06 Allston Creek at Weston Flat 11/05/2002 49 3604-06 Allston Creek at Weston Flat 11/12/2002 170 3204-06 Allston Creek at Weston Flat 11/24/2002 64 3404-06 Allston Creek at Weston Flat 12/04/2002 49 3404-06 Allston Creek at Weston Flat 12/30/2002 33 34

TMDL Development for the Murrell’s Inlet Estuary Appendix A
TRN: 025-05 A-8 FINAL April 2005
04-06 Allston Creek at Weston Flat 01/08/2003 4 3404-06 Allston Creek at Weston Flat 01/21/2003 2 3404-06 Allston Creek at Weston Flat 02/24/2003 1.9 3404-06 Allston Creek at Weston Flat 03/05/2003 11 3204-06 Allston Creek at Weston Flat 03/30/2003 49 3204-06 Allston Creek at Weston Flat 04/08/2003 49 3204-06 Allston Creek at Weston Flat 04/21/2003 2 3004-06 Allston Creek at Weston Flat 05/19/2003 180 3404-06 Allston Creek at Weston Flat 06/02/2003 8 3404-06 Allston Creek at Weston Flat 07/23/2003 7 3404-06 Allston Creek at Weston Flat 08/12/2003 13 3504-06 Allston Creek at Weston Flat 09/09/2003 33 3504-06 Allston Creek at Weston Flat 09/14/2003 1.9 3404-06 Allston Creek at Weston Flat 10/06/2003 1.9 3504-06 Allston Creek at Weston Flat 10/20/2003 4 3404-06 Allston Creek at Weston Flat 11/12/2003 2 3504-06 Allston Creek at Weston Flat 12/10/2003 1.9 3204-06 Allston Creek at Weston Flat 01/05/2004 4 3204-06 Allston Creek at Weston Flat 02/10/2004 17 3404-06 Allston Creek at Weston Flat 02/23/2004 2 3204-06 Allston Creek at Weston Flat 03/03/2004 13 3304-06 Allston Creek at Weston Flat 04/12/2004 22 3404-06 Allston Creek at Weston Flat 05/19/2004 11 3404-06 Allston Creek at Weston Flat 05/25/2004 1.9 3404-06 Allston Creek at Weston Flat 06/14/2004 5 3504-06 Allston Creek at Weston Flat 07/06/2004 2 3604-06 Allston Creek at Weston Flat 08/16/2004 2500 14
TMDL Development for the Murrell’s Inlet Estuary Appendix B
TRN: 025-05 B-1 FINAL April 2005
APPENDIX B LAND USE AND SUB-WATERSHED DELINEATIONS FOR THE
IMPAIRED SYSTEMS OF MURRELL’S INLET

TMDL Development for the Murrell’s Inlet Estuary Appendix B
TRN: 025-05 B-2 FINAL April 2005
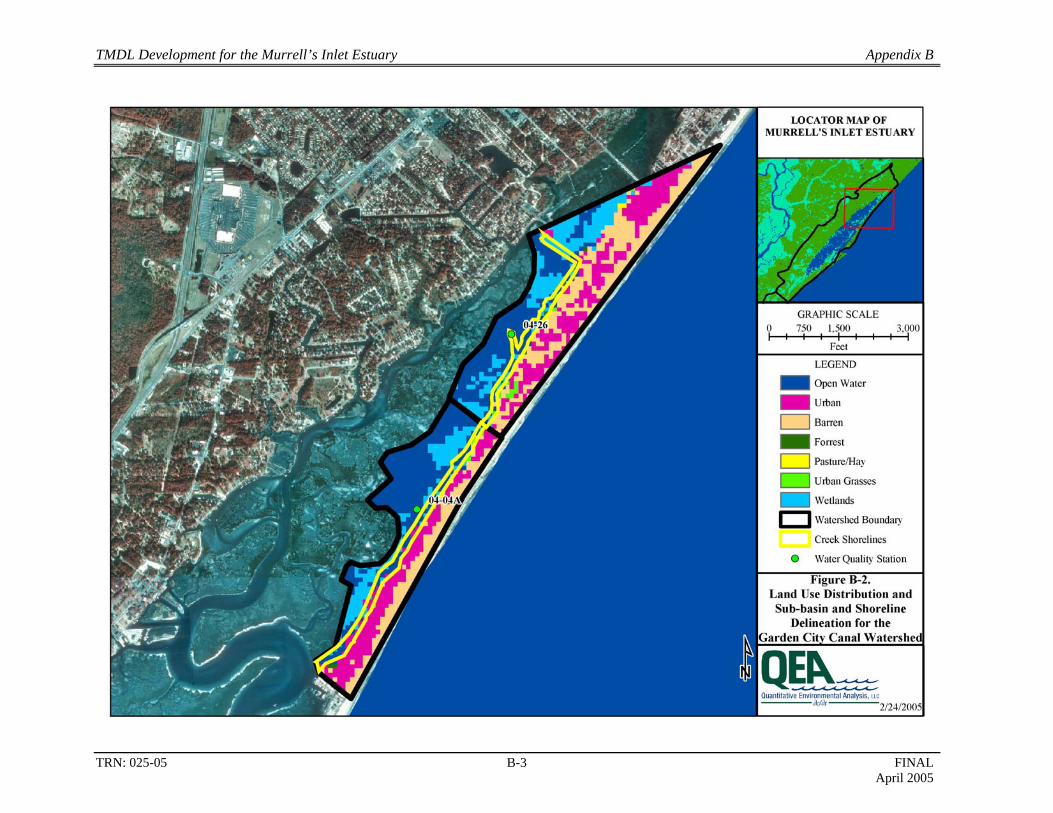
TMDL Development for the Murrell’s Inlet Estuary Appendix B
TRN: 025-05 B-3 FINAL April 2005
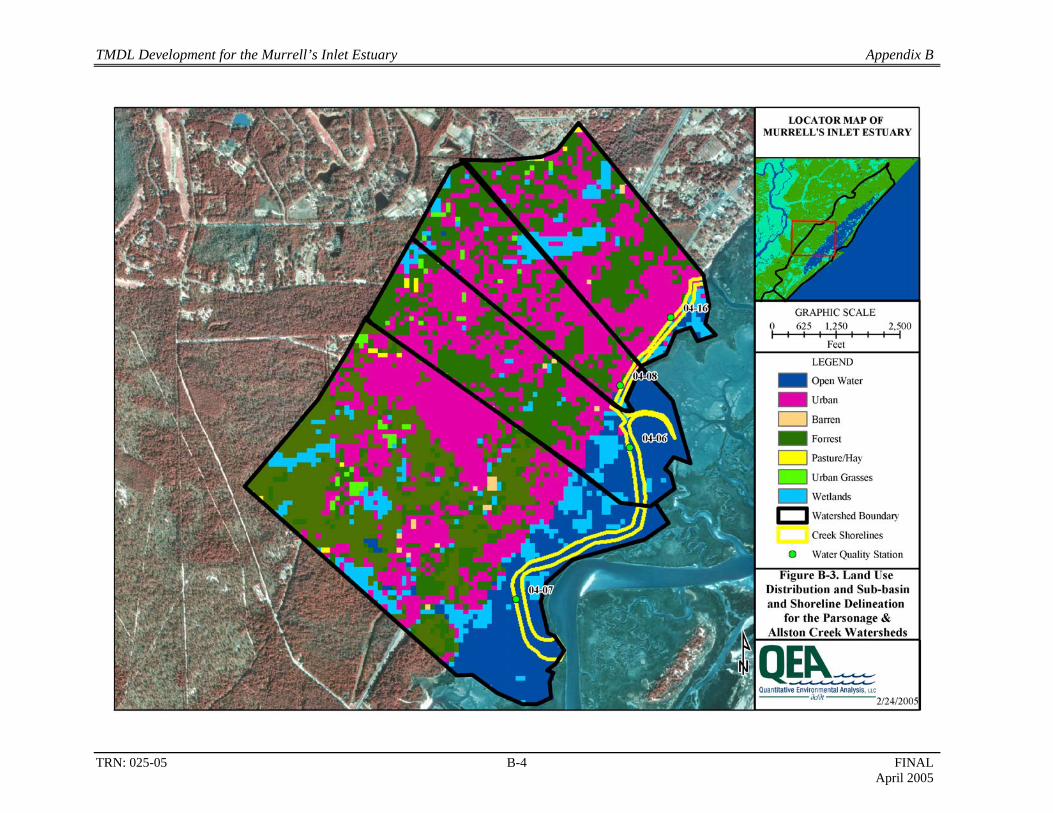
TMDL Development for the Murrell’s Inlet Estuary Appendix B
TRN: 025-05 B-4 FINAL April 2005
TMDL Development for the Murrell’s Inlet Estuary Appendix C
TRN: 025-05 C-1 FINAL April 2005
APPENDIX C TIME SERIES OF PREDICTED AND OBSERVED SALINITY AND FECAL COLIFORM LEVELS AT EACH 303(D) LISTED STATION
(SEPTEMBER 2001 TO AUGUST 2004)
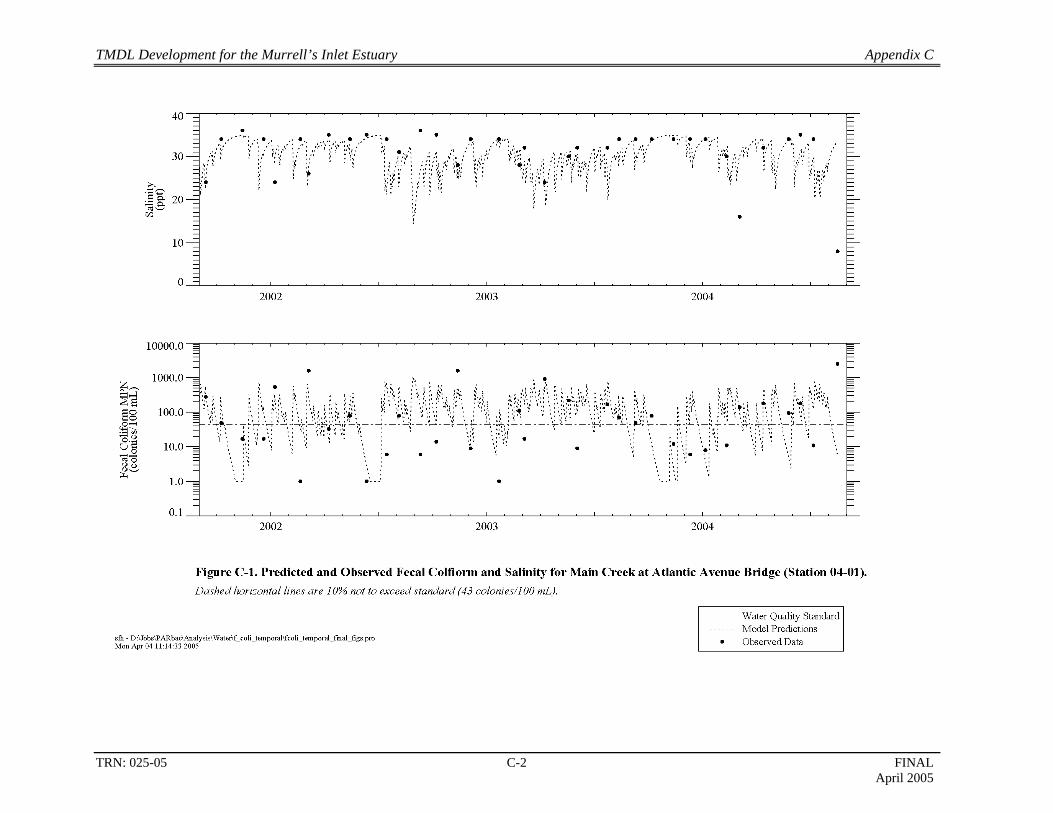
TMDL Development for the Murrell’s Inlet Estuary Appendix C
TRN: 025-05 C-2 FINAL April 2005
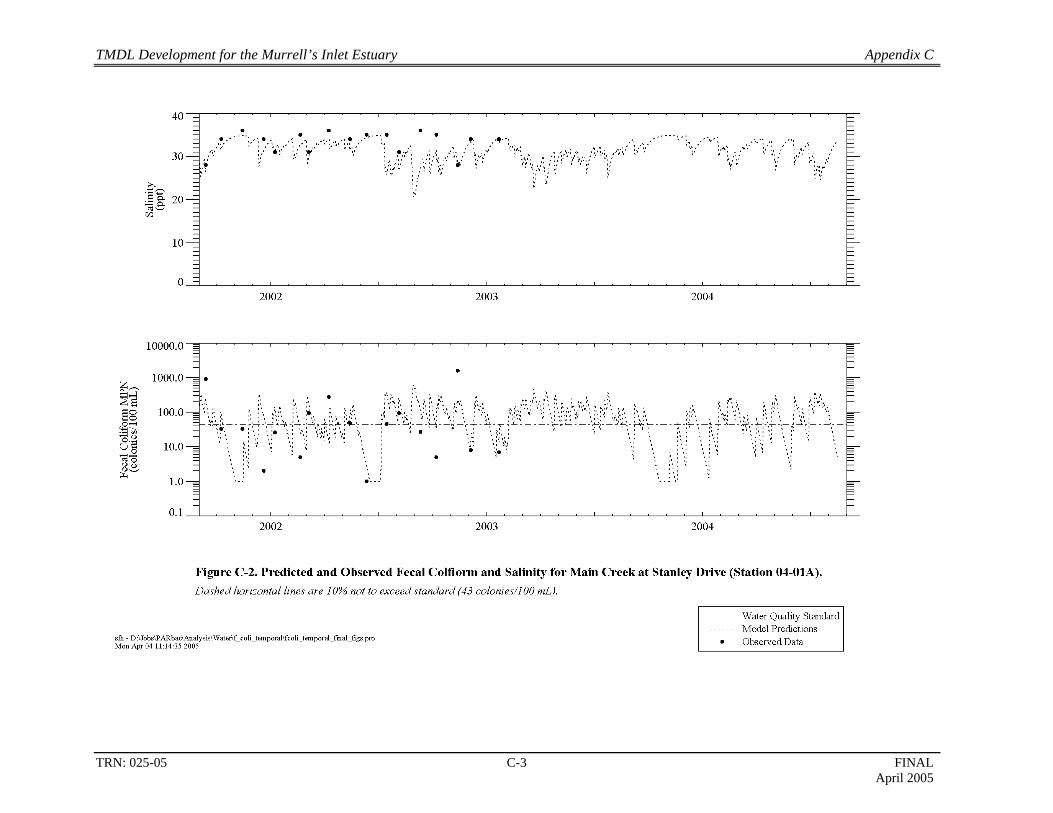
TMDL Development for the Murrell’s Inlet Estuary Appendix C
TRN: 025-05 C-3 FINAL April 2005
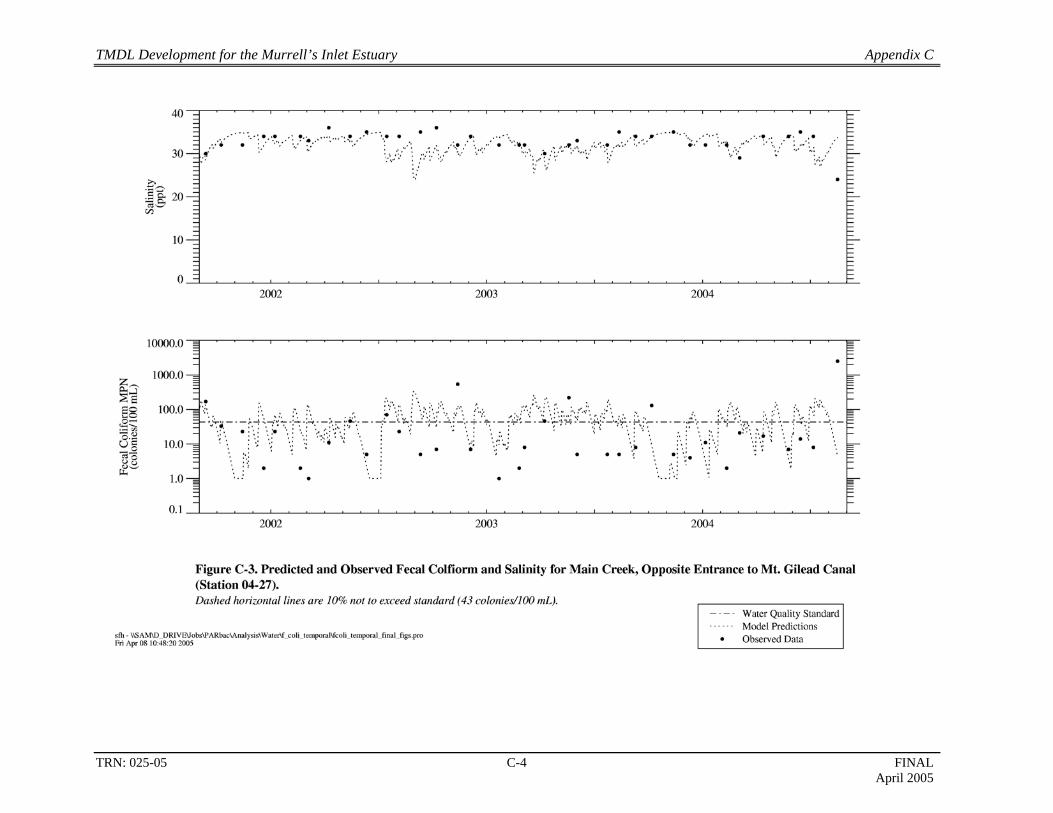
TMDL Development for the Murrell’s Inlet Estuary Appendix C
TRN: 025-05 C-4 FINAL April 2005

TMDL Development for the Murrell’s Inlet Estuary Appendix C
TRN: 025-05 C-5 FINAL April 2005
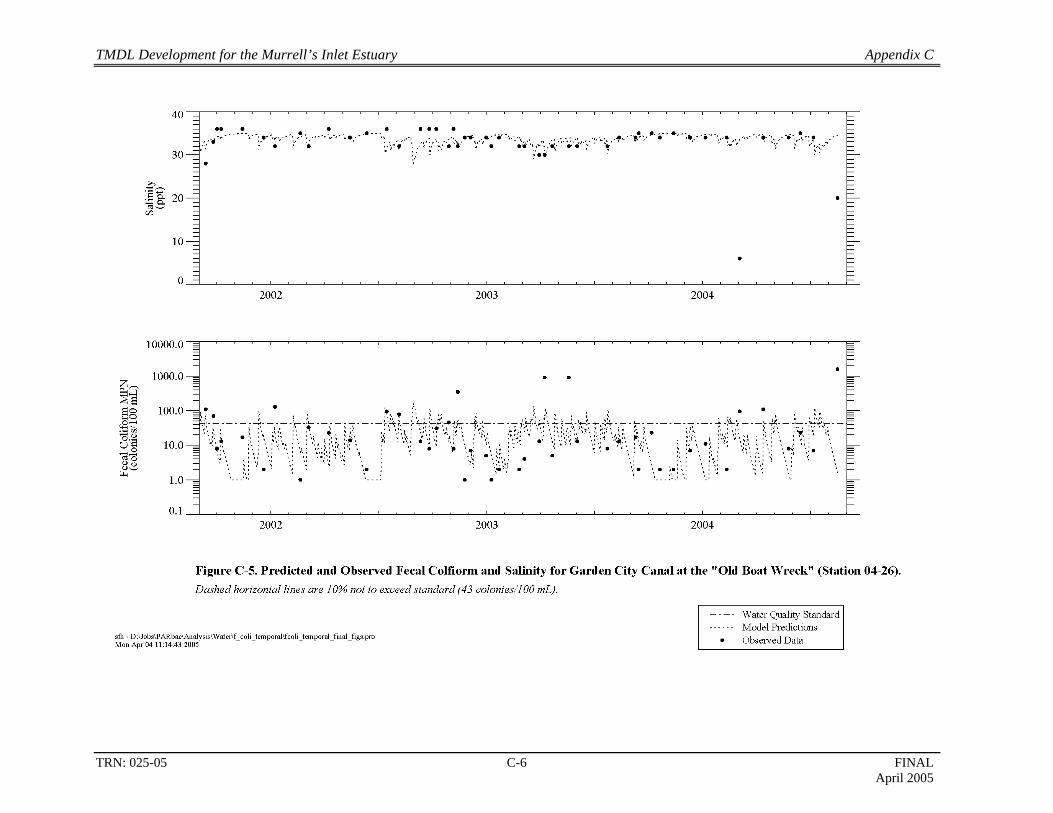
TMDL Development for the Murrell’s Inlet Estuary Appendix C
TRN: 025-05 C-6 FINAL April 2005
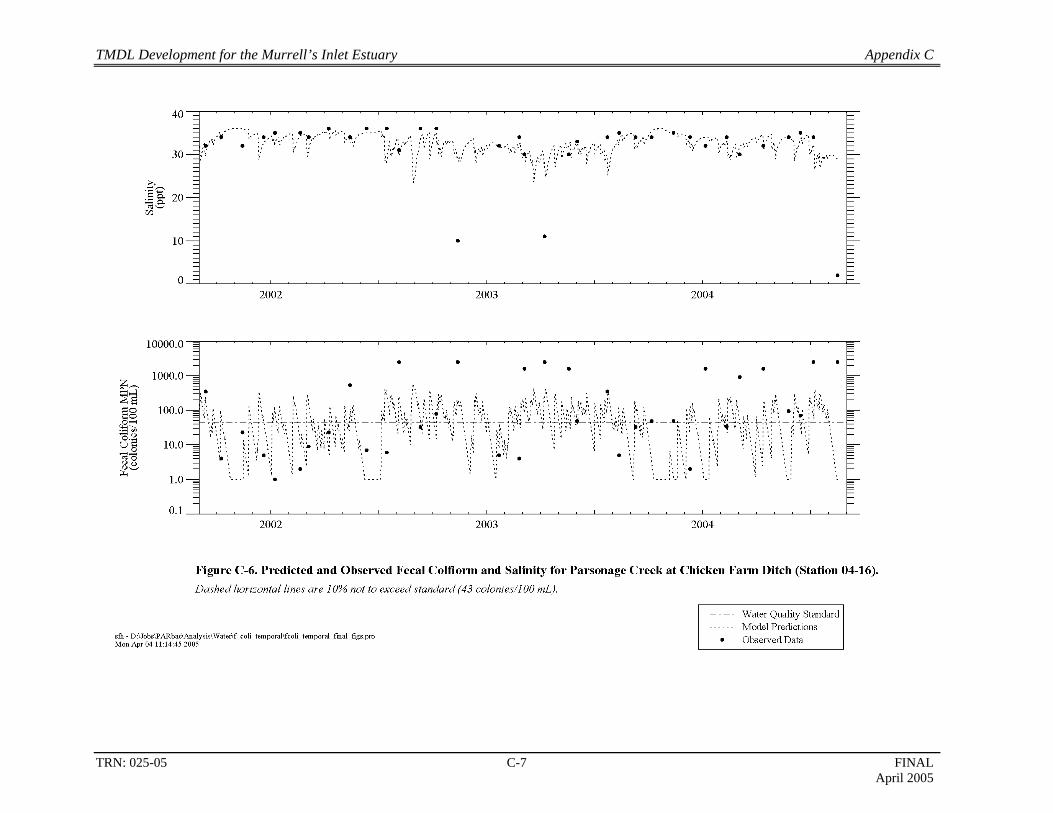
TMDL Development for the Murrell’s Inlet Estuary Appendix C
TRN: 025-05 C-7 FINAL April 2005
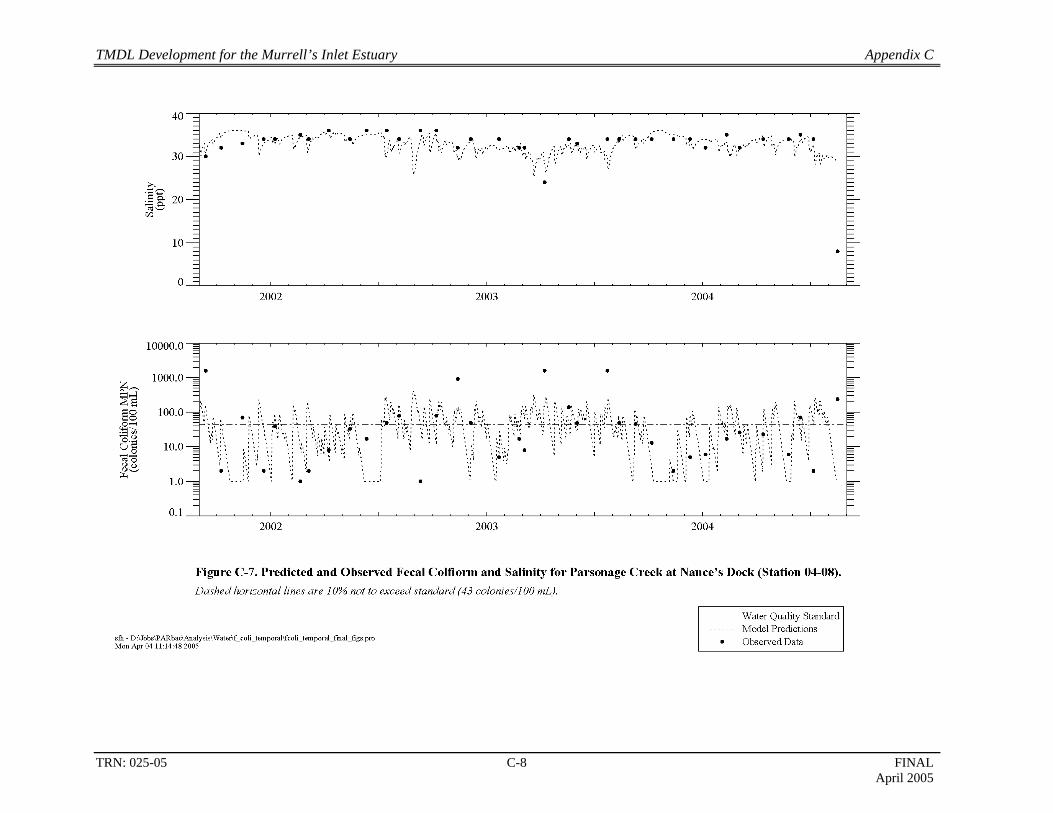
TMDL Development for the Murrell’s Inlet Estuary Appendix C
TRN: 025-05 C-8 FINAL April 2005
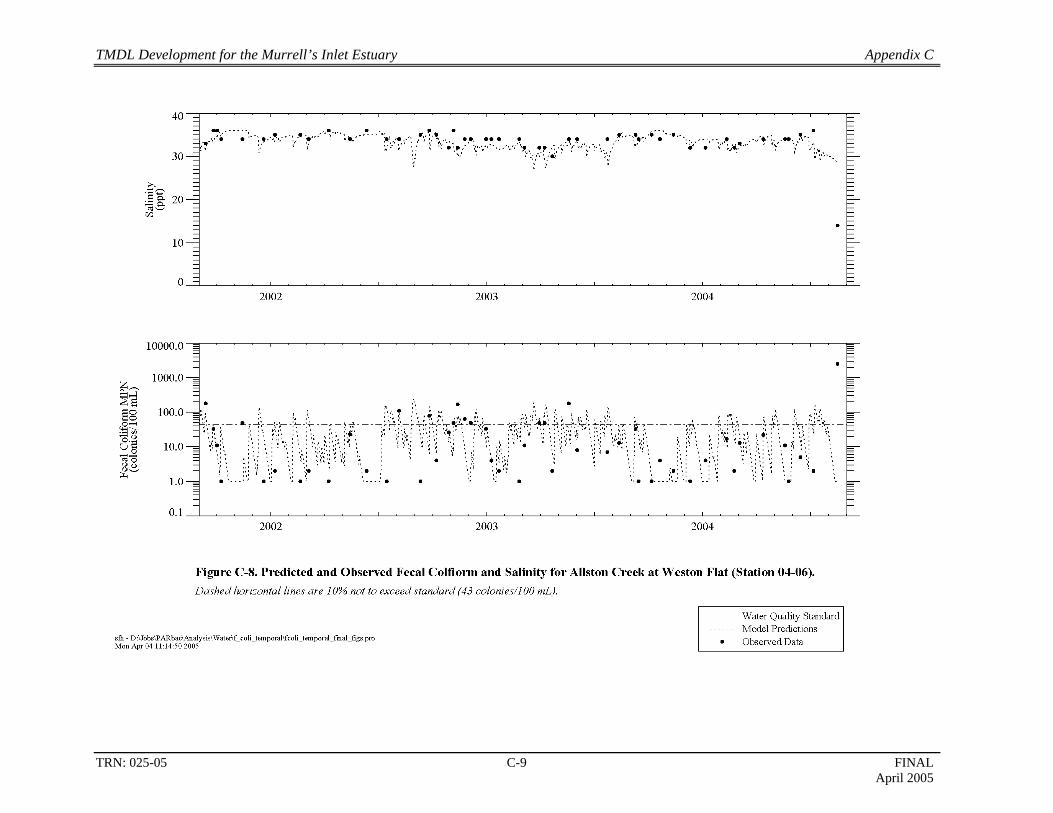
TMDL Development for the Murrell’s Inlet Estuary Appendix C
TRN: 025-05 C-9 FINAL April 2005