total maximum daily load (tmdl) for phosphorus …total maximum daily load (tmdl) for phosphorus in...
TRANSCRIPT

Total Maximum Daily Load (TMDL) for Phosphorus in Chautauqua Lake
Chautauqua County, New York
November 2012
Prepared for:
U.S. Environmental Protection Agency Region 2
290 Broadway New York, NY 10007
New York State Department of Environmental Conservation
625 Broadway, 4th Floor Albany, NY 12233
Prepared by:

TABLE OF CONTENTS 1.0 INTRODUCTION .............................................................................................................................. 4
1.1. Background ........................................................................................................................................ 4
1.2. Problem Statement ............................................................................................................................ 4
2.0 WATERSHED AND LAKE CHARACTERIZATION .............................................................. 5
2.1. History of the Lake and Watershed ................................................................................................ 5
2.2. Watershed Characterization ............................................................................................................. 5
2.3. Lake Morphometry ......................................................................................................................... 10
2.4. Water Quality ................................................................................................................................... 12
3.0 NUMERIC WATER QUALITY TARGET .................................................................................. 13
4.0 SOURCE ASSESSMENT ................................................................................................................. 14
4.1. Analysis of Phosphorus Contributions ........................................................................................ 14
4.2. Sources of Phosphorus Loading ................................................................................................... 14
5.0 DETERMINATION OF LOAD CAPACITY ............................................................................. 19
5.1. Lake Modeling Using the BATHTUB Model ............................................................................. 19
5.2. Linking Total Phosphorus Loading to the Numeric Water Quality Target ........................... 19
6.0 POLLUTANT LOAD ALLOCATIONS ....................................................................................... 21
6.1. Wasteload Allocation (WLA)......................................................................................................... 22
6.2. Load Allocation (LA) ...................................................................................................................... 23
6.3. Margin of Safety (MOS) ................................................................................................................. 23
6.4. Critical Conditions .......................................................................................................................... 27
6.5. Seasonal Variations ......................................................................................................................... 27
7.0 IMPLEMENTATION ....................................................................................................................... 27
7.1. Reasonable Assurance for Implementation ................................................................................. 27
7.2. Follow-up Monitoring .................................................................................................................... 31
8.0 PUBLIC PARTICIPATION ............................................................................................................ 31
8.1 Response to comments received during the initial public comment period .......................... 32
8.2 Response to comments received during the final public comment period ............................ 37
9.0 REFERENCES ................................................................................................................................... 45
10.0 APPENDIX A. AVGWLF MODELING ANALYSIS ............................................................... 48
2
11.0 APPENDIX B. BATHTUB MODELING ANALYSIS .............................................................. 67

3
12.0 APPENDIX C. TOTAL EQUIVALENT DAILY PHOSPHORUS LOAD
ALLOCATIONS ............................................................................................................................... 74
13.0 APPENDIX D. ESTIMATED DISCHARGE DATA FOR WASTEWATER
TREATMENT PLANTS ................................................................................................................. 76

1.0 INTRODUCTION 1.1. Background
In April of 1991, the United States Environmental Protection Agency (EPA) Office of Water’s Assessment and Protection Division published “Guidance for Water Quality-based Decisions: The Total Maximum Daily Load (TMDL) Process” (USEPA 1991b). In July 1992, EPA published the final “Water Quality Planning and Management Regulation” (40 CFR Part 130). Together, these documents describe the roles and responsibilities of EPA and the states in meeting the requirements of Section 303(d) of the Federal Clean Water Act (CWA) as amended by the Water Quality Act of 1987, Public Law 100-4. Section 303(d) of the CWA requires each state to identify those waters within its boundaries not meeting water quality standards for any given pollutant applicable to the water’s designated uses. Further, Section 303(d) requires EPA and states to develop TMDLs for all pollutants violating or causing violation of applicable water quality standards for each impaired water body. A TMDL determines the maximum amount of pollutant that a water body is capable of assimilating while continuing to meet the existing water quality standards. Such loads are established for all the point and nonpoint sources of pollution that cause the impairment at levels necessary to meet the applicable standards with consideration given to seasonal variations and margin of safety. TMDLs provide the framework that allows states to establish and implement pollution control and management plans with the ultimate goal indicated in Section 101(a)(2) of the CWA: “water quality which provides for the protection and propagation of fish, shellfish, and wildlife, and recreation in and on the water, wherever attainable” (USEPA, 1991a). 1.2. Problem Statement Chautauqua Lake (WI/PWL ID North: 0202-0072 and South: 0202-0020) is located in Chautauqua County, New York. The watershed includes areas of the Towns of Chautauqua, North Harmony, Busti, Ellicott, Ellery, Stockton, Harmony, Portland and Sherman; the Villages of Bemus Point, Mayville, Lakewood, Panama and Celeron; and the City of Jamestown. Over the past couple of decades, the Lake has experienced degraded water quality that has reduced the Lake’s recreational and aesthetic value. The Lake consists of two segments, separated by a narrow channel. While recreational conditions in the North segment are often described as “excellent”, the South segment is most often considered “slightly impaired”. The North segment’s water is most often described as “not quite crystal clear”, while the South segment is described as having “definite algae greenness” (NYS DEC, 2007). The Lake experienced a toxic blue-green algal bloom in 2009. The 1996 Allegheny River Basin PWL lists bathing and boating as impaired, fishing, fish survival, and aesthetics as stressed, and fish propagation as threatened due to excessive weed growth (NYS DEC, 2007).
4
Although a variety of sources of phosphorus are contributing to the poor water quality in Chautauqua Lake, it is primarily influenced by runoff events from the drainage basin. In response to precipitation, nutrients, such as phosphorus – naturally found in New York soils – drain into the Lake from the surrounding drainage basin by way of streams, overland flow, and groundwater. Nutrients are then deposited and stored in the Lake bottom sediments. Phosphorus is often the limiting nutrient in temperate lakes and ponds and can be thought of as a fertilizer; a primary food for plants, including algae. When lakes receive excess phosphorus, it “fertilizes” the Lake by feeding the algae. Too much phosphorus can result in algae blooms, which can damage the

ecology/aesthetics of a lake, as well as the economic well-being of the surrounding drainage basin community. The results from state sampling efforts confirm eutrophic conditions in both Chautauqua Lake assessment units (North and South basins), with the concentration of phosphorus in both of the Lake basins violating the state guidance value for phosphorus (20 µg/L or 0.020 mg/L, applied as the mean summer, epilimnetic total phosphorus concentration), which increases the potential for nuisance summertime algae blooms. In 2004, the North and South basins of Chautauqua Lake were both added to the New York State Department of Environmental Conservation (NYS DEC) CWA Section 303(d) list of impaired water bodies that do not meet water quality standards due to phosphorus impairments (NYS DEC, 2010). Based on this listing and their designation as high priority waters for TMDL development, a TMDL for phosphorus is being developed to address the impairment for both Chautauqua Lake North and South. 2.0 WATERSHED AND LAKE CHARACTERIZATION 2.1. History of the Lake and Watershed
The Chautauqua Lake Watershed has likely been inhabited for 10,000-12,000 years. The first significant impacts to the Lake and watershed, however, did not occur until the 19th century when deforestation and overfishing were at their peak. Warner Dam was built in 1919 and is currently used to partially regulate Lake levels. Chautauqua Lake has a long history of water quality monitoring. The Lake was first sampled by the New York State Conservation Department (NYS DEC’s predecessor) as early as 1937 (NYS DEC, 2007). 2.2. Watershed Characterization Chautauqua Lake has a direct drainage basin area of 101,943 acres excluding the surface area of the Lake (Figure 1). Elevations in the Lake’s basin range from approximately 1,863.5 feet above mean sea level (AMSL) to as low as 1,308 feet AMSL at the surface of Chautauqua Lake. Existing land cover in the Chautauqua Lake drainage basin was determined from digital aerial photography and geographic information system (GIS) datasets. Digital land cover data were obtained from Bergmann Associates (NYSDEC, personal communication, 2010). High-resolution color orthophotos were used to manually update and refine land cover for portions of the drainage basin to reflect current conditions (Figure 2). Land use categories (including individual category acres and percent of total) in Chautauqua Lake’s North and South drainage basins were interpreted from the land cover datasets and orthophotos and are listed in Table 1 and presented in Figures 3, 4, and 5.
5

Figure 1. Chautauqua Lake Direct Drainage Basin
6

Figure 2. Aerial Image of Chautauqua Lake
7

Table 1. Land Use Acres and Percent in Chautauqua Lake Drainage Basins
Land Use Category
North Basin South Basin
Acres % of Drainage Basin Acres % of Drainage BasinOpen Water (excluding lake) 44 0.1% 0 0.0% Agriculture 14,216 28.8% 14,379 27.4% Hay & Pasture 10,768 21.8% 11,060 21.1% Cropland 3,448 7.0% 3,319 6.3% Developed Land 1,742 3.5% 3,049 5.8% Low Intensity 1,501 3.0% 2,410 4.6% High Intensity 240 0.5% 639 1.2% Forest 30,712 62.1% 33,214 63.3% Wetland 2,081 4.2% 1,469 2.8% Quarry 24 0.0% 80 0.1% Turf Grass 636 1.3% 297 0.6%
TOTAL 49,455 100% 52,488 100%
Figure 3. Percent Land Use in North Basin of Chautauqua Lake
Figure 4. Percent Land Use in South Basin of Chautauqua Lake
8
Open water0.1% Row Crops
7.0%
Hay & Pasture21.8%
Developed Land3.5%
Forest62.1%
Wetland4.2%
Quarry0.0%
Turf Grass1.3%
Open water0.0% Row Crops
6.3%
Hay & Pasture21.1%
Developed Land5.8%
Forest63.3%
Wetland2.8%
Quarry0.1%
Turf Grass0.6%

Figure 5. Land Use in Chautauqua Lake Drainage Basin
9

2.3. Lake Morphometry
Chautauqua Lake is a 13,132 acre water body at an elevation of about 1,308 feet AMSL. Figures 6 and 7 show bathymetric maps of the North and South segments of Chautauqua Lake developed by The Cadmus Group, Inc. using data collected by the Upstate Freshwater Institute during the summer of 2007. Table 2 summarizes key morphometric characteristics for the two segments of Chautauqua Lake.
Figure 6. Bathymetric Map of the North Segment of Chautauqua Lake
10

Figure 7. Bathymetric Map of the South Segment of Chautauqua Lake
Table 2. Chautauqua Lake Characteristics
North South Surface Area (acres) 7,065 6,067 Elevation (ft AMSL) 1,308 1,308 Maximum Depth (ft) 75 26 Mean Depth (ft) 26 12 Length (ft) 39,780 34,851 Width at widest point (ft) 11,463 10,914 Shoreline perimeter (ft) 127,814 126,710 Direct Drainage Area (acres) 49,455 52,488 Watershed: Lake Ratio 7:1 18:1 Mass Residence Time (years) 0.7 0.4 Hydraulic Residence Time (years) 2.0 0.4
11

2.4. Water Quality NYS DEC’s Citizens Statewide Lake Assessment Program (CSLAP) is a cooperative volunteer monitoring effort between NYS DEC and the New York Federation of Lake Associations (FOLA). The goal of the program is to establish a volunteer lake monitoring program that provides data for a variety of purposes, including establishment of a long-term database for NYS lakes, identification of water quality problems on individual lakes, geographic and ecological groupings of lakes, and education for data collectors and users. The data collected in CSLAP are fully integrated into the state database for lakes, have been used to assist in local lake management and evaluation of trophic status, spread of invasive species, and other problems seen in the state’s lakes. Volunteers undergo on-site initial training and follow-up quality assurance and quality control sessions are conducted by NYS DEC and trained NYS FOLA staff. After training, equipment, supplies, and preserved bottles are provided to the volunteers by NYS DEC for bi-weekly sampling for a 15 week period between May and October. Water samples are analyzed for standard lake water quality indicators, with a focus on evaluating eutrophication status - total phosphorus, nitrogen (nitrate, ammonia, and total), chlorophyll a, pH, conductivity, color, and calcium. Field measurements include water depth, water temperature, and Secchi disk transparency. Volunteers also evaluate use impairments through the use of field observation forms, utilizing a methodology developed in Minnesota and Vermont. Aquatic vegetation samples, deepwater samples, and occasional tributary samples are also collected by sampling volunteers at some lakes. Data are sent from the laboratory to NYS DEC and annual interpretive summary reports are developed and provided to the participating lake associations and other interested parties. As part of CSLAP, a limited number of water quality samples were collected in Chautauqua Lake during the summers of 1990-2007. Additional samples were collected by Chautauqua County in the summers of 1993 and 1994. The results from these sampling efforts show eutrophic conditions in Chautauqua Lake, with the concentration of phosphorus in the Lake exceeding the state guidance value for phosphorus (20 µg/L or 0.020 mg/L, applied as the mean summer, epilimnetic total phosphorus concentration), which increases the potential for nuisance summertime algae blooms. Figure 8 shows the summer mean epilimnetic phosphorus concentrations for phosphorus data collected during all sampling seasons and years in which Chautauqua Lake was sampled; the number annotations on the bars indicate the number of data points included in each summer mean.
12
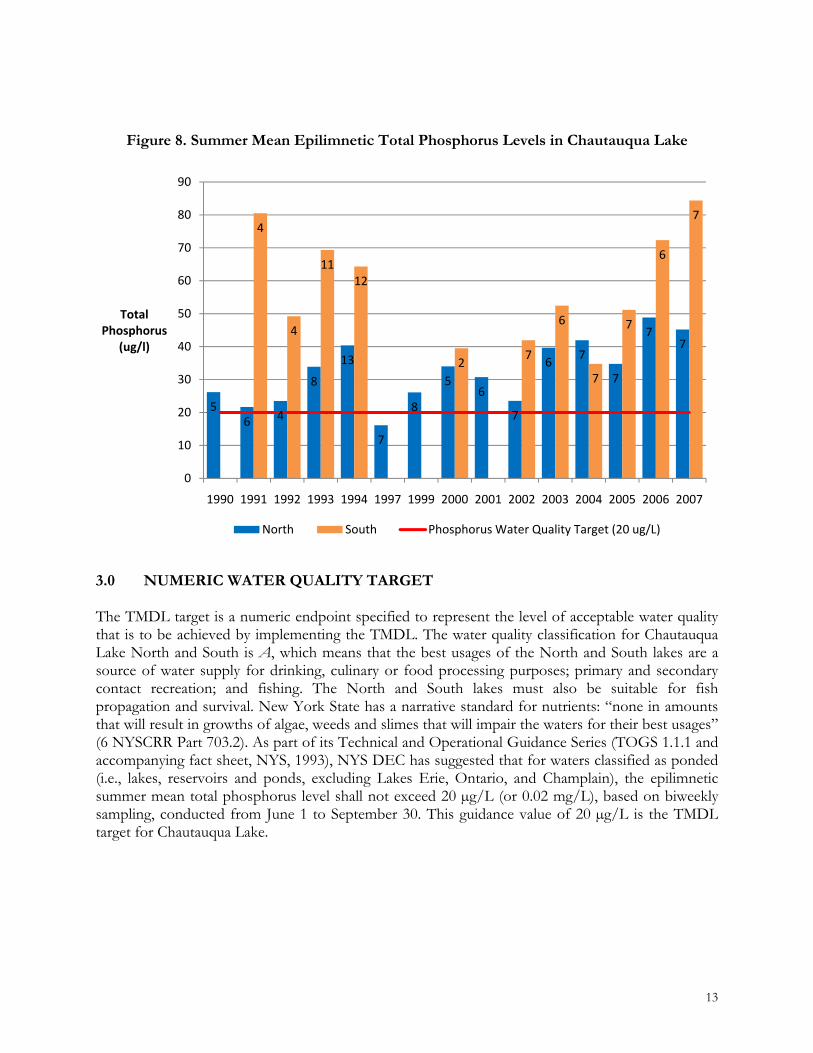
Figure 8. Summer Mean Epilimnetic Total Phosphorus Levels in Chautauqua Lake
3.0 NUMERIC WATER QUALITY TARGET The TMDL target is a numeric endpoint specified to represent the level of acceptable water quality that is to be achieved by implementing the TMDL. The water quality classification for Chautauqua Lake North and South is A, which means that the best usages of the North and South lakes are a source of water supply for drinking, culinary or food processing purposes; primary and secondary contact recreation; and fishing. The North and South lakes must also be suitable for fish propagation and survival. New York State has a narrative standard for nutrients: “none in amounts that will result in growths of algae, weeds and slimes that will impair the waters for their best usages” (6 NYSCRR Part 703.2). As part of its Technical and Operational Guidance Series (TOGS 1.1.1 and accompanying fact sheet, NYS, 1993), NYS DEC has suggested that for waters classified as ponded (i.e., lakes, reservoirs and ponds, excluding Lakes Erie, Ontario, and Champlain), the epilimnetic summer mean total phosphorus level shall not exceed 20 µg/L (or 0.02 mg/L), based on biweekly sampling, conducted from June 1 to September 30. This guidance value of 20 µg/L is the TMDL target for Chautauqua Lake.
13
56 4
8
13
7
8
56
7
6 7
7
77
4
4
1112
27
6
7
7
6
7
0
10
20
30
40
50
60
70
80
90
1990 1991 1992 1993 1994 1997 1999 2000 2001 2002 2003 2004 2005 2006 2007
TotalPhosphorus
(ug/l)
North South Phosphorus Water Quality Target (20 ug/L)

4.0 SOURCE ASSESSMENT 4.1. Analysis of Phosphorus Contributions The ArcView Generalized Watershed Loading Function (AVGWLF) watershed model was used in combination with the BATHTUB lake response model to develop the Chautauqua Lake TMDL. This approach consists of using AVGWLF to determine mean annual phosphorus loading to the Lake, and BATHTUB to define the extent to which this load must be reduced to meet the water quality target. The GWLF model was developed by Haith and Shoemaker (1987). GWLF simulates runoff and stream flow by a water-balance method based on measurements of daily precipitation and average temperature. The complexity of GWLF falls between that of a detailed, process-based simulation model and a simple export coefficient model that does not represent temporal variability. The GWLF model was determined to be appropriate for this TMDL analysis because it simulates the important processes of concern, but does not have onerous data requirements for calibration. AVGWLF was developed to facilitate the use of the GWLF model via an ArcView interface (Evans, 2002). Appendix A discusses the setup, calibration, and use of the AVGWLF model for lake TMDL assessments in New York. 4.2. Sources of Phosphorus Loading AVGWLF was used to estimate long-term (1990-2007) mean annual phosphorus (external) loading to Chautauqua Lake. Additionally, estimates for internal loading were calculated (see Section 4.2.7). The estimated mean annual load of 80,828.7 lbs/yr of total phosphorus that enters Chautauqua Lake comes from the sources listed in Table 3 and shown in Figures 9 and 10. Appendix A provides the detailed simulation results from AVGWLF.
Table 3. Estimated Sources of Phosphorus Loading to Chautauqua Lake
14
Source Total Phosphorus (lbs/yr)
North South Hay/Pasture 1,828.6 711.2 Cropland 1,411.8 935.0 Forest 105.8 54.4 Wetlands 20.6 7.9 Quarry 1.7 7.8 Turf Grass 369.5 50.1 Developed Land 435.6 1,076.5 Groundwater 10,243.0 11,038.7 Stream Bank 36.0 47.8 Septic Systems 975.4 719.4 Point Sources 5,487.4 1,008.0 Internal Loading 7,014.7 29,147.8 Load from North Basin NA 8,094.0
TOTAL 27,930.1 52,898.6

Figure 9. Estimated Sources of Total Phosphorus Loading to Chautauqua Lake
North
Figure 10. Estimated Sources of Total Phosphorus Loading to Chautauqua Lake
South
4.2.1. Wastewater Treatment Plants
The following thirteen wastewater treatment plants were identified in the Lake’s North basin: 1) North Chautauqua Lake Sewage District, 2) Chautauqua Utility District, 3) Chautauqua Heights Sewage District (formerly permitted as Chautauqua Lake Estates, NY 010 3055), 4) Snow Ridge Motel, 5) Crosswinds, 6) Chedwel Club Condos, 7) Bayberry Landing Condo Association, 8) Lake Chautauqua Lutheran Center, 9) Mallard Cove Subdivision, 10) Andriaccio Restaurant, 11) Wee Wood Park, 12) Chautauqua Heights Campground, and 13) Chautauqua State Fish Hatchery. The following nine wastewater treatment plants were identified in the Lake’s South basin: 1) South & Center Chautauqua Lake WWTP, 2) Maplehurst Country Club, 3) Lakeside Auto Court, 4) Sunshine Mobile Home Park, 5) Asheville Fire Department, 6) Maple Grove High School, 7) Panama Central School, 8) Wellman Road Trailer Park, and 9) Hewes Educational Center. Hewes Educational Center was connected to the South & Center Chautauqua Lake WWTP in 2011 but was included in the analysis because the facility was discharging during the simulation period Estimated monthly total phosphorus concentration and flow was estimated by NYS DEC for these facilities; these estimates are provided in Appendix D. These data are used in AVGWLF to calculate phosphorus loading from wastewater treatment plants. Estimated total phosphorus loading from the wastewater treatment plants in the North basin is 5,487.4 lbs/yr (19.6% of the total loading) and 1,008.0 lbs/yr (1.9% of the total loading) in the South basin.
Hay & Pasture6.5%
Cropland5.1%
Forest0.4%
Wetlands0.1%
Quarry 0.0%
Turfgrass1.3%
Developed Land1.6%
Ground‐water36.7%
Stream Bank0.1%
Septic Systems3.5%
Point Sources19.6%
Internal Loading25.1%
15
Hay & Pasture1.3%
Cropland1.8%
Forest0.1%
Wetlands0.0%
Quarry 0.0%
Turfgrass0.0%
Developed Land2.0%
Ground‐water20.9%
Stream Bank0.1%Septic
Systems1.4%
Point Sources1.9%
Internal Loading55.1%
Load from North Basin15.4%

4.2.2. Residential On-Site Septic Systems Residential on-site septic systems contribute an estimated 975.4 lbs/yr of phosphorus to the North basin of Chautauqua Lake and 719.4 lbs/yr to the South basin, which is 3.5% and 1.4% of the total loading to the respective Lake segments. Residential septic systems contribute dissolved phosphorus to nearby water bodies due to system malfunctions. Septic systems treat human waste using a collection system that discharges liquid waste into the soil through a series of distribution lines that comprise the drain field. In properly functioning (normal) systems, phosphates are adsorbed and retained by the soil as the effluent percolates through the soil to the shallow saturated zone. Therefore, normal systems contribute very little phosphorus loads to nearby water bodies. A ponding septic system malfunction occurs when there is a discharge of waste to the soil surface (where it is available for runoff); as a result, malfunctioning septic systems can contribute high phosphorus loads to nearby water bodies. Short-circuited systems (those systems in close proximity to surface waters where there is limited opportunity for phosphorus adsorption to take place) also contribute significant phosphorus loads; septic systems within 250 feet of the Lake are subject to potential short-circuiting, with those closer to the Lake more likely to contribute greater loads. Additional details about the process for estimating the population served by normal and malfunctioning systems within the Lake drainage basin is provided in Appendix A. Approximately 80% of the North Lake’s shoreline and 66% of the South Lake’s shoreline has sewer service. An analysis of orthoimagery, using GIS, was conducted in areas outside of sewer collection zones since all of the houses are assumed to have septic systems. The analysis showed approximately 114 houses within 50 feet of the North Lake’s shoreline and 104 houses within 50 feet of the South Lake’s shoreline. Between 50 and 250 feet of the North Lake’s shoreline, 218 houses were identified and 122 were identified between 50 and 250 feet of the South Lake’s shoreline. Within 50 feet of the shorelines, 100% of septic systems were categorized as short-circuiting. Between 50 and 250 feet of the shoreline, 40% of septic systems were categorized as short-circuiting, 10% were categorized as ponding systems, and 50% were categorized as normal systems. To convert the estimated number of septic systems to population served, an average household size of 2.61 people per dwelling was used based on the circa 2000 USCB census estimate for number of persons per household in New York State. To account for seasonal variations in population, data from the 2000 census were used to estimate the percentage of seasonal homes for the town(s) surrounding the Lake. Approximately 86% of the homes around the Lake are assumed to be year-round residences, while 14% are seasonally occupied (i.e., June through August only). The estimated population in the Chautauqua Lake drainage basin served by normal and malfunctioning systems is summarized in Tables 4 and 5.
Table 4. Population Served by Septic Systems on the Chautauqua Lake North Shoreline
Normally Functioning Ponding Short Circuiting Total September – May 244 49 452 745 June – August (Summer) 284 57 525 866
Table 5. Population Served by Septic Systems on the Chautauqua Lake South Shoreline
16
Normally Functioning Ponding Short Circuiting Total September – May 136 27 342 505 June – August (Summer) 159 32 399 590
4.2.3. Agricultural Runoff Agricultural land encompasses 14,216 acres (28.8%) of the Lake’s North basin and includes hay and pasture land (21.8%) and row crops (7.0%). Overland runoff from agricultural land is estimated to contribute 3,240.4 lbs/yr of phosphorus loading to the North Lake, which is 11.6% of the total phosphorus loading to the North Lake. Agricultural land encompasses 14,379 acres (27.4%) of the Lake’s South basin and includes hay and pasture land (21.1%) and row crops (6.3%). Overland runoff from agricultural land is estimated to contribute 1,646.2 lbs/yr of phosphorus loading to the South Lake, which is 3.1% of the total phosphorus loading to the South Lake. In addition to the contribution of phosphorus to the Lake from overland agriculture runoff, additional phosphorus originating from agricultural lands is leached in dissolved form from the surface and transported to the Lake through subsurface movement via groundwater. The process for estimating subsurface delivery of phosphorus originating from agricultural land is discussed in the Groundwater Seepage section (section 4.2.6). Phosphorus loading from agricultural land originates primarily from soil erosion and the application of manure and fertilizers. Implementation plans for agricultural sources will require voluntary controls applied on an incremental basis. 4.2.4. Urban and Residential Development Runoff Developed land comprises 1,742 acres (3.5%) of the Lake’s North basin and 3,049 (5.8%) of the Lake’s South basin. Stormwater runoff from developed land contributes 435.6 lbs/yr of phosphorus to the North and 1,076.5 lbs/yr to the South Lake, which is 1.6% and 2.0% (respectively) of the total phosphorus loading to the Lake. Turf grass is also considered part of the urban and residential run off. Turf grass comprises 636 acres (1.3%) of the Lake’s North basin and 297 acres (2.6%) of the Lake’s South basin. Runoff from turf grass contributes 369.5 lbs/yr of phosphorus to the North basin and 50.1 lbs/yr to the South basin, which is 1.3% and 0.1% (respectively) of the total phosphorus loading to the Lake. In addition to the contribution of phosphorus to the Lake from overland urban runoff, additional phosphorus originating from developed lands is leached in dissolved form from the surface and transported to the Lake through subsurface movement via groundwater. The process for estimating subsurface delivery of phosphorus originating from developed land is discussed in the Groundwater Seepage section (below). Phosphorus runoff from developed areas originates primarily from human activities, such as fertilizer applications to lawns. Shoreline development, in particular, can have a large phosphorus loading impact to nearby water bodies in comparison to its relatively small percentage of the total land area in the drainage basin. 4.2.5. Natural Background
17
Forested land comprises 30,712 acres (62.1%) of the Lake’s North basin and 33,214 (63.3%) of the Lake’s South basin. Runoff from forested land is estimated to contribute 105.8 lbs/yr of phosphorus loading to the North Lake and 54.4 lbs/yr to the South Lake, which is about 0.4% and 0.1% (respectively) of the total phosphorus loading to the Lake. Phosphorus contribution from forested land is considered a component of background loading. Phosphorus contributions from wetlands

and stream bank erosion are also considered components of background loading. Wetlands comprise about 2,081 acres (4%) of the Lake’s North basin and 1,469 (3%) acres of the Lake’s South basin. Wetlands are estimated to contribute 20.6 lbs/yr of phosphorus to the North Lake and 7.9 lbs/yr to the South Lake, which are less than 0.1% of the total phosphorus loading to the Lake. Stream bank erosion is estimated to contribute an additional 36.0 lbs/yr (0.1%) to the North Lake and 47.8 lbs/yr (0.1%) to the South Lake. 4.2.6. Groundwater Seepage In addition to nonpoint sources of phosphorus delivered to the Lake by surface runoff, a portion of the phosphorus loading from nonpoint sources seeps into the ground and is transported to the Lake via groundwater. Groundwater includes unsaturated, shallow saturated and deep saturated subsurface zones. Groundwater is estimated to transport 10,243.0 lbs/yr (36.7%) of the total phosphorus load to the North Lake and 11,038.7 (20.9%) of the total phosphorus load to the South Lake. With respect to groundwater, there is typically a small “background” concentration owing to various natural sources. In the Chautauqua Lake drainage basin, the model-estimated groundwater phosphorus concentration is 0.054 mg/L for the North basin and 0.055 mg/L for the South basin. The GWLF manual provides estimated background groundwater phosphorus concentrations for ≥90% forested land in the eastern United States, which is 0.006 mg/L. Consequently, about 11% of the groundwater load (1,138.1 lbs/yr in the North basin and 1,204.2 lbs/yr in the South basin) can be attributed to natural sources, including forested land and soils. It is estimated that the remaining 9,104.9 lbs/yr of phosphorus transported to the North Lake through groundwater originates from developed land (1,078.9 lbs/yr) and agricultural sources (8,026.0 lbs/yr), proportional to their respective surface runoff loads. The remaining 9,834.5 lbs/yr of phosphorus transported to the South Lake through groundwater is estimated to originate from developed land (3,888.3 lbs/yr) and agricultural sources (5,946.2 lbs/yr). Table 6 summarizes this information. 4.2.7. Internal Loading Chautauqua Lake has been exposed to nutrient loading that is much higher than its assimilative capacity. Over time, much of this excess phosphorus has been deposited into the bottom sediments. Internal phosphorus loading from lake sediments can be an important component of the phosphorus budget for lakes, especially shallow lakes. Excess phosphorus in a lake’s bottom sediments is available for release back into the water column when conditions are favorable for nutrient release. Such conditions can include re-suspension of sediments by wind mixing or rough
Table 6. Sources of Phosphorus Transported in the Subsurface via Groundwater Total Phosphorus (lbs/yr) % of Total Groundwater Load North South North South Natural Sources 1,138.1 1,204.2 11% 11% Developed Land 1,078.9 3,888.3 11% 35% Agricultural Land 8,026.0 5,946.2 78% 54%
TOTAL 10,243.0 11,038.7 100% 100%
18

fish activity (e.g., feeding off bottom of lake), sediment anoxia (i.e., low dissolved oxygen levels near the sediment water interface), high pH levels, die-offs of heavy growths of curly-leaf pond weeds, and other mechanisms that result in the release of poorly bound phosphorus. Accurate simulation of internal phosphorus loading is an uncertain science and a generally applicable method has yet to be identified. Several existing methods were considered for estimating internal loading in Chautauqua Lake. However, none of these methods were able to accurately simulate the internal loading process. Therefore, once all external sources of phosphorus loading were identified, it was assumed that the remaining load must be originating from internal sources (i.e., lake bottom sediments). Based on this determination, internal loading is estimated to contribute about 7,014.7 lbs/yr (25.1%) of phosphorus to the North Lake and 29,147.8 lbs/yr (55.1%) of phosphorus to the South Lake. 4.2.8. Other Sources Atmospheric deposition, wildlife, waterfowl, and domestic pets are also potential sources of phosphorus loading to the Lake. All of these small sources of phosphorus are incorporated into the land use loadings as identified in the TMDL analysis (and therefore accounted for). Further, the deposition of phosphorus from the atmosphere over the surface of the Lake is accounted for in the Lake model, though it is small in comparison to the external loading to the Lake. The model also accounts for the drainage of the North Lake into the South Lake. The model estimates that the drainage out of the North basin contributes 8,094 lbs/yr (15.4%) of phosphorus to the South basin. 5.0 DETERMINATION OF LOAD CAPACITY 5.1. Lake Modeling Using the BATHTUB Model BATHTUB was used to define the relationship between phosphorus loading to the Lake and the resulting concentrations of total phosphorus in the Lake. The U.S. Army Corps of Engineers’ BATHTUB model predicts eutrophication-related water quality conditions (e.g., phosphorus, nitrogen, chlorophyll a, and transparency) using empirical relationships previously developed and tested for reservoir applications (Walker, 1987). BATHTUB performs steady-state water and nutrient balance calculations in a spatially segmented hydraulic network. Appendix B discusses the setup, calibration, and use of the BATHTUB model. 5.2. Linking Total Phosphorus Loading to the Numeric Water Quality Target
19
In order to estimate the loading capacity of the Lake, simulated phosphorus loads from AVGWLF and internal loads were input to the BATHTUB model to simulate water quality in each of the two Chautauqua Lake segments. AVGWLF was used to derive a mean annual phosphorus loading to the Lake for the period 1990-2007. Using this external load and calculated internal load as input, BATHTUB was used to simulate water quality in the Lake. The results of the BATHTUB simulation were compared against the average of the Lake’s observed summer mean phosphorus concentrations for the years 1990-2007. Year-specific loading was also simulated with AVGWLF and calculated for internal loading, run through BATHTUB, and compared against the observed summer mean phosphorus concentration for years with observed in-lake data. The combined use of AVGWLF, BATHTUB, and internal loading estimates provides a good fit to the observed data for Chautauqua Lake (Figures 11 and 12).

Figure 11. Observed vs. Simulated Summer Mean Epilimnetic Total Phosphorus
Concentrations (µg/L) in Chautauqua Lake North
0
5
10
15
20
25
30
35
40
45
50
TotalPhosphorus
(ug/l)
Observed Simulated
Figure 12. Observed vs. Simulated Summer Mean Epilimnetic Total Phosphorus Concentrations (µg/L) in Chautauqua Lake South
20
0
10
20
30
40
50
60
70
80
90
TotalPhosphorus
(ug/l)
Observed Simulated
The BATHTUB model was used as a “diagnostic” tool to derive the total phosphorus load reduction required to achieve the phosphorus target of 20 µg/L. In order to achieve the 20 µg/L target in the South Basin, the target in the North Basin (which flows into the South) must be set at 17 µg/L. The loading capacity of Chautauqua Lake was determined by running BATHTUB iteratively, reducing the concentration of the drainage basin phosphorus load (which in turn reduced the internal load) until model results demonstrated attainment of the water quality target. As external loading is reduced, internal loading is also reduced; thus the percent reduction in internal loading is estimated to be proportional to the percent reduction in external loading. The maximum concentration that results in compliance with the TMDL target for phosphorus is used as the basis for determining the Lake’s loading capacity. This concentration is converted into a loading rate using simulated flow from AVGWLF. The maximum annual phosphorus load (i.e., the annual TMDL) that will maintain compliance with the phosphorus target of 17 µg/L in the North basin of Chautauqua Lake is a mean annual load of 8,327.4 lbs/yr. The maximum annual phosphorus load (i.e., the annual TMDL) that will maintain compliance with the phosphorus water quality goal of 20 µg/L in the South basin of Chautauqua Lake is a mean annual load of 11,243.4 lbs/yr. The daily TMDL of 22.8 lbs/day in the North basin and 30.8 lbs/day in the South basin was calculated by dividing the annual load by the number of days in a year. Lakes and reservoirs store phosphorus in the water column and sediment, therefore water quality responses are generally related to the total nutrient loading occurring over a year or season. For this reason, phosphorus TMDLs for lakes and reservoirs are generally calculated on an annual or seasonal basis. The use of annual loads, versus daily loads, is an accepted method for expressing nutrient loads in lakes and reservoirs. This is supported by EPA guidance such as The Lake Restoration Guidance Manual (USEPA 1990) and Technical Guidance Manual for Performing Waste Load Allocations, Book IV, lakes and Impoundments, Chapter 2 Eutrophication (USEPA 1986). While a daily load has been calculated for each basin, it is recommended that the annual loading targets be used to guide implementation efforts since the annual load of total phosphorus as a TMDL target is more easily aligned with the design of best management practices (BMPs) used to implement nonpoint source and stormwater controls for lakes than daily loads. Ultimate compliance with water quality standards for the TMDL will be determined by measuring the Lake’s water quality to determine when the phosphorus guidance value is attained. 6.0 POLLUTANT LOAD ALLOCATIONS The objective of a TMDL is to provide a basis for allocating acceptable loads among all of the known pollutant sources so that appropriate control measures can be implemented and water quality standards achieved. Individual waste load allocations (WLAs) are assigned to discharges regulated by State Pollutant Discharge Elimination System (SPDES) permits (commonly called point sources) and unregulated loads (commonly called nonpoint sources) are contained in load allocations (LAs). A TMDL is expressed as the sum of all individual WLAs for point source loads, LAs for nonpoint source loads, and an appropriate margin of safety (MOS), which takes into account uncertainty (Equation 1). Tables 7 and 8 lists the current loading for each source and the load allocation needed to meet the TMDL; Figures 13 and 14 provide a graphical representation of this information.
Equation 1. Calculation of the TMDL
21
MOSLAWLATMDL +∑+∑=

6.1. Wasteload Allocation (WLA) The WLA for Chautauqua Lake - North is set at 1,048.6 lbs/yr. Currently there are 13 permitted wastewater treatment plant dischargers in the North basin of Chautauqua Lake (see Appendix D). The WLA for Chautauqua Lake - South is set at 370.9 lbs/yr. Currently there are 8 permitted wastewater treatment plant dischargers in the South basin of Chautauqua Lake (see Appendix D). There are no MS4s in either basin. Wasteload allocations for point sources are shown in Tables 7 and 8. The WLAs for the three largest dischargers to the North Basin (Chautauqua Heights Sewer District (previously permitted as Chautauqua Lake Estates, NY 010 3055), North Chautauqua Lake Sewer District STP, and Chautauqua Utility District STP) were developed based on the proportion of the mid-point of the design flow and average flow for each facility. This allocation approach more fairly and equitably distributes the burden of achieving reductions among the three major dischargers. The phosphorus content from these secondary treatment facilities contains a much higher proportion of bioavailable phosphorus than other sources in the watershed. Thus, even though the wastewater discharges in total only represent 19.7 percent of the annual total phosphorus load to the North Basin, they are believed to have a disproportionate impact on lake water quality, particularly during the growing season. These facilities also represent the most technologically achievable place to attain load reductions. It is assumed that the majority of the South & Center Chautauqua Lake WWTPs treated effluent enters the Chadakoin River instead of Chautauqua Lake. This assumption was also made in the Chautauqua Lake State of the Lake Report. There are conditions when the effluent may migrate back into the Lake due to differences in density, wind direction etc. This migration may be more pronounced during periods of low flow in the outlet which coincides with the summer growing season. The proposed phosphorus limit is less stringent than the other major facilities to account for the discharge location. The Chadakoin River is however, also impaired by phosphorus and NYSDEC is currently developing nutrient criteria for flowing waters that may provide justification for a more stringent limit for this facility in the future. The WLA of 226 lbs/yr is based on an estimate of 5 percent of the discharge entering the Lake during the growing season at an effluent phosphorus concentration of 0.8 mg/l plus 21 lbs/yr contributed from the Hewes Educational Center. The WLA for the Chautauqua State Fish Hatchery is based on recent phosphorus effluent monitoring of the fish rearing ponds and process water discharges. Due to the extremely low phosphorus concentrations present (0.013 mg/l for the process water and 0.15 mg/l for the fish rearing ponds), requiring treatment would not be technically achievable therefore, the WLA is intended to cap the load from the hatchery. The WLAs for the remaining small dischargers is set at an estimate of their existing discharged load. Based on the nature of treatment provided by these small systems, it would not be financially feasible to require phosphorus removal at these facilities, for the minor reductions in load. All of the small dischargers in the watershed will be required to monitor for phosphorus.
22
One regulated concentrated animal feeding operation (CAFO), Country Ayre Farms LLC, is located in the watershed for the North basin. This CAFO is regulated via the SPDES ECL Permit (GP-0-09-001) for CAFOs. SPDES permits for CAFOs require that the facilities be designed, constructed

23
and operated to have no discharge of pollutants to navigable waters, unless caused by a catastrophic storm (24-hour duration exceeding the 25-year recurrence interval). CAFOs must comply with their no-discharge permit requirements; therefore, loading from the Country Ayre Farms CAFO is assumed to be zero (0). Water quality-based effluent limits (WQBELs) in NPDES permits that implement wasteload allocations in approved TMDLs must be “consistent with the assumptions and requirements of any available wasteload allocation for the discharge” 122.44(d)(1)(vii)(B). These provisions do not require that effluent limits in NPDES permits be expressed in a form that is identical to that in which the wasteload allocation for the discharge is expressed in a TMDL. The permit writer has the flexibility to express the effluent limitation using a time frame appropriate to the water body, pollutant, and the applicable water quality standard. In addition, allocations based on monthly, seasonal or annual timeframes may be used to guide management measures and implementation efforts because they are related to the overall loading capacity of the water body, while the daily expressions represent day to day snapshots of the total loading capacity based on ambient conditions. Given the retention time of Chautauqua Lake, annual (12- month rolling average) load limits would be appropriate. NYS DEC may also adjust the individual permitted discharge WLAs, as long as the total effective WLA to a basin is not increased. 6.2. Load Allocation (LA) The LA for Chautauqua Lake - North is set at 6,446.0 lbs/yr and the LA for Chautauqua Lake - South is set at 9,748.2 lbs/yr. Nonpoint sources that contribute total phosphorus to Chautauqua Lake on an annual basis include loads from developed and agricultural land. Phosphorus originating from natural sources (including forested land, wetlands, and stream banks) is assumed to be a minor source of loading that is unlikely to be reduced further and therefore the load allocation is set at current loading. Internal loads were allocated in the North Basin under the assumption that the internal load will decrease proportionally to decreases in external loads. The bulk of the reductions need to come from agricultural land, which accounts for most of the estimated load in the watershed. 6.3. Margin of Safety (MOS) The margin of safety (MOS) can be implicit (incorporated into the TMDL analysis through conservative assumptions) or explicit (expressed in the TMDL as a portion of the loadings) or a combination of both. For the Chautauqua Lake TMDL, the MOS is explicitly accounted for during the allocation of loadings. An implicit MOS could have been provided by making conservative assumptions at various steps in the TMDL development process (e.g., by selecting conservative model input parameters or a conservative TMDL target). However, making conservative assumptions in the modeling analysis can lead to errors in projecting the benefits of BMPs and in projecting lake responses. Therefore, the recommended method is to formulate the mass balance using the best scientific estimates of the model input values and keep the margin of safety in the “MOS” term. The TMDL contains an explicit margin of safety corresponding to 10% of the loading capacity, or 832.74 lbs/yr in the North basin and 1,124.34 lbs/yr in the South basin. The MOS can be reviewed in the future as new data become available.

Table 7. Total Annual Phosphorus Load Allocations for Chautauqua Lake - South*
* The values reported in Table 7 are annually integrated. Daily equivalent values are provided in Appendix C. ** Includes phosphorus transported through surface runoff and subsurface (groundwater) ***Hewes Educational Center is connected to the South & Center Chautauqua Lake WWTP. As a result, the Hewes Ed. Center’s load of 21.0 lbs/yr has been reallocated to the South & Center Chautauqua Lake WWTP.
24
Source Total Phosphorus Load (lbs/yr)
% Reduction Current Allocated Reduction
Agriculture** 7,592.4 1,235.0 6,357.4 84% Developed Land** 5,014.9 2,903.0 2,111.9 42% Septic Systems 719.4 470.5 248.9 35% Quarry 7.8 7.8 0.0 0% Forest, Wetland, Stream Bank, and Natural Background** 1,314.3 1,314.3 0.0 0%
Internal Loading 29,147.8 0.0 29,147.8 100% Load from North Lake 8,094.0 3,817.6 4,276.4 53% LOAD ALLOCATION 51,890.6 9,748.2 42,142.4 81% South & Center Chautauqua Lake WWTP (NY0106895) 842.1 226.0 616.1 73%
Maplehurst Country Club (NY0204102) 5.9 5.9 0.0 0% Lakeside Auto Court (NY0126365) 11.15 11.15 0.0 0% Sunshine Mobile Home Park (NY0203769) 20.6 20.6 0.0 0%
Ashville Fire Dept. Training Center (NY0258539) 5.05 5.05 0.0 0%
Maple Grove High School (NY0097527) 54.7 54.7 0.0 0%
Panama Central School STP (NY0022373) 41.2 41.2 0.0 0%
Wellman Road Trailer Park (NY0076619) 6.3 6.3 0.0 0%
Hewes Educational Center *** (NY0026964) 21.0 0.0 21.0 100%
WASTELOAD ALLOCATION 1,008.0 370.9 637.1 63% LA + WLA 52,898.6 10,119.1 42,779.5 81% Margin of Safety --- 1,124.34 --- ---
TOTAL 52,898.6 11,243.4 --- ---

Table 8. Total Annual Phosphorus Load Allocations for Chautauqua Lake - North*
* The values reported in Table 8 are annually integrated. Daily equivalent values are provided in Appendix C. ** Includes phosphorus transported through surface runoff and subsurface (groundwater).
25
Source Total Phosphorus Load (lbs/yr)
% ReductionCurrent Allocated Reduction
Agriculture** 11,266.4 2,061.7 9,204.7 82% Developed Land** 1,884.1 1,023.7 860.4 46% Septic Systems 975.4 215.7 759.7 78% Quarry 1.6 1.6 0 0% Forest, Wetland, Stream Bank, and Natural Background** 1,300.5 1,300.5 0 0%
Internal Loading 7,014.7 1,842.8 5,171.9 74% LOAD ALLOCATION 22,442.7 6,446.0 15,996.7 71% Chautauqua Heights Sewer District (NY0269450) 121.8 36.1 85.7 70%
North Chautauqua Lake Sewer District STP (NY0020826) 2,308.5 339.5 1,969.1 85%
Chautauqua Utility District STP (NY0029769) 2,876.8 492.8 2,384.1 83%
Snow Ridge Motel (NY0103080) 3.4 3.4 0.0 0% Crosswinds (NY0203807) 43.7 43.7 0.0 0% Chedwel Club Condos (NY0203696) 27.3 27.3 0.0 0% Bayberry Landing Condo Assn. (NY0060348) 26.3 26.3 0.0 0%
Lake Chautauqua Lutheran Center (NY0102580) 21.0 21.0 0.0 0%
Mallard Cove Subdivision (NY0204935) 5.9 5.9 0.0 0%
Andriaccio Restaurant (NY0203882) 2.1 2.1 0.0 0% Wee Wood Park (NY0128074) 7.2 7.2 0.0 0% Chautauqua Heights Campgrounds (NY0128163) 21.0 21.0 0.0 0%
Chautauqua State Fish Hatchery (NY0035441) 22.4 22.4 0.0 0%
Country Ayre Farms LLC (GP009001) 0.0 0.0 0.0 0%
WASTELOAD ALLOCATION 5,487.4 1,048.6 4,438.8 81% LA + WLA 27,930.1 7,494.6 20,435.4 73% Margin of Safety --- 832.74 --- ---
TOTAL 27,930.1 8,327.4 --- ---

Figure 13. Total Phosphorus Load Allocations for Chautauqua Lake - North (lbs/yr)
Agriculture2,061.7
Forest, Wetland, Stream
Bank, and Natural
Background1,300.5
Quarry 1.6
Developed Land
1,023.7Septic Systems215.7
Point Sources1,048.6
Internal Loading1,842.8
Margin of Safety832.7
Figure 14. Total Phosphorus Load Allocations for Chautauqua Lake - South (lbs/yr)
26
Agriculture1,235.0
Forest, Wetland, Stream
Bank, and Natural
Background1,314.3
Quarry 7.8
Developed Land
2,903.0Septic Systems470.5
Point Sources370.9
Load from North Basin3,817.6
Margin of Safety, 1,124.3

6.4. Critical Conditions TMDLs must take into account critical environmental conditions to ensure that the water quality is protected during times when it is most vulnerable. Critical conditions were taken into account in the development of this TMDL. In terms of loading, spring runoff periods are considered critical because wet weather events transport significant quantities of nonpoint source loads to lakes. However, the water quality ramifications of these nutrient loads are most severe during middle or late summer. Therefore, BATHTUB model simulations were compared against observed data for the summer period only. Furthermore, AVGWLF takes into account loadings from all periods throughout the year, including spring loads. 6.5. Seasonal Variations Seasonal variation in nutrient load and response is captured within the models used for this TMDL. In BATHTUB, seasonality is incorporated in terms of seasonal averages for summer. Seasonal variation is also represented in the TMDL by taking 14 years of daily precipitation data when calculating runoff through AVGWLF, as well as by estimating septic system loading inputs based on residency (i.e., seasonal or year-round). This takes into account the seasonal effects the Lake will undergo during a given year. 7.0 IMPLEMENTATION One of the critical factors in the successful development and implementation of TMDLs is the identification of potential management alternatives, such as best management practices (BMPs) and screening and selection of final alternatives in collaboration with the involved stakeholders. Implementation of this TMDL was aided by the parallel development of a Lake management plan. In that process, Chautauqua County coordinated with state agencies, federal agencies, local governments, and stakeholders such as the Chautauqua County Water Quality Task Force, Chautauqua Lake Management Commission, the general public, environmental interest groups, and representatives from the point and nonpoint pollution sources to outline practical management alternatives. NYS DEC, in coordination with these local interests, will address the sources of impairment using regulatory and non-regulatory tools by matching management strategies with sources and aligning available resources to effect implementation. NYS DEC recognizes that TMDL designated load reductions alone may not be sufficient to address all concerns of eutrophic lakes, such as invasive weeds. The TMDL establishes the required nutrient reduction targets and provides some regulatory framework to effect those reductions. However, the nutrient load only affects the eutrophication potential of a lake. The implementation plan therefore calls for the collection of additional monitoring data, as discussed in Section 7.2, to determine the effectiveness of nutrient reduction management practices. 7.1. Reasonable Assurance for Implementation
27
This TMDL was written with stringent waste load allocations for the four major wastewater treatment plants, along with significant load reductions from agriculture, septic systems and developed land. Meeting the necessary load reductions using this approach is the most technically achievable and financially viable. Reasonable assurance of meeting the TMDL is provided by

requiring load reductions from the point sources, which are the most direct and verifiable, along with significant reductions from nonpoint sources.
7.1.1. Recommended Phosphorus Management Strategies for Septic Systems A systematic approach, such as the formation of a management district, may be beneficial to achieving the load reductions specified above. New York State has begun to offer funding for the abatement of inadequate onsite wastewater systems through the development and implementation of a septic system management program by a responsible management entity. Municipal sewer system expansion should be investigated for high priority areas such as existing lakefront development not currently served such as those located between the beltway and the Lake, systems proximal to tributaries and non-lakefront areas where large numbers of failing on sites systems are documented. New York State passed on July 15, 2010 the Household Detergent and Nutrient Runoff Law (Chapter 205 of the laws of 2010) that prohibits the sale of automatic dishwasher detergent that contains more than 0.5 percent phosphorus by weight. Studies show that this measure could reduce the phosphorus content of domestic sewage by approximately 10 percent. In the interim, a surveying and testing program should be implemented to document the location of septic systems and verify failing systems requiring replacement in accordance with the State Sanitary Code. State funding is also available for a voluntary septic system inspection and maintenance program or a septic system local law requiring inspection and repair. Property owners should be educated on proper maintenance of their septic systems and encouraged to make preventative repairs. To further assist municipalities, NYS DEC is involved in the development of a statewide training program for onsite wastewater treatment system professionals. A largely volunteer industry group called the Onsite Wastewater Treatment Training Network (OTN) has been formed. NYS DEC has provided financial and staff support to the OTN during the last five years. 7.1.2. Recommended Phosphorus Management Strategies for Wastewater Treatment
Facilities
28
In order to provide reasonable assurance that the TMDL will be met, stringent waste load allocations for Chautauqua Heights Sewer District, North Chautauqua Lake Sewer District, Chautauqua Utility District and South & Center Chautauqua Lake WWTP have been adopted. The waste load allocations are then translated into permit limits for each of the facilities. When the SPDES permits are modified following TMDL approval, they will include an interim phosphorus limit of 1.0 mg/l and a staged implementation for the final load limits to become effective 5 years later, most likely in 2017. Also, Chautauqua Heights Sewer District, North Chautauqua Lake Sewer District and Chautauqua Utility District would have the option of participating in a bubble permit. A bubble permit would sum the individual loads from each facility to calculate the combined total load. The combined total load is then compared to the total WLA for the three facilities. The permittees would be in compliance with the bubble permit so long as the combined total load does not exceed the total WLA. If the total WLA is exceeded, the individual loads would be used, for purposes of compliance, to determine which permittee was the cause of the exceedance. An exceedance of the total WLA does not necessarily mean that all participants in the bubble are in violation rather, only those permittees that exceed their individual WLA would be in violation. WLA offsets will be given to a facility for providing sewer service to areas currently served by on-

site septic systems or for accepting wastewater from any of the private, commercial and institutional (PCI) dischargers in the watershed. In addition to the major SPDES dischargers there are 17private, commercial and institutional (PCI) dischargers in both the North and South basins. Based on the nature of treatment provided by these small systems, it would not be financially feasible to require phosphorus removal at these facilities however; minor reductions will be realized due to the passage of the Household Detergent and Nutrient Runoff Law. The permits for these facilities will be modified to include phosphorus monitoring. These facilities should be encouraged to tie into the municipal sewer system, where available. 7.1.3. Recommended Phosphorus Management Strategies for Agricultural Runoff Much has been done in terms of agricultural management in the watershed. Manure from the one CAFO located within the watershed, Country Ayre Farms LLC, as well as from others located just outside the watershed must be applied in accordance with a Comprehensive Nutrient Management Plan, which limits the amount of phosphorus applied to the fields. Country Ayre Farms LLC is regulated under the SPDES ECL Permit (GP-0-09-001) for CAFOs and is given a WLA of zero (0) since the barnyard is required to contain runoff from a 25-year, 24-hour rainfall event. Chautauqua County Soil and Water Conservation District statistics show a large percentage of farms in the watershed are enrolled in the Agricultural Environmental Management (AEM) program. Tables 7 and 8 do not account for the load reduction practices that have already been implemented and the associated reduction that has already been achieved. Despite this progress, loads from agriculture remains a large source of phosphorus loading to the Lake. Without further load reductions, water quality improvements in Chautauqua Lake may be diminished. The New York State Agricultural Environmental Management (AEM) Program was codified into law in 2000. Its goal is to support farmers in their efforts to protect water quality and conserve natural resources, while enhancing farm viability. AEM provides a forum to showcase the soil and water conservation stewardship farmers provide. It also provides information to farmers about Concentrated Animal Feeding Operation (CAFO) regulatory requirements, which helps to assure compliance. Details of the AEM program can be found at the New York State Soil and Water Conservation Committee (SWCC) website, http://www.nys-soilandwater.org/aem/index.html. Using a voluntary approach to meet local, state, and national water quality objectives, AEM has become the primary program for agricultural conservation in New York. It also has become the umbrella program for integrating/coordinating all local, state, and federal agricultural programs. For instance, farm eligibility for cost sharing under the SWCC Agricultural Non-point Source Abatement and Control Grants Program is contingent upon AEM participation. AEM core concepts include a voluntary and incentive-based approach, attending to specific farm needs and reducing farmer liability by providing approved protocols to follow. AEM provides a locally led, coordinated and confidential planning and assessment method that addresses watershed needs. The assessment process increases farmer awareness of the impact farm activities have on the environment and by design, it encourages farmer participation, which is an important overall goal of this implementation plan.
29

The AEM Program relies on a five-tiered process:
Tier 1 – Survey current activities, future plans and potential environmental concerns.
Tier 2 – Document current land stewardship; identify and prioritize areas of concern.
Tier 3 – Develop a conservation plan, by certified planners, addressing areas of concern tailored to farm economic and environmental goals.
Tier 4 – Implement the plan using available financial, educational and technical assistance.
Tier 5 – Conduct evaluations to ensure the protection of the environment and farm viability. Chautauqua County Soil and Water Conservation District should continue to implement the AEM program on farms in the watershed, focusing on identification of management practices that reduce phosphorus loads. In light of the reductions required from the agricultural sector, a recommended goal of 80% participation in the AEM program is suggested. These practices would be eligible for state or federal funding and because they address a water quality impairment associated with this TMDL, should score well. Tier 1 could be used to identify farmers that for economic or personal reasons may be changing or scaling back operations, or contemplating selling land. These farms would be candidates for conservation easements, or conversion of cropland to hay, as would farms identified in Tier 2 with highly-erodible soils and/or needing stream management. Ideally, Tier 3 would include a Comprehensive Nutrient Management Plan with phosphorus indexing at the appropriate stage in the planning process. Additional practices could be fully implemented in Tier 4 to reduce phosphorus loads, such as conservation tillage, stream fencing, rotational grazing and cover crops. Also, riparian buffers reduce losses from upland fields and stabilize stream banks in addition to reducing load by taking land out of production. 7.1.4. Recommended Phosphorus Management Strategies for Urban Stormwater Runoff NYS DEC issued SPDES general permits GP-0-10-001 for construction activities, and GP-0-10-002 for stormwater discharges from municipal separate stormwater sewer system (MS4s) in response to the federal Phase II Stormwater rules. GP-0-10-002 applies to urbanized areas of New York State, so it does not cover the Chautauqua Lake watershed. The Chautauqua Lake Watershed Management Plan (2010) recommends that watershed municipalities should work with the Chautauqua County Soil & Water Conservation District, the Chautauqua County Department of Planning and Economic Development, and the Watershed Coordinator to develop and implement a stormwater, sedimentation, and erosion control ordinance that is consistent with the NYSDEC framework. Stormwater management in rural areas can be addressed through the Nonpoint Source Management Program. There are several measures, which, if implemented in the watershed, could directly or indirectly reduce phosphorus loads in stormwater discharges. Many of the following measures are also recommended in the Chautauqua Lake Watershed Management Plan.
• Public education regarding:
30
• Lawn care, specifically reducing fertilizer use or using phosphorus-free products, now commercially available. Chautauqua County local law and the NYS Household Detergent and Nutrient Runoff Law both restrict the sale and application of fertilizers containing phosphorus.

• Cleaning up pet waste • Discouraging waterfowl congregation by restoring natural shoreline vegetation.
• Management practices to address any significant existing erosion sites. • Construction site and post construction stormwater runoff control ordinance, inspection and
enforcement programs. • Pollution prevention practices for road and ditch maintenance. • Management practices for the handling, storage and use of roadway deicing products
7.1.5. Additional Protection Measures Measures to further protect water quality and limit the growth of phosphorus load that would otherwise offset load reduction efforts should be considered, as identified in the Chautauqua Lake Management Plan. The basic protections afforded by local zoning ordinances could be enhanced to promote smart growth, limit non-compatible development and preserve natural vegetation along shorelines and tributaries. Identification of wildlife habitats, sensitive environmental areas, and key open spaces within the watershed could lead to their preservation or protection by way of conservation easements or other voluntary controls. 7.2. Follow-up Monitoring A targeted post-assessment monitoring effort is necessary to determine the effectiveness of the implementation plan associated with the TMDL. Chautauqua Lake will be sampled at its deepest location in both the North and South basins, during the summer growing season (June through September) on 8 sampling dates as part of the Citizens State Lake Assessment Program (CSLAP). Grab samples will be collected at 1.5 meter below the surface and in the hypolimnion. The samples will be analyzed for the phosphorus series (total phosphorus, total soluble phosphorus, and soluble reactive phosphorus), the nitrogen series (nitrate, ammonia and total nitrogen), and chloride. The epilimnetic samples will be analyzed for chlorophyll a and clarity (Secchi disk depth). A simple macrophyte survey will also be conducted one time during midsummer. Depending on the speed and extent of implementation, the sampling will be repeated at a regular interval. The initial plan will be to encourage continued participation in the CSLAP Program which has a yearly sampling interval. In addition, as information on the DEC GIS system is updated (land use, BMPs, etc.), these updates will be applied to the input data for the models BATHTUB and AVGWLF. The information will be incorporated into the NY 305(b) report as needed. 8.0 PUBLIC PARTICIPATION
31
NYSDEC met with local representatives and stake holders on August 20, 2008 to discuss TMDL development, refine data and to receive local input. Coordination during development of the Chautauqua Lake Watershed Management Plan led to further TMDL refinement. Notice of availability of the draft TMDL was made to local government representatives and interested parties. The draft TMDL was public noticed in the Environmental Notice Bulletin (ENB) on July 28, 2010 and another stakeholder meeting was held on September 21, 2010. A 30-day public review period was established for soliciting written comments from stakeholders. The Department continued discussions with representative of the four largest dischargers to identify allocation and

implementation approaches that more practically an equitably achieved the required load reductions. Based on the significant public comments received and the subsequent revisions made to the document, the TMDL was public noticed for a second time in the ENB on July 27, 2011. The document TMDL was reissued in August, 2011 to solicit any additional written comments from stakeholders prior to the finalization and submission of the TMDL for EPA approval. Comments were received from the Chautauqua County Water Quality Task Force, the Chautauqua Watershed Conservancy and the South and Center Chautauqua Lake Sewer District. Additional comments were received during the final (August 2011) public comment period from the Chautauqua Utility District, the Chautauqua County Department of Health, the Chautauqua County Water Quality Task Force, the Chautauqua County Environmental Management Council, the North Chautauqua Lake Sewer District, the Chautauqua Heights Sewer District, the Crosswinds Homeowners Association, and the Chautauqua Watershed Conservancy. NYS DEC's responses to comments are below, grouped by those comments received during the first comment period followed by those comments received during the final comment period. 8.1. Response to comments received during the initial public comment period South and Center Chautauqua Lake Sewer Districts (S&CCLSD) Comments 1. Section 4.2.1 Wastewater Treatment Plants lists the Hewes Educational Center as one of the nine
wastewater treatment plants in the South Chautauqua Lake basin with a current Total Phosphorus loading of 21.0 lbs/yr. The Hewes Educational Center will be connecting directly to the South and Center Chautauqua Lake Sewer Districts (SCCLSD) in 2011.
Response: As of the date of this draft, the Hewes Educational Center has connected to the South and Center Chautauqua Lake S.D. The historic load of 21 lbs/yr attributed to this facility will remain in the current phosphorus load column of table 7. The WLA will be reallocated to the SCCLSD.
2. Section 6.1 states:
The W(aste) L(oad) A(llocation)(for the Draft TMDL for Chautauqua Lake) is based on 5 percent of the discharge on average seasonally entering the Lake, so the discharge limit for this facility will be set at 205 lbs/yr.
This section points out that the majority of the S&CCLSD effluent enters the Chadakoin River due to its location at the historical southernmost boundary. The engineers have assigned a Waste Load Allocation to the S&CCLSD for 5 per cent of its discharge on average seasonally actually entering the Lake as similarly done in the State of the Lake Report (2000.) This is an arbitrary estimate that should be scientifically examined through dye testing and sampling during various climactic and hydraulic phenomena as defined in the report. Such findings will translate into an allowable mass discharge necessary to protect the Lake and define the capital project to achieve objectives. Any variation to assumed values will have significant impact for both the necessary capital project and associated long term operating costs.
32
Response: S&CCLSD is performing an engineering analysis to determine what upgrades are necessary to achieve various levels of phosphorus removal. It is anticipated that the pending nutrient criteria for flowing waters will drive the level of phosphorus reduction required from

this facility. Please note that the WLA for SCCLSD has been revised to 226 lbs/yr based on the Departments response to comment 1.
3. Section 6.1 also references assumed upcoming regulations for rivers and streams specifically the
Chadakoin River: …NYSDEC is currently developing nutrient criteria for flowing waters that may provide justification for a more
stringent limit for this facility (SCCLSD) in the future.
The S&CCLSD is concerned that the waste load allocations for the Lake TMDL will cause our SPDES permit to be modified prior to review and a possible more restrictive phosphorus discharge limit based on these future predictions for the Chadakoin River. Thus, a capital project entered into by the S&CCLSD to comply with immediate permit modifications might result in wasted expenses if another capital project is required for even more stringent limits for a Chadakoin River TMDL.
Response: The Department has provided SCCLSD further guidance on the potential impact of draft nutrient criteria for flowing waters, and will consider the need for potential future upgrades when establishing the compliance schedule for SCCLSD.
4. Section 4.2.8 Other Sources states: Atmospheric deposition, wildlife, waterfowl, and domestic pets are also potential sources of
phosphorus loading to the Lake. All of these small sources of phosphorus are incorporated into the land use loadings as identified in the TMDL Analysis (and therefore accounted for). Further, the deposition of phosphorus from the atmosphere over the surface of the Lake is accounted for in the lake model, though it is small in comparison to the external loading to the Lake.
Appendix B. BATHTUB Modeling Analysis, Model Set-up states:
Atmospheric phosphorus loads were specified using data collected by USGS from a collection site in Monroe County, New York (Sherwood, 1999.) Atmospheric deposition is not a major source of phosphorus loading to Chautauqua Lake and has little impact on simulations.
Listed in Table 12. BATHTUB Model Input: Global Variable, the Cadmus group lists the mean Total P atmospheric load in mg/ m2 – yr at 29.773 with a .05 coefficient of variation. The reference cited (Monroe County New York Sherwood 1999) uses a significantly higher atmospheric load for atmospheric deposition in their calculations based upon actual research. They list an eighteen year average of 503 lb/mi2 which converts to 87.90 mg/m2 for Total Phosphorus atmospheric deposition. Thus the comparison is 29.773 mg/ m2 to 87.90 mg/ m2 which should be reconciled.
We referred to the 2000 State of the Lake Report (Wilson, Riforgiat and Boria) and found the authors had also used data from Monroe County and that they concluded in:
5-24: Conclusions regarding Cl and TP Annual Budgets: Atmospheric impacts were up to 75% of tributary, periphery, and direct-to-lake (phosphorus) loads.
33
Further investigation into atmospheric phosphorus loadings used in development of other TMDL's or watershed plans in the state show atmospheric phosphorus deposition being taken into account in determining waste load allocations. These discrepancies in atmospheric phosphorus deposition contributions and their affect on the Lake and its watershed from historical studies on Chautauqua Lake and from other similar sources should be reconciled. Atmospheric phosphorus should be listed separately on Tables 3, 6, 7, and 8 rather than merged with other phosphorus sources and allocations.
Response: The Sherwood, D.A., 2005, Water Resources of Monroe County, New York, Water Years 2000-02 Atmospheric Deposition, Ground Water, Streamflow, Trends in Water Quality, and Chemical Loads in Streams: U.S. Geological Scientific Investigations Report 2005-5107 which contains the 18 year average atmospheric deposition of 503 lb/mi2 was referenced in error. This report contains data that was collected at Mendon Ponds County Park using bulk collectors. The Department has strong reservations about using deposition data from bulk collectors due to the significant impact that localized sources of organic debris have on the results (Tsukuda, et al. 2004). The 29.773 mg/ m2 atmospheric load used in the TMDL was obtained from USGS Fact Sheet FS-128-99, October 1999, Phosphorus Loads Entering Long Pond, A Small Embayment of Lake Ontario near Rochester, New York and is comparable to the default value of 30 mg/m2used in Bathtub.
Atmospheric load is implicitly included in the watershed model and therefore does not have a separate term in the allocation tables. Furthermore, atmospheric load is an uncontrollable source and will not have an assigned load reduction.
Chautauqua Watershed Conservancy Comments 1. Table 3 and Section 4.2.5 Stream Erosion: In our degraded system I would break out projected
stream erosion and background stream erosion. I believe the estimated 36 and 47.8 lbs/yr of P from stream banks may be low by an order or orders of magnitude. Presentations by Fred Lubnow and my field observations would indicate a much higher and more significant contribution from stream bank erosion. Can we calculate this from assumed soil loss rates at know locations from Academy data or other data and apply gram mass P per lbs of soil lost to check this?
Response: The model does not have the ability to distinguish between background stream bank erosion and projected erosion. The stream bank erosion load predicted by the model represents 0.1% of the total load to the Lake. Even if this were increased by an order of magnitude it would still represent a small fraction of the total load. In addition, the particulate phosphorus load associated with erosion is not readily available to support algal growth, further limiting its impact.
2. The residential septic systems assumptions seem to hold significant error. Our experience from
mailing addresses for lakeshore homes indicate a much larger percentage of seasonal occupancy and correspondingly fewer year-round residences. Lakeshore residences on septic would be about 60-70% seasonal based on our mailing list.
34
In addition, County Planning’s analysis of private homes within 50/250 feet of the Lake served by on-site septic was completed using GIS parcel and ORPS data determined the following: 348
homes are within 50 ft of the Lake and 217 are within 250 ft. 42% are seasonal residencies. The Chautauqua County household size is 2.45 people per dwelling per the 2000 census not 2.61 as indicated in the TMDL however, the summer season population in a majority of the seasonal residences is greater than 2.61 people per dwelling.
Response: While a higher percentage of homes being seasonally occupied will reduce the yearly total septic load it does not change the load during the summer growing season when occupancy rates are near 100% and when phosphorus inputs to the Lake are far more critical. The yearly septic load used in the TMDL is likely to be overestimated based on this discrepancy. The overestimated load is being used as an offset to the underestimation of septic system loads attributed to the facilities listed in Chautauqua County Water Quality Task Force comment 1 below.
The estimated number of households in the TMDL is similar to those provided in the comment
and will not have an appreciable effect on septic loads. Estimating seasonal occupancy rates is somewhat subjective as some residencies may be used throughout the summer while others may be weekend use only.
3. Is Chautauqua Lake Estates now discharging to the Mayville plant of the NCLSD?
Response: Chautauqua Lake Estates was formerly covered under an individual Private, Commercial and Institutional (PCI) SPDES permit NY0103055. This permit has been discontinued and the facility is currently covered under a municipal permit known as Chautauqua Heights Sewer District WWTP SPDES NY0269450 issued to the Town of Chautauqua. Chautauqua Heights Sewer District was included in the draft TMDL. All references to Chautauqua Lake Estates will be omitted.
4. How can a target of 100% internal load reduction for the South basin and 63% for the North
basin be set? Aren’t these infeasible?
Response: The internal load in the North basin is believed to be responsive to external loads. There is not enough Lake specific information to predict the timing and magnitude of the internal load response to external load reductions. As this TMDL is implemented and highly available phosphorus in wastewater loads are reduced during the growing season, the reduced productivity of the upper waters can be measured, as well as water quality during fall turnover to better assess internal load. Management of nonpoint sources can then be adjusted. Response of internal load in the South basin is what is required to reach the target concentrations. The achievability of attaining the target concentrations may need to be reassessed.
5. It is going to take a lot more aggressive actions to get a 42% and 46% reduction in P from
urban stormwater than proposed in Section 7.1.4.
35
Response: The reductions specified for urban stormwater are at the high end of what is considered achievable, but much less than what is needed in overall load reduction . Section 7.1.5 identifies additional management practices that would affect the phosphorus load attributed to urban storm water. Modeling for other programs and studies has shown that about

a third of the required reduction could be achieved through the implementation of the phosphorus fertilizer laws.
Chautauqua County Water Quality Task Force Comments 1. Remove Andriaccios Restaurant as a point source. The following systems have a subsurface discharge within 250 feet from the Lake: Town of
Chautauqua, Creek’N Lake Campground, Camp Onyahsa, Town of North Harmony, Chautauqua Estates and Camp Chautauqua, Pine Hill Cottages and Motel, Lakeside Camping, Town of Ellery, Camp Mission Meadows, Boys JIM Club and Viking Lake Park. The following facilities have subsurface discharges within 250 feet of a Lake tributary: Town of Chautauqua, Chautauqua Family Campground, Camp Prendergast, Town of Harmony and Baker Estates MHP.
Response: Andriaccios Restaurant (NY 020 3882) has a SPDES permit in effect until 04/30/15. Consequently, their current load and WLA will remain in the TMDL.
The orthoimagery analysis to determine the number of parcels served by on-site septic systems includes the facilities listed as within 250 from the Lake but not those identified as being within 250 feet from a tributary. The TMDL likely underestimates the load from these facilities, however, it is assumed that this error is offset by the overestimated yearly load from all septic systems as described in the Departments response to Comment 2 submitted by the Chautauqua Watershed Conservancy.
2. Discuss elevation of on-site systems along with distance to the Lake in Section 4.2.2.
Chautauqua County Planning noted, using GIS that most homes within 250 feet from a watercourse are below 1,315 feet of elevation (7 feet from water table). This may have implications beyond the 250 foot zone.
Response: The watershed model does not have the ability to take into account the elevation of septic systems.
3. AVGWLF severely underestimates streambank load. We disagree with the assumption on page
34 that reduces streambank erosion by 90% because of glacial terrain. Our glacial till, especially along streams, is highly erodible and many streams in valley areas are in a constant state of erosion.
Response: Please refer to the Department’s response to Chautauqua Watershed Conservancy comment #1.
4. The approach in Section 4.2.2 assumes that all septic systems located farther than 250 feet from
the Lake are operating without any P inputs to ground or surface water. In reality there are some that are failing and others that are short circuiting. Is this accounted for in the model via developed land groundwater?
36
Response: Section 4.2.6 explains how developed land groundwater is accounted for in the model. Approximately 11% of the total groundwater load is attributed to natural sources such

as forested land and soils. The remaining 89% originates from agriculture and developed land and is proportional to their respective surface runoff loads. Septic System loads are not explicitly included in the groundwater load attributed to developed land.
5. There are no regulated MS4s in the watershed however, any system of conveyance that a public
entity has jurisdiction over is an MS4 and are subject to comply with CWA regulations.
Response: While any discharge has the potential to be regulated by the CWA, NYSDEC has not designated any areas of the Chautauqua Lake watershed as an MS4 at this time. NYSDEC has the authority to additionally designate areas as MS4 per criteria 1 of the additionally designated areas definition in G-0-10-002, but has chosen not to as part of this TMDL. Section 7.1.4 recommends that watershed municipalities work with the various entities and stakeholders to develop and implement a stormwater, sedimentation and erosion control ordinance that is consistent with the NYSDEC framework.
6. We feel that phosphorus monitoring needs to be required for all point sources that will not have
a limit.
Response: This suggestion has been included in the TMDL; phosphorus monitoring will be required of all point sources.
7. Data from Fredonia weather station should not be used in the TMDL model because it does not
represent weather patterns in the Chautauqua Lake basin. While the Jamestown weather station also does not fully represent weather patterns in the watershed (especially lake effect snow and rain falling in the northern half of the watershed), it is much closer using it alone than averaging Fredonia and Jamestown.
Response: While there may be some variation in precipitation data that could lead to modeling inaccuracies, they are not believed to affect the management implications of the TMDL.
8.2. Response to comments received during the final public comment period 1. Several commenters expressed strong support for the establishment of the Total Maximum
Daily Load (TMDL) as proposed by the New York State Department of Environmental Conservation in order to substantially reduce the phosphorus entering Chautauqua Lake. They cite excessive plant and algae growth, which may pose a threat to human health, and worries that if the problems within the Lake are not addressed soon they may become much worse. Response: The comment is noted.
2. The TMDL was not developed with sufficient input from the County and the various agencies responsible for treating wastewater around the Lake. The County and the State should have a larger role in the effort to reduce the amount of algae. The burden on the POTWs involved is not fair or realistic.
37
Response: A previous version of the draft TMDL was issued in July, 2010 providing ample opportunity for the County and POTWs to provide input. Prior to that proposal, DEC discussed the approach to the TMDL with the Chautauqua Water Quality Task Force for two

years, and the issue of potential limits for PTOWs was discussed in the development of the Chautauqua Lake Management Plan developed by the County. In June, 2011, DEC provided the impacted POTWs with some allocation alternatives, which were discussed on a conference call. DEC requested feedback from POTW representatives. Preferable options or alternatives provided to the DEC by the POTWs were incorporated into the TMDL. Additional reductions are being sought from several other nonpoint sources as outlined in the TMDL.
3. The data that was used for the in-situ phosphorous concentration is very limited in nature and was collected by non-professionals. No data was collected during the development of the TMDL.
Response: NYSDEC’s Citizens Statewide Lake Assessment Program (CSLAP) participants are trained volunteers and samples were collected following a Quality Assurance Project Plan to ensure the reliability of the data collected. All samples were processed and analyzed by NYS certified analytical laboratories. The samples collected characterize the epilimnetic growing season mean total phosphorus concentration, the basis for the TMDL water quality target. Additional data from the CSLAP program for 2008 – 2010 are consistent with those values measured in previous years. The growing season mean upper epilimnetic total phosphorus in the North Basin varied from 20 – 35 µg l-1 (5 – 6 samples each season) and in the South Basin varied from 40 – 97 µg l-1 (5 – 6 samples each season). Additional data will be collected under CSLAP (refer to Section 8 of the TMDL document). These data will be used to assess TMDL implementation.
4. Significant quantities of phosphorus that were unaccounted for were attributed to internal loading. There does not appear to be any justification for this and it is unclear how reductions of the internal loading can be achieved.
Response: Years of excessive phosphorus loading has resulted in large quantities of phosphorus stored within the Lake. Such internal sources may include higher phosphorus concentrations in the sediments and phosphorus contained within increased biological populations. With the external loads sufficiently quantified the internal loads were estimated as those required to accurately model the observed the phosphorus concentrations in the Lake. The internal load is believed to be responsive to the external loads such that reductions in the latter will result in reductions in the former. Phosphorus is lost from the Lake every year via the Lake outlet. As phosphorus loading from the watershed and point sources decreases more of the annual loss of phosphorus will be from the internal loading, resulting in the projected in-lake reductions.
5. Harvesting of algae and aquatic plants does not appear to be accounted for. Algae and plant
harvesting will have a beneficial effect on the phosphorus balance in that it will remove phosphorus from the Lake and will, over time, reduce the internal loading. The TMDL should also address and explore the use of ecologically friendly, non-toxic use of chemicals, in spray or pellet form, to kill the harmful algae in the Lake. Chemical treatments have been used successfully in many parts of the country.
38

Response: Approximately 3,300 lbs of wet plants need to be harvested to remove one pound of phosphorus, according to estimates in the Chautauqua Lake State of the Lake Report (2000). Mechanical harvesting is currently ongoing in the Lake at an annual cost of $500,000. According to the Chautauqua Lake Association (2011), approximately 20 million pounds of plants were removed from the Lake in 2009, for an estimated phosphorus removal of 6,000 pounds. According to the Chautauqua Lake Watershed Management Plan (2010), mechanical harvesting and biological controls on aquatic vegetation “are positive efforts that are needed now to improve in-lake conditions to support recreational uses. However, they do not fully address the problem of nutrient contamination…” Mechanical harvesting may have a beneficial effect on the phosphorus balance. The use of chemical treatments addresses one aspect of the problem but does not solve the underlying causes of the algal blooms and detrimental aquatic plant growth which is excessive phosphorus loading. The goal of the TMDL is to reduce phosphorus loading to the Lake which will ultimately limit the growth of harmful algae and aquatic plants.
6. A target of 80% or better should be set for participation in and implementation of Agricultural Environmental Management (AEM) program actions and target dates should be set for voluntary implementations. The program should be transitioned to mandatory participation. Response: The AEM Program is a voluntary approach for meeting local, state and national water quality objectives. However, there are incentives, including financial benefits, which are contingent upon AEM participation. The Chautauqua County Soil and Water Conservation District statistics show a large percentage of farms are already enrolled in the AEM program. Because a very high percentage of farmer participation would be needed to reach the load reduction targets set for the agricultural sector, this recommended goal will be added to the Implementation section 7.1.3.
7. The DEC should set a target date for the creation and implementation of a storm water and erosion control ordinance for the Chautauqua Lake watershed. A date of 2015 is recommended to be consistent with the Chautauqua Lake Watershed Management Plan 5 year goals.
Response: The Implementation section 7.1.4 will be amended to refer to the Chautauqua Lake Watershed Management Plan (2010), which recommends that the watershed municipalities work with local and state entities to develop and implement a stormwater, sediment and erosion control ordinance that is consistent with the NYS Stormwater Management Design Manual.
39
8. The data used for the TMDL development does not reflect the recent phosphorus bans on lawn fertilizer and dish washing detergent. It is expected that these bans will have a positive effect.
Response: The commenter correctly notes that the existing loads are based on information prior to the local and state restrictions taking effect. Thus, it is expected that the phosphorus restrictions will result in reduced loading from the watershed to the Lake. Reductions of phosphorus concentrations in streams of roughly 25% were found in Michigan following the introduction of similar fertilizer restrictions (Lehman et al. 2009) and the soluble phosphorus content of runoff from turf grass was also found to decrease by 40% in a University of Michigan study (Struss 2011). Loading to the Lake from several areas of nonpoint sources should therefore be reduced and the anticipated reductions have been incorporated into the load allocations. Reductions are expected to occur primarily in the developed lands, which includes phosphorus transported through surface runoff and subsurface flow (groundwater).
9. The 46% reduction of phosphorus from groundwater and surface water is impossible to achieve
when addressing storm water. We recommend that the DEC separate groundwater and surface water into their own respective categories. The DEC should qualify the reductions from developed land and create sub-categories.
Response: NYSDEC recognizes that the level of reduction is substantial and that the watershed model has limitation on how loads are characterized from urban lands. The watershed model characterizes the “groundwater” portion of dissolved phosphorus and for urban land a primary source of this would be from lawn fertilizers. The state law’s restriction on fertilizer phosphorus is believed to reduce most of the load which the model assigns to the groundwater fraction and will contribute to a substantial reduction in the load through surface routes. It is therefore expected that the phosphorus restrictions will provide a significant but practicable reduction of the ground and surface waters phosphorus loads. See also the response to Comment 8.
10. The model assumptions regarding septic systems may be oversimplified and therefore inaccurate. Given that septic systems are believed to be a significant part of the problem, it is recommended that detailed information should be collected to more accurately determine the true nature of the problem.
Response: The loads attributable to septic systems are calculated using the watershed model, AVGWLF, which has been recommended for use by USEPA and has been used in a number of other similar phosphorus TMDLs. While the loads attributed to the septic systems are, of necessity, based on certain generalizing assumptions, it is believed that the estimates are sufficiently accurate and that further refinement of the septic system data will not significantly alter the assigned loads. Additional funds would be required for further characterization of the load from septic systems. Such efforts are recommended in the Implementation section 7.1.1: “In the interim, a surveying and testing program should be implemented to document the location of septic systems and verify failing systems requiring replacement in accordance with the State Sanitary Code.”
11. The TMDL should clearly state that public sewers be extended to all areas where residential
onsite wastewater treatment systems do not meet the minimum standards set forth in New York State Sanitary Code Appendix 75-A, especially between the beltway (i.e. Routes 394/430) and the Lake and to unsewered population centers proximal to tributaries.
Response: The responsibility for inspection and enforcement regarding residential onsite wastewater treatment systems (septic systems) lies with the NYS Department of Health and with the Chautauqua County Health Department. Towns also have the authority to enact ordinances that could be done in conjunction with an illicit discharge elimination component of their storm water programs. It is beyond the scope of this TMDL to set such a requirement. The Implementation section already includes it as a general recommendation, which will be edited to cite specific watershed locations, and the need for sewering is factored into the load reduction from this sector. See also the response to Comment 12.
40
12. There is widespread interest by both public health professionals and homeowners in extending sewers around the Lake which would eliminate or drastically reduce the phosphorus originating

from septic systems, small SPDES direct dischargers, and groundwater. This type of undertaking (sewer district expansion) will take significant time and resources to determine how best to implement. Studies will need to be performed to examine how best and how far to extend the sewer system, and where to treat the resulting flows.
Response: Extension of municipal sanitary sewers would be beneficial for the reduction of phosphorus loads to the Lake. As noted by the commenter, this would be time and resource intensive but could be eligible for funding in conjunction with wastewater treatment plant upgrades. The Chautauqua Lake Watershed Management Plan (2010) recommends that sewers should first be expanded to existing lake front properties not currently served by municipal sewers and to locations where large numbers of failing onsite systems are impacting water quality. See response to Comment 11.
13. There is no mechanism in the TMDL which requires the small facilities with SPDES permits to meet similar percent reductions of phosphorus as the POTWs. This should be required by 2020. In the interim they should be required to monitor their effluent for phosphorus monthly during the summer season and quarterly throughout the rest of the year and to monitor and report daily flow.
Response: Monitoring will be required as these small sources will have a limit following recall of their permits after the TMDL is approved by the USEPA. It is not economically practical to require similar load reductions from those facilities at this time. Should practical technology develop, or a sewering plan be adopted, the TMDL could be amended to require reductions. Also, the State’s intent to develop numeric criteria for nutrients in flowing streams may also result in required reductions from these facilities in the future.
14. The DEC should not be allowed to "grandfather" any facility/operation from the TMDL requirements.
Response: Those facilities excluded from load reductions under the TMDL contribute small amounts of phosphorus to the Lake. See also the response to Comment 13.
15. New or commercial onsite systems and expansion of existing systems should be required to install advanced phosphorus treatment.
Response: For those facilities which require new discharge permits or the modification of existing discharge permits to surface waters, those limits will be set so as to be in agreement with the goals of the TMDL. Discharge locations will be reviewed for assurance that they will not contribute additional phosphorus.
16. The TMDL only requires action from the largest permitted point sources, which account for approximately 8% of the loading to the North and South Basins. Requiring the large permitted point sources to remove 80 plus percent of 8% of the phosphorus loading will not significantly reduce the phosphorus concentration in the Lake.
41
Response: The point sources represent about one fifth of the estimated overall load to the North Basin and a quarter of the external load. As noted in the TMDL, the phosphorus content from these secondary treatment facilities contains a much higher proportion of bioavailable

phosphorus than other sources in the watershed so they are believed to have a disproportionate impact on lake water quality, particularly during the growing season. It is far less cost effective and in many cases technically infeasible to require load reductions from the smaller permitted point sources. Significant phosphorus reductions will also come about from nonpoint source load reductions.
17. We believe that there are many sources which result in phosphorus discharges to Chautauqua Lake not originating with the four sewer treatment plants which surround the Lake. We would urge that there be a comprehensive enforcement plan undertaken to reduce phosphorus discharges to the Lake emanating from private septic systems and other sources. Response: Any systems which result in discharges to the surface can be referred to NYSDEC for enforcement. The TMDL does recommend establishment of management districts and in the interim, a surveying and testing program to document the location of septic systems and to verify failing systems requiring replacement in accordance with the State Sanitary Code. Reductions are also sought from other sources. See the responses to Comments 6 – 8 and 11.
18. All POTWs were assumed to discharge the same concentration of phosphorus. No data was collected to support this.
Response: Information supplied by two of the dischargers was in line with the general assumptions. Phosphorus discharge information contained within the State of the Lake Report (2000) for three of the four POTWs indicate average discharges in the range of 1.3 – 3.2 mg l-1, with a volume weighted average of 2.1 mg l-1. No recent data was available for the other POTW discharges, with the exception of the fish hatchery. The number selected is a best estimate to sufficiently represent the amount of phosphorus contributed to the Lake by the POTWs. Because the major POTWs will be required to reduce phosphorus loads significantly, the contributions of the POTWs to the Lake under the TMDLs final requirements are more important than their current contributions.
19. We are advised that, in the future, there may be an increase in standards concerning nitrogen/ammonium removal from effluent discharged into the Lake as well. We would urge that DEC promulgate rules and regulations which will enable the district to know what requirements will be imposed in the future so that the design and modifications attempt to incorporate those requirements which may be more cost effective than having to make modifications in future years.
Response: Ammonia and total residual chlorine limits will be required to protect against aquatic toxicity. The ammonia limits will vary seasonally. When the permits are reopened for the waste load allocations, ammonia and total residual chlorine requirements will also be put into place with appropriate compliance schedules.
20. The “bubble approach” for POTWs should not be utilized. It is also unclear how season variations of discharges from these POTWs would fit into the model of the “bubble approach”.
42
Response: The purpose of the TMDL is to reduce overall yearly loading of phosphorus to the Lake. Allowing the bubble permit gives the POTWs some flexibility in attaining their required discharge limits while still meeting the goals of the TMDL. One major POTW in the North

Basin has informed NYSDEC that they do not wish to participate in a bubble permit. In receiving this and other comments on the TMDL, NYSDEC has decided not to allow the bubble on the interim limits for individual POTWs in order to effectively reduce local summertime discharges of highly bioavailable phosphorus. The final limits will address less immediately available phosphorus. The bubble will be written into the final permits of the other two POTWs discharging to the North Basin. This may be more cost effective for the POTWs, who are faced with significant costs associated with attaining the reductions required by the TMDL, without jeopardizing the goals of the TMDL.
21. The DEC should hold to the current time tables described in the document.
Response: It is the intention of the DEC at this time to keep the current time tables. However, in light of the economic challenges faced by some of the facilities, the time line may need to be revised in the future. See the responses to Comments 22 – 23.
22. A five-year final limit schedule will be difficult to meet, particularly if no outside funding assistance is provided. We would urge that DEC permit phasing, to allow construction and financing of necessary modifications to the sewage treatment plant over a number of years.
Response: The NYSDEC recognizes that the TMDL will result in significant expenditures by the POTWs; however, the five-year implementation plan will be retained in the TMDL. Final implementation schedules will be developed for each POTW subject to a consent order. The NYSDEC will consider revising the TMDL if a locally supported sewer extension plan is developed. The revision would reallocate load reductions from septic systems or small discharges to the POTW treating the waste and extend the implementation dates as needed.
23. A one-year interim limit of 1 mg l-1 should be possible assuming chemical addition alone is necessary (no mixing, no flocculation, no sludge handling, etc.). The NYSDEC should go forward with the interim P limits of 1 mg l-1 but hold off on the lower P limits until a more comprehensive TMDL can be developed.
Response: As written in the TMDL, a 1 mg l-1 interim limit will be put in place once the permits are modified following approval of this TMDL. The lower phosphorus limit will become effective 5 years after the permits are initially modified, most likely in 2017. See also the response to Comment 22.
24. As a practical matter, control/elimination of point source phosphorous discharge is understood
as necessary to the long-term sustainability of Chautauqua Lake. Yet, a higher impact near-term intervention strategy is still needed if the Lake is to be restored to a condition that we all desire. Response: It is believed that the reductions specified within the TMDL will be sufficient to restore the Lake to the desired condition. The Implementation plan includes recommendations and strategies ranging from current and ongoing efforts to short and long term solutions.
43
25. The TMDL point source limits that have been proposed will result in estimated expenditures of between $5 and $15 million by the affected POTWs. A dedicated funding source needs to be

44
established to fund the capital upgrades. Funds should derive from a County or State source because the benefits will extend far beyond the affected sewer districts.
Response: NYS DEC has identified potential sources of funding available to the POTWs to help offset some of the costs of any plant upgrades necessitated by this TMDL. This information has been made available to those affected entities. Pursuit of these or any other sources of funding ultimately is the responsibility of the POTWs or their overseeing entities. See also the response to Comment 22.
26. Chautauqua Utility District (CUD) is a special district corporation created by a special act of the
New York State Legislature, Chapter 85 of the Laws of 1934. That legislation requires that the governing board of CUD, the Board of Commissioners, submit any proposed capital expenditure in excess of $100,000 for a mandatory public referendum. Although CUD has the legal authority to issue serial bonds in its name, pursuant to provisions of the Local Finance Laws of the State of New York, it must first obtain the consent of the Town Board of the Town of Chautauqua. If the Town Board of the Town of Chautauqua does not approve the proposed financing by CUD, existing state law would not permit CUD to proceed with the project. Response: The comment is noted, and this requirement could factor into a consent order. See also the response to Comments 22 and 25.
27. Although we have been attempting to determine the limitations imposed by the recent legislation
enacted by the State of New York earlier this summer, imposing a 2% cap on real estate taxes, based upon information contained in a publication issued in August, 2011, by the New York State Association of Counties, it appears that the 2% cap will apply to special ad valorem levies and special assessments, which is the type of levy historically used by CUD to pay for debt service of serial bonds issued by CUD. Response: NYSDEC Office of Counsel confirms that this is an accurate interpretation of the legislation. See also the response to Comments 22 – 23 and 25-26.
28. We would urge the DEC to consider providing some type of alternative to CUD, if the
restrictions imposed by the general laws for the State of New York and by the special act which created the CUD, prevent CUD from making the improvements to its sewage treatment plant to comply with this DEC regulation. Response: See the responses to Comments 22 and 25.
9.0 REFERENCES 40 CFR Part 130 Water Quality Planning and Management ASCE Task Committee on Definition of Criteria for Evaluation of Watershed Models of the Watershed Management Committee, Irrigation and Drainage Division, 1993. Criteria for evaluation of watershed models. Journal of Irrigation and Drainage Engineering, Vol. 199, No. 3. Chautauqua County Department of Planning and Development, 2000. “Chautauqua Lake – Entering the 21st Century: State of the Lake Report.” Michael P. Wilson, Kelly D. Riforgiat and William T. Boria (eds.). Chautauqua County Department of Planning and Economic Development, 2010. “Chautauqua Lake Watershed Management Plan.” <http://www.planningchautauqua.com/watershed/ chautlake_mgmt_plan.htm> Accessed October 3, 2011. Chautauqua Lake Association, 2011. “Chautauqua Lake Association Report on 2009 Achievements.” <http://www.chautauqualake.org/events.htm>. Accessed October 4, 2011. Day, L.D., 2001. Phosphorus Impacts from Onsite Septic Systems to Surface Waters in the Cannonsville Reservoir Basin, NY. Delaware County Soil and Water Conservation District, Walton, NY, June, 2001. Evans, B.M., D.W. Lehning, K.J. Corradini, 2007. Summary of Work Undertaken Related to Adaptation of AVGWLF for Use in New England and New York. Evans, B.M., D.W. Lehning, K.J. Corradini, G.W. Petersen, E. Nizeyimana, J.M. Hamlett, P.D. Robillard, and R.L. Day, 2002. A Comprehensive GIS-Based Modeling Approach for Predicting Nutrient Loads in Watersheds. Journal of Spatial Hydrology, Vol. 2, No. 2. Haith, D.A. 1993. RUNQUAL: Runoff Quality from Development Sites Users Manual. Cornell University Department of Agricultural and Biological Engineering. Haith, D.A. and L.L. Shoemaker, 1987. Generalized Watershed Loading Functions for Stream Flow Nutrients. Water Resources Bulletin, 23(3), pp. 471-478. Lehman, J. T., D. W. Bell, and K. E. McDonald, 2009. Reduced river phosphorus following implementation of a lawn fertilizer ordinance. Lake Reserv. Manage. 25:307–312. National Oceanic and Atmospheric Administration (NOAA). 2005. Coastal Change Analysis Program Regional Land Cover. http://www.csc.noaa.gov/digitalcoast/data/ccapregional/index.html. National Atmospheric Deposition Program (NRSP-3). 2007. NADP Program Office, Illinois State Water Survey, 2204 Griffith Dr., Champaign, IL 61820.
45
New York State Department of Environmental Conservation and New York Federation of Lake Associations, 2007. 2006 Interpretive Summary, New York Citizens Statewide Lake Assessment Program, Chautauqua Lake.
NYS DEC, 2010. New York State 2010 Section 303(d) List of Impaired Waters Requiring a TMDL/Other Strategy. NYS Department of Environmental Conservation, Division of Water, Bureau of Watershed Assessment and Management. New York State, 1998. 6 NYS Codes Rules and Regulations, Part 703.2, Narrative Water Quality Standards. New York State, 1993. New York State Fact Sheet, Ambient Water Quality Value for Protection of Recreational Uses, Substance: Phosphorus, Bureau of Technical Services and Research. NYS Department of Environmental Conservation. Pitt, R., A. Maestre, and R. Morquecho. 2008. National Stormwater Quality Database, Version 3. February. http://unix.eng.ua.edu/~rpitt/Research/ms4/Table%20NSQD%20v3%20Feb%2003,%202008.xls Sherwood, D.A., 1999, Phosphorus Loads Entering Long Pond, A Small Embayment of Lake Ontario near Rochester, New York: U.S. Geological Survey Fact Sheet FS-128-99. Struss, Ron, 2011. “Nitrogen and Phosphorus Pollution Series: State and Local Policies to Restrict the Use of Lawn Fertilizers.” U.S. EPA Watershed Academy Webcast. September 21. United States Army Corps of Engineers, Engineer Research and Development Center., 2004. Flux, Profile, and BATHTUB: Simplified Procedures for Eutrophication Assessment and Prediction. <http://el.erdc.usace.army.mil/elmodels/emiinfo.html>. USEPA. 2002. Onsite Wastewater Treatment Systems Manual. EPA/625/R-00/008. February 2002. USEPA, 1999. Protocol for Developing Sediment TMDLs (First Edition). EPA 841-B-99-004. Office of Water (4503F), United States Environmental Protection Agency, Washington, DC. USEPA. 1991a. Technical support document for water quality-based toxics control. Office of Water. Washington, D.C. March 1991. EPA/505/2-90-001. USEPA. 1991b. April 1991. Guidance for Water Quality-Based Decisions: The TMDL Process. EPA 440/4-91001. USEPA. 1990. The Lake and Reservoir Restoration Guidance Manual. 2nd Ed. and Monitoring Lake and Reservoir Restoration (Technical Supplement). Prepared by North American Lake Management Society. EPA 440/4-90-006 and EPA 440/4-90-007. USEPA. 1986. Technical Guidance Manual for Performing Wasteload Allocations, Book IV: Lakes, Reservoirs and Impoundments, Chapter 2: Eutrophication. EPA 440/4-84-019, p. 3-8.
46
United States Census Bureau, Census 2000 Summary File 3 (SF 3) - Sample Data. H18. AVERAGE HOUSEHOLD SIZE OF OCCUPIED HOUSING UNITS BY TENURE Average Household Size of Occupied housing Units by Tenure. 2007, http://factfinder.census.gov/

Walker, W.W., Jr. 1987. Empirical Methods for Predicting Eutrophication in Impoundments. Report 4-Phase III: Applications Manual. U.S. Army Corps of Engineers Technical Report E-81-9. U.S. Army Waterways Experiment Station, Environmental Laboratory, Vicksburg, MS. Watts, S., B. Gharabaghi, R.P. Rudra, M. Palmer, T. Boston, B. Evans, and M. Walters, 2005. Evaluation of the GIS-Based Nutrient Management Model CANWET in Ontario. In: Proc. 58th
Natl. Conf. Canadian Water Resources Assoc., June 2005, Banff, Canada. Wilson, M., K. Riforgiat, W. Boria. 2001. Chautauqua Lake – Entering the 21st Century: State of the Lake Report. Chautauqua County Department of Planning and Development.
47
Tsukuda, S., M. Sugiyama, Y. Harita, and K. Nishimura. "A Methodological Re-Examination of Atmospheric Phosphorus Input Estimates Based on Spatial Microheterogeneity." Water, Air and Soil Pollution, 2004: 333-347.

10.0 APPENDIX A. AVGWLF MODELING ANALYSIS Northeast AVGWLF Model The AVGWLF model was calibrated and validated for the northeast (Evans et al., 2007). AVGWLF requires that calibration watersheds have long-term flow and water quality data. For the northeast model, watershed simulations were performed for twenty-two (22) watersheds throughout New York and New England for the period 1997-2004 (Figure 15). Flow data were obtained directly from the water resource database maintained by the U.S. Geological Survey (USGS). Water quality data were obtained from the New York and New England State agencies. These data sets included in-stream concentrations of nitrogen, phosphorus, and sediment based on periodic sampling. Figure 15. Location of Calibration and Verification Watersheds for the Northeast AVGWLF
Model
Initial model calibration was performed on half of the 22 watersheds for the period 1997-2004. During this step, adjustments were iteratively made in various model parameters until a “best fit” was achieved between simulated and observed stream flow, and sediment and nutrient loads. Based on the calibration results, revisions were made in various AVGWLF routines to alter the manner in which model input parameters were estimated. To check the reliability of these revised routines, follow-up verification runs
48
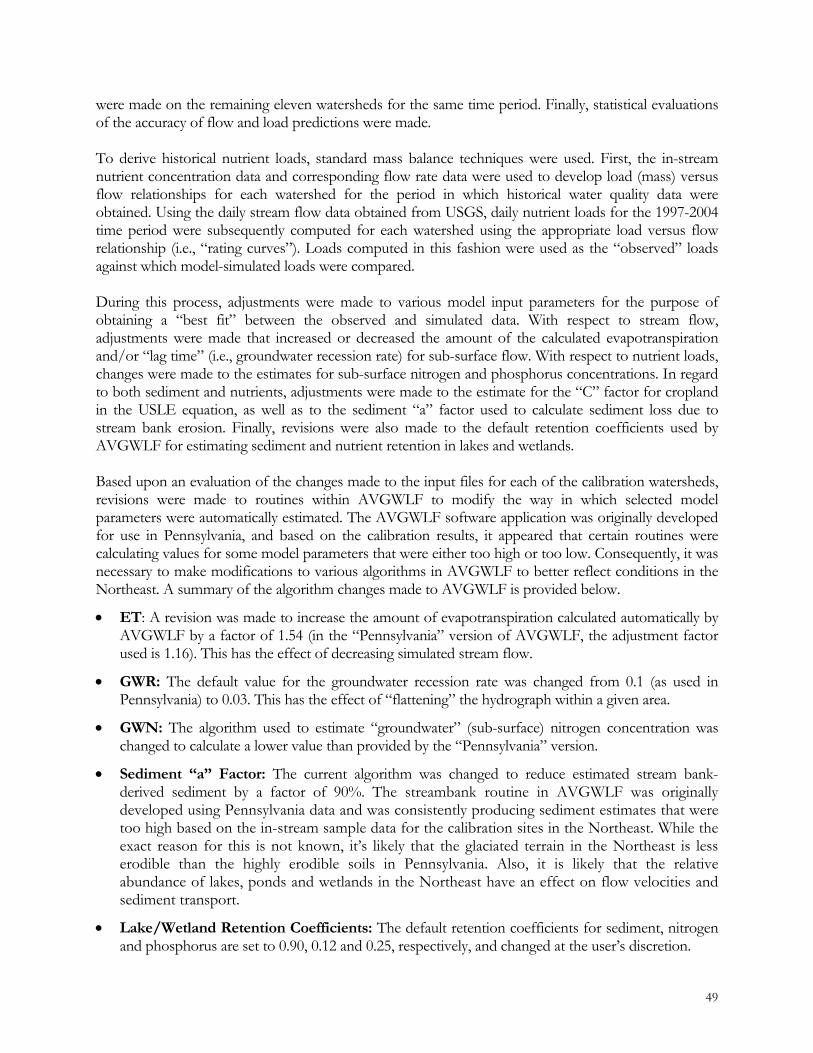
were made on the remaining eleven watersheds for the same time period. Finally, statistical evaluations of the accuracy of flow and load predictions were made. To derive historical nutrient loads, standard mass balance techniques were used. First, the in-stream nutrient concentration data and corresponding flow rate data were used to develop load (mass) versus flow relationships for each watershed for the period in which historical water quality data were obtained. Using the daily stream flow data obtained from USGS, daily nutrient loads for the 1997-2004 time period were subsequently computed for each watershed using the appropriate load versus flow relationship (i.e., “rating curves”). Loads computed in this fashion were used as the “observed” loads against which model-simulated loads were compared. During this process, adjustments were made to various model input parameters for the purpose of obtaining a “best fit” between the observed and simulated data. With respect to stream flow, adjustments were made that increased or decreased the amount of the calculated evapotranspiration and/or “lag time” (i.e., groundwater recession rate) for sub-surface flow. With respect to nutrient loads, changes were made to the estimates for sub-surface nitrogen and phosphorus concentrations. In regard to both sediment and nutrients, adjustments were made to the estimate for the “C” factor for cropland in the USLE equation, as well as to the sediment “a” factor used to calculate sediment loss due to stream bank erosion. Finally, revisions were also made to the default retention coefficients used by AVGWLF for estimating sediment and nutrient retention in lakes and wetlands. Based upon an evaluation of the changes made to the input files for each of the calibration watersheds, revisions were made to routines within AVGWLF to modify the way in which selected model parameters were automatically estimated. The AVGWLF software application was originally developed for use in Pennsylvania, and based on the calibration results, it appeared that certain routines were calculating values for some model parameters that were either too high or too low. Consequently, it was necessary to make modifications to various algorithms in AVGWLF to better reflect conditions in the Northeast. A summary of the algorithm changes made to AVGWLF is provided below.
• ET: A revision was made to increase the amount of evapotranspiration calculated automatically by AVGWLF by a factor of 1.54 (in the “Pennsylvania” version of AVGWLF, the adjustment factor used is 1.16). This has the effect of decreasing simulated stream flow.
• GWR: The default value for the groundwater recession rate was changed from 0.1 (as used in Pennsylvania) to 0.03. This has the effect of “flattening” the hydrograph within a given area.
• GWN: The algorithm used to estimate “groundwater” (sub-surface) nitrogen concentration was changed to calculate a lower value than provided by the “Pennsylvania” version.
• Sediment “a” Factor: The current algorithm was changed to reduce estimated stream bank-derived sediment by a factor of 90%. The streambank routine in AVGWLF was originally developed using Pennsylvania data and was consistently producing sediment estimates that were too high based on the in-stream sample data for the calibration sites in the Northeast. While the exact reason for this is not known, it’s likely that the glaciated terrain in the Northeast is less erodible than the highly erodible soils in Pennsylvania. Also, it is likely that the relative abundance of lakes, ponds and wetlands in the Northeast have an effect on flow velocities and sediment transport.
49
• Lake/Wetland Retention Coefficients: The default retention coefficients for sediment, nitrogen and phosphorus are set to 0.90, 0.12 and 0.25, respectively, and changed at the user’s discretion.

To assess the correlation between observed and predicted values, two different statistical measures were utilized: 1) the Pearson product-moment correlation (R2) coefficient and 2) the Nash-Sutcliffe coefficient. The R2 value is a measure of the degree of linear association between two variables, and represents the amount of variability that is explained by another variable (in this case, the model-simulated values). Depending on the strength of the linear relationship, the R2 can vary from 0 to 1, with 1 indicating a perfect fit between observed and predicted values. Like the R2 measure, the Nash-Sutcliffe coefficient is an indicator of “goodness of fit,” and has been recommended by the American Society of Civil Engineers for use in hydrological studies (ASCE, 1993). With this coefficient, values equal to 1 indicate a perfect fit between observed and predicted data, and values equal to 0 indicate that the model is predicting no better than using the average of the observed data. Therefore, any positive value above 0 suggests that the model has some utility, with higher values indicating better model performance. In practice, this coefficient tends to be lower than R2 for the same data being evaluated. Adjustments were made to the various input parameters for the purpose of obtaining a “best fit” between the observed and simulated data. One of the challenges in calibrating a model is to optimize the results across all model outputs (in the case of AVGWLF, stream flows, as well as sediment, nitrogen, and phosphorus loads). As with any watershed model like GWLF, it is possible to focus on a single output measure (e.g., sediment or nitrogen) in order to improve the fit between observed and simulated loads. Isolating on one model output, however, can sometimes lead to less acceptable results for other measures. Consequently, it is sometimes difficult to achieve very high correlations (e.g., R2 above 0.90) across all model outputs. Given this limitation, it was felt that very good results were obtained for the calibration sites. In model calibration, initial emphasis is usually placed on getting the hydrology correct. Therefore, adjustments to flow-related model parameters are usually finalized prior to making adjustments to parameters specific to sediment and nutrient production. This typically results in better statistical fits between stream flows than the other model outputs. For the monthly comparisons, mean R2 values of 0.80, 0.48, 0.74, and 0.60 were obtained for the calibration watersheds for flow, sediment, nitrogen and phosphorus, respectively. When considering the inherent difficulty in achieving optimal results across all measures as discussed above (along with the potential sources of error), these results are quite good. The sediment load predictions were less satisfactory than those for the other outputs, and this is not entirely unexpected given that this constituent is usually more difficult to simulate than nitrogen or phosphorus. An improvement in sediment prediction could have been achieved by isolating on this particular output during the calibration process; but this would have resulted in poorer performance in estimating the nutrient loads for some of the watersheds. Phosphorus predictions were less accurate than those for nitrogen. This is not unusual given that a significant portion of the phosphorus load for a watershed is highly related to sediment transport processes. Nitrogen, on the other hand, is often linearly correlated to flow, which typically results in accurate predictions of nitrogen loads if stream flows are being accurately simulated. As expected, the monthly Nash-Sutcliffe coefficients were somewhat lower due to the nature of this particular statistic. As described earlier, this statistic is used to iteratively compare simulated values against the mean of the observed values, and values above zero indicate that the model predictions are better than just using the mean of the observed data. In other words, any value above zero would indicate that the model has some utility beyond using the mean of historical data in estimating the flows or loads for any particular time period. As with R2 values, higher Nash-Sutcliffe values reflect higher degrees of correlation than lower ones.
50
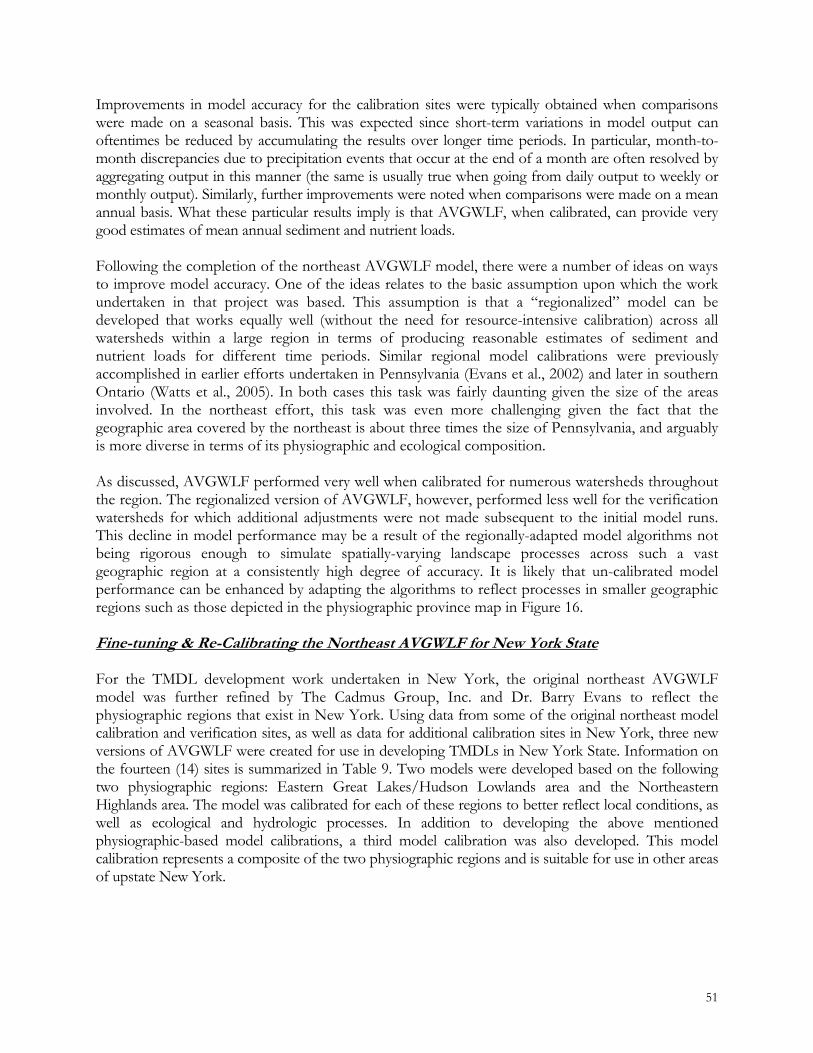
Improvements in model accuracy for the calibration sites were typically obtained when comparisons were made on a seasonal basis. This was expected since short-term variations in model output can oftentimes be reduced by accumulating the results over longer time periods. In particular, month-to-month discrepancies due to precipitation events that occur at the end of a month are often resolved by aggregating output in this manner (the same is usually true when going from daily output to weekly or monthly output). Similarly, further improvements were noted when comparisons were made on a mean annual basis. What these particular results imply is that AVGWLF, when calibrated, can provide very good estimates of mean annual sediment and nutrient loads. Following the completion of the northeast AVGWLF model, there were a number of ideas on ways to improve model accuracy. One of the ideas relates to the basic assumption upon which the work undertaken in that project was based. This assumption is that a “regionalized” model can be developed that works equally well (without the need for resource-intensive calibration) across all watersheds within a large region in terms of producing reasonable estimates of sediment and nutrient loads for different time periods. Similar regional model calibrations were previously accomplished in earlier efforts undertaken in Pennsylvania (Evans et al., 2002) and later in southern Ontario (Watts et al., 2005). In both cases this task was fairly daunting given the size of the areas involved. In the northeast effort, this task was even more challenging given the fact that the geographic area covered by the northeast is about three times the size of Pennsylvania, and arguably is more diverse in terms of its physiographic and ecological composition. As discussed, AVGWLF performed very well when calibrated for numerous watersheds throughout the region. The regionalized version of AVGWLF, however, performed less well for the verification watersheds for which additional adjustments were not made subsequent to the initial model runs. This decline in model performance may be a result of the regionally-adapted model algorithms not being rigorous enough to simulate spatially-varying landscape processes across such a vast geographic region at a consistently high degree of accuracy. It is likely that un-calibrated model performance can be enhanced by adapting the algorithms to reflect processes in smaller geographic regions such as those depicted in the physiographic province map in Figure 16. Fine-tuning & Re-Calibrating the Northeast AVGWLF for New York State For the TMDL development work undertaken in New York, the original northeast AVGWLF model was further refined by The Cadmus Group, Inc. and Dr. Barry Evans to reflect the physiographic regions that exist in New York. Using data from some of the original northeast model calibration and verification sites, as well as data for additional calibration sites in New York, three new versions of AVGWLF were created for use in developing TMDLs in New York State. Information on the fourteen (14) sites is summarized in Table 9. Two models were developed based on the following two physiographic regions: Eastern Great Lakes/Hudson Lowlands area and the Northeastern Highlands area. The model was calibrated for each of these regions to better reflect local conditions, as well as ecological and hydrologic processes. In addition to developing the above mentioned physiographic-based model calibrations, a third model calibration was also developed. This model calibration represents a composite of the two physiographic regions and is suitable for use in other areas of upstate New York.
51

Figure 16. Location of Physiographic Provinces in New York and New England
Table 9. AVGWLF Calibration Sites for use in the New York TMDL Assessments
Site Location Physiographic Region
Owasco Lake NY Eastern Great Lakes/Hudson Lowlands West Branch NY Northeastern Highlands Little Chazy River NY Eastern Great Lakes/Hudson Lowlands Little Otter Creek VT Eastern Great Lakes/Hudson Lowlands
Poultney River VT/NY Eastern Great Lakes/Hudson Lowlands & Northeastern Highlands
Farmington River CT Northeastern Highlands Saco River ME/NH Northeastern Highlands Squannacook River MA Northeastern Highlands Ashuelot River NH Northeastern Highlands Laplatte River VT Eastern Great Lakes/Hudson Lowlands Wild River ME Northeastern Highlands Salmon River CT Northeastern Coastal Zone Norwalk River CT Northeastern Coastal Zone Lewis Creek VT Eastern Great Lakes/Hudson Lowlands
52

Set-up of the “New York State” AVGWLF Model Using data for the time period 1990-2007, the calibrated AVGWLF model was used to estimate mean annual phosphorus loading to the Lake. Table 10 provides the sources of data used for the AVGWLF modeling analysis. The various data preparation steps taken prior to running the final calibrated AVGWLF Model for New York are discussed below the table.
Table 10. Information Sources for AVGWLF Model Parameterization
53
WEATHER.DAT file Data Source or Value
Historical weather data from Fredonia, NY and Jamestown, NY National Weather Service Stations
TRANSPORT.DAT file Data Source or Value Basin size GIS/derived from basin boundaries Land use/cover distribution GIS/derived from land use/cover map Curve numbers by source area GIS/derived from land cover and soil maps USLE (KLSCP) factors by source area GIS/derived from soil, DEM, & land cover ET cover coefficients GIS/derived from land cover Erosivity coefficients GIS/ derived from physiographic map Daylight hrs. by month Computed automatically for state Growing season months Input by user Initial saturated storage Default value of 10 cm Initial unsaturated storage Default value of 0 cm Recession coefficient Default value of 0.1 Seepage coefficient Default value of 0 Initial snow amount (cm water) Default value of 0 Sediment delivery ratio GIS/based on basin size Soil water (available water capacity) GIS/derived from soil map NUTRIENT.DAT file Data Source or Value Dissolved N in runoff by land cover type Default values/adjusted using GWLF Manual Dissolved P in runoff by land cover type Default values/adjusted using GWLF Manual N/P concentrations in manure runoff Default values/adjusted using AEU density N/P buildup in urban areas Default values (from GWLF Manual) N and P point source loads Derived from SPDES point coverage Background N/P concentrations in GW Derived from new background N map
Background P concentrations in soil Derived from soil P loading map/adjusted using GWLF Manual
Background N concentrations in soil Based on map in GWLF Manual Months of manure spreading Input by user
Population on septic systems Derived from census tract maps for 2000 and house counts
Per capita septic system loads (N/P) Default values/adjusted using AEU density

Land Use The Coastal Change Analysis Program’s 2005 land use coverage (NOAA, 2005) was obtained, recoded, and formatted specifically for use in AVGWLF by Bergmann Associates. Aerial imagery was used to update the land use coverage to more accurately reflect current conditions. Total phosphorus concentrations in runoff from the different urban land uses were acquired from the National Stormwater Quality Database (Pitt, et al., 2008). These data were used to adjust the model’s default phosphorus accumulation rates. These adjustments were made using best professional judgment based on examination of specific watershed characteristics and conditions. Phosphorus retention in wetlands and open waters in the basin can be accounted for in AVGWLF. AVGWLF recommends the following coefficients for wetlands and pond retention in the northeast: nitrogen (0.12), phosphorus (0.25), and sediment (0.90). Wetland retention coefficients for large, naturally occurring wetlands vary greatly in the available literature. Depending on the type, size and quantity of wetland observed, the overall impact of the wetland retention routine on the original watershed loading estimates, and local information regarding the impact of wetlands on watershed loads, wetland retention coefficients defaults were adjusted accordingly. The percentage of the drainage basin area that drains through a wetland area was calculated and used in conjunction with nutrient retention coefficients in AVGWLF. To determine the percent wetland area, the total basin land use area was derived using ArcView. Of this total basin area, the area that drains through emergent and woody wetlands were delineated to yield an estimate of total watershed area draining through wetland areas. If a basin displays large areas of surface water (ponds) aside from the water body being modeled, then this open water area is calculated by subtracting the water body area from the total surface water area. On-site Wastewater Treatment Systems (“septic tanks”) GWLF simulates nutrient loads from septic systems as a function of the percentage of the unsewered population served by normally functioning vs. three types of malfunctioning systems: ponded, short-circuited, and direct discharge (Haith et al., 1992).
• Normal Systems are septic systems whose construction and operation conforms to recommended procedures, such as those suggested by the EPA design manual for on-site wastewater disposal systems. Effluent from normal systems infiltrates into the soil and enters the shallow saturated zone. Phosphates in the effluent are adsorbed and retained by the soil and hence normal systems provide no phosphorus loads to nearby waters.
• Short-Circuited Systems are located close enough to surface water (~15 meters) so that negligible adsorption of phosphorus by soil takes place. The only nutrient removal mechanism is plant uptake. Therefore, these systems are always contributing to nearby waters.
• Ponded Systems exhibit hydraulic malfunctioning of the tank’s absorption field and resulting surfacing of the effluent. Unless the surfaced effluent freezes, ponding systems deliver their nutrient loads to surface waters in the same month that they are generated through overland flow. If the temperature is below freezing, the surfacing is assumed to freeze in a thin layer at the ground surface. The accumulated frozen effluent melts when the snowpack disappears and the temperature is above freezing.
54
• Direct Discharge Systems illegally discharge septic tank effluent directly into surface waters.

GWLF requires an estimation of population served by septic systems to generate septic system phosphorus loadings. In reviewing the orthoimagery for the Lake, it became apparent that septic system estimates from the 1990 census were not reflective of actual population in close proximity to the shore. Shoreline dwellings immediately surrounding the Lake account for a substantial portion of the nutrient loading to the Lake. Therefore, the estimated number of septic systems in the drainage basin was refined using a combination of 1990 and 2000 census data and GIS analysis of orthoimagery to account for the proximity of septic systems immediately surrounding the Lake. If available, local information about the number of houses within 250 feet of the lakes was obtained and applied. Great attention was given to estimating septic systems within 250 feet of the Lake (those most likely to have an impact on the Lake). To convert the estimated number of septic systems to population served, an average household size of 2.61 people per dwelling was used based on the circa 2000 USCB census estimate for number of persons per household in New York State. GWLF also requires an estimate of the number of normal and malfunctioning septic systems. This information was not readily available for the Lake. Therefore, several assumptions were made to categorize the systems according to their performance. These assumptions are based on data from local and national studies (Day, 2001; USEPA, 2002) in combination with best professional judgment. To account for seasonal variations in population, data from the 2000 census were used to estimate the percentage of seasonal homes for the town(s) surrounding the Lake. The failure rate for septic systems closer to the Lake (i.e., within 250 feet) were adjusted to account for increased loads due to greater occupancy during the summer months. If available, local information about seasonal occupancy was obtained and applied. For the purposes of this analysis, seasonal homes are considered those occupied only during the month of June, July, and August. Groundwater Phosphorus Phosphorus concentrations in groundwater discharge are derived by AVGWLF. Watersheds with a high percentage of forested land will have low groundwater phosphorus concentrations while watersheds with a high percentage of agricultural land will have high concentrations. The GWLF manual provides estimated groundwater phosphorus concentrations according to land use for the eastern United States. Completely forested watersheds have values of 0.006 mg/L. Primarily agricultural watersheds have values of 0.104 mg/L. Intermediate values are also reported. The AVGWLF-generated groundwater phosphorus concentration was evaluated to ensure groundwater phosphorus values reasonably reflect the actual land use composition of the drainage basin and modifications were made if deemed unnecessary. Point Sources If permitted point sources exist in the drainage basin, their location was identified and verified by NYS DEC and an estimated monthly total phosphorus load and flow was determined using either actual reported data (e.g., from discharge monitoring reports) or estimated based on expected discharge/flow for the facility type. Concentrated Animal Feeding Operations (CAFOs)
55
A state-wide Concentrated Animal Feeding Operation (CAFO) shapefile was provided by NYS DEC. CAFOs are categorized as either large or medium. The CAFO point can represent either the centroid of the farm or the entrance of the farm, therefore the CAFO point is more of a general

gauge as to where further information should be obtained regarding permitted information for the CAFO. If a CAFO point is located in or around a basin, orthos and permit data were evaluated to determine the part of the farm with the highest potential contribution of nutrient load. In ArcView, the CAFO shapefile was positioned over the basin and clipped with a 2.5 mile buffer to preserve those CAFOS that may have associated cropland in the basin. If a CAFO point is found to be located within the boundaries of the drainage basin, every effort was made to obtain permit information regarding nutrient management or other best management practices (BMPs) that may be in place within the property boundary of a given CAFO. These data can be used to update the nutrient file in AVGWLF and ultimately account for agricultural BMPs that may currently be in place in the drainage basin. Municipal Separate Storm Sewer Systems (MS4s) Stormwater runoff within Phase II permitted Municipal Separate Storm Sewer Systems (MS4s) is considered a point source of pollutants. Stormwater runoff outside of the MS4 is non-permitted stormwater runoff and, therefore, considered nonpoint sources of pollutants. Permitted stormwater runoff is accounted for in the wasteload allocation of a TMDL, while non-permitted runoff is accounted for in the load allocation of a TMDL.
56

AVGWLF Model Simulation Results for Chautauqua Lake - North Input Transport File
57

Input Nutrient File
58

Simulated Hydrology Transport Summary
59

Simulated Nutrient Transport Summary
60

Simulated Total Loads by Source
61

AVGWLF Model Simulation Results for Chautauqua Lake - South Input Transport File
62

Input Nutrient File
63

Simulated Hydrology Transport Summary
64

Simulated Nutrient Transport Summary
65

Simulated Total Loads by Source
66
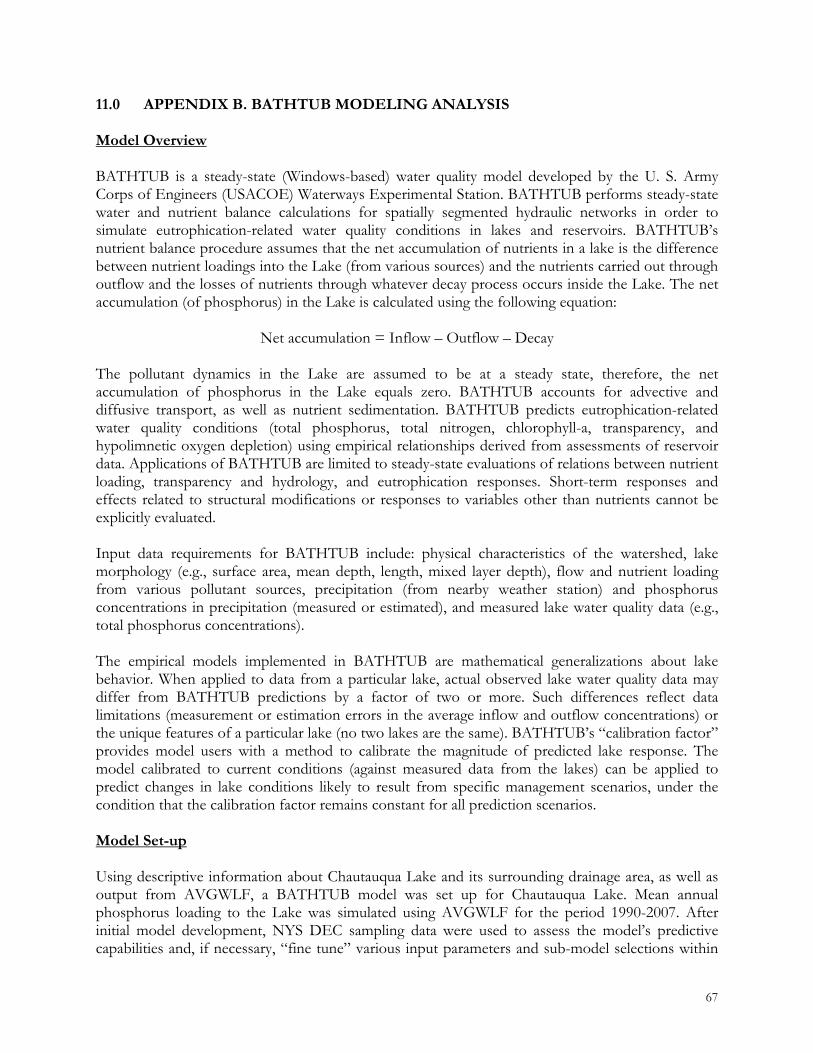
11.0 APPENDIX B. BATHTUB MODELING ANALYSIS Model Overview BATHTUB is a steady-state (Windows-based) water quality model developed by the U. S. Army Corps of Engineers (USACOE) Waterways Experimental Station. BATHTUB performs steady-state water and nutrient balance calculations for spatially segmented hydraulic networks in order to simulate eutrophication-related water quality conditions in lakes and reservoirs. BATHTUB’s nutrient balance procedure assumes that the net accumulation of nutrients in a lake is the difference between nutrient loadings into the Lake (from various sources) and the nutrients carried out through outflow and the losses of nutrients through whatever decay process occurs inside the Lake. The net accumulation (of phosphorus) in the Lake is calculated using the following equation:
Net accumulation = Inflow – Outflow – Decay
The pollutant dynamics in the Lake are assumed to be at a steady state, therefore, the net accumulation of phosphorus in the Lake equals zero. BATHTUB accounts for advective and diffusive transport, as well as nutrient sedimentation. BATHTUB predicts eutrophication-related water quality conditions (total phosphorus, total nitrogen, chlorophyll-a, transparency, and hypolimnetic oxygen depletion) using empirical relationships derived from assessments of reservoir data. Applications of BATHTUB are limited to steady-state evaluations of relations between nutrient loading, transparency and hydrology, and eutrophication responses. Short-term responses and effects related to structural modifications or responses to variables other than nutrients cannot be explicitly evaluated.
Input data requirements for BATHTUB include: physical characteristics of the watershed, lake morphology (e.g., surface area, mean depth, length, mixed layer depth), flow and nutrient loading from various pollutant sources, precipitation (from nearby weather station) and phosphorus concentrations in precipitation (measured or estimated), and measured lake water quality data (e.g., total phosphorus concentrations).
The empirical models implemented in BATHTUB are mathematical generalizations about lake behavior. When applied to data from a particular lake, actual observed lake water quality data may differ from BATHTUB predictions by a factor of two or more. Such differences reflect data limitations (measurement or estimation errors in the average inflow and outflow concentrations) or the unique features of a particular lake (no two lakes are the same). BATHTUB’s “calibration factor” provides model users with a method to calibrate the magnitude of predicted lake response. The model calibrated to current conditions (against measured data from the lakes) can be applied to predict changes in lake conditions likely to result from specific management scenarios, under the condition that the calibration factor remains constant for all prediction scenarios. Model Set-up
67
Using descriptive information about Chautauqua Lake and its surrounding drainage area, as well as output from AVGWLF, a BATHTUB model was set up for Chautauqua Lake. Mean annual phosphorus loading to the Lake was simulated using AVGWLF for the period 1990-2007. After initial model development, NYS DEC sampling data were used to assess the model’s predictive capabilities and, if necessary, “fine tune” various input parameters and sub-model selections within

BATHTUB during a calibration process. Once calibrated, BATHTUB was used to derive the total phosphorus load reduction needed in order to achieve the TMDL target. Sources of input data for BATHTUB include:
• Physical characteristics of the watershed and Lake morphology (e.g., surface area, mean depth, length, mixed layer depth) - Obtained from CSLAP and bathymetric maps provided by NYS DEC or created by the Cadmus Group, Inc.
• Flow and nutrient loading from various pollutant sources - Obtained from AVGWLF output.
• Precipitation – Obtained from nearby National Weather Services Stations.
• Phosphorus concentrations in precipitation (measured or estimated), and measured Lake water quality data (e.g., total phosphorus concentrations) – Obtained from NYS DEC.
Tables 11 – 18 summarize the primary model inputs for Chautauqua Lake, including the coefficient of variation (CV), which reflects uncertainty in the input value. Default model choices are utilized unless otherwise noted. Spatial variations (i.e., longitudinal dispersion) in phosphorus concentrations are not a factor in the development of the TMDL for Chautauqua Lake. Therefore, division of the Lake into multiple segments was not necessary for this modeling effort. Modeling the entire Lake with one segment provides predictions of area-weighted mean concentrations, which are adequate to support management decisions. Water inflow and nutrient loads from the Lake’s drainage basin were treated as though they originated from one “tributary” (i.e., source) in BATHTUB and derived from AVGWLF. BATHTUB is a steady state model, whose predictions represent concentrations averaged over a period of time. A key decision in the application of BATHTUB is the selection of the length of time over which water and mass balance calculations are modeled (the “averaging period”). The length of the appropriate averaging period for BATHTUB application depends upon what is called the nutrient residence time, which is the average length of time that phosphorus spends in the water column before settling or flushing out of the Lake. Guidance for BATHTUB recommends that the averaging period used for the analysis be at least twice as large as nutrient residence time for the Lake. The appropriate averaging period for water and mass balance calculations would be 1 year for lakes with relatively long nutrient residence times or seasonal (6 months) for lakes with relatively short nutrient residence times (e.g., on the order of 1 to 3 months). The turnover ratio can be used as a guide for selecting the appropriate averaging period. A seasonal averaging period (April/May through September) is usually appropriate if it results in a turnover ratio exceeding 2.0. An annual averaging period may be used otherwise. Other considerations (such as comparisons of observed and predicted nutrient levels) can also be used as a basis for selecting an appropriate averaging period, particularly if the turnover ratio is near 2.0.
68
Precipitation inputs were taken from the observed long term mean daily total precipitation values from the Fredonia, NY and Jamestown, NY National Weather Services Stations for the 1990-2007 period. Evapotranspiration was derived from AVGWLF using daily weather data (1990-2007) and a cover factor dependent upon land use/cover type. The values selected for precipitation and change in Lake storage have very little influence on model predictions. Atmospheric phosphorus loads were obtained from USGS from a collection site in Monroe County New York (USGS Fact Sheet FS-

128-99, 1999). Atmospheric deposition is not a major source of phosphorus loading to Chautauqua Lake and has little impact on simulations. Lake surface area, mean depth, and length were derived using GIS analysis of bathymetric data. Depth of the mixed layer was estimated using a multivariate regression equation developed by Walker (1996). Existing water quality conditions in Chautauqua Lake were represented using an average of the observed summer mean phosphorus concentrations for years 1990-2007. These data were collected through NYS DEC’s CSLAP and Chautauqua County. The concentration of phosphorus loading to the Lake was calculated using the average annual flow and phosphorus loads simulated by AVGWLF. For years with observed data, the concentration of internal loading was calculated using the concentration of external loading, the hydraulic residence time, and Lake phosphorus concentrations. Otherwise, the concentration of internal loading was calculated assuming concentrations were proportional to the average of years with observed data. To obtain flow in units of volume per time, the depth of flow was multiplied by the drainage area and divided by one year. To obtain phosphorus concentrations, the nutrient mass was divided by the volume of flow. Internal loading rates reflect nutrient recycling from bottom sediments. Internal loading rates are normally set to zero in BATHTUB since the pre-calibrated nutrient retention models already account for nutrient recycling that would normally occur (Walker, 1999). Walker warns that nonzero values should be specified with caution and only if independent estimates or measurements are available. In some studies, internal loading rates have been estimated from measured phosphorus accumulation in the hypolimnion during the stratified period. Results from this procedure should not be used for estimation of internal loading in BATHTUB unless there is evidence the accumulated phosphorus is transported to the mixed layer during the growing season. Specification of a fixed internal loading rate may be unrealistic for evaluating response to changes in external load. Because they reflect recycling of phosphorus that originally entered the reservoir from the watershed, internal loading rates would be expected to vary with external load. In situations where monitoring data indicate relatively high internal recycling rates to the mixed layer during the growing season, a preferred approach would generally be to calibrate the phosphorus sedimentation rate (i.e., specify calibration factors < 1). However, there still remains some risk that apparent internal loads actually reflect under-estimation of external loads.
69

BATHTUB Model Inputs for Chautauqua Lake - North
Table 11. BATHTUB Model Input Variables: Model Selections Water Quality Indicator Option Description Total Phosphorus 01 2nd Order Available Phosphorus* Phosphorus Calibration 01 Decay Rate* Error Analysis 01 Model and Data* Availability Factors 00 Ignore* Mass Balance Tables 01 Use Estimated Concentrations*
* Default model choice Table 12. BATHTUB Model Input: Global Variables
Model Input Mean CV
Averaging Period (years) 1 NA Precipitation (meters) 1.064 0.2* Evaporation (meters) 0.593 0.3* Atmospheric Load (mg/m2-yr)- Total P 29.773 0.5* Atmospheric Load (mg/m2-yr)- Ortho P 17.166 0.5*
* Default model choice Table 13. BATHTUB Model Input: Lake Variables
Morphometry Mean CV Surface Area (km2) 28.59 NA Mean Depth (m) 8.070 NA Length (km) 12.09 NA Estimated Mixed Depth (m) 6.1 0.12
Observed Water Quality Mean CV Total Phosphorus (ppb) 32.44 0.5
Internal Load Mean CV Total Phosphorus (mg/m2-day) 0.299 0.5
* Default model choice Table 14. BATHTUB Model Input: Watershed “Tributary” Loading
Monitored Inputs Mean CV Total Watershed Area (km2) 199.66 NA Flow Rate (hm3/yr) 99.72 0.1 Total P (ppb) 95.78 0.2 Organic P (ppb) 91.27 0.2
70

BATHTUB Model Inputs for Chautauqua Lake - South
Table 15. BATHTUB Model Input Variables: Model Selections Water Quality Indicator Option Description Total Phosphorus 01 2nd Order Available Phosphorus* Phosphorus Calibration 01 Decay Rate* Error Analysis 01 Model and Data* Availability Factors 00 Ignore* Mass Balance Tables 01 Use Estimated Concentrations*
* Default model choice Table 16. BATHTUB Model Input: Global Variables
Model Input Mean CV
Averaging Period (years) 1 NA Precipitation (meters) 1.064 0.2* Evaporation (meters) 0.593 0.3* Atmospheric Load (mg/m2-yr)- Total P 29.773 0.5* Atmospheric Load (mg/m2-yr)- Ortho P 17.166 0.5*
* Default model choice Table 17. BATHTUB Model Input: Lake Variables
Morphometry Mean CV Surface Area (km2) 24.55 NA Mean Depth (m) 3.513 NA Length (km) 10.59 NA Estimated Mixed Depth (m) 3.5 0.12
Observed Water Quality Mean CV Total Phosphorus (ppb) 58.18 0.5
Internal Load Mean CV Total Phosphorus (mg/m2-day) 1.475 0.5
* Default model choice Table 18. BATHTUB Model Input: Watershed “Tributary” Loading
Monitored Inputs Mean CV Total Watershed Area (km2) 212.28 NA Flow Rate (hm3/yr) 96.83 0.1 Total P (ppb) 73.34 0.2 Organic P (ppb) 65.23 0.2
71

Model Calibration BATHTUB model calibration consists of:
1. Applying the model with all inputs specified as above
2. Comparing model results to observed phosphorus data
3. Adjusting model coefficients to provide the best comparison between model predictions and observed phosphorus data (only if absolutely required and with extreme caution.
Several t-statistics calculated by BATHTUB provide statistical comparison of observed and predicted concentrations and can be used to guide calibration of BATHTUB. Two statistics supplied by the model, T2 and T3, aid in testing model applicability. T2 is based on error typical of model development data set. T3 is based on observed and predicted error, taking into consideration model inputs and inherent model error. These statistics indicate whether the means differ significantly at the 95% confidence level. If their absolute values exceed 2, the model may not be appropriately calibrated. The T1 statistic can be used to determine whether additional calibration is desirable. The t-statistics for the BATHUB simulations for Chautauqua Lake are as follows:
T-statistics for Chautauqua North
Year Observed Simulated T1 T2 T3 1990 26 30 -0.29 -0.54 -0.27 1991 22 36 -1.04 -1.93 -0.95 1992 24 31 -0.56 -1.04 -0.51 1993 34 32 0.10 0.18 0.09 1994 40 32 0.49 0.91 0.45 1995 -- 33 -- -- -- 1996 -- 30 -- -- -- 1997 16 31 -1.33 -2.47 -1.22 1998 -- 35 -- -- -- 1999 26 37 -0.71 -1.32 -0.64 2000 34 34 -0.01 -0.02 -0.01 2001 31 36 -0.30 -0.56 -0.28 2002 24 32 -0.61 -1.13 -0.56 2003 40 35 0.24 0.44 0.21 2004 42 32 0.56 1.04 0.51 2005 35 32 0.16 0.29 0.14 2006 49 31 0.89 1.65 0.82 2007 45 -- -- -- --
Average 32 32 0.00 0.00 0.00
72

T-statistics for Chautauqua South
Year Observed Simulated T1 T2 T3 1990 -- 51 -- -- -- 1991 81 70 0.29 0.54 0.26 1992 49 54 -0.18 -0.33 -0.16 1993 69 57 0.40 0.74 0.36 1994 64 56 0.29 0.54 0.26 1995 -- 60 -- -- -- 1996 -- 51 -- -- -- 1997 -- 55 -- -- -- 1998 -- 66 -- -- -- 1999 -- 72 -- -- -- 2000 40 64 -0.96 -1.78 -0.85 2001 -- 68 -- -- -- 2002 42 57 -0.60 -1.12 -0.54 2003 52 67 -0.48 -0.89 -0.42 2004 35 55 -0.93 -1.73 -0.84 2005 51 57 -0.23 -0.42 -0.20 2006 72 55 0.54 1.01 0.49 2007 84 -- -- -- --
Average 58 58 0.00 0.00 0.00 In cases where predicted and observed values differ significantly, calibration coefficients can be adjusted to account for the site-specific application of the model. Calibration to account for model error is often appropriate. However, Walker (1996) recommends a conservative approach to calibration since differences can result from factors such as measurement error and random data input errors. Error statistics calculated by BATHTUB indicate that the match between simulated and observed mean annual water quality conditions in Chautauqua Lake is quite good. Therefore, BATHTUB is sufficiently calibrated for use in estimating load reductions required to achieve the phosphorus TMDL target in the Lake.
73

12.0 APPENDIX C. TOTAL EQUIVALENT DAILY PHOSPHORUS LOAD ALLOCATIONS
Chautauqua Lake – North
* Includes phosphorus transported through surface runoff and subsurface (groundwater)
74
Source Total Phosphorus Load (lbs/d)
% ReductionCurrent Allocated Reduction
Agriculture* 30.846 5.645 25.201 82% Developed Land* 5.158 2.802 2.356 46% Septic Systems 2.671 0.591 2.080 78% Quarry 0.004 0.004 0.000 0% Forest, Wetland, Stream Bank, and Natural Background* 3.561 3.561 0.000 0%
Internal Loading 19.218 5.049 14.170 74% LOAD ALLOCATION 61.487 17.660 43.827 71% Chautauqua Heights Sewer District (NY0269450) 0.333 0.099 0.235 70%
North Chautauqua Lake Sewer District STP (NY0020826) 6.320 0.930 5.395 85%
Chautauqua Utility District STP (NY0029769) 7.876 1.350 6.532 83%
Snow Ridge Motel (NY0103080) 0.009 0.009 0.000 0% Crosswinds (NY0203807) 0.120 0.120 0.000 0% Chedwel Club Condos (NY0203696) 0.075 0.075 0.000 0%
Bayberry Landing Condo Assn. (NY0060348) 0.072 0.072 0.000 0%
Lake Chautauqua Lutheran Center (NY0102580) 0.058 0.058 0.000 0%
Mallard Cove Subdivision (NY0204935) 0.016 0.016 0.000 0%
Andriaccio Restaurant (NY0203882) 0.006 0.006 0.000 0%
Wee Wood Park (NY0128074) 0.020 0.020 0.000 0% Chautauqua Heights Campgrounds (NY0128163) 0.058 0.058 0.000 0% Chautauqua State Fish Hatchery (NY0035441) 0.061 0.061 0.000 0% Country Ayre Farms LLC (GP009001) 0.000 0.000 0.000 0% WASTELOAD ALLOCATION 15.034 2.873 12.161 81% LA + WLA 76.521 20.533 55.988 73% Margin of Safety --- 2.2800 --- ---
TOTAL 76.521 22.815 --- ---

Chautauqua Lake – South
* Includes phosphorus transported through surface runoff and subsurface (groundwater) ** As noted in the text, this daily maximum will not be used as the basis for permit limits.
75
Source Total Phosphorus Load (lbs/d)
% ReductionCurrent Allocated Reduction
Agriculture* 20.787 3.381 17.406 84% Developed Land* 13.730 7.948 5.782 42% Septic Systems 1.970 1.288 0.682 35% Quarry 0.021 0.021 0.000 0% Forest, Wetland, Stream Bank, and Natural Background* 3.599 3.599 0.000 0%
Internal Loading 79.802 0.000 79.802 100% Load from North Lake 22.160 10.452 11.708 53% LOAD ALLOCATION 142.069 26.689 115.380 81% South & Center Chautauqua Lake WWTP (NY0106895) 2.305 0.619 1.688 73%
Maplehurst Country Club (NY0204102) 0.016 0.016 0.000 0%
Lakeside Auto Court (NY0126365) 0.031 0.031 0.000 0% Sunshine Mobile Home Park (NY0203769) 0.056 0.056 0.000 0%
Ashville Fire Dept. Training Center (NY0258539) 0.014 0.014 0.000 0%
Maple Grove High School (NY0097527) 0.150 0.150 0.000 0%
Panama Central School STP (NY0022373) 0.113 0.113 0.000 0%
Wellman Road Trailer Park (NY0076619) 0.017 0.017 0.000 0%
Hewes Educational Center (NY0026964) 0.058 0.000 0.000 100%
WASTELOAD ALLOCATION 2.760 1.016 1.744 63% LA + WLA 144.829 27.705 117.124 81% Margin of Safety --- 3.0783 --- ---
TOTAL 144.829 30.783 --- ---

13.0 APPENDIX D. ESTIMATED DISCHARGE DATA FOR WASTEWATER
TREATMENT PLANTS NORTH CHAUTAUQUA LAKE SD WWTP (NPDES ID: NY0020826)
Month Total Phosphorus (mg/l) Estimated Discharge (MGD)
January 2.3 0.403 February 2.3 0.357 March 2.3 0.466 April 2.3 0.390 May 2.3 0.271 June 2.3 0.210 July 2.3 0.254 August 2.3 0.257 September 2.3 0.257 October 2.3 0.300 November 2.3 0.329 December 2.3 0.457
CHAUTAUQUA UTILITY DIST WWTP (NPDES ID: NY0029769)
Month Total Phosphorus (mg/l) Estimated Discharge (MGD)
January 2.3 0.435 February 2.3 0.385 March 2.3 0.547 April 2.3 0.427 May 2.3 0.296 June 2.3 0.316 July 2.3 0.609 August 2.3 0.542 September 2.3 0.276 October 2.3 0.295 November 2.3 0.336 December 2.3 0.459
76

CHAUTAUQUA HEIGHTS SD WWTP (NPDES ID: NY0269450)
Month Total Phosphorus (mg/l) Estimated Discharge (MGD)
January 2.3 0.015 February 2.3 0.012 March 2.3 0.017 April 2.3 0.018 May 2.3 0.011 June 2.3 0.014 July 2.3 0.027 August 2.3 0.028 September 2.3 0.021 October 2.3 0.017 November 2.3 0.016 December 2.3 0.013
SNOW RIDGE MOTEL (NPDES ID: NY0103080)
Month Total Phosphorus (mg/l) Estimated Discharge (MGD)
January 2.3 0.00048 February 2.3 0.00048 March 2.3 0.00048 April 2.3 0.00048 May 2.3 0.00048 June 2.3 0.00048 July 2.3 0.00048 August 2.3 0.00048 September 2.3 0.00048 October 2.3 0.00048 November 2.3 0.00048 December 2.3 0.00048
77

CROSSWINDS (NPDES ID: NY0203807)
Month Total Phosphorus (mg/l) Estimated Discharge (MGD)
January 2.3 0.0062 February 2.3 0.0062 March 2.3 0.0062 April 2.3 0.0062 May 2.3 0.0062 June 2.3 0.0062 July 2.3 0.0062 August 2.3 0.0062 September 2.3 0.0062 October 2.3 0.0062 November 2.3 0.0062 December 2.3 0.0062
78

CHEDWEL CLUB CONDOS (NPDES ID: NY0203696)
Month Total Phosphorus (mg/l) Estimated Discharge (MGD)
January 2.3 0.0039 February 2.3 0.0039 March 2.3 0.0039 April 2.3 0.0039 May 2.3 0.0039 June 2.3 0.0039 July 2.3 0.0039 August 2.3 0.0039 September 2.3 0.0039 October 2.3 0.0039 November 2.3 0.0039 December 2.3 0.0039
BAYBERRY LANDING CONDO ASSN. (NPDES ID: NY0060348)
Month Total Phosphorus (mg/l) Estimated Discharge (MGD)
January 2.3 0.0038 February 2.3 0.0038 March 2.3 0.0038 April 2.3 0.0038 May 2.3 0.0038 June 2.3 0.0038 July 2.3 0.0038 August 2.3 0.0038 September 2.3 0.0038 October 2.3 0.0038 November 2.3 0.0038 December 2.3 0.0038
79

LAKE CHAUTAUQUA LUTHERAN CENTER (NPDES ID: NY0102580)
Month Total Phosphorus (mg/l) Estimated Discharge (MGD)
January 2.3 0.0030 February 2.3 0.0030 March 2.3 0.0030 April 2.3 0.0030 May 2.3 0.0030 June 2.3 0.0030 July 2.3 0.0030 August 2.3 0.0030 September 2.3 0.0030 October 2.3 0.0030 November 2.3 0.0030 December 2.3 0.0030
MALLARD COVE SUBDIVISION (NPDES ID: NY0204935)
Month Total Phosphorus (mg/l) Estimated Discharge (MGD)
January 2.3 0.00084 February 2.3 0.00084 March 2.3 0.00084 April 2.3 0.00084 May 2.3 0.00084 June 2.3 0.00084 July 2.3 0.00084 August 2.3 0.00084 September 2.3 0.00084 October 2.3 0.00084 November 2.3 0.00084 December 2.3 0.00084
80

ANDRIACCIO RESTAURANT (NPDES ID: NY0203882)
Month Total Phosphorus (mg/l) Estimated Discharge (MGD)
January 2.3 0.0003 February 2.3 0.0003 March 2.3 0.0003 April 2.3 0.0003 May 2.3 0.0003 June 2.3 0.0003 July 2.3 0.0003 August 2.3 0.0003 September 2.3 0.0003 October 2.3 0.0003 November 2.3 0.0003 December 2.3 0.0003
WEE WOOD PARK (NPDES ID: NY0128074)
Month Total Phosphorus (mg/l) Estimated Discharge (MGD)
January 2.3 0.0010 February 2.3 0.0010 March 2.3 0.0010 April 2.3 0.0010 May 2.3 0.0010 June 2.3 0.0010 July 2.3 0.0010 August 2.3 0.0010 September 2.3 0.0010 October 2.3 0.0010 November 2.3 0.0010 December 2.3 0.0010
81

CHAUTAUQUA HEIGHTS CAMPGOUNDS (NPDES ID: NY0128163)
Month Total Phosphorus (mg/l) Estimated Discharge (MGD)
January 2.3 0.0030 February 2.3 0.0030 March 2.3 0.0030 April 2.3 0.0030 May 2.3 0.0030 June 2.3 0.0030 July 2.3 0.0030 August 2.3 0.0030 September 2.3 0.0030 October 2.3 0.0030 November 2.3 0.0030 December 2.3 0.0030
CHAUTAUQUA STATE FISH HATCHERY (NPDES ID: NY0035441)
Outfall 001
Month Total Phosphorus (mg/l) Estimated Discharge (MGD)
April 0.013 0.19 May 0.013 0.19 June 0.013 0.19 July 0.013 0.19 August 0.013 0.19 September 0.013 0.19 October 0.013 0.19
Fish Rearing Ponds Total Phosphorus (mg/l) Estimated Discharge (MG/year)
0.147 15.3
82

LONG POINT STATE PARK (NPDES ID: NY0171387)*
Month Total Phosphorus (mg/l) Estimated Discharge (MGD)
January 2.3 0.0059 February 2.3 0.0059 March 2.3 0.0059 April 2.3 0.0059 May 2.3 0.0059 June 2.3 0.0059 July 2.3 0.0059 August 2.3 0.0059 September 2.3 0.0059 October 2.3 0.0059 November 2.3 0.0059 December 2.3 0.0059
*This facility is no longer operating and its permit has been discontinued. SOUTH & CTR CHAUTAUQUA L WWTP (NPDES ID: NY0106895)
Month Total Phosphorus (mg/l) Estimated Discharge (MGD)
January 2.3 0.140 February 2.3 0.129 March 2.3 0.160 April 2.3 0.137 May 2.3 0.110 June 2.3 0.097 July 2.3 0.104 August 2.3 0.107 September 2.3 0.096 October 2.3 0.102 November 2.3 0.111 December 2.3 0.147
83

MAPLEHURST COUNTRY CLUB (NPDES ID: NY0204102)
Month Total Phosphorus (mg/l) Estimated Discharge (MGD)
January 2.3 0.00084 February 2.3 0.00084 March 2.3 0.00084 April 2.3 0.00084 May 2.3 0.00084 June 2.3 0.00084 July 2.3 0.00084 August 2.3 0.00084 September 2.3 0.00084 October 2.3 0.00084 November 2.3 0.00084 December 2.3 0.00084
LAKESIDE AUTO COURT (NPDES ID: NY0126365)
Month Total Phosphorus (mg/l) Estimated Discharge (MGD)
January 2.3 0.00159 February 2.3 0.00159 March 2.3 0.00159 April 2.3 0.00159 May 2.3 0.00159 June 2.3 0.00159 July 2.3 0.00159 August 2.3 0.00159 September 2.3 0.00159 October 2.3 0.00159 November 2.3 0.00159 December 2.3 0.00159
84
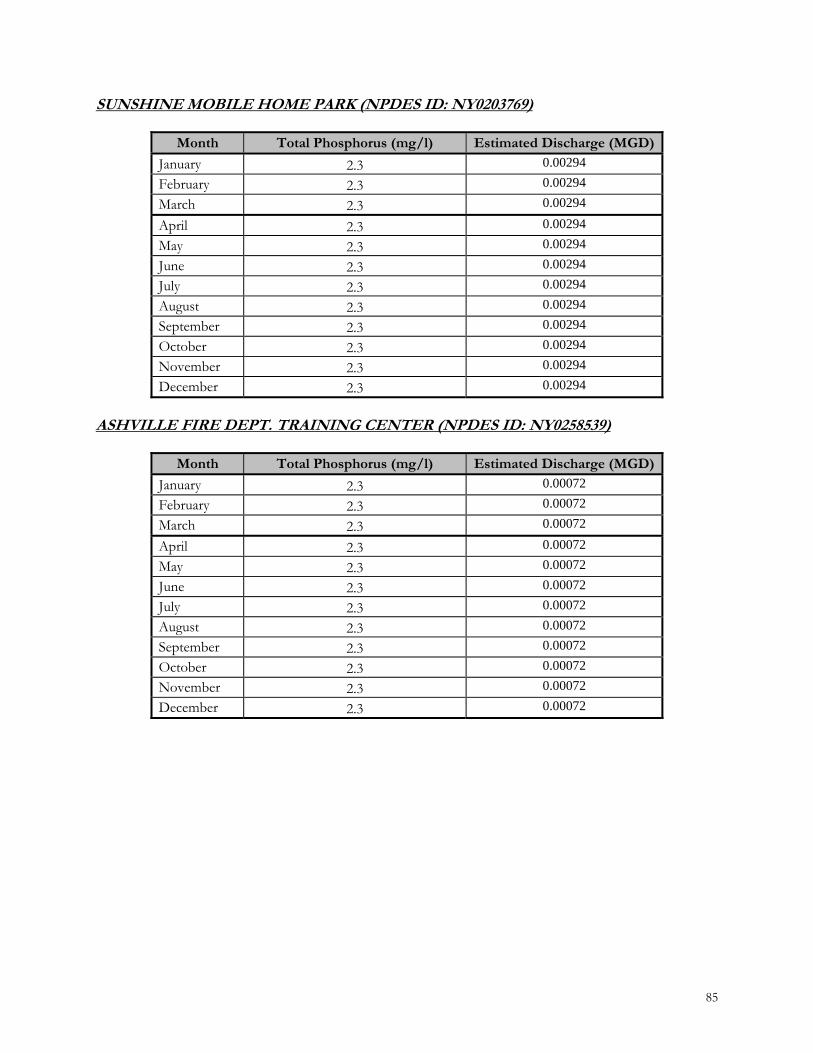
SUNSHINE MOBILE HOME PARK (NPDES ID: NY0203769)
Month Total Phosphorus (mg/l) Estimated Discharge (MGD)
January 2.3 0.00294 February 2.3 0.00294 March 2.3 0.00294 April 2.3 0.00294 May 2.3 0.00294 June 2.3 0.00294 July 2.3 0.00294 August 2.3 0.00294 September 2.3 0.00294 October 2.3 0.00294 November 2.3 0.00294 December 2.3 0.00294
ASHVILLE FIRE DEPT. TRAINING CENTER (NPDES ID: NY0258539)
Month Total Phosphorus (mg/l) Estimated Discharge (MGD)
January 2.3 0.00072 February 2.3 0.00072 March 2.3 0.00072 April 2.3 0.00072 May 2.3 0.00072 June 2.3 0.00072 July 2.3 0.00072 August 2.3 0.00072 September 2.3 0.00072 October 2.3 0.00072 November 2.3 0.00072 December 2.3 0.00072
85
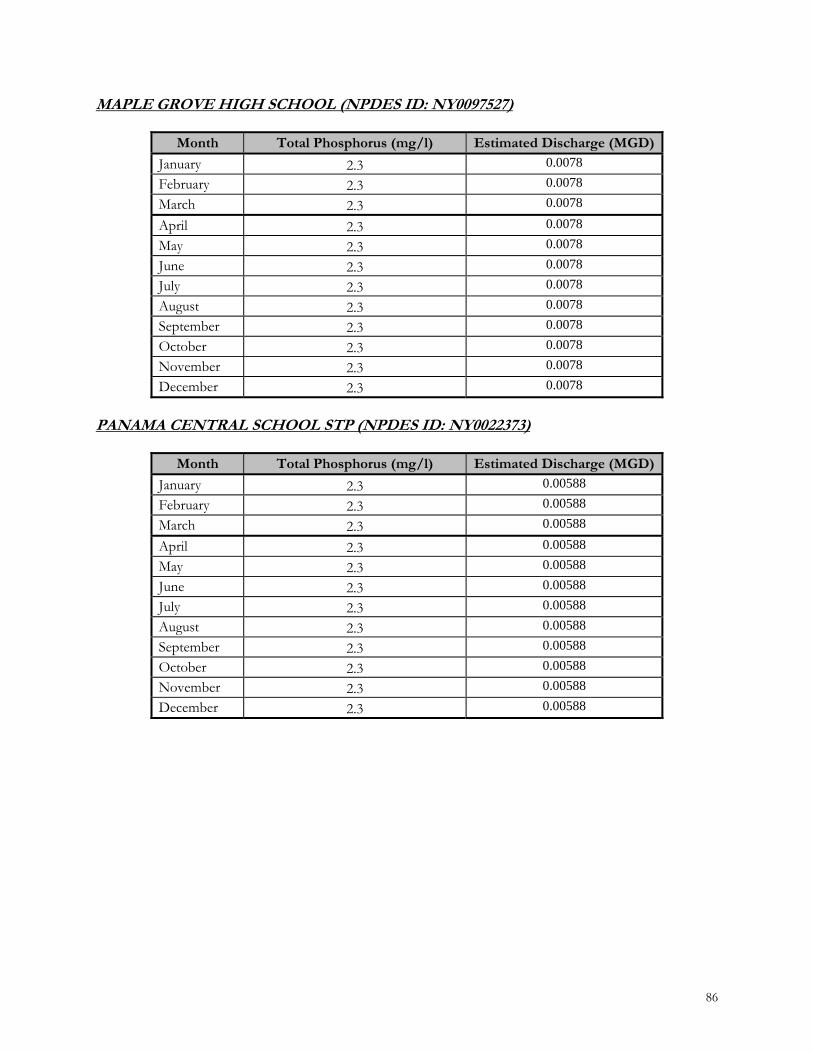
MAPLE GROVE HIGH SCHOOL (NPDES ID: NY0097527)
Month Total Phosphorus (mg/l) Estimated Discharge (MGD)
January 2.3 0.0078 February 2.3 0.0078 March 2.3 0.0078 April 2.3 0.0078 May 2.3 0.0078 June 2.3 0.0078 July 2.3 0.0078 August 2.3 0.0078 September 2.3 0.0078 October 2.3 0.0078 November 2.3 0.0078 December 2.3 0.0078
PANAMA CENTRAL SCHOOL STP (NPDES ID: NY0022373)
Month Total Phosphorus (mg/l) Estimated Discharge (MGD)
January 2.3 0.00588 February 2.3 0.00588 March 2.3 0.00588 April 2.3 0.00588 May 2.3 0.00588 June 2.3 0.00588 July 2.3 0.00588 August 2.3 0.00588 September 2.3 0.00588 October 2.3 0.00588 November 2.3 0.00588 December 2.3 0.00588
86

87
WELLMAN ROAD TRAILER PARK (NPDES ID: NY0076619)
Month Total Phosphorus (mg/l) Estimated Discharge (MGD)
January 2.3 0.00090 February 2.3 0.00090 March 2.3 0.00090 April 2.3 0.00090 May 2.3 0.00090 June 2.3 0.00090 July 2.3 0.00090 August 2.3 0.00090 September 2.3 0.00090 October 2.3 0.00090 November 2.3 0.00090 December 2.3 0.00090
HEWES EDUCATIONAL CENTER (NPDES ID: NY0026964)
Month Total Phosphorus (mg/l) Estimated Discharge (MGD)
January 2.3 0.0030 February 2.3 0.0030 March 2.3 0.0030 April 2.3 0.0030 May 2.3 0.0030 June 2.3 0.0030 July 2.3 0.0030 August 2.3 0.0030 September 2.3 0.0030 October 2.3 0.0030 November 2.3 0.0030 December 2.3 0.0030