total intensity of odor: a new method to evaluate...
TRANSCRIPT

E42 JACOBSEN-GARCIA ET AL. | 109 :2 • FEBRUARY 2017 | JOURNAL AWWA
Municipal drinking water that meets all primary state and federal water quality standards can at times have an unpleasant odor. Odor problems can arise from a variety of sources. Odorous chemicals such as 2-methylisoborneol and geosmin are released from cyanobacteria (blooms or benthic) in surface water supplies, resulting in earthy/musty odors (Izaguirre et al. 1982). Sulfate-reducing bacteria under anoxic conditions reduce sulfate to hydrogen sulfide and give off a rotten-egg smell (Taylor et al. 2006). Chem-icals added during treatment (e.g., disinfectants/oxidants such as chlorine or ozone) can affect the odor of drinking water (destroying and/or creating odors) (AWWARF & Lyonnaise des Eaux 1987). Fortunately, most odors found in drinking water are not considered to be a public health concern. However, odors in drinking water are a major concern for consumers. Odors have a negative effect on consumer confidence and acceptance and can quickly destroy the public’s trust in the safety of its drinking water.
Aesthetic properties, such as odor and color, are regu-lated as secondary maximum contaminant levels (SMCLs) because they are not considered to pose a health risk. The US Environmental Protection Agency recommends sec-ondary standards to water systems but does not require systems to comply. However, states may choose to adopt them as enforceable standards. The recommended test for
odor is the threshold odor number (TON) method, a dilution-to-threshold test (Standard Methods 2012). However, TON is a poor measure of consumer accep-tance. As a result, many utilities have turned to flavor profile analysis (FPA) to better understand and predict consumer preferences (Krasner et al. 1985). FPA, a descriptive sensory technique, is the most powerful sen-sory method available for drinking water assessment. However, FPA by design is not intended to be a pass/fail measurement and thus is not the appropriate alternative test to TON for compliance purposes. In addition, FPA requires extensive panel training and time commitment, which is not practical for many utilities.
DILUTION VERSUS INTENSITYSensory methods. The TON test is an approved stan-
dard method (SM2170) that has existed since the 1940s (Standard Methods 2012). TON is the prescribed method for compliance with the secondary regulation for the evaluation of odor in drinking water. It is a dilution-to-threshold test, which requires heating mul-tiple dilutions of a sample to 60°C and then sniffing the headspace of each dilution (starting at the most dilute) until a definite odor is perceived. The TON is the dilu-tion ratio at which odor is just detectable. The SMCL
Peer Reviewed
Total Intensity of Odor: A New Method to Evaluate OdorsALLISON JACOBSEN-GARCIA,1 MELISSA DALE,2 ROY DESROCHERS,3 AND STUART KRASNER1
1Metropolitan Water District of Southern California, La Verne, Calif.2Plaza & Associates, Camano Island, Wash.3Tufts University Sensory and Science Center, Medford, Mass.
Keywords: FPA, odor, TIO, TON
Unpleasant odors in drinking water can have a negative effect on consumer confidence. In fact, consumers often perceive that if their water smells bad, then it must be bad and unsafe to drink. Compliance for odor aesthetics of drinking water in the United States is based on a secondary standard using the threshold odor number (TON) method, a dilution-to-threshold test. However, this test has been subject to criticism in the drinking water community for being a poor measure of consumer
acceptance. As a result, many utilities have turned to flavor profile analysis (FPA) to better predict consumer acceptance. However, FPA requires a trained panel, and TON remains the recommended procedure for regulatory compliance. The Metropolitan Water District of Southern California, in collaboration with Tufts University, developed a new, robust odor testing method called total intensity of odor, which offers a valid alternative for compliance purposes.
2017 © American Water Works Association
JACOBSEN-GARCIA ET AL. | 109 :2 • FEBRUARY 2017 | JOURNAL AWWA E43
for TON is 3, meaning that samples with TON ≤3 are in compliance and considered free of significant odors. Samples with TON >3 are out of compliance, indicating the presence of odors likely to cause complaints. TON is considered an inappropriate test for measuring odor, however, because it does not correlate with consumer complaints (Dietrich & Burlingame 2015). Consumer complaints are driven by odor intensity; TON measures the dilution number, not odor intensity (Burlingame & Waer 1999). Additionally, TON preparation and analy-sis is cumbersome, time consuming, and requires spe-cially prepared glassware. Despite these disadvantages, the TON test is the only regulatory option for evaluating the odor of a water sample.
FPA is a descriptive method that provides the most comprehensive sensory evaluation of a sample. FPA was introduced to the drinking water industry in 1983 (Krasner et al. 1985) and has been an approved standard method (SM2170) since 1990 (Standard Methods 2012). The FPA method evaluates both the flavor and aroma (odor) in a water sample. Panelists identify individual attributes in flavor and odor and assign intensities to each attribute using a seven-point intensity scale of 0 (none) to 12 (strong). FPA panelists are carefully screened and thor-oughly trained to be able to recognize and describe flavors and odors. FPA is considered to be the best predictor of consumer complaints (Taylor et al. 2006). As a result, many water utilities use FPA to evaluate taste-and-odor aesthetics, identify particular flavors and odors, and troubleshoot taste and odor events. There are significant data supporting the interpretation of FPA results to understand and predict consumer preferences. The past FPA experiences of the Metropolitan Water District of Southern California (MWD) indicate that the presence of an unexpected off-odor with intensity of 6 (“weak to moderate”) or greater on the FPA scale of 0 to 12 is likely to elicit consumer complaints. Unfortunately, FPA is not the appropriate alternative to the TON test, namely because it is not intended to be a pass/fail measurement. Also, FPA requires extensive training and time commit-ment, which may not be practical for many utilities.
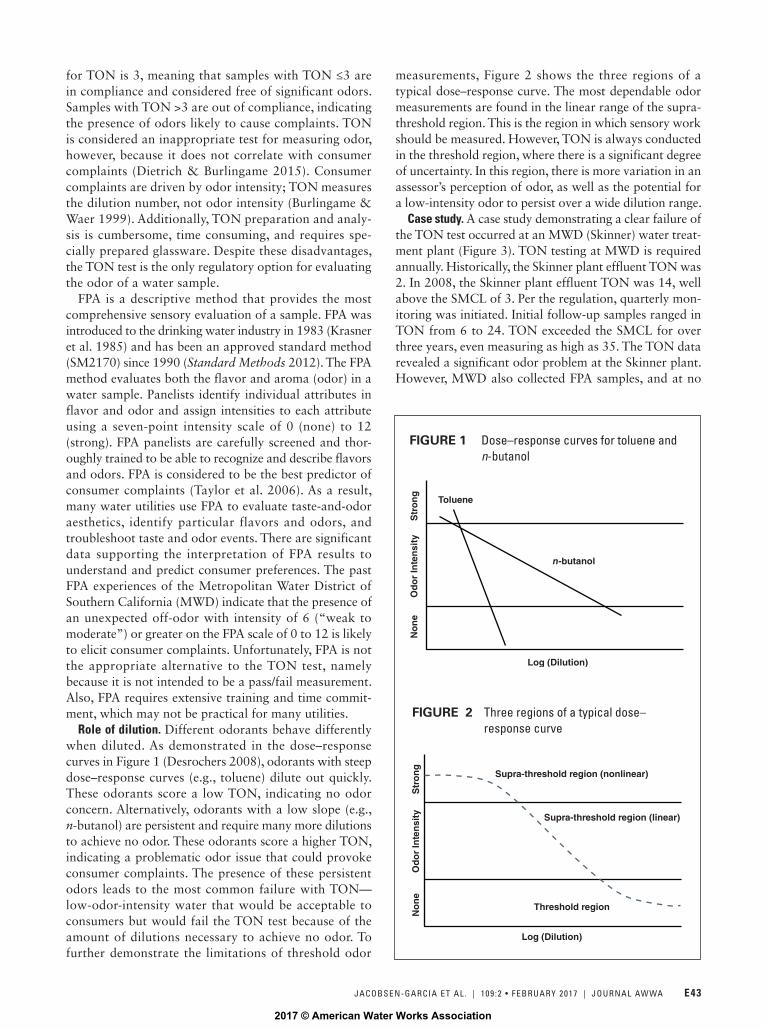
Role of dilution. Different odorants behave differently when diluted. As demonstrated in the dose–response curves in Figure 1 (Desrochers 2008), odorants with steep dose–response curves (e.g., toluene) dilute out quickly. These odorants score a low TON, indicating no odor concern. Alternatively, odorants with a low slope (e.g., n-butanol) are persistent and require many more dilutions to achieve no odor. These odorants score a higher TON, indicating a problematic odor issue that could provoke consumer complaints. The presence of these persistent odors leads to the most common failure with TON—low-odor-intensity water that would be acceptable to consumers but would fail the TON test because of the amount of dilutions necessary to achieve no odor. To further demonstrate the limitations of threshold odor
measurements, Figure 2 shows the three regions of a typical dose–response curve. The most dependable odor measurements are found in the linear range of the supra-threshold region. This is the region in which sensory work should be measured. However, TON is always conducted in the threshold region, where there is a significant degree of uncertainty. In this region, there is more variation in an assessor’s perception of odor, as well as the potential for a low-intensity odor to persist over a wide dilution range.
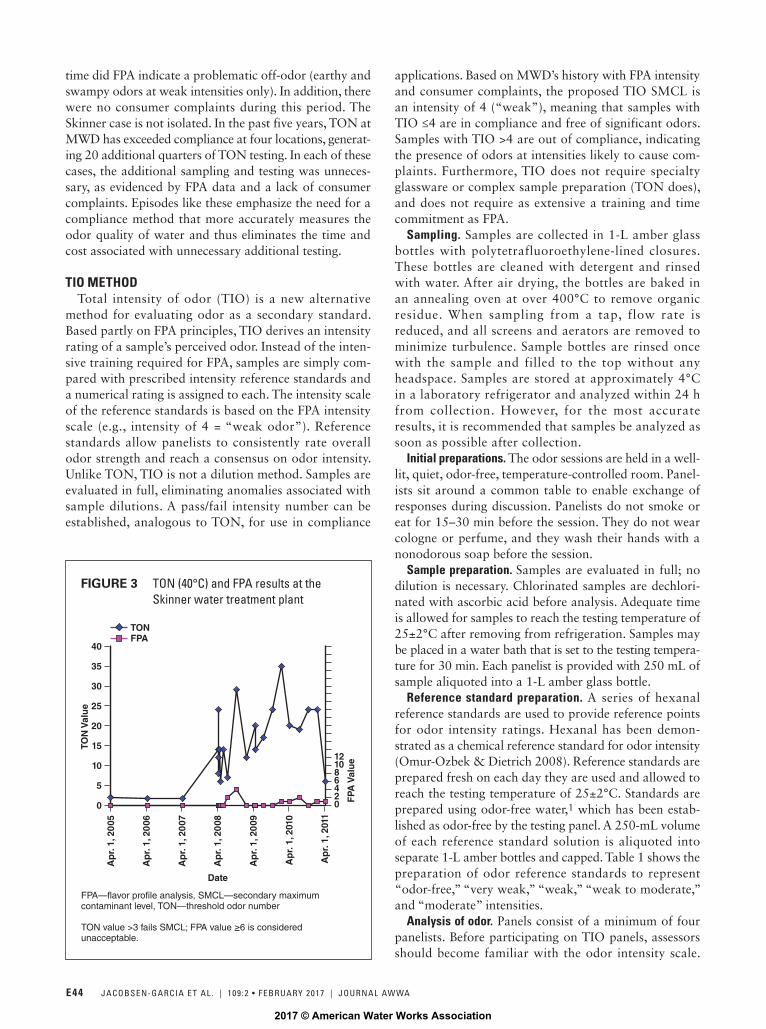
Case study. A case study demonstrating a clear failure of the TON test occurred at an MWD (Skinner) water treat-ment plant (Figure 3). TON testing at MWD is required annually. Historically, the Skinner plant effluent TON was 2. In 2008, the Skinner plant effluent TON was 14, well above the SMCL of 3. Per the regulation, quarterly mon-itoring was initiated. Initial follow-up samples ranged in TON from 6 to 24. TON exceeded the SMCL for over three years, even measuring as high as 35. The TON data revealed a significant odor problem at the Skinner plant. However, MWD also collected FPA samples, and at no
Log (Dilution)
n-butanol
Toluene
No
ne
Str
on
gO
do
r In
ten
sity
FIGURE 1 Dose–response curves for toluene and n-butanol
Log (Dilution)
Threshold region
No
ne
Str
on
gO
do
r In
ten
sity
FIGURE 2 Three regions of a typical dose– response curve
Supra-threshold region (nonlinear)
Supra-threshold region (linear)
2017 © American Water Works Association
E44 JACOBSEN-GARCIA ET AL. | 109 :2 • FEBRUARY 2017 | JOURNAL AWWA
time did FPA indicate a problematic off-odor (earthy and swampy odors at weak intensities only). In addition, there were no consumer complaints during this period. The Skinner case is not isolated. In the past five years, TON at MWD has exceeded compliance at four locations, generat-ing 20 additional quarters of TON testing. In each of these cases, the additional sampling and testing was unneces-sary, as evidenced by FPA data and a lack of consumer complaints. Episodes like these emphasize the need for a compliance method that more accurately measures the odor quality of water and thus eliminates the time and cost associated with unnecessary additional testing.
TIO METHODTotal intensity of odor (TIO) is a new alternative
method for evaluating odor as a secondary standard. Based partly on FPA principles, TIO derives an intensity rating of a sample’s perceived odor. Instead of the inten-sive training required for FPA, samples are simply com-pared with prescribed intensity reference standards and a numerical rating is assigned to each. The intensity scale of the reference standards is based on the FPA intensity scale (e.g., intensity of 4 = “weak odor”). Reference standards allow panelists to consistently rate overall odor strength and reach a consensus on odor intensity. Unlike TON, TIO is not a dilution method. Samples are evaluated in full, eliminating anomalies associated with sample dilutions. A pass/fail intensity number can be established, analogous to TON, for use in compliance
applications. Based on MWD’s history with FPA intensity and consumer complaints, the proposed TIO SMCL is an intensity of 4 (“weak”), meaning that samples with TIO ≤4 are in compliance and free of significant odors. Samples with TIO >4 are out of compliance, indicating the presence of odors at intensities likely to cause com-plaints. Furthermore, TIO does not require specialty glassware or complex sample preparation (TON does), and does not require as extensive a training and time commitment as FPA.
Sampling. Samples are collected in 1-L amber glass bottles with polytetrafluoroethylene-lined closures. These bottles are cleaned with detergent and rinsed with water. After air drying, the bottles are baked in an annealing oven at over 400°C to remove organic residue. When sampling from a tap, flow rate is reduced, and all screens and aerators are removed to minimize turbulence. Sample bottles are rinsed once with the sample and filled to the top without any headspace. Samples are stored at approximately 4°C in a laboratory refrigerator and analyzed within 24 h from collection. However, for the most accurate results, it is recommended that samples be analyzed as soon as possible after collection.
Initial preparations. The odor sessions are held in a well-lit, quiet, odor-free, temperature-controlled room. Panel-ists sit around a common table to enable exchange of responses during discussion. Panelists do not smoke or eat for 15–30 min before the session. They do not wear cologne or perfume, and they wash their hands with a nonodorous soap before the session.
Sample preparation. Samples are evaluated in full; no dilution is necessary. Chlorinated samples are dechlori-nated with ascorbic acid before analysis. Adequate time is allowed for samples to reach the testing temperature of 25±2°C after removing from refrigeration. Samples may be placed in a water bath that is set to the testing tempera-ture for 30 min. Each panelist is provided with 250 mL of sample aliquoted into a 1-L amber glass bottle.
Reference standard preparation. A series of hexanal reference standards are used to provide reference points for odor intensity ratings. Hexanal has been demon-strated as a chemical reference standard for odor intensity (Omur-Ozbek & Dietrich 2008). Reference standards are prepared fresh on each day they are used and allowed to reach the testing temperature of 25±2°C. Standards are prepared using odor-free water,1 which has been estab-lished as odor-free by the testing panel. A 250-mL volume of each reference standard solution is aliquoted into separate 1-L amber bottles and capped. Table 1 shows the preparation of odor reference standards to represent “odor-free,” “very weak,” “weak,” “weak to moderate,” and “moderate” intensities.
Analysis of odor. Panels consist of a minimum of four panelists. Before participating on TIO panels, assessors should become familiar with the odor intensity scale.
024681012
0
5
10
15
20
25
30
35
40
F
PA V
alu
e
TON
Val
ue
TONFPA
FIGURE 3 TON (40°C) and FPA results at the Skinner water treatment plant
FPA—flavor profile analysis, SMCL—secondary maximum contaminant level, TON—threshold odor number
TON value >3 fails SMCL; FPA value ≥6 is considered unacceptable.
Date
Ap
r. 1,
20
05
Ap
r. 1,
20
06
Ap
r. 1,
20
07
Ap
r. 1,
20
08
Ap
r. 1,
20
09
Ap
r. 1,
201
0
Ap
r. 1,
201
1
2017 © American Water Works Association

JACOBSEN-GARCIA ET AL. | 109 :2 • FEBRUARY 2017 | JOURNAL AWWA E45
Assessors initially work independently. The samples and reference standards are gently shaken, the cap is removed, and the headspace is sniffed. Each assessor sniffs the hexanal intensity 4 reference standard to calibrate the anchor intensity of 4 (“weak”). After waiting at least 30 s, each assessor sniffs the sample. TIO is assigned on the basis of the intensity scale. To minimize carry-over and fatigue, panelists sniff odor-free water and rest at least 1 min between samples.
Compilation of results. One panel member compiles all results on one sheet. If for any given sample the difference in any two individual TIO values is >2 (e.g., one panelist reports TIO of 2 and another reports TIO of 6), the panel discusses the sample and may re-test, using the reference standards for calibration. After individual results are discussed and recorded, one representative value is selected through discussion and then reported.
METHOD VALIDATION STUDY Experimental design. During the 2014 and 2015
annual compliance testing of TON at MWD, parallel samples were evaluated using TIO and FPA to compare the effectiveness of TON and TIO for predicting con-sumer acceptance. The best way to compare the effec-tiveness of the TON and TIO methods relative to con-sumer acceptance is to compare the results of both TON and TIO with the FPA results. It is well docu-mented that FPA intensity measurements are a good predictor of consumer acceptance (Taylor et al. 2006). Past experiences at MWD indicated that an off-odor or off-flavor at an intensity of 6 or greater was likely to result in consumer complaints. FPA was conducted in this study to provide a more complete description of the aesthetic characteristics of the water samples and as a benchmark for evaluating consumer acceptance. Sample sites included MWD’s drinking water treatment plant effluents and source water locations. Note that source waters are not compliance samples, but MWD includes them during compliance testing for informa-tional purposes. Per method requirements, plant efflu-ent samples were dechlorinated before analysis by TON and TIO to remove the potential for chlorine to drive the overall odor rating. Because FPA identifies indi-vidual descriptors, chlorine does not interfere with the sensory evaluation, and not altering the sample more closely represents what is received in the distribution system. Samples were analyzed for TON at 40 and 60°C, TIO, and FPA. MWD had adopted 40°C as the TON operating temperature for compliance testing (as allowed by the method). However, 60°C remains the standard temperature for TON and is commonly used by other agencies.
A number of odorants were screened using FPA and TON to find a selection that represented a spectrum of dose–response characteristics upon dilution. The odorants
selected are listed in Table 2. The objective was to mimic a low-odor event by spiking these odorants into a plant efflu-ent sample and compare the effectiveness of TON and TIO for predicting consumer acceptance, as measured using FPA. Dose–response information for each odorant was used to select the concentration(s) to test for each odorant, with the intent to target levels that would either cause or not cause consumer complaints. Samples from the Weymouth plant effluent were collected on each day of testing. Samples were spiked with a single odorant and aliquoted for analysis by TON at 40 and 60°C, TIO, and FPA.
Results and discussion. Figures 4, 5, 6, and 7 compare FPA and TON methods. The overlay of data denotes multiple data points that fall on the same area of the graph. The x-axis represents FPA results, with a vertical line at 6. Data that fall on or to the right of the vertical line are considered unacceptable (FPA ≥6) and would likely cause consumer complaints. Alternatively, data that fall to the left of the vertical line are considered acceptable (FPA <6) and would not be likely to result in complaints. The y-axis represents TON results, with a horizontal line at 3. TON data that fall on or below the horizontal line are in compliance (TON ≤3), denoting no significant odor issue. TON data that fall above the horizontal line are out of compliance (TON >3), indicat-ing the presence of odor likely to cause complaints. Figures 8, 9, 10, and 11 compare FPA and TIO methods. The x-axis follows the same interpretation as figures 4, 5, 6, and 7. However, the y-axis represents TIO results, with a horizontal line at 4. TIO data that fall on or below the horizontal line are in compliance (TIO ≤4), denoting no significant odor issue. TIO data that fall above the
TABLE 1 Hexanal odor reference standard preparation
CodeHexanal µg/L
Odor Intensity
Odor Intensity Description
H0 0 0 Odor-free
H2 5 2 Very weak
H4 30 4 Weak
H6 100 6 Weak to moderate
H8 1,600 8 Moderate
TABLE 2 Odorants selected for fortified samples
Odorant Odor Description
Dimethyl sulfide Rotten vegetation
Hexanal Solventy
2-methylisoborneol Musty
Geosmin Earthy
Cis-3-hexenol Grassy
2017 © American Water Works Association

E46 JACOBSEN-GARCIA ET AL. | 109 :2 • FEBRUARY 2017 | JOURNAL AWWA
horizontal line are out of compliance (TIO >4), indicating an odor likely to cause complaints. Four combinations are possible in figures 4–11:
• FPA at an intensity that will not cause consumer complaints and TON or TIO in agreement with FPA (bottom left)
• FPA at an intensity that will cause consumer com-plaints and TON or TIO not in agreement with FPA (bottom right)
• FPA at an intensity that will not cause consumer complaints and TON or TIO not in agreement with FPA (top left)
• FPA at an intensity that will cause consumer com-plaints and TON or TIO in agreement with FPA (top right)
A comparison of FPA, TON (40 and 60°C), and TIO methods at plant effluent sites is shown in Figures 4 and 8. FPA intensities for all plant effluent sites were deemed acceptable (FPA <6), and would not be likely to cause consumer complaints. All TIO agreed with FPA (Figure 8), with intensities at or below the proposed SMCL of 4. The TON method compared well with FPA (Figure 4), with most TON results at or below the SMCL of 3. However, one TON result at 60°C was above 3, suggesting
0
3
6
9
12
0 2 4 6 8 10 12
TON
Val
ue
FPA Value
FIGURE 4 Comparison of TON (40°C and 60°C) versus FPA method for 10 plant ef�uent samples
FPA—flavor profile analysis, SMCL—secondary maximum contaminant level, TON—threshold odor number
TON value >3 fails SMCL; FPA value ≥6 is considered unacceptable.
40ºC60ºC
0
3
6
9
12
15
18
21
24
0 2 4 6 8 10 12
TON
Val
ue
FPA Value
40ºC60ºC
FIGURE 5 Comparison of TON (40ºC and 60ºC) versus FPA method for three source water samples (moderate odors)
FPA—flavor profile analysis, SMCL—secondary maximum contaminant level, TON—threshold odor number
TON value >3 fails SMCL; FPA value ≥6 is considered unacceptable.
0
3
6
9
12
0 2 4 6 8 10 12
TON
Val
ue
FPA Value
FIGURE 6 Comparison of TON (40ºC and 60ºC) versus FPA method for seven source water samples (weak odors)
40ºC60ºC
FPA—flavor profile analysis, SMCL—secondary maximum contaminant level, TON—threshold odor number
TON value >3 fails SMCL; FPA value ≥6 is considered unacceptable.
0
3
6
9
12
0 2 4 6 8 10 12
TON
Val
ue
FPA Value
FIGURE 7 Comparison of TON (40ºC and 60ºC) versus FPA method for 24 forti�ed samples
40ºC60ºC
FPA—flavor profile analysis, SMCL—secondary maximum contaminant level, TON—threshold odor number
TON value >3 fails SMCL; FPA value ≥6 is considered unacceptable.
2017 © American Water Works Association

JACOBSEN-GARCIA ET AL. | 109 :2 • FEBRUARY 2017 | JOURNAL AWWA E47
an odor problem even though FPA predicted otherwise. For this sample, utilities using the standard tempera-ture of 60°C would have reacted to a false measure of elevated odor. Comparison of methods at source water sites with moderate odors is shown in Figures 5 and 9. FPA intensities were found to be unacceptable (FPA ≥6) and would likely result in consumer complaints. Both TIO (Figure 9) and TON (Figure 5) agreed with FPA, with intensities above 4 and 3, respectively. Overall, TON and TIO methods compare well with FPA for waters free of significant odors (plant effluents) and waters with moderate odors.
A comparison of methods at source water sites with weak odors is shown in Figures 6 and 10. FPA intensi-ties for all sites were considered acceptable (FPA <6). There were some off-odors present, but at low intensi-ties and at low risk of consumer aversion. The TIO results corresponded with all FPA results (Figure 10). However, 93% of TON results (Figure 6) disagreed with FPA, suggesting the presence of off-odor(s) at intensities likely to cause complaints. Even more trou-bling, 100% of TON at 60°C (standard temperature for TON) disagreed with FPA. These false measures of elevated odors would ultimately result in unnecessary
0
2
4
6
8
10
12
0 2 4 6 8 10 12
TIO
Val
ue
FPA Value
FIGURE 8 Comparison of TIO versus FPA method for 10 plant ef�uent samples
FPA—flavor profile analysis, SMCL—secondary maximum contaminant level, TIO—total intensity of odor
TIO value >4 fails proposed SMCL; FPA value ≥6 is considered unacceptable.
0
2
4
6
8
10
12
0 2 4 6 8 10 12
TIO
Val
ue
FPA Value
FIGURE 9 Comparison of TIO versus FPA method for three source water samples (moderate odors)
FPA—flavor profile analysis, SMCL—secondary maximum contaminant level, TIO—total intensity of odor
TIO value >4 fails proposed SMCL; FPA value ≥6 is considered unacceptable.
0
2
4
6
8
10
12
0 2 4 6 8 10 12
TIO
Val
ue
FPA Value
FIGURE 11 Comparison of TIO versus FPA method for 24 forti�ed samples
FPA—flavor profile analysis, SMCL—secondary maximum contaminant level, TIO—total intensity of odor
TIO value >4 fails proposed SMCL; FPA value ≥6 is considered unacceptable.
0
2
4
6
8
10
12
0 2 4 6 8 10 12
TIO
Val
ue
FPA Value
FIGURE 10 Comparison of TIO versus FPA method for seven source water samples (weak odors)
FPA—flavor profile analysis, SMCL—secondary maximum contaminant level, TIO—total intensity of odor
TIO value >4 fails proposed SMCL; FPA value ≥6 is considered unacceptable.
2017 © American Water Works Association

E48 JACOBSEN-GARCIA ET AL. | 109 :2 • FEBRUARY 2017 | JOURNAL AWWA
concern and additional monitoring, when in fact FPA predicted no significant odor.
Comparison of methods of fortified samples is shown in Figures 7 and 11. Most of the fortified samples (92%) reported low FPA intensities (FPA <6) and would not be expected to invoke complaints. TIO (Figure 11) agreed with FPA 83% of the time. TON, on the other hand, did not reach the same consistency of agreement as TIO. The TON method (Figure 7) agreed with FPA only 52% of the time (58% agreement at 40°C and 46% agreement at 60°C). Overall, the TIO test was better at predicting con-sumer acceptance than TON in source waters with weak odors and fortified samples. Furthermore, samples with weak, persistent odors demonstrate the most common failure of using TON: odorants in water at intensities that are acceptable to consumers but need four or more dilu-tions to reach a nondetect odor.
SUMMARY, CONCLUSIONS, AND RECOMMENDATIONS For an SMCL for odor in drinking water to be meaning-
ful, there must be a valid sensory technique to measure the level of odor that can reliably predict consumer acceptance/rejection. TON, a dilution-to-threshold test, has been the recommended procedure by regulators since the SMCL was first adopted. Since that time, the drinking water commu-nity has recognized the shortcomings of the TON method, namely as being a poor measure of consumer acceptance, and as a result have sought better options to evaluate aes-thetic characteristics of drinking water. In 1983, MWD was the first to adopt and modify the flavor profile method for use in drinking water applications (Krasner et al. 1985) and has since been accepted by Standard Methods. FPA provides comprehensive descriptive analysis of both flavor and odor from which consumer preferences can be reliably predicted. FPA also provides invaluable information for use in identi-fying and troubleshooting taste and odor events. However, the nature of the methodology is complex, requiring exten-sive panel training and time commitment. Additionally, FPA by design is not intended to be a pass/fail measurement and thus is not the appropriate alternative test to TON for compliance purposes.
The TIO method was developed to reliably predict con-sumer acceptance/rejection of drinking water. TIO imple-ments the strength of using intensity ratings with reference standards as anchors, and at the same time maintains the simplicity required to set pass/fail criteria for use in compli-ance with an SMCL. Direct comparisons of methodologies not only has demonstrated that TIO is a valid method to use for compliance testing; it is indeed a superior test to the TON method for the aesthetic evaluation of odor in drinking water. The information gathered through this project will support the adoption of TIO as an approved analytical method through Standard Methods and/or ASTM International. Once approved, regulators could amend the secondary standard to include TIO as a valid method for odor evaluation in drinking water.
ENDNOTES1Arrowhead® Mountain Spring Water, Ontario, Calif.
ABOUT THE AUTHORSAllison Jacobsen-Garcia (to whom correspondence may be addressed) is a chemist at the Metropolitan Water District of Southern California (MWD), 700 Moreno Ave., La Verne, CA 91750 USA; [email protected]. She has been employed at MWD for 12 years, has more than
eight years of experience in flavor profile analysis, and has been involved in the Total Intensity of Odor Method Validation study for two years. Other work includes analysis of bromate, chlorite, chlorate, hexavalent chromium, and carboxylic acids by ion chromatography. Jacobsen-Garcia received a BS degree in biology from California State Polytechnic University, Pomona, Calif. Melissa Dale is vice-president of Plaza & Associates, Camano Island, Wash. Roy Desrochers is the sensory practice leader at the Tufts University Sensory and Science Center, Medford, Mass. Stuart Krasner is a principal environmental specialist at MWD.
https://dx.doi.org/10.5942/jawwa.2017.109.0010
PEER REVIEWDate of submission: 07/15/2016Date of acceptance: 09/29/2016
REFERENCESAWWARF (AWWA Research Foundation) & Lyonnaise des Eaux, 1987.
Identification and Treatment of Tastes and Odors in Drinking Water (J. Mallevialle & I.H. Suffet, editors). AWWARF & AWWA, Denver.
Burlingame, G.A. & Waer, M.A., 1999. AWWA Water Quality Division Taste and Odor Committee. Options for a Taste and Odor Standard. Proc. 1999 AWWA Water Quality Technology Conference, Tampa, Fla.
Desrochers, R., 2008. Descriptive Sensory Analysis. AEG New England chapter meeting, Wellesley, Mass.
Dietrich, A.M. & Burlingame, G.A., 2015. Critical Review and Rethinking of USEPA Secondary Standards for Maintaining Organoleptic Quality of Drinking Water. Environmental Science & Technology, 49:2:708. https://doi.org/10.1021/es504403t.
Izaguirre, G.; Hwang, C.J.; Krasner, S.W.; & McGuire, M.J., 1982. Geosmin and 2-Methylisoborneol From Cyanobacteria in Three Water Supply Systems. Applied and Environmental Microbiology, 43:3:708.
Krasner, S.W.; McGuire, M.J.; & Ferguson, V.B., 1985. Tastes and Odors: The Flavor Profile Method. Journal AWWA, 77:3:34.
Omur-Ozbek, P. & Dietrich, A.M., 2008. Developing Hexanal as an Odor Reference Standard for Sensory Analysis of Drinking Water. Water Research, 42:2598. https://doi.org/10.1016/j.watres.2008.01.010.
Standard Methods for the Examination of Water and Wastewater, 2012 (22nd ed.). APHA, AWWA, and WEF, Washington.
Taylor, W.D.; Losee, R.F.; Torobin, M.; Izaguirre, G.; Sass, D.; Khiari, D.; & Atasi, K., 2006. Early Warning and Management of Surface Water Taste-and-Odor Events. Water Research Foundation, Denver.
2017 © American Water Works Association