‘total economic value’ of new zealand’s land-based … · 2014-07-23 · “total economic...
TRANSCRIPT
3.2 VALUE OF ECOSYSTEM SERVICES
496
‘TOTAL ECONOMIC VALUE’ OF NEW ZEALAND’S LAND-BASED ECOSYSTEMS AND THEIR SERVICESMurray G. Patterson1, Anthony O. Cole2
1 School of People, Environment and Planning, Massey University, Private Bag 11222, Palmerston North, New Zealand2 Panosphy Ltd, Palmerston North, New Zealand
Patterson MG, Cole AO 2013. “Total economic value” of New Zealand’s land-based ecosystems and their services. In Dymond JR ed. Ecosystem services in New Zealand – conditions and trends. Manaaki Whenua Press, Lincoln, New Zealand.
INTRODUCTIONThis chapter updates and revises a study undertaken in
1996/97 for the Department of Conservation and the Ministry for Environment, to provide background information for New Zealand’s Biodiversity Strategy. While the fi rst report was completed in 1997 (Cole and Patterson 1997), it was not fully published until February 1999 (Patterson and Cole 1999a). A range of other commissioned reports that applied the Patterson and Cole (1999a) methodology to various regions in New Zealand were also subsequently produced: Patterson and Cole (1999b), McDonald and Patterson (2008), van den Belt et al. (2009) and Chrystall et al. (2012).
In this revision and update we will restrict ourselves to land-based ecosystems (horticulture, cropping, agriculture, forests, scrubland, wetlands, rivers, lakes, estuaries and mangroves) and their services. Although the original study also covered the coastal zone and indeed the entire Exclusive Economic Zone of New Zealand, these ecosystems will not be covered in this anal-ysis primarily due to the current lack of reliable data. However, it should be noted that indicative calculations demonstrate that the value of coastal–marine ecosystems in New Zealand is likely to be very high and signifi cantly exceeding the land-based ecosys-tems (Patterson and Cole 1999a).
As with our original study, the analytical aim is to estimate the total economic value derived from New Zealand’s land-based ecosystems and their services. The ‘total economic value’ (TEV) taxonomy promoted by Pearce et al. (1989) and Perrings (1995), among others, is used in this analysis. The TEV of ecosystems, like any resource, consists of use value and non-use (passive) value. The passive-value component can be subdivided into option-, bequest- and existence-value components. In this study, the use-value component is subdivided into supporting services, regulating services, provisioning services and cultural services.
Rationale for this valuation studyMany would argue that biodiversity and ecosystems cannot or
should not be valued by short-term perceptions of instrumental
or utilitarian value; rather, their value should be determined by ethical and moral principles. In this vein, it is often contended that, for example, a kauri forest ecosystem or a tuatara is ‘price-less’ much the same as a rare piece of art. Although this may be the philosophical position of some, we argue there are compelling pragmatic reasons for being explicit about the value of ecosys-tems and biodiversity if true progress is to be made in ecosystem management.
Firstly, as others such as Perrings (1995) and Costanza et al. (1997) argue, in reality all of us implicitly place value on ecosys-tems and biodiversity in terms of our everyday behaviour – no matter how opposed we may be to monetisation and commodifi ca-tion of nature. All the valuation process does is to be explicit about the value of ecosystems and biodiversity, based on an examina-tion of people’s revealed or stated preferences. In saying this, the authors wish to acknowledge that there are signifi cant operational problems in validly and reliably measuring these preferences – refer to Blamey and Common (1994) for a fuller discussion. Also, it needs to be acknowledged that the standard neoclassical valua-tion approach we allude to here is fundamentally anthropocentric and as such has a number of signifi cant limitations. For example, it needs to be recognised that the neoclassical approach is predi-cated on short-term perceptions of instrumental value and is often based on incomplete ecological knowledge.
Secondly, the authors consider it imperative to assess the value of ecosystems and biodiversity, so that their values can be appre-ciated and compared with other yardsticks of progress. Most importantly, there is a need to compare the value of New Zealand’s ecosystems with the GDP (gross domestic product) indicator that measures the value of the output of the economy. Only then will the values of ecosystems and biodiversity that we subcon-sciously understand become ‘visible’ and apparent to many decision-makers who are more used to dealing with indicators such as the GDP. Environmental accounting exercises such as this in other countries have been very successful in highlighting the importance of natural resources and the environment relative to economic indicators, for example in the United States (Daly
ABSTRACT: This analysis updates and refi nes an earlier study (1999) undertaken by the authors. The ‘total economic value’ of land-based ecosystems and their services is quantifi ed, which involves measuring their use values (provisioning, cultural, regulating, supporting) and their non-use values (option, existence, bequest). Particular methodological attention was paid to (1) reconfi guring the original framework to be compatible with the Millennium Ecosystem Assessment framework and (2) eliminating some of the double-counting issues in aggregating these values – this particularly means not double counting ‘supporting’ ecosystem services. Once issues of double counting have been eliminated, it is estimated that in 2012 New Zealand’s land-based ecosystem services contributed $57 billion to human welfare (this is equivalent to 27% of New Zealand’s GDP). From another perspective, it is shown that the main categories of ecosystem services and values for New Zealand’s land-based ecosystems were: supporting services ($22b), regulating services ($15b), provisioning services ($30b), cultural services ($1b), and passive values ($12b). Limitations of the rapid assessment methodology include lack of specifi c New Zealand data except for provisioning services, problems with translating world data for the New Zealand context, and issues relating to the methodological and philosophical assumptions underlying the approach. We suggest how to improve and enrich the estimates for this national-scale analysis.
Key words: double counting, Millennium Ecosystem Assessment, national scale, terrestrial, total economic value.

497
VALUE OF ECOSYSTEM SERVICES 3.2
and Cobb 1994) and Australia (Hamilton and Saddler 1997). Probably of most signifi cance in terms of its impact on the policy community, was Costanza et al.’s (1997) analysis that showed the contribution to human welfare from world ecosystem services was surprisingly nearly double the world GDP.
Our analysis is undertaken in the spirit of methodological pluralism, where it is acknowledged that no one methodology is correct or comprehensive, but a number of methodologies need to be used to gain a fuller appreciation of the value of biodiversity and ecosystem services. This study uses the standard neoclas-sical valuation approach, which as noted above is fundamentally anthropocentric, even when it encompasses non-use values such as existence value. Costanza (1991) argues that this neoclassical approach can lead to anomalies based on human beings having imperfect knowledge of ecological processes and functions. For example, he points out that human beings generally assign higher value to species of direct commercial value or those that are easy to empathise with, whereas less visible species such as inverte-brates are often ignored.
In order to capture a broader range of values and ecological functions, other valuation methods in addition to the anthropo-centric neoclassical approach need to be employed. For example, the contributory value approach developed by Patterson (1998, 2002, 2008) could be used to explicitly measure the contributory value of invertebrates in the food chain in terms of what extent (via energy and mass fl ows) they contribute to other species. It is therefore strongly recommended that these other approaches, such as the contributory value technique and Odum’s (1996) emergy methodology, be used to complement the neoclassical valuation approach. It is unwise to rely on only one approach or perspective.
Rapid assessment methodologyIt is impossible in a study such as this to measure economic
values comprehensively and accurately for all ecosystems and their services. Instead we relied on a very large range of literature values and mapping infor-mation to undertake a rapid assessment of the value of New Zealand’s land-based ecosystems and their services – the full methodology is detailed in Patterson and Cole (1999a).
Although some data could be obtained directly from Statistics New Zealand (e.g. food and fi bre production), most needed to be abstracted from the literature and adapted to the New Zealand situation. That is, we used the ‘benefi t transfer’ method to estimate economic values for ecosystem services, trans-ferring information available from studies completed in another location to the New Zealand context. For example, values for recreati-onal fi shing could be applied to the New Zealand situation
as long as the original data applied to a similar country or situ-ation; or if this was not the case, the data could be adjusted to refl ect the New Zealand situation more closely. The main data sources we used for these ‘benefi t transfer’ calculations were:• Costanza et al. (1997). These data became available in 1997,
enabling us to crosscheck and fi ll gaps in our data. Costanza et al.’s (1997) values were based on worldwide averages, and therefore care needs to be taken in transferring them to the New Zealand situation.
• The literature outlined in both Cole and Patterson (1997) and Patterson and Cole (1999a), particularly for passive (non-use) values, which are not covered by Costanza et al. (1997).
• Ecosystem Services Database, constructed in 2008–09 for the project ‘Ecosystem Services Benefi ts in Terrestrial Ecosystems for Iwi’ (MAU0502, Foundation for Research, Science and Technology). This database contains 282 records for the 7 types of systems (wetlands, forestry, coastal, rivers, lakes, agriculture, conservation parks) across 15 categories of ecosystem services, with most entries directly relevant to the New Zealand situation.
• Vegetative cover data, primarily obtained from Newsome (1987), Terralink’s Landcover database and AgriBase, with some other spatial data being obtained from topographical maps.
A cautionary caveat is required in interpreting the results of this rapid assessment of the value of land-based New Zealand ecosystems and their services. Even though some of the values have improved and been updated from our initial estimates in 1996/97, the overall results can still only be seen as indicative. However, the data are good enough to indicate, in broad terms: What ecosystems are most important in terms of their service delivery? What ecosystem services are most important? What research agenda should be followed to improve our understanding of the science and management of ecosystem services?
FIGURE 1 Millennium Ecosystem Assessment’s ecosystem services framework.

3.2 VALUE OF ECOSYSTEM SERVICES
498
Millennium Ecosystem Assessment frameworkFor the assessment of use values we have used the Millennium
Ecosystem Assessment framework (2005) to classify ecosystem services into the following categories: provisioning, regulating, cultural, and supporting ecosystem services (Figure 1). This is a departure from our original study (Cole and Patterson 1997; Patterson and Cole 1999a), where the term ‘direct’ was used to refer to both ‘provisioning’ and ‘cultural’ services, and the term ‘indirect’ was used to refer to both ‘regulating’ and ‘supporting’ services. The advantage of using the Millennium Ecosystem Assessment framework is that it separates ‘supporting services’ from the other services (particularly regulating), which means that double counting of ‘supporting services’ can be easily avoided when summing ecosystem service dollar values. That is, in aggre-gating the dollar values of ecosystem services for New Zealand, ‘provisioning’,‘ regulating ’and ‘cultural’ values should be added together, but not that of ‘supporting’ services’ as their value is already included in the dollar values of the fi rst three types of ecosystem services.
Departing from the Millennium Ecosystem Assessment frame-work, we have not included ‘pollination’ as a ‘regulating’ service – rather we have considered pollination to be a ‘supporting’ service. That is, pollination supports the provisioning services of food and fi bre production, and in that sense is clearly a support service and does not directly contribute to human well-being. In doing this we agree with Haines-Young and Potschin (2009) that pollination is an ‘intermediate service’ rather than a ‘fi nal service/benefi t’. We also question that pollination is a regulating service, as it does not regulate the environment per se as does, for example, the gas or climate regulation services – rather polli-nation indirectly enhances human well-being by providing mass (pollen) for fertilising plants that then in turn produce products (food and fi bre) that are directly consumed by humans.
A second departure from the framework was considering ‘erosion control’ to be primarily a supporting service. That is, erosion control enhances and supports provisioning services such as food and fi bre production and perhaps regulating services such as ‘fl ood control’, but by itself does not directly contribute to human well-being or a ‘fi nal service’– one possible exception is erosion control that may be considered to be a ‘provisioning’ service (providing space for housing) in urban1 situations where housing and other structures may be at risk from erosion – this, however, is a rare situation as most erosion takes place in rural situations where food and fi bre production predominate.
Valuation methodsMuch of the value of provisioning ecosystem services can
be measured by using market values, which are recorded in the System of National Accounts. Commercial markets, for example, exist for food and forestry products and therefore their market values were used in our analysis.
Some of the provisioning ecosystem services, and all of the supporting /regulating /cultural ecosystem services, and all passive values of ecosystem services are not subject to market transactions and therefore they have no market value. In these instances non-market valuation techniques need to be used to impute a value for these ecosystem services. In this analysis, in the virtual absence of suitable New Zealand studies, a wide range of overseas studies were used to estimate these non-market values. These overseas studies for the most part used the following non-market valuation methods:
1.Willingness-To-Pay (WTP). Surveys ask individuals how
much they are willing to pay to gain the benefi t of using ecosystem services given variations in the quality and quan-tity supplied. For example, an individual may be asked how much he/she is willing to pay for the right to fi sh in a river for a month, to ascertain the individual’s WTP. When these individual WTPs are aggregated, a demand curve for the ecosystem service of ‘fi shing’ can be obtained for an entire population, and can then be used as the basis for valuing this particular ecosystem service.2. Replacement Cost Method. This method was also frequently used. It attempts to measure the cost of replacing the loss of an ecosystem service with an equivalent service. For example if a wetland is destroyed and there is a loss of the fl ood control service provided by a wetland, the question is how much would it cost to replace this loss of service perhaps by building a fl ood control dam.3.Willingness-To-Accept-Compensation (WTA). Surveys ask individuals to nominate how much they would need to be compensated in order to accept the loss of an ecosystem service. Evidence shows that WTA estimates are usually higher than WTP, essentially because WTP is bounded by an individual’s income, whereas WTA has no practical upper bound (Goodstein 1995). Partly for this reason WTP is the most widely used non-market valuation method.
Other methods used in the literature that we drew on are avoided cost, factor income, travel costs, hedonic pricing, conjoint analysis, and choice modelling.
CLASSIFICATION OF ECOSYSTEMS, THEIR SERVICES AND THEIR VALUESTypes of ecosystems
The total land2 surface area of New Zealand is divided into 12 standard ecosystem types:• Horticulture and cropping (301 500 ha) [C1, C2]• Agriculture (10 604 000 ha) [ G1–G6]• Intermediate agriculture–scrub (5 170 000 ha) [GS1–GS8]• Scrub (1 104 000 ha) [S1–S4]• Intermediate agriculture–forest (732 000 ha) [GF1–GF6]• Forest–scrub (1 277 000 ha) [FS1–FS8]• Forests (6 330 000 ha) [F1–F9]• Wetlands (166 000 ha) [M2]• Estuaries (100 000 ha)• Mangroves (19 000 ha)• Lakes (303 977 ha)• Rivers (225 000 ha)
The fi rst eight classes of ecosystems are based on their common vegetative cover. These classes are aggregations of Newsome’s (1987) 47 vegetative cover classes – Newsome’s original classes are indicated in square parenthesis in the above list. These standard ecosystems were used in the assessment of ‘use value’ (see below).
In the assessment of ‘passive value’ (see below), heritage ecosystem types were used. These are heritage ecosystems that normally have special protection under New Zealand legislation, due to their outstanding ecological, scientifi c or cultural heritage features. It is these features that result in heritage ecosystems having very signifi cant passive (non-use) values, as people feel it is important to protect these ecosystems whether they use them or not. In a spatial analytic sense, these heritage ecosystems are overlays of the standard ecosystem units, and therefore care needs to be taken not to double-count values. The heritage ecosystems

499
VALUE OF ECOSYSTEM SERVICES 3.2
covered in this analysis include:• National parks (3 080 093 ha)• Forest parks (2 404 998 ha)• Land reserves, including scenic, nature, scientifi c, historical,
recreation and wildlife management reserves (about 300 000 ha)
It should be noted that the passive-value calculations also used some of these standard ecosystem types (e.g. wetlands).
Types of ecosystem servicesThe term ecosystem service is used here. Alternative synony-
mous terms that are used less frequently in the literature include ‘biodiversity services’, or ‘environmental services of biodiver-sity’ (Myers 1996), as well as ‘nature’s services’ (Daily 1997).
The concept of ecosystem services emerged in the 1990s, as a mechanism for understanding how ecosystems directly and indirectly contribute to human welfare (de Groot 1987, 1992; Daily 1997). Ecosystem services can be defi ned as ecosystem goods (such as food) and services (such as climate regulation) that benefi t humans. For simplicity, these ecosystem goods and services are usually collectively referred to as ‘ecosystem services’.
The following 17 ecosystem services derived from Costanza et al.’s (1997) analysis were used, with renaming of the hydrolog-ical services (for clarity’s sake): gas regulation, climate regulation, disturbance regulation, water provisioning, water storage and
retention, erosion control and sediment retention, soil formation, nutrient cycling, waste treatment, pollination, biological control, refugia, food production, raw materials, genetic resources, recrea-tion, and cultural. Table 1 provides a full defi nition and examples of each ecosystem service.
Types of values coveredIn this study, the ‘value of ecosystem services’ is measured
according to the Total Economic Value (TEV) taxonomy. By defi nition, TEV is the sum of use value (UV) and passive value or non-use value (PV):
TEV = UV + PV. (1)
Use value (UV) refers to the utilitarian value that can annually be derived from ecosystems and their services. Use value can be decomposed into four component parts:
1. Provisioning services value (PSV). This refers to the direct provision of goods and services by an ecosystem. This includes services such as the provision of food, fi bre, fresh water, and genetic resources. Usually provisioning services are measured by the System of National Accounts and there-fore they are included in GDP calculations, as they are traded on commercial markets, when they are supplied. Sometimes, however, provisioning services values are not recorded in the national accounts, as their provision involves no commercial
TABLE 1 Defi nition and examples of ecosystem services
Ecosystem Service Defi nition Examples
1 Gas regulation Regulation of atmospheric chemical composition CO2 /O2 balance, O3 for UV protection, and SOX levels
2 Climate regulationRegulation of global temperature, precipitation, and other biologically mediated climatic processes at global or local levels
Greenhouse gas regulation, DMS production affecting cloud formation
3 Disturbance regulation Capacitance, damping, and integrity of ecosystem response to environmental fl uctuations
Storm protection, fl ood control, drought recovery, and other aspects of habitat response to environmental variability mainly controlled by vegetation structure
4 Water provisioning Regulation of hydrological fl ows Provisioning of water for agricultural, industrial processes or transportation
5 Water storage & retention Storage and retention of water Storage of water by watersheds, reservoirs, and aquifers
6 Erosion control and sediment retention Retention of soil within an ecosystem Prevention of loss of soil by wind, runoff or other removal
processes. Storage of silt in lakes and wetlands
7 Soil formation Soil formation processes Weathering of rock and the accumulation of organic material
8 Nutrient cycling Storage, internal cycling, processing and acquisition of nutrients N, P and other elemental or nutrient cycles
9 Waste treatment Recovery of mobile nutrients and removal or breakdown of excess or xenic nutrients and compounds Waste treatment, pollution control, detoxifi cation
10 Pollination Movement of fl oral gametes Provisioning of pollinators for the reproduction of plant populations
11 Biological control Trophic-dynamic regulations of populations Keystone predator control of prey species, reduction of herbivory by top predators
12 Refugia Habitat for resident and transient populations Nurseries, habitat for migratory species, regional habitats for locally harvested species or overwintering grounds
13 Food production That portion of gross primary production extractable as food
Production of animals, fi sh, fruit and vegetables for human consumption
14 Raw materials That portion of gross primary production extractable as raw materials The production of timber, fi bres (e.g. wool) or fodder
15 Genetic resources Sources of unique biological materials and products Medicine, genes for resistance to plant pathogens and crop pests
16 Recreation Providing opportunities for recreational activities Eco-tourism, sport fi shing, and other outdoor recreational activities
17 Cultural Providing opportunities for non-commercial uses Aesthetic, artistic, educational, spiritual and/or scientifi c values of ecosystems
Source: Based on table 1 from Costanza et al. (1997) with renaming of some ecosystem services for clarity’s sake.
3.2 VALUE OF ECOSYSTEM SERVICES
500
transaction – e.g. the use of fi rewood obtained free-of-charge from forests.2. Regulating services value (RSV). This refers to the regulation of biophysical and ecological processes in the environment in order to provide life support and a suitable habitat for human existence. This includes services such as regulation of the climate, fl ood control, drought recovery, control of pest species and so forth.3. Cultural services value (CSV). This refers to how the ecosystem contributes to the maintenance of human health and well-being by providing services such as spiritual fulfi l-ment, aesthetics, education, scientifi c knowledge and cultural well-being.4. Supporting services value (SSV). This refers to the ecolog-ical and biophysical processes that support the provisioning and regulating services of ecosystems. This includes services such as nutrient cycling, soil formation, and provision of habitat.3
Note that:UV (gross) = PSV + RSV + CSV + SSV (2)UV (net) = PSV + RSV + CSV (3)
Although UV (gross) is frequently used in the literature to ‘add up’ ecosystem services values for an entire system, it is arguably incorrect to use this as a measure of the total value of ecosystem services (Haines-Young and Potschin 2009). This is because it involves ‘double counting’ of the supporting services value (SSV). In adding up values across the entire system, it is therefore recommended to use UV (net).
Passive value (PV) refers to the value not related to the actual use of ecosystems. It is therefore sometimes termed non-use value. Passive value can be decomposed into three component parts:1. Option value. This is the willingness to pay for the preservation of an ecosystem against some probability that an individual will make use of the ecosystem at a later date.2. Existence value. This is how much an individual is willing to pay to preserve an ecosystem, even though that individual may never intend to use that ecosystem. For example, an indi-vidual may wish to preserve tuatara on an offshore island of New Zealand, but have no intention or inclination of ever visiting such an island because of its isolation.3. Bequest value. This is the willingness to pay to preserve an ecosystem so that future generations can gain the benefi t from that ecosystem.
USE VALUE OF ECOSYSTEMS AND THEIR SERVICES Horticulture and cropping ecosystems
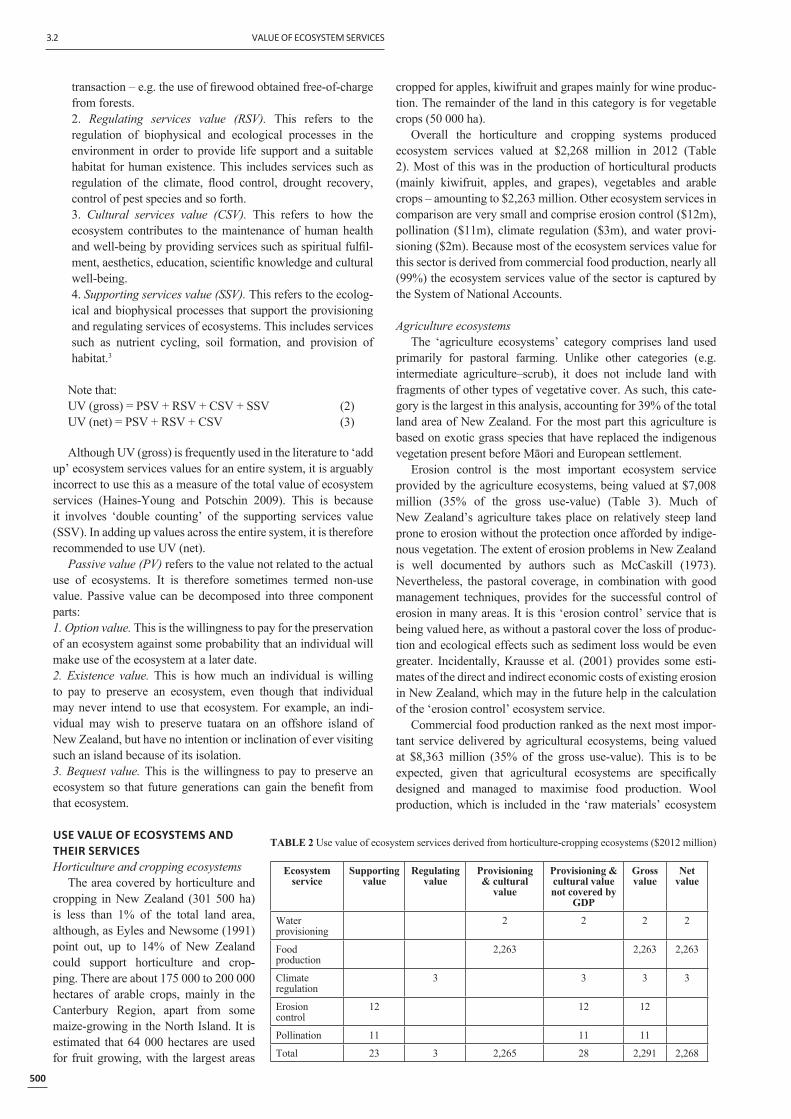
The area covered by horticulture and cropping in New Zealand (301 500 ha) is less than 1% of the total land area, although, as Eyles and Newsome (1991) point out, up to 14% of New Zealand could support horticulture and crop-ping. There are about 175 000 to 200 000 hectares of arable crops, mainly in the Canterbury Region, apart from some maize-growing in the North Island. It is estimated that 64 000 hectares are used for fruit growing, with the largest areas
TABLE 2 Use value of ecosystem services derived from horticulture-cropping ecosystems ($2012 million)
Ecosystem service
Supporting value
Regulating value
Provisioning & cultural
value
Provisioning & cultural value not covered by
GDP
Gross value
Net value
Water provisioning
2 2 2 2
Food production
2,263 2,263 2,263
Climate regulation
3 3 3 3
Erosion control
12 12 12
Pollination 11 11 11
Total 23 3 2,265 28 2,291 2,268
cropped for apples, kiwifruit and grapes mainly for wine produc-tion. The remainder of the land in this category is for vegetable crops (50 000 ha).
Overall the horticulture and cropping systems produced ecosystem services valued at $2,268 million in 2012 (Table 2). Most of this was in the production of horticultural products (mainly kiwifruit, apples, and grapes), vegetables and arable crops – amounting to $2,263 million. Other ecosystem services in comparison are very small and comprise erosion control ($12m), pollination ($11m), climate regulation ($3m), and water provi-sioning ($2m). Because most of the ecosystem services value for this sector is derived from commercial food production, nearly all (99%) the ecosystem services value of the sector is captured by the System of National Accounts.
Agriculture ecosystems The ‘agriculture ecosystems’ category comprises land used
primarily for pastoral farming. Unlike other categories (e.g. intermediate agriculture–scrub), it does not include land with fragments of other types of vegetative cover. As such, this cate-gory is the largest in this analysis, accounting for 39% of the total land area of New Zealand. For the most part this agriculture is based on exotic grass species that have replaced the indigenous vegetation present before Māori and European settlement.
Erosion control is the most important ecosystem service provided by the agriculture ecosystems, being valued at $7,008 million (35% of the gross use-value) (Table 3). Much of New Zealand’s agriculture takes place on relatively steep land prone to erosion without the protection once afforded by indige-nous vegetation. The extent of erosion problems in New Zealand is well documented by authors such as McCaskill (1973). Nevertheless, the pastoral coverage, in combination with good management techniques, provides for the successful control of erosion in many areas. It is this ‘erosion control’ service that is being valued here, as without a pastoral cover the loss of produc-tion and ecological effects such as sediment loss would be even greater. Incidentally, Krausse et al. (2001) provides some esti-mates of the direct and indirect economic costs of existing erosion in New Zealand, which may in the future help in the calculation of the ‘erosion control’ ecosystem service.
Commercial food production ranked as the next most impor-tant service delivered by agricultural ecosystems, being valued at $8,363 million (35% of the gross use-value). This is to be expected, given that agricultural ecosystems are specifi cally designed and managed to maximise food production. Wool production, which is included in the ‘raw materials’ ecosystem

501
VALUE OF ECOSYSTEM SERVICES 3.2
service, is also a signifi cant output of the commercial agricultural system, being valued at $514 million.
Waste treatment services are also very signifi cant being valued at $2,488 million (12% of the gross use-value). A wide range of xenic wastes, including animal excrement, agricultural chemi-cals, fertilisers, dairy shed wastes and suchlike, are processed by agricultural ecosystems. Open pastures, which dominate the New Zealand agricultural landscape, clearly have an enormous capacity for absorbing and transforming these waste products. Without the processing of such wastes there would be consid-erable ecological impact to waterways, toxifi cation of the soil environment, and so forth.
Notably the gross use-value of ecosystem services from the sector is relatively high at $20,172 million, but its net value is signifi cantly lower at $12,421 million – this is due to signifi cant ‘supporting services’ for the sector valued at $7,751 million, which represents the difference between the gross and the net values.
Intermediate agriculture–scrub ecosystems This category covers land that is more marginal for pastoral
farming than the land comprising the ‘agriculture’ ecosystem type.
TABLE 3 Use value of ecosystem services derived from agriculture ecosystems ($2012 million)
Ecosystem service
Supporting value
Regulating value
Provisioning & cultural value
Provisioning & cultural value not covered by GDP
Gross value
Net value
Water provisioning 85 68 85 85
Food production 8,363 8,363 8,363
Raw materials 514 514 514
Recreation 57 57 57 57
Cultural 57 57 57 57
Gas regulation 200 200 200 200
Waste treatment 2,488 2,488 2,488 2,488
Biological control 657 657 657 657
Soil formation 28 28 28 0
Erosion control 7,008 7,008 7,008 0
Pollination 715 715 715 0
Total 7,751 3,345 9,076 11,278 20,172 12,421
TABLE 4 Use value of ecosystem services derived from intermediate agriculture–scrub ecosystems ($2012 million)
Ecosystem service
Supporting value Regulating value
Provisioning & cultural value
Provisioning & cultural value not covered by GDP
Gross value
Net value
Water provisioning 42 34 42 42
Food production 857 857 857
Raw materials 171 171 171
Recreation 14 14 14 14
Cultural 28 28 28 28
Gas regulation 97 97 97 97
Waste treatment 1,213 1,213 1,213 1,213
Biological control 320 320 320 320
Soil formation 138 138 138 0
Nutrient cycling 1,007 1,007 1,007 0
Erosion control 404 404 404 0
Pollination 348 348 348 0
Total 1,897 1,630 1,112 3,603 4,639 2,742
In the intermediate agricul-ture–scrub category there is a signifi cant coverage of scrub and fern vegetation mixed with tracts of exotic grasses. The area covered by this type of ecosystem is just over 19% of the total land area of New Zealand.
Intermediate agricul-ture–scrub vegetation eco-systems comprise a total total area of 5 170 000 hectares and includes Newsome’s (1987) eight subdivisions: Grassland and Mixed Indigenous Scrub; Grassland and Lepto spermum Scrub or
Fern Grassland and Cassinia Scrub; Tussock Grassland and Sub-alpine Scrub; Grassland and Dracophyllum Scrub; Grassland and Gorse Scrub; Grassland and Matagouri; and Grassland with Sweet Brier or Sweet Brier and Matagouri.
The gross use-value of ecosystem services from the inter-mediate agriculture–scrub ecosystems is $4,639 million (Table 4). Food production valued at $857 million is an important provisioning service provided by these ecosystems, with other signifi cant provisioning services being raw materials (mainly wool), water provisioning and recreation. Again, however, the supporting ($1,897m) and regulating ($1,630m) services dom-inate. The benefi ts of waste treatment ($1,213m) are particularly signifi cant although the recycling of animal faeces is less important compared with prime pasture. Scrub vegetation plays an important part in slope stability and hence its importance in erosion control, which was valued at $404 million. Pollination ($348m), biolo-gical control ($320m) and soil formation ($138m) are ecosystem services that ensure the long-term integrity of these ecosystems and the individual species in them. The ‘recycling of nutrients’ is also an important ecological function of this type of ecosystem, which has a relatively high value of $1,007 million explained mainly by the vast tracts of land (19% of New Zealand’s land area) covered by this type of ecosystem.
Scrub ecosystems This category entirely
consists of native scrub vegetation, and unlike the three previous categories is not used for commercial agriculture, horticulture or cropping. It is neverthe-less a signifi cant land use at about 4% (1 104 000 ha) of the total land area of New Zealand. This ecosystem category cons-ists of scrub communities made up of mixed broad-leaved shrubs, mānuka, kānuka, bracken, ferns, subalpine scrub and gorse.
The most valuable
3.2 VALUE OF ECOSYSTEM SERVICES
502
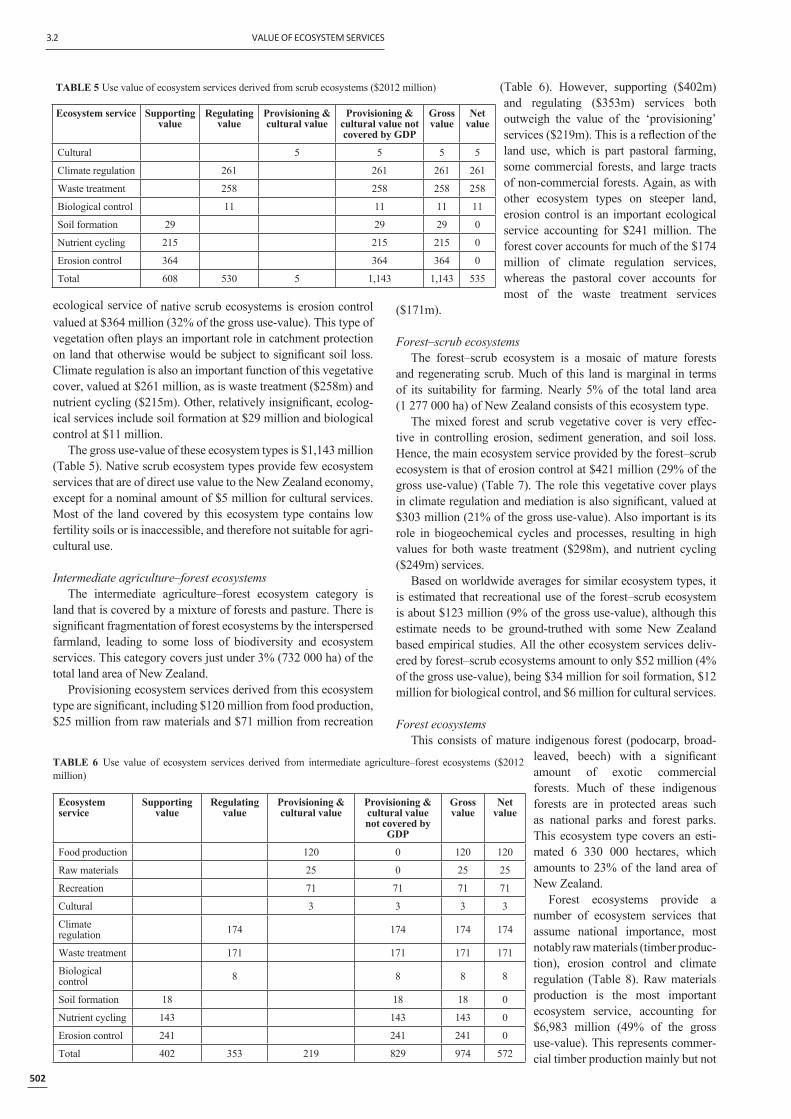
ecological service of native scrub ecosystems is erosion control valued at $364 million (32% of the gross use-value). This type of vegetation often plays an important role in catchment protection on land that otherwise would be subject to signifi cant soil loss. Climate regulation is also an important function of this vegetative cover, valued at $261 million, as is waste treatment ($258m) and nutrient cycling ($215m). Other, relatively insignifi cant, ecolog-ical services include soil formation at $29 million and biological control at $11 million.
The gross use-value of these ecosystem types is $1,143 million (Table 5). Native scrub ecosystem types provide few ecosystem services that are of direct use value to the New Zealand economy, except for a nominal amount of $5 million for cultural services. Most of the land covered by this ecosystem type contains low fertility soils or is inaccessible, and therefore not suitable for agri-cultural use.
Intermediate agriculture–forest ecosystems The intermediate agriculture–forest ecosystem category is
land that is covered by a mixture of forests and pasture. There is signifi cant fragmentation of forest ecosystems by the interspersed farmland, leading to some loss of biodiversity and ecosystem services. This category covers just under 3% (732 000 ha) of the total land area of New Zealand.
Provisioning ecosystem services derived from this ecosystem type are signifi cant, including $120 million from food production, $25 million from raw materials and $71 million from recreation
TABLE 5 Use value of ecosystem services derived from scrub ecosystems ($2012 million)
Ecosystem service Supporting value
Regulating value
Provisioning & cultural value
Provisioning & cultural value not covered by GDP
Gross value
Net value
Cultural 5 5 5 5
Climate regulation 261 261 261 261
Waste treatment 258 258 258 258
Biological control 11 11 11 11
Soil formation 29 29 29 0
Nutrient cycling 215 215 215 0
Erosion control 364 364 364 0
Total 608 530 5 1,143 1,143 535
(Table 6). However, supporting ($402m) and regulating ($353m) services both outweigh the value of the ‘provisioning’ services ($219m). This is a refl ection of the land use, which is part pastoral farming, some commercial forests, and large tracts of non-commercial forests. Again, as with other ecosystem types on steeper land, erosion control is an important ecological service accounting for $241 million. The forest cover accounts for much of the $174 million of climate regulation services, whereas the pastoral cover accounts for most of the waste treatment services
($171m).
Forest–scrub ecosystems The forest–scrub ecosystem is a mosaic of mature forests
and regenerating scrub. Much of this land is marginal in terms of its suitability for farming. Nearly 5% of the total land area (1 277 000 ha) of New Zealand consists of this ecosystem type.
The mixed forest and scrub vegetative cover is very effec-tive in controlling erosion, sediment generation, and soil loss. Hence, the main ecosystem service provided by the forest–scrub ecosystem is that of erosion control at $421 million (29% of the gross use-value) (Table 7). The role this vegetative cover plays in climate regulation and mediation is also signifi cant, valued at $303 million (21% of the gross use-value). Also important is its role in biogeochemical cycles and processes, resulting in high values for both waste treatment ($298m), and nutrient cycling ($249m) services.
Based on worldwide averages for similar ecosystem types, it is estimated that recreational use of the forest–scrub ecosystem is about $123 million (9% of the gross use-value), although this estimate needs to be ground-truthed with some New Zealand based empirical studies. All the other ecosystem services deliv-ered by forest–scrub ecosystems amount to only $52 million (4% of the gross use-value), being $34 million for soil formation, $12 million for biological control, and $6 million for cultural services.
Forest ecosystems This consists of mature indigenous forest (podocarp, broad-
leaved, beech) with a signifi cant amount of exotic commercial forests. Much of these indigenous forests are in protected areas such as national parks and forest parks. This ecosystem type covers an esti-mated 6 330 000 hectares, which amounts to 23% of the land area of New Zealand.
Forest ecosystems provide a number of ecosystem services that assume national importance, most notably raw materials (timber produc-tion), erosion control and climate regulation (Table 8). Raw materials production is the most important ecosystem service, accounting for $6,983 million (49% of the gross use-value). This represents commer-cial timber production mainly but not
TABLE 6 Use value of ecosystem services derived from intermediate agriculture–forest ecosystems ($2012 million)
Ecosystem service
Supporting value
Regulating value
Provisioning & cultural value
Provisioning & cultural value not covered by
GDP
Gross value
Net value
Food production 120 0 120 120
Raw materials 25 0 25 25
Recreation 71 71 71 71
Cultural 3 3 3 3
Climate regulation 174 174 174 174
Waste treatment 171 171 171 171
Biological control 8 8 8 8
Soil formation 18 18 18 0
Nutrient cycling 143 143 143 0
Erosion control 241 241 241 0
Total 402 353 219 829 974 572

503
VALUE OF ECOSYSTEM SERVICES 3.2
exclusively from exotics. Much of this timber production is from pines located in the central volcanic plateau in the North Island, although there are signifi cant plantings in areas such as Nelson, Gisborne, Hawke’s Bay, North Canterbury, and Southland.
Ranking second is erosion control, valued at $2,092 million (15% of the gross use-value). The indigenous forests in particular play a critical role in maintaining soils and preventing sediment loss on land that is often steep and unstable. There are numerous past examples of how clear felling of indigenous forests has led to a dramatic loss of soils (McCaskill 1973). Perhaps, Cyclone Bola is the best relatively recent example of an erosion event occur-ring on land once protected by indigenous forests. For just this one event, the economic cost of losing this ecosystem service of erosion control (through forest clearance) has been put at close to $200 million (Ministry for the Environment 1997).
Climate regulation is the third most important ecosystem service valued at $1,503 million (11% of the gross use-value). Forests play an important role in storing and regulating the fl ow of carbon. Studies such as those used by Costanza et al. (1997) have quantifi ed the cost of losing carbon storage capacity under various forms of forest degradation and related this to damages or current costs avoided.
Wetland ecosystems Wetlands cover 0.61% of the land area of New Zealand, but
they have been reduced by conversion to farmland and other changes over the last century, from about 700 000 hectares to 166 000 hectares. Wetlands are highly productive and dynamic
TABLE 7 Use value of ecosystem services derived from forest–scrub ecosystems ($2012 million)
Ecosystem service
Supporting value
Regulating value
Provisioning & cultural
value
Provisioning & cultural value not covered by
GDP
Gross value
Net value
Recreation 123 123 123 123
Cultural 6 6 6 6
Climate regulation 303 303 303 303
Waste treatment 298 298 298 298
Biological control 12 12 12 12
Soil formation 34 34 34 0
Nutrient cycling 249 249 249 0
Erosion control 421 421 421 0
Total 704 613 129 1,446 1,446 742
systems, producing a wide variety of ecosystem services.
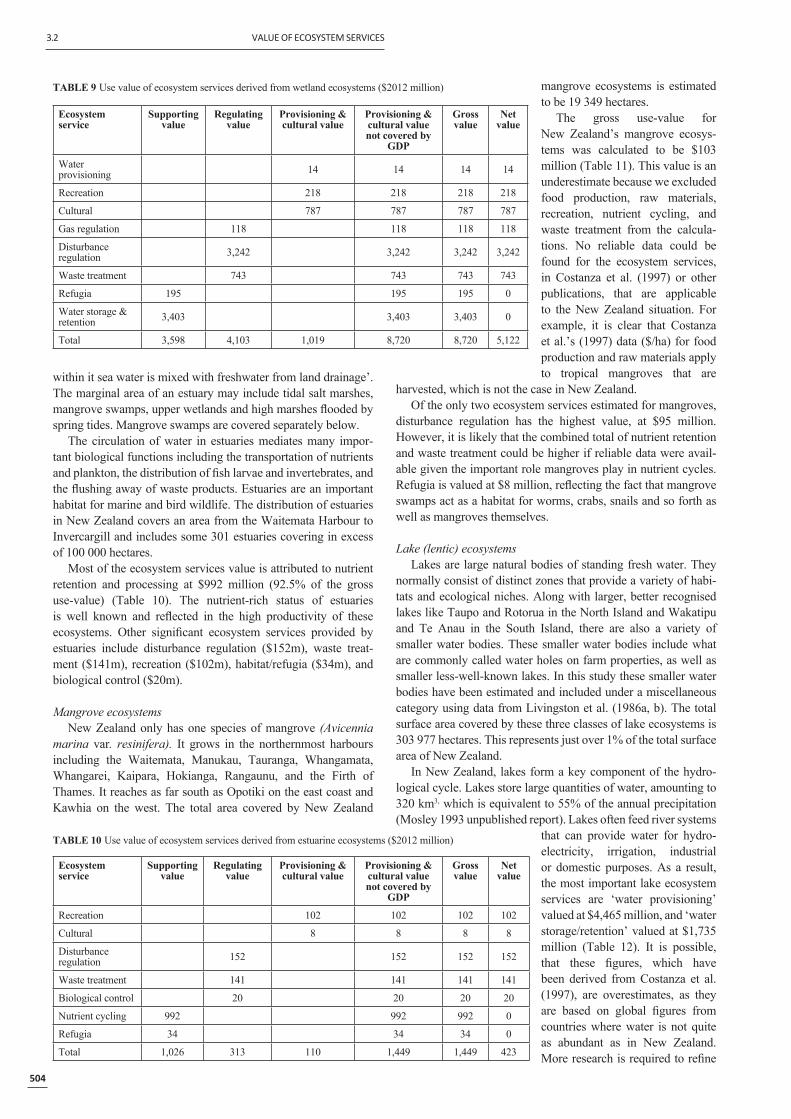
The gross use-value delivered by wetland ecosystems is estimated to be $8,720 million (Table 9). Even though wetlands cover only 0.61% of New Zealand, they generate an esti-mated 13.0% of the gross use-value derived from land-based ecosystems.
Water storage and retention is the most signifi cant ecosystem service provided by wetlands, valued at $3,403 million. This estimate is based on international data from Costanza et al. (1997), which estimated the direct and indirect costs incurred by
losing the water storage and retention function of wetlands. This fi gure may be an overestimate for the New Zealand situation, given our relatively abundant water supplies. Notwithstanding this reservation, there are no grounds on which to adjust these fi gures without further research.
Disturbance regulation is the next most important ecosystem service provided by wetlands, estimated at $3,242 million. This estimate includes storm protection, fl ood control, drought recovery and other aspects of habitat response to environmental variability. It is based on Costanza et al.’s (1997) study, which used data primarily from the United States and it is therefore diffi cult to know how precisely these costings ($/ha) relate to the New Zealand situation. Their fl ood control estimates, for example, are based on estimations of prevented damage or in some cases the costs of replacing this function of wetlands by artifi cial constructions. It is debatable how readily such values can be developed for New Zealand, even though we have reason-ably good data on fl ood damage from sources such as Ericksen et al. (1988).
The estimate for cultural services (aesthetic, education, scien-tifi c values) is also relatively high at $787 million, being based on overseas averages. Waste treatment, which is also signifi cant, valued at $743 million, refers to the processing of agricultural runoff, fertiliser and other wastes that fi nd their way into wetlands.
In general terms, valuation studies have consistently found wetlands to have a high non-market value when expressed on a $/ha basis. For example, studies such as those by Costanza et al. (1989) indicate that wetlands have non-market value in the range of $NZ45,000/ha to $NZ60,000/ha. Although there is little
doubt that this aggregate value is broadly applicable to New Zealand wetlands, it is not clear how to allocate this value to individual ecosystem services delivered by wetlands. Specifi c research is there-fore required to determine the value of individual ecosystem services for New Zealand wetlands on a $/ha basis.
Estuarine ecosystemsKnox (1980) defi nes an estuary in
the New Zealand context as ‘a semi enclosed coastal body of water with free circulation to the sea; it is thus strongly affected by tidal action and
TABLE 8 Use value of ecosystem services derived from forest ecosystems ($2012 million)
Ecosystem service
Supporting value
Regulating value
Provisioning & cultural value
Provisioning & cultural value not covered by
GDP
Gross value
Net value
Raw materials 6,983 6,983 6,983
Recreation 614 614 614 614
Cultural 34 34 34 34
Climate regulation 1,503 1,503 1,503 1,503
Waste treatment 1,486 1,486 1,486 1,486
Biological control 68 68 68 68
Soil formation 171 171 171 0
Nutrient cycling 1,233 1,233 1,233 0
Erosion control 2,092 2,092 2,092 0
Total 3,496 3,057 7,631 7,201 14,184 10,688
3.2 VALUE OF ECOSYSTEM SERVICES
504
TABLE 9 Use value of ecosystem services derived from wetland ecosystems ($2012 million)
Ecosystem service
Supporting value
Regulating value
Provisioning & cultural value
Provisioning & cultural value not covered by
GDP
Gross value
Net value
Water provisioning 14 14 14 14
Recreation 218 218 218 218
Cultural 787 787 787 787
Gas regulation 118 118 118 118
Disturbance regulation 3,242 3,242 3,242 3,242
Waste treatment 743 743 743 743
Refugia 195 195 195 0
Water storage & retention 3,403 3,403 3,403 0
Total 3,598 4,103 1,019 8,720 8,720 5,122
TABLE 10 Use value of ecosystem services derived from estuarine ecosystems ($2012 million)
Ecosystem service
Supporting value
Regulating value
Provisioning & cultural value
Provisioning & cultural value not covered by
GDP
Gross value
Net value
Recreation 102 102 102 102
Cultural 8 8 8 8
Disturbance regulation 152 152 152 152
Waste treatment 141 141 141 141
Biological control 20 20 20 20
Nutrient cycling 992 992 992 0
Refugia 34 34 34 0
Total 1,026 313 110 1,449 1,449 423
within it sea water is mixed with freshwater from land drainage’. The marginal area of an estuary may include tidal salt marshes, mangrove swamps, upper wetlands and high marshes fl ooded by spring tides. Mangrove swamps are covered separately below.
The circulation of water in estuaries mediates many impor-tant biological functions including the transportation of nutrients and plankton, the distribution of fi sh larvae and invertebrates, and the fl ushing away of waste products. Estuaries are an important habitat for marine and bird wildlife. The distribution of estuaries in New Zealand covers an area from the Waitemata Harbour to Invercargill and includes some 301 estuaries covering in excess of 100 000 hectares.
Most of the ecosystem services value is attributed to nutrient retention and processing at $992 million (92.5% of the gross use-value) (Table 10). The nutrient-rich status of estuaries is well known and refl ected in the high productivity of these ecosystems. Other signifi cant ecosystem services provided by estuaries include disturbance regulation ($152m), waste treat-ment ($141m), recreation ($102m), habitat/refugia ($34m), and biological control ($20m).
Mangrove ecosystemsNew Zealand only has one species of mangrove (Avicennia
marina var. resinifera). It grows in the northernmost harbours including the Waitemata, Manukau, Tauranga, Whangamata, Whangarei, Kaipara, Hokianga, Rangaunu, and the Firth of Thames. It reaches as far south as Opotiki on the east coast and Kawhia on the west. The total area covered by New Zealand
mangrove ecosystems is estimated to be 19 349 hectares.
The gross use-value for New Zealand’s mangrove ecosys-tems was calculated to be $103 million (Table 11). This value is an underestimate because we excluded food production, raw materials, recreation, nutrient cycling, and waste treatment from the calcula-tions. No reliable data could be found for the ecosystem services, in Costanza et al. (1997) or other publications, that are applicable to the New Zealand situation. For example, it is clear that Costanza et al.’s (1997) data ($/ha) for food production and raw materials apply to tropical mangroves that are
harvested, which is not the case in New Zealand.Of the only two ecosystem services estimated for mangroves,
disturbance regulation has the highest value, at $95 million. However, it is likely that the combined total of nutrient retention and waste treatment could be higher if reliable data were avail-able given the important role mangroves play in nutrient cycles. Refugia is valued at $8 million, refl ecting the fact that mangrove swamps act as a habitat for worms, crabs, snails and so forth as well as mangroves themselves.
Lake (lentic) ecosystemsLakes are large natural bodies of standing fresh water. They
normally consist of distinct zones that provide a variety of habi-tats and ecological niches. Along with larger, better recognised lakes like Taupo and Rotorua in the North Island and Wakatipu and Te Anau in the South Island, there are also a variety of smaller water bodies. These smaller water bodies include what are commonly called water holes on farm properties, as well as smaller less-well-known lakes. In this study these smaller water bodies have been estimated and included under a miscellaneous category using data from Livingston et al. (1986a, b). The total surface area covered by these three classes of lake ecosystems is 303 977 hectares. This represents just over 1% of the total surface area of New Zealand.
In New Zealand, lakes form a key component of the hydro-logical cycle. Lakes store large quantities of water, amounting to 320 km3, which is equivalent to 55% of the annual precipitation (Mosley 1993 unpublished report). Lakes often feed river systems
that can provide water for hydro-electricity, irrigation, industrial or domestic purposes. As a result, the most important lake ecosystem services are ‘water provisioning’ valued at $4,465 million, and ‘water storage/retention’ valued at $1,735 million (Table 12). It is possible, that these fi gures, which have been derived from Costanza et al. (1997), are overestimates, as they are based on global fi gures from countries where water is not quite as abundant as in New Zealand. More research is required to refi ne

505
VALUE OF ECOSYSTEM SERVICES 3.2
TABLE 11 Use value of ecosystem services derived from mangrove ecosystems ($2012 million)
Ecosystem service
Supporting value
Regulating value
Provisioning & cultural value
Provisioning & cultural value not covered by
GDP
Gross value
Net value
Disturbance regulation
95 95 95
Refugia 8 8 8
Total 0 103 0 0 103 103
these preliminary estimates for the New Zealand situation.Lakes also play an important role in the waste treatment of
animal wastes and fertiliser runoff resulting from pastoral agri-culture. Often this capacity of lakes to process such water is exceeded. Accordingly it has been estimated by the Ministry for the Environment (1997) that between 10% and 40% of New Zealand’s more than 700 smaller lakes are eutrophic. The value of this waste treatment ecosystem service is estimated to be $544 million.
Lakes are also valuable as a source of recreation and tourism-based activities. For example, Lakes Taupo and Rotorua in the North Island and Lakes Te Anau, Wakatipu and Wanaka in the South Island are major tourism attractions. It is diffi cult to precisely value the use of these lakes for tourism and recreation, as they are often associated with other tourism attractions such as national parks and geothermal areas. Nevertheless, the value of this recreation ecosystem service is estimated to be $188 million.
Lakes also provide refugia/habitat for a number of species. This is acknowledged as an important ecosystem service of lakes, but it was not included in the calculations as there were no reli-able data available to make an estimate of this value.
TABLE 12 Use value of ecosystem services derived from lake ecosystems ($2012 million)
Ecosystem service
Supporting value
Regulating value
Provisioning & cultural value
Provisioning & cultural value not covered by
GDP
Gross value
Net value
Water provisioning 4,465 3,571 4,465 4,465
Food production 19 8 19 19
Recreation 188 188 188 188
Waste treatment 544 544 544 544
Water storage & retention 1,735 1,735 1,735 0
Total 1,735 544 4,672 6,046 6,951 5,216
River (lotic) ecosystemsRivers refer to a natural fl ow of
fresh water along a defi nite course, usually into the sea. The different biophysical conditions in a river ecosystem provide a wide variety of habitats from the headwaters to the river mouth.
The New Zealand river ecosys-tems included in this study are all fi rst-order rivers as classifi ed by the Department of Statistics (1996). The fi gures given by the department are in kilometres and have been converted to hectares by assuming that all fi rst-order rivers have a mean width of 500 metres. This gives a total fi rst-order-river area estimate of 225 750 hectares.
Water provisioning to various commercial and non-commercial end-users is the most valuable ecosystem service provided by rivers, valued at $3,316 million
(Table 13). This includes the provision of water for hydroelec-tricity generation, irrigation particularly in the South Island, industrial use, commercial use, and for use by households. ‘Water storage and retention’ is valued at an additional $1,289 million. It is estimated by Mosley (1993 unpublished) that the average storage of water in rivers is 415 km3. This is more than the storage capacity of lakes at only 320 km3.
Rivers also provide waste treatment services, valued at $404 million. Agricultural runoff, industrial discharges, urban stormwater as well as sewage are processed by New Zealand’s rivers. The limits to this processing are often achieved in the lower reaches of river catchments, where the discharges exceed the absorption capacity of the river and hence lead to localised pollution.
Recreation and tourism activities are valued at $140 million, although this is diffi cult to measure with any precision due to the lack of data.
Rivers do provide refugia/habitat for a number of species. This is acknowledged as an important ecosystem service of rivers, but it was not included in the calculations as there were no reliable data available to make an estimate of this value.
Total use value of land ecosystemsThe total use value of New Zealand’s land-based ecosystem
services was estimated to be $67 billion when measured in gross terms. Of this total, supporting services accounted for $22 billion, regulating services for $15 billion, provisioning services for $30 billion and cultural services for $900 million.
Once double counting had been accounted for (i.e. not counting ‘supporting services’ twice), the ‘net use-value’ of New Zealand’s land-based ecosystem services was estimated to be $45 billion. Just over half (53%, $24 billion) of this
TABLE 13 Use value of ecosystem services derived from river ecosystems ($2012 million)
Ecosystem service
Supporting value
Regulating value
Provisioning & cultural value
Provisioning & cultural value not covered by
GDP
Gross value
Net value
Water provisioning 3,316 2,653 3,316 3,316
Food production 15 6 15 15
Recreation 140 140 140 140
Waste treatment 404 404 404 404
Water storage & retention 1,289 1,289 1,289 0
Total 1,289 404 3,471 4,492 5,164 3,875

3.2 VALUE OF ECOSYSTEM SERVICES
506
net use-value is not currently measured by the GDP indicator or included in the System of National Accounts.
It is recommended that in referring to the total value of land-based ecosystem services in New Zealand that the ‘net value’ be used, as the ‘gross value’, although useful in some circumstances, can be misleading.
PASSIVE VALUE OF LAND BASED ECOSYSTEMS Passive value was estimated for various heritage ecosystems
that are ascribed special status by New Zealand legislation: national parks (30 809 km2), forest parks (30 200 km2) and land reserves (6145 km2). Other ecosystems that have signifi cant passive values associated with them, but which are not accorded the same legal status, were also covered in the analysis: wetlands (1660 km2), estuarine ecosystems (1000 km2), mangrove ecosys-tems (193 km2), lake ecosystems (3039 km2), and river ecosystems (2257 km2). The approach simply estimated the indicative passive value of those areas that are known to have signifi cant passive values associated with them. We also estimated the passive value of some of the ‘standard ecosystems’: wetlands, estuaries, mangroves, lakes and rivers.
The data summarised by table 4.1 in Patterson and Cole (1999a) were used to estimate the passive value of New Zealand’s heritage ecosystems and some standard ecosystems. Although passive (non-use) value should include option, existence, and bequest values, limitations in the data meant that usually only existence value could be calculated. Readers should refer to Patterson and Cole (1999a) for the full methodological details of how these estimates were calculated. These estimates should be treated as preliminary and indicative because of:• problems in extrapolating the data from overseas studies to
New Zealand. Many of these passive values are culture, time and place specifi c, and it is not known to what extent these factors introduce errors when extrapolating from overseas studies
• problems in aggregating data measured on a personal basis ($/person) to a population ($) basis
• problems in aggregating passive values across different heritage ecosystems. Mitchell and Carson (1989), for example, have shown that there are diminishing marginal values when aggregating across many cross-sectional cases
• the limited scope of data we used. Usually our base data (table 4.1 in Paterson and Cole 1999a) only covered existence value, with very limited coverage of option and bequest value.
National parksThe National Parks Act 1980 made provision for the establish-
ment of national parks and reserves in areas of distinctive scenic quality or ecological interest. The Act provided legal recogni-tion for the protection of landscape ecosystems, the integrity and existence of which are considered to be in the national interest. The Act also states that these areas are to be maintained in their natural state so that their value as soil, water, and forest conserva-tion areas is maintained.
The national parks in New Zealand comprise the following: Tongariro (79 598 ha), Urewera (212 675 ha), Egmont (33 543 ha), Whanganui (74 231 ha), Kahurangi National Park (452 000 ha), Abel Tasman (22 530 ha), Nelson Lakes (101 753 ha), Paparoa (30 560 ha), Arthur’s Pass (114 547 ha), Westland (117 547 ha), Aoraki-Mount Cook (70 728 ha), Mount Aspiring (355 531 ha), Fiordland (1 251 924 ha), and Rakiura (163 000 ha).
On the basis that national parks are of national importance, it is also assumed that the appropriate catchment population is the New Zealand adult population. It could be argued that this ‘national’ recognition in some cases translates into an ‘inter-national’ recognition in view of the World Heritage status of Tongariro, Aoraki/Mount Cook, Fiordland, Mount Aspiring, and Westland national parks.
It is estimated that the passive value of national parks is $7,164 million (Table 14). This estimate is based on 10 overseas studies that found the average passive value (mainly existence) associ-ated with national parks to be $169/person/year (see Patterson and Cole (1999a) for full details). This fi gure of $169/person/year, although based on overseas analysis, seems to capture similar passive values to those known to exist for New Zealand national parks. Existence and bequest value seem to be implicit in the purpose of setting up national parks. The National Parks Act 1980 seeks to protect areas in perpetuity that contain distinc-tive scenery, ecological systems, or natural features so beautiful, unique or scientifi cally important that their preservation is in the national interest. Option value is also important as it is clear that
many people wish to preserve national parks although they might only personally visit them a few times in their lifetime.
Forest parksThe main reason for the
establishment of forest parks was to protect catchments of forested mountain ranges. In more recent times these parks have become the centre of outdoors recreational inter-ests. New Zealand forest parks were initially administered by the Forest Service. When the Forest Service was disbanded in the late 1980s the admin-istration of forest parks was handed over to the Department
TABLE 14 Estimation of the passive value of New Zealand land-based ecosystems
Ecosystem type / heritage area
Number Assumed catchment population1
Passive value per person (NZ$2012)2
Passive value ($NZ2012 millions)
Passive value per hectare ($NZ2012/
ha)
National parks 12 3,540,800 (N) 169 7,1643 2,9284
Forest parks 20 300,000 (R) 124 7433 2464
Land reserves 1270 5,000 (C) 192 1,2183 1,9824
Peatlands/wetlands 59 10,000 (L) 593 3503 1,1824
Estuarine 301 ? ? 2115 2,1066
Mangrove 766 ? ? 415 2,1066
Lakes 34 300,000 (R) 87 8853 2,9134
Rivers 21 300,000 (R) 228 1,4343 6,3514
1 Assumed catchment populations: N = national, R = regional, L = local, C = community average value for comparable overseas ecosystems/heritage areas [refer to table 4.1 From Patterson and Cole (1999a)]2 Passive value per person3 Total passive value = number × assumed catchment population × passive value per person4 Total passive value per hectare = total passive value / area in hectares5 Total passive value = total passive value per hectare × area in hectares6 $/ha assumed same as Peatlands/wetlands

507
VALUE OF ECOSYSTEM SERVICES 3.2
of Conservation. There are now in total 20 forest parks, covering an area of 2 404 998 hectares. The Department of Conservation administers these forest parks, whose primary purpose, in most cases, is to protect the catchments of forested mountain ranges throughout the country. They provide a less restricted range of recreational activities than national parks and reserves, including tramping, camping, fi shing, and shooting for a variety of game.
It is estimated that the passive value of forest parks is $743 million. This fi gure is calculated assuming that each of the 20 forest parks has a catchment of 300 000 hectares and each person within the catchment ascribes $124/year passive value to main-taining the park. The $124/person/year is based on data from Bishop and Boyle (1985), Boyle and Bishop (1987) and Majid et al. (1983) for similar parks in the United States and Australia.
As would be expected, the passive value both per hectare and per person for forest parks is considerably lower than that for national parks. This is not surprising as forest parks generally do not have the same level of unique biodiversity, outstanding land-scapes and/or cultural features as do the more prestigious national parks.
Land reservesLand reserves include a variety of land holdings under various
conservation and open space covenants. New Zealand has more than 1200 scenic reserves totalling in excess of 300 000 hectares. A further 10 300 hectares is vested in scientifi c reserves, 3200 hectares in historic reserves and 18 500 hectares in wildlife reserves. The Department of Conservation also administers a variety of recreational areas including camping grounds and public domains.
It is estimated that the passive value of these land reserves is $1,218 million. In these calculations, it is assumed that in general terms the 1270 land reserves have a community-level catchment population.
The passive value derived from these land reserves primarily relates to conservation, scientifi c and cultural values, as well as option value for reserves that have potential recreational value. Perhaps they could, in some circumstances, have value to individ-uals beyond the community-level catchment population assumed in these calculations.
Wetland ecosystemsIt is estimated that the passive value of New Zealand’s peat-
land/wetland ecosystems is $350 million, based on studies by Hoehn and Loomus (1993) and Whitehead and Blomquist (1991) for US wetlands. This translates into a value of $2,106/ha for the passive value, which is similar to the $2,928/ha for the passive value of national parks.
Wetlands are becoming increasingly recognised by the New Zealand public for their signifi cant passive value, as well as their role in providing ecosystem services such as absorbing fl oodwaters and fi ltering wastewater. This passive value seems to relate mainly to the habitat wetlands provide for indigenous species including rushes, sedges, reeds, fl ax, water birds, eels and freshwater fi sh, as well as landscape and aesthetic values.
Estuarine and mangrove ecosystemsIt proved diffi cult to derive a reliable estimate of the passive
value of estuaries and mangrove ecosystems, due to the unavail-ability of overseas data. The approach therefore adopted in this study was to use $2,106/ha as the appropriate multiplier, which is the fi gure for the passive value for wetlands. It was thereby
assumed that estuaries and mangroves have similar passive values to wetlands.
On this basis, the passive value of estuaries was calculated to be $211 million. This passive value is mainly associated with preserving the rich diversity of species that exist in estua-rine ecosystems, including pipis, cockles, worms, and various echinoderms.
The passive value of mangrove ecosystems was calculated to be $41 million. Although the mangrove ecosystem is low in species diversity it is well recognised as having important passive value due to its uniqueness in the New Zealand landscape, being confi ned to only a few localities.
Lake and river ecosystemsRivers were estimated to have a passive value of $1,434
million. This estimate was based on a value of $228 per person, which was the mean value of the literature case studies. One of these case studies was undertaken in the early 1980s by Harris (1984) for water quality in the Waikato River. It is diffi cult in our calculations to make full use of Harris’ (1984) WTP estimate of $16 per person for the ‘intangible’ aspects of health, recreation, aesthetic, and conservation values. First, it only covered the water quality features of the Waikato River ecosystem, and second, it covered a mixture of use and non-use (passive) values that cannot be separated.
Rivers nevertheless have signifi cant passive values associ-ated with them in addition to the well-known use values, as they form an important part of both the Pakeha and particularly Māori cultural heritage. The debates on the minimum fl ow of rivers such as the Whanganui and the call for the preservation of many wild and scenic rivers attest to this. Option value is also probably important in the New Zealand context, as rivers provide a signifi -cant potential venue for various recreational uses.
Lake ecosystems were estimated to have a passive value of $885 million on the basis of four overseas studies (table 4.1 in Paterson and Cole 1999a). Lakes have high scenic value and are very important in terms of New Zealand’s national identity. The public campaigns to protect Lakes Manapouri and Te Anau from hydroelectric development provided early evidence of these values in the late 1960s.
An amendment to the Water and Soil Conservation Act 1967 establishing water conservation orders, carried through to the Resource Management Act 1991, underlies the importance that New Zealanders place on the non-use (passive) values associated with lakes and rivers. Accordingly, to qualify for a water conser-vation order, a lake or river must have outstanding amenity or intrinsic values.
TOTAL FLOW4 VALUE OF LAND BASED ECOSYSTEMS AND THEIR SERVICES
The total (use plus passive) value of New Zealand’s land-based ecosystem services (Table 15) can be calculated by summing the data for standard and heritage ecosystems from the sections on use value and passive value of New Zealand’s land-based ecosys-tems and their services, above.
Overall estimatesThe net total (use and passive) value of New Zealand’s land-
based ecosystem and their services is estimated to be $56,7475 million for 2012 (Table 15). Of this total the highest value is for provisioning services at $29,705 million of which $20,896 million is already measured by GDP and the System of National

3.2 VALUE OF ECOSYSTEM SERVICES
508
TABLE15 Total economic value of New Zealand’s land-based ecosystems
Ecosystem type Use value Passive value Gross value1 Net value2
Supporting value
Regulating value
Provisioning & cultural value
Total
Standard ecosystems
Horticulture & cropping 23 3 2,265 2,291 Note 3 2,291 2,268
Agriculture 7,751 3,345 9,075 20,171 Note 3 20,171 12,420
Intermediate agric–scrub 1,897 1,630 1,112 4,639 Note 3 4,639 2,742
Scrub 609 531 5 1,144 Note 3 1,144 535
Intermediate agric–forest 402 352 218 973 Note 3 973 571
Forest–scrub 704 614 129 1,447 Note 3 1,447 743
Forest 3,495 3,056 7,631 14,182 Note 4 14,182 10,687
Wetlands 3,599 4,103 1,020 8,722 350 9,072 5,473
Estuaries 1,026 314 109 1,449 211 1,659 634
Mangroves 0 103 0 103 41 144 144
Lakes 1,735 544 4,671 6,950 885 7,836 6,101
Rivers 1,289 404 3,470 5,164 1,434 6,597 5,309
Heritage ecosystems
National parks Note 5 Note 5 Note 5 Note 5 7,164 7,164 7,164
Forest parks Note 5 Note 5 Note 5 Note 5 743 743 743
Land reserves Note 5 Note 5 Note 5 Note 5 1,218 1,218 1,218
Total 22,530 15,000 29,705 67,235 12,045 79,280 56,7491 Gross value = use value + passive value2 Net value = use value + passive value − supporting value3 The passive value of these standard ecosystems could not be estimated due to the lack of data. It is probably small compared with the passive value of the heritage ecosystems.4 The passive value of signifi cant tracts of the forest ecosystem is measured under the heritage ecosystems. It is not recorded here because it would amount to double counting. Nevertheless it should be noted that there may be additional passive value derived from forests that are not national parks, forest parks or land reserves.5 Use value of heritage ecosystems has already been recorded under the standard ecosystem types. It is not recorded here (i) to avoid double counting, and in any case (ii) it proved too diffi cult to allocate this use value of standard ecosystems to the appropriate heritage ecosystem.
Accounts. The second highest total is for supporting services at $22,530 million, although as noted by endnote 5, this amount has not been factored into the ‘net total’ in order to avoid double counting. The third and fourth highest components are regu-lating services at $15,000 million and passive (non-use) values at $12,045 million.
The ecosystem that produces the highest net total value of ecosystem services is the ‘agriculture’ ecosystem, accounting for $12,420 million. Furthermore, the agriculture ecosystem contrib-utes another $7,751 million of supporting services that are not accounted for in the net total. This is not surprising since the agri-culture ecosystem covers 39% of New Zealand’s land surface. The main two services provided by agricultural ecosystems are food production ($8,363m) and erosion control ($7,008).
Forests rank next in providing $10,687 million (net total value) ecosystems services and more if the passive values are taken into account. The main ecosystem services provided are raw material production, erosion control, nutrient cycling, and climate regulation.
National parks rank next with a net total value of $7,164 million, which is made up entirely of non-use or passive values. Due to lack of data, no account has been taken of use values in national parks; however, there has been a good attempt (McAlpine and Wootten 2009) to identify and describe ecosystem services in national parks that have use value, but unfortunately these ecosystem services were not monetised and therefore cannot be directly included in our analysis. Notwithstanding, it should be
noted that these use values for ecosystem services in national parks have been accounted for in our ‘forest’ ‘standard ecosys-tems’ layer, but the portion of these attributed to national parks is not known.
Next in terms of net total value are lakes at $6,101 million, wetlands at $5,473 million and then rivers at $5,309 million. Of particular note are wetlands, which, despite having a net total value similar to those of lakes and rivers, only cover a very small portion (0.60%) of New Zealand’s land surface. This is because wetlands have a very high ecosystem services delivery per hectare, at $54,650/ha (gross), playing a particularly important role in disturbance regulation, water supply and waste treatment.
All other land-based ecosystems are signifi cantly lower in terms of their ecosystem service delivery, with a considerable drop to the next most valuable ecosystem of horticulture and cropping with a net total value of $2,268 million.
Total land-based ecosystem values in relation to the System of National Accounts
Most of the value derived from New Zealand’s land-based ecosystem services is not measured by the System of National Accounts and the GDP indicator. For example, in 2012 the New Zealand GDP was $208 billion, with only $20 billion of land-based ecosystem services being incorporated into the indicator, mainly in the form of commercial food and fi bre production. The following values for land-based ecosystems were not accounted by the national accounts or the GDP indicator:

509
VALUE OF ECOSYSTEM SERVICES 3.2
• Provisioning services ($10b)• Cultural services ($927m)• Regulating services ($15b)• Support services ($22b)• Passive value ($12b)
Aggregating these amounts (excluding support services to avoid double counting), the total net value not taken account of by the GDP indicator is $36 billion. This amounts to 17% of the GDP in 2012.
DISCUSSIONThis analysis updates and refi nes an earlier study undertaken
by Cole and Patterson (1997) and Patterson and Cole (1999a). Like the original study, its aim is to estimate the total value of ecological services and passive value annually derived from New Zealand’s land-based ecosystems. The main improvement in the method is to recognise the distinction between ‘supporting’, ‘regulating’, ‘provisioning’ and ‘cultural’ ecosystem services, based on the Millennium Ecosystem Assessment framework (2005). In the original study (Patterson and Cole 1999a) we used the distinction between ‘direct’ and ‘indirect’ ecosystem services, which unfortunately confl ated regulating and supporting ecosystem services into the indirect category.
An important consequence of separating out supporting ecosystem services was to remove the risk of double counting supporting ecosystem services when aggregating across all services. Costanza et al. (1997) in their landmark study did double count services by including supporting services in their aggregation process, and this has drawn criticism from a number of quarters (Fisher et al. 2008; Haines-Young and Potschin 2009). It is interesting that Costanza (2008) now also recognises this problem, stating: ‘It is true that for the purposes of certain aggre-gation exercises adding intermediate and fi nal services would be double counting.’
By removing double counting it is shown that, for 2012, land-based ecosystems produced $57 billion of ecosystem services, which put into context is about 27% of New Zealand’s GDP for that year. This aggregate value can be split into individual values for ecosystems (15 types) and ecosystem services (17 types). These estimates are necessarily only indicative. The justifi cation for this approach is that at the very least it makes visible, and tangible, value that hitherto has remained ‘hidden’ to decision-makers. Nevertheless, there are many data, methodological and theoretical issues that arise from this study, some of which may be resolvable and some of which are of a more intractable nature.
First, there is a severe lack of New Zealand data for the supporting services, regulating services and passive values, although provisioning services data can be for the most part uplifted from standard economic censuses and accounts. In particular, for the supporting and regulating services derived, we had to mostly rely on Costanza et al.’s (1997) data and adjust their fi gures for the New Zealand situation, although more recent studies by Dominati et al. (2010), Golubiewski (2012), Sandhu et al. (2010) and others meant we were not quite so reliant on the Costanza et al. (1997) data as we were in 1997.
Second, there is a whole host of problems involved in trans-lating world data to the New Zealand context. Assumptions are unavoidable and they are not always that well justifi ed. Unfortunately, this seems to be the only practical approach at this time, given the likelihood of primary data not being forthcoming. Particularly, with passive value it is diffi cult to cross-match
overseas data validly, e.g. we used data for US national parks and applied it to New Zealand national parks. The values and aspi-rations of New Zealanders with respect to national parks might be quite different to those of Americans, and hence there may be quite divergent existence, bequest, and option values for both populations.
Third, in estimating the passive values, we needed to make some critical assumptions about the catchment populations for various heritage areas and other ecosystem types. For example, we assumed that the entire New Zealand population had exist-ence, bequest, and option values with respect to national parks, but only regional populations had these values for forest parks. These assumptions need to be tested by further research, perhaps by using selective case studies to assess the criticality of these assumptions.
Fourth, when answering contingent valuation surveys, respondents typically value environmental goods as some dimin-ishing marginal increment of existing environmental goods. Unfortunately, most of the environmental goods in this study were valued as if they existed in a single isolated market (partial equilibrium approach). Hence, this could lead to a signifi cant overestimation of the total value of ecosystem services, which is based on aggregating environmental goods that were valued on a single-market basis.
Fifth, most ecosystem services, although they can be substituted for or replaced at the margins, are ultimately non-substitutable. That is, a minimum level of service is needed for human survival, which means that the demand curve trends to infi nity at low quantities. This results in consumer surplus being unbounded (infi nite). Hence any value actually used for the consumer surplus is by defi nition less than infi nity and therefore the consumer surplus is underestimated. In general, this means the neoclassical valuation approach will always underestimate the total value of ecosystem services.
Finally, a number of theoretical and philosophical issues arising from the use of neoclassical valuation analysis need to be addressed. Elsewhere, Patterson (1998) criticises the neoclassical approach for its reliance on ‘subjective preference’ by human valuers. Subjective preference may overlook critical species and ecological processes, as it is dependent on the knowledge and perception of the valuing agent (humans). Neoclassical valu-ation is by defi nition anthropocentric, which can easily lead to intrinsic value and contributory value being overlooked or under-estimated. Biophysical and energy valuation methods, derived by Odum (1996) and Patterson (1998), are arguably superior at estimating the intrinsic value and the contributory value of ecosystem processes. Furthermore, the neoclassical valuation techniques are necessarily from the viewpoint of today’s genera-tion, which can be a critical limitation when you are dealing with ecological processes that may be subject to irreversible change across generations.
REFERENCESBishop RC, Boyle KJ 1985. The economic value of Illinois Beach State Nature
Preserve. Madison, WI, HBRS.Blamey R, Common M 1994. Sustainability and the limits to pseudo market
valuation. In: van den Bergh JCJM, van der Straaten J eds Toward sustain-able development – concepts, methods and policy. Washington, DC, Island Press. Pp. 165–205.
Boyle KJ, Bishop RC 1987. Valuing wildlife in benefi t–cost analysis: a case study involving endangered species. Water Resources Research 23: 943–950.
Chrystall C, Patterson MG, Cole AO, Golubiewski N 2012. The economic value of ecosystem services and Ngati Raukawa Ki Te Tonga. Research

3.2 VALUE OF ECOSYSTEM SERVICES
510
Monograph Series Report No. 6. Palmerston North, Massey University and Landcare Research.
Cole AO, Patterson MG 1997. The economic value of New Zealand’s biodi-versity. Unpublished report to the Ministry for the Environment and Department of Conservation, Wellington.
Costanza R 1991. Energy, uncertainty and ecological economics. In: Ecological Physical Chemistry: Proceeding of an International Workshop, 8–12 November 1990, Siena, Italy. Amsterdam, Elsevier. Pp. 203–227.
Costanza R 2008. Ecosystem services: multiple classifi cation systems are needed. Biological Conservation 141: 350–352.
Costanza R, Farber SC, Maxwell J 1989. Valuation and management of wetland ecosystems. Ecological Economics 1: 335–361
Costanza R, d’Arge R, de Groot R, Farber S, Grasso M, Hannon B, Limburg K, Naeem S, O’Neill RV, Paruelo J, Raskin RG, Sutton P, van den Belt M 1997. The value of the world’s ecosystem service and natural capital. Nature 387: 253–260.
Daily G 1997. Nature’s services: societal dependence on natural ecosystems. Washington, DC, Island Press.
Daly HE, Cobb JB 1994. For the common good: redirecting the economy toward community, the environment and a sustainable future. Boston, Beacon Press.
de Groot RS 1987. Environmental functions as a unifying concept for ecology and economics. Environmentalist 7: 105–109.
de Groot RS 1992. Functions of nature: evaluation of nature in envi-ronmental planning, management and decision making. Groningen, Wolters-Noordhoff.
Department of Statistics 1996. New Zealand Offi cial Yearbook 1966. Wellington, Department of Statistics.
Dominati E, Patterson M, Mackay A 2010. A framework for classifying and quantifying the natural capital and ecosystem services of soils. Ecological Economics 69: 1858–1868.
Ericksen NJ, Handmer JW, Smith DJ 1988. ANUFLOOD: Evaluation of a computerised urban fl ood-loss assessment policy for New Zealand. Wellington, National Water and Soil Conservation Authority, Ministry of Works and Development.
Eyles GO, Newsome PF 1991. A soil conservation approach to sustainable land use. In: Henriques PR ed. Proceedings of the International Conference on Sustainable Land Management. Napier, Hawke’s Bay Regional Council. Pp. 216–220.
Faucheux S, O’Connor M 1998. Valuation for sustainable development: methods and policy indicators. Cheltenham, UK, Edward Elgar.
Fisher B, Turner K, Zylstra M, Brouwer, R, de Groot R, Farber S, Ferraro P, Green R, Hadley D, Harlow J, Jefferiss P, Kirkby C, Morling P, Mowatt S, Naidoo R, Paavola J, Strassburg B, Yu D, Balmford A 2008. Ecosystem services and economic theory: integration for policy-relevant research. Ecological Applications 18: 2050–2067.
Golubiewski, N 2012. Ecosystem service inventory of the natural and managed landscapes within the greater Ngati Raukawa Ki Te Tonga. Research Monograph Series Report No. 7. Palmerston North, Massey University and Landcare Research.
Goodstein E 1995. Economics and the environment. Englewood Cliffs, NJ, Prentice Hall.
Haines-Young R, Potschin M 2009. Methodologies for defi ning and assessing ecosystem services. CEM Report No. 14. Nottingham, UK, Centre for Environmental Management, University of Nottingham.
Hamilton C, Saddler H 1997. The genuine progress indicator: a new index of changes in well-being in Australia. Lynehom, ACT, Australia Institute.
Harris BS 1984. Contingent valuation of water pollution control. Journal of Environmental Management 19: 199–208.
Hoehn JP, Loomis JB 1993. Substitution effects in the valuation of multiple environmental programs. Journal of Environmental Economics and Management 25: 56–75.
Knox GA 1980. The estuarine zone. Soil and Water 16: 13–17.Krausse M, Eastwood C, Alexander RR 2001. Muddied waters: estimating the
national economic cost of soil erosion and sedimentation in New Zealand. Lincoln, Landcare Research.
Livingston ME, Biggs BJ, Gifford JS 1986a. Inventory of New Zealand lakes Part I: North Island. Water and Soil Miscellaneous Publication 80.
Livingston ME, Biggs BJ, Gifford JS 1986b. Inventory of New Zealand lakes Part II: South Island. Water and Soil Miscellaneous Publication 80.
Majid I, Sinden JA, Randall A 1983. Benefi t evaluation of increments to existing systems of public facilities. Land Economics 59: 377–392.
McAlpine KG, Wootten DM 2009. Conservation and the delivery of ecosystem
services: a literature review. Science for Conservation 295. Wellington, Department of Conservation.
McCaskill LW 1973. Hold this land: A history of soil conservation in New Zealand. Wellington, A.H. and A.W. Reed.
McDonald GW, Patterson MG 2008. Canterbury Region’s ‘hidden’ economy: Assessing the value of the region’s ecosystem services and biodiver-sity. NZCEE Research Monograph Series No. 7. Palmerston North, New Zealand Centre for Ecological Economics (Landcare Research and Massey University).
Millennium Ecosystem Assessment 2005. Ecosystem and human well-being: Our human planet – Summary for decision makers. Washington, DC, Island Press.
Ministry for the Environment 1997. The state of New Zealand’s environment: 1997. Wellington, Ministry for the Environment.
Mitchell RC, Carson RT 1989. Using surveys to value public goods: the Contingent Valuation Method. Washington, DC, Resources for the Future.
Myers N 1996. Environmental services of biodiversity. Proceedings of the National Academy of Science USA 93: 2764–2769.
Newsome PFJ 1987. The vegetation cover of New Zealand. Wellington, Water and Soil Directorate, Ministry of Works and Development.
Odum HT 1996. Environmental accounting: emergy and environmental decison making. New York, Wiley.
Patterson MG 1998. Commensuration and theories of value in ecological economics. Ecological Economics 25: 105–123.
Patterson MG 2002. Ecological production-based pricing biosphere processes. Ecological Economics 41: 457–478.
Patterson MG 2008. Ecological shadow prices and contributory value: a biophysical approach to valuing marine ecosystems. In: Patterson MG, Glavovic B eds Ecological economics of the oceans and coasts. Cheltenham, UK, Edward Elgar.
Patterson MG, Cole AO 1999a. Assessing the value of New Zealand’s biodi-versity. Occasional Paper No. 1. Palmerston North, School of Resource and Environmental Planning, Massey University.
Patterson MG, Cole AO 1999b. Estimation of the value of ecosystem services in the Waikato Region. Hamilton, Environment Waikato.
Pearce D, Markandya A, Barbier EB 1989. Blueprint for a green economy. London, Earthscan.
Perrings C 1995. The economic value of biodiversity. In: Heywood VH ed. Global biodiversity assessment. Cambridge, Cambridge University Press. Pp. 823–914.
Sandhu HS, Wratten S, Cullen, R 2010. The role of supporting ecosystem services in conventional and organic arable farming. Ecological Complexity 7: 302–310.
van den Belt MJ, Chrystall C, Patterson MG 2009. Rapid ecosystem service assessment for the Manawatu-Wanganui Region. Report for Horizons Regional Council by Massey University, Palmerston North.
Whitehead J, Blomquist G 1991. Measuring contingent values for wetlands: effects of information about related environmental goods. Water Resources Research 27: 2523–2531.
ENDNOTES1 According to the New Zealand Land Cover Database (Version 2), ‘built-up
urban areas’ covered 200 462 hectares of land in 2001/02 – this is less than 1% of New Zealand’s total area. Due to lack of data, we have not included ‘built up urban areas’ in our analysis of the value of New Zealand’s ecosystem services.
2 This term, as can be ascertained by this list, refers to all ecosystems situated on New Zealand’s land mass including land-based aquatic systems, and peri-coastal systems such as estuaries and mangroves. It does not, however, refer to other ecosystems in the coastal zone (e.g. sea grass beds, inter-tidal area) or marine ecosystems.
3 This framework of ‘provisioning’, ‘regulating’, ‘cultural’ and ‘supporting’ ecosystem services is drawn from the Millennium Ecosystem Assessment report (2005) (see above).
4 We explicitly measure the ‘fl ow’ value ($ per year) rather than the ‘stock’ value ($) of ecosystems. This is because measuring the ‘stock’ value is fraught with both theoretical and operational problems – refer to Faucheux and O’Connor (1998) and Patterson and Cole (1999a) for a discussion of this issue.
5 The ‘gross’ total (use and passive) value New Zealand’s land-based ecosys-tems and their services is estimated to be $79,279 million, but it should be recognised that this ‘double counts’ the value of the supporting services.