total cost of ownership (tco) comparison - amazon s3 · pdf filetotal cost of ownership (tco)...
TRANSCRIPT

Total Cost of Ownership (TCO) Comparison
This report includes a total cost of ownership (TCO) comparison between running your application in an on-premises or colocation infrastructure and AWS. The on-premises/colocation infrastructure is based on the description you provided in the online tool. The AWS infrastructure is an approximation of the infrastructure you described. These calculations use third-party estimates and assumptions. We are currently Beta testing the AWS TCO calculator. This calculator provides an estimate of usage charges for AWS services based on certain information you provide. Your monthly charges will be based on your actual usage of AWS services and may vary from the estimates the calculator has provided.
Notices© 2014 Amazon Web Services, Inc., This report is provided for informational purposes only. Amazon Web Services, Inc. is not responsible for any damages related to the information in this report, which is provided “as is” without warranty of any kind, whether express, implied, or statutory. Nothing in this report creates any warranties or representations from Amazon Web Services, Inc., its affiliates, suppliers, or licensors. This report does not modify the applicable terms and conditions governing your use of Amazon Web Services technologies, including the Amazon Web Services website. This report represents Amazon Web Services' current product offerings as of the date of issue and are subject to change without notice.

Total Cost of Ownership (TCO) : On-Premises vs. AWS
© 2008- 2014, Amazon Web Services, Inc. or its affiliates. All rights reserved.5/24/2014 Page 2 of 16
SUMMARY
Savings Summary (3 Years)
3 Yr. Total Cost of Ownership
On-Premises AWS
Server $90,739 $1,865
Storage $57,848 $988
Network $7,148 $ -
IT-Labor $ - $ -
Total $155,735 $2,853
Annual Savings
$951 - Annual AWS Cost
Annual On-Premises Cost - $51,912
AWS is less expensive by 98%
Annual Savings by running on AWS $50,961

Total Cost of Ownership (TCO) : On-Premises vs. AWS
© 2008- 2014, Amazon Web Services, Inc. or its affiliates. All rights reserved.5/24/2014 Page 3 of 16
Environment Details
Your On-Premises environment
Environment : Virtual
# of VMs CPU Cores Memory (GB) OS VM Usage (%) Optimize by
1 2 8 Linux 100% RAM
Storage (TB)
SAN NAS Object
1 0 0
Your AWS environment : EU (Ireland)
Closest AWS Instances
# Instances Instance vCPU RAM (GiB) Optimize by Instance Type
1 m3.large 2 7.5 RAM 3 Yr. Heavy Util. RI
EC2 Instance Mapping Criteria
Optimize by Description
CPU Option matches by vCPU count and then finds the lowest priced EC2 instance from the available choices
RAM Option matches by vRAM size and then finds the lowest priced EC2 instance from the available choices
Storage IO Option matches by I/O requirements and then finds the lowest priced EC2 instance from the available choices
Total Cost of Ownership (TCO) : On-Premises vs. AWS
© 2008- 2014, Amazon Web Services, Inc. or its affiliates. All rights reserved.5/24/2014 Page 4 of 16
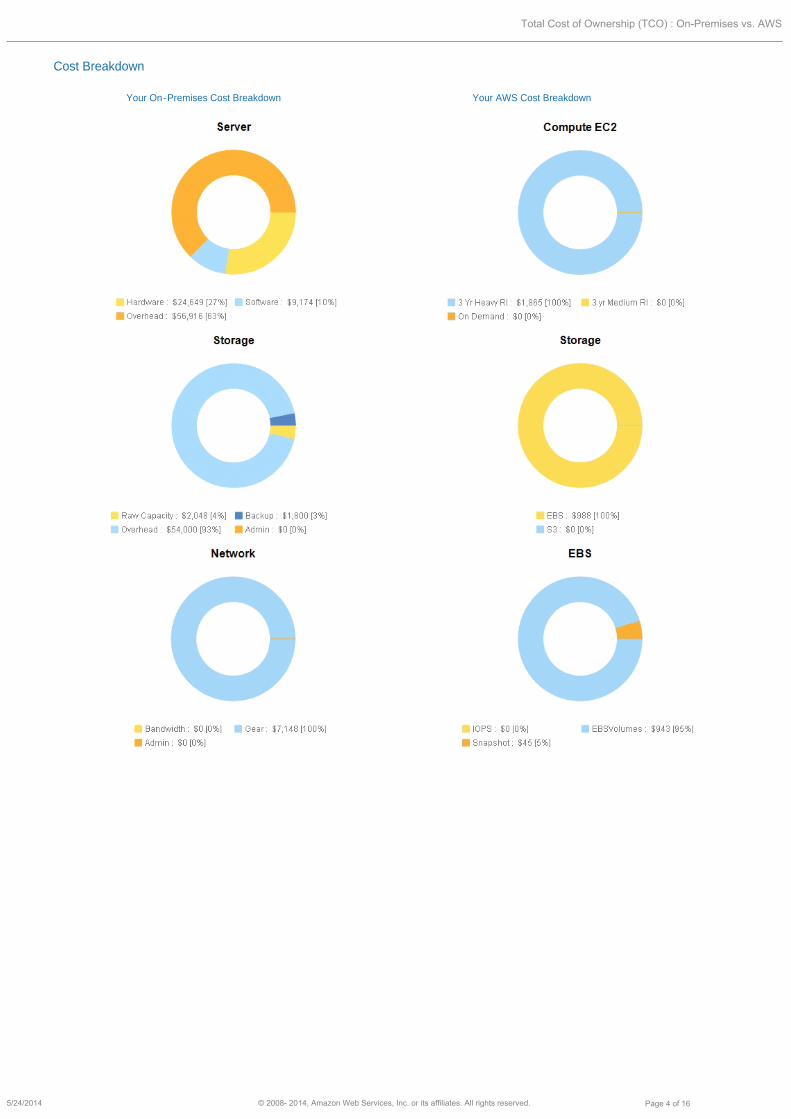
Cost Breakdown
Your On-Premises Cost Breakdown Your AWS Cost Breakdown

Total Cost of Ownership (TCO) : On-Premises vs. AWS
© 2008- 2014, Amazon Web Services, Inc. or its affiliates. All rights reserved.5/24/2014 Page 5 of 16
SERVER
Input
On-Premises Server Configuration
App Name # of VMs CPU Cores Memory (GB) Hypervisor Guest OS VM Usage (%) Virtualization Host
Domino server 1 2 0 VMware Linux 0 Host 1: 2 CPU, 6 Cores, 96 GB RAM
OutputOn-Premises - Server Costs
Server Hardware Costs
Virtual Host Sizing for Virtualized Environments
App Name # VMs Host Type # Cores RAM # Servers VM Density
Domino server 1 Host 1 12 96 1 1
Server Hardware Costs
#
Servers
# of
Cores
RAM
(GB)
Units
(U)
Power
(KW)Unit Cost Total Cost
1 12 96 2 0.75 $7,851 $5,888
1 2 0.75 $5,888
Total Server Hardware Cost $ 5,888
Server Hardware Maintenance Cost for 3 Yrs.
(@15%/Yr.)$ 2,650
Total number of Racks req. (1 Rack=42U, 28U occupied by
servers, 4U by ToR and PDUs )1
Total Peak power consumed (kW) 0.75
Rack Infrastructure Costs
Rack Chassis with PDU (@$3500/rack) $ 3,500
PDUs, dual 280V per rack (@$540 each, 2/rack for HA)
cost$ 1,080
Top of Rack Switch (48-port 10/100/1G, $5,000 each,
2/rack for HA)$ 10,000
Rack and Stack one-time deployment ( $250/server) $ 250
Provision for Spare Servers for 3 Yrs. (@5% spare
capacity/Yr.)$ 1,281
Total Rack costs (including Rack Infra, Servers) $ 24,649
Virtualization Software Costs
vSphere
Total number of VMware vSphere Licenses req 2
VMware vSphere List Price (Unit per processor) $ 3,495
VMware vSphere Discounted Price (Unit per processor) $ 2,621
VMware vSphere License Costs $ 5,243
VMware vSphere SnS Costs $ 3,932
Total VMware vSphere License + SnS (3 Yrs.) $ 9,174
Total Virtualization License and Maint. Cost (3 Yrs.) $ 9,174
Total Server Costs (HW, SW, Virt., Maint.) - 3 Yrs. $ 33,823
Facilities Costs (Datacenter Space, Power and Cooling) - On-Premises
Total Power consumed by servers (kW) 0.75
Metered cost per kWH $ 0.15
Estimated Power cost/month $ 81.00
Monthly cost to operate a Rack $ 1,500.00
Total Rack costs/month $ 1,500.00
Total Monthly Facilities costs $ 1,581.00
Facilities Costs - On-Premises (3 Yrs.) $ 56,916
Server Costs Summary
Server Costs Summary
Category Cost % of Total Cost
Hardware $24,649 27%
Software $9,174 10%
Operating Costs (3 Yrs.) $56,916 63%
Total $90,739 100%
Total Server Costs, including operational costs (3 Yr.)
$ 90,739
AWS - EC2 Costs
EC2 Instance Costs (3 Yr.) – On-Demand and Reserved Instances
3 Yr. Heavy Util. Reserved Instances
AWS Instance One-time Price/Hr. Total Costs
m3.large $673 $0.05 $1,865
Total Cost: $1,865
3 Yr. Medium Util. Reserved Instances
AWS Instance One-time Price/Hr. Total Costs
m3.large $571 $0.06 $2,048
Total Cost: $2,048
On-Demand
AWS Instance Total Costs
m3.large $3,992
Total Cost: $3,992
Lowest Priced Instance
Instance Cost Type
m3.large $1,865 3 Yr. Heavy Util. RI
Total Cost: $1,865
EC2 Costs (3 Yr.) $ 1,865
EC2 Reserved Instances discounts (if Applicable)
EC2 Reserved Instances
AWS Instance
Pricing model # Instances
Upfront fee
Total upfront
m3.large3 Yr. Heavy Util. RI
1 $673 $673
Total upfront fee $ 673
Discount Tier Applicable 0%
EC2 Costs (3 Yr.) after discount $ 1,865

Total Cost of Ownership (TCO) : On-Premises vs. AWS
© 2008- 2014, Amazon Web Services, Inc. or its affiliates. All rights reserved.5/24/2014 Page 6 of 16
SERVER
Input
On-Premises Server Configuration
App Name # of VMs CPU Cores Memory (GB) Hypervisor Guest OS VM Usage (%) Virtualization Host
Domino server 1 2 0 VMware Linux 0 Host 1: 2 CPU, 6 Cores, 96 GB RAM
OutputOn-Premises - Server Costs
Server Hardware Costs
Virtual Host Sizing for Virtualized Environments
App Name # VMs Host Type # Cores RAM # Servers VM Density
Domino server 1 Host 1 12 96 1 1
Server Hardware Costs
#
Servers
# of
Cores
RAM
(GB)
Units
(U)
Power
(KW)Unit Cost Total Cost
1 12 96 2 0.75 $7,851 $5,888
1 2 0.75 $5,888
Total Server Hardware Cost $ 5,888
Server Hardware Maintenance Cost for 3 Yrs.
(@15%/Yr.)$ 2,650
Total number of Racks req. (1 Rack=42U, 28U occupied by
servers, 4U by ToR and PDUs )1
Total Peak power consumed (kW) 0.75
Rack Infrastructure Costs
Rack Chassis with PDU (@$3500/rack) $ 3,500
PDUs, dual 280V per rack (@$540 each, 2/rack for HA)
cost$ 1,080
Top of Rack Switch (48-port 10/100/1G, $5,000 each,
2/rack for HA)$ 10,000
Rack and Stack one-time deployment ( $250/server) $ 250
Provision for Spare Servers for 3 Yrs. (@5% spare
capacity/Yr.)$ 1,281
Total Rack costs (including Rack Infra, Servers) $ 24,649
Virtualization Software Costs
vSphere
Total number of VMware vSphere Licenses req 2
VMware vSphere List Price (Unit per processor) $ 3,495
VMware vSphere Discounted Price (Unit per processor) $ 2,621
VMware vSphere License Costs $ 5,243
VMware vSphere SnS Costs $ 3,932
Total VMware vSphere License + SnS (3 Yrs.) $ 9,174
Total Virtualization License and Maint. Cost (3 Yrs.) $ 9,174
Total Server Costs (HW, SW, Virt., Maint.) - 3 Yrs. $ 33,823
Facilities Costs (Datacenter Space, Power and Cooling) - On-Premises
Total Power consumed by servers (kW) 0.75
Metered cost per kWH $ 0.15
Estimated Power cost/month $ 81.00
Monthly cost to operate a Rack $ 1,500.00
Total Rack costs/month $ 1,500.00
Total Monthly Facilities costs $ 1,581.00
Facilities Costs - On-Premises (3 Yrs.) $ 56,916
Server Costs Summary
Server Costs Summary
Category Cost % of Total Cost
Hardware $24,649 27%
Software $9,174 10%
Operating Costs (3 Yrs.) $56,916 63%
Total $90,739 100%
Total Server Costs, including operational costs (3 Yr.)
$ 90,739
AWS - EC2 Costs
EC2 Instance Costs (3 Yr.) – On-Demand and Reserved Instances
3 Yr. Heavy Util. Reserved Instances
AWS Instance One-time Price/Hr. Total Costs
m3.large $673 $0.05 $1,865
Total Cost: $1,865
3 Yr. Medium Util. Reserved Instances
AWS Instance One-time Price/Hr. Total Costs
m3.large $571 $0.06 $2,048
Total Cost: $2,048
On-Demand
AWS Instance Total Costs
m3.large $3,992
Total Cost: $3,992
Lowest Priced Instance
Instance Cost Type
m3.large $1,865 3 Yr. Heavy Util. RI
Total Cost: $1,865
EC2 Costs (3 Yr.) $ 1,865
EC2 Reserved Instances discounts (if Applicable)
EC2 Reserved Instances
AWS Instance
Pricing model # Instances
Upfront fee
Total upfront
m3.large3 Yr. Heavy Util. RI
1 $673 $673
Total upfront fee $ 673
Discount Tier Applicable 0%
EC2 Costs (3 Yr.) after discount $ 1,865

Total Cost of Ownership (TCO) : On-Premises vs. AWS
© 2008- 2014, Amazon Web Services, Inc. or its affiliates. All rights reserved.5/24/2014 Page 7 of 16
STORAGE
Input
On-Premises Storage Configuration
Storage Type Raw Storage Capacity (TB) Max IOPS for Application Backup % / Month
SAN 1 0 0
Output
Only raw capacity specified, no IO requirements; use HDD by default
On-Premises - Storage Costs
SAN Costs
Starting capacity/Raw capacity (TB) user provided 1
Starting capacity/Raw capacity (GB) 1,024
Capacity after OS Penalty (~7%, capacity OS recognizes)
(GB)952
Usable capacity based on RAID (RAID 10 assumed)
configuration (GB)476
$/raw GB Purchase Price $ 4.00
Discounted $/raw Purchase Price (50% storage
hardware discount applied)$ 2.00
Acquisition Cost of SAN storage $ 2,048
Storage backup costs
Total amount of storage to be backed up (TB) 1.00
Total amount of storage to be backed up (GB) 1,024
Tape Library used LTO-5
Max uncompressed speed (MB/s) for Tape Library 140
Max uncompressed speed - TB/day 11.54
Backup Window Time 8
TBs processed/drive for backup window 3.85
Number of Tape drives req 1
Tape Library Price/drive $ 1,800
Backup Costs (3 Yr.) $ 1,800
Amount of TBs hosted by a single Rack (TB) 200
Number of racks required 1
Monthly cost to operate a rack $ 1,500
Total Datacenter Space, Power, Cooling Costs (3
Yr.)$ 54,000
Storage Break-down
Storage Break-down
Category Cost % of Total Cost
Raw Capacity (Incl. IOPS) $2,048 4%
Backup $1,800 3%
Overhead (incl. storage admin) $54,000 93%
Storage Admin $ - 0%
Total $57,848 100%
Total Storage Costs (3 Yr.) $ 57,848
AWS - Storage Costs
EBS Storage - Only Standard EBS used with no IOPS requirements
EBS Costs - Equivalent to On-Premises SAN environment
Starting Capacity (GB) 476
Equivalent EBS Storage Volume Standard
Number of EBS Volumes required 1
EBS Volumes cost/month $ 26.19
Initial snapshot (one-time) $ 45.24
EBS incremental snapshots cost/month $ -
Total EBS cost /month $ 26
EBS Costs (3 Yr) - no IOPS $ 988
EBS Costs (3 Yr.) $ 988
Total AWS Storage Costs (3 Yr.) $ 988.03

Total Cost of Ownership (TCO) : On-Premises vs. AWS
© 2008- 2014, Amazon Web Services, Inc. or its affiliates. All rights reserved.5/24/2014 Page 8 of 16
STORAGE
Input
On-Premises Storage Configuration
Storage Type Raw Storage Capacity (TB) Max IOPS for Application Backup % / Month
SAN 1 0 0
Output
Only raw capacity specified, no IO requirements; use HDD by default
On-Premises - Storage Costs
SAN Costs
Starting capacity/Raw capacity (TB) user provided 1
Starting capacity/Raw capacity (GB) 1,024
Capacity after OS Penalty (~7%, capacity OS recognizes)
(GB)952
Usable capacity based on RAID (RAID 10 assumed)
configuration (GB)476
$/raw GB Purchase Price $ 4.00
Discounted $/raw Purchase Price (50% storage
hardware discount applied)$ 2.00
Acquisition Cost of SAN storage $ 2,048
Storage backup costs
Total amount of storage to be backed up (TB) 1.00
Total amount of storage to be backed up (GB) 1,024
Tape Library used LTO-5
Max uncompressed speed (MB/s) for Tape Library 140
Max uncompressed speed - TB/day 11.54
Backup Window Time 8
TBs processed/drive for backup window 3.85
Number of Tape drives req 1
Tape Library Price/drive $ 1,800
Backup Costs (3 Yr.) $ 1,800
Amount of TBs hosted by a single Rack (TB) 200
Number of racks required 1
Monthly cost to operate a rack $ 1,500
Total Datacenter Space, Power, Cooling Costs (3
Yr.)$ 54,000
Storage Break-down
Storage Break-down
Category Cost % of Total Cost
Raw Capacity (Incl. IOPS) $2,048 4%
Backup $1,800 3%
Overhead (incl. storage admin) $54,000 93%
Storage Admin $ - 0%
Total $57,848 100%
Total Storage Costs (3 Yr.) $ 57,848
AWS - Storage Costs
EBS Storage - Only Standard EBS used with no IOPS requirements
EBS Costs - Equivalent to On-Premises SAN environment
Starting Capacity (GB) 476
Equivalent EBS Storage Volume Standard
Number of EBS Volumes required 1
EBS Volumes cost/month $ 26.19
Initial snapshot (one-time) $ 45.24
EBS incremental snapshots cost/month $ -
Total EBS cost /month $ 26
EBS Costs (3 Yr) - no IOPS $ 988
EBS Costs (3 Yr.) $ 988
Total AWS Storage Costs (3 Yr.) $ 988.03

Total Cost of Ownership (TCO) : On-Premises vs. AWS
© 2008- 2014, Amazon Web Services, Inc. or its affiliates. All rights reserved.5/24/2014 Page 9 of 16
NETWORK
Input
Data Center Bandwidth (Mbit/s) 0
Peak/Average Ratio 0
OutputOn-Premises - Networking Costs
Networking Hardware and Software Costs
Network overhead cost as a % of Server hardware
acquisition cost20%
Network hardware and software cost $ 4,929.73
Network hardware and software Maintenance/Yr. 15%
Maintenance Cost (3 Yr.) $ 2,218.38
Total Network Hardware and Software costs (3 Yr.)
$ 7,148
Total Networking Costs (3 Yr.) $ 7,148

Total Cost of Ownership (TCO) : On-Premises vs. AWS
© 2008- 2014, Amazon Web Services, Inc. or its affiliates. All rights reserved.5/24/2014 Page 10 of 16
The AWS TCO calculator uses the following methodology when calculating on-premises, colocation, and AWS costs.
Our methodology defines Total Cost of Ownership (TCO) as below –
TCO = Acquisition Costs + Operational Costs
Operational costs include labor cost to manage the data center operations as well as overhead cost associated with running the data center equipment. A standard 3 year time frame is used for our calculations as the useful life for the data center equipment.
The following graphic shows the major cost categories in on-premises and colocation environments
For On-Premises/Colocation, TCO = Server Costs + Storage Costs + Network Costs + IT Labor Costs
For on-premises and colocation environments, each of the major cost categories (server, storage, and network) include the cost of hardware, software (where applicable), and overhead costs. Overhead costs include the cost of data center floor space, and power
and cooling required for data center equipment. For our calculations, a “standard rack” is considered to be the typical 19 inch rack that
has a rack footprint of 28 sq. ft. (actual area covered by the rack) in the data center. Additionally, we assume average power density per rack to be 10kW in an on-premises data center and a cabinet to have a primary 20 amp, 120V single phase circuit and a redundant
20 amp, 120V circuit in a colocation environment. We use Uptime institute cost model to calculate overhead costs for on-premises and a
publically available price quote from a global colocation, interconnection, and managed IT infrastructure service provider for colocation environment.Since power and cooling expenses are billed on a monthly basis, we calculate our overhead costs on a monthly basis. We
also use a “standard rack ” as a common point for calculating overhead costs.
For On-Premises and Colocation environments, the $/rack/month is calculated differently -
As shown above, the logic by which the overhead cost is calculated for on-premises and colocation environments is different. Most of
the other cost categories are handled similarly between these environments. On the network side, a colocation environment incurs
recurring bandwidth costs where as an on-premises environment also incurs network capital expense and network operation expense.
Finally, on AWS side overhead costs is included in the publically listed prices and customers don ’ t have to pay extra for space, power,
and cooling as shown below.
The AWS TCO calculator makes the following assumptions for on-premises, co- location, and AWS environments.
On-Premises and Co-location Assumptions
1. Servers and Racks:
l On-premises and co- location server prices are based on Dell PowerEdge Rack servers and HP ProLiant Rack servers.
l On-premises and co- location server prices are based on Dell PowerEdge Rack servers and HP ProLiant Rack servers.
l Dell PowerEdge prices available here.
l HP ProLiant Rack servers prices available here.
l Servers can be physical or virtualized. Customers can choose VMware vSphere, Microsoft Hyper-V, KVM or Xen as their hypervisor
of choice.
l For virtualized environments, two virtualization host configurations are supported –
l Host 1 - 2 processors with 6 cores each and 96 GB RAM. Details are provided below.
l Host 2 – 4 processors with 6 cores each and 256 GB RAM
l VM density is calculated based on the virtual RAM and virtual cores allocated to VMs (more details in the methodology section).
l Server and rack hardware are discounted by 25% off the publically available list prices.
l A “standard rack ” is considered to be the typical 19 inch rack that has a rack footprint (actual area covered by the rack) in the data
center as defined here. Standard rack assumed to consist of 42 rack units (42U).
l On average each rack is filled up to 75% of capacity (i.e. for a 42U rack, 32U is actually used)
l Dell PowerEdge Energy Smart 4620S Rack Enclosure used to hold data center equipment. A base price of $3,499 assumed as per the
published price here.
l Every rack consists of two top of rack Switches (ToR) for Redundancy. Cisco Catalyst 2960 48 port switches used in calculations
with the following configuration- 48 x 10/100/1000 - PoE+ 525Watt + 4 x SFP, LAN Base Layer 2. A base price of $6,895 assumed for
Cisco switch as per the published price here.
l Every rack consists of 2 Power Distribution Units (PDU) for high-availability. APC Metered Rack PDU - power distribution strip used
with a base price of $545 as per the published price here.
l A 15% hardware maintenance/year applied to the server and rack hardware. More details are provided below.
l 5% of all server capacity assumed to be hot spare servers. A hot spare or hot standby is used as a failover mechanism to provide
reliability and high-availability in data center environments.
2. Software
l VMware vSphere Enterprise Plus licenses assumed for customers using VMware environments. A base price of $3,495 per licenses
and $874 for 1 year support and subscription assumed as per the published prices from VMware here.
l KVM is free software released under the GPL as described here. Vendors like RedHat offer KVM hypervisor under a subscription
model that includes product access, all updates, and support. Details can be found here.
l Xen hypervisor is covered by the GNU general public license as described here and available for free. Vendors like Citrix offer a free
and paid version of XenServer. Details can be found here.
l Software licenses and maintenance are discounted by 25% off the publically available list prices.
l The Linux distributions used in our model are available for free as described here. Our model doesn ’ t use the paid Linux distributions
like SUSE Enterprise Linux and Red Hat Enterprise Linux.
3. Storage
l Our model assumes RAID 10 configurations for on-premises and colocation storage. RAID 10 details are available here.
l Hard disk manufacturers measure drive capacity differently than operating systems. Hard disk manufacturers use a “base-10”
measure, whereas operating systems use a “base-2 ” measure as described here. This mismatch causes a 7% penalty on the disk capacity.
l Raw capacity is defined as the disk capacity in the box or frame while usable capacity is the disk capacity after RAID protection and
available for host allocation.
l Average Solid State Devices (SSD) and Hard Disk Drives (HDD) price per GB available here. Our model assumes higher prices as we
include the price of Host Bus Adapters (HBA), Fiber Channel Adapters, Optical or Fiber Channel Cables and other storage equipment.
l A discount of 50% is applied by default to the SSD and HDD price per GB.
l Assumed that a storage admin manages 1000 TB of data on an annual basis.
l Assumed that a single storage rack contains 200 TB of disks.
l Assumed LTO-5 tapes used for backups. Details available here.
l A base price of $1800/drive assumed for the cost of LTO-5 drive taking tapes of up to 1.5 TB true (uncompressed) capacity as per the
published price here.
l Assumed a media-rotation policy for backups whereas incremental backups are taken once at month end.
4. Network
l Assume a 20% network overhead for on-premises environments. The network overhead is calculated by taking a 20% overhead on
server and rack hardware cost.
l For a colocation facility, no network overhead is assumed as colocation providers would bundle this cost in their prices.
l Traffic in the data center assumed to be both north-south (between servers inside the data center and end points outside the data
center) and east-west (between components in the data center). Assumed 70% of all data center traffic is “east-west ” .
l For on-premises environment, Bandwidth costs also include cost of WAN Optimizers and MPLS VPN.
l Average colocation bandwidth pricing is tiered – our model assumes $30/Mbps at the lowest tier and $7/Mbps at the highest tier. More
details can be found here.
l Average network admin effort is around 8% of total IT administration effort as per this report.
5. Power and Cooling
l Average Retail Price of Electricity in the US can be found here.
l The average cents per kilowatt-hour in the US commercial segment for January 2014 was 10.34.
l Assume a standard on-premises/colocation PUE of 1.5 and a base kWh (kilo watt hour) price of 10 cents/hr. This gives us a total
electricity charge of 15 cents per kWh (10*1.5).
6. Data Center Space
l Average wholesale colocation asking price in the US in Q2 2013 is $150/kW/month as per the published report here.
l Model assumes colocation providers charge a fixed $ per kW rate that covers the cost of all power and space contracted. Every rack
assumed to have a primary and redundant power supply.
l The model assumes a separate charge for space, power and cooling for on-premises environments.
7. IT Labor
l Average Data center admin salaries by region available here.
AWS Assumptions
1. Compute
l Both On-Demand and 3 Yr. Reserved Instance types used for AWS compute. All three Reserved Instance types (Light, Medium, and
Heavy Utilization Reserved Instances) used in the model depending on the actual instance usage.
l EC2 instances are matched with on-premises servers and VMs based on CPU, RAM, or Disk I/O.
l The number of EC2 instances is the same as the physical servers or VMs on-premises meaning we don ’ t apply any cost optimization
on AWS side. In real- life situations, customers would change instance sizes up or down based on monitoring various AWS resource metrics like CPU utilization, free memory, or disk usage.
l Amazon EC2 provides a wide selection of instance types optimized to fit different use cases. Our model uses General purpose,
Compute-optimized, Memory-optimized, and Storage-optimized instances.
l Model uses only the current generation of instances- General purpose (m3), Compute-optimized (c3), and Storage-optimized (I2).
l Current generation of instances provide faster, newer Intel Ivy Bridge processors, SSD-based instance storage, Higher performance
Enhance Networking, and advanced features such as support for HVM AMIs, AVX and XSAVE flags.
l Model assumes Reserved Instance volume discounts as described here.
2. Storage
l On-premises SAN and NAS storage systems are represented in AWS as EBS volumes.
l On-premises Object storage is represented in AWS as S3.
l S3 offers multiple storage classes – S3 Standard, RRS, and Glacier depending on how S3 handles data. Our model assumes S3
standard only.
l Model assumes RAID 0 for EBS volumes as described here.
l Multiple EBS volumes can be stripped together to achieve up to 48,000 IOPS when attached to larger EC2 instances as described here.
l For backup, we use EBS snapshots to S3 for calculating backup costs on AWS.
l Backup%/month is the amount of data that changes every month. So a 50% number means that 50% of data changes every month and
is backed up.
l Model calculates EBS-optimized instance cost separately, but doesn ’ t add it to the total storage cost.
3. Network
l Model assumes publically available Data Transfer OUT tiered rates From Amazon EC2 to Internet as described here.
l Model assumes no data transfer happens from Amazon S3 to internet
4. IT Labor
l Model assumes that an IT admin can manage 400 EC2 instances.
5. AWS Support
l Model assumes Business- level support for AWS as described here.
METHODOLOGY
ASSUMPTIONS

Total Cost of Ownership (TCO) : On-Premises vs. AWS
© 2008- 2014, Amazon Web Services, Inc. or its affiliates. All rights reserved.5/24/2014 Page 11 of 16
The AWS TCO calculator uses the following methodology when calculating on-premises, colocation, and AWS costs.
Our methodology defines Total Cost of Ownership (TCO) as below –
TCO = Acquisition Costs + Operational Costs
Operational costs include labor cost to manage the data center operations as well as overhead cost associated with running the data center equipment. A standard 3 year time frame is used for our calculations as the useful life for the data center equipment.
The following graphic shows the major cost categories in on-premises and colocation environments
For On-Premises/Colocation, TCO = Server Costs + Storage Costs + Network Costs + IT Labor Costs
For on-premises and colocation environments, each of the major cost categories (server, storage, and network) include the cost of hardware, software (where applicable), and overhead costs. Overhead costs include the cost of data center floor space, and power
and cooling required for data center equipment. For our calculations, a “standard rack” is considered to be the typical 19 inch rack that
has a rack footprint of 28 sq. ft. (actual area covered by the rack) in the data center. Additionally, we assume average power density per rack to be 10kW in an on-premises data center and a cabinet to have a primary 20 amp, 120V single phase circuit and a redundant
20 amp, 120V circuit in a colocation environment. We use Uptime institute cost model to calculate overhead costs for on-premises and a
publically available price quote from a global colocation, interconnection, and managed IT infrastructure service provider for colocation environment.Since power and cooling expenses are billed on a monthly basis, we calculate our overhead costs on a monthly basis. We
also use a “standard rack ” as a common point for calculating overhead costs.
For On-Premises and Colocation environments, the $/rack/month is calculated differently -
As shown above, the logic by which the overhead cost is calculated for on-premises and colocation environments is different. Most of
the other cost categories are handled similarly between these environments. On the network side, a colocation environment incurs
recurring bandwidth costs where as an on-premises environment also incurs network capital expense and network operation expense.
Finally, on AWS side overhead costs is included in the publically listed prices and customers don ’ t have to pay extra for space, power,
and cooling as shown below.
The AWS TCO calculator makes the following assumptions for on-premises, co- location, and AWS environments.
On-Premises and Co-location Assumptions
1. Servers and Racks:
l On-premises and co- location server prices are based on Dell PowerEdge Rack servers and HP ProLiant Rack servers.
l On-premises and co- location server prices are based on Dell PowerEdge Rack servers and HP ProLiant Rack servers.
l Dell PowerEdge prices available here.
l HP ProLiant Rack servers prices available here.
l Servers can be physical or virtualized. Customers can choose VMware vSphere, Microsoft Hyper-V, KVM or Xen as their hypervisor
of choice.
l For virtualized environments, two virtualization host configurations are supported –
l Host 1 - 2 processors with 6 cores each and 96 GB RAM. Details are provided below.
l Host 2 – 4 processors with 6 cores each and 256 GB RAM
l VM density is calculated based on the virtual RAM and virtual cores allocated to VMs (more details in the methodology section).
l Server and rack hardware are discounted by 25% off the publically available list prices.
l A “standard rack ” is considered to be the typical 19 inch rack that has a rack footprint (actual area covered by the rack) in the data
center as defined here. Standard rack assumed to consist of 42 rack units (42U).
l On average each rack is filled up to 75% of capacity (i.e. for a 42U rack, 32U is actually used)
l Dell PowerEdge Energy Smart 4620S Rack Enclosure used to hold data center equipment. A base price of $3,499 assumed as per the
published price here.
l Every rack consists of two top of rack Switches (ToR) for Redundancy. Cisco Catalyst 2960 48 port switches used in calculations
with the following configuration- 48 x 10/100/1000 - PoE+ 525Watt + 4 x SFP, LAN Base Layer 2. A base price of $6,895 assumed for
Cisco switch as per the published price here.
l Every rack consists of 2 Power Distribution Units (PDU) for high-availability. APC Metered Rack PDU - power distribution strip used
with a base price of $545 as per the published price here.
l A 15% hardware maintenance/year applied to the server and rack hardware. More details are provided below.
l 5% of all server capacity assumed to be hot spare servers. A hot spare or hot standby is used as a failover mechanism to provide
reliability and high-availability in data center environments.
2. Software
l VMware vSphere Enterprise Plus licenses assumed for customers using VMware environments. A base price of $3,495 per licenses
and $874 for 1 year support and subscription assumed as per the published prices from VMware here.
l KVM is free software released under the GPL as described here. Vendors like RedHat offer KVM hypervisor under a subscription
model that includes product access, all updates, and support. Details can be found here.
l Xen hypervisor is covered by the GNU general public license as described here and available for free. Vendors like Citrix offer a free
and paid version of XenServer. Details can be found here.
l Software licenses and maintenance are discounted by 25% off the publically available list prices.
l The Linux distributions used in our model are available for free as described here. Our model doesn ’ t use the paid Linux distributions
like SUSE Enterprise Linux and Red Hat Enterprise Linux.
3. Storage
l Our model assumes RAID 10 configurations for on-premises and colocation storage. RAID 10 details are available here.
l Hard disk manufacturers measure drive capacity differently than operating systems. Hard disk manufacturers use a “base-10”
measure, whereas operating systems use a “base-2 ” measure as described here. This mismatch causes a 7% penalty on the disk capacity.
l Raw capacity is defined as the disk capacity in the box or frame while usable capacity is the disk capacity after RAID protection and
available for host allocation.
l Average Solid State Devices (SSD) and Hard Disk Drives (HDD) price per GB available here. Our model assumes higher prices as we
include the price of Host Bus Adapters (HBA), Fiber Channel Adapters, Optical or Fiber Channel Cables and other storage equipment.
l A discount of 50% is applied by default to the SSD and HDD price per GB.
l Assumed that a storage admin manages 1000 TB of data on an annual basis.
l Assumed that a single storage rack contains 200 TB of disks.
l Assumed LTO-5 tapes used for backups. Details available here.
l A base price of $1800/drive assumed for the cost of LTO-5 drive taking tapes of up to 1.5 TB true (uncompressed) capacity as per the
published price here.
l Assumed a media-rotation policy for backups whereas incremental backups are taken once at month end.
4. Network
l Assume a 20% network overhead for on-premises environments. The network overhead is calculated by taking a 20% overhead on
server and rack hardware cost.
l For a colocation facility, no network overhead is assumed as colocation providers would bundle this cost in their prices.
l Traffic in the data center assumed to be both north-south (between servers inside the data center and end points outside the data
center) and east-west (between components in the data center). Assumed 70% of all data center traffic is “east-west ” .
l For on-premises environment, Bandwidth costs also include cost of WAN Optimizers and MPLS VPN.
l Average colocation bandwidth pricing is tiered – our model assumes $30/Mbps at the lowest tier and $7/Mbps at the highest tier. More
details can be found here.
l Average network admin effort is around 8% of total IT administration effort as per this report.
5. Power and Cooling
l Average Retail Price of Electricity in the US can be found here.
l The average cents per kilowatt-hour in the US commercial segment for January 2014 was 10.34.
l Assume a standard on-premises/colocation PUE of 1.5 and a base kWh (kilo watt hour) price of 10 cents/hr. This gives us a total
electricity charge of 15 cents per kWh (10*1.5).
6. Data Center Space
l Average wholesale colocation asking price in the US in Q2 2013 is $150/kW/month as per the published report here.
l Model assumes colocation providers charge a fixed $ per kW rate that covers the cost of all power and space contracted. Every rack
assumed to have a primary and redundant power supply.
l The model assumes a separate charge for space, power and cooling for on-premises environments.
7. IT Labor
l Average Data center admin salaries by region available here.
AWS Assumptions
1. Compute
l Both On-Demand and 3 Yr. Reserved Instance types used for AWS compute. All three Reserved Instance types (Light, Medium, and
Heavy Utilization Reserved Instances) used in the model depending on the actual instance usage.
l EC2 instances are matched with on-premises servers and VMs based on CPU, RAM, or Disk I/O.
l The number of EC2 instances is the same as the physical servers or VMs on-premises meaning we don ’ t apply any cost optimization
on AWS side. In real- life situations, customers would change instance sizes up or down based on monitoring various AWS resource metrics like CPU utilization, free memory, or disk usage.
l Amazon EC2 provides a wide selection of instance types optimized to fit different use cases. Our model uses General purpose,
Compute-optimized, Memory-optimized, and Storage-optimized instances.
l Model uses only the current generation of instances- General purpose (m3), Compute-optimized (c3), and Storage-optimized (I2).
l Current generation of instances provide faster, newer Intel Ivy Bridge processors, SSD-based instance storage, Higher performance
Enhance Networking, and advanced features such as support for HVM AMIs, AVX and XSAVE flags.
l Model assumes Reserved Instance volume discounts as described here.
2. Storage
l On-premises SAN and NAS storage systems are represented in AWS as EBS volumes.
l On-premises Object storage is represented in AWS as S3.
l S3 offers multiple storage classes – S3 Standard, RRS, and Glacier depending on how S3 handles data. Our model assumes S3
standard only.
l Model assumes RAID 0 for EBS volumes as described here.
l Multiple EBS volumes can be stripped together to achieve up to 48,000 IOPS when attached to larger EC2 instances as described here.
l For backup, we use EBS snapshots to S3 for calculating backup costs on AWS.
l Backup%/month is the amount of data that changes every month. So a 50% number means that 50% of data changes every month and
is backed up.
l Model calculates EBS-optimized instance cost separately, but doesn ’ t add it to the total storage cost.
3. Network
l Model assumes publically available Data Transfer OUT tiered rates From Amazon EC2 to Internet as described here.
l Model assumes no data transfer happens from Amazon S3 to internet
4. IT Labor
l Model assumes that an IT admin can manage 400 EC2 instances.
5. AWS Support
l Model assumes Business- level support for AWS as described here.
METHODOLOGY
ASSUMPTIONS

Total Cost of Ownership (TCO) : On-Premises vs. AWS
© 2008- 2014, Amazon Web Services, Inc. or its affiliates. All rights reserved.5/24/2014 Page 12 of 16
The AWS TCO calculator uses the following methodology when calculating on-premises, colocation, and AWS costs.
Our methodology defines Total Cost of Ownership (TCO) as below –
TCO = Acquisition Costs + Operational Costs
Operational costs include labor cost to manage the data center operations as well as overhead cost associated with running the data center equipment. A standard 3 year time frame is used for our calculations as the useful life for the data center equipment.
The following graphic shows the major cost categories in on-premises and colocation environments
For On-Premises/Colocation, TCO = Server Costs + Storage Costs + Network Costs + IT Labor Costs
For on-premises and colocation environments, each of the major cost categories (server, storage, and network) include the cost of hardware, software (where applicable), and overhead costs. Overhead costs include the cost of data center floor space, and power
and cooling required for data center equipment. For our calculations, a “standard rack” is considered to be the typical 19 inch rack that
has a rack footprint of 28 sq. ft. (actual area covered by the rack) in the data center. Additionally, we assume average power density per rack to be 10kW in an on-premises data center and a cabinet to have a primary 20 amp, 120V single phase circuit and a redundant
20 amp, 120V circuit in a colocation environment. We use Uptime institute cost model to calculate overhead costs for on-premises and a
publically available price quote from a global colocation, interconnection, and managed IT infrastructure service provider for colocation environment.Since power and cooling expenses are billed on a monthly basis, we calculate our overhead costs on a monthly basis. We
also use a “standard rack ” as a common point for calculating overhead costs.
For On-Premises and Colocation environments, the $/rack/month is calculated differently -
As shown above, the logic by which the overhead cost is calculated for on-premises and colocation environments is different. Most of
the other cost categories are handled similarly between these environments. On the network side, a colocation environment incurs
recurring bandwidth costs where as an on-premises environment also incurs network capital expense and network operation expense.
Finally, on AWS side overhead costs is included in the publically listed prices and customers don ’ t have to pay extra for space, power,
and cooling as shown below.
The AWS TCO calculator makes the following assumptions for on-premises, co- location, and AWS environments.
On-Premises and Co-location Assumptions
1. Servers and Racks:
l On-premises and co- location server prices are based on Dell PowerEdge Rack servers and HP ProLiant Rack servers.
l On-premises and co- location server prices are based on Dell PowerEdge Rack servers and HP ProLiant Rack servers.
l Dell PowerEdge prices available here.
l HP ProLiant Rack servers prices available here.
l Servers can be physical or virtualized. Customers can choose VMware vSphere, Microsoft Hyper-V, KVM or Xen as their hypervisor
of choice.
l For virtualized environments, two virtualization host configurations are supported –
l Host 1 - 2 processors with 6 cores each and 96 GB RAM. Details are provided below.
l Host 2 – 4 processors with 6 cores each and 256 GB RAM
l VM density is calculated based on the virtual RAM and virtual cores allocated to VMs (more details in the methodology section).
l Server and rack hardware are discounted by 25% off the publically available list prices.
l A “standard rack ” is considered to be the typical 19 inch rack that has a rack footprint (actual area covered by the rack) in the data
center as defined here. Standard rack assumed to consist of 42 rack units (42U).
l On average each rack is filled up to 75% of capacity (i.e. for a 42U rack, 32U is actually used)
l Dell PowerEdge Energy Smart 4620S Rack Enclosure used to hold data center equipment. A base price of $3,499 assumed as per the
published price here.
l Every rack consists of two top of rack Switches (ToR) for Redundancy. Cisco Catalyst 2960 48 port switches used in calculations
with the following configuration- 48 x 10/100/1000 - PoE+ 525Watt + 4 x SFP, LAN Base Layer 2. A base price of $6,895 assumed for
Cisco switch as per the published price here.
l Every rack consists of 2 Power Distribution Units (PDU) for high-availability. APC Metered Rack PDU - power distribution strip used
with a base price of $545 as per the published price here.
l A 15% hardware maintenance/year applied to the server and rack hardware. More details are provided below.
l 5% of all server capacity assumed to be hot spare servers. A hot spare or hot standby is used as a failover mechanism to provide
reliability and high-availability in data center environments.
2. Software
l VMware vSphere Enterprise Plus licenses assumed for customers using VMware environments. A base price of $3,495 per licenses
and $874 for 1 year support and subscription assumed as per the published prices from VMware here.
l KVM is free software released under the GPL as described here. Vendors like RedHat offer KVM hypervisor under a subscription
model that includes product access, all updates, and support. Details can be found here.
l Xen hypervisor is covered by the GNU general public license as described here and available for free. Vendors like Citrix offer a free
and paid version of XenServer. Details can be found here.
l Software licenses and maintenance are discounted by 25% off the publically available list prices.
l The Linux distributions used in our model are available for free as described here. Our model doesn ’ t use the paid Linux distributions
like SUSE Enterprise Linux and Red Hat Enterprise Linux.
3. Storage
l Our model assumes RAID 10 configurations for on-premises and colocation storage. RAID 10 details are available here.
l Hard disk manufacturers measure drive capacity differently than operating systems. Hard disk manufacturers use a “base-10”
measure, whereas operating systems use a “base-2 ” measure as described here. This mismatch causes a 7% penalty on the disk capacity.
l Raw capacity is defined as the disk capacity in the box or frame while usable capacity is the disk capacity after RAID protection and
available for host allocation.
l Average Solid State Devices (SSD) and Hard Disk Drives (HDD) price per GB available here. Our model assumes higher prices as we
include the price of Host Bus Adapters (HBA), Fiber Channel Adapters, Optical or Fiber Channel Cables and other storage equipment.
l A discount of 50% is applied by default to the SSD and HDD price per GB.
l Assumed that a storage admin manages 1000 TB of data on an annual basis.
l Assumed that a single storage rack contains 200 TB of disks.
l Assumed LTO-5 tapes used for backups. Details available here.
l A base price of $1800/drive assumed for the cost of LTO-5 drive taking tapes of up to 1.5 TB true (uncompressed) capacity as per the
published price here.
l Assumed a media-rotation policy for backups whereas incremental backups are taken once at month end.
4. Network
l Assume a 20% network overhead for on-premises environments. The network overhead is calculated by taking a 20% overhead on
server and rack hardware cost.
l For a colocation facility, no network overhead is assumed as colocation providers would bundle this cost in their prices.
l Traffic in the data center assumed to be both north-south (between servers inside the data center and end points outside the data
center) and east-west (between components in the data center). Assumed 70% of all data center traffic is “east-west ” .
l For on-premises environment, Bandwidth costs also include cost of WAN Optimizers and MPLS VPN.
l Average colocation bandwidth pricing is tiered – our model assumes $30/Mbps at the lowest tier and $7/Mbps at the highest tier. More
details can be found here.
l Average network admin effort is around 8% of total IT administration effort as per this report.
5. Power and Cooling
l Average Retail Price of Electricity in the US can be found here.
l The average cents per kilowatt-hour in the US commercial segment for January 2014 was 10.34.
l Assume a standard on-premises/colocation PUE of 1.5 and a base kWh (kilo watt hour) price of 10 cents/hr. This gives us a total
electricity charge of 15 cents per kWh (10*1.5).
6. Data Center Space
l Average wholesale colocation asking price in the US in Q2 2013 is $150/kW/month as per the published report here.
l Model assumes colocation providers charge a fixed $ per kW rate that covers the cost of all power and space contracted. Every rack
assumed to have a primary and redundant power supply.
l The model assumes a separate charge for space, power and cooling for on-premises environments.
7. IT Labor
l Average Data center admin salaries by region available here.
AWS Assumptions
1. Compute
l Both On-Demand and 3 Yr. Reserved Instance types used for AWS compute. All three Reserved Instance types (Light, Medium, and
Heavy Utilization Reserved Instances) used in the model depending on the actual instance usage.
l EC2 instances are matched with on-premises servers and VMs based on CPU, RAM, or Disk I/O.
l The number of EC2 instances is the same as the physical servers or VMs on-premises meaning we don ’ t apply any cost optimization
on AWS side. In real- life situations, customers would change instance sizes up or down based on monitoring various AWS resource metrics like CPU utilization, free memory, or disk usage.
l Amazon EC2 provides a wide selection of instance types optimized to fit different use cases. Our model uses General purpose,
Compute-optimized, Memory-optimized, and Storage-optimized instances.
l Model uses only the current generation of instances- General purpose (m3), Compute-optimized (c3), and Storage-optimized (I2).
l Current generation of instances provide faster, newer Intel Ivy Bridge processors, SSD-based instance storage, Higher performance
Enhance Networking, and advanced features such as support for HVM AMIs, AVX and XSAVE flags.
l Model assumes Reserved Instance volume discounts as described here.
2. Storage
l On-premises SAN and NAS storage systems are represented in AWS as EBS volumes.
l On-premises Object storage is represented in AWS as S3.
l S3 offers multiple storage classes – S3 Standard, RRS, and Glacier depending on how S3 handles data. Our model assumes S3
standard only.
l Model assumes RAID 0 for EBS volumes as described here.
l Multiple EBS volumes can be stripped together to achieve up to 48,000 IOPS when attached to larger EC2 instances as described here.
l For backup, we use EBS snapshots to S3 for calculating backup costs on AWS.
l Backup%/month is the amount of data that changes every month. So a 50% number means that 50% of data changes every month and
is backed up.
l Model calculates EBS-optimized instance cost separately, but doesn ’ t add it to the total storage cost.
3. Network
l Model assumes publically available Data Transfer OUT tiered rates From Amazon EC2 to Internet as described here.
l Model assumes no data transfer happens from Amazon S3 to internet
4. IT Labor
l Model assumes that an IT admin can manage 400 EC2 instances.
5. AWS Support
l Model assumes Business- level support for AWS as described here.
METHODOLOGY
ASSUMPTIONS

Total Cost of Ownership (TCO) : On-Premises vs. AWS
© 2008- 2014, Amazon Web Services, Inc. or its affiliates. All rights reserved.5/24/2014 Page 13 of 16
The AWS TCO calculator uses the following methodology when calculating on-premises, colocation, and AWS costs.
Our methodology defines Total Cost of Ownership (TCO) as below –
TCO = Acquisition Costs + Operational Costs
Operational costs include labor cost to manage the data center operations as well as overhead cost associated with running the data center equipment. A standard 3 year time frame is used for our calculations as the useful life for the data center equipment.
The following graphic shows the major cost categories in on-premises and colocation environments
For On-Premises/Colocation, TCO = Server Costs + Storage Costs + Network Costs + IT Labor Costs
For on-premises and colocation environments, each of the major cost categories (server, storage, and network) include the cost of hardware, software (where applicable), and overhead costs. Overhead costs include the cost of data center floor space, and power
and cooling required for data center equipment. For our calculations, a “standard rack” is considered to be the typical 19 inch rack that
has a rack footprint of 28 sq. ft. (actual area covered by the rack) in the data center. Additionally, we assume average power density per rack to be 10kW in an on-premises data center and a cabinet to have a primary 20 amp, 120V single phase circuit and a redundant
20 amp, 120V circuit in a colocation environment. We use Uptime institute cost model to calculate overhead costs for on-premises and a
publically available price quote from a global colocation, interconnection, and managed IT infrastructure service provider for colocation environment.Since power and cooling expenses are billed on a monthly basis, we calculate our overhead costs on a monthly basis. We
also use a “standard rack ” as a common point for calculating overhead costs.
For On-Premises and Colocation environments, the $/rack/month is calculated differently -
As shown above, the logic by which the overhead cost is calculated for on-premises and colocation environments is different. Most of
the other cost categories are handled similarly between these environments. On the network side, a colocation environment incurs
recurring bandwidth costs where as an on-premises environment also incurs network capital expense and network operation expense.
Finally, on AWS side overhead costs is included in the publically listed prices and customers don ’ t have to pay extra for space, power,
and cooling as shown below.
The AWS TCO calculator makes the following assumptions for on-premises, co- location, and AWS environments.
On-Premises and Co-location Assumptions
1. Servers and Racks:
l On-premises and co- location server prices are based on Dell PowerEdge Rack servers and HP ProLiant Rack servers.
l On-premises and co- location server prices are based on Dell PowerEdge Rack servers and HP ProLiant Rack servers.
l Dell PowerEdge prices available here.
l HP ProLiant Rack servers prices available here.
l Servers can be physical or virtualized. Customers can choose VMware vSphere, Microsoft Hyper-V, KVM or Xen as their hypervisor
of choice.
l For virtualized environments, two virtualization host configurations are supported –
l Host 1 - 2 processors with 6 cores each and 96 GB RAM. Details are provided below.
l Host 2 – 4 processors with 6 cores each and 256 GB RAM
l VM density is calculated based on the virtual RAM and virtual cores allocated to VMs (more details in the methodology section).
l Server and rack hardware are discounted by 25% off the publically available list prices.
l A “standard rack ” is considered to be the typical 19 inch rack that has a rack footprint (actual area covered by the rack) in the data
center as defined here. Standard rack assumed to consist of 42 rack units (42U).
l On average each rack is filled up to 75% of capacity (i.e. for a 42U rack, 32U is actually used)
l Dell PowerEdge Energy Smart 4620S Rack Enclosure used to hold data center equipment. A base price of $3,499 assumed as per the
published price here.
l Every rack consists of two top of rack Switches (ToR) for Redundancy. Cisco Catalyst 2960 48 port switches used in calculations
with the following configuration- 48 x 10/100/1000 - PoE+ 525Watt + 4 x SFP, LAN Base Layer 2. A base price of $6,895 assumed for
Cisco switch as per the published price here.
l Every rack consists of 2 Power Distribution Units (PDU) for high-availability. APC Metered Rack PDU - power distribution strip used
with a base price of $545 as per the published price here.
l A 15% hardware maintenance/year applied to the server and rack hardware. More details are provided below.
l 5% of all server capacity assumed to be hot spare servers. A hot spare or hot standby is used as a failover mechanism to provide
reliability and high-availability in data center environments.
2. Software
l VMware vSphere Enterprise Plus licenses assumed for customers using VMware environments. A base price of $3,495 per licenses
and $874 for 1 year support and subscription assumed as per the published prices from VMware here.
l KVM is free software released under the GPL as described here. Vendors like RedHat offer KVM hypervisor under a subscription
model that includes product access, all updates, and support. Details can be found here.
l Xen hypervisor is covered by the GNU general public license as described here and available for free. Vendors like Citrix offer a free
and paid version of XenServer. Details can be found here.
l Software licenses and maintenance are discounted by 25% off the publically available list prices.
l The Linux distributions used in our model are available for free as described here. Our model doesn ’ t use the paid Linux distributions
like SUSE Enterprise Linux and Red Hat Enterprise Linux.
3. Storage
l Our model assumes RAID 10 configurations for on-premises and colocation storage. RAID 10 details are available here.
l Hard disk manufacturers measure drive capacity differently than operating systems. Hard disk manufacturers use a “base-10”
measure, whereas operating systems use a “base-2 ” measure as described here. This mismatch causes a 7% penalty on the disk capacity.
l Raw capacity is defined as the disk capacity in the box or frame while usable capacity is the disk capacity after RAID protection and
available for host allocation.
l Average Solid State Devices (SSD) and Hard Disk Drives (HDD) price per GB available here. Our model assumes higher prices as we
include the price of Host Bus Adapters (HBA), Fiber Channel Adapters, Optical or Fiber Channel Cables and other storage equipment.
l A discount of 50% is applied by default to the SSD and HDD price per GB.
l Assumed that a storage admin manages 1000 TB of data on an annual basis.
l Assumed that a single storage rack contains 200 TB of disks.
l Assumed LTO-5 tapes used for backups. Details available here.
l A base price of $1800/drive assumed for the cost of LTO-5 drive taking tapes of up to 1.5 TB true (uncompressed) capacity as per the
published price here.
l Assumed a media-rotation policy for backups whereas incremental backups are taken once at month end.
4. Network
l Assume a 20% network overhead for on-premises environments. The network overhead is calculated by taking a 20% overhead on
server and rack hardware cost.
l For a colocation facility, no network overhead is assumed as colocation providers would bundle this cost in their prices.
l Traffic in the data center assumed to be both north-south (between servers inside the data center and end points outside the data
center) and east-west (between components in the data center). Assumed 70% of all data center traffic is “east-west ” .
l For on-premises environment, Bandwidth costs also include cost of WAN Optimizers and MPLS VPN.
l Average colocation bandwidth pricing is tiered – our model assumes $30/Mbps at the lowest tier and $7/Mbps at the highest tier. More
details can be found here.
l Average network admin effort is around 8% of total IT administration effort as per this report.
5. Power and Cooling
l Average Retail Price of Electricity in the US can be found here.
l The average cents per kilowatt-hour in the US commercial segment for January 2014 was 10.34.
l Assume a standard on-premises/colocation PUE of 1.5 and a base kWh (kilo watt hour) price of 10 cents/hr. This gives us a total
electricity charge of 15 cents per kWh (10*1.5).
6. Data Center Space
l Average wholesale colocation asking price in the US in Q2 2013 is $150/kW/month as per the published report here.
l Model assumes colocation providers charge a fixed $ per kW rate that covers the cost of all power and space contracted. Every rack
assumed to have a primary and redundant power supply.
l The model assumes a separate charge for space, power and cooling for on-premises environments.
7. IT Labor
l Average Data center admin salaries by region available here.
AWS Assumptions
1. Compute
l Both On-Demand and 3 Yr. Reserved Instance types used for AWS compute. All three Reserved Instance types (Light, Medium, and
Heavy Utilization Reserved Instances) used in the model depending on the actual instance usage.
l EC2 instances are matched with on-premises servers and VMs based on CPU, RAM, or Disk I/O.
l The number of EC2 instances is the same as the physical servers or VMs on-premises meaning we don ’ t apply any cost optimization
on AWS side. In real- life situations, customers would change instance sizes up or down based on monitoring various AWS resource metrics like CPU utilization, free memory, or disk usage.
l Amazon EC2 provides a wide selection of instance types optimized to fit different use cases. Our model uses General purpose,
Compute-optimized, Memory-optimized, and Storage-optimized instances.
l Model uses only the current generation of instances- General purpose (m3), Compute-optimized (c3), and Storage-optimized (I2).
l Current generation of instances provide faster, newer Intel Ivy Bridge processors, SSD-based instance storage, Higher performance
Enhance Networking, and advanced features such as support for HVM AMIs, AVX and XSAVE flags.
l Model assumes Reserved Instance volume discounts as described here.
2. Storage
l On-premises SAN and NAS storage systems are represented in AWS as EBS volumes.
l On-premises Object storage is represented in AWS as S3.
l S3 offers multiple storage classes – S3 Standard, RRS, and Glacier depending on how S3 handles data. Our model assumes S3
standard only.
l Model assumes RAID 0 for EBS volumes as described here.
l Multiple EBS volumes can be stripped together to achieve up to 48,000 IOPS when attached to larger EC2 instances as described here.
l For backup, we use EBS snapshots to S3 for calculating backup costs on AWS.
l Backup%/month is the amount of data that changes every month. So a 50% number means that 50% of data changes every month and
is backed up.
l Model calculates EBS-optimized instance cost separately, but doesn ’ t add it to the total storage cost.
3. Network
l Model assumes publically available Data Transfer OUT tiered rates From Amazon EC2 to Internet as described here.
l Model assumes no data transfer happens from Amazon S3 to internet
4. IT Labor
l Model assumes that an IT admin can manage 400 EC2 instances.
5. AWS Support
l Model assumes Business- level support for AWS as described here.
METHODOLOGY
ASSUMPTIONS

Total Cost of Ownership (TCO) : On-Premises vs. AWS
© 2008- 2014, Amazon Web Services, Inc. or its affiliates. All rights reserved.5/24/2014 Page 14 of 16
The AWS TCO calculator uses the following methodology when calculating on-premises, colocation, and AWS costs.
Our methodology defines Total Cost of Ownership (TCO) as below –
TCO = Acquisition Costs + Operational Costs
Operational costs include labor cost to manage the data center operations as well as overhead cost associated with running the data center equipment. A standard 3 year time frame is used for our calculations as the useful life for the data center equipment.
The following graphic shows the major cost categories in on-premises and colocation environments
For On-Premises/Colocation, TCO = Server Costs + Storage Costs + Network Costs + IT Labor Costs
For on-premises and colocation environments, each of the major cost categories (server, storage, and network) include the cost of hardware, software (where applicable), and overhead costs. Overhead costs include the cost of data center floor space, and power
and cooling required for data center equipment. For our calculations, a “standard rack” is considered to be the typical 19 inch rack that
has a rack footprint of 28 sq. ft. (actual area covered by the rack) in the data center. Additionally, we assume average power density per rack to be 10kW in an on-premises data center and a cabinet to have a primary 20 amp, 120V single phase circuit and a redundant
20 amp, 120V circuit in a colocation environment. We use Uptime institute cost model to calculate overhead costs for on-premises and a
publically available price quote from a global colocation, interconnection, and managed IT infrastructure service provider for colocation environment.Since power and cooling expenses are billed on a monthly basis, we calculate our overhead costs on a monthly basis. We
also use a “standard rack ” as a common point for calculating overhead costs.
For On-Premises and Colocation environments, the $/rack/month is calculated differently -
As shown above, the logic by which the overhead cost is calculated for on-premises and colocation environments is different. Most of
the other cost categories are handled similarly between these environments. On the network side, a colocation environment incurs
recurring bandwidth costs where as an on-premises environment also incurs network capital expense and network operation expense.
Finally, on AWS side overhead costs is included in the publically listed prices and customers don ’ t have to pay extra for space, power,
and cooling as shown below.
The AWS TCO calculator makes the following assumptions for on-premises, co- location, and AWS environments.
On-Premises and Co-location Assumptions
1. Servers and Racks:
l On-premises and co- location server prices are based on Dell PowerEdge Rack servers and HP ProLiant Rack servers.
l On-premises and co- location server prices are based on Dell PowerEdge Rack servers and HP ProLiant Rack servers.
l Dell PowerEdge prices available here.
l HP ProLiant Rack servers prices available here.
l Servers can be physical or virtualized. Customers can choose VMware vSphere, Microsoft Hyper-V, KVM or Xen as their hypervisor
of choice.
l For virtualized environments, two virtualization host configurations are supported –
l Host 1 - 2 processors with 6 cores each and 96 GB RAM. Details are provided below.
l Host 2 – 4 processors with 6 cores each and 256 GB RAM
l VM density is calculated based on the virtual RAM and virtual cores allocated to VMs (more details in the methodology section).
l Server and rack hardware are discounted by 25% off the publically available list prices.
l A “standard rack ” is considered to be the typical 19 inch rack that has a rack footprint (actual area covered by the rack) in the data
center as defined here. Standard rack assumed to consist of 42 rack units (42U).
l On average each rack is filled up to 75% of capacity (i.e. for a 42U rack, 32U is actually used)
l Dell PowerEdge Energy Smart 4620S Rack Enclosure used to hold data center equipment. A base price of $3,499 assumed as per the
published price here.
l Every rack consists of two top of rack Switches (ToR) for Redundancy. Cisco Catalyst 2960 48 port switches used in calculations
with the following configuration- 48 x 10/100/1000 - PoE+ 525Watt + 4 x SFP, LAN Base Layer 2. A base price of $6,895 assumed for
Cisco switch as per the published price here.
l Every rack consists of 2 Power Distribution Units (PDU) for high-availability. APC Metered Rack PDU - power distribution strip used
with a base price of $545 as per the published price here.
l A 15% hardware maintenance/year applied to the server and rack hardware. More details are provided below.
l 5% of all server capacity assumed to be hot spare servers. A hot spare or hot standby is used as a failover mechanism to provide
reliability and high-availability in data center environments.
2. Software
l VMware vSphere Enterprise Plus licenses assumed for customers using VMware environments. A base price of $3,495 per licenses
and $874 for 1 year support and subscription assumed as per the published prices from VMware here.
l KVM is free software released under the GPL as described here. Vendors like RedHat offer KVM hypervisor under a subscription
model that includes product access, all updates, and support. Details can be found here.
l Xen hypervisor is covered by the GNU general public license as described here and available for free. Vendors like Citrix offer a free
and paid version of XenServer. Details can be found here.
l Software licenses and maintenance are discounted by 25% off the publically available list prices.
l The Linux distributions used in our model are available for free as described here. Our model doesn ’ t use the paid Linux distributions
like SUSE Enterprise Linux and Red Hat Enterprise Linux.
3. Storage
l Our model assumes RAID 10 configurations for on-premises and colocation storage. RAID 10 details are available here.
l Hard disk manufacturers measure drive capacity differently than operating systems. Hard disk manufacturers use a “base-10”
measure, whereas operating systems use a “base-2 ” measure as described here. This mismatch causes a 7% penalty on the disk capacity.
l Raw capacity is defined as the disk capacity in the box or frame while usable capacity is the disk capacity after RAID protection and
available for host allocation.
l Average Solid State Devices (SSD) and Hard Disk Drives (HDD) price per GB available here. Our model assumes higher prices as we
include the price of Host Bus Adapters (HBA), Fiber Channel Adapters, Optical or Fiber Channel Cables and other storage equipment.
l A discount of 50% is applied by default to the SSD and HDD price per GB.
l Assumed that a storage admin manages 1000 TB of data on an annual basis.
l Assumed that a single storage rack contains 200 TB of disks.
l Assumed LTO-5 tapes used for backups. Details available here.
l A base price of $1800/drive assumed for the cost of LTO-5 drive taking tapes of up to 1.5 TB true (uncompressed) capacity as per the
published price here.
l Assumed a media-rotation policy for backups whereas incremental backups are taken once at month end.
4. Network
l Assume a 20% network overhead for on-premises environments. The network overhead is calculated by taking a 20% overhead on
server and rack hardware cost.
l For a colocation facility, no network overhead is assumed as colocation providers would bundle this cost in their prices.
l Traffic in the data center assumed to be both north-south (between servers inside the data center and end points outside the data
center) and east-west (between components in the data center). Assumed 70% of all data center traffic is “east-west ” .
l For on-premises environment, Bandwidth costs also include cost of WAN Optimizers and MPLS VPN.
l Average colocation bandwidth pricing is tiered – our model assumes $30/Mbps at the lowest tier and $7/Mbps at the highest tier. More
details can be found here.
l Average network admin effort is around 8% of total IT administration effort as per this report.
5. Power and Cooling
l Average Retail Price of Electricity in the US can be found here.
l The average cents per kilowatt-hour in the US commercial segment for January 2014 was 10.34.
l Assume a standard on-premises/colocation PUE of 1.5 and a base kWh (kilo watt hour) price of 10 cents/hr. This gives us a total
electricity charge of 15 cents per kWh (10*1.5).
6. Data Center Space
l Average wholesale colocation asking price in the US in Q2 2013 is $150/kW/month as per the published report here.
l Model assumes colocation providers charge a fixed $ per kW rate that covers the cost of all power and space contracted. Every rack
assumed to have a primary and redundant power supply.
l The model assumes a separate charge for space, power and cooling for on-premises environments.
7. IT Labor
l Average Data center admin salaries by region available here.
AWS Assumptions
1. Compute
l Both On-Demand and 3 Yr. Reserved Instance types used for AWS compute. All three Reserved Instance types (Light, Medium, and
Heavy Utilization Reserved Instances) used in the model depending on the actual instance usage.
l EC2 instances are matched with on-premises servers and VMs based on CPU, RAM, or Disk I/O.
l The number of EC2 instances is the same as the physical servers or VMs on-premises meaning we don ’ t apply any cost optimization
on AWS side. In real- life situations, customers would change instance sizes up or down based on monitoring various AWS resource metrics like CPU utilization, free memory, or disk usage.
l Amazon EC2 provides a wide selection of instance types optimized to fit different use cases. Our model uses General purpose,
Compute-optimized, Memory-optimized, and Storage-optimized instances.
l Model uses only the current generation of instances- General purpose (m3), Compute-optimized (c3), and Storage-optimized (I2).
l Current generation of instances provide faster, newer Intel Ivy Bridge processors, SSD-based instance storage, Higher performance
Enhance Networking, and advanced features such as support for HVM AMIs, AVX and XSAVE flags.
l Model assumes Reserved Instance volume discounts as described here.
2. Storage
l On-premises SAN and NAS storage systems are represented in AWS as EBS volumes.
l On-premises Object storage is represented in AWS as S3.
l S3 offers multiple storage classes – S3 Standard, RRS, and Glacier depending on how S3 handles data. Our model assumes S3
standard only.
l Model assumes RAID 0 for EBS volumes as described here.
l Multiple EBS volumes can be stripped together to achieve up to 48,000 IOPS when attached to larger EC2 instances as described here.
l For backup, we use EBS snapshots to S3 for calculating backup costs on AWS.
l Backup%/month is the amount of data that changes every month. So a 50% number means that 50% of data changes every month and
is backed up.
l Model calculates EBS-optimized instance cost separately, but doesn ’ t add it to the total storage cost.
3. Network
l Model assumes publically available Data Transfer OUT tiered rates From Amazon EC2 to Internet as described here.
l Model assumes no data transfer happens from Amazon S3 to internet
4. IT Labor
l Model assumes that an IT admin can manage 400 EC2 instances.
5. AWS Support
l Model assumes Business- level support for AWS as described here.
METHODOLOGY
ASSUMPTIONS

Total Cost of Ownership (TCO) : On-Premises vs. AWS
© 2008- 2014, Amazon Web Services, Inc. or its affiliates. All rights reserved.5/24/2014 Page 15 of 16
1. What is the purpose of the AWS TCO calculator?
You can use the AWS TCO calculator to compare the cost of running your applications in an on-premises or colocation environment to
AWS. The tool produces a detailed cost comparison with AWS based on the infrastructure details you provide.
2. What assumptions do you make?
We make several assumptions based on third party analyst and industry research as well as data from hundreds of AWS customers.
Please refer to the Assumptions section of the TCO output page.
3. What is the difference between an on-premises data center and colocation facility?
An on-premises data center is a brick and mortar structure that contains all the required systems / facilities to house computing infrastructure running 24 x 7 x 365. An on-premises data center is owned and operated by the owners of the computing infrastructure. A
colocation facility is usually offered by a provider that owns their own “data center ” and rents out rack space and/or computing hardware.
These environments have very different cost structures and your TCO for the same application would vary between these environments.
4. How are you calculating on-premises (or colocation) server infrastructure costs?
The calculator averages market rate pricing from multiple enterprise server vendors to determine an average price for a server based on
CPU, RAM, and storage configuration. In addition, the tool adds licensing cost for Operating System and virtualization licenses as well as rack infrastructure costs. Rack infrastructure costs include cost of power distribution units, top of rack switches, rack chassis and one-
time server deployment.
5. Do you apply any discount to on-premises (or colocation) server hardware, storage hardware, and software acquisition costs?
Yes, by default server hardware is discounted by 25%, Operating System and Virtualization licenses by 25% and storage hardware by
50%. These closely resemble industry standard pricing policy.
6. What types of storage are you using to compare?
On-premises Storage Area Network (SAN) and Network Attached Storage (NAS) are mapped to Amazon EBS, while on-premises object storage is mapped to Amazon S3. The amount of on-premises storage specified in the calculator input represents the amount of raw
physical storage capacity purchased. AWS storage that is calculated is not equal to the amount of raw physical storage capacity, but
rather a percentage of the storage that is actually utilized for on-premises data storage. Primary and secondary research indicates that this is ~50-60% of the raw physical storage purchased after taking into account RAID and Operating System overhead.
7. How are you calculating on-premises (or colocation) storage costs?
We are using industry standard pricing based on $ per raw GB purchase. We use a combination of Solid State Drives (SSD) and Hard Disk Drives (HDD); SSDs are used in case customers need higher IOPS for their on-premises/colocation environments. The tool uses RAID 10
configurations for on-premises and colocation storage. A discount of 50% is applied by default to the SSD and HDD price per GB.
8. How are you calculating on-premises network costs?
This is calculated as a percentage (20%) of server hardware acquisition cost. The network cost includes the cost for network interface cards, host bus adapters, core switches and other networking gear.
9. How are you calculating bandwidth costs?
We use a sampling of average market rates for data center telecom from major markets (typically measured in $/Mbps). Traffic in the data center is assumed to be both north-south (between servers inside the data center and end points outside the data center) and east-west
(between components in the data center). We also assume a high percentage of data center traffic (~70-80%) to be “east-west ”.
10. what is the overhead cost? How are you calculating it for on-premises and colocation environments?
Overhead costs include the cost of data center floor space, and power and cooling required for data center equipment. It can also include other ongoing data center expenses such as maintenance and physical security. For the sake of simplicity, we only consider data space,
power, and cooling when calculating overhead costs. The way overhead cost is calculated is different for on-premises and colocation
environments. We leverage the publically available Uptime institute ’s cost model to calculate overhead costs for on-premises data center and a price quote from a global colocation and interconnection infrastructure service provider for colocation environment. Since power and
cooling expenses are billed on a monthly basis, we calculate our overhead costs on a monthly basis. We also use a “standard rack” as a
common point for calculating overhead costs.
11. How do you calculate IT Labor costs?
You can specify the fully burdened cost of your IT admin resources. We leverage industry and third party analyst research for server:
admin ratios. For physical environments, we assume one FTE IT admin per 100 physical servers or 250 virtual machines. We use these
two variables and the rest of the inputs of the tool to calculate the percentage administrative cost. For storage, we assume a storage admin to manage 1 PB of storage annually and for network we assume network admin effort to be ~8% of the total IT admin effort.
12. How are the Amazon EC2 compute costs computed?
The tool automates the task of selecting the right AWS instance type based on the information you provide; you can input your physical or virtual infrastructure details and the tool will provide the equivalent AWS instance types that meet your requirements. The calculator uses
current generation Amazon EC2 instances (except GPU instances) to calculate AWS compute costs. The tool also takes into account your
on-premises usage/utilization rate. You can think of on-premises usage/utilization rate as the total desired uptime for your servers or VMs. For example, over a 3 year time-period, a 10% usage rate implies that your servers are running 10% of the time (or 3.6 months).
13. Why do you ask for usage/utilization rate?
If you don't need your on-premises VMs or physical servers up and running 24/7/365 you could save lot of money by powering off the
VM/servers when not used. AWS provides multiple pricing models to optimize your spend for variable or steady-state workloads. The calculator will let you change the usage % (uptime) and automatically select the right AWS pricing model that will meet that uptime at the
lowest price. If you don ’ t know your usage/utilization rate, the tool defaults to 100% (which means that your servers/VMs are running
24/7/365).
14. Why can ’t I run calculations with previous generation Amazon EC2 instances?
We encourage you to use the latest generation of Amazon EC2 instances to get the best price for performance ratio. The calculator uses
the current Amazon EC2 instances - M3, C3, R3, I2 and HS1 (and m1.small and t1.micro). You can find more details about the previous
generation Amazon EC2 instances here.
15. Do you use S3 Reduced Redundancy Storage and Amazon Glacier?
No, currently the tool only uses S3 standard. For backup of EBS data, the tool uses EBS Snapshots to Amazon S3 charges.
16. Are data transfer costs included in the AWS storage cost?
No, all AWS data transfer costs are included under the network charges for AWS. The data transfer cost is calculated based on the EC2 data transfer out from Amazon EC2 to the internet. Since the calculator doesn’ t assume cross-AZ deployments, it doesn’ t calculate data
transfer charges between Amazon EC2 instances in another Availability Zone in the same region.
17. What is the AWS server to admin ratio?
We have found a 400:1 Server to Admin ratio to be appropriate when running your apps on AWS. This is a conservative ratio based on AWS customer engagements. (Note: for on-premises we assume a 100:1 server admin ratio for physical servers and 250:1 ratio for virtual
machines)
FAQ

Total Cost of Ownership (TCO) : On-Premises vs. AWS
© 2008- 2014, Amazon Web Services, Inc. or its affiliates. All rights reserved.5/24/2014 Page 16 of 16
1. What is the purpose of the AWS TCO calculator?
You can use the AWS TCO calculator to compare the cost of running your applications in an on-premises or colocation environment to
AWS. The tool produces a detailed cost comparison with AWS based on the infrastructure details you provide.
2. What assumptions do you make?
We make several assumptions based on third party analyst and industry research as well as data from hundreds of AWS customers.
Please refer to the Assumptions section of the TCO output page.
3. What is the difference between an on-premises data center and colocation facility?
An on-premises data center is a brick and mortar structure that contains all the required systems / facilities to house computing infrastructure running 24 x 7 x 365. An on-premises data center is owned and operated by the owners of the computing infrastructure. A
colocation facility is usually offered by a provider that owns their own “data center ” and rents out rack space and/or computing hardware.
These environments have very different cost structures and your TCO for the same application would vary between these environments.
4. How are you calculating on-premises (or colocation) server infrastructure costs?
The calculator averages market rate pricing from multiple enterprise server vendors to determine an average price for a server based on
CPU, RAM, and storage configuration. In addition, the tool adds licensing cost for Operating System and virtualization licenses as well as rack infrastructure costs. Rack infrastructure costs include cost of power distribution units, top of rack switches, rack chassis and one-
time server deployment.
5. Do you apply any discount to on-premises (or colocation) server hardware, storage hardware, and software acquisition costs?
Yes, by default server hardware is discounted by 25%, Operating System and Virtualization licenses by 25% and storage hardware by
50%. These closely resemble industry standard pricing policy.
6. What types of storage are you using to compare?
On-premises Storage Area Network (SAN) and Network Attached Storage (NAS) are mapped to Amazon EBS, while on-premises object storage is mapped to Amazon S3. The amount of on-premises storage specified in the calculator input represents the amount of raw
physical storage capacity purchased. AWS storage that is calculated is not equal to the amount of raw physical storage capacity, but
rather a percentage of the storage that is actually utilized for on-premises data storage. Primary and secondary research indicates that this is ~50-60% of the raw physical storage purchased after taking into account RAID and Operating System overhead.
7. How are you calculating on-premises (or colocation) storage costs?
We are using industry standard pricing based on $ per raw GB purchase. We use a combination of Solid State Drives (SSD) and Hard Disk Drives (HDD); SSDs are used in case customers need higher IOPS for their on-premises/colocation environments. The tool uses RAID 10
configurations for on-premises and colocation storage. A discount of 50% is applied by default to the SSD and HDD price per GB.
8. How are you calculating on-premises network costs?
This is calculated as a percentage (20%) of server hardware acquisition cost. The network cost includes the cost for network interface cards, host bus adapters, core switches and other networking gear.
9. How are you calculating bandwidth costs?
We use a sampling of average market rates for data center telecom from major markets (typically measured in $/Mbps). Traffic in the data center is assumed to be both north-south (between servers inside the data center and end points outside the data center) and east-west
(between components in the data center). We also assume a high percentage of data center traffic (~70-80%) to be “east-west ”.
10. what is the overhead cost? How are you calculating it for on-premises and colocation environments?
Overhead costs include the cost of data center floor space, and power and cooling required for data center equipment. It can also include other ongoing data center expenses such as maintenance and physical security. For the sake of simplicity, we only consider data space,
power, and cooling when calculating overhead costs. The way overhead cost is calculated is different for on-premises and colocation
environments. We leverage the publically available Uptime institute ’s cost model to calculate overhead costs for on-premises data center and a price quote from a global colocation and interconnection infrastructure service provider for colocation environment. Since power and
cooling expenses are billed on a monthly basis, we calculate our overhead costs on a monthly basis. We also use a “standard rack” as a
common point for calculating overhead costs.
11. How do you calculate IT Labor costs?
You can specify the fully burdened cost of your IT admin resources. We leverage industry and third party analyst research for server:
admin ratios. For physical environments, we assume one FTE IT admin per 100 physical servers or 250 virtual machines. We use these
two variables and the rest of the inputs of the tool to calculate the percentage administrative cost. For storage, we assume a storage admin to manage 1 PB of storage annually and for network we assume network admin effort to be ~8% of the total IT admin effort.
12. How are the Amazon EC2 compute costs computed?
The tool automates the task of selecting the right AWS instance type based on the information you provide; you can input your physical or virtual infrastructure details and the tool will provide the equivalent AWS instance types that meet your requirements. The calculator uses
current generation Amazon EC2 instances (except GPU instances) to calculate AWS compute costs. The tool also takes into account your
on-premises usage/utilization rate. You can think of on-premises usage/utilization rate as the total desired uptime for your servers or VMs. For example, over a 3 year time-period, a 10% usage rate implies that your servers are running 10% of the time (or 3.6 months).
13. Why do you ask for usage/utilization rate?
If you don't need your on-premises VMs or physical servers up and running 24/7/365 you could save lot of money by powering off the
VM/servers when not used. AWS provides multiple pricing models to optimize your spend for variable or steady-state workloads. The calculator will let you change the usage % (uptime) and automatically select the right AWS pricing model that will meet that uptime at the
lowest price. If you don ’ t know your usage/utilization rate, the tool defaults to 100% (which means that your servers/VMs are running
24/7/365).
14. Why can ’t I run calculations with previous generation Amazon EC2 instances?
We encourage you to use the latest generation of Amazon EC2 instances to get the best price for performance ratio. The calculator uses
the current Amazon EC2 instances - M3, C3, R3, I2 and HS1 (and m1.small and t1.micro). You can find more details about the previous
generation Amazon EC2 instances here.
15. Do you use S3 Reduced Redundancy Storage and Amazon Glacier?
No, currently the tool only uses S3 standard. For backup of EBS data, the tool uses EBS Snapshots to Amazon S3 charges.
16. Are data transfer costs included in the AWS storage cost?
No, all AWS data transfer costs are included under the network charges for AWS. The data transfer cost is calculated based on the EC2 data transfer out from Amazon EC2 to the internet. Since the calculator doesn’ t assume cross-AZ deployments, it doesn’ t calculate data
transfer charges between Amazon EC2 instances in another Availability Zone in the same region.
17. What is the AWS server to admin ratio?
We have found a 400:1 Server to Admin ratio to be appropriate when running your apps on AWS. This is a conservative ratio based on AWS customer engagements. (Note: for on-premises we assume a 100:1 server admin ratio for physical servers and 250:1 ratio for virtual
machines)
FAQ