toshiba tec announced its fy2015 business results on may 20, …€¦ · © 2016 toshiba tec...
TRANSCRIPT
© 2016 Toshiba Tec Corporation 1
Toshiba Tec announced its FY2015 Business Results on May 20, 2016. However, on June 23, 2016, Toshiba Tec corrected certain parts of those results. For the reasons for the corrections, please refer to “(Corrections/Corrections of Numerical Data) Notice Regarding Partial Corrections of ‘Summary of Consolidated Financial Results for the Year Ended March 31, 2016 (Based on Japanese GAAP)’” announced on June 23, 2016. This document contains the corrected version of the FY 2015 Business Results announced on May 20, 2016. The
corrected parts are underlined.

© 2016 Toshiba Tec Corporation
FY2015 Consolidated Business Results
May 20, 2016
3 © 2016 Toshiba Tec Corporation
1.FY2015 Consolidated Business Results
2.FY2016 Forecast
3.Overseas Retail Business

4 © 2016 Toshiba Tec Corporation
Net Sales: 532.8 billion yen (YoY: +8.2 billion yen)
Increased by 2% over the previous year primarily due to the increase in the overseas
printing business and foreign exchange gains.
Operating Income: 1.6 billion yen (YoY: △15.5 billion yen)
The operating loss in the overseas retail business (GCS) continued and the revaluation of
sales inventories were added, resulting in a lower income by 15.5 billion yen against the
previous year.
Net Loss: △103.4 billion yen (YoY: △102.3 billion yen)
Decreased by 102.3 billion yen due to the drop in operating income and the 84.6 billion
yen impairment loss of GCS assets.
The impairment was recorded in FY2015 for the entire fixed assets and goodwill of GCS.
Dividend
The annual dividend is 0 yen as previously forecasted.
(Note) GCS: Toshiba Global Commerce Solutions
Key Points of FY2015 Business Results
Although Net Sales increased over the previous year owing to the foreign exchange rate gain, the operating loss in the overseas retail business (GCS) continued for the full year and the revaluation of sales inventories were added, resulting in a lower income by 15.5 billion yen against the previous year.
An additional impairment loss for the GCS business of 18.8 billion yen was booked in 4Q as a result of the review of GCS’s business plan.

© 2016 Toshiba Tec Corporation 5
FY2015 Results
FY2015 FY2014 Difference
Actual Actual vs. FY2014
Net Sales 532.8 524.6 +8.2
(Growth rate) (102%)
Operating Income 1.6 17.1 △15.5
(Rate of sales) (0.3%) (3.3%) (△3.0%)
Ordinary Income (Loss) △2.3 10.4 △12.7
(Rate of sales) (△0.4%) (2.0%) (△2.4%)
Income (Loss) before income taxes and minority interests △89.1 9.7 △98.8
(Rate of sales) (△16.7%) (1.9%) (△18.6%)
Loss attributable to owners of parent △103.4 △1.1 △102.3
(Rate of sales) (△19.4%) (△0.2%) (△19.2%)
Foreign currency exchange rate
US$ 120.77 109.16 +11.61
EUR 132.74 139.43 △6.69
(Billions of Yen)
6 © 2016 Toshiba Tec Corporation
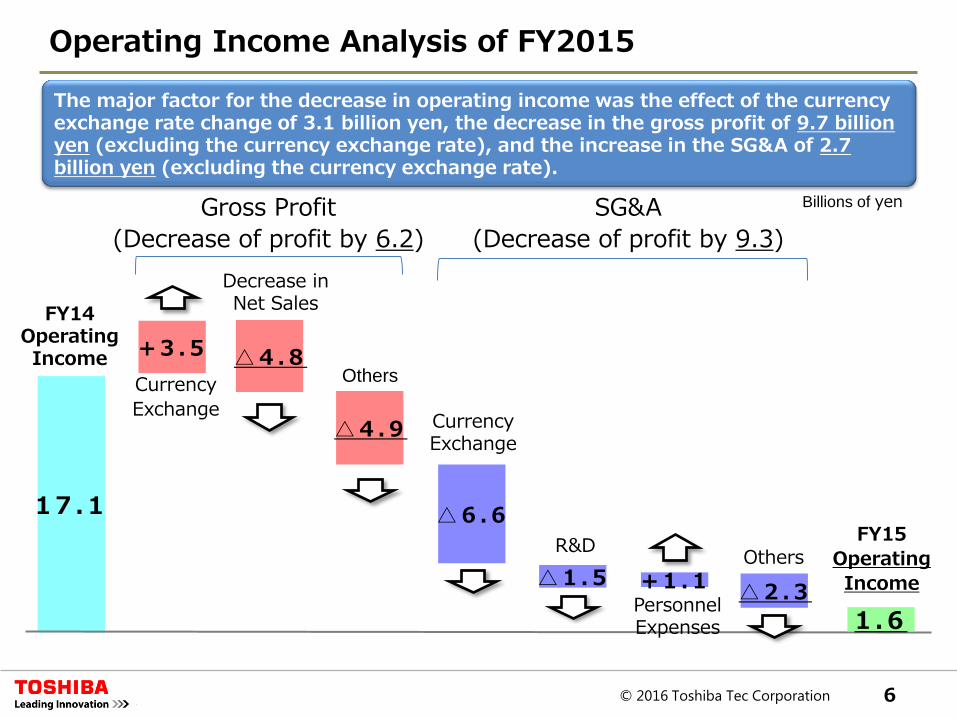
Operating Income Analysis of FY2015
FY14 Operating Income
1 7 .1
+ 3 . 5
Currency
Exchange
△ 4 . 8
Decrease in Net Sales
Others
△ 4 . 9 Currency Exchange
△ 6 . 6
R&D
△ 1 . 5
Billions of yen
Personnel Expenses
+ 1 . 1
1 .6
FY15
Operating
Income
Gross Profit
(Decrease of profit by 6.2)
SG&A
(Decrease of profit by 9.3)
Others
△ 2 . 3
The major factor for the decrease in operating income was the effect of the currency exchange rate change of 3.1 billion yen, the decrease in the gross profit of 9.7 billion yen (excluding the currency exchange rate), and the increase in the SG&A of 2.7 billion yen (excluding the currency exchange rate).
© 2016 Toshiba Tec Corporation 7
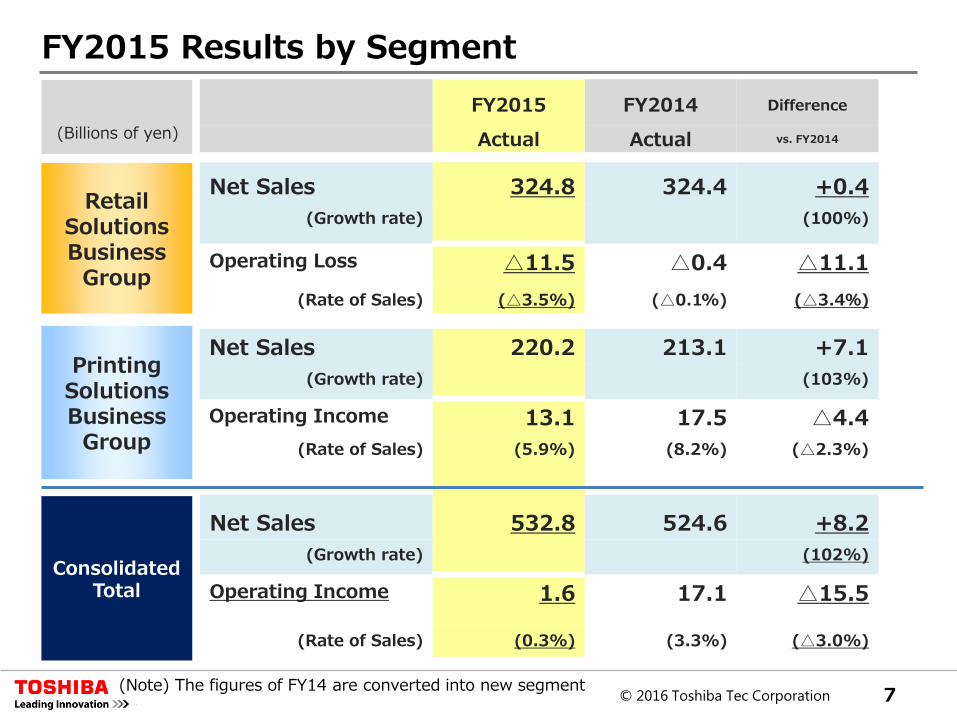
Net Sales 220.2 213.1 +7.1
(Growth rate) (103%)
Operating Income 13.1 17.5 △4.4
(Rate of Sales) (5.9%) (8.2%) (△2.3%)
Net Sales 324.8 324.4 +0.4
(Growth rate) (100%)
Operating Loss △11.5 △0.4 △11.1
(Rate of Sales) (△3.5%) (△0.1%) (△3.4%)
Retail Solutions Business
Group
Printing Solutions Business
Group
Net Sales 532.8 524.6 +8.2
(Growth rate) (102%)
Operating Income 1.6 17.1 △15.5
(Rate of Sales) (0.3%) (3.3%) (△3.0%)
Consolidated Total
FY2015 FY2014 Difference
Actual Actual vs. FY2014 (Billions of yen)
FY2015 Results by Segment
(Note) The figures of FY14 are converted into new segment

© 2016 Toshiba Tec Corporation 8
Net Sales 324.8 324.4 +0.4
(Growth rate) (100%)
Operating Loss △11.5 △0.4 △11.1
(Rate of Sales) (△3.5%) (△0.1%) (△3.4%)
Retail Solutions Business
Group
FY2015 FY2014 Difference
Actual Actual vs. FY2014 (Billions of yen)
Retail Solutions Business Group
◆ POS system for Japanese market, etc. The wait-and-see attitude for the new roll-out plan continued at retailers and restaurants. In spite of the sales growth in self check-out/order systems, net sales to specialty stores and shopping centers decreased from the previous year.
◆ POS system for overseas markets, etc. Although demand in the overseas retail market was weak, net sales increased over the previous year due to the exchange rate gains.

© 2016 Toshiba Tec Corporation 9
Retail Solutions Business Group:vs. Forecast dated Mar.14
<Changed points of forecast for overseas retail business> ①Major reason for revision dated May 12 (△3.8 billion yen)
Write-down of software products (TCxGravity) Cancellation from new customers ⇨ Close inspection of other customers ⇨ Review of business plan
Deterioration of gross margin Decrease in sales, delay in cost reduction, deterioration of gross margin on certain project
Others Delay in reduction of fixed expenses in the current overseas retail business ②Major reason for revision dated May 20 (△2.7 billion yen)
Revaluation of sales inventory for H/W products POS terminals and peripherals (printer, drawer, display etc.) ③Major reason for revision dated June 23 (+2.1 billion yen)
Correction of errors relating to accounts payable-trade and accounts payable-other Correction of errors relating to sales Correction of errors relating to inventory valuation amounts
Net Sales 324.8 322.0 +2.8
Operating Loss △11.5 △7.0 △4.5
(Rate of Sales) (△3.5%) (△2.2%) (△1.3%)
Retail Solutions Business
Group
FY2015 FY2015 Difference
Actual Forecast (Mar.14) vs. Forecast (Billions of yen)

© 2016 Toshiba Tec Corporation 10
Retail Solutions Business Group:Additional impairment on TGCS
<Detail of additional impairment> The sales plan of software product (TCxGravity) was revised as a result of the review of the project.
The review of the GCS business plan was conducted taking into account the business results of the 2nd half of FY2015 and the latest business environment.
Impairment recorded in 2Q/E
Asset write-down ¥69.6 billion ($571million) Depreciation △¥3.8 billion (Goodwill) Impairment Amount ¥65.8 billion
Additional impairment recorded in 4Q/E
Asset write-down $157 million
Impairment Amount ¥18.8 billion

© 2016 Toshiba Tec Corporation 11
Net Sales 220.2 213.1 +7.1
(Growth rate) (103%)
Operating Income 13.1 17.5 △4.4
(Rate of Sales) (5.9%) (8.2%) (△2.3%)
Printing Solutions Business
Group
FY2015 FY2014 Difference
Actual Actual vs. FY2014 (Billions of yen)
Printing Solutions Business Group
◆ MFP for overseas market, etc. Net sales in the Americas and Europe were flat but grew in Asian countries owing to the acquisition of new subsidiaries in Malaysia and Thailand. Including the currency exchange gains, sales in the Americas and Asian countries increased but decreased in Europe. Total sales increased by 103% over the previous year.
12 © 2016 Toshiba Tec Corporation
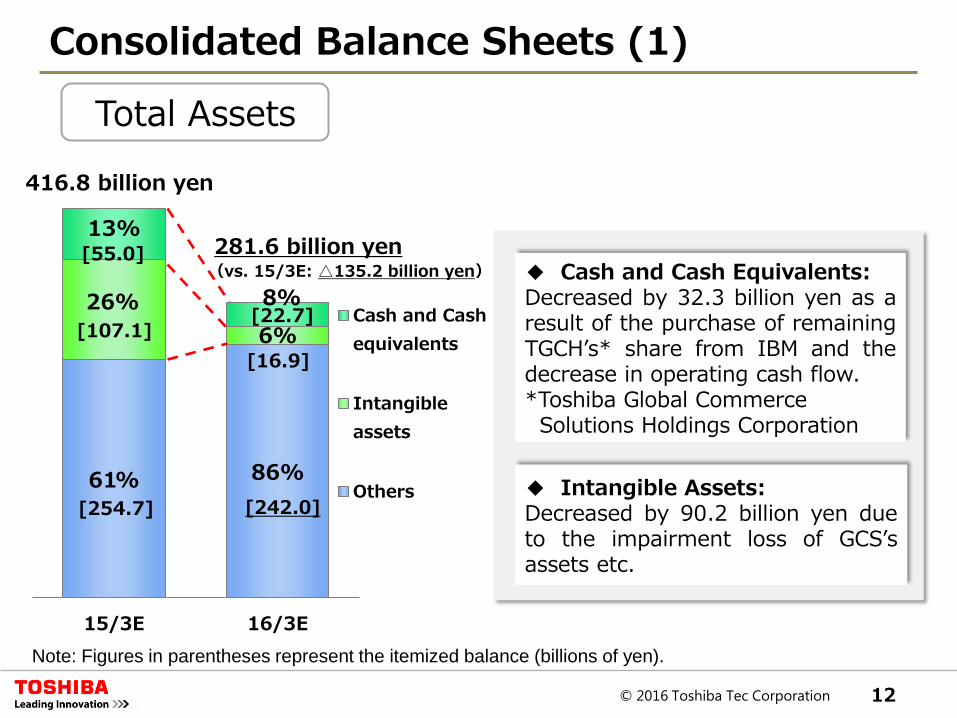
Total Assets
Consolidated Balance Sheets (1)
61% 86%
26%
6%
13%
8%
15/3E 16/3E
Cash and Cash
equivalents
Intangible
assets
Others
416.8 billion yen
[55.0]
[22.7] [107.1]
[16.9]
[254.7] [242.0]
◆ Cash and Cash Equivalents: Decreased by 32.3 billion yen as a result of the purchase of remaining TGCH’s* share from IBM and the decrease in operating cash flow. *Toshiba Global Commerce Solutions Holdings Corporation
◆ Intangible Assets: Decreased by 90.2 billion yen due to the impairment loss of GCS’s assets etc.
Note: Figures in parentheses represent the itemized balance (billions of yen).
281.6 billion yen (vs. 15/3E: △135.2 billion yen)
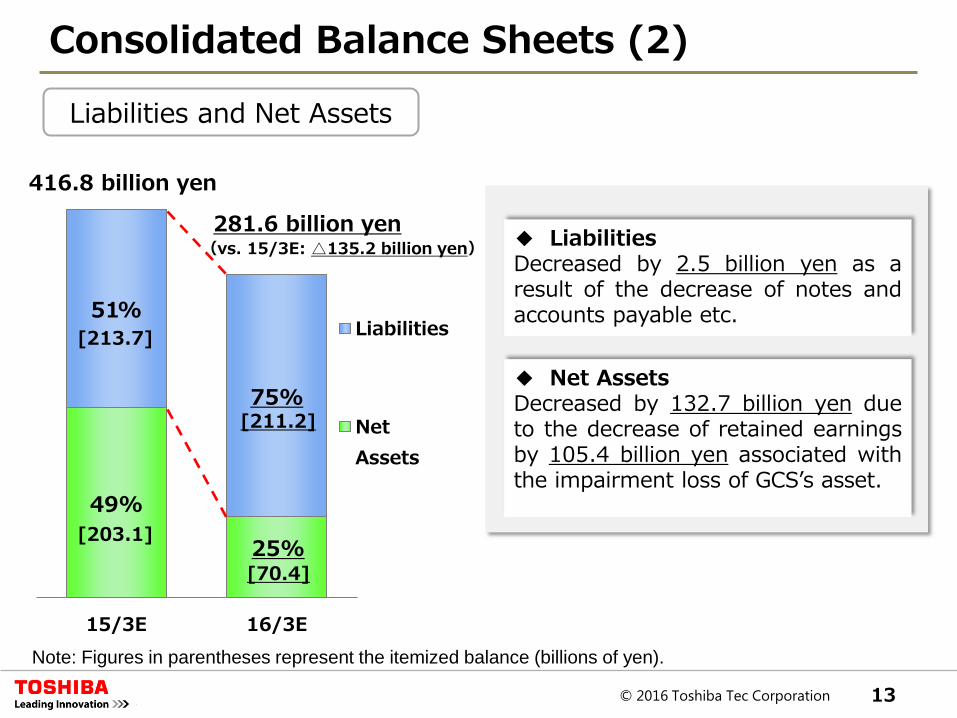
13 © 2016 Toshiba Tec Corporation
Liabilities and Net Assets
49%
25%
51%
75%
15/3E 16/3E
Liabilities
Net
Assets
281.6 billion yen (vs. 15/3E: △135.2 billion yen)
416.8 billion yen
Consolidated Balance Sheets (2)
[203.1]
[213.7]
[211.2]
[70.4]
◆ Liabilities Decreased by 2.5 billion yen as a result of the decrease of notes and accounts payable etc.
◆ Net Assets Decreased by 132.7 billion yen due to the decrease of retained earnings by 105.4 billion yen associated with the impairment loss of GCS’s asset.
Note: Figures in parentheses represent the itemized balance (billions of yen).
14 © 2016 Toshiba Tec Corporation
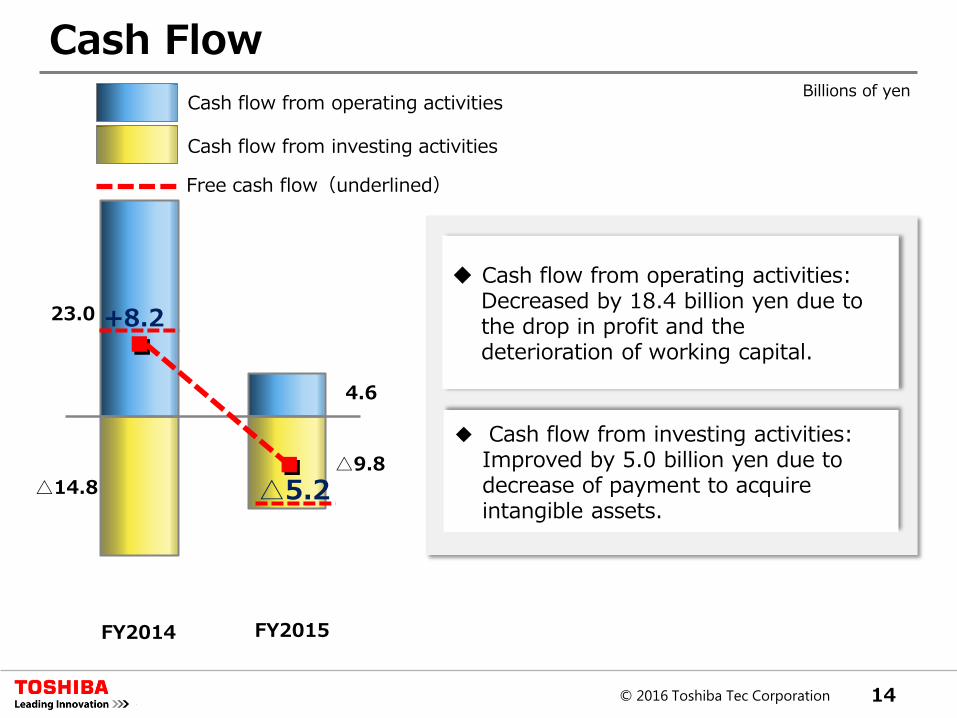
△14.8
23.0
4.6
△9.8
Cash Flow
Cash flow from operating activities
Cash flow from investing activities
Free cash flow(underlined)
+8.2
△5.2
FY2014 FY2015
Billions of yen
Cash flow from operating activities: Decreased by 18.4 billion yen due to the drop in profit and the deterioration of working capital.
◆ Cash flow from investing activities: Improved by 5.0 billion yen due to decrease of payment to acquire intangible assets.

15 © 2016 Toshiba Tec Corporation
1.FY2015 Consolidated Business Results
2.FY2016 Forecast
3.Overseas Retail Business

© 2016 Toshiba Tec Corporation 16
Key points of FY2016 Forecast
Net sales: 2 % decrease equivalent to a 3% increase in local currency basis Operating income:12.4 billion yen increase reflecting the improvement of GCS ‘s profitability Net income: Expected to turn positive at 0.5 billion yen
Net Sales: 520.0 billion yen(YoY △12.8 billion yen)
Net Sales in all the segments of domestic retail, overseas retail, and printing
are expected to grow in local currency. However, net sales in yen are expected to decrease by 29.0 billion yen due to the yen appreciation.
Operating Income: 14.0 billion yen (YoY +12.4 billion yen)
The profitability of the retail solutions business is expected to improve through
SG&A reduction and higher gross margin. For the printing solutions business, the currency exchange rate will effect negatively on profit by 3.0 billion yen.
Net Income: 0.5 billion yen (YoY +103.9 billion yen)
A net income of 0.5 billion yen is forecasted due to the structural reform cost and
a mixture of different tax rates applied to the GCS subsidiaries, globally operated in various countries, resulting in an irregularly high rate to the unprofitable GCS operation as a whole.

© 2016 Toshiba Tec Corporation 17
FY2016 FY2015 Difference
Forecast Actual vs. FY2015
Overall FY2016 Forecast
Net Sales 520.0 532.8 △12.8
(Achievement rate /Growth rate)
(98%)
Operating Income 14.0 1.6 +12.4
(Rate of sales) (2.7%) (0.3%) (+2.4%)
Ordinary Income (Loss) 10.0 △2.3 +12.3
(Rate of sales) (1.9%) (△0.4%) (+2.3%)
Income (Loss) attributable to owners of parent 0.5 △103.4 +103.9
(Rate of sales) (0.1%) (△19.4%) (+19.5%)
Foreign currency exchange rate
US$ 110.00 120.77 △10.77
EUR 125.00 132.74 △7.74
(Billions of Yen)

© 2016 Toshiba Tec Corporation 18
Net Sales 212.0 220.2 △8.2 (Achievement rate
/Growth rate) (96%)
Operating Income 10.0 13.1 △3.1
(Rate of Sales) (4.7%) (5.9%) (△1.2%)
Net Sales 322.0 324.8 △2.8 (Achievement rate
/Growth rate) (99%)
Operating Income (Loss) 4.0 △11.5 +15.5
(Rate of Sales) (1.2%) (△3.5%) (+4.7%)
Retail Solutions Business
Group
Printing Solutions Business
Group
Net Sales 520.0 532.8 △12.8 (Achievement rate
/Growth rate) (98%)
Operating Income 14.0 1.6 +12.4
(Rate of Sales) (2.7%) (0.3%) (+2.4%)
Consolidated Total
FY2016 FY2015 Difference
Forecast Actual vs. FY2015 (Billions of yen)
FY2016 Forecast by Segment
19 © 2016 Toshiba Tec Corporation
1.FY2015 Consolidated Business Results
2.FY2016 Forecasts
3.Overseas Retail Business
© 2016 Toshiba Tec Corporation 20
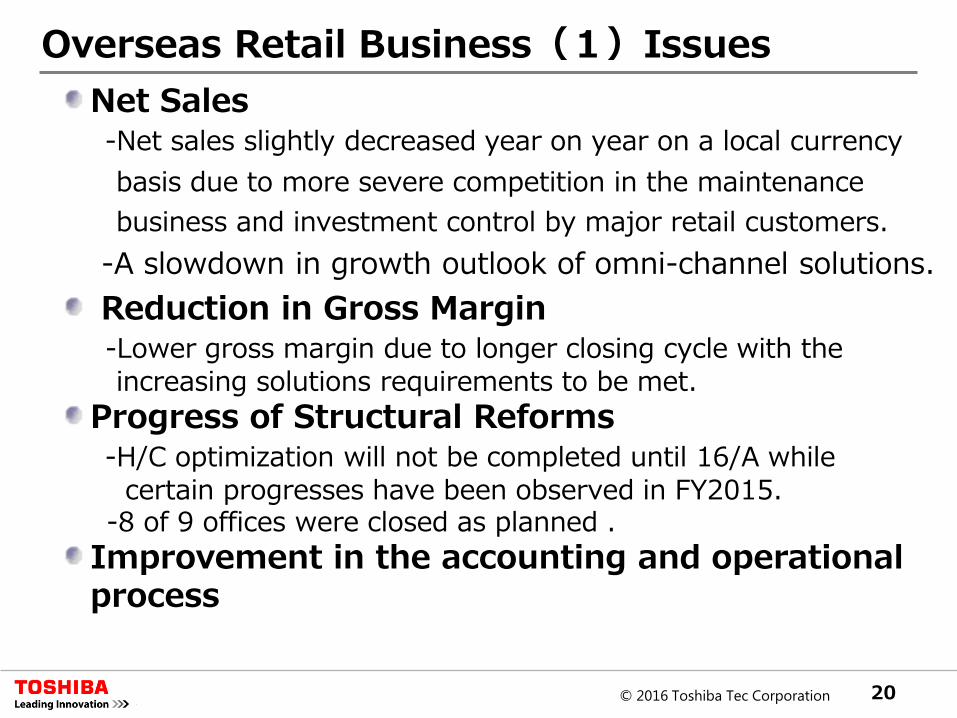
Overseas Retail Business(1)Issues
Net Sales -Net sales slightly decreased year on year on a local currency
basis due to more severe competition in the maintenance
business and investment control by major retail customers.
-A slowdown in growth outlook of omni-channel solutions.
Reduction in Gross Margin -Lower gross margin due to longer closing cycle with the increasing solutions requirements to be met.
Progress of Structural Reforms -H/C optimization will not be completed until 16/A while certain progresses have been observed in FY2015. -8 of 9 offices were closed as planned .
Improvement in the accounting and operational process

© 2016 Toshiba Tec Corporation 21
Overseas Retail Business(2)Measures
Improve Contribution Margin ratio by improving product mix
-Acquire new deals by utilizing the competitive lineup, such as self-service POS and local fit products. -Expand solutions business. -Enhance the menu of service maintenance
Improve Contribution Margin ratio by enhancing cost reduction
-Increase CR and service efficiency -Reduction in SCM (variable expenses) and outsourcing fees
Reduce Fixed Expense by promoting structural reforms
-Speed up the implementation of H/C optimization -Implement additional office closures -Utilize the back-office functions of the existing offices

© 2016 Toshiba Tec Corporation 22
SG&A(Other)
SG&A(R&D)
Gross Profit
GCS
OTHER
4.0
△11.5
FY2015 O/I
Actual
FY2016 O/I
Forecast
* Figures of O/I represents the total amount for Retail Solutions Business Group
Overseas Retail Business(3)Outlook
(Billions of yen)
Decrease of depreciation & amortization as a result of
FY2015 transactions
23 © 2016 Toshiba Tec Corporation
Forward-looking statements concerning TOSHIBA TEC's future
performance contained in this presentation represent certain
reasonable assumptions based on economic, financial and
competitive data and information currently available. However,
actual results will be affected by the business and competitive
environment and may differ materially from forecasts.

24 © 2016 Toshiba Tec Corporation