toronto hydro productivity studies - ontario energy board
TRANSCRIPT
Toronto Hydro yBenchmarking study
Presentation to OEB RRFE Performance Measurement and benchmarking Working groupbenchmarking Working group
Benny LaPianta, VP Grid ManagementAlex Bakulev, Manager Power System Planning and LogisticsJanuary, 2013
Toronto Hydro-Electric System Limited
A dAgenda
• Current OEB Benchmarking Model• Ontario and North America utility dataset• THESL North America benchmarking results• Next steps
Toronto Hydro-Electric System Limited2 | Agenda January 19, 2013
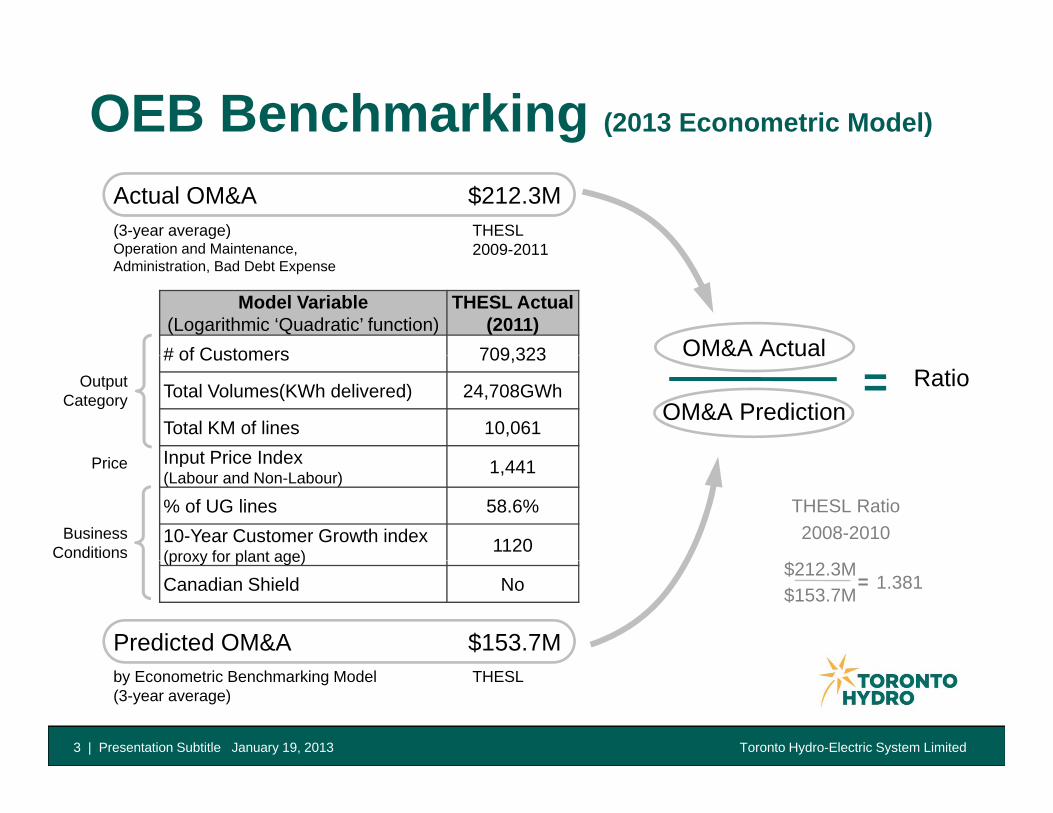
OEB Benchmarking (2013 Econometric Model)
Actual OM&A $212.3M(3-year average)Operation and Maintenance,
THESL 2009-2011
Model Variable (Logarithmic ‘Quadratic’ function)
THESL Actual(2011)
# of Customers 709 323 OM&A Actual
Operation and Maintenance, Administration, Bad Debt Expense
2009 2011
# of Customers 709,323
Total Volumes(KWh delivered) 24,708GWh
Total KM of lines 10,061Input Price Index
OM&A Actual
OM&A PredictionRatio=Output
Category
P i Input Price Index (Labour and Non-Labour) 1,441
% of UG lines 58.6%10-Year Customer Growth index(proxy for plant age) 1120
THESL Ratio2008-2010
Price
Business Conditions (proxy for plant age)
Canadian Shield No$212.3M$153.7M
1.381=
Predicted OM&A $153.7M
Toronto Hydro-Electric System Limited3 | Presentation Subtitle January 19, 2013
by Econometric Benchmarking Model(3-year average)
THESL
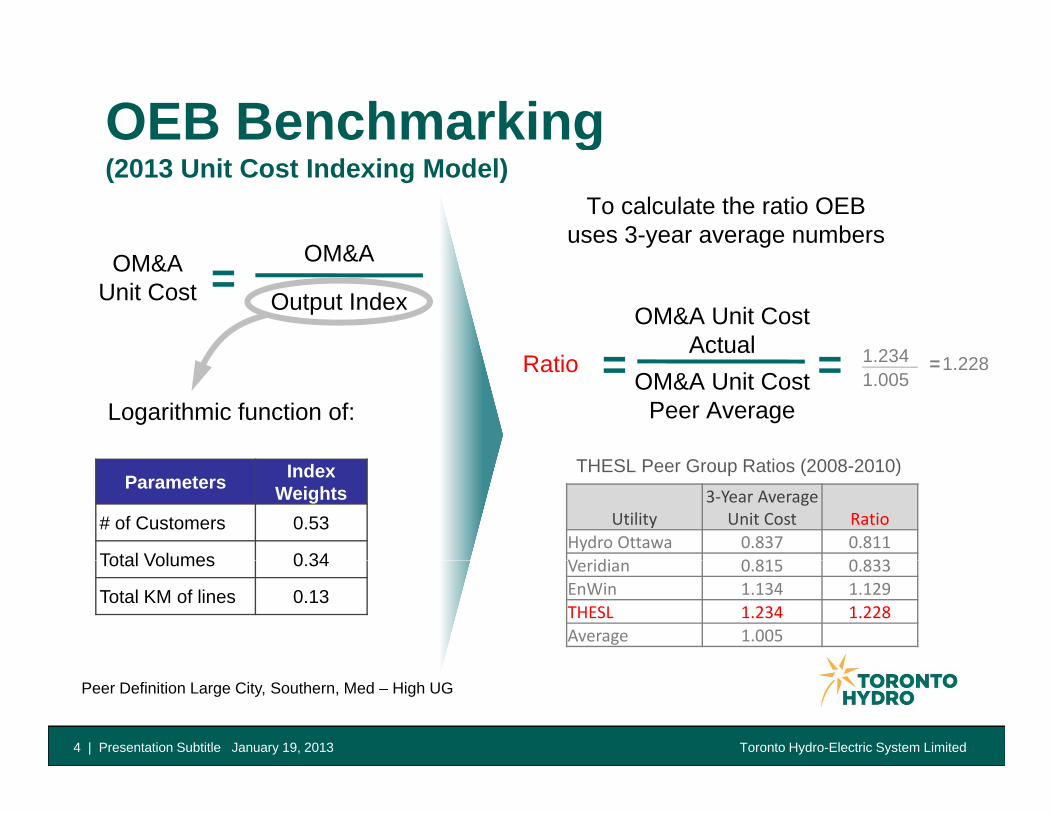
OEB Benchmarking
OM&A
To calculate the ratio OEB uses 3-year average numbers
g(2013 Unit Cost Indexing Model)
OM&A Unit CostActual
R ti
OM&A
Output Index=OM&A
Unit Cost
1 234OM&A Unit Cost
Peer Average
Ratio =Logarithmic function of:
1.234= 1.005=1.228
Parameters Index Weights
# of Customers 0.53
Total Volumes 0 34
Utility3‐Year Average
Unit Cost RatioHydro Ottawa 0.837 0.811V idi 0 815 0 833
THESL Peer Group Ratios (2008-2010)
Total Volumes 0.34
Total KM of lines 0.13
Veridian 0.815 0.833EnWin 1.134 1.129THESL 1.234 1.228Average 1.005
Toronto Hydro-Electric System Limited4 | Presentation Subtitle January 19, 2013
Peer Definition Large City, Southern, Med – High UG
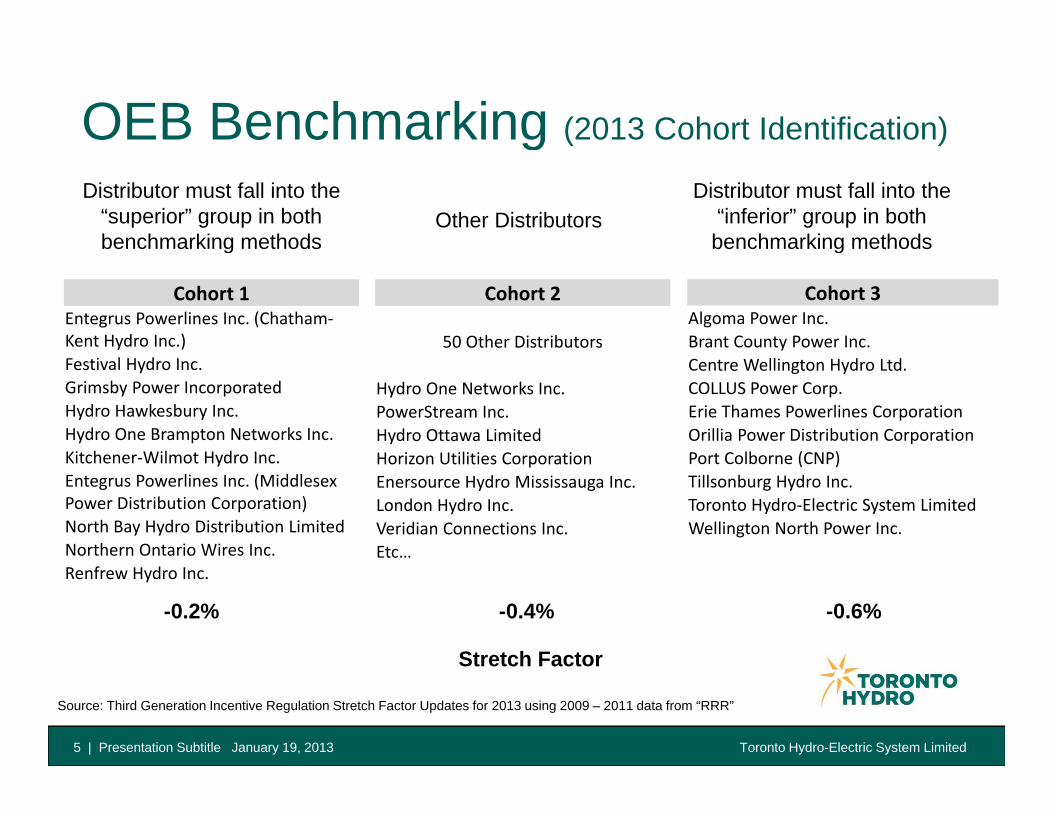
OEB Benchmarking (2013 Cohort Identification)gDistributor must fall into the
“superior” group in both benchmarking methods
Other DistributorsDistributor must fall into the
“inferior” group in both benchmarking methods
Cohort 1Entegrus Powerlines Inc. (Chatham‐Kent Hydro Inc.)
g g
Cohort 2
50 Other Distributors
Cohort 3Algoma Power Inc.Brant County Power Inc.
Festival Hydro Inc.Grimsby Power IncorporatedHydro Hawkesbury Inc.Hydro One Brampton Networks Inc.Kitchener Wilmot Hydro Inc
Hydro One Networks Inc.PowerStream Inc.Hydro Ottawa LimitedHorizon Utilities Corporation
Centre Wellington Hydro Ltd.COLLUS Power Corp.Erie Thames Powerlines CorporationOrillia Power Distribution CorporationPort Colborne (CNP)Kitchener‐Wilmot Hydro Inc.
Entegrus Powerlines Inc. (Middlesex Power Distribution Corporation)North Bay Hydro Distribution LimitedNorthern Ontario Wires Inc.
Horizon Utilities CorporationEnersource Hydro Mississauga Inc.London Hydro Inc.Veridian Connections Inc.Etc…
Port Colborne (CNP)Tillsonburg Hydro Inc.Toronto Hydro‐Electric System LimitedWellington North Power Inc.
Renfrew Hydro Inc.
Stretch Factor
-0.2% -0.4% -0.6%
Toronto Hydro-Electric System Limited5 | Presentation Subtitle January 19, 2013
Source: Third Generation Incentive Regulation Stretch Factor Updates for 2013 using 2009 – 2011 data from “RRR”
Stretch Factor
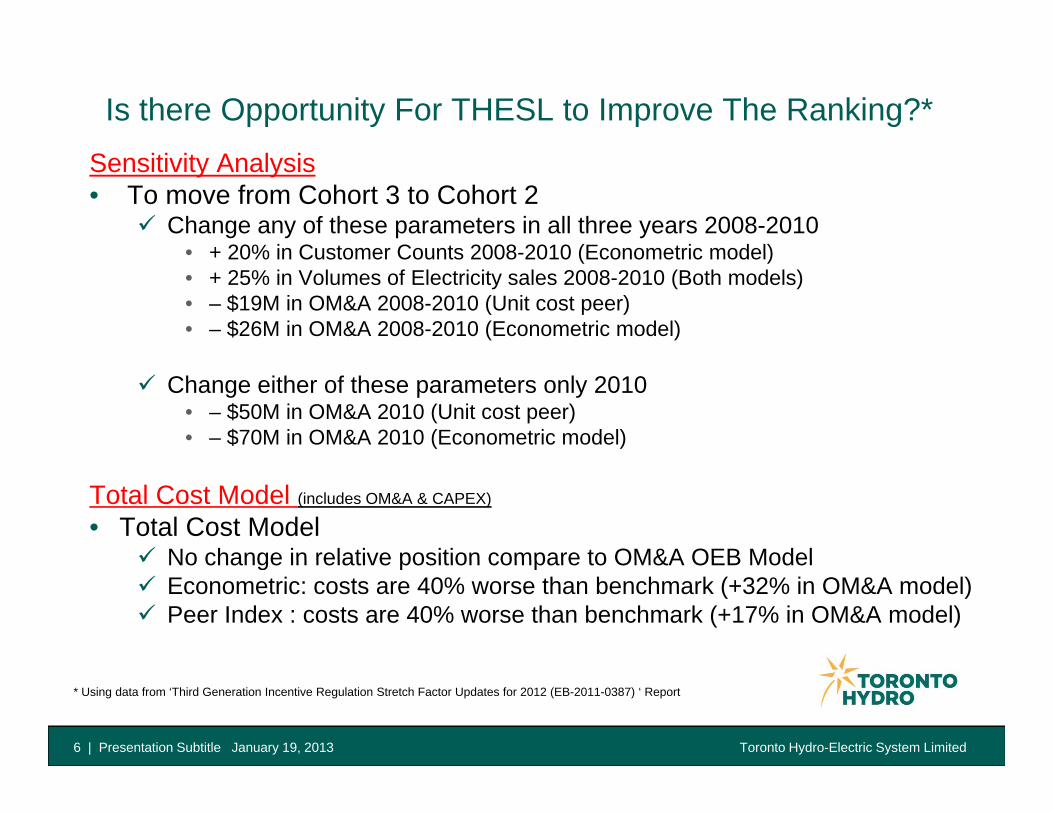
Is there Opportunity For THESL to Improve The Ranking?*Sensitivity Analysis• To move from Cohort 3 to Cohort 2
Change any of these parameters in all three years 2008-2010• + 20% in Customer Counts 2008-2010 (Econometric model)• + 20% in Customer Counts 2008-2010 (Econometric model)• + 25% in Volumes of Electricity sales 2008-2010 (Both models)• – $19M in OM&A 2008-2010 (Unit cost peer)• – $26M in OM&A 2008-2010 (Econometric model)
Change either of these parameters only 2010• – $50M in OM&A 2010 (Unit cost peer)• – $70M in OM&A 2010 (Econometric model)
Total Cost Model (includes OM&A & CAPEX)
• Total Cost ModelNo change in relative position compare to OM&A OEB ModelNo change in relative position compare to OM&A OEB ModelEconometric: costs are 40% worse than benchmark (+32% in OM&A model)Peer Index : costs are 40% worse than benchmark (+17% in OM&A model)
Toronto Hydro-Electric System Limited6 | Presentation Subtitle January 19, 2013
* Using data from ‘Third Generation Incentive Regulation Stretch Factor Updates for 2012 (EB-2011-0387) ‘ Report
Ontario Benchmarking - ConclusionsgThe current OEB Models are insensitive to move within Cohorts :
Reduce OM&A by $70M to gain ~ $1M in rates – unrealistic for THESLIncrease customer count by 20% - unrealistic for THESLIncrease electricity sales by 25% - unrealistic for THESLIncluding Total Cost (OM&A + CAPEX) will not impact Cohort ranking
• THESL does not have an Ontario peer, nor does it have a Canadian Peer -is an “outlier” in Ontario dataset 1
Our closest “peer” has ~43% of our customer count, ~31% of our consumption,Our closest peer has 43% of our customer count, 31% of our consumption, ~33% of the population, ~23% of the asset base (Hydro Ottawa)The next largest to THESL utility has ~47% of our customer count, ~34% of our consumption, ~41% of the population, ~30% of the asset base (Powerstream)
• The current OEB benchmarking approach (dataset) is not sensitive to the business conditions that impact the cost performance of a highly diversified and complex, dense, urban utility.
Toronto Hydro-Electric System Limited
p , , y
7 | Presentation Subtitle January 19, 2013
1 Excluding HONI. HONI doesn’t have a peer in Peer Unit Index model. Source: 2011 Yearbook of Electricity Distributors. OEB
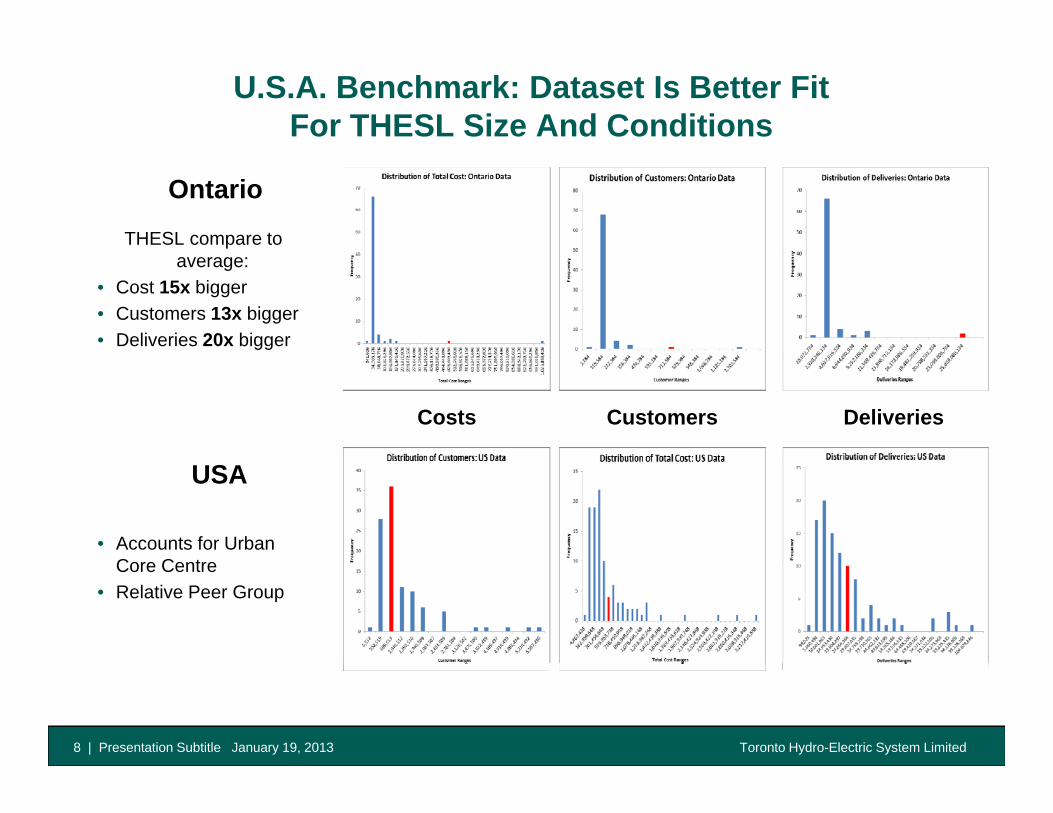
U.S.A. Benchmark: Dataset Is Better Fit For THESL Size And Conditions
Ontario
THESL compare to average:
• Cost 15x bigger• Customers 13x bigger• Deliveries 20x bigger
Costs Customers Deliveries
• Accounts for Urban C C t
USA
Core Centre• Relative Peer Group
Toronto Hydro-Electric System Limited8 | Presentation Subtitle January 19, 2013
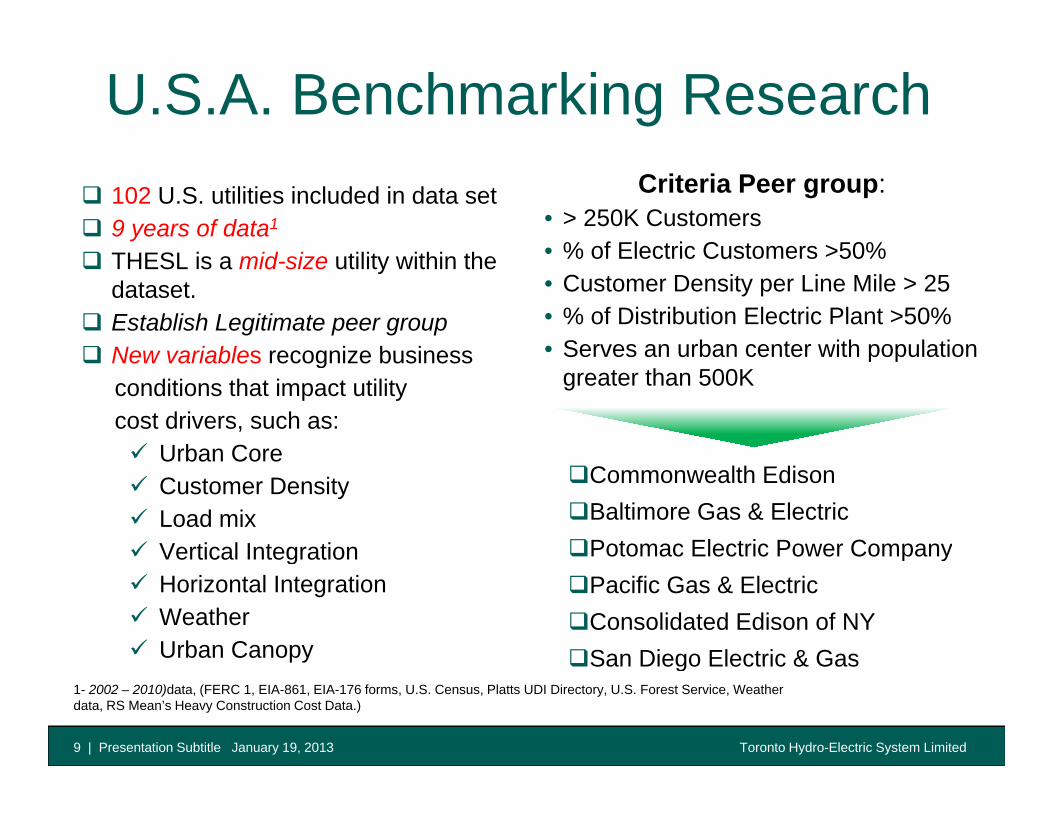
U.S.A. Benchmarking Research102 U.S. utilities included in data set9 years of data1
THESL i id i tilit ithi th
Criteria Peer group:• > 250K Customers• % of Electric Customers >50%THESL is a mid-size utility within the
dataset.Establish Legitimate peer group New variables recognize business
• % of Electric Customers >50%• Customer Density per Line Mile > 25• % of Distribution Electric Plant >50%• Serves an urban center with populationNew variables recognize business
conditions that impact utilitycost drivers, such as:
Urban Core
Serves an urban center with population greater than 500K
Urban Core Customer DensityLoad mix Vertical Integration
Commonwealth EdisonBaltimore Gas & ElectricPotomac Electric Power Companyg
Horizontal IntegrationWeather Urban Canopy
p yPacific Gas & ElectricConsolidated Edison of NYSan Diego Electric & Gas
Toronto Hydro-Electric System Limited9 | Presentation Subtitle January 19, 2013
1- 2002 – 2010)data, (FERC 1, EIA-861, EIA-176 forms, U.S. Census, Platts UDI Directory, U.S. Forest Service, Weather data, RS Mean’s Heavy Construction Cost Data.)
San Diego Electric & Gas
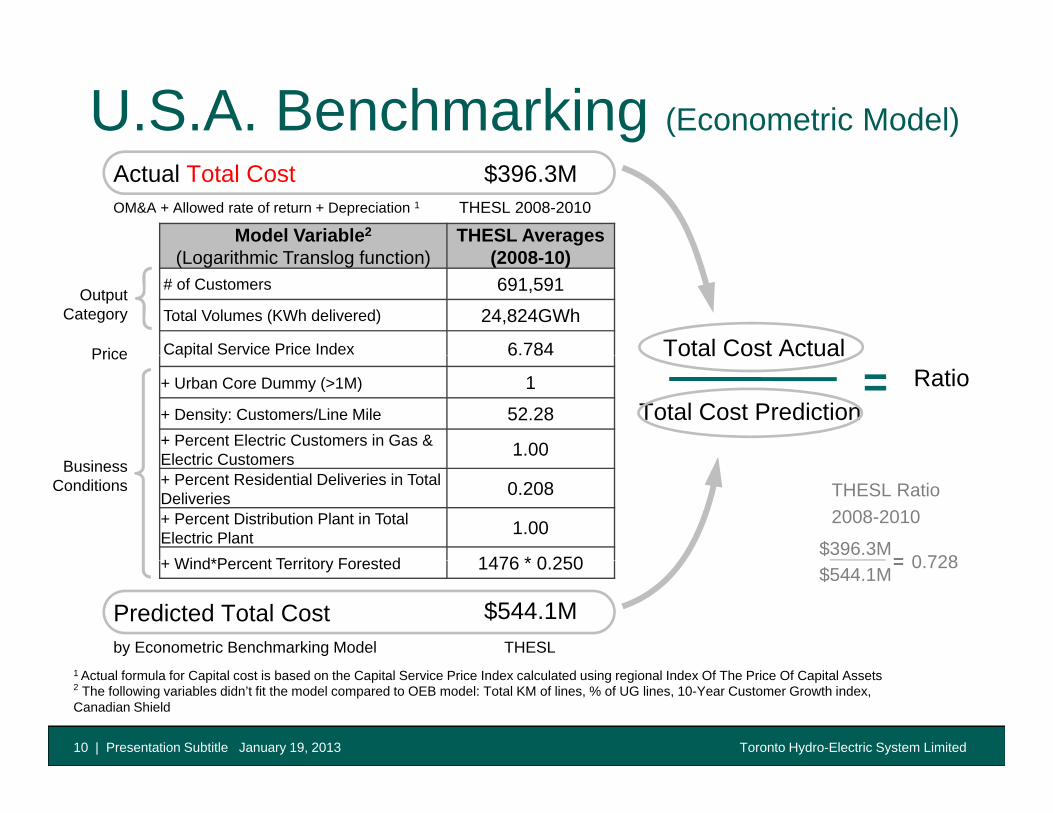
U.S.A. Benchmarking (Econometric Model)
Model Variable2
(L ith i T l f ti )THESL Averages
(2008 10)
Actual Total Cost $396.3MOM&A + Allowed rate of return + Depreciation 1 THESL 2008-2010
(Logarithmic Translog function) (2008-10)# of Customers 691,591Total Volumes (KWh delivered) 24,824GWh
Capital Service Price Index 6.784 Total Cost Actual
Output Category
Price p 6 8
+ Urban Core Dummy (>1M) 1+ Density: Customers/Line Mile 52.28+ Percent Electric Customers in Gas & Electric Customers 1.00
Total Cost Actual
Total Cost PredictionRatio=
Price
Electric Customers+ Percent Residential Deliveries in Total Deliveries 0.208+ Percent Distribution Plant in Total Electric Plant 1.00
+ Wi d*P t T it F t d 1476 * 0 250$396.3M
0 728=
THESL Ratio2008-2010
Business Conditions
+ Wind*Percent Territory Forested 1476 * 0.250 $544.1M0.728=
Predicted Total Cost $544.1Mby Econometric Benchmarking Model THESL
Toronto Hydro-Electric System Limited10 | Presentation Subtitle January 19, 2013
1 Actual formula for Capital cost is based on the Capital Service Price Index calculated using regional Index Of The Price Of Capital Assets2 The following variables didn’t fit the model compared to OEB model: Total KM of lines, % of UG lines, 10-Year Customer Growth index, Canadian Shield
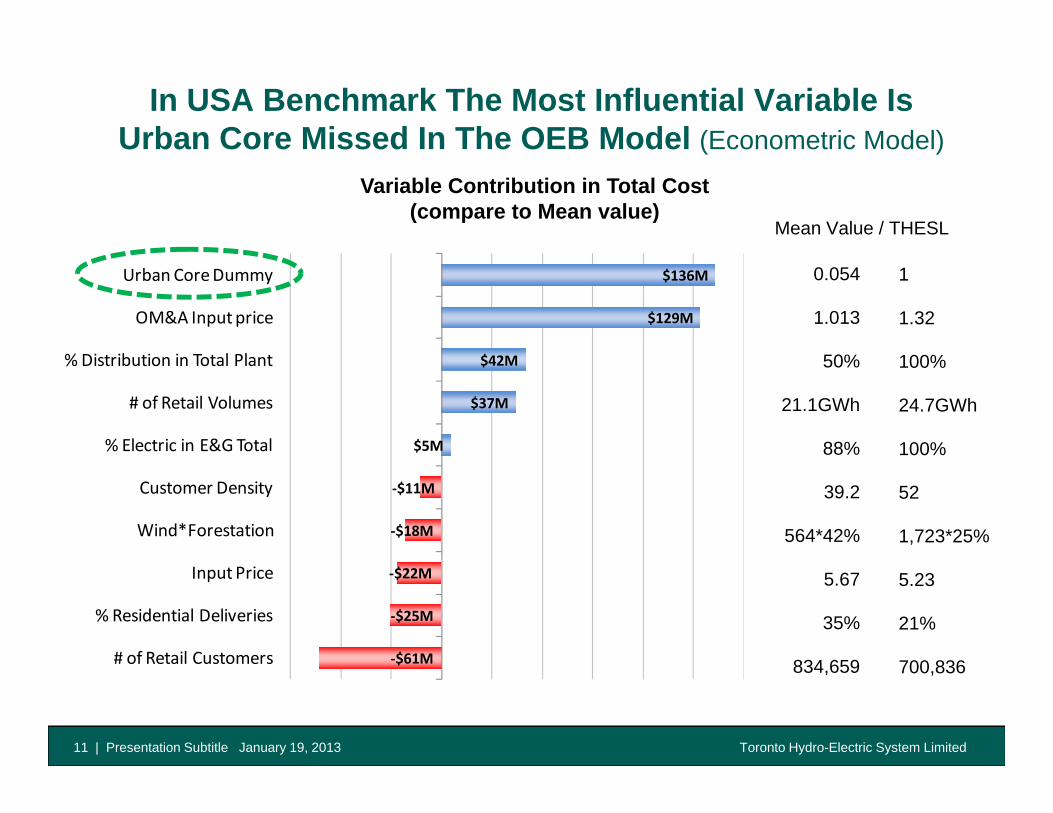
In USA Benchmark The Most Influential Variable Is Urban Core Missed In The OEB Model (Econometric Model)( )
Variable Contribution in Total Cost (compare to Mean value)
Mean Value / THESL
$ 2
$129M
$136M
%Di t ib ti i T t l Pl t
OM&A Input price
Urban Core Dummy 0.054
1.013
50%
1
1.32
100%
$5M
$37M
$42M
% Electric in E&G Total
# of Retail Volumes
% Distribution in Total Plant 50%
21.1GWh
88%
100%
24.7GWh
100%
‐$18M
‐$11M
Wind*Forestation
Customer Density 39.2
564*42%
52
1,723*25%
‐$61M
‐$25M
‐$22M
# of Retail Customers
% Residential Deliveries
Input Price 5.67
35%
834 659
5.23
21%
700 836
Toronto Hydro-Electric System Limited11 | Presentation Subtitle January 19, 2013
$61M# of Retail Customers 834,659 700,836
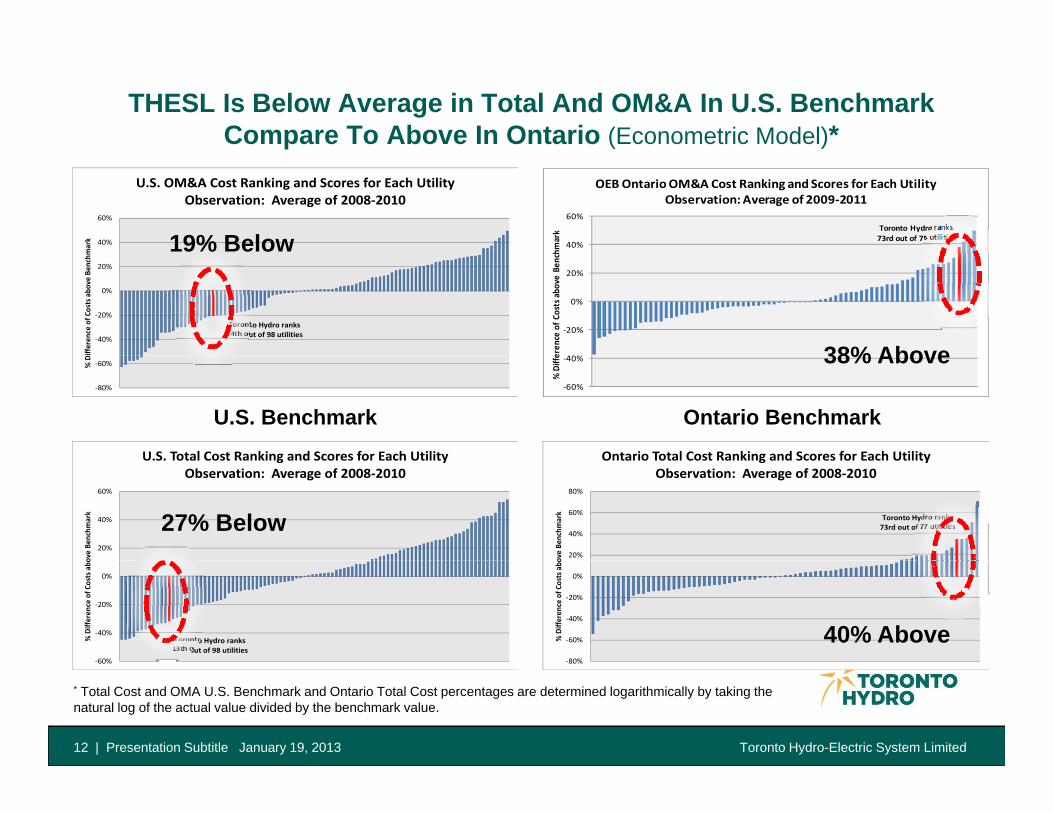
THESL Is Below Average in Total And OM&A In U.S. Benchmark Compare To Above In Ontario (Econometric Model)*
40%
60%
hmark
OEB Ontario OM&A Cost Ranking and Scores for Each Utility Observation: Average of 2009‐2011
Toronto Hydro ranks 73rd out of 75 utilities40%
60%
mark
U.S. OM&A Cost Ranking and Scores for Each Utility Observation: Average of 2008‐2010
19% Below
‐20%
0%
20%
eren
ce of Co
sts a
bove
Ben
ch
Toronto Hydro ranks 24th out of 98 utilities
‐40%
‐20%
0%
20%
ifferen
ce of C
osts abo
ve Ben
chm
38% Above‐60%
‐40%
% Diffe
Ontario Total Cost Ranking and Scores for Each UtilityU S Total Cost Ranking and Scores for Each Utility
‐80%
‐60%% D
U.S. Benchmark Ontario Benchmark
38% Above
Toronto Hydro ranks 73rd out of 77 utilities
20%
40%
60%
80%
ove Be
nchm
ark
Ontario Total Cost Ranking and Scores for Each Utility Observation: Average of 2008‐2010
20%
40%
60%
ove Be
nchm
ark
U.S. Total Cost Ranking and Scores for Each Utility Observation: Average of 2008‐2010
27% Below
‐80%
‐60%
‐40%
‐20%
0%
% Differen
ce of C
osts abo
Toronto Hydro ranks 13th out of 98 utilities
‐60%
‐40%
‐20%
0%
% Differen
ce of C
osts abo
40% Above
Toronto Hydro-Electric System Limited
80%
12 | Presentation Subtitle January 19, 2013
60%
* Total Cost and OMA U.S. Benchmark and Ontario Total Cost percentages are determined logarithmically by taking the natural log of the actual value divided by the benchmark value.
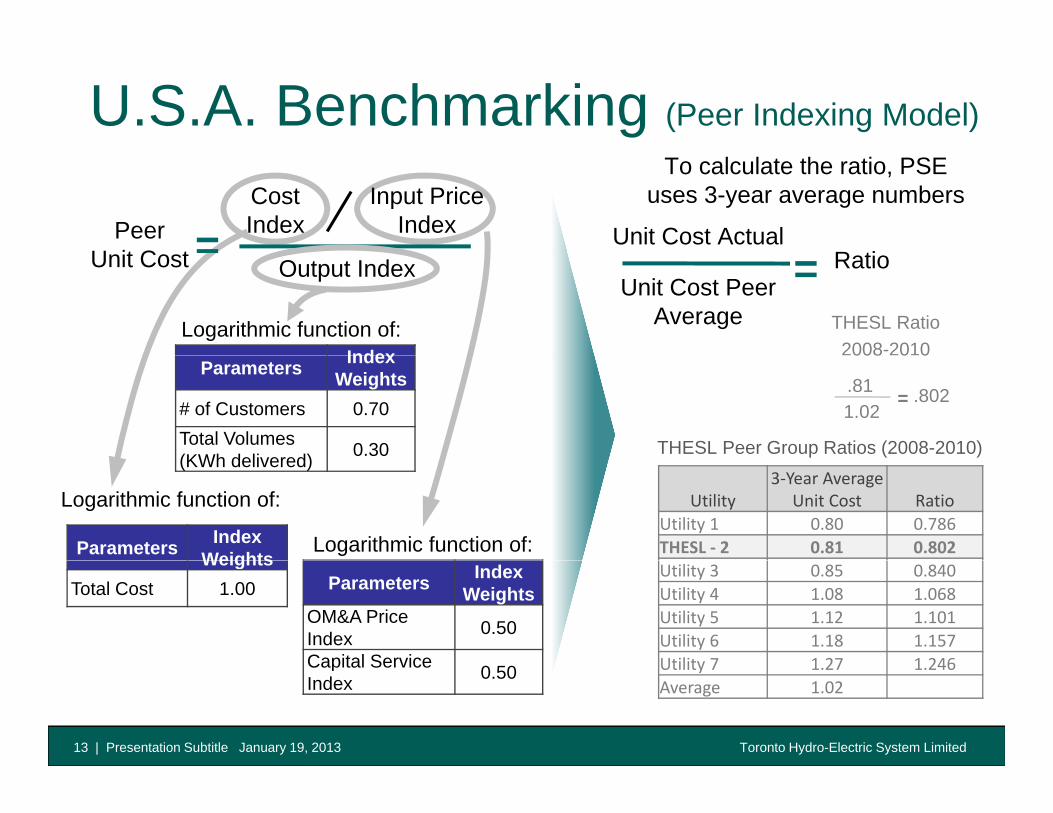
U.S.A. Benchmarking (Peer Indexing Model)
Unit Cost ActualR ti
Cost Index=Peer
U it C t
To calculate the ratio, PSE uses 3-year average numbersInput Price
Index
Unit Cost Peer Average
Ratio=Output IndexUnit Cost
IndexLogarithmic function of: THESL Ratio
2008-2010Parameters Index
Weights# of Customers 0.70Total Volumes (KWh delivered) 0.30 THESL Peer Group Ratios (2008-2010)
.811.02
.802=
008 0 0
(KWh delivered)
Parameters Index Weights
Logarithmic function of:
Logarithmic function of:
Utility3‐Year Average
Unit Cost RatioUtility 1 0.80 0.786THESL ‐ 2 0.81 0.802Weights
Total Cost 1.00 Parameters Index Weights
OM&A Price Index 0.50
Capital Service
Utility 3 0.85 0.840Utility 4 1.08 1.068Utility 5 1.12 1.101Utility 6 1.18 1.157Utility 7 1 27 1 246
Toronto Hydro-Electric System Limited13 | Presentation Subtitle January 19, 2013
Capital Service Index 0.50 Utility 7 1.27 1.246
Average 1.02
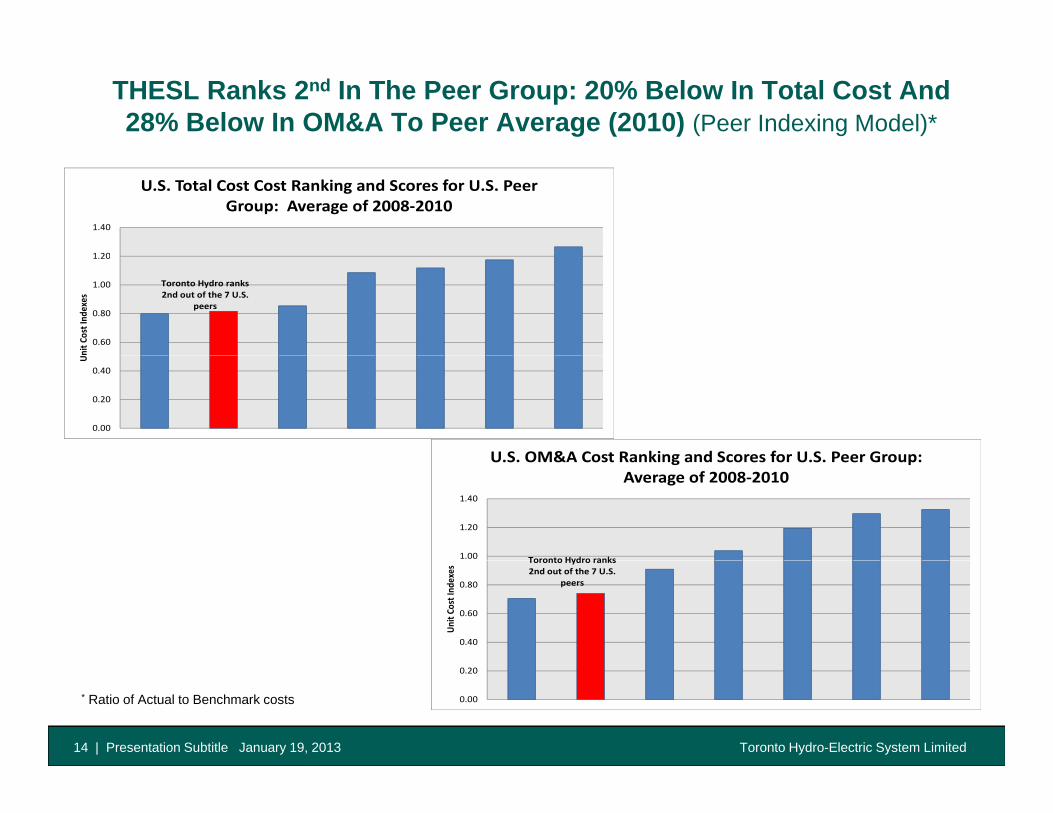
THESL Ranks 2nd In The Peer Group: 20% Below In Total Cost And 28% Below In OM&A To Peer Average (2010) (Peer Indexing Model)*
1 20
1.40
U.S. Total Cost Cost Ranking and Scores for U.S. Peer Group: Average of 2008‐2010
Toronto Hydro ranks 2nd out of the 7 U.S.
peers
0.60
0.80
1.00
1.20
nit C
ost Ind
exes
0.00
0.20
0.40
U
U S OM&A Cost Ranking and Scores for U S Peer Group:
Toronto Hydro ranks1.00
1.20
1.40
U.S. OM&A Cost Ranking and Scores for U.S. Peer Group: Average of 2008‐2010
Toronto Hydro ranks 2nd out of the 7 U.S.
peers
0.40
0.60
0.80
Unit C
ost Ind
exes
Toronto Hydro-Electric System Limited14 | Presentation Subtitle January 19, 2013
0.00
0.20
* Ratio of Actual to Benchmark costs
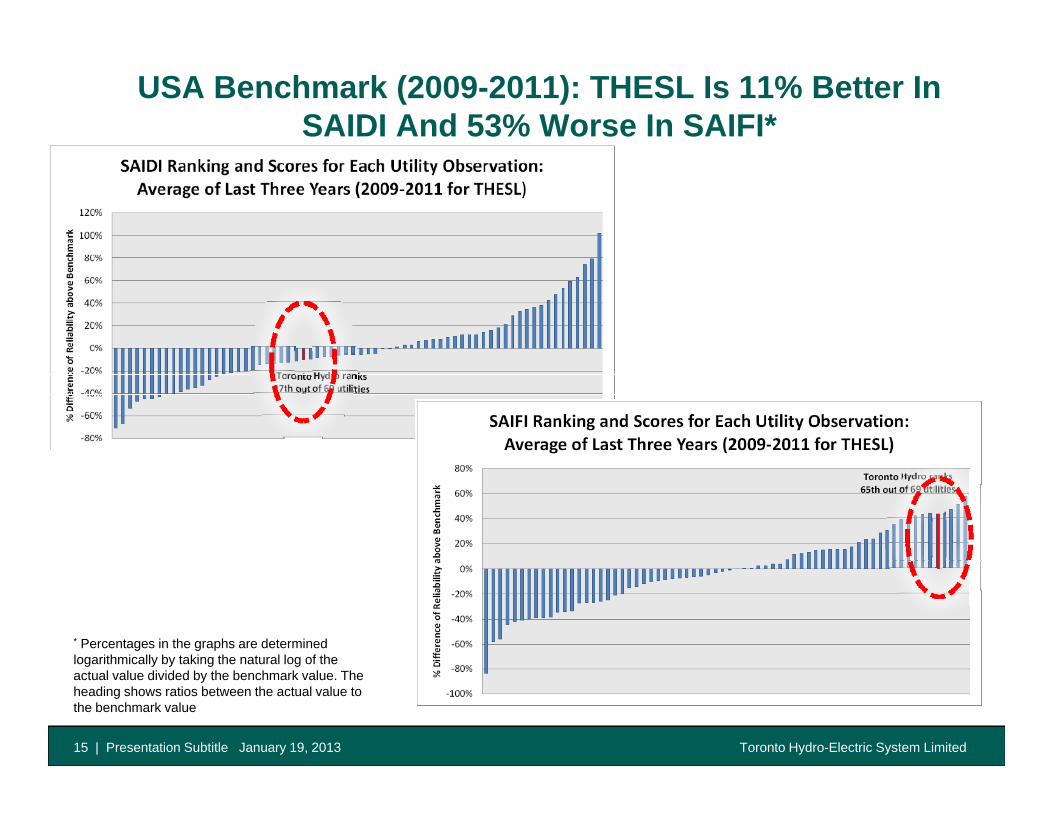
USA Benchmark (2009-2011): THESL Is 11% Better In SAIDI And 53% Worse In SAIFI*
* Percentages in the graphs are determined logarithmically by taking the natural log of the
Toronto Hydro-Electric System Limited15 | Presentation Subtitle January 19, 2013
logarithmically by taking the natural log of the actual value divided by the benchmark value. The heading shows ratios between the actual value to the benchmark value
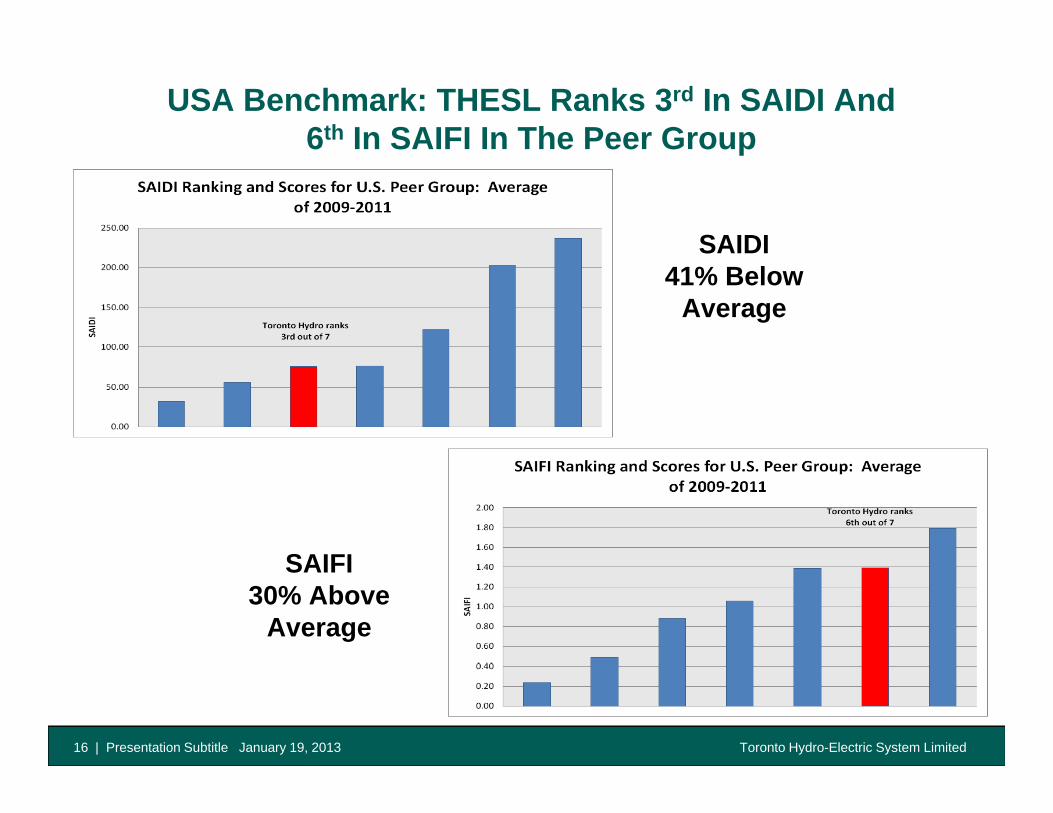
USA Benchmark: THESL Ranks 3rd In SAIDI And 6th In SAIFI In The Peer Groupp
SAIDISAIDI41% Below
Average
SAIFISAIFI 30% Above
Average
Toronto Hydro-Electric System Limited16 | Presentation Subtitle January 19, 2013