tornado-producing mini supercells associated with typhoon 9019
TRANSCRIPT

1868 VOLUME 128M O N T H L Y W E A T H E R R E V I E W
q 2000 American Meteorological Society
Tornado-Producing Mini Supercells Associated with Typhoon 9019
OSAMU SUZUKI
Japan Meteorological Agency, Ohtemachi, Chiyoda, Tokyo, Japan
HIROSHI NIINO
Ocean Research Institute, University of Tokyo, Minamidai, Nakano, Tokyo, Japan
HISAO OHNO
Meteorological College, Asahi-cho, Kashiwa, Chiba, Japan
HIROSHI NIRASAWA
Japan Meteorological Agency, Ohtemachi, Chiyoda, Tokyo, Japan
(Manuscript received 3 August 1998, in final form 11 June 1999)
ABSTRACT
On the night of 19 September 1990, nine mini-supercell storms were observed over the Kanto Plain of Japanin the northeast quadrant of Typhoon 9019. Three storms out of nine spawned a tornado. The characteristics ofthe storms and tornadoes were studied by means of a single Doppler radar, conventional radars, surface mete-orological observations, and damage surveys.
The mini-supercell storms exhibited characteristics similar to typical supercell storms over the Great Plainsof the United States, such as hook echo, bounded weak echo region, slower movement relative to the meanwind, long lives, and rightward deviation of the storm motion relative to the mean wind shear was observed.They also displayed several differences from typical supercell storms with respect to the following points: 1)horizontal scale of the mesocyclone was smaller; and 2) vertical vorticity was confined to lower levels (lessthan 5 km above ground level). These similarities and differences correspond with those observed for miniaturesupercells in Hurricane Danny’s environment.
The storm environment for these mini supercells was characterized by modest convective available potentialenergy (about 1600 J kg21) and strong low-level wind shear with veering. The storm updrafts likely tilted theambient horizontal vorticity associated with the strong low-level wind shear to generate mesocyclonic verticalvorticity.
Two of the tornadoes were spawned by mini-supercell storms moving along a preexisting surface boundarythat was accompanied by significant convergence, vertical vorticity, and horizontal gradients of temperature. Anestimation of vertical vorticity near the ground in the boundary suggests a possibility that preexisting verticalvorticity contributed to supercell evolution resulting in tornadogenesis.
1. Introduction
A significant number of tornadoes are known to occurin association with tropical cyclones such as hurricanesand typhoons. About 40% of the typhoons making land-fall in the islands of Japan during 1961–82 produced atleast one tornado (Mitsuta 1983) as did approximately59% of the hurricanes that hit the United States duringthe period of 1948–86 (McCaul 1991).
Corresponding author address: Dr. Osamu Suzuki, Japan Meteo-rological Agency, 1-3-4 Ohtemachi, Chiyoda, Tokyo 100-8122, Ja-pan.E-mail: [email protected]
Statistical studies on tropical cyclone–associated tor-nadoes have been made by many researchers (e.g., Fujitaet al. 1972; Novlan and Gray 1974; Omoto 1982; Mit-suta 1983; McCaul 1991). These studies revealed thatthe prevalence for tornadic events in the northeast quad-rant of a hurricane or typhoon (Novlan and Gray 1974;Gentry 1983) and that low-level vertical wind shear isa crucial factor for the occurrence of a tornado. Averagevertical wind shear in the environments of tornadicstorms as defined by the wind speed difference betweenthe surface and 850 hPa was greater than 23 m s21 fortyphoon-associated tornadoes (Mitsuta 1983), and wasgreater than 20 m s21 for hurricane-associated tornadoes(Novlan and Gray 1974). McCaul (1991) has demon-strated that the wind hodographs for the four storm
Unauthenticated | Downloaded 02/15/22 04:35 AM UTC

JUNE 2000 1869S U Z U K I E T A L .
FIG. 1. Times and locations of tornadoes at Inagi city, Mibu town,and Azuma village and wind damages at Chiyokawa village (C in thefigure) and Shimotsuma city (S). The locations of tornadoes and winddamages are indicated by solid and open circles, respectively, togetherwith the times of occurrence in Japan Standard Time (JST). The locationof MRI Doppler radar is indicated by the solid square and that of Tokyois shown by the open triangle. Topography around the Kanto Plain isshown by the height contours drawn for every 500 m.
quadrants with respect to the hurricane motion vary sig-nificantly and that the right forward quadrant is the mostpreferred location for supercells and therefore for tor-nadoes. He speculated that helicity enhancement causedby the interaction of the hurricane’s swirling flow witha steering current containing shear roughly parallel tothe hurricane heading is responsible for the prevalenceof hurricane-associated tornadoes in the hurricane’sright-forward quadrant.
A surprisingly limited number of studies on the char-acteristics of parent storms of tropical cyclone–associ-ated tornadoes have been performed. Most previousstudies utilized data from surface observations and con-ventional radars. These studies suggest that parentstorms of tropical cyclone-associated tornadoes are of-ten supercells (e.g., Fujita et al. 1972; Omoto 1982;McCaul 1987). Fujita et al. (1972) analyzed the Ohmiyatornado associated with Typhoon 7113 in 1971, andfound a mesocyclone in the parent storm. Omoto (1982)found that the parent storm of the Nagoya tornado as-sociated with Typhoon 7912 in 1979 had characteristicssimilar to those of typical supercell storms over theGreat Plains. However, the parent storm displayed littledeviation to the right of the mean wind. Saito (1992)analyzed tornadoes associated with Typhoon 8019 in1980 in Miyazaki prefecture and found that the torna-does were accompanied by mesocyclones in the parentstorms.
McCaul (1987) studied the parent storms of tornadoesassociated with hurricane Danny in 1985. He found thatthe morphology of the parent storms, such as a hook-shaped echo, was similar to that of typical supercellsover the Great Plains, though their scales both verticaland horizontal were smaller. Furthermore he found thatthe rightward or leftward deviation of the storm motion,which is often observed in typical supercells (e.g., Char-ba and Sasaki 1971) and for simulated supercells (e.g.,Weisman and Klemp 1984), was less significant. Itshould be noted that not all the supercells deviate.McCaul also compared the environment of tornado pro-ducing storms under hurricane Danny with that of typ-ical supercell storms over the Great Plains. He pointedout that in the hurricane environment, vertical windshear was stronger below a few kilometers above groundlevel (AGL) and was weaker above, and convectiveavailable potential energy (CAPE) was modest. Usinga numerical simulation model, McCaul (1993) andMcCaul and Weisman (1996) illustrated that storms sim-ilar to typical supercells, but with smaller horizontal andvertical scales, can be generated in the hurricane en-vironment.
Doppler radar observations of tornadic storms in thehurricane or typhoon environment began only recently.Snell and McCaul (1993) succeeded in Doppler radarobservation of tornado-producing storms in hurricaneAndrew in 1992, detecting mesocyclones in the storms.They identified at least nine separate mesocyclones inDoppler radar data. The mesocyclones exhibited several
features similar to those observed in typical supercellstorms. However, their circulation was smaller in hor-izontal scale, confined to below 4.7 km AGL. Thesecharacteristics were consistent with the results of nu-merical simulations made by McCaul (1993) andMcCaul and Weisman (1996).
Similar small-scale supercells, labeled miniature su-percells or mini supercells are reportedly associated withnot only tropical cyclones but also extratropical cy-clones (e.g., Burgess et al. 1995). Most mini supercellshave been found in environments characterized by lowstrong vertical wind shear as found under a tropicalcyclone (e.g., McCaul 1987) or an extratropical cyclone(Davies 1993; Guerrero and Read 1993). Burgess et al.(1995) examined mesocyclones detected by WSR-88Din 18 mini supercells and compared them with the tra-ditional Oklahoma mesocyclones studied in Burgess etal. (1982). The comparison revealed similarities, suchas in storm morphology and evolution, and differences,such as in mesocyclone scale. An averaged mesocyclonediameter and vertical extent for mini supercells are, re-spectively, as two-thirds and half of those of traditionalGreat Plains supercells.
On the night of 19 September 1990, three tornadoesoccurred in the Kanto Plain in association with Typhoon9019 (T9019). The locations and the times of the tor-nadoes are shown in Fig. 1, together with the topographyaround the Kanto Plain. The parent storms of these tor-
Unauthenticated | Downloaded 02/15/22 04:35 AM UTC

1870 VOLUME 128M O N T H L Y W E A T H E R R E V I E W
FIG. 2. Locations of surface meteorological stations and weatherradars in the Kanto Plain. The closed circles show observatories ofJMA. The open circles show AMeDAS stations of JMA. The dotsshow environmental meteorological stations of local governments.The solid squares show Doppler radar at MRI in Tsukuba and con-ventional radars at Kashiwa (Tokyo radar) and Haneda. Tateno, theupper-air sounding station, is only 500 m north of MRI, and is in-distinguishable from the location of MRI in this scale.
nadoes were observed by a Doppler radar at the Me-teorological Research Institute (MRI) in Tsukuba, about60 km northeast of Tokyo (see Fig. 1). In this paper,we will describe the characteristics of the tornadoes andtheir parent storms as revealed from damage surveys,surface meteorological data, conventional radars, andthe Doppler radar.
In the following section, the data used for the presentanalysis are described. The synoptic condition that ledto the mini-supercell formation and tornadogenesis areillustrated in section 3. The storm environment and sur-face boundary are examined in section 4. The charac-teristics of the tornadoes and parent storms are presentedin section 5. Results are discussed in section 6, andsummary and conclusions are given in section 7.
2. Data
In this section, the data used for the present analysisare described briefly. Detailed description of the datamay be found in Niino et al. (1993).
Surface meteorological data were collected from localobservatories and AMeDAS stations of the Japan Me-teorological Agency (JMA), and environmental moni-toring stations (EMS) of local governments. Figure 2shows the locations and category of the stations. TheAMeDAS stations are distributed one per 17 km 3 17km square all over Japan on average. Most of theAMeDAS stations measure wind speed and direction,temperature, insolation, and precipitation every 10 min.The EMS are distributed with much higher density asseen in Fig. 2. A considerable fraction of the EMS mea-sure only wind speed and direction.
A C-band1 Doppler radar at MRI and two C-bandconventional radars at Kashiwa (Tokyo radar) and Ha-neda were used for analysis. The Nyquist interval of theDoppler radar was 616 m s21. The MRI Doppler radarstarted its operation at 1918 JST2 19 September. BothDoppler velocity and reflectivity data were collected at11 elevations every 12 min (full circle scans during1918–2003 and 2200–0600 JST) or every 5 min (sectorscans over western semicircle during 2008–2145 JST).Spatial resolutions are 500 m (1918–2145 and after 0005JST) or 250 m (2149–2359 JST) in the radial and 1.48in the azimuth. The two conventional radars provideprecipitation intensity R mm h21 calculated from theZ–R relation of Z 5 200R1.6. Tokyo radar provides con-stant altitude plan position indicator (CAPPI) data atapproximately 2 km AGL, while Haneda radar provides
1 Wavelengths of the three C-band radars are approximately 5.7cm.
2 JST indicates Japan Standard Time. Hereafter, reference to timewill be in JST; 0900 JST is 0000 UTC.
plan position indicator (PPI) data with a constant ele-vation angle of 1.58.
Upper-air soundings of wind, temperature, and hu-midity were available from Tateno Upper Air Obser-vatory, which is located about 500 m north of the MRIDoppler radar site. The sounding interval was 6 h from0900 JST 19 September to 0900 JST 20 September.
3. Synoptic conditions
Figure 3 shows the track of T9019 from 18 to 20September, superimposed on an infrared image taken at2100 JST by the Japanese Geostationary MeteorologicalSatellite (GMS-4). Typhoon 9019 moved northeastwardand struck on the shoreline near Shirahama (33.68N,135.88E) in Wakayama prefecture at around 2000 JST19 September. At the time of landing, the typhoon’smaximum wind speed and central surface pressure were45 m s21 and 945 hPa, respectively. Past statistical stud-ies by Novlan and Gray (1974), Mitsuta (1983), andMcCaul (1991) pointed out that the intensity of a trop-ical cyclone is an important factor for the ability toproduce tornadoes. According to McCaul (1991), meanintensities of 21.9, 28.7, and 47.1 m s21 were found for
Unauthenticated | Downloaded 02/15/22 04:35 AM UTC

JUNE 2000 1871S U Z U K I E T A L .
FIG. 3. Track of Typhoon 9019 from 18 to 20 Sep together withthe satellite imagery taken by GMS-4 at 2100 JST 19 Sep. Typhoon9019 landed at Shirahama in Wakayama prefecture in Honsyu Islandabout 20 JST. Typhoon position is indicated by white solid and opencircles at 0900 and 2100 JST, respectively. The number by each opencircle shows the day. The Kanto Plain was in the northeast quadrantof the typhoon on the evening of 19 Sep. The box, drawn by dashedline, in the figure indicates the area of Fig. 1.
hurricanes that produced no tornado, one tornado, andmore than eight tornadoes, respectively. The fact thatT9019’s intensity was 45 m s21 at the landing producedfour tornadoes consistent with his result. T9019 contin-ued to move northeastward across the Honshu Island(the largest island of Japan), and reached the PacificOcean by 1100 JST 20 September. At the time of thesatellite imagery, the typhoon was located about 500km east-northeast of the Kanto Plain and southeasterlywind was prevailing in the plain.
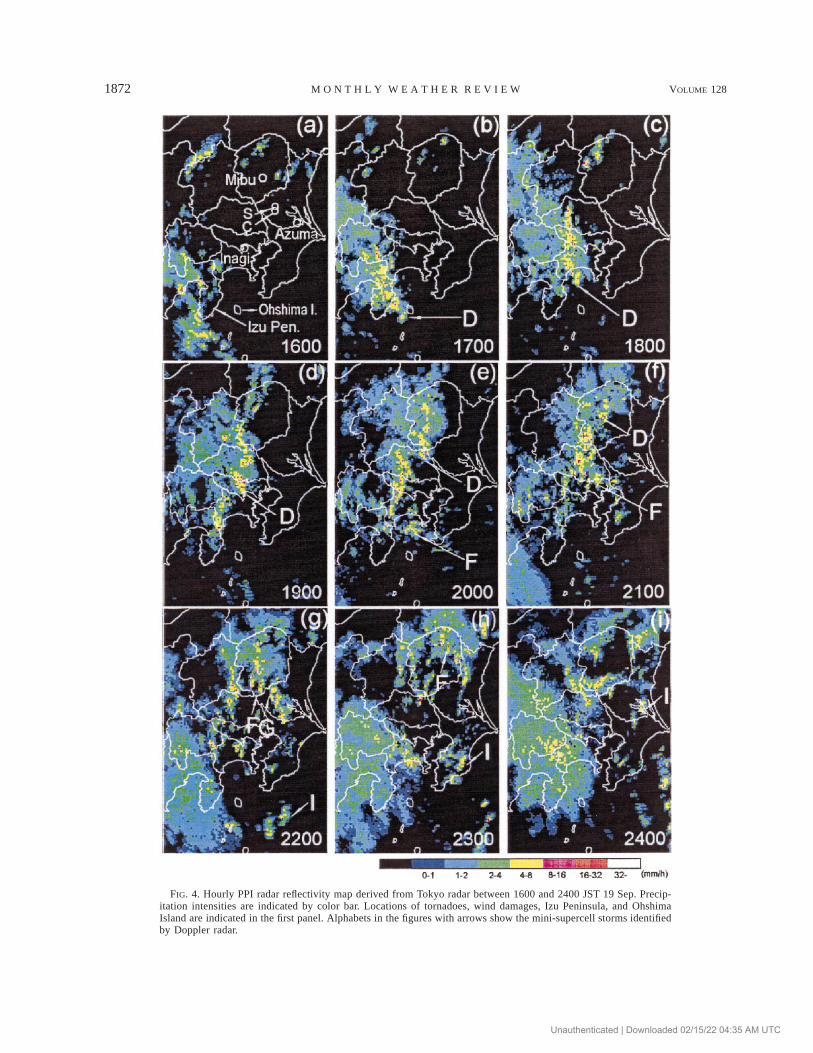
The first of the four tornadoes associated with T9019occurred in Hamamatsu in Shizuoka prefecture at 1350JST, under an outer rainband of the typhoon. The rain-band moved northward from the Pacific Ocean to Shi-zuoka prefecture and covered the Chubu district (centralpart of the Honshu Island) of Japan. Fig. 4 shows thehourly reflectivity fields by the Tokyo radar from 1600to 2400 JST. Before 1730 JST, only scattered thunder-storms were found over the Kanto Plain (Figs. 4a,b).The rainband reached the Kanto Plain around 1730 JST,and eventually covered the western half of the KantoPlain (Fig. 4c). This rainband seemed to be trapped bythe orography of the Izu Peninsula and the western Kan-to Plain. Most of the new cells in the cluster were gen-erated near the northern side of Izu Peninsula, and prop-agated north-northeastward to form a bandlike echo ina line from Izu Peninsula to the northern Kanto Plain
(see Figs. 4d–f). This bandlike structure (seen as a yel-low region in the figure) persisted during the period of1800–2100 JST (Figs. 4c–f). Such a precipitation bandis known to occur frequently when a warm moist south-erly wind prevails over the Kanto Plain (e.g., Sekiguchiet al. 1964; Asai and Takahashi 1981). Asai and Tak-ahashi (1981) analyzed a strong bandlike echo, whichproduced three tornadoes on 9 September 1976, andsuggested that the Amagi Mountain in the Izu Peninsulawas responsible for forming such bandlike echo. Thevertical wind profile of the day displayed south-south-easterly winds veering slightly between 850 hPa and700 hPa to nearly due south. Wind speed increased withheight from several meters per second to about 18 ms21. These conditions were almost identical to those of19 September 1990.
On the other hand, in the eastern half of the KantoPlain, only scattered thunderstorms, sometimes accom-panied by light to moderate rain associated with anvilsof the thunderstorms, appeared occasionally and movednorth-northeastward (Figs. 4d–i). The contrast in theecho pattern between the western and eastern KantoPlain persisted until 0200 JST 20 September.
4. Storm environment
a. Vertical structure
Figure 5 presents upper sounding data gathered from2030 to 2202 JST 19 September at Tateno. Since syn-optic conditions changed very little and no significantstorm nor frontal system passed over Tateno during theobservation, the sounding is considered to give a goodrepresentation of the environment in which the stormsdeveloped on the eastern Kanto Plain.
The Showalter’s stability index (SSI) value calculatedfrom the sounding was about 22 K indicating an un-stable environment. CAPE was about 1600 J kg21, andis comparable to that of the miniature supercell envi-ronment (1834 J kg21) under hurricane Danny in 1985(McCaul and Weisman 1996). Though this value is sig-nificantly larger than the average CAPE value of thehurricane-tornado environment (e.g., 253 J kg21 ;McCaul 1987), it is smaller than that of typical supercellenvironments over the Great Plains (e.g., 2542 J kg21
for Oklahoma supercells; Bluestein and Jain 1985).Figure 6 shows the wind hodograph obtained from
the same sounding. Strong vertical shear with veeringexisted below 3 km AGL, which again is similar to thatof hurricane Danny’s case, indicated in the same figureby dashed line. The bulk Richardson number (BRN),introduced by Weisman and Klemp (1982), was 10, andis in the lower end of possible range for simulated andobserved supercell storm development. Storm relativehelicity (SRH), which is suggested to be an importantcomponent in quantitative measurements of the stormenvironment (e.g., Davies-Jones et al. 1990), was 310m2 s22 assuming storm motion of 17 m s21 to the north-
Unauthenticated | Downloaded 02/15/22 04:35 AM UTC
1872 VOLUME 128M O N T H L Y W E A T H E R R E V I E W
FIG. 4. Hourly PPI radar reflectivity map derived from Tokyo radar between 1600 and 2400 JST 19 Sep. Precip-itation intensities are indicated by color bar. Locations of tornadoes, wind damages, Izu Peninsula, and OhshimaIsland are indicated in the first panel. Alphabets in the figures with arrows show the mini-supercell storms identifiedby Doppler radar.
Unauthenticated | Downloaded 02/15/22 04:35 AM UTC

JUNE 2000 1873S U Z U K I E T A L .
FIG. 5. Skew T-logp diagram of temperature and dewpoint temper-ature at Tateno at 2100 JST 19 Sep. CAPE is about 1600 J kg21.
FIG. 6. Wind hodograph observed at Tateno at 2100 JST 19 Sep.The movement of storm F is indicated by the thick arrow, and thedensity-weighted mean wind below 10 km AGL by the open circle.Numbers by the solid circles on the curve indicate height in kilometersand 0 the surface. The thin arrows shows storm relative winds ateach height. Dashed line and dashed letters indicate wind hodographand heights at Centreville, Alabama (CKL), 0000 UTC 17 Aug 1985(McCaul 1987).
FIG. 7. Distribution of surface temperature and winds derived fromsurface meteorological stations at 1900 JST 19 Sep. Dashed linesdenote temperature contours drawn for each 1 K. Wind barb and flagrepresent 1 m s21 and 5 m s21, respectively. Contour lines of radarreflectivity are also shown for each 10 dB by solid lines. Areas wherereflectivity is greater than 30 dBZ are hatched. The shaded area showsthe surface boundary. The location of the Inagi tornado is indicatedby the solid square.
northeast. This value is about twice that of the thresholdvalue (150 m2 s22) for mesocyclone formation noted byDavies-Jones et al. (1990). Although recent research(e.g., Davies-Jones 1993; Markowski et al. 1998) sug-gests that significant spatial and temporal variabilitiesmay exist, the estimated CAPE, BRN, and SRH valuesindicate that the environment would support the devel-opment of supercells.
b. Preexisting surface boundary
When the prevailing wind is southerly, a mesoscalesurface boundary often forms on the Kanto Plain, whichis bordered from west to north by mountains ;1000–2000 m in height (e.g., Kawamura 1970). The boundaryon such an occasion runs from north-northeast to south-southwest, and divides warm air in the southeast andcool stagnant air in the northwest. On the evening of19 September, such a surface boundary with sharp tem-perature-gradient and wind shear did exist near the east-ern edge of the precipitation region (see Fig. 4) overthe western portion of the Kanto Plain.
Figure 7 shows the distribution of surface wind andtemperature derived from AMeDAS and EMS at 1900JST, together with the reflectivity map obtained by theTokyo radar. The boundary is distinguishable, extendingnorth-northeastward from the northeastern edge of theIzu Peninsula and located in the central Kanto Plain (seeFig. 1). The western side of the boundary containedcool air produced by the precipitation over the westernKanto Plain, and in the east side was warm air advectedfrom south. The boundary had an eastward protuberancenear the Inagi City where a tornado occurred between1900 and 1920 JST. This protuberance may have been
Unauthenticated | Downloaded 02/15/22 04:35 AM UTC

1874 VOLUME 128M O N T H L Y W E A T H E R R E V I E W
FIG. 8. Traces of (a) wind direction, (b) wind speed, (c) temperatureand dewpoint temperature, and (d) surface pressure at Utsunomiya localmeteorological observatory (ULMO) between 2000 and 2330 JST.
FIG. 9. Same as Fig. 7 but at 2200 JST. The location of the Mibutornado is indicated by the solid square.
caused by outflow from storm D, which produced theInagi tornado.
From 1800 to 2100 JST the bandlike echo clusterover the western Kanto Plain moved eastward (Figs.4c–f), the surface boundary also drifted slowly eastward
in the northern part of the Kanto Plain. In the southernpart of the Plain, on the other hand, the boundary re-treated westward. After 2100 JST, the boundary re-mained stationary, though some fluctuations, related tothe passage of storms near or over the boundary, wereobserved.
Figure 8 shows the traces of wind direction, windspeed, temperature, dewpoint temperature, and pressurefrom 2000 to 2300 JST at Utsunomiya Local Meteo-rological Observatory (ULMO, see Fig. 2). Around2100 JST, a sharp temperature drop of 2 K over 5 minwas recorded, caused by a passage of the surface bound-ary toward the east. The boundary returned from theeast around 2140 JST.
Figure 9 shows distributions of surface wind and tem-perature at 2200 JST. The boundary was located 5;10km west of the Mibu Town (solid square in the figure),displaying an eastward protuberance near the storm F,which produced the Mibu tornado around 2215–2200JST, like the one near storm D in Fig. 7.
Temperature gradient and vertical vorticity across theboundary are evaluated from the data at 1900 and 2200JST. The temperature data at Chofu Airport Meteoro-logical Observatory (CAMO in Fig. 2) and Tachikawa(about 11 km apart, not included) show that a temper-ature gradient across the boundary of at least 3.5 K (10km)21 at 1900 JST. A similar value, about 3 K (10 km)21,was also observed near ULMO at 2200 JST. The verticalvorticities at 1900 and 2200 JST were estimated to be
Unauthenticated | Downloaded 02/15/22 04:35 AM UTC

JUNE 2000 1875S U Z U K I E T A L .
TABLE 1. Summary of tornadoes and wind damages.
Place Time period F*Path length
and width (km)Phenomenon
(rotation)
Housedamages
Com-pletely Partly
In-jured Data source
Inagi city 1900–20 F1 5.0 3 0.2 Tornado (cyclonic) 2 118 0 T. Hosoda (1990, unpub-lished manuscript)
Shimotsuma city andChiyakawa village
Around 2200 F0 — Heavy winds 0 0 0 Local governments andnewspaper
Mibu town 2215–20 F2 3.4 3 0.4 Tornado (cyclonic) 32 188 23 The authorsAzuma village Around 0010 F1 1.0 3 0.03 Tornado (cyclonic) 0 10 2 The authors
* F denotes Fujita scale.
at least 4 3 1024 s21 [;4 m s21 (10 km)21] in theboundary (see Figs. 7 and 9).
5. Tornadoes and storm characteristics
a. Tornadoes
Typhoon 9019 produced four tornadoes from 1350JST on 19 to 0010 JST 20 September (see Fig. 1). Allthe tornadoes occurred in the northeast quadrant of thetyphoon. This fact is consistent with the findings ofprevious statistical studies: the northeast quadrant of ahurricane (Novlan and Gray 1974; Gentry 1983) or theright-forward quadrant relative to a typhoon/hurricanemotion is the preferred location of hurricane/typhoon-associated tornadoes (Fujita et al. 1972; Mitsuta 1983;McCaul 1991). Three of the tornadoes on the KantoPlain occurred after 1900 JST (see Fig. 1). The Inagitornado, estimated as F1 in the Fujita scale, occurredbetween 1900 and 1920 JST. Two F0 damage swathsproduced by heavy winds (not identified as tornadoes)occurred in Chiyokawa Village around 2150 and in Shi-motsuma City around 2200 JST. The most intense tor-nado, ranked as F2, occurred in Mibu Town between2215 and 2200 JST. The Azuma tornado occurredaround 0010 JST. Rotation in all the three tornadoes wascyclonic.
In contrast to the Inagi and the Mibu tornadoes, whichoccurred near/over the surface boundary, the Azumatornado and damage-producing winds in ShimotsumaCity and Chiyokawa Village (S and C in Fig. 1) occurredabout 50 km and 25 km east of the boundary, respec-tively, and did not have relation to the boundary. Dam-age in Azuma, Shimotsuma, and Chiyokawa, however,was minor when compared to that caused by the Inagiand the Mibu tornadoes.
Characteristics of the three tornadoes and the twoheavy winds are summarized in Table 1.
b. Supercell identification
During the night of 19 September 1990, a total ofnine supercell storms were identified over the KantoPlain by the Doppler radar. Recent studies (Weismanand Klemp 1982; Doswell et al. 1990; Doswell and
Burgess 1993) suggest that a supercell may be properlydefined as a storm that contains a rotating updraft calleda mesocyclone. In this paper, we adopt this definitionof a supercell. However, the presence of an updraft neara vortex is difficult to identify because vertical velocityinformation cannot be extracted from a single Dopplerradar data with lower elevation angles. Therefore, toidentify a supercell, features, such as persistency, weakecho region (WER), bounded weak echo region(BWER), and/or hook echoes are used, in addition tothe following mesoscale vortex identification criteria(Donaldson 1970): 1) A pair of maximum and minimumof Doppler velocities is detected on at least two adjacentelevation angles and two successive scans, 2) the anglebetween beam direction and a horizontal vector per-pendicular to the vector pointing out the velocity max-imum from the velocity minimum is less than 458, 3)vertical vorticity is greater than 1.0 3 1022 s21, wherethe vertical vorticity was calculated by dividing the dif-ference of the maximum and minimum Doppler veloc-ities by their distance and multiplying by a factor oftwo. A vortex is assumed to be approximated by a Ran-kine combined vortex and its diameter is defined as acore diameter of the solid rotation, which is estimatedby the distance between a Doppler velocity maximacouplet. Throughout this paper, the term ‘‘mesocy-clone’’ (MC) will be used to denote either misocycloneor mesocyclone regardless of its diameter for simplicity(cf. Fujita 1981).
There is, however, a problem in the estimation of MCdiameter and velocity difference. Brown and Lemon(1976) demonstrated that measurement of MC size andvelocity maxima depend significantly upon the vortexsize to the effective radar beam width. The estimatedvalues of vertical vorticity presented in this paper willbe underestimated because the diameter of MC wasnearly comparable to the azimuthal resolution of theradar beam. This effect causes not only underestimationof vertical vorticity, but also a failure to detect a distantMC from the radar. Although this effect deteriorates theaccuracy of the estimation, trend of the vertical vorticityof MC may be judged reliable because the movementof the MC corresponds smoothly with the effective beamwidth during a volume scan.
Unauthenticated | Downloaded 02/15/22 04:35 AM UTC

1876 VOLUME 128M O N T H L Y W E A T H E R R E V I E W
FIG. 10. Movement of mesocyclones and storms detected by theMRI Doppler radar on the night of 19 Sep 1990. The solid trianglesconnected by thin lines show the locations of mesocyclones. Numeralsby the triangles indicate the beginning or end time of the detectionof mesocyclones. Mesocyclone paths in the same storms are con-nected with dashed lines. Thick lines and solid circles show the lo-cation of damages by tornadoes (Inagi City, Mibu Town, and Azumavillage) and heavy winds (Chiyokawa and Shimotsuma), respectively.
FIG. 11. PPI display of Doppler velocity and radar reflectivity withelevation angle 1.48 near Mibu town at 2216 JST. The mesocyclonecenter at 2216 JST is indicated by the solid circle. Contour intervalsof Doppler velocity and reflectivity are 8 m s21 and 10 dBZ, respec-tively. The Utsunomiya Local Meteorological Observatory (ULMO)is indicated by an open square. Space-to-time converted 1-min-av-eraged winds observed at ULMO are indicated by barbs: full barb5 5 m s21, half barb 5 2.5 m s21. The tornado damage path is shownby the thick straight line and the power line of TEPCO cut by thetornado at 2219 JST is also indicated by the solid triangle. Estimatedlocations of the tornado and the MC center at 2219 JST is indicatedby solid and dashed open triangles, respectively. The rectangle inlower right shows size of radar resolution.
Figure 10 shows the path of each detected MC centerwithin the supercells observed during a period from1922 JST 19 September to 0100 JST 20 September. Allof the supercell storms, labeled A–I, moved ;N–NNEat average speeds of 16–19 m s21.
Storms A, C, D, and I showed little jumps in MCpaths toward the east, likely indicating cyclic generationof MC cores (e.g., Brandes 1977; Burgess et al. 1982;Johnson et al. 1987). In fact, multiple cores were de-tected in storm I at 2343 JST. It is noted, however, thatnot all the storms observed during the period were su-percells (see Fig. 4). The average movement vector ofordinary storms during the period is also denoted forreference in the upper-left corner of Fig. 10, with anabsolute value of 25 m s21. The movement of the su-percell storms was about 30% slower than that of theordinary storms, but in nearly the same direction as thatof the ordinary storms. The movement of supercellstorms showed little deviation to the right of the density-weighted mean wind below 10 km AGL (see Fig. 6).A similar feature in the storm motion was also notedby McCaul (1987) for miniature supercells associatedwith hurricane Danny in 1985 and by Omoto (1982) forthe tornado-producing storm associated with typhoon7912.
c. Inagi storm and Mibu storm
Storms D and F, respectively, the parent storm of theInagi and Mibu tornados, displayed similar life cycles.
Both storms were first detected near the Ohshima Island(see Figs. 4b and 4e) as isolated cells at 1645 and 1953JST by Tokyo radar, moving north-northeastward at av-erage speeds of 18 m s21 and 17 m s21, respectively.As they moved to the north, their northern parts mergedwith the bandlike echo cluster over the western KantoPlain while keeping their identities. They were trackeduntil 2100 and 2300 JST, respectively.
The maximum radar reflectivity cores of the stormsD and F were located near their southern extents, ex-hibited elongated beanlike or even ribbonlike (Figs. 7,9) shapes, and had reflectivity intensities of about 50dBZ and 55 dBZ, respectively. The Haneda radar andthe MRI Doppler radar several times identified a hook-shaped echo, a WER, and/or a BWER near at the south-ern end of the storms D and F. Echo top heights of bothstorms were approximately 10 km AGL. An MC wasdetected in the midlevels (2.1–4.0 km AGL) of thesoutheastern edge of the storm D at 1922 JST lastinguntil 2040 JST.
Figure 11 shows a PPI display of Doppler velocityand reflectivity fields of storm F with elevation angle
Unauthenticated | Downloaded 02/15/22 04:35 AM UTC
JUNE 2000 1877S U Z U K I E T A L .
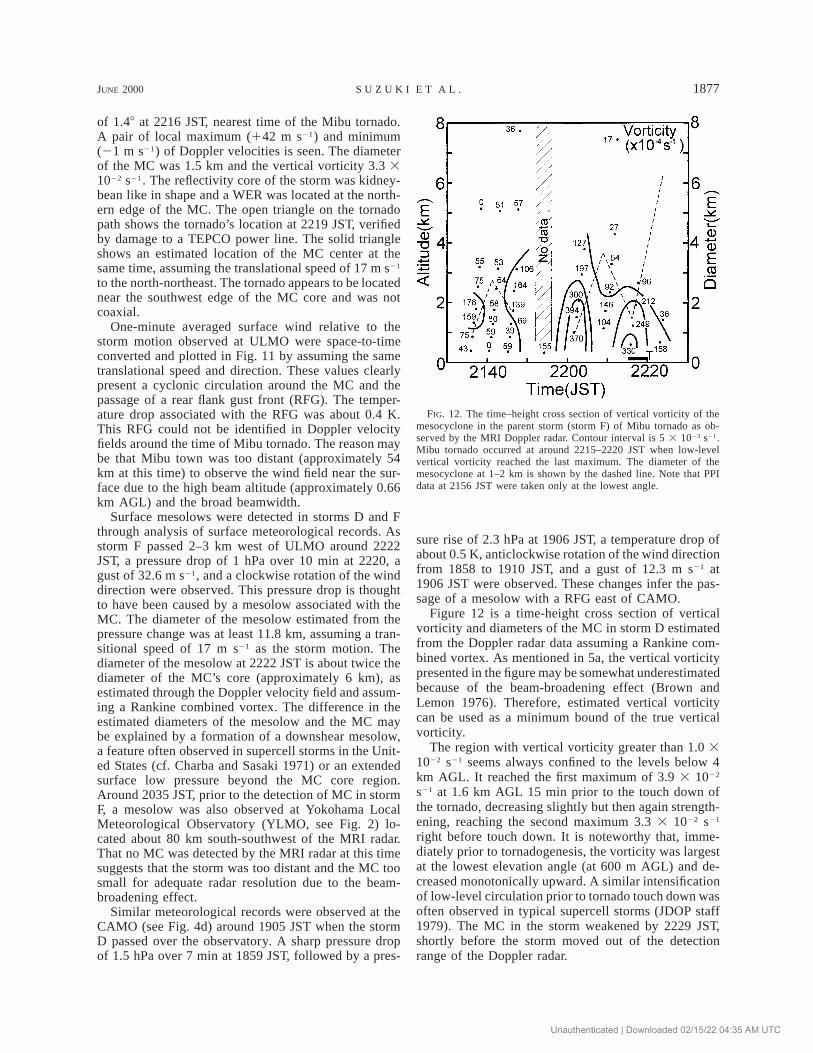
FIG. 12. The time–height cross section of vertical vorticity of themesocyclone in the parent storm (storm F) of Mibu tornado as ob-served by the MRI Doppler radar. Contour interval is 5 3 1023 s21.Mibu tornado occurred at around 2215–2220 JST when low-levelvertical vorticity reached the last maximum. The diameter of themesocyclone at 1–2 km is shown by the dashed line. Note that PPIdata at 2156 JST were taken only at the lowest angle.
of 1.48 at 2216 JST, nearest time of the Mibu tornado.A pair of local maximum (142 m s21) and minimum(21 m s21) of Doppler velocities is seen. The diameterof the MC was 1.5 km and the vertical vorticity 3.3 31022 s21. The reflectivity core of the storm was kidney-bean like in shape and a WER was located at the north-ern edge of the MC. The open triangle on the tornadopath shows the tornado’s location at 2219 JST, verifiedby damage to a TEPCO power line. The solid triangleshows an estimated location of the MC center at thesame time, assuming the translational speed of 17 m s21
to the north-northeast. The tornado appears to be locatednear the southwest edge of the MC core and was notcoaxial.
One-minute averaged surface wind relative to thestorm motion observed at ULMO were space-to-timeconverted and plotted in Fig. 11 by assuming the sametranslational speed and direction. These values clearlypresent a cyclonic circulation around the MC and thepassage of a rear flank gust front (RFG). The temper-ature drop associated with the RFG was about 0.4 K.This RFG could not be identified in Doppler velocityfields around the time of Mibu tornado. The reason maybe that Mibu town was too distant (approximately 54km at this time) to observe the wind field near the sur-face due to the high beam altitude (approximately 0.66km AGL) and the broad beamwidth.
Surface mesolows were detected in storms D and Fthrough analysis of surface meteorological records. Asstorm F passed 2–3 km west of ULMO around 2222JST, a pressure drop of 1 hPa over 10 min at 2220, agust of 32.6 m s21, and a clockwise rotation of the winddirection were observed. This pressure drop is thoughtto have been caused by a mesolow associated with theMC. The diameter of the mesolow estimated from thepressure change was at least 11.8 km, assuming a tran-sitional speed of 17 m s21 as the storm motion. Thediameter of the mesolow at 2222 JST is about twice thediameter of the MC’s core (approximately 6 km), asestimated through the Doppler velocity field and assum-ing a Rankine combined vortex. The difference in theestimated diameters of the mesolow and the MC maybe explained by a formation of a downshear mesolow,a feature often observed in supercell storms in the Unit-ed States (cf. Charba and Sasaki 1971) or an extendedsurface low pressure beyond the MC core region.Around 2035 JST, prior to the detection of MC in stormF, a mesolow was also observed at Yokohama LocalMeteorological Observatory (YLMO, see Fig. 2) lo-cated about 80 km south-southwest of the MRI radar.That no MC was detected by the MRI radar at this timesuggests that the storm was too distant and the MC toosmall for adequate radar resolution due to the beam-broadening effect.
Similar meteorological records were observed at theCAMO (see Fig. 4d) around 1905 JST when the stormD passed over the observatory. A sharp pressure dropof 1.5 hPa over 7 min at 1859 JST, followed by a pres-
sure rise of 2.3 hPa at 1906 JST, a temperature drop ofabout 0.5 K, anticlockwise rotation of the wind directionfrom 1858 to 1910 JST, and a gust of 12.3 m s21 at1906 JST were observed. These changes infer the pas-sage of a mesolow with a RFG east of CAMO.
Figure 12 is a time-height cross section of verticalvorticity and diameters of the MC in storm D estimatedfrom the Doppler radar data assuming a Rankine com-bined vortex. As mentioned in 5a, the vertical vorticitypresented in the figure may be somewhat underestimatedbecause of the beam-broadening effect (Brown andLemon 1976). Therefore, estimated vertical vorticitycan be used as a minimum bound of the true verticalvorticity.
The region with vertical vorticity greater than 1.0 31022 s21 seems always confined to the levels below 4km AGL. It reached the first maximum of 3.9 3 1022
s21 at 1.6 km AGL 15 min prior to the touch down ofthe tornado, decreasing slightly but then again strength-ening, reaching the second maximum 3.3 3 1022 s21
right before touch down. It is noteworthy that, imme-diately prior to tornadogenesis, the vorticity was largestat the lowest elevation angle (at 600 m AGL) and de-creased monotonically upward. A similar intensificationof low-level circulation prior to tornado touch down wasoften observed in typical supercell storms (JDOP staff1979). The MC in the storm weakened by 2229 JST,shortly before the storm moved out of the detectionrange of the Doppler radar.
Unauthenticated | Downloaded 02/15/22 04:35 AM UTC

1878 VOLUME 128M O N T H L Y W E A T H E R R E V I E W
FIG. 13. The PPI display of (a) reflectivity and (b) Doppler velocity of storms E, F, and G with elevation angle of 2.28 at 2146 JST. TheRHI display of (c) reflectivity and (d) Doppler velocity of storm G with azimuth angle 2508 at 2153 JST. The MCs are indicated by opencircles in the PPI displays. Arrows in (d) indicate wind directions relative the radar deduced from the Doppler velocity field.
d. Mini supercells
Excluding storms A, B, and C, most of the supercellsobserved during the night of 19 September had a similarmorphology to that of typical supercell storms over theGreat Plains. Common features included an MC de-tectable by a Doppler radar, a hook-shaped echo, aWER, and/or a BWER. Most MCs were located nearthe southeastern edge of reflectivity cores. Storms E–Iwere isolated cells or cells whose southern half (coreregions) were surrounded by an echo-free regionthroughout most of their lifetime. Cyclic MC core gen-
eration was observed in some storms; and the averagelifetime was 3 h.
Figures 13a,b represent an example of a typical PPIdisplay of radar reflectivity (Fig. 13a) and Doppler ve-locity (Fig. 13b) for storms E and G at 2146 JST. TheMCs, indicated by open circles, are found near thesoutheastern edge of the strong echo region. The RHIdisplay of the reflectivity field (Fig. 13c) derived at 2153JST displays a vaultlike weak echo region capped by astrong echo of 3 km AGL in storm G. CorrespondingDoppler velocity field (Fig. 13d) shows strong radialconvergence approximately 2 3 1022 s21 [;40 m s21
Unauthenticated | Downloaded 02/15/22 04:35 AM UTC

JUNE 2000 1879S U Z U K I E T A L .
TABLE 2. Comparison between typical supercells, mini supercells associated with T9019, and supercellular storms associated with Danny.
Typical supercells overGreat Plains
Mini supercells associatedwith T9019
Supercellular stormsassociated with Danny
(McCaul 1987)
Morphology Hook echo, BWER, WER Hook echo, BWER, WER Hook echo, wall cloudStorm’s lifetime Several hours 3 h in average Long lifeHorizontal scale of MC 5.7 km (an average) (Burgess et
al. 1979);1–4 km Unknown
Vertical scale of MC Deep (;⅔ of storm depth) (Bur-gess and Lemon 1990)
Lower than 5 km Unknown
Height of initial MC ;5 km (Burgess and Lemon 1990) ;2–3 km UnknownStorm motion relative to
mean windRightward deviation and slower
movementLittle rightward deviation and
slower movementLittle rightward deviation and
slower movementEcho top height Higher than 10 km Lower than 10 km Lower than 10 kmHodograph Strong deep vertical wind shear
with curvatureStrong vertical wind shear with
curvature below a few km AGLStrong vertical wind shear with
curvature below a few km AGLCAPE (J kg21) 2542 (average for Oklahoma
storms; Bluestein and Jain 1985)1 600 1984 (McCaul and Weisman 1996)
Storm relative helicity(m2 s22)
Medians are 278, 330, and 531 forF0–F1, F2–F3, and F4–F5 tor-nadoes (Davies-Jones et al.1990)
310 263
BRN 10;50 (Weisman and Klemp 1982) 10 24Ratio with tornado About 50% (JDOP Staff 1979) 3/9 —Multiple MC cores and
cyclic core generationYes Yes Unknown
(2 km)21] below 2 km AGL and divergence between 2and 3.5 km AGL. Figure 13d indicates a strong updraftin the vault similar to those found in typical supercellstorms (e.g., Browning 1964). If we assume axisym-metry of the divergence field around the updraft and thecontinuity equation of fluid, this vertical distribution ofconvergence and divergence indicates that upward ve-locity increases with height below 2 km, proceeds to amaximum value, and then decreases above. These ob-served vertical structures are almost identical to that ofa simulated supercell in hurricane Danny’s environmentby McCaul and Weisman (1996).
Average MC diameter ranged between 1 and 5 km,with most smaller than 4 km. Maximum vertical extentof Doppler radar–detected MCs were less than 5 km.According to Burgess et al. (1982, 1995), averaged di-ameters and depth of the traditional mesocyclone duringmature stage are 6.0 km (midlevel) and 9.2 km, re-spectively. The values for the present mini supercellsare almost identical to averages for WSR-88D-detectedmini-supercell MCs examined by Burgess et al. (1995),but are significantly smaller than those of the MCs intypical supercells over the Great Plains. The reflectivitydata (e.g., Fig. 13a) indicate that horizontal length iscomparable but vertical dimension and width of thesestorms is much smaller than those of the typical super-cell storms (e.g., schematic figures in Doswell and Bur-gess 1993). Some features found in the mini supercellson the night of 19 September, such as hook echo, longerlife time, and smaller size compared to typical super-cells, are reported by McCaul (1987) for supercellularstorms that developed in Danny’s environment, though,no Doppler data was available.
Several MCs passed over or close to surface mete-orological stations where temperature data were avail-able. Temperature deficit of 0.6 K at most were mea-sured during the passage of MCs, while that of 2 K wasobserved across the surface boundary.
The above features are summarized in Table 2, to-gether with features of typical supercells and supercel-lular storms in Danny’s environment, and as schematicillustration in Fig. 14. These features demonstrate that,while their dimensions were small, the supercell stormsover the Kanto Plain observed during the night of 19September contained all the functions of typical super-cells over the Great Plains.
6. Discussions
a. Spatial scale of mesocyclones in the minisupercells
The confinement of vertical vorticity to the low-levelis the one of the most remarkable feature of the MCsin the presented storms. This confinement is also dem-onstrated in the mini supercells generated in numericalsimulations under Danny’s environment by McCaul(1993) and McCaul and Weisman (1996).
The reason for this confinement may be explained asfollows. As shown in Fig. 6, vertical wind shear wasvery strong below 1 km AGL and relatively weak be-tween 1 and 7 km AGL. As explained in many previousstudies (e.g., Rotunno and Klemp 1985), vertical vor-ticity of a midlevel mesocyclone developed in a strongvertical wind shear is mainly generated through the tilt-ing of ambient horizontal vorticity to vertical and the
Unauthenticated | Downloaded 02/15/22 04:35 AM UTC

1880 VOLUME 128M O N T H L Y W E A T H E R R E V I E W
FIG. 14. A schematic of horizontal (left) and vertical (right) sectionsof mini supercell. Mesocyclone is located near the southeastern edgeof the strong reflectivity core.
following amplification by stretching. As seen in section5d, the vertical distribution of divergence in the minisupercells indicates strong convergence below 2 km anddivergence aloft. Therefore, vertical vorticity generationby the tilting of ambient horizontal vorticity by thestorm updraft would be fairly small above 2 km AGL.In the present case, generated vertical vorticity at 1–2km AGL may have been advected upward and decreasedwith height above the 2 km by the stretching effect ofa divergent updraft.
The small diameter of MCs in the mini supercellsmay be explained as follows. Since the midlevel MC isconsidered to be generated through tilting of horizontalvorticity in the environmental wind, the horizontal scaleof the MC would nearly coincide with that of the up-draft. In dry convection (i.e., Rayleigh-Benard convec-tion), the horizontal dimension of an updraft tends tobe scaled by the vertical dimension. Since the verticalscale of the mini supercell is considerably smaller thanthat of the typical supercell, the horizontal scales of theupdraft and MC of the mini supercell are considered tobe smaller than those of the typical supercell over theGreat Plains.
b. Rightward deviation
As mentioned in section 5b, the movement of mini-supercell storms on the night showed little deviation tothe right of the density-weighted mean wind below 10km AGL (see Fig. 6). And mini-supercell storms andordinary storms moved to nearly the same direction.
Rotunno and Klemp (1982) demonstrated that tiltingof the horizontal vorticity of the vertically sheared basicflow by the storm updraft produces a midlevel vortexand that the vertical pressure gradient force produced
by the vortex is responsible for generating a new updrafton the right-hand side with respect to the shear vector,resulting in a rightward deviation of the storm motion.Therefore, it may be appropriate to discuss the mini-supercell storm motion in reference to the mean shearvector between surface and 1–2 km AGL, where thevertical vorticity in the MC is generated through thetilting of the ambient horizontal vorticity. In this mean,a mini-supercell storm does move rightward relative tothe mean wind shear vector.
In the above paragraph, rightward deviated motion ofa mini-supercell storm motion relative to the mean windshear was explained. Then, a question may arise on thefinding that the ordinary storms also moved nearly thesame direction as the mini-supercell storms. Powell(1990) found that cells in the outer rainbands of hur-ricane Floyd (1981) moved down the band, and therainbands oriented along the density-weighted meanwind speed of the 0.2–6-km layer. In the present case,direction of the ordinary storms motion and of the den-sity-weighted mean wind of the layer were the almostsame. Therefore, this similarity in the storms’ motionbetween mini supercells and ordinary cells on this nightis likely to be a coincidence.
c. Evaluation of vorticities in the surface boundary
As noted in section 5a, two of the stronger tornadoes,the Inagi and the Mibu, occurred when the storms weremoving along the surface boundary. This suggests thepossible contribution to the storms development ofstretching of the preexisting vertical vorticity and thebaroclinically generated horizontal vorticity.
First, the possibility of preexisting vertical vorticityamplification in an updraft is examined. The verticalvorticity equation for an inviscid incompressible ho-mogeneous fluid is written as follows:
dz ]w5 v · = w 1 z , (1)h hdt ]z
where z is the vertical vorticity, d/dt is the time deriv-ative following the fluid parcel, vh is the horizontalcomponent of vorticity vector v, =h is the horizontalderivative vector, and w is the vertical component of thevelocity vector (u, y , w). The first term on the right-hand side of Eq. (1) is the tilting term. The second termon the right-hand side is the stretching term.
After Klemp and Rotunno (1983), change over timeof the vertical vorticity in an updraft with a constantconvergence (denoted by wz) and a constant tilting term(denoted by T) is evaluated. Under this assumption, onecan easily integrate Eq. (1) to obtain (Klemp and Ro-tunno 1983),
Tw (t2t ) w (t2t )z 0 z 0z(t) 5 [e 2 1] 1 z e , (2)0wz
where t0 is the beginning time of the integration and z0
Unauthenticated | Downloaded 02/15/22 04:35 AM UTC

JUNE 2000 1881S U Z U K I E T A L .
is the vertical vorticity at t 5 t0. As mentioned in section4b, vertical vorticity in the surface boundary is on theorder of 4 3 1024 s21. Doppler radar observation (seeFig. 13d) found a strong radial convergence reachingon the order of 1 3 1022 s21. If this value is used asthe wz in Eq. (2), it takes 320 s for the vertical vorticityto be amplified to 1 3 1022 s21 solely by the convergentstretching. Evaluated vertical vorticity of the order of1022 s21 seems still insufficient to explain the rapid am-plification of low-level vertical vorticity before the tor-nado. However, these values are not so small as to beneglected. There is a possibility that additional vorticitygenerated by the above mechanism makes a contributionto the amplification of supercell development and re-sultant tornadogenesis as in a nonsupercell tornado de-velopment mechanism (Wakimoto and Wilson 1989).
Second, horizontal vorticity generated by barocliniceffect is roughly evaluated with a calculation afterKlemp and Rotunno (1983). The estimated value is ap-proximately a quarter of averaged environmental hori-zontal vorticity on the order of 2 3 1023 s21 betweenthe surface and 1 km (Fig. 6). It indicates that stream-wise horizontal vorticity generated in the barocliniczone along the forward flank gust front is less importantin the case of our mini-supercell storms than in the caseof typical supercell storms, even though this estimationmay have errors because the data available were insuf-ficient to describe temperature field in the storms.
7. Summary and conclusions
On the night of 19 September 1990, nine mini su-percells were observed over the Kanto Plain in thenortheast quadrant of Typhoon 9019. The supercell en-vironment was characterized by a modest CAPE (about1600 J kg21) and a strong low-level veering wind shear.The mini supercells had several features similar to theGreat Plains supercells, including an indication of cyclicmesocyclone evolution. However, single Doppler radarand conventional radar observations revealed that MCsin the mini supercells had smaller diameters (;1–5 km),and the extent of vertical vorticity was smaller (below5 km AGL). These features are similar to mini supercellsobserved in the United States.
Three mini supercells out of nine spawned a tornado.Two of the tornadoes occurred near the preexisting sur-face boundary. It was suggested that the stretching ofthe vertical vorticity in the surface boundary likely con-tributed to the amplification of the vertical vorticity ofthe MCs in the low-level to the marginal value overwhich a tornadogenesis is possible.
Recently, the authors’ group identified several su-percell storms that produced tornado in the Kanto Plainassociated with extratropical cyclones using Doppler ra-dar data (e.g., Suzuki et al. 1997). Most of these su-percells were small and shallow storms. In addition tothe Doppler radar-detected mini supercells in Japan, astatistical study was conducted by the authors’ group in
the Okinawa area on the relationship between atmo-spheric vortices and environmental indices (Suzuki, Ni-ino and Cooperative Research Group of Okinawa Ob-servatory 94–95 1998). This study, though limited tothe Okinawa area, revealed that 33% and 67% of tor-nadoes occurred in environments with high storm rel-ative helicity (.150 m2 s22) and low BRN (,50), re-spectively. These findings together with the present pa-per suggest that a significant fraction of tornado-pro-ducing storms in Japan are mini supercells. Thediminutive dimensions of the mini supercell and thelimited availability of reliable Doppler radar analyseshinder the understanding of the dynamics of mini su-percell and associated tornadoes, as mentioned in theearlier section. Further observational and numericalstudies on the mini supercells are needed for the morecomplete understanding of the mini supercells and re-lated tornadoes.
Acknowledgments. The authors wish to thank to themetropolitan office of Tokyo, the prefectural offices ofTochigi, Saitama, Kanagawa, Ibaraki, and Chiba, thecity offices of Utsunomiya, Yokohama, Kawasaki, Fu-jisawa, Sagamihara, and Yokosuka, the town office ofMibu, Tokyo electric power company, and JMA for pro-viding meteorological data. Thanks are extended to Mrs.K. Yoshiye and Miss Ohyoshi for preparing the figures.This research was partly supported by the Grant-in-Aidfor Scientific Research (No. 09440166) of the JapaneseMinistry of Education, Science, Sports and Culture.
REFERENCES
Asai, T., and K. Takahashi, 1981: On the quasi-stationary rain bandobserved in the Kanto District on 9 September 1976. J. NaturalDisaster Sci., 4, 33–44.
Bluestein, H. B., and M. H. Jain, 1985: Formation of mesoscale linesof precipitation: Severe squall lines in Oklahoma during thespring. Mon. Wea. Rev., 115, 2719–2727.
Brandes, E. A., 1977: Gust front evolution and tornadogenesis asviewed by Doppler radar. J. Appl. Meteor., 16, 333–338.
Brown, R. A., and L. R. Lemon, 1976: Single Doppler radar vortexrecognition. Part II: Tornadic vortex signatures. Preprints, 17thRadar Meteorology Conf., Seattle, WA, Amer. Meteor. Soc.,104–109.
Browning, K. A., 1964: Airflow and precipitation trajectories withinsevere local storms which travel to the right of the winds. J.Atmos. Sci., 21, 634–668.
Burgess, D. W., and L. R. Lemon, 1990: Severe thunderstorm de-tection by radar. Radar in Meteorology, D. Atlas, Ed., Amer.Meteor. Soc., 619–647., V. T. Wood, and R. A. Brown, 1982: Mesocyclone evolutionstatistics. Preprints, 12th Conf. on Severe Local Storms, SanAntonio, TX, Amer. Meteor. Soc., 422–424., R. L. Lee, S. S. Parker, S. J. Keighton, and D. L. Floyd, 1995:A study of mini supercells observed by WSR-88D radars. Pre-prints, 27th Conf. on Radar Meteor., Vail, CO, Amer. Meteor.Soc., 4–6.
Charba, J., and Y. Sasaki, 1971: Structure and movement of the severethunderstorms of 3 April 1964 as revealed from radar and me-sonetwork data analysis. J. Meteor. Soc. Japan, 49, 191–214.
Davies, J. M., 1993: Small tornadic supercells in the central plains.
Unauthenticated | Downloaded 02/15/22 04:35 AM UTC

1882 VOLUME 128M O N T H L Y W E A T H E R R E V I E W
Preprints, 17th Conf. on Severe Local Storms, St. Louis, MO,Amer. Meteor. Soc., 305–309.
Davies-Jones, R. P., 1993: Helicity trends in tornado outbreaks. Pre-prints, 17th Conf. on Severe Local Storms, St. Louis, MO, Amer.Meteor. Soc., 56–60., D. Burgess, and M. Foster, 1990: Test of helicity as a tornadoforecast parameter. Preprints, 16th Conf. on Severe Local Storms,Kananaskis Park, AB, Canada, Amer. Meteor. Soc., 588–592.
Donaldson, R. J., Jr., 1970: Vortex signature recognition by a Dopplerradar. J. Appl. Meteor., 9, 661–670.
Doswell, C. A., III, and D. W. Burgess, 1993: The Tornado: ItsStructure, Dynamics, Prediction, and Hazards. Geograph. Mon-ogr., No. 79, Amer. Geophys. Union, 161–172., A. R. Moller, and R. Przybylinski, 1990: A unified set of con-ceptual models for variations on the supercell theme. Preprints,16th Conf. on Severe Local Storms, Kananaskis Park, AB, Can-ada, Amer. Meteor. Soc., 334–339.
Fujita, T. T., 1981: Tornadoes and downbursts in the context of gen-eralized planetary scales. J. Atmos. Sci., 38, 1511–1533., K. Watanabe, K. Tsuchiya, and M. Shimada, 1972: Typhoon-associated tornadoes in Japan and new evidence of suction vor-tices in a tornado near Tokyo. J. Meteor. Soc. Japan, 50, 431–453.
Gentry, R. C., 1983: Genesis of tornadoes associated with hurricanes.Mon. Wea. Rev., 111, 1793–1805.
Guerrero, H., and W. Read, 1993: Operational use of the WSR-88Dduring the November 21, 1992 southeast Texas tornado outbreak.Preprints, 17th Conf. on Severe Local Storms, St. Louis, MO,Amer. Meteor. Soc., 399–402.
JDOP staff, 1979: Final report of the Joint Doppler Operational Pro-ject. NOAA Tech. Memo. ERL NSSL-86, National SevereStorms Laboratory, Norman, Oklahoma, 84 pp. [NTIS PB80-107 188/AS; Available from National Technical Information Ser-vice, 5285 Port Royal Rd., Springfield, VA 22161.]
Johnson, K. W., P. S. Ray, B. C. Johnson, and R. P. Davies-Jones,1987: Observations related to the rotational dynamics of the 20May 1977 tornadic storms. Mon. Wea. Rev., 115, 2463–2478.
Kawamura, T., 1970: Surface wind systems over central Japan in thewarm season—With special reference to the southwesterly flowpattern (in Japanese with English abstract). Geo. Rev. Japan, 43,203–210.
Kemp, J. B., and R. Rotunno, 1983: A study of the tornadic regionwithin a supercell thunderstorm. J. Atmos. Sci., 40, 359–377.
Markowski, P. M., J. M. Straka, E. N. Rasmussen, and D. O. Bran-chard, 1998: Variability of storm-relative helicity during VOR-TEX. Mon. Wea. Rev., 26, 2959–2971.
McCaul, E. W., Jr., 1987: Observations of the hurricane ‘‘Danny’’tornado outbreak of 16 August 1985. Mon. Wea. Rev., 115,1206–1223., 1991: Buoyancy and shear characteristics of hurricane-tornadoenvironments. Mon. Wea. Rev., 119, 1954–1978.
, 1993: Hurricane spawned tornadic storms. The Tornado: ItsStructure, Dynamics, Prediction, and Hazards, Geograph. Mon-ogr., No. 79, Amer. Geophys. Union, 119–142., and M. L. Weisman, 1996: Simulations of shallow supercellstorms in landfalling hurricane environments. Mon. Wea. Rev.,124, 408–429.
Mitsuta, Y., Ed., 1983: Studies on wind disasters caused by tatsumaki(tornadoes and waterspouts) and severe local storms in Japan(in Japanese with English abstract). Final Report of the SpecialResearch Project for Natural Disaster Sponsored by the Ministryof Education, 124 pp.
Niino, H., O. Suzuki, H. Nirasawa, T. Fujitani, H. Ohno, I. Takayabu,N. Kinoshita, and Y. Ogura, 1993: Tornadoes in Chiba prefectureon 11 December 1990. Mon. Wea. Rev., 121, 3001–3018.
Novlan, D. J., and W. M. Gray, 1974: Hurricane-spawned tornadoes.Mon. Wea. Rev., 102, 476–488.
Omoto, Y., 1982: On ‘‘tatsumaki’’ (tornadoes) associated with ty-phoons (in Japanese). Tenki, 29, 967–980.
Powell, M., 1990: Boundary layer structure and dynamics in outerhurricane rainbands. Part I: Mesoscale rainfall and kinematicstructure. Mon. Wea. Rev., 118, 891–917.
Rotunno, R., and J. B. Kemp, 1982: The influence of the shear-induced pressure gradient on thunderstorm motion. Mon. Wea.Rev., 110, 136–151., and , 1985: On the rotation and propagation of simulatedsupercell thunderstorms. J. Atmos. Sci., 42, 271–292.
Saito, A., 1992: Mesoscale analysis of typhoon-associated tornadooutbreaks in Kyushu Island on 13 October 1980. J. Meteor. Soc.Japan, 70, 43–55.
Sekiguchi, T., T. Yoshidama, and M. Taniharu, 1964: Geographicdistribution of hourly typhoon rainfall and radar echoes in theKanto Plain, eastern Japan—Formation of orographic rain-bands(in Japanese with English abstract). Geo. Rev. Japan, 37, 55–62.
Snell, W. L., and E. W. McCaul, 1993: Doppler signatures of tor-nadoes spawned by hurricane Andrew near Montgomery, Ala-bama. Preprints, 26th Conf. on Radar Meteorology, Norman,OK, Amer. Meteor. Soc., 80–82.
Suzuki, O., H. Niino, and Cooperative Research Group of OkinawaObservatory 94–95, 1998: A statistical study on tornadoes, wa-terspouts, and funnels aloft in Okinawa prefecture in Japan. Pre-prints, 19th Conf. on Severe Local Storms, Minneapolis, MN,Amer. Meteor. Soc., 105–107., Y. Tanaka, K. Kusunoki, and Y. Makihara, 1997: Supercellevolution observed with a high resolution Doppler radar. Pre-prints, 28th Conf. on Radar Meteorology, Austin, TX, Amer.Meteor. Soc., 538–539.
Wakimoto, R. M., and J. W. Wilson, 1989: Non-supercell tornadoes.Mon. Wea. Rev., 117, 1113–1140.
Weisman, M. L., and J. B. Klemp, 1982: The dependence of nu-merically simulated convective storms on vertical wind shearand buoyancy. Mon. Wea. Rev., 110, 504–520.
Unauthenticated | Downloaded 02/15/22 04:35 AM UTC