topochemical distribution of lignin and hydroxycinnamic ...³p. esp.: formação e...
TRANSCRIPT

RESEARCH Open Access
Topochemical distribution of lignin andhydroxycinnamic acids in sugar-cane cell wallsand its correlation with the enzymatic hydrolysisof polysaccharidesGermano Siqueira1, Adriane MF Milagres1, Walter Carvalho1, Gerald Koch2, André Ferraz1*
Abstract
Background: Lignin and hemicelluloses are the major components limiting enzyme infiltration into cell walls.Determination of the topochemical distribution of lignin and aromatics in sugar cane might provide importantdata on the recalcitrance of specific cells. We used cellular ultraviolet (UV) microspectrophotometry (UMSP) totopochemically detect lignin and hydroxycinnamic acids in individual fiber, vessel and parenchyma cell walls ofuntreated and chlorite-treated sugar cane. Internodes, presenting typical vascular bundles and sucrose-storingparenchyma cells, were divided into rind and pith fractions.
Results: Vascular bundles were more abundant in the rind, whereas parenchyma cells predominated in the pith region.UV measurements of untreated fiber cell walls gave absorbance spectra typical of grass lignin, with a band at 278 nmand a pronounced shoulder at 315 nm, assigned to the presence of hydroxycinnamic acids linked to lignin and/or toarabino-methylglucurono-xylans. The cell walls of vessels had the highest level of lignification, followed by those offibers and parenchyma. Pith parenchyma cell walls were characterized by very low absorbance values at 278 nm;however, a distinct peak at 315 nm indicated that pith parenchyma cells are not extensively lignified, but containsignificant amounts of hydroxycinnamic acids. Cellular UV image profiles scanned with an absorbance intensitymaximum of 278 nm identified the pattern of lignin distribution in the individual cell walls, with the highestconcentration occurring in the middle lamella and cell corners. Chlorite treatment caused a rapid removal ofhydroxycinnamic acids from parenchyma cell walls, whereas the thicker fiber cell walls were delignified only after a longtreatment duration (4 hours). Untreated pith samples were promptly hydrolyzed by cellulases, reaching 63% of celluloseconversion after 72 hours of hydrolysis, whereas untreated rind samples achieved only 20% hydrolyzation.
Conclusion: The low recalcitrance of pith cells correlated with the low UV-absorbance values seen in parenchymacells. Chlorite treatment of pith cells did not enhance cellulose conversion. By contrast, application of the sametreatment to rind cells led to significant removal of hydroxycinnamic acids and lignin, resulting in markedenhancement of cellulose conversion by cellulases.
BackgroundThe recalcitrance of lignocellulosic materials to enzy-matic hydrolysis is clearly associated with the limitedporosity of lignified cell walls. This limited porosity hin-ders enzyme infiltration into non-pretreated lignocellu-losic materials [1-5]. Lignin and hemicelluloses are the
major components limiting enzyme infiltration into thecell walls. These components also encapsulate cellulosemicrofibrils, preventing the access of cellulases to thecellulose chains [6,7]. In grasses, the hydroxycinnamicacid content is an important influence on recalcitrance[8]. In such monocotyledons, the various chemical com-positions and structures of the individual cell typesmake elucidation of the recalcitrance in these plantmaterials more difficult [3,9].
* Correspondence: [email protected] de Biotecnologia, Escola de Engenharia de Lorena,Universidade de São Paulo, CP 116, 12602-810 Lorena, SP, BrasilFull list of author information is available at the end of the article
Siqueira et al. Biotechnology for Biofuels 2011, 4:7http://www.biotechnologyforbiofuels.com/content/4/1/7
© 2011 Siqueira et al; licensee BioMed Central Ltd. This is an Open Access article distributed under the terms of the Creative CommonsAttribution License (http://creativecommons.org/licenses/by/2.0), which permits unrestricted use, distribution, and reproduction inany medium, provided the original work is properly cited.

Cellular ultraviolet (UV) microspectrophotometry(UMSP) has been used to provide information on thetopochemical distribution of lignin and other aromaticcompounds in diverse cell walls [10-14]. Recently, Akin[9] correlated the topochemistry of lignin and aromaticswith the biodegradability of cell walls in various ligno-cellulosic materials.There have as yet been no reports of attempts to cor-
relate the topochemical distribution of lignin and hydro-xycinnamic acids in sugarcane cell walls with thein vitro recalcitrance of such material to hydrolyticenzymes. Taking into account the cell-wall characteris-tics of sugar cane, it is clear that lignin represents oneof the main hindrances to cellulosic ethanol productionfrom this lignocellulosic material. Determination of thetopochemical distribution of lignin and aromatics insugar cane might also provide important data on therecalcitrance of specific cells, which would be useful forresearch programs aiming to improve cultivars anddesign mild pretreatment processes for efficient biomassconversion.Sugar cane is a monocotyledon with a complex cellu-
lar anatomy, comprised mainly of vascular bundles andparenchyma cells. In a sugar-cane internode, the outer-most part is named the rind and the inner region isusually named the pith. The rind contains minoramounts of parenchyma cells and most of the vascularbundles, which are formed by vessels surrounded by alarge number of fibers. The pith is rich in sucrose-stor-ing parenchyma cells, but also contains small numbersof vascular bundles [15]. Vessel and parenchyma cellshave a wide lumen and relatively thin cell walls, whereasfibers are thick-walled and have a narrower lumen [16].The distribution of lignin and hydroxycinnamic acids
in the different morphological regions of sugar cane waspreviously studied by He and Terashima [17,18], usingmicroautoradiography and UMSP. These authors foundthat syringyl-propane, guaiacyl-propane and p-hydroxy-phenyl-propane lignin subunits various between fiber,vessel and parenchyma cell walls. Hydroxycinnamic acidresidues could also be detected by UMSP, because theirwavelengths of maximum absorption (315-320 nm) dif-fered from those of lignin (278-282 nm). Lignification ofvessels was found to occur in the early cell maturationstage followed by lignification of fibers. Sinapyl acid,p-coumaric acid and ferulic acid were shown to depositat the early stage of lignification, and the levels ofhydroxycinnamic acids were higher in parenchyma wallsthan in the vascular bundles.In this study, we attempted to elucidate the factors
related to lignin hindrance for enzymatic hydrolysis ofsugar-cane lignified cells. For topochemical analyses, cel-lular UMSP was used to provide a complete view of thedistribution of lignin and hydroxycinnamic acids in the
individual cell wall types. Model sugar-cane substratesdepleted in lignin were also prepared by aqueous aceticacid/chlorite delignification [19]. These samples werethen treated with commercial cellulases to evaluate theeffects of lignin and hydroxycinnamic acids on the enzy-matic hydrolysis of polysaccharides.
Results and discussionSugar-cane cell anatomy and topochemical distribution ofaromatic componentsRind and pith regions were excised from sugar caneinternodes, cut into transverse sections 1 μm thick, andexamined by microscopy. Using toluidine blue staining,we found that the sugar-cane internodes had the typicalvascular bundles (vessels and surrounding fibers) andsucrose-storing parenchyma cells (Figure 1). The vascu-lar bundles were more abundant in the rind, whereasparenchyma cells predominated in the pith region, con-sistent with the literature on sugar-cane anatomy [15]and other grasses as revised recently [9]. These celltypes are well described in the literature, and are charac-terized by various lengths, diameters and wall thick-nesses [15,16].UMSP was used to record UV spectra from spots 1
μm2 in size located in the secondary wall (S2) of thethree main cell types (Figure 2). The highest UV absor-bance was measured in the S2 of vessels from rind andpith, followed by fibers and parenchyma. UV spectra offiber and vessel S2 walls had defined bands near 278 nmand 315 nm (Figure 2). The band at 278 nm is producedby the aromatic rings in guaiacyl lignin, whereas thestrong band at 315 nm is typical of hydroxycinnamicacids linked to the lignin and/or the arabino-methylglu-curono-xylan backbones often found in grasses
V
P
F
Figure 1 Transverse section from the rind region of a sugar-cane internode after toluidine blue staining. The typical celltypes are indicated: V = vessel, F = fibers and P = parenchyma.
Siqueira et al. Biotechnology for Biofuels 2011, 4:7http://www.biotechnologyforbiofuels.com/content/4/1/7
Page 2 of 9

[9,18,20]. The spectra from the S2 of parenchyma cellwalls had the lowest absorbance values, especially in thepith region. The band at 278 nm was not resolved inthese spectra, but a pronounced band appeared at 315nm, which is consistent with the predominance ofhydroxycinnamic acids esterified to arabino-methylglu-curono-xylans [9,21].Selected areas of the sugar-cane tissues were further
scanned at constant wavelengths of 278 and 315 nmwith a spatial resolution of 0.25 μm. The signals of theUV-spectrophotometer were converted into digitizedimages (APAMOS software; Zeiss, Jena, Germany).Colored micrographs for selected samples are illu-strated in Figure 3 (see Methods). The scanned micro-graphs of fiber tissues from the rind and the pith hadsimilar absorbance levels, with the most intense absor-bance seen in the cell corners (CC) and the compoundmiddle lamella (CML). Frequency histograms fromeach image were evaluated to calculate average absor-bance values [22]. In the rind and pith fibers, the aver-age absorbance values at 278 nm were 0.40 and 0.39(including all cell-wall layers), respectively, whereas,those of the parenchyma tissue were significantly lowerat 0.31 and 0.18, respectively. Comparing the resultsobtained from the spectral point measurements andscanning analyses for the individual cell types andlayers, both datasets had very good congruence (com-pare Figure 2 and Figure 3).Excised rind from untreated sugar cane contained 19%
lignin, 30% hemicelluloses and 44% cellulose, whereasthe pith fraction had corresponding values of 12%, 24%and 53%. Considering that parenchyma cells predomi-nate in the pith region, these data are in close agree-ment with those of He and Terashima [17,18], whoreported lower lignin content in the parenchyma com-pared with the vascular bundle tissues. Notably, part ofthe lignin measured by the Klason procedure actually
corresponds to the hydroxycinnamic acids that condensewith lignin during the analytical acid treatment [23].Treatment of the rind and pith samples with aqueous
acetic acid/chlorite caused selective removal of ligninand hydroxycinnamic acids. Total lignin contentsdecreased rapidly, from 19% to 7% after 4 hours oftreatment for rind samples, and from 12% to 7% after2 hours of treatment for pith samples. Selected portionsof the treated sugar-cane tissues were also examined bythe UV spectroscopic techniques. The lignin (and acces-sory aromatic compounds) originally deposited in thefiber cell walls of the rind tissue mainly resisted adelignification process of 1 hour, whereas the pith fibertissue was rapidly delignified (Figure 3a-d). In fact, therind fibers required prolonged treatment (4 hours) forsignificant removal of the aromatic components. By con-trast, the cell walls of the rind parenchyma tissue dis-played a distinct decrease in UV absorbance values after1 hour of treatment with aqueous acetic acid/chlorite(Figure 3e,g). The highest level of delignification wasfound in the cell walls of the pith parenchyma tissue(Figures 3f,h); after a treatment of 1 hour, none absor-bance values were quantified using the highly-sensitiveUMSP technique. The studied vessel cell walls werecharacterized by heterogeneous delignification (mea-sured at 278 nm, representing guaiacyl lignin), but theabsorbance at 315 nm decreased significantly for bothrind and pith cells (data not shown).UV spectra obtained from the S2 of fibers, vessels and
parenchyma cells of the aqueous acetic acid/chlorite-treated samples are shown in Figure 4 and Figure 5.Treatment time was extended up to 4 hours, but in gen-eral, the removal of lignin and hydroxycinnamic acidswas fully completed after 2 hours. After this time, theremaining lignin (detected by the topochemical analysis)was located in the compound middle lamella and cellcorners. Evaluation of the S2 UV spectra of all cell typesrevealed that the hydroxycinnamic acids were the firstto be removed, because the 315 nm band decreased inintensity more rapidly than did the bands at 278 nm(Figure 4, Figure 5). In pith cells, removal of hydroxycin-namic acids was even more pronounced (Figure 5).
Enzymatic hydrolysis of rind and pith samplesThe untreated rind and pith samples and the aqueousacetic acid/chlorite-treated samples were digested with amixture of cellulolytic enzymes. Beside cellulose, xylanpresent in the bagasse (fibre) samples was also hydrolyzedby the enzymatic cocktail (Figure 6a-d). The xylan hydro-lysis was a result of the xylanase and b-xylosidase activitiespresent in the commercial enzyme preparations [24-26].For rind samples, the xylan conversion to xylose was simi-lar to that seen for cellulose hydrolysis, but for pith sam-ples, it was significantly lower than the cellulose hydrolysis
-0.1
0
0.1
0.2
0.3
0.4
0.5
0.6
220 240 260 280 300 320 340 360 380 400
Abs
orba
nce
Wavelenght (nm)
vesselfiberparenchyma
a
-0.1
0
0.1
0.2
0.3
0.4
0.5
0.6
220 240 260 280 300 320 340 360 380 400
Abs
orba
nce
Wavelenght (nm)
vesselfiberparenchyma
b
Figure 2 Representative UV spectra of individual cell walls (S2)of untreated sugar-cane, showing (A) rind and (B) pith S2,respectively. At least five spectra were recorded from eachdifferent cell type. The average spectra are shown in this figure.Standard deviations, calculated from the absorbance valuesmeasured at the wavelength of maximal absorption, were in therange of 5%, 13% and 25% for fiber, vessel and parenchyma cells,respectively.
Siqueira et al. Biotechnology for Biofuels 2011, 4:7http://www.biotechnologyforbiofuels.com/content/4/1/7
Page 3 of 9

(Figure 6b,d), indicating that the hemicellulose remainingin the pith fraction after the delignification was morerecalcitrant to enzymatic attack.Cellulose from untreated pith samples was promptly
hydrolyzed to glucose, reaching 63% conversion after
72 hours of hydrolysis, whereas untreated rind sampleshad only 20% conversion, indicating that the less lignifiedparenchyma cells, which mainly occurred in the pithregion, were significantly less recalcitrant than the fibersand vessels predominating in the rind region. This is
Cell type Rind Pith Untreatedfibers
a b1-h chlorite/ acetic acid treated fibers
c dUntreatedparenchyma
e f1-h acetic acid/chloritetreated parenchyma
g
There was no UV- absorption
hFigure 3 Scanning ultraviolet (UV) micrographs of 1-μm transverse sections of sugar-cane cells. The colored pixels represent different UVabsorbance values of the cell-wall layers measured at 278 nm with a geometric spatial resolution of 0.25 × 0.25 μm per pixel.
Siqueira et al. Biotechnology for Biofuels 2011, 4:7http://www.biotechnologyforbiofuels.com/content/4/1/7
Page 4 of 9

consistent with previous work showing that parenchymacells from maize stems at various states of maturationwere preferentially degraded by rumen biota [27]. Hansenet al. [28] also reported that parenchyma cells surroundingthe pith cavity lining of thermally pretreated wheat straw
were promptly hydrolyzed by a mixture of cellulolyticenzymes. Akin revised the histochemical findings fordegradation of various tissues by cellulolytic systems, andconfirmed that cells with lower levels of lignin are the firstto be hydrolyzed in several plant species [9].The UMSP data showed that parenchyma cells in the
pith region are characterized by the lowest UV-absorbance
-0.1
0
0.1
0.2
0.3
0.4
0.5
0.6
220 240 260 280 300 320 340 360 380 400
Abs
orba
nce
Wavelenght (nm)
untreated
1-h treated
2-h treated
a
-0.1
0
0.1
0.2
0.3
0.4
0.5
0.6
220 240 260 280 300 320 340 360 380 400
Abs
orba
nce
Wavelenght (nm)
untreated
1h-treated
2h-treated
b
-0.1
0
0.1
0.2
0.3
0.4
0.5
0.6
220 240 260 280 300 320 340 360 380 400
Abs
roba
nce
Wavelenght (nm)
untreated
1-h treated
2-h treated
c
Figure 4 Representative ultraviolet (UV) absorbance spectra ofindividual rind cell walls (S2) of sugar cane delignified underaqueous acetic acid/chlorite solution. (A) Vessel, (B) fiber and (C)parenchyma cells, respectively. At least five spectra were recordedfor each different cell type, and the average of each is shown.
-0.1
0
0.1
0.2
0.3
0.4
0.5
0.6
220 240 260 280 300 320 340 360 380 400
Abs
orba
nce
Wavelenght (nm)
untreated
1-h treated
a
-0.1
0
0.1
0.2
0.3
0.4
0.5
0.6
220 240 260 280 300 320 340 360 380 400
Abs
orba
nce
Wavelenght (nm)
untreated
1-h treated
b
-0.1
0
0.1
0.2
0.3
0.4
0.5
0.6
220 240 260 280 300 320 340 360 380 400
Abs
orba
nce
Wavelenght (nm)
untreated
1-h treated
c
Figure 5 Representative ultraviolet (UV) absorbance spectra ofindividual pith cell walls (S2) of sugar cane delignified underaqueous acetic acid/chlorite solution. (A) Vessel, (B) fiber and (C)parenchyma cells, respectively. At least five spectra were recordedfrom each different cell type, and the average of each is shown.
Siqueira et al. Biotechnology for Biofuels 2011, 4:7http://www.biotechnologyforbiofuels.com/content/4/1/7
Page 5 of 9

values, mostly related to hydroxycinnamic acids, becausethe measured S2 spectrum had its peak only at 315 nm.Taken together, these results suggest that the action ofthe cellulolytic enzymes was not restrained by the aro-matics occurring in the pith parenchyma. In addition,aqueous acetic acid/chlorite treatment of pith did notenhance the cellulose or xylan conversion, corroboratingthe notion that the recalcitrance of this fraction doesnot depend on the presence of aromatics only. It islikely that the limited hydrolysis of xylan to xylose alsoreflects the hindrance to cellulase action, as the hemi-celluloses are known to encapsulate cellulose fibrils inthe cell walls [3]. More recently, Qing and Wyman [25]found that xylo-oligomers accumulating during enzy-matic treatment of xylans can also inhibit cellulolyticenzymes. In our study, we found that partially deligni-fied fiber and vessels remained in the pith fraction, andmight also account for the maximum level of celluloseconversion of around 63-66% (Figure 6b). Conversely,treatment of the rind cells with aqueous acetic acid/chlorite, which led to significant removal of hydroxycin-namic acids and lignin (Figure 4), resulted in significant
enhancement of cellulose and xylan conversion by thecommercial cellulases (Figure 6a).There was an inverse correlation between cellulose
conversion levels and lignin contents or absorbance datafor the various tissue types in rind (Figure 7). Absorbancedata at 280 nm and 315 nm (Figure 4, Figure 5) wereused as an estimate of lignin and hydroxycinnamic acidcontents, respectively, in each cell type. The r2 values fordata correlation by linear models were relatively high(Figures 7b,c). An exception was the data for rind par-enchyma at 280 nm, which gave an r2 value of only 0.655.For the total lignin detected in the rind fraction, the cor-relation with cellulose conversion was also high (r2 =0.83), reflecting the weighted average of absorbances at280 nm of each individual cell type. The inverse correla-tion seen for the lignin content or the absorbanceassigned to aromatics with the levels of cellulose conver-sion is in close agreement with data reported in previousstudies by Grabber et al. [29] for mature and immaturealfalfa fibers, Jung and Casler [27] for maize stems at var-ious stages of maturation, Chen and Dixon [30] for trans-genic alfalfa, and Lee et al. [31] for selectively delignified
0
10
20
30
40
50
60
70
0 24 48 72
Cel
lulo
se c
onve
rsio
n (%
)
Hydrolysis time (h)
4h-treated (7 % of lignin)2h-treated (12 % of lignin)1h-treated (17 % of lignin)untreated (19 % of lignin)
a
0
10
20
30
40
50
60
70
0 24 48 72
Cel
lulo
se c
onve
rsio
n (%
)
Hydrolysis time (h)
2h-treated (7 % of lignin)1h-treated (8 % of lignin)untreated (12 % of lignin)
b
0
10
20
30
40
50
60
70
0 24 48 72
Xyl
an c
onve
rsio
n (%
)
Hydrolysis time (h)
c
0
10
20
30
40
50
60
70
0 24 48 72
Xyl
an c
onve
rsio
n (%
)
Hydrolysis time (h)
d
Figure 6 Cellulose and xylan conversion to monosaccharides after enzymatic hydrolysis of (A,C) rind and (B,D) pith samples treatedwith aqueous acetic acid/chlorite.
Siqueira et al. Biotechnology for Biofuels 2011, 4:7http://www.biotechnologyforbiofuels.com/content/4/1/7
Page 6 of 9
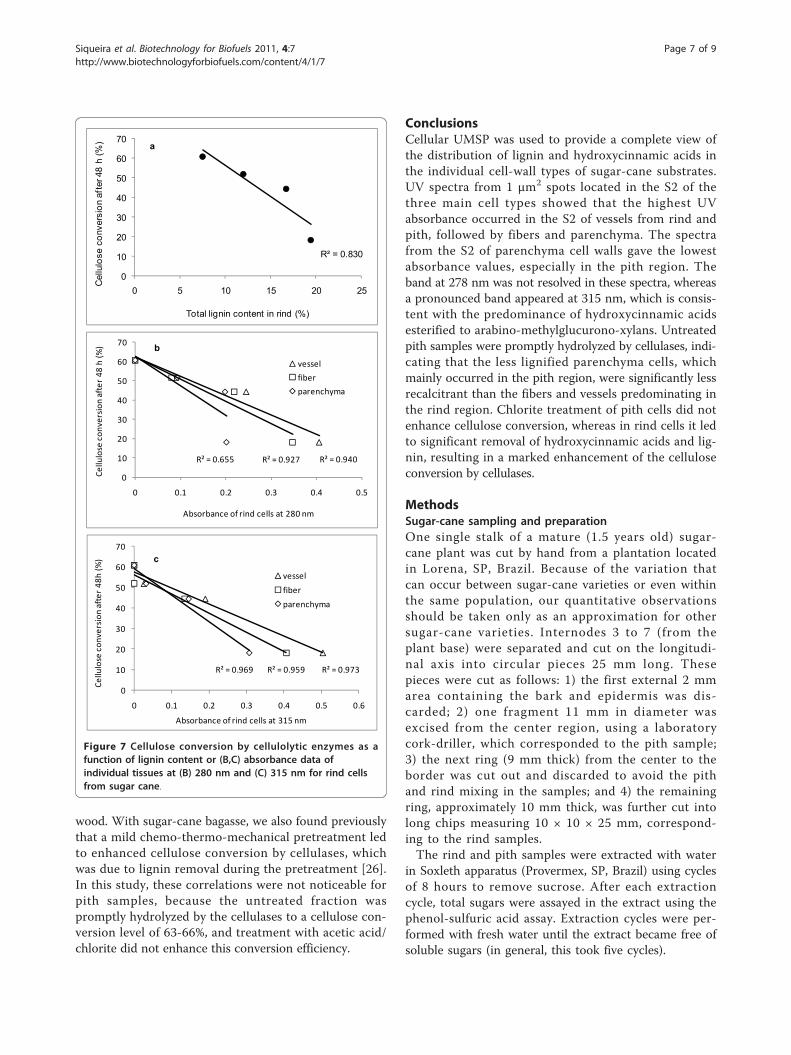
wood. With sugar-cane bagasse, we also found previouslythat a mild chemo-thermo-mechanical pretreatment ledto enhanced cellulose conversion by cellulases, whichwas due to lignin removal during the pretreatment [26].In this study, these correlations were not noticeable forpith samples, because the untreated fraction waspromptly hydrolyzed by the cellulases to a cellulose con-version level of 63-66%, and treatment with acetic acid/chlorite did not enhance this conversion efficiency.
ConclusionsCellular UMSP was used to provide a complete view ofthe distribution of lignin and hydroxycinnamic acids inthe individual cell-wall types of sugar-cane substrates.UV spectra from 1 μm2 spots located in the S2 of thethree main cell types showed that the highest UVabsorbance occurred in the S2 of vessels from rind andpith, followed by fibers and parenchyma. The spectrafrom the S2 of parenchyma cell walls gave the lowestabsorbance values, especially in the pith region. Theband at 278 nm was not resolved in these spectra, whereasa pronounced band appeared at 315 nm, which is consis-tent with the predominance of hydroxycinnamic acidsesterified to arabino-methylglucurono-xylans. Untreatedpith samples were promptly hydrolyzed by cellulases, indi-cating that the less lignified parenchyma cells, whichmainly occurred in the pith region, were significantly lessrecalcitrant than the fibers and vessels predominating inthe rind region. Chlorite treatment of pith cells did notenhance cellulose conversion, whereas in rind cells it ledto significant removal of hydroxycinnamic acids and lig-nin, resulting in a marked enhancement of the celluloseconversion by cellulases.
MethodsSugar-cane sampling and preparationOne single stalk of a mature (1.5 years old) sugar-cane plant was cut by hand from a plantation locatedin Lorena, SP, Brazil. Because of the variation thatcan occur between sugar-cane varieties or even withinthe same population, our quantitative observationsshould be taken only as an approximation for othersugar-cane varieties. Internodes 3 to 7 (from theplant base) were separated and cut on the longitudi-nal axis into circular pieces 25 mm long. Thesepieces were cut as follows: 1) the first external 2 mmarea containing the bark and epidermis was dis-carded; 2) one fragment 11 mm in diameter wasexcised from the center region, using a laboratorycork-driller, which corresponded to the pith sample;3) the next ring (9 mm thick) from the center to theborder was cut out and discarded to avoid the pithand rind mixing in the samples; and 4) the remainingring, approximately 10 mm thick, was further cut intolong chips measuring 10 × 10 × 25 mm, correspond-ing to the rind samples.The rind and pith samples were extracted with water
in Soxleth apparatus (Provermex, SP, Brazil) using cyclesof 8 hours to remove sucrose. After each extractioncycle, total sugars were assayed in the extract using thephenol-sulfuric acid assay. Extraction cycles were per-formed with fresh water until the extract became free ofsoluble sugars (in general, this took five cycles).
R² = 0.830
0
10
20
30
40
50
60
70
0 5 10 15 20 25
Cel
lulo
se c
onve
rsio
n af
ter 4
8 h
(%)
Total lignin content in rind (%)
a
R² = 0.940R² = 0.927R² = 0.655
0
10
20
30
40
50
60
70
0 0.1 0.2 0.3 0.4 0.5
Cellulose
conversion
after48
h(%)
Absorbance of rind cells at 280 nm
vessel
fiber
parenchyma
b
R² = 0.973R² = 0.959R² = 0.969
0
10
20
30
40
50
60
70
0 0.1 0.2 0.3 0.4 0.5 0.6
Cellulose
conversion
after48
h(%)
Absorbance of rind cells at 315 nm
vessel
fiber
parenchyma
c
Figure 7 Cellulose conversion by cellulolytic enzymes as afunction of lignin content or (B,C) absorbance data ofindividual tissues at (B) 280 nm and (C) 315 nm for rind cellsfrom sugar cane.
Siqueira et al. Biotechnology for Biofuels 2011, 4:7http://www.biotechnologyforbiofuels.com/content/4/1/7
Page 7 of 9
Extracted material was delignified at 75-80°C in aqu-eous sodium chlorite/acetic acid reagent for up to4 hours [19]. The solid:liquid ratio was 1:26 (w/v), andthe acetic acid and sodium chlorite loads were 0.1 ml/gand 0.3 g/g, respectively (oven-dried). At intervals of1 hour, fresh acetic acid and sodium chlorite was addedto the reaction tube. To avoid collapse of the sugar-canetissues after long delignification periods, fishing line wastied around the cylindrical outer surface of the rind andpith pieces. After delignification, the samples werewashed with acetone and water. The washed sampleswere placed into screw-capped tubes and maintained at4°C until they were prepared for UMSP analyses andenzyme digestion assays.
UMSP of the samplesFor the UV spectroscopic analysis, small blocks(approximately 1 × 1 × 0.5 mm) were dissected fromthe rind and pith samples. The specimens were dehy-drated in a graded series of acetone and embedded inSpurr’s epoxy resin [32]. Sections 1 μm thick were pre-pared from these samples with a diamond knife, trans-ferred to quartz microscope slides, and embedded inglycerine [33]. The topochemical analysis was carriedout using a microspectrophotometer (UMSP 80; Zeiss)equipped with a scanning stage enabling the determina-tion of image profiles at defined wavelengths using thescan program APAMOS (Zeiss). Wavelengths of 278and 315 nm were selected for detection of the distribu-tion of lignin or hydroxycinnamic acids, respectively.The scan program digitizes rectangular fields of the tis-sue with a local geometrical resolution of 0.25 × 0.25μm and a photometrical resolution of 4,096 grayscalelevels, which are converted into 16 basic colors to visua-lize the absorbance intensities. The samples were alsoinvestigated conventionally by point measurements witha spot size of 1 μm2, between 240 and 400 nm, usingUVMSP (Tidas MSP 80, J&M), (J&M, Essingen/Aalen,Germany). At least five spectra were recorded from eachindividual cell type and cell-wall layer. The averageabsorbance values of the spectra are presented through-out the paper. Standard deviations, calculated from theabsorbance measured at the wavelength of maximalabsorption, were in the range of 5%, 13% and 25% forfiber, vessel and parenchyma cells, respectively.
Determination of the chemical composition of thesamplesThe chemical composition of the lignocellulosic sampleswas determined in the ethanol-extracted material.Approximately 3 g of milled sample was extracted with95% ethanol for 6 hours in a Soxleth extractor.Extracted samples (300 mg) were hydrolyzed with 72%(w/w) sulfuric acid (3 mL) at 30°C for 1 hour. The acid
was diluted to a final concentration of 3% with the addi-tion of 79 mL of water, and the mixture was heated at121°C and 1 atm for 1 hour. The resulting material wascooled and filtered through a porous glass filter (number3). The solids were dried to a constant weight at 105°C,and considered the insoluble lignin. The soluble ligninconcentration in the filtrate was determined by measur-ing the absorbance at 205 nm and using the value 105 l/g/cm as the absorptivity of soluble lignin. Concentra-tions of monomeric sugars in the soluble fraction weredetermined by high-performance liquid chromatography(HPLC) (HPX87H column; Bio-Rad Laboratories, Rich-mond, CA, USA) at 45°C, eluted at a rate of 0.6 ml/minwith 5 mmol/l sulfuric acid. Sugars were detected usinga temperature controlled refractive index detector [34].Because of the limited amounts of each sample, an esti-mate of experimental deviations in chemical composi-tions was based on triplicate repeats performed with theuntreated rind samples. The glucan, hemicelluloses andtotal lignin contents varied by 2.1%, 2.3% and 1.0% ofthe average values, respectively.
Enzymatic hydrolysis of the samplesThe pith and rind samples were milled to pass througha 0.84 mm screen and digested with a mixture of com-mercial enzyme preparations (Celluclast and Novozym188; Novozymes Biopharma DK, Bagsvaerd, Denmark)at a dosage of 10 filter-paper units (FPU) of cellulaseand 20 IU of b-glucosidase per gram of substrate(oven-dried weight). Each hydrolysis experiment wascarried out in 50-mL centrifuge tubes containing 200mg of lignocellulosic material (oven-dried weight) and10 mL of 50 mmol/L sodium acetate buffer pH 5.0,plus the enzyme solution (final consistency of 2%). Thetubes were incubated at 45°C under reciprocal agita-tion of 120 cycles per min. At defined periods, from 4to 72 hours, a sample of 250 μL was taken from eachtube and heated to 100°C for 5 min, followed by spin-ning in a centrifuge at 11,260 g for 15 minutes. Foreach reaction time, three replicate experiments werecarried out. Hydrolysates were assayed for glucose, cel-lobiose and xylose contents using the previouslydescribed HPLC procedure. Cellulose conversion wascalculated as 0.9 × mass of glucose + 0.95 × mass ofcellobiose released from the glucan contained in thesample. Only minor amounts of cellobiose weredetected in the hydrolysates. Variation between hydro-lysis triplicates is shown as standard deviation bars inthe corresponding figures.
AcknowledgementsWe thank J.M. Silva and J.C. Tavares for their technical assistance. This workwas supported by FAPESP (contract number 08/56256-5), CNPq and CAPES.GS is a CAPES Student Fellow.
Siqueira et al. Biotechnology for Biofuels 2011, 4:7http://www.biotechnologyforbiofuels.com/content/4/1/7
Page 8 of 9

Author details1Departamento de Biotecnologia, Escola de Engenharia de Lorena,Universidade de São Paulo, CP 116, 12602-810 Lorena, SP, Brasil. 2Institute ofWood Technology and Wood Biology, Federal Research Institute for RuralAreas, Forestry and Fisheries, D-21031 Hamburg, Germany.
Authors’ contributionsGS performed the delignification experiments, enzymatic hydrolysis ofsamples, chemical analyses and data interpretation. AMFM participated inthe design of the study, data interpretation and drafting of the manuscript.WC participated in the design of the study and data interpretation. GKparticipated in the cellular UMSP analyses, data interpretation and drafting ofthe manuscript. AF conceived the study, performed the delignificationexperiments, cellular UMSP analyses and data interpretation, and reviewedthe manuscript. All authors read and approved the final manuscript.
Competing interestsThe authors declare that they have no competing interests.
Received: 21 December 2010 Accepted: 16 March 2011Published: 16 March 2011
References1. Grethlein HE: The effect of pore size distribution on the rate of
enzymatic hydrolysis of cellulosic substrates. Bio/Technology 1985,3:155-160.
2. Ramos LP, Breuil C, Saddler JN: Comparison of steam pretreatment ofeucalyptus, aspen and spruce wood chips and their enzymatichydrolysis. Appl Biochem Biotechnol 1992, 34/35:37-47.
3. Himmel ME, Ding S-H, Johnson DK, Adney WS, Nimlos MR, Brady JW,Foust TD: Biomass recalcitrance: engineering plants and enzymes forbiofuels production. Science 2007, 315:804-807.
4. Várnai A, Siika-aho M, Viikari L: Restriction of the 1 enzymatic hydrolysis ofsteam pretreated spruce by lignin and hemicellulose. Enzyme MicrobTechnol 2010, 46:185-193.
5. Gomez LD, Whitehead C, Barakate A, Halpin , McQueen-Mason SJ:Automated saccharification assay for determination of digestibility inplant materials. Biotechnol Biofuels 2010, 3:23.
6. Yang B, Wyman CE: Effect of xylan and lignin removal by batch andflowthrough pretreatment on the enzymatic digestibility of corn stovercellulose. Biotechnol Bioeng 2004, 86:88-95.
7. Kristensen JB, Thygesen LG, Felby C, Jorgensen H, Elder T: Cell-wallstructural changes in wheat straw pretreated for bioethanol production.Biotechnol Biofuels 2008, 1:5.
8. Lam TB, Iiyama K, Stone BA: Hot alkali-labile linkages in the walls of theforage grass Phalaris aquatica and Lolium perenne and their relation toin vitro wall digestibility. Phytochem 2003, 64:603-607.
9. Akin DE: Plant cell wall aromatics: influence on degradation of biomass.Biofuels Bioproducts Biorefining 2008, 2:288-303.
10. Koch G, Kleist G: Application of scanning UV microspectrophotometry tolocalise lignins and phenolic extractives in plant cell walls. Holzforschung2001, 55:1-5.
11. Koch G: Topochemical characterization of lignins and phenolicextractives in wood cell walls. Lenzinger Berichte 2004, 83:6-12.
12. Lybeer B, Koch G: Lignin distribution in the tropical bamboo speciesGigantochloa levis. IAWA J 2005, 26:443-456.
13. Kim JS, Lee KH, Cho CH, Koch G, Kim YS: Micromorphologicalcharacteristics and lignin distribution in bamboo (Phyllostachyspubescens) degraded by the white rot fungus Lentinus edodes.Holzforschung 2008, 62:481-487.
14. Rehbein M, Pereira M, Koch G, Kordsachia O: Topochemical investigationon the delignification of Eucalyptus globulus chips during neutral sulfite(NS) pulping. Wood Sci Technol 2010, 44:435-449.
15. Moore PH: Anatomy and morphology, In: Sugar cane improvementthrough breeding.Edited by: Heinz DJ. Amsterdam, Elsevier; 1987:85-142.
16. SanJuan R, Anzaldo J, Vargas J, Turrado J, Patt R: Morphological andchemical composition of pith and fibers from mexican sugar canebagasse. HolzAlsRoh-Und Werkstoffholz 2001, 59:447-450.
17. He L, Terashima N: Formation and structure of lignin in monocotyledons.III. Heterogeneity of sugarcane (Saccharurn officinarurn L.) lignin with
respect to the composition of structural units in different morphologicalregions. J Wood Chem Technol 1990, 10:435-459.
18. He L, Terashima N: Formation and structure of lignin in MonocotyledonsIV. Deposition process and structural diversity of the lignin in the cellwall of sugar cane and rice plant studied bu ultraviolet microscopicspectrometry. Holzforschung 1991, 45:191-198.
19. Browning B: Methods of wood chemistry. Wiley: New York; 1968.20. Lybeer B, Koch G, Acker JV, Goetghebeur P: Lignification and Cell Wall
Thickening in Nodes of Phyllostachys viridiglaucescens and Phyllostachysnigra. Ann Bot 2006, 97:529-539.
21. Grabber JH, Mertens DR, Kim H, Funk C, Lu FC, Ralph J: Cell wallfermentation kinetics are impacted more by lignin content and ferulatecross-linking than by lignin composition. J Sci Food Agric 2009,89:122-129.
22. Mendonça R, Ferraz A, Kordsachia O, Koch G: Cellular UV-microspectrophotometric investigations on pine wood (Pinus taeda andPinus elliottii) delignification during biopulping with Ceriporiopsissubvermispora (Pilat) Gilbn. & Ryv. and alkaline sulfite/anthraquinonetreatment. Wood Sci Technol 2004, 38:567-575.
23. Casler MD, Jung H-JG: Relationships of fibre, lignin, and phenolics to invitro fibre digestibility in three perennial grasses. Animal Feed Sci Technol2006, 125:151-161.
24. Rosgaard L, Pedersen S, Langston J, Akerhielm D, Cherry JR, Meyer AS:Evaluation of minimal Trichoderma reesei cellulase mixtures ondifferently pretreated barley straw substrates. Biotechnol Prog 2007,23:1270-1276.
25. Qing Q, Wyman CE: Hydrolysis of different chain length xylooliogmers bycellulase and hemicellulase. Bioresource Technol 2011, 102:1359-1366.
26. Mendes FM, Siqueira G, Carvalho W, Ferraz A, Milagres AMF: Enzymatichydrolysis of chemithermomechanical pretreated sugarcane bagasseand samples with reduced initial lignin content. Progress Biotechnol 2011.
27. Jung HG, Casler MD: Maize stem tissues: impact of development on cellwall degradability. Crop Sci 2006, 46:1801-1809.
28. Hansen MAT, Kristensen JB, Felby C, Jørgensen H: Pretreatment andenzymatic hydrolysis of wheat straw (Triticum aestivum L.) - The impactof lignin relocation and plant tissues on enzymatic accessibility.Biorerource Technol 2011, 102:2804-2811.
29. Grabber JH, Panciera MT, Hatfield RD: Chemical composition andenzymatic degradability of xylem and nonxylem walls isolated fromalfalfa internodes. J Agric Food Chem 2002, 50:2595-2600.
30. Chen F, Dixon RA: Lignin modification improves fermentable sugar yieldsfor biofuel production. Nature Biotechnol 2007, 25:759-761.
31. Lee SH, Doherty TV, Linhardt RJ, Dordick JS: Ionic liquid-mediated selectiveextraction of lignin from wood leading to enhanced enzymatic cellulosehydrolysis. Biotechnol Bioeng 2009, 102:1368-1376.
32. Spurr AR: A low viscosity epoxy resin embedding medium for electronmicroscopy. J Ultrastruct Res 1969, 26:31-43.
33. Koch G, Grünwald C: Application of UV microspectrophotometry for thetopochemical detection of lignin and phenolic extractives in wood fibrecell walls. In Wood Fibre Cell Walls: Methods to Study their Formation,Structure and Properties.Edited by: Schmitt U. Uppsala: Swedish Universityof Agricultural Sciences; 2004:119-130.
34. Ferraz A, Baeza J, Rodriguez J, Freer J: Estimating the chemicalcomposition of biodegraded pine and eucalyptus wood by DRIFTspectroscopy and multivariate analysis. Bioresource Technol 2000,74:201-212.
doi:10.1186/1754-6834-4-7Cite this article as: Siqueira et al.: Topochemical distribution of ligninand hydroxycinnamic acids in sugar-cane cell walls and its correlationwith the enzymatic hydrolysis of polysaccharides. Biotechnology forBiofuels 2011 4:7.
Siqueira et al. Biotechnology for Biofuels 2011, 4:7http://www.biotechnologyforbiofuels.com/content/4/1/7
Page 9 of 9