topic # 4 (chapter 6, part 1) project time management. (project...
TRANSCRIPT

Topic # 4(Chapter 6, part 1)
Project Time Management.(Project Scheduling)

Objectives
Understand the process of project decomposition into activities
Understand the level of details required for activities
Understand the process of sequencing activities
Time management: methods and tools

Importance of Project Schedules Managers often cite delivering projects
on time as one of their biggest challenges
CHAOS Report of 2016 (by The Standish Group):
- 32 % of all projects were successful(2015 – 29%);
- 44 % were late, or over budget, or with less than required features and functions(2015 – 52%);
- 24 % failed or cancelled(2015 – 19%)
Time is the most precarious element of the triple constraint: Time has the least amount of flexibility; it passes no matter what!
Survey of SW development Projects:
http://swprojectsurvey.blogspot.com/


PMBOK: Time Management (main steps):
1. Define activities and sequences
2. Estimate activity resources
3. Estimate activity durations
4. Develop project schedule

Defining ActivitiesDecomposition of parent activities: Depending on the technique used to create the Work Breakdown Structure (WBS), typically the work
packages are built by decomposing parent activities down into smaller and smaller units of work.
Each activity is decomposed into smaller and smaller units until the deliverable can be: 1) assigned to one person who is held responsible for the completion of the task, 2) a time and cost estimate can be accurately generated 3) schedule can be created 4) metrics can be tracked
Activity (task) characteristics: Status and/or completion is measurable
and can be reported easily at any time Start and End events are clearly defined
and easily communicated Each activity has a single deliverable Time and cost are easily estimated Activity duration is within acceptable limits (usually, it is no longer than 10 work days). This is not
a hard unbreakable rule but a suggested guideline that no activity be defined with an effort longer than two weeks
Work assignments are independent, you shouldn’t need to interrupt the work in the middle of an activity due to another activity not working as planned
Reminders: The 100% rule is in affect; all of the work packages defined must add up to 100% of the total scope
of the project Not all of the work packages will be defined at the same level of detail

Activity Sequencing
The two techniques of activity sequencing are 1. the precedence diagram method (PDM), and 2. the activity on arrow diagramming method (ADM).
You must determine correct dependencies to create a realistic schedule
Involves identifying and documenting the logical and sometimes physical relationships among schedule activities Mandatory dependencies: inherent in the nature of the work; for ex: write software
and then test Discretionary (optional) dependencies: defined by the project team, they offer the
most flexibility in project activities; for ex: optional course asignments External dependencies: based on work being performed by an entity outside of the
organization (for example, suppliers materials or providers of services or sub-contractors – BEC)
Regardless of which scheduling method is chosen, both PDM or ADM strive to graphically demonstrate the sequential relationships between activities

Precedence Diagramming Method (PDM)
Rules:
• Use boxes or circles to represent activities (tasks) and lines with arrows to represent the dependencies see example next slide
• The task names are for this example shortened to just letters.
• The lines with arrows are not labeled
• Notice that some of the activities (C, F, G, and H) have more than one predecessor; some only have a successor (Begin) and some only have a predecessor (End)
Sample of PDM in Microsoft Project
A task (activity)

Arrow Diagramming Method (ADM) or Activity-on-Arrow (AOA) Network Diagram
Rules:• Lines with arrows represent tasks• Circles with words or numbers represent the begin or end of a task
Processes:1. You draw the first Begin circle or node and then proceed with the tasks that do not have a
predecessor, usually the first tasks to be done on the project. These are shown in the diagram as lines A, K, and F
2. Then you move to the next tasks listed in the WBS in order of precedence. Activity B has a predecessor of A and Activity C has a predecessor of B and so on. Tasks M, G, and L have no successors so we draw their arrows to the End node
3. You add circles at the end of each arrow as an end point. At the end of the process you then number each circle
4. Be prepared as you draw this diagram to draw and then erase and redraw as you work your way down the task list
5. You may need to add dummy activities to complete the diagram
A task (activity)

Project Scheduling
Determines the planned start and completion dates for each activity listed on the WBS. The deliverable from this process is the project schedule.
Uses results of the other time management processes (activity definition, sequencing) to determine the start and end date of the project.
Techniques to develop (identify) project schedule:1. Critical Path Method (CPM) (or, minimum project time)2. Program Evaluation Review Technique (PERT) (with probabilistic approach)3. Resource Leveling4. Critical Chain Method (CCM)

Technique # 1: Critical Path Method (CPM)
CPM uses the sequence and duration of activities to determine the total project duration
A critical path for a project is the series of activities that determines the earliest time by which the project can be completed
Produces two key pieces of information: 1. the amount of slack time or also
referred to as float for each activity in the schedule and
2. the longest path through the schedule or said another way the shortest time the project can be completed referred to as the critical path
All activities that fall on critical path are referred to as critical path activities

An example: “Design and development of a new Web site for a department” project
Step # Name of an Activity (project step) Duration (days) Predecessor Successor
1 Analyze of existing Web sites 5 - 2
2 Create a Design Model(using Prototype approach)
8 1 3, 5
3 Development (coding) of Web site 7 2 4
4 Testing of Web site (links, functions) 4 3 6
5 Documentation (online HELP system) 3 2 6
6 Implementation (on department’s server) 4 4, 5 -
Main questions:
1. Total project duration ?
2. Project’s Critical Path ?

1
2 3
65
4
ES=5EF=13
CPM - Phase # 1:Calculation of Early Start (ES) and Early
Finish (EF) times(“From Project Start to Project End” move,
or from Left to the Right)
TT=5
TT=8TT=7
TT=3
TT=4
TT=4
ES=0EF=5
ES=20EF=24
ES=13EF=20
ES=24EF=28
ES=13EF=16
Task # Duration TT Predecessor
Successor
1 5 - 2
2 8 1 3, 5
3 7 2 4
4 4 3 6
5 3 2 6
6 4 4, 5 -
Compress all tasks to the beginning, move from left to the right in order to calculate ES and EF times
Project time = 28

1
2 3
65
4
LS=5LF=13
CPM - Phase # 2:Calculation of Late Start (LS) and
Late Finish (LF) times(from Project End to Project Start move,
or from Left to the Right
Project ends at 28 (from previous calc.)
TT=5
TT=8TT=7
TT=3
TT=4
TT=4
LS=0LF=5
LS=20LF=24
LS=13LF=20
LS=24LF=28
LS=21LF=24
Task # Duration TT Predecessor
Successor
1 5 - 2
2 8 1 3, 5
3 7 2 4
4 4 3 6
5 3 2 6
6 4 4, 5 -
Compress all tasks to the end, move from right to the left in order to calculate LS and LF times
Project time = 28

1
2 3
65
4
ES=5LS=5EF=13LF=13
CPM – Phases Combined and Outcomes:
ES and LS, EF and LF, TT and ST, and Critical Path
TT=5
TT=8TT=7
TT=3
TT=4
TT=4
ST=8
ST(5) = TT(3) + TT(4) – TT(5) = 7 + 4 – 3 = 8Critical Path
Non Critical Path
ES=0LS=0EF=5LF=5
ES=20LS=20EF=24LF=24
ES=13LS=13EF=20LF=20
ES=24LS=24EF=28LF=28
ES=13LS=21EF=16LF=24
Task # Duration TT Predecessor Successor
1 5 - 2
2 8 1 3, 5
3 7 2 4
4 4 3 6
5 3 2 6
6 4 4, 5 -
Critical Path: 1-2-3-4-6

Every PM must know project scheduling and corresponding tools (about 75 commercial systems are available):
Microsoft Project Smart Draw Oracle Primavera Scitor PS Suite™ SuperProject 5.0 SureTrak Project Manager 2.0 TurboProject Professional 2.0 CAN-PLAN (FREE) Project Management Software Rational Concepts Plan & Progress Tracker FastTrack Scheduler 5.02 Milestones, Etc. 5.0 Project Kickstart TodoManager 1.0 Visio Standard 5.0 ……………
Tools for Project Scheduling and Identification of CP
Source: http://www.startwright.com/project1.htm

Example of the CPM (using Microsoft Project Tool)

Technique # 2: Program Evaluation and Review Technique (PERT)
Uses a weighted average approach or beta probability distribution to capture the three point estimates (optimistic, most likely, and pessimistic) for activity duration
Optimistic time (O): the minimum possible time required to accomplish a task, assuming everything proceeds better than is normally expected
Pessimistic time (P): the maximum possible time required to accomplish a task, assuming everything goes wrong (but excluding major catastrophes).
Most likely time (M): the best estimate of the time required to accomplish a task, assuming everything proceeds as normal.
Time Expected (TE): the best estimate of the time required to accomplish a task, assuming everything proceeds as normal (the implication being that the expected time is the average time the task would require if the task were repeated on a number of occasions over an extended period of time).
TE = (O + 4M + P)/6The PERT weighted averages for each activity are added to the network diagram to show the start dates and finish dates for each and the final project end date
The Program Evaluation and Review Technique (PERT) was developed by the U.S. Navy in cooperation with the consulting firm Booz-Allen Hamilton for the Polaris missile/submarine project in 1958 to help organize the activities of 11,000+ contractors

Program Evaluation and Review Technique (PERT): An Example
A Gantt chart created using Microsoft Project (MSP).
Notes: 1) the critical path is in red,
2) the slack is the black lines connected to non-critical activities,
3) since Saturday and Sunday are not work days and are thus excluded from the schedule, some bars on the Gantt chart are longer if they cut through a weekend.

Example of PERT Diagram(using Microsoft Project Tool)

An Example of PERT Diagram(using SmartDraw scheduling tool)
Source: http://www.smartdraw.com/tutorials/gantt/tips.htm

Technique # 3: Resource Leveling (Loading)
Resource loading defines the amount of time a specific resource is needed over each time period by various activities (tasks)
Project software is great at highlighting issues of overloading a particular resource, i.e. having a resource working more time in a day than it is available.
The software will do this based on available slack and in order to achieve a more balanced distribution of resource usage.
Before Leveling After LevelingA fragment of networkdiagram
3 resources used during days ## 1 and 2
Only 2 resources used during days ## 1 and 2, A and B resources are sequenced

Topic # 4(Chapter 6, part 1)
Project Time Management.Homework Assignment.

Topic # 4(Chapter 6, part 1)
Project Time Management.
Additional (optional) information.

Critical Path Method (CPM)
Change of Critical Path: If one of more activities on the critical path takes longer than planned, the whole project
schedule will slip unless corrective action is taken The critical path may change as you enter actual start and finish dates during project
execution As soon as you know the project completion date will change, negotiate/communicate
with the project sponsor
Misconceptions: The critical path is not the one with all the critical activities; it only accounts for
time The critical path can change as the project progresses!!!!!!!!!
Shortening Critical Path: Knowing the critical path helps you make schedule trade-offs Shortening durations of critical tasks by adding more resources or changing their
scope Crashing tasks by obtaining the greatest amount of schedule compression for the least
incremental cost Fast tracking tasks by doing them in parallel or overlapping them

Analysis of AOA or PDM: Info Available and Benefits
Information available from analysis of AOA or PDM: Interdependencies of activities Project schedule and project completion time “What if” exercises Impact of late starts Impact of early starts Trade-offs between resources and time Cost of a crash program Slippages in planning/performance Evaluation of performance
Benefits: Provides a consistent framework for repeatable project successes Effectively illustrates the interdependence of all tasks Clearly denotes the dates that resources need to be available Determines milestone and project completion dates Identifies critical path activities that if delayed will delay the project completion date Identifies which activities are not on the critical path and thus can be delayed if needed
without affecting the project completion date Identifies resource availability Shows which tasks can or are being done in parallel

Project Schedule Benefits
Creates a consistent framework which can be followed from project to project and during the execution of the project
Illustrates the interdependencies of each activity on the WBS Facilitates communication within the project team and between the team and
stakeholders Aides in the identification of critical activities Aides the project manager to evaluate all alternatives and their impact when making
scheduling changes during the project Reduces the amount of resource scheduling conflicts Provides visibility to those tasks that can or must be run in parallel to keep the project
on track Facilitates “what-if” analysis

The Mythical Man-Month author Fredrick Brooks
Unfortunately, techniques used by most to do estimates are poorly developed. Many are based on a flawed assumption that all will go well. Problems and changes are sure to happen to the project and need to be considered
Many techniques confuse effort with progress, assuming that a person and time are interchangeable (?!)
“Adding manpower to a late software project makes it later.” Just putting more people on a task does not necessarily reduce the time it takes to complete it.
A man-month in estimating refers to how much work can be done by a worker in a given month, referred to today as “person-month” - “time-robbers” keep this from being 160 hours.

Time Robbers
• Task rework• Telephone calls, e-mail• Land mail• Incomplete work• Lack of needed authority• Inefficient change procedures• Waiting on people• Day-to-day administration• Too many levels of review• Casual office conversations
• Poorly run meetings• Executive meddling or micro-
management• Poorly motivated or educated
customers• Vague goals and objectives• Poor time management• Ill defined project scope• Company politics• Working on under-funded projects
Those activities that at first seem to be short and unobtrusive but when they are all added together can completely fill an entire work day

Critical Chain Method (CCM)
Murphy’s Law states that if something can go wrong, it will. Parkinson’s Law, Student Syndrome states that work expands to fill the time allowed. In
traditional estimates, people often add a buffer and use it if it’s needed or not
Critical Chain Nethod (CCM) is a method of scheduling that takes constraints into account when creating a project schedule and includes buffers to protect the project completion date unlike CPM which is only based on time
A buffer is additional time to complete a task.A duration is assigned to each task. Some software implementations add a second duration: one a "best guess," or 50% probability duration, and a second "safe" duration, which should have higher probability of completion (perhaps 90% or 95%, depending on the amount of risk that the organization can accept). Other software implementations go through the duration estimate of every task and remove a fixed percentage to be aggregated into the buffers.
Critical chain schedule removes buffers from individual tasks and instead creates A project buffer, which is additional time added before the project’s due date Feeding buffers, additional time added before tasks on the critical path

Critical Chain Method (CCM)
Powerful tool that involves: Critical path analysis Resource constraints, and Changes in how task estimates are made in terms of
buffers (reduce the over/under estimating game) Focus attention on critical tasks
Another issue presented by Goldratt which adds to the benefit of using buffers is the problem of resources multitasking with the idea of reducing idle time between tasks

Resource Estimation

Estimate Activity Resources Before estimating activity durations,
PM must have a good idea of the quantity and type or level of needed resources that will be assigned to each activity.
PM must consider important issues in estimating resources: How difficult/complex will it
be to complete specific activities on this project?
What is the organization’s history in doing similar activities?
Are the required resources available? Internal or External?
Very important to match the right person with the right task!
Process Activities: Activity resource requirements Resource calendars Assigned resources

Techniques for Resource Estimating1. Expert judgment (based on SME knowledge)
An estimator uses expert judgment to gain insight into the resource requirements for each individual work package. No estimator will have all the knowledge needed to assess an entire project. The estimator will need to consult Software SMEs—network engineers, database designers, software developers, and User SMEs—accountants, engineers, marketing people, and so on. The estimator seeks to determine what expertise is needed and what level of knowledge is required to complete the deliverable of the work package. (Do we need a senior network engineer with 10 years of experience? Or is this a task that a junior network engineer with 2 years of experience can handle?)
2. Analogous (based on previous projects)If the WBS was created using the analogous approach—that is, building the WBS using a similar project first and then editing to fit the uniqueness of the current project—the required resources have already been determined. Adjustments will be needed based on the lessons learned from the previous project and the uniqueness of the current project. For example, say that in the previous analogous project, a junior systems analyst with just one year of experience was assigned to develop the specifications for a small key piece of the application. The junior analyst who was struggling to complete the work didn’t want to look bad in front of his boss, so he worked very long hours and weekends to complete the assignment but didn’t report the extra effort. The task ended up getting done, but the quality was not up to expectations. The junior analyst then confessed his difficulties to his boss. If this information is not recorded and communicated, the same mistake will be made again.
3. Alternatives analysis (based on alternative possible solutions)Each work package will have alternative ways in which the work can be accomplished. Some examples include different skill levels of resources, internal versus external resources, technology selected, and time constraints. Some of these alternatives are voluntary choices, and others are required. For example, say that a new software package selected is written in Java, and no one on the current staff has Java experience. Or say that the added functionality needed for a student registration system must be done while the students are on break, so time is critical.
Avoid what Ed Yourdon’ calls the “Marine Corps mentality: Real Programmers Don’t Need Sleep”

Activity Duration Estimation

Activity Duration EstimatingDuration vs. Effort: Duration = the effort (actual amount of time worked on an activity) + elapsed (beyond,
over) time. Most SW workers work on more than one project at the same time period; so it may
take only 8 hours to complete an activity but will take 40 hours of duration to find time to get the 8 hours of work accomplished.
Estimates and Project Progress: Developing an estimate for a large technology project is a complex task requiring a
significant amount of effort. Remember that estimates are done at various stages of the project “Progressive
Elaboration” ROM (Rough Order of Magnitude) estimate: -25% to + 75% Budget (-10% to + 25%) Definitive (-5% to 10%)
Problems with Estimates: Many people doing estimates have little experience doing them. Try to provide training and mentoring People have a bias toward underestimation. Review estimates and ask important questions to make sure
estimates are not biased Management wants a number for a bid or just to look good to superiors, not a real estimate. Project
managers must negotiate with project sponsors to create realistic estimates

Activity Duration Estimating Methods To arrive at an estimate of time, you first determine which estimate of SW
project size is needed.
Many different techniques have been used:1. Task Sizing-Based Methods:
- LOC (lines of Code)-based;- FP (Function Points)-based;
2. Analogous Estimating3. Packaged: Top-down or Bottom-Up Estimating4. Three-point Estimating5. Simulation Estimating (Monte Carlo Method)6. COCOMO Model
After the effort has been sized using one of these methods, time estimates can be applied
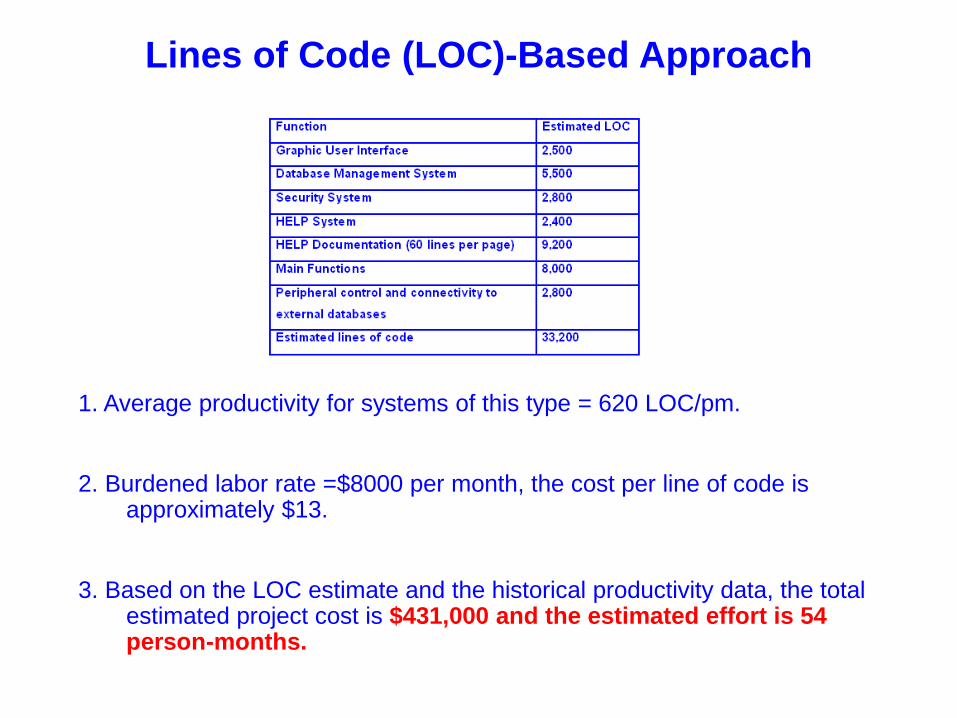
Lines of Code (LOC)-Based Approach
1. Average productivity for systems of this type = 620 LOC/pm.
2. Burdened labor rate =$8000 per month, the cost per line of code is approximately $13.
3. Based on the LOC estimate and the historical productivity data, the total estimated project cost is $431,000 and the estimated effort is 54 person-months.

Task Sizing Method: Lines of Code (LOC)
Has been one of the most used methods Based on historical results Effort, dollars, documentation, software bugs, and number of resources
Advantages Can be very quick and inexpensive to generate Can be done early in the process Universal metric Can be generated easily, in most environments automatically Facilitate a lessons-learned process
Disadvantages Must compensate for technology differences Can’t be done well unless relevant history exists Must determine what counts as a line of code What level of resource is generating the code No industry standards Need to distinguish between auto-generated code and original work Needs to be continually updated

Function Point (FP-Based) Approach
The estimated number of FP is derived:FPestimated = count-total 3 [0.65 + 0.01 3 S (Fi)]FPestimated = 375
organizational average productivity = 6.5 FP/pm. burdened (above and beyond) labor rate = $8000 per month, approximately $1230/FP. Based on the FP estimate and the historical productivity data, total estimated project cost is $461,000 and estimated effort is 58 person-months.

FP-Based Approach: Pros and Cons
Advantages: It is independent of programming language and technology It can be used early in the project life cycle at the end of the requirements discovery
phase or design phase A wealth of research exists to support the process Impact of scope changes easier for all to comprehend and track Organizations can track their own results and improve the function point estimates It can be used in any development environment
Disadvantages: Requires many subjective evaluations (complexity ratings and environmental factors) Accuracy is greatly increased only after the detailed design phase or after a few project
iterations have been performed Takes some time (training) to perfect and can vary depending on who is doing the
calculations due to personal bias

Analogous Estimating Bases a current work package time estimate on the actual time of a work
package from a similar project already completed Usually done in a “Top-down” approach Have 3 or 4 experts review requirements Make sure you have the experience and that the two systems are very
similar Can use time, or LOC, or Function Points

Package-Level or Bottom-Up Analogy
Involves estimating individual work activities and summing them to get a project total
Each person assigned to that work activity, does the estimate Can be time intensive to develop Dependent on each individuals ability to estimate Combining several independent estimates yields a better estimate than
separate estimates. Errors are randomly distributed; statistically speaking
(this is because there is no guarantee that the given estimates will be equally distributed about the mean)

Three Point Estimation Use a weighted average approach or beta probability distribution approach
to capture three point estimates for each work package Optimistic, Normal, Pessimistic
Equations for expected value (E), and the standard deviation (SD) are:E = (a + 4b + c)/6; SD = (c-a)/6
a = the optimistic estimateb = normal estimatec = pessimistic estimate
Adds the element of risk into its calculations
SME’s determine three types of estimates: Most Likely Optimistic Pessimistic
Next the SME uses the weighted average formula

Simulation (Monte Carlo Technique) This technique is an excellent way to assess how different project-related
variables will affect the project schedule, including different time estimates, cost estimates, risks, resources, and so on.
It randomly generates specific end values for a variable with a specific probability distribution

Empirical Estimation Models
General form:
effort = tuning coefficient * sizeexponent
usually derivedas person-monthsof effort required
either a constant ora number derived based on complexity of project
usually LOC butmay also befunction point
empiricallyderived

COCOMO First developed by Barry Boehm in 1981 Most widely accepted models available today Revised into version II in 1995 Version II setup to handle new development methodologies; RAD,
Iterative/Incremental, COTS packages, O-O application distribution, frameworks and components, etc.
Models available on website and algorithms are published. Commercial software exists
Copyright © 2010 Pearson Education, Inc. Publishing as Prentice Hall

COCOMO I and COCOMO II Models
Consists of three project types described as: Organic – small project teams, little innovation, constraints and deadlines are few, stable
development environments, known familiar technology, few changes expected Semidetached – medium sized project teams, some innovation, few constraints, tighter
deadlines, and more changes expected, still a fairly stable development environment Embedded – largest of the three in all categories, large project teams, constant innovation,
many constraints, very tight deadlines, and many changes expected, complex development environment
Organic: Effort = 2.4 x KLOC1.05 where KLOC = 1000 lines of code Duration = 2.5 x Effort0.38
Semidetached Effort = 3.0 x KLOC1.12 Duration = 2.5 x Effort0.35
Embedded Effort = 3.6 x KLOC1.2 Duration = 2.5 x Effort0.32

COCOMO Advantages
Advantages: Can be Quick Can be done early in the project Can be tailored to fit any organization Can be applied at different phases of the life cycle Many models exist to aid organizations in getting started
Issues: Ignores documentation and other requirements No compensation for customer attributes (availability, knowledge,
cooperation) Ignores personnel turnover issues Based on historical data which may be obsolete Used only to estimate the development effort, other phases of the project
(planning, implementation) are not accounted for

Project Duration: “A Cone of Uncertainty”
Estimates of the unknown at the beginning of the project will not be very accurate, too many unknowns.
As the project proceeds uncertainties narrow and estimates get clearer.
Remember that estimates are done at various stages of the project “Progressive Elaboration”