topconf : devops monitoring: feedback loops in enterprise environments
TRANSCRIPT
DevOps MonitoringFeedback Loops in Enterprise EnvironmentsMay 12th, 2015
Jonah Kowall, VP Market Development and Insights
Copyright © 2015 AppDynamics. All rights reserved. 2
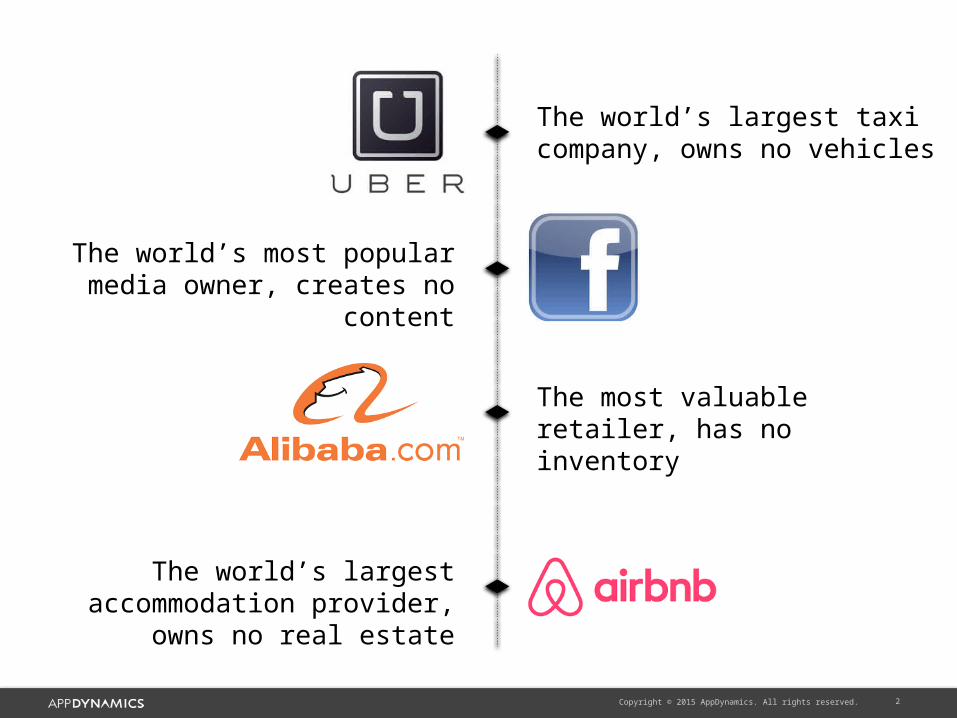
The world’s largest taxi company, owns no vehicles
The most valuable retailer, has no inventory
The world’s largest accommodation provider, owns no real estate
The world’s most popular media owner, creates no content

Copyright © 2015 AppDynamics. All rights reserved. 3
Massive shift: Nature of IT is changing
CRM
HRM
ECM
ERP $
BACK OFFICESystems of record
DIGITAL FRONT OFFICESystems of engagement
80% 2011
50% 2016
20% 2011
50% 2016

Copyright © 2015 AppDynamics. All rights reserved. 4
Agenda
1. What is Changing?
2. Why do we need to monitor?
3. How do we monitor?
4. What are the best practices in monitoring?
5. Why does monitoring suck?
6. How to create business context in monitoring?

Copyright © 2015 AppDynamics. All rights reserved. 5
Applications are Transforming
Conventional Enterprise Cloud "Native" Pattern
Adapted From Cloud Architecture Tutorial by Adrian Cockcroft (Netflix)
Central SQL Database
Sticky In-memory Session
Chatty Protocols
Tangled Service Interfaces
Polled Information
Fat Complex Objects
Components as Jar Files
Distributed Key/Value NoSQL
Latency Tolerant Protocols
Event-driven
Lightweight Serializable Objects
Components as Services
Layered Service Interfaces
Shared Memcached/Redis Session
Java, .NET JavaScript, Python, Ruby, node.js

Copyright © 2015 AppDynamics. All rights reserved. 6
Generic Feedback Loop
Change or
Correct
MeasureAnalyze

Copyright © 2015 AppDynamics. All rights reserved. 7
User Feedback Loop

Copyright © 2015 AppDynamics. All rights reserved. 8
DevOps Feedback Loop
Develop
Test
DeployMonitor
Analyze

Copyright © 2015 AppDynamics. All rights reserved. 9
Measurement: Push vs Pull
Both are essential and scalable
• Push • Easier to manage since new instances begin sending data• Real-time streaming of metrics/data• Monitoring system can have stale or otherwise
disconnected data• Must have centralized configuration management
• Pull• Centralized management of polls or requests for data• Must build specific infrastructure to scale polling

Copyright © 2015 AppDynamics. All rights reserved. 10
Measurement: Interrogation
Request a metric
Relies upon another device or manufacturer
Often an API
HTTP (WS), WMI, SNMP
HTTP, DNS, SMTP, TCP

Copyright © 2015 AppDynamics. All rights reserved. 11
Measurement: Observation
Inspect transaction/conversationAgent – APM Device - Network Capture (NPM)
Network
Application
Packet and Flow
Transaction
Code Instrumentation
ORGenerate, Gather, and Analyze/Parse Logs

Copyright © 2015 AppDynamics. All rights reserved. 12
How Is This Done
Ops - Out of the box instrumentationInfrastructureApplication ComponentsTransactions
DevelopersCustom InstrumentationMetrics, Logs

Copyright © 2015 AppDynamics. All rights reserved. 13
Overhead of Monitoring
Often ignored, even logs have an overhead, not just APM tools
Overhead impacts end user experience
Most do not measure end user experience, must measure with Real User Monitoring
Can verify impact of monitoring based on load testing or real users
Open Source RUM : Boomerang
Commercial tools : AppDynamics or other APM products

Copyright © 2015 AppDynamics. All rights reserved. 14
Not Just About the Application: Must Understand the End User
Know Your Fans!

Copyright © 2015 AppDynamics. All rights reserved. 15
We Have Data Now What?
AlertingCalculated rate of change
Never use a threshold
Anomaly detection improving
AnalyticsMostly reporting today, needs to
change with Machine Learning

Copyright © 2015 AppDynamics. All rights reserved. 16
Never Store Rates or Calculated Values

Copyright © 2015 AppDynamics. All rights reserved. 17
Too Many Graphs, Too Much Time Wasted
Typical NOC, inefficient.
Lots of screens and data.
Too many email alerts.
Alert on what matters for end-user experience, otherwise handle component or redundant outages without notification.
Very primitive, cobbled together, custom built solutions:• Nagios, Zabbix, or others doing alerting.
• Graphite dashboards.
• StatsD custom metrics.
• collectd service/system metrics.
• Elasticsearch, Logstash and Kibana (ELK) for logs.

Copyright © 2015 AppDynamics. All rights reserved. 18
New Web-scale Process Requirements: Deployment and Monitoring Are Now Linked
Deployment
Monitoring
Continuous Delivery
Source: http://www.flickr.com/photos/yandle/4337747398
Copyright © 2015 AppDynamics. All rights reserved. 19
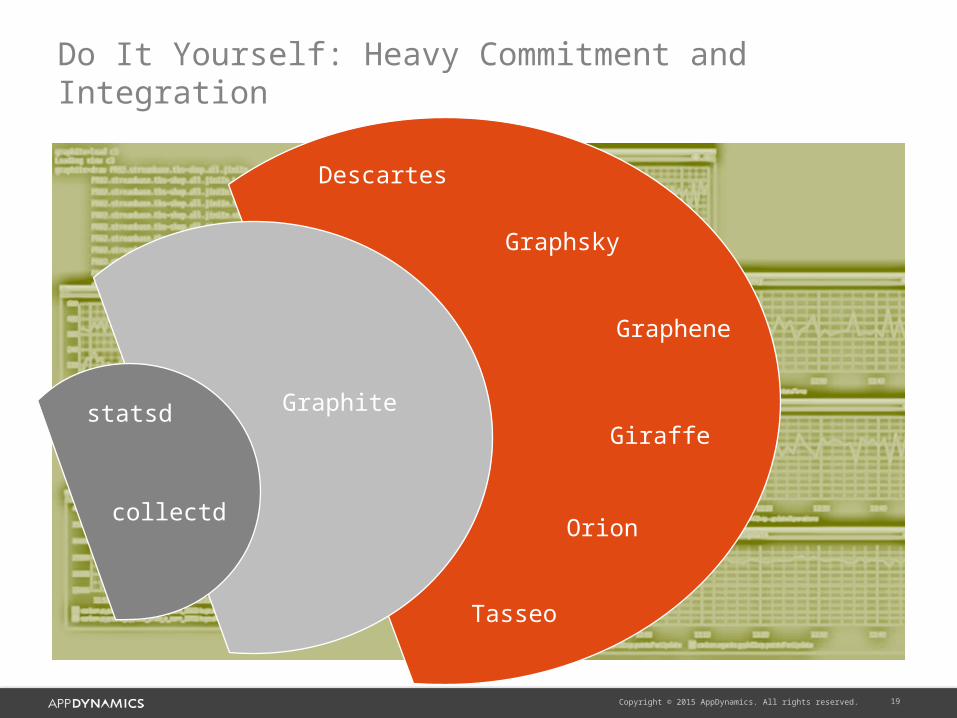
Do It Yourself: Heavy Commitment and Integration
Graphitestatsd
collectd
Graphsky
Descartes
Tasseo
Giraffe
Graphene
Orion
Copyright © 2015 AppDynamics. All rights reserved. 20
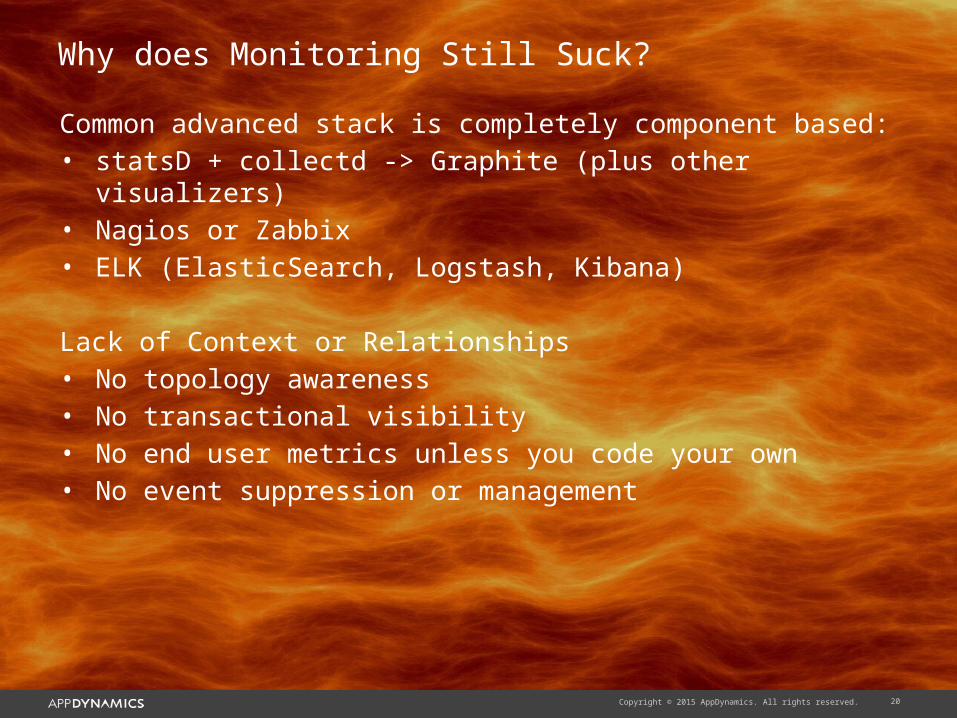
Why does Monitoring Still Suck?
Common advanced stack is completely component based:• statsD + collectd -> Graphite (plus other visualizers)• Nagios or Zabbix• ELK (ElasticSearch, Logstash, Kibana)
Lack of Context or Relationships• No topology awareness• No transactional visibility• No end user metrics unless you code your own• No event suppression or management

Copyright © 2015 AppDynamics. All rights reserved. 21
What Should I Monitor?
Server CPU, Memory, Network?Capacity? Utilization? Throughput?
Throughput is a rate, don’t measure that
If your business is selling server CPU, Memory, and network, yes, but most are not

Copyright © 2015 AppDynamics. All rights reserved. 22
Up Level the Conversation
Capture business transactions!How? (APM or Custom Instrumentation)
Assume you are a retail bank, you don’t just monitor the amount of money being deposited?
Monitor if your customers can deposit money and are depositing money
Is this a rate?Not if you store it as each transaction and analyze/display it as a rate.

Copyright © 2015 AppDynamics. All rights reserved. 23
Context is King: Unified Monitoring
ApplicationPERFORMANCE
InfrastructureCAPACITY%
End UserEXPERIENCE
BusinessREVENUE
MobileCRASH
Machine dataLOGS
Code DIAGNOSTICS
DatabasePERFORMANCE
Real userMONITORING

Copyright © 2015 AppDynamics. All rights reserved. 24
Buy it Already Integrated
Analytics• Visualization• Insight into data (ex: root cause, SLA violations)
Language Support• Java shop?• You will have more if you don’t already today
Application Stack Support • app server• Databases• Data stores• Cloud services
Deployment Flexibility• On premises maybe today• SaaS possibly in the future

Copyright © 2015 AppDynamics. All rights reserved. 25
It's Ultimately About Understanding Your Customers
"If you're not looking at your data (in its rawest possible form), then you don't understand your business and you almost certainly don't understand your customers"
— John Rauser (Amazon)
Thank You