top five practices contributing to best-in-class order-to
TRANSCRIPT

IBM Global Business Services Financial ManagementBenchmarking Brief
1
Top five practices contributing to best-in-class order-to-cash performance
IntroductionOver the years, Finance organizations have played an increasing role in developing enterprise strategy and helping achieve tactical objectives to improve operational performance, drive cost reduction, identify new revenue opportunities and forecast future performance. Increasing demands for this type of support have necessitated that Finance transform itself to become more efficient, and in so doing, free up resources — from traditional accounting transaction activities to more resources dedicated to decision support.
Optimizing performance of the revenue cycle helps organizations expedite their cash flows and increase available working capital. A comparison to IBM’s broader benchmarking database shows that European participants have a median cost for the revenue cycle of US$7.06 per US$1,000 revenue, of which an average of 70 percent constitutes personnel costs. Therefore, any increase in process efficiency can directly reduce process costs as, on average, approximately 20 percent of all Finance function FTEs are associated with the order-to-cash processes.
OverviewA recent study shows that the adoption of five leading practices improves median order-to-cash performance by as much as 83 percent in efficiency through FTE count reductions and associated higher transaction volumes processed per FTE, as well as up to 60 percent in key cycle time improvements. A statistical analysis of data from over 280 European benchmarking study participants quantifies the link between adoption of several leading practices and improved performance in key order-to-cash (revenue cycle) metrics. Benchmarking data shows that organizations that excel in revenue cycle efficiency and quality are more likely to have adopted leading practices which influence different parts of the cycle.
IBM Institute for Business Value

IBM Global Business Services Financial ManagementBenchmarking Brief
2
Manage sales orders
Process customer credit
Invoice customers
Process accounts receivable
Manage / process collections
Manage / process adjustments / deductions
Source: APQC Cross-industry Process Classification Framework.
Figure 1: This study included six processes within the order-to-cash (revenue) cycle.
Adoption of leading practices drives effectiveness and quality in the revenue cycleThe IBM Institute for Business Value Benchmarking Program performed a statistical analysis of data collected in 2011 from over 280 organizations across a range of European countries and industry sectors. The analysis provides empirical evidence that positively correlates the adoption of several leading practices with top quartile performance in a variety of order-to-cash FTE, cycle time, transaction volume, and other quality and efficiency performance measures. The study examined the entire revenue cycle (see Figure 1).
We examined the correlation between order-to-cash top quartile performance and the adoption of the following leading practices:
1. Using tools for automatic assessment and cleansing of customer and product master data
2. Evaluating new accounts and orders for credit quality 3. Enforcing centralized credit limits and controls for national and
international accounts4. Viewing customer adherence to payment terms as a key indicator
of the credit function’s performance5. Sharing write-offs with the credit function.
These leading practices impact different parts of the revenue cycle (see Figure 2).
Use automated assessment/cleansing of master data
Evaluate new accounts/orders for credit quality
Enforce centralized credit limits for accounts
Use customer adherence to payment terms as key indicator of performance
Share write offs with the credit function
Manage sales orders
Process customer credit
Invoice customers
Process accounts receivable
Manage / process collections
Manage / process adjustments / deductions
= Impact on the order-to-cash cycle
Source: APQC Cross-industry Process Classification Framework.
Figure 2: Different leading practices impact different processes within the order-to-cash cycle.

IBM Global Business Services Financial ManagementBenchmarking Brief
3
Percentage of all respondents that adopted the leading practiceS
elec
ted
orde
r-to
-cas
h le
adin
g pr
actic
es0% 20% 40% 60% 80% 100%
Share write offs with the credit function
83%
Enforce centralized credit limits/controls for national/
international accounts69%
Evaluate new accounts/orders for credit quality
59%
Use customer adherence to payment terms as key indicator of performance
42%
Use automated assessment/ cleansing of master data
10%
Source: IBM Benchmarking Program.
Figure 3: Adoption rate of selected order-to-cash leading practices.
Figure 4: Organizations that use tools to automatically assess/cleanse customer/product master data compared to those that do not.
0.8
4.3 4.1
1.3
2.8
0.8
2.1
0.7
81%better
83%better
54%better
62%better
Manage sales orders
Adopted Not adopted
Invoice customer
Accounts receivable
Collections
FTE
s pe
r US
$1 b
illion
re
venu
e, b
y pr
oces
s
Source: IBM Benchmarking Program.
These leading practices impact different parts of the revenue cycle (see Figure 2) and overall adoption rates varied considerably between leading practices (see Figure 3).
Most organizations share write offs with the credit function (83 percent adoption) and enforce centralized credit limits and controls for national and international accounts (69 percent adoption). However, only 10 percent of organizations use tools for automatic assessment and cleansing of customer and product master data.
Using tools for automatic assessment and cleansing of customer and product master dataThe use of technology to automatically assess and clean customer and product master data is a key enabler in maintaining high quality, consistent data. Accurate master data is a necessity to facilitate consolidated billing and collections, improve customer satisfaction, streamline visibility of inventory and provide a holistic view of the customer. It has significant impact on the number of FTEs per US$1 billion revenue for several key order-to-cash processes (see Figure 4). In particular, these organizations showed an improvement of over 80 percent in the median number of FTEs per US$1 billion revenue to manage sales orders and invoice customers, and over 50 percent improvement in the median number of FTEs to process accounts receivables and collections.

IBM Global Business Services Financial ManagementBenchmarking Brief
4
114
56,410
8313,194
37%better
428%better
Number of credit reviews* per customer credit FTE
Number of receipts per accounts receivable FTE
Med
ian
annu
al tr
ansa
ctio
nvo
lum
es p
er F
TE
Adopted Not adopted
*Credit reviews include only the account-level reviews performed to determine appropriate credit limits; it does not include transactional credit lookups that may be associated with the ordering process.
Source: IBM Benchmarking Program.
Figure 5: Organizations that evaluate new accounts/orders for credit quality compared to those that do not.
5.0 days
8.0 days
4.0 days
5.5 days
37%better
27%better
Median cycle time for credit approval
Median cycle time to generate complete and
correct billing data
Adopted Not adopted
Med
ian
cycl
e tim
es
Source: IBM Benchmarking Program.
Figure 6: Organizations that evaluate new accounts/orders for credit quality compared to those that do not.
Evaluating new accounts and orders for credit qualityCredit quality represents the overall financial health of an organization or individual and, by extension, its ability to fulfill financial obligations. Evaluating new accounts and orders for credit quality is an important practice to extend credit only where appropriate, and at the appropriate level. The impact of this practice is seen mostly in the customer credit, invoicing and accounts receivable processes through improvement in the number of transactions processed per FTE and key cycle times.
Transaction volumes per FTE: Organizations that evaluate new accounts and orders for credit quality show a 37 percent increase in the median number of credit reviews processed annually per FTE compared to those that do not. The difference is even more drastic when comparing the number of receipts per accounts receivable FTE annually. Organizations that have adopted this practice process more than four times the number of receipts (see Figure 5).
Cycle times: Organizations that have adopted this practice have lower median cycle times for credit approval and the generation of complete and correct billing data (see Figure 6).
Enforcing centralized credit limits and controls on national and international accountsCentralizing credit management within the organization facilitates greater efficiencies and improves customer service by consolidating credit operations into one consistent and cohesive talent pool with fewer personnel, as well as consistent credit policies and reporting. This practice directly impacts the customer credit and invoicing processes, and overall, the adoption of this practice was positively correlated with top quartile performance in transaction volumes and cycle times.

IBM Global Business Services Financial ManagementBenchmarking Brief
5
Transaction volumes per FTE: Median performance for organizations with centralized credit limits and controls was significantly higher for all transaction volumes. On an annual basis, FTEs processed more than five times the number of sales order line items and more than four times the number of invoice line items (see Figure 7).
Cycle times: Organizations with centralized credit limits and controls had a 60 percent faster cycle time to approve credit and a 33 percent faster cycle time to generate complete and correct billing data (see Figure 8).
Viewing customer adherence to payment terms as a key indicator of the credit function’s performanceThis practice particularly impacts the credit, invoicing and accounts receivable processes since firmly linking timely customer payments to the credit function’s performance provides incentive to optimize credit policies and mitigate credit risks. Organizations that adopted this practice showed significant improvements in: transaction volumes processed per FTE, key cycle times, and other efficiency and quality measures, such as electronic processing of invoices.
Transaction volumes per FTE: Median performance of organizations that view customer adherence to payment terms as a key indicator of the credit function’s performance was significantly better than that of organizations that assess the credit function only to a limited degree or not at all based on customer adherence to payment terms.
4.0
10.0
4.0
6.0
60%better
33%better
Credit approval Generate complete and correct billing data
Adopted Not adopted
Source: IBM Benchmarking Program.
Figure 8: Organizations that enforce centralized credit limits on national/international accounts compared to those that do not.
356K
62K
5.7xbetter
356K78
1.3xbetter
400K
92K
4.3xbetter
67K 10K
6.7xbetter
8K 3K
2.7xbetter
Sales order line items
Adopted Not adopted
Credit reviews
Invoice line items
Receipts Adjustments/deductions
Source: IBM Benchmarking Program.
Figure 7: Organizations that enforce centralized credit limits on national/international accounts compared to those that do not.
Med
ian
annu
al tr
ansa
ctio
nvo
lum
es p
er F
TE
Med
ian
cycl
e tim
es
(in d
ays)

IBM Global Business Services Financial ManagementBenchmarking Brief
6
Organizations that firmly link on-time payments to the credit function’s performance processed more than ten times the number of receipts per accounts receivable FTE, twice as many adjustments and deductions per adjustments/deductions FTE, and twice the number of credit reviews per customer credit FTEs than organizations that do not (see Figure 9).
0.0 2.0 4.0 6.0 8.0 10.0 12.0
8.0
11.0
2.0
0.0 2.0 4.0 6.0
5.0
4.0
3.0
Credit approval Create correct and complete billing data
Median cycle time in days
Key indicator / significant extent Limited extent Not at all
Source: IBM Benchmarking Program.
Figure 10: Organizations that view customer adherence to payment terms as a key performance indicator show significantly lower median cycle time in days.
0 100,000 200,000 300,000 400,000
20,833
19,545
287,500
0 50 100 150 200
63
83
176
0 5,000 10,000 15,000
4,000
5,000
10,000
Receipts Adjustments / deductions
Annual transaction volumes per FTE
Credit reviews
Key indicator/ significant extent Limited extent Not at all
Source: IBM Benchmarking Program.
Figure 9: Organizations that view customer adherence to payment terms as a key performance indicator show significantly higher annual transaction volumes per FTE.
Cycle times: The median cycle time to process customer credit for organizations that directly linked on-time customer payments to the credit function’s performance was only two days, compared to a median of 8 or more days for the other organizations. Furthermore, the data shows a linear progression in median cycle times to create correct and complete billing data. It took three days for those respondents who view on-time customer payment as a key indicator, compared to four days for those who connect the two to a limited extent and five days for organizations that do not connect the two at all (see Figure 10).
IBM Global Business Services Financial ManagementBenchmarking Brief
7
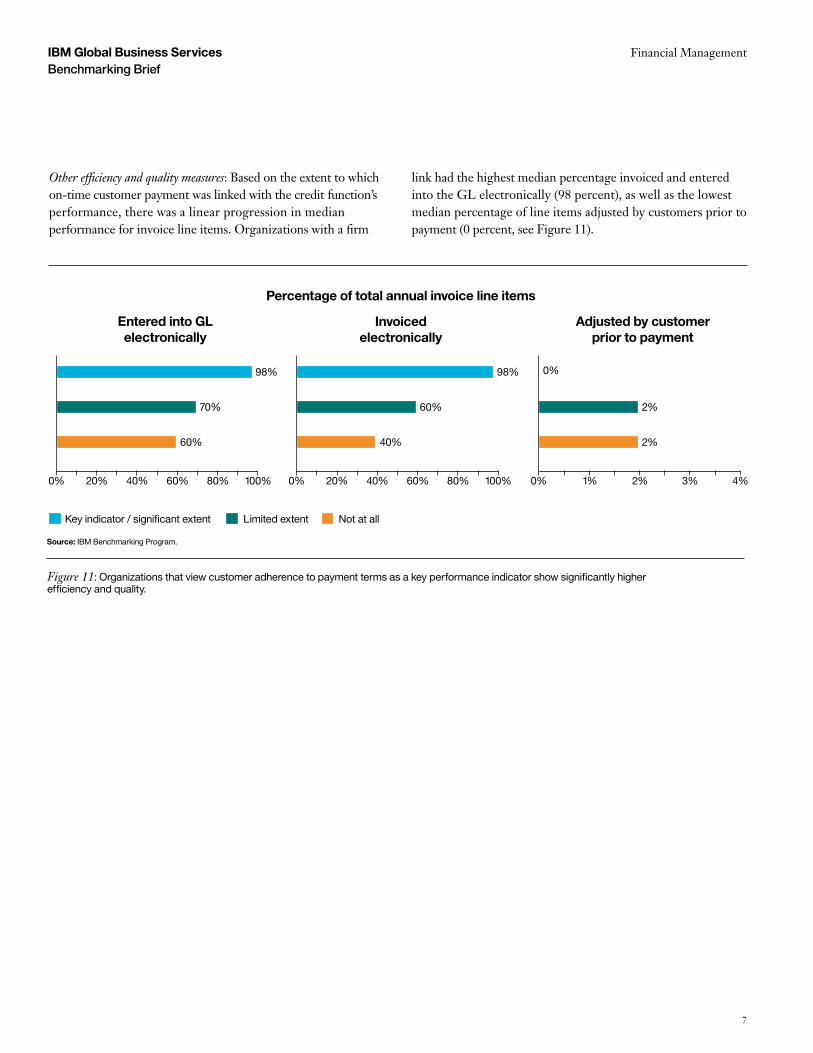
Other efficiency and quality measures: Based on the extent to which on-time customer payment was linked with the credit function’s performance, there was a linear progression in median performance for invoice line items. Organizations with a firm
0% 0% 0%20% 20% 1%40% 40% 2%60% 60% 3%80% 80% 4%100% 100%
60%
70%
98%
2%
2%
40%
60%
98%
Entered into GL electronically
Invoiced electronically
Percentage of total annual invoice line items
Adjusted by customer prior to payment
Key indicator / significant extent Limited extent Not at all
Source: IBM Benchmarking Program.
Figure 11: Organizations that view customer adherence to payment terms as a key performance indicator show significantly higher efficiency and quality.
link had the highest median percentage invoiced and entered into the GL electronically (98 percent), as well as the lowest median percentage of line items adjusted by customers prior to payment (0 percent, see Figure 11).
0%

IBM Global Business Services Financial ManagementBenchmarking Brief
8
They also had 30 percent lower days sales outstanding and received 16 percent more of their receipts electronically (see Figure 12).
Sharing write offs with the credit functionSharing write offs with the credit function is one example of establishing a cross-functional approach to working capital accountability and supporting collaboration between the credit and collections functions. This practice mainly impacts key cycle times in the credit, accounts receivable and adjustments/deductions processes within the revenue cycle. Organizations that share write offs with the credit function have a 37 percent faster cycle time for credit approval and a 20 percent faster cycle time to generate complete and correct billing data (see Figure 13).
There is no single solutionWhile the IBM benchmarking data clearly shows an improvement in quality and efficiency metrics associated with the adoption of several leading practices in the revenue cycle, there is no one practice that influences performance in all examined order-to-cash processes and performance measures. Together, these practices aid in generating revenue lift by eliminating some root causes for billing inaccuracies and by enabling an organization to tap into new customer risk segments using tailored pricing terms based on a better understanding of the organization’s credit risk and exposure. Improved invoice timing and accuracy help decrease days sales outstanding. And, a cross-functional information sharing approach on credit policies and write offs not only improves insight into customers and their payment behaviors — it also improves the dispute resolution process and results in lower write offs.
In terms of the number of FTEs, the order-to-cash process is one of the largest in the Finance organization; it certainly is an area with key impact on working capital. Adoption of the leading practices detailed here should be in conjunction with a more holistic review of other contributing factors that enable top performers. As examined in previous studies, an effective service delivery model that enables common technology and sound data management practices can make a crucial difference in Finance function performance. To effectively implement leading practices requires an organization to look closer at current capabilities and skills, delivery models, and IT infrastructure and architecture.
5.0
8.0
4.05.0
37%better
20%better
Credit approval Generate complete and correct correct billing data
Adopted Not adopted
Med
ian
cycl
e tim
es in
day
s
Source: IBM Benchmarking Program.
Figure 13: Organizations that view customer adherence to payment terms as a key performance indicator show significantly lower median cycle time in days.
Source: IBM Benchmarking Program.
Figure 12: Organizations that view customer adherence to payment terms as a key performance indicator show significantly better performance.
40
57
93%
80%
30%better
16%better
Avg. days sales outstanding Percentage of receipts received electronically
Key indicator of credit function’sperformance
Not at all/to a limited extent
Med
ian
perf
orm
ance
IBM Global Business Services Financial ManagementBenchmarking Brief
9
Learn more about Finance function challenges, trends, future insights and new business models through detailed case studies of how ten organizations transformed their Finance functions in the IBM Institute for Business Value study, “Journey to a Value Integrator” at http://bit.ly/olyVMl.
For more informationTo learn more about the IBM Institute for Value Benchmarking Program, visit, ibm.com/iibv/benchmarking.
The right partner for a changing worldAt IBM, we collaborate with our clients, bringing together business insight, advanced research and technology to give them a distinct advantage in today’s rapidly changing environment. Through our integrated approach to business design and execution, we help turn strategies into action. And with expertise in 17 industries and global capabilities that span 170 countries, we can help clients anticipate change and profit from new opportunities.
About the authorsAnnette LaPrade manages financial management and business analytics benchmarking for IBM Global Business Services. The IBM business process benchmarking team can be reached at [email protected] or [email protected].
Spencer Lin is an Associate Partner in Financial Management in IBM Global Business Services. He currently serves as the Finance & Risk Global Business Advisor and is responsible for strategy development, planning, market development and solutions. He can be reached at [email protected].
Carl Nordman formerly served as global financial management research team lead for the IBM Institute for Business Value responsible for research, thought leadership, global strategies and market insights for the CFO and Finance audience. He is currently a global project executive for Finance & Accounting outsourcing with a major IBM client. Carl can be reached at [email protected].
Key contactsTo learn more about IBM’s financial management solutions, contact one of our executive financial management leaders in your local geography:
Global and AmericasMartin Harmer [email protected]
Spencer Lin [email protected]
EuropePhil Berrington [email protected]
Alexander Vocelka [email protected]
Asia Pacific and Latin AmericaDon Maccorquodale [email protected]
Indrajit Roy [email protected]
JapanMie Matsuo [email protected]
References1 IBM Institute for Business Value. “The New Value
Integrator: Insights from the Global Chief Financial Officer Study.” March 2010. www.ibm.com/cfostudy
2 “Open Standards Benchmarking Assessments.” APQC. http://www.apqc.org/open-standards-benchmarking-assessments
Please Recycle
© Copyright IBM Corporation 2013
IBM Global Services Route 100 Somers, NY 10589 U.S.A.
Produced in the United States of America February 2013 All Rights Reserved
IBM, the IBM logo and ibm.com are trademarks or registered trademarks of International Business Machines Corporation in the United States, other countries, or both. If these and other IBM trademarked terms are marked on their first occurrence in this information with a trademark symbol (® or ™), these symbols indicate U.S. registered or common law trademarks owned by IBM at the time this information was published. Such trademarks may also be registered or common law trademarks in other countries. A current list of IBM trademarks is available on the Web at “Copyright and trademark information” at: www.ibm.com/legal/copytrade.shtml. Other product, company or service names may be trademarks or service marks of others. References in this publication to IBM products or services do not simply that IBM intends to make them available in all countries in which IBM operates.
GBE03544-USEN-00