top- down olfactory processing and brain … file1 a project report on ^top- down olfactory...
TRANSCRIPT

1
A PROJECT REPORT ON
“TOP- DOWN OLFACTORY PROCESSING AND BRAIN ACTIVATION IN SUBJECTS WITH OLFACTORY LOSS”
SUBMITTED BY
AKSHITA JOSHI
ENROLLMENT NO: 13/000755
UNDER THE SUPERVISION OF
Prof. Dr. med. THOMAS HUMMEL
(HEAD OF INTERDISCIPLINARY CENTER IN SMELL AND TASTE AT THE DEPT. OF OTORHINOLARYNGOLOGY)
TECHNICAL UNIVERSITY OF DRESDEN MEDICAL SCHOOL, GERMANY
CENTRE FOR CONVERGING TECHNOLOGIES,
UNIVERSITY OF RAJASTHAN (UOR),
JAIPUR (302004) RAJASTHAN, INDIA
2
DECLARATION
I hereby declare that the Dissertation entitled “Top down olfactory processing and brain activation in
subjects with olfactory loss” is an original and genuine research/ project work carried out by me under
the guidance of Dr. Thomas Hummel in Interdisciplinary Center for Smell and Taste at the Department
of Otorhinolaryngology, Technical University of Dresden Medical School, Germany.
This work has not been submitted in part or in full for a degree, a diploma, or a fellowship to any
other university or institute. Whenever contributions of others are involved, every effort is made to
indicate this clearly, with due acknowledgment of collaborative research and discussions. This thesis
is a bonafide record of original work done by me and all sources listed within have been detailed in
the bibliography.
Date:
Signature of candidate
Place- Dresden, Germany
Name: Akshita Joshi
Date:
In my capacity as the supervisor of the candidate’s project work, I certify that the above statement by the candidate is true to be the best of my knowledge.
Prof. Dr. med. Thomas Hummel
(Thesis Supervisor)

3

4
ACKNOWLEDGEMENT
Gratitude is that difficult sentiment which cannot be expressed in words, but still I would like to
thank my parents, teachers, friends and well-wishers for their overwhelming support and faith in me
throughout my educational journey.
I express my sincere regards and gratitude to my research supervisor Prof Dr med Thomas Hummel
and Prof Dr med Antje Hähner, in Interdisciplinary Center for Smell and Taste at the Department of
Otorhinolaryngology of the Technical University of Dresden Medical School Dresden, Germany who
permitted me to work in their department. I will be always grateful to their constant guidance,
suggestions, and support that helped me throughout the course of my dissertation.
I express my gratitude to my director Sir Ramvir Singh and my internal supervisor Prof. Sushila Pareek
and Dr.Devdatt Patel for their kind co-operation and encouragement which helped me in completion
of this project.
I would like to extend my special thanks to Mr. Pengfei Han, Dr. Cornelia Hummel, Lisa
Grzeschuchna, Theresa Herrmann, Eva, Elena Schäfer who helped me during the course of
experiments and being there when I needed their help. I would specially like to thanks Vanda Faria
and Pengfei Han, for helping me tackle the technical aspects of machine and help me in learning the
tool for analysing my data. My acknowledgement would not complete without mentioning my family
members. I am grateful to my parents for their blessing, enthusiasm, patience, unstinting support
and faith in my capabilities. They are always around with a warm hug and a word of support. This
work would not have been possible without them.
Thank you
Akshita Joshi

5
LIST OF FIGURES
S.No. Figures Page No.
1 UPSIT 17
2 Upsit scores in LRRK2 Parkinson Patients 20
3 Burghart Sniffin’ Sticks 20
4 Sniffin’ Sticks performance 22
5 Olfactory Pathway 23
6 Simplified illustration of olfactory
24
processing in brain
Comparison of ICA with NC in terms of how
7 functional aspects are affected by the loss 25
of smell
8 Gender wise comparison for ICA patients 26
Calculation of depth of sulcus and
9 comparison of depth of sulcus between ICA 27
and NC
Comparison between the deepest OS in the
10 PPTE plane in a patient with ICA and NC 28
subject
11 Regions with higher density and increased
28
cortical thickness in CA subjects

6
1
12 MRI images, pedigree, mutation of subject
30
with CA
13 Loss of olfactory bulb 31
14 Differences between orthonasal and
35
retronasal olfaction
15 Taste bud neuron triggers action potential
36
and transfer of signal to the brain
16 8 channel Olfactometer 41
17 Negative and positive peaks 42
18 International 10-20 system 43
19 Image technology 45
20 Block diagram of MR components 48
21 T1 weighted image with fat and CSF 50
22 T2 weighted image with CSF and fat 50
23 Proton density image 51
24 Experimental block design for olfactory and
52
trigeminal odor
25 Experimental block design of olfactory and
54
neutral words

7
26 Comparison of patient group and control
57 group to lateralization score
27 Comparison of patient group and control
58 group with regard to retronasal testing
28 Comparison of patient and control group
60 with regard to BDI
29 Comparison of patient group and control
61 group with regard to MoCA test
30 Brain activations in response to chocolate
62 odor
31 Brain activations in response to trigeminal
63 odor
32 Brain activations during expectancy (CA <
66 IA)
33 Brain activations during expectancy (CA <
67 NC)
34 Brain activations during reading of olfactory
69 58 associated words (CA> IA)
35 Brain activations during reading of olfactory
70 associated words (CA > NC)

8
LIST OF TABLES
S. No. Tables Page No.
1
Scoring of UPSIT for men and 18
women
2 TDI Sniffin’sticks score card 19
3
Sniffin’ Sticks test result for 56
study groups
4
Lateralization test results for 57
study groups
5
Retronasal test results for 58
study groups
6
BDI test results for study 59
groups
7
MoCA test results for study 60
groups
Statistical significantly
8
activated voxels following 61
chocolate odor for control
group
Statistical significantly
9 activated voxels for the 62
patient group
10
CA < idiopathic for chocolate 64
odor
11
CA < idiopathic for eucalyptus 64
odor

9
Statistical significantly
12 activated voxels for contrast 65
expectancy CA < IA
Statistical significantly
13 activated odors for contrast 66
expectancy CA < NC
Statistical significantly
14 activated voxels for reading 68
contrast CA > IA
Statistical significantly
15 activated voxels for reading 70
contrast CA > NC

10
ABSTRACT
Objective: To investigate top- down olfactory processing and brain activations in patients with
congenital (CA) or idiopathic anosmia (IA) in comparison to normosmic controls (NC) during
expectancy and reading of odor associated words.
Method: We investigated 3 different groups: CA (n=14) with a life-long inability to smell; IA with past
experience of smell (n=8) and NC (n=16). Within the MR scanner (3T, Siemens Prisma) participants
were presented with a stimulus within block design of 4 minutes duration per odor; odors were given
birhinally, using an olfactometer. This was followed by an 8 minute session of words with or without
olfactory associations, e.g. “banana” or “chair”. Blocks with odor-associated words were alternated
with blocks of neutral words. Data was analyzed in terms of (A) expectancy of and (B) response to
odor associated words.
Results: CA patients did not show significant olfactory-related activations in response to the control
odor (chocolate) but the trigeminal stimulant (eucalyptus) elicited selective activations in brain areas
bilaterally in the insular cortex and in the motor areas. Moreover, right inferior frontal gyrus and parts
of superior temporal gyrus also showed activations in response to the trigeminal stimulus given. In
the second session for analysis (A), expectancy, NC and IA subjects showed more activation as
compared to CA participants in the anterior cingulate gyrus along with the middle frontal gyrus of
prefrontal cortex. For analysis (B), overall CA patients exhibited more activation in the right insular
cortex and right caudate compared to IA and NC.
Conclusion: Trigeminal stimulation produces bilateral activations in insular cortex as a secondary
chemosensory area and activation in the inferior frontal gyrus may be an attempt to identify the
presented stimulus; whereas neuro-imaging results suggest a group difference during expectancy and
reading of odor related words. IA and NC subjects show more activation in anterior cingulate gyrus
and in the middle frontal gyrus, suggesting their olfactory related experience. On the other hand,
activations in CA patients suggest that the anterior insular cortex is strongly involved in the
processing of olfactory information even if there was no previous experience with odorous stimulus.

11
LIST OF CONTENTS
INTRODUCTION ....................................................................................................................................... 14
Types of olfactory disorders .................................................................................................... 15
Classification of smelling disorders ................................................................................................... 15
What causes smell disorders? .......................................................................................................... 15
DIAGNOSIS .................................................................................................................................... 16
ORTHONASAL OLFACTION ................................................................................................................ 16
RETRONASAL OLFACTION ................................................................................................................. 20
OLFACTORY MECHANISM: ........................................................................................................... 21
PATHWAY: ......................................................................................................................................... 22
FOCUS OF INTEREST: CONGENITAL ANOSMIA ............................................................................. 23
FUNCTIONAL BASIS: .......................................................................................................................... 24
STRUCTURAL BASIS: .......................................................................................................................... 27
GENETIC BASIS: ................................................................................................................................. 31
MATERIALS AND METHODS .................................................................................................................... 34
ETHICS STATEMENT ...................................................................................................................... 34
PARTICIPANTS: ............................................................................................................................. 34
LIST OF PHYSIOLOGICAL TESTS:.................................................................................................... 35 Medical history ................................................................................................................................. 35
Orthonasal test ................................................................................................................................. 35
Retronasal test .................................................................................................................................. 35
Spray test .......................................................................................................................................... 36
Lateralization test ............................................................................................................................. 37
Beck Depression Inventory test ....................................................................................................................... 38
MONTREAL COGNITIVE ASSESSMENT (MOCA) ................................................................................ 39
INSTRUMENTATION AND TECHNIQUES ....................................................................................... 40
OLFACTOMETER- .......................................................................................................................... 40 FLOW OLFACTOMETER: .................................................................................................................... 40
Specific issues related to OLFACTOMETER: ...................................................................................... 40

12
ELECTROENCEPHALOGRAPHY- ..................................................................................................... 42
Specific issues related to EEG: .......................................................................................................... 43
Analysis: ............................................................................................................................................ 43
Electrode Placement: ........................................................................................................................ 43
FUNCTIONAL MAGNETIC RESONANCE IMAGING – ..................................................................... 44
HISTORY OF MRI: .............................................................................................................................. 44
SPIN PHYSICS ..................................................................................................................................... 44
PRECESSION: ..................................................................................................................................... 44
LARMOR FREQUENCY: ...................................................................................................................... 45
SPIN EXCESS : .................................................................................................................................... 46
MRI HARDWARE:............................................................................................................................... 46
MR COMPONENTS- ........................................................................................................................... 46
How Does MRI work? ........................................................................................................................ 48
Basic MRI scans ................................................................................................................................. 49
STIMULUS DELIVERY ..................................................................................................................... 51
Experiment 1 ................................................................................................................................ 52 Brain activation in response to trigeminal and olfactory stimuli in subjects with olfactory loss..... 52
Experiment 2: ............................................................................................................................... 53
Top-down olfactory processing in subjects with olfactory loss ........................................................ 53
IMAGING DATA ACQUISITION AND ANALYSIS ........................................................................................ 55
RESULTS- ................................................................................................................................................. 56
LATERALIZATION TEST: ................................................................................................................. 57
RETRONASAL TEST: ....................................................................................................................... 58
BECK DEPRESSION INVENTORY TEST............................................................................................ 59
MOCA TEST ................................................................................................................................... 60 NEUROIMAGING RESULTS ...................................................................................................................... 62
Experiment 1 ................................................................................................................................ 62
Brain activation in response to trigeminal and olfactory stimuli in subjects with olfactory loss..... 62
EXPERIMENT 2 .............................................................................................................................. 65
12

13
Top-down olfactory processing in subjects with olfactory loss ........................................................ 65
CONCLUSION ........................................................................................................................................... 71
FUTURE ASPECT- ..................................................................................................................................... 71
BIBLIOGRAPHY ........................................................................................................................................ 72

14
INTRODUCTION
Olfactory system or the sense of smell is a very important part of our body, which seem to be overshadowed in a number of places as compared to other senses such as vision or hearing. Many people ignore the lack of sense of smell. Five major senses which are known as the five methods of perception include the sense of taste, sight, touch, smell, and sound. Both the sense of smell and taste, together are known as the chemical senses as they both give information of different chemical composition to the brain and the process by which the information is transferred is known as TRANSDUCTION. Olfaction is the way of sensing the smell.(Hummel and Nordin, 2005). This system is very essential in humans and is very important for a healthy and safe living.(Frasnelli and Hummel, 2005)
The olfactory system is important for the following roles:
- It plays an important role in an individual’s eating habit, providing flavor qualities and to protect one from dangerous situations (Croy and Hummel, 2017).
INGESTIVE BEHAVIOR: Brillat- Savarin’s “Physiologie du gout” highlighted the importance of olfaction in the
field of ingestion (which involves eating and drinking habits). The ingestive behavior can be studied in terms of
orthonasal and retronasal function. Orthonasal function helps to locate food and also whether the food is
suitable for eating or not. People with olfactory loss often complain about the risk of eating stale food and
also studies suggest that people with olfactory loss have been found to persist an unorganized eating habit (I.,
S. and T., 2014)(Stevenson, 2009). When we eat food, volatile chemicals are released which stimulates the
olfactory receptors via nasopharynx. This process is known as retronasal olfaction (Stevenson RJ et al., 2010).
Regulation of appetite forms a factor of human ingestive behavior. Some studies suggest that breastfeeding
depends on the ability by which the new-born babies find the nipple using olfaction as the cue.(Croy and
Hummel, 2017)
ENVIRONMENTAL HAZARDS: People with olfactory loss report more household accidents. Their social
relationships seem to be affected mostly with their partners and also enhanced social insecurity has been seen
in people with olfactory loss. The social insecurity refers to people they are not well-known with e.g.
acquaintances or colleagues at work. Environmental hazards could be microbial or non-microbial.
SOCIAL COMMUNICATION: The role of smell has proved to be important in reproductive behavior (Croy et
al. 2012). Women report scent of a prospective mate as an important determinant in the field of
attractiveness or smell being the most important factor in deciding about the mating partners. In
vertebrates, the reproduction related chemosensory signals were considered to function primarily
through the vomeronasal system, but recent studies suggest that the main

15
olfactory system is also sensitive to reproductive chemosensory signals (Sarafoleanu et al. 2009). Vertebrates
and humans appear to be able to detect danger or signals that are threat related and are due to a stressful
situation. Moreover, women as indicated in previous studies can detect the hazardous stimuli making it
possible for them to detect and be aware of dangerous and harmful circumstances. Infants use smell as an
indicator of breastfeeding. High stress and cortisol level is related to a range of behavioral impairments and
the sense of a familial odor helps in decreasing the stress level (Hummel and Nordin, 2005). Thus we can say
that olfaction has an important role in social life whether it is in terms of fear and safety (emotional stability)
or in terms of breeding (Croy et al. 2014).
Types of olfactory disorders:
People may have different types of smelling problems which may relate to decrease in the ability to smell or in the way they perceive the odors.
Hyposmia- People have a reduced ability to observe and detect the surrounding odors. Hyposmia
is also associated with the development of Parkinson’s and Alzheimer' disease.(Lötsch and Hummel, 2006)
Anosmia- Complete loss of sense of smell.(Schellinck and Brown, 2015) Congenital anosmia- Type of anosmia in which people are born with a life-long inability to smell.(Lötsch
and Hummel, 2006) Parosmia: Distorted perception of odors. Phantosmia: Continuous sensation of an odor that is not actually present(Patel and Pinto, 2014).
Classification of smelling disorders
Sinonasal Non-sinonasal
Sinonasal includes inflammatory (infectious or non- infectious) or non- inflammatory (anatomical or non-anatomical) type of olfactory disorders.(Hummel and Nordin, 2005)
Non-sinonasal causes include postviral, post-traumatic, toxic, congenital and others causes of olfactory loss.
What causes smell disorders?
Head injury With aging, a decrease in sense of smell is observed. Continuous exposure to chemicals such as insecticides. Infections of the upper respiratory tract. Seasonal allergies.

16
A disease such as Parkinson or Alzheimer which has an impact on the nervous system also leads to olfactory dysfunction.
Smoking
DIAGNOSIS:
Smell and taste disorders are diagnosed and treated by an otorhinolaryngologist. Some smell problems are
resolved after a particular period but some can long-last, which should not be neglected and proper treatment
should be taken with consultancy. Olfactory dysfunction can be an early symptom of Parkinson, Alzheimer’s
disease or multiple sclerosis (Haehner et al., 2007). It could result in other medical conditions such as obesity,
diabetes, hypertension and lack of nutrition.
Tests used for diagnosis of smell dysfunction includes orthonasal or retronasal olfactory functioning.
ORTHONASAL OLFACTION: This is the olfactory process which involves sniffing. There are numerous
tests used for the assessment of olfactory functions but the question lies whether which one of them is more reliable and can be used for more people around the world, as the most appropriate method has a great impact on the medical diagnosis patients.(Heilmann and Hummel, 2004)
• The University of Pennsylvania Smell Identification Test (Doty, 1989) or CC-SIT (Doty et al., 1996) has
reached the widest degree of distribution. It is a multiple forced choice scratch and sniff test in which
40 odorants are given to an individual out of which they are asked to select the item which best
describes the odor from a list of 4 options. The test is based on microencapsulated odors which are
released after scratching the surface with the help of a pencil. This test was first introduced in North
America by Doty and colleagues at the University of Pennsylvania. Followed by the identification test,
threshold test was used, so as to get a clearer scenario of the patients. Cain and Rabin (1989)
combined the threshold test with the odor identification test in the Connecticut Chemosensory Clinical
Research Center Test (CCCRC). In this test, the threshold for butanol was assessed in each subject by
merely squeezing the bottles using the method of ascending limits (Doty, Marcus and William Lee,
1996).
In Europe and Asia (except Japan), the UPSIT has been introduced in versions specifically adapted to
the local population. In UPSIT there were some odors which were not known to the people of Europe
and Asia and so the reliability of the test was low for the people living in that region. Available
clinical tests so far focus on verbal odor identification (UPSIT) (Doty et al. 1984).

17
Figure 1 University of Pennsylvania Smell Identification test (Richard L. Doty Vidyulata Kamath 2014
The scoring criteria of UPSIT was set up separately for men and women.

18
Correctly identified odors Correctly identified odors Degree of disorder
(men) (women)
≤5 ≤5 Probable simulation
6-18 6-18 Microsmia
19-25 19-25 Strong hyposmia
26-29 26-30 Moderate hyposmia
30-33 31-34 Weak hyposmia
34-40 35-40 Normosmia
Table 1) Scoring of UPSIT for men (over 15 years) and women (over 10 years)(Doty et al., 1984)
• The Sniffin’ sticks are felt tip pens which are filled with odorants. It should be noted that the odor will
be released if the cap is left open for long which can lead to adaptation to the participant,
environmental contamination and decreased usability of the pens. Point should be noted that the pen
should be held at 2 cm distance from the nostrils.(Kobal et al., 1996)
The Sniffin Sticks test was designed to include verbal as well as non- verbal components. The test comprises of three parts:
1. During the Odor Identification test subjects have to choose one of 4 choices presented after sniffing the pens. The test consists of 16 odors. Importantly, all of them should be familiar to the general population.
2. This is followed by the Odor Discrimination in which subjects are presented with three odorants and
the participants are asked to identify the sample given which has a different and the odd one out
smell (Hummel et al., 1997). The subjects are blindfolded and he pens are presented one by one, out
of which two are of same smell and the third being the odd one out that has to be pointed out. The
odorants should all be of the same intensity. The interval between each triplet should be of 30
seconds and each pen should be exposed for 3 seconds (Sorokowska et al. 2014). A total of 16 triplets
are administered.
3. Odor Threshold is assessed using the rose- like odor pehnylethylalcohol and the dilutions are always done
in a geometric series (Hummel et al., 1997). The procedure is the same as the discrimination in which

19
triplets are presented one by one, out of which two have no smell and the one having a smell is to be pointed out. Subjects are blindfolded for the process. The test consists of 16 dilution steps.
Instructions:
• Patient should not eat or drink anything 15 minutes prior to the experiment.
• Disturbance during the measurements should be avoided.
• Odorless gloves should be used by the investigator.
Participants should select one of the four options which best suits and describe the odors accordingly. If the participants are not sure about the smell, they are asked to make a choice.
The test result is a total of all the scores from odor identification, discrimination and threshold.
Age (years) Score Degree of disorder
< 16 >25 Normosmic
16-25 Hyposmic
<16 Anosmic
16-35 >32 Normosmic
16-32 Hyposmic
<16 Anosmic
36-53 >29 Normormic
16-29 Hyposmic
<16 Anosmic
>53 >28 Normosmic
16-28 Hyposmic
<16 Anosmic
Table 2) TDI Sniffin’ sticks score card (Hummel et al., 1997)

20
Figure 2) Burghart Sniffin‘ sticks / extended test 2- Phenylethanol
Figure 3) Sniffin‘ Sticks performance (Burghart Messtechnik)
RETRONASAL OLFACTION: It relates to the perception of food we eat. It contributes to orthonasal smell and
gustatory function (Shepherd et al. 2011). Retronasal olfaction shapes flavor that reach the olfactory cleft
through the pharynx during eating and drinking process. People having smell disorder sometimes complain
about the decrease in “taste”. Also often the loss of retronasal olfaction is mistaken with a loss of gustatory
function. The flavor of an apple or a pear which we perceive during eating is an example of a retronasal
olfactory percept (Landis et al. 2005).

21
OLFACTORY MECHANISM:
The sense of smell is a chemical sensation and one of the most important human senses. The smell we perceive
is mixed with air and is present in the gaseous state. The dendrites of neuron carry olfactory cells (Whitman
and Greer, 2009). Attached to olfactory rods or dendrites are present cilia which project upwards and act like
an antenna. These are present in the mucosal layer. In total there are about 6-30 million of olfactory receptor
neurons per nostril. The olfactory receptor neuron project to the olfactory bulb where the axon of olfactory
receptor neuron synapses with mitral cells in areas called glomeruli (Manzini, Frasnelli and Croy, 2014).
There are two types of neurons present in the olfactory bulb.
Mitral cells Tufted cells
Tufted cells are the minority cells present in the olfactory bulb. Axons reach the opposite end passing
through the anterior commissure which extends up to the olfactory bulb. They reach the limbic system and
the hypothalamus, whereas the other kind of cells i.e. the mitral cells extend up to the pre-piriform cortex.
As mentioned earlier, the olfactory system is important in the way we sense and perceive the molecules
present in the air, which are then detected by the sensory organs. Next process, after identification and
detection by the sense organs is that these signals are sent to the brain. The olfactory system depends on
brain, nerves and the sensory organs (Bailey et al., 2018). Let us throw some light on the structures involved
in the olfactory system.
Nose- Nose is an external opening which has two nostrils and allows air to enter the nasal cavity. It filters and humidifies the outer air and makes it warm.
Nasal cavity- Nasal septum divides the nasal cavity into left and right cavity and it has mucosal
lining around it.
Olfactory epithelium- It is a special type of tissue present in the nasal cavity which has nerve cells present in it. These cells send signals to the olfactory bulb.
Cribriform plate- Cribriform plate separates the nasal cavity from the brain. The nerve fibers related
to olfaction extends through the hole to reach olfactory bulb.(Stockhorst and Pietrowsky, 2004) Olfactory nerve: It is the first cranial nerve involved in olfaction.
Olfactory bulb- These are bilateral bulb structures which are present in the forebrain. In congenital
anosmic subjects, olfactory bulb is absent whereas in anosmic patients reduction in bulb volume is seen as compared to healthy subjects.
Olfactory tract- It is a bundle of nerve fibers which arise from each olfactory bulb and extends to
the olfactory cortex of the brain.
Olfactory cortex- It is a part of the cerebral cortex that receives the neural information from the olfactory bulb (Merkelt et al., 2017).
Olfactory sulcus- Olfactory sulcus (OS) is a deep groove on the ventral surface. It overlies olfactory
bulb and the olfactory tract.

22
Figure 4) Olfactory pathway (image source: CDN:biologydiscussion.com)
PATHWAY: Olfactory epithelium present in the nasal cavity has millions of receptor neurons which detect odors. When we
identify an odor, we sniff it and odorous molecules get dissolved in the mucus. Receptor neurons detect the odor
and the signals are sent to the olfactory bulb which is then taken to the olfactory cortex along the olfactory tract.
Olfactory cortex present in the temporal lobe is important for the processing of odorous information. It is also an
important component of limbic system (Sarafoleanu, C, et al., 2009) which is located on top of the brain stem and
beneath the neocortex. Its function includes the regulation of emotions related to anger and fear.

23
It is also involved in feeling of pleasure and those experienced by eating. Olfactory cortex is also connected to
other parts of the limbic system which are also involved in olfactory perception. Amygdala is among the
primary olfactory area activated when odors are presented to subjects. It mediates the connection of odors
and emotion. Hippocampus and hypothalamus are parts also seen to be activated where hippocampus
manages memories and hypothalamus regulates emotional connectivity. Therefore, the limbic system connects
the sense of smell in forming memories and regulating emotions respectively. Many studies suggest that
piriform cortex is also activated in relation to olfactory-related studies. The piriform cortex processes visual and
mental response or expectations are already set in association to the particular fragrance. For example, when
we see a rose we have an expectation that the odor will be pleasant and that is what influences the way we
perceive the stimulus. (Stockhorst and Pietrowsky, 2004)
Figure 5) Simplifies illustration of olfactory processing in brain; image source:
Bromley SM (2000).
FOCUS OF INTEREST: CONGENITAL ANOSMIA (CA)
Congenital anosmia is an inborn condition in which patients are born with a lifelong and lifetime inability
to smell. There is a complete loss of olfactory perception and the aplasia (absence) or hypoplasia
(underdevelopment) of the olfactory bulb.(Frasnelli, Schuster and Hummel, 2007)

24
Studies show that patients with CA also have enhanced intranasal trigeminal chemosensory perception (Hummel et al., 2006).
Brain structural changes in congenital anosmia:
Olfactory dysfunction can be classified as syndromic or non- syndromic.
Syndromic means the genetic or the complete level which has a general deficiency in the morphotype. Example, Kallmann syndrome.
Non-syndromic means the incomplete or isolated condition.
Olfactory dysfunction may be due to disruptions in the signal transduction, malformations in olfactory-related brain areas. Most cases of isolated congenital anosmia occur sporadically with no family history (Karstensen et. al., 2011)
Magnetic resonance imaging (MRI) is known to be a key factor in clinical diagnosis indicating absence or
underdevelopment of olfactory bulbs and flattening of the olfactory sulcus. Let us discuss this aspect into
three separate bases: functional, structural and genetic basis.
FUNCTIONAL BASIS:
Learning the functions of olfactory system (Croy et al., 2012).

25
Figure 6) Comparison of ICA with NC in terms of how functional aspects are
affected by the loss of smell. The functional learning considered are household
accidents, social insecurity and a number of sexual relationships (Nc = 36; NICA
= 32).
ICA subjects significantly agree to have more number of household accidents as compared to
healthy controls. They also report cases with social insecurities. Controls report a number of
different sexual partners compared to ICA subjects.
Importance of sense of smell in terms of sexual relationships.
Functional comparison between male and female was done for the subjects with CA and healthy
subjects; where error bars represent standard deviation at p < 0.001.

26
Figure 7) Gender wise comparison for ICA patients with respect to social
insecurity, number of sexual relationships and in terms of partnership
security (Croy et al., 2013)

27
According to the figure above, studies suggest that men and women show enhanced social
insecurity but with different consequences. Men who are born without a sense of smell tend to exhibit a reduced number of sexual relationships whereas women feel less secure about their partners (Croy et al. 2013)
STRUCTURAL BASIS:
The depth of olfactory sulcus in the PPTE (plane of the posterior tract through the eye ball) is
a useful tool for the diagnosis of CA.
Figure 8) To calculate depth of sulcus a straight line tangent to the top of the gyrus rectus and
medial orbital gyrus is drawn and the depth of olfactory sulcus is measured by drawing a line
perpendicular and connecting it with the deepest point of the Olfactory sulcus (Huart et al., 2011)

28
Figure 9 Shows the depth of OS in plane of the posterior tangent through the
eyeballs (PPTE) in patients with CA compared to NC (Huart et al., 2011)
Figure 10) Comparison between the deepest OS (white arrow) in the PPTE plane in a patient with an isolated anosmic patient and a control subject (Huart et al., 2011).
29
Differences between the depths of OS in subjects with CA were only found when measurements
were done in PPTE. The depth of the OS in the PPTE if less than or equal to 8 mm; patients likely to have CA
condition. The depth of OS measured in PPTE reflects the presence of olfactory tracts; used as a major indicator
in the diagnosis of isolated anosmia. The finding is in contrast to that observed in acquired anosmia, where a reduction in olfactory
function is associated with less thickness and volume. CA subjects have been seen to show large grey matter volume in the piriform cortex and the
entorhinal cortex.
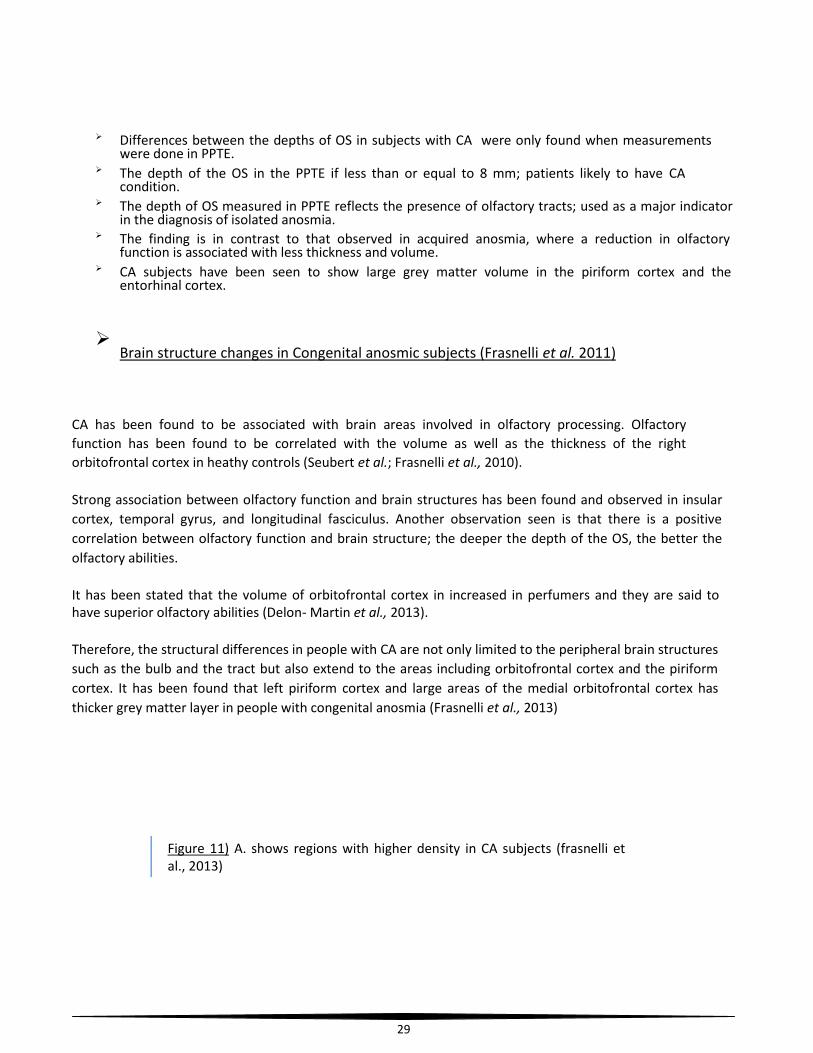
Brain structure changes in Congenital anosmic subjects (Frasnelli et al. 2011)
CA has been found to be associated with brain areas involved in olfactory processing. Olfactory
function has been found to be correlated with the volume as well as the thickness of the right
orbitofrontal cortex in heathy controls (Seubert et al.; Frasnelli et al., 2010).
Strong association between olfactory function and brain structures has been found and observed in insular
cortex, temporal gyrus, and longitudinal fasciculus. Another observation seen is that there is a positive
correlation between olfactory function and brain structure; the deeper the depth of the OS, the better the
olfactory abilities.
It has been stated that the volume of orbitofrontal cortex in increased in perfumers and they are said to have superior olfactory abilities (Delon- Martin et al., 2013).
Therefore, the structural differences in people with CA are not only limited to the peripheral brain structures
such as the bulb and the tract but also extend to the areas including orbitofrontal cortex and the piriform
cortex. It has been found that left piriform cortex and large areas of the medial orbitofrontal cortex has
thicker grey matter layer in people with congenital anosmia (Frasnelli et al., 2013)
Figure 11) A. shows regions with higher density in CA subjects (frasnelli et al., 2013)

30
(B) show increased cortical thickness found in the medial orbitofrontal cortex bilaterally and
decreased thickness in the posterior orbitofrontal cortex. (left superior longitudinal fasciculus, left
entorhinal cortex, left piriform cortex, posterior orbitofrontal cortex)( Frasnelli et al., 2013)

31
GENETIC BASIS:
First mutation in CNGA2 in two brothers with anosmia (Karstensen et al., 2014)
Figure 12) (a) MRI images of two brothers were taken where the mother is a
heterozygous mutant of CA condition; olfactory bulb and olfactory sulcus have
been seen (b) pedigree of family; m (mutants) (c) mutation seen in both the
brothers where mother is heterozygous mutant and both the sons are
hemizygous mutant II-1 and II-2(Karstensena et al., 2014)
Previous studies on mice show that the cyclic nucleotide-gated channel subunit CNGA-2 (expressed in the olfactory epithelium) has an important role in olfactory signal transduction.
Exome sequencing was used to identify the X- linked stop mutation with respect to CNGA-2 in two brothers
with anosmia.
Therefore, to conclude on the genetic basis it can be noted that CNGA-2 is seen to be essential for
olfaction in humans and the phenotype that was observed in mice can be replicated in humans with a hemizygous null-mutation. (Karstensena et al.)

32
Numerous fMRI studies have been done regarding olfactory function but a lot is remaining to find out about
the trigeminal system. Olfactory and trigeminal stimuli have been known to share close relationships. There
are some odorants found in nature which can stimulate trigeminal sensations as well. Trigeminal odor
stimulation has the power to exhibit olfactory sensations (Cain et al. 1980) and the impact of trigeminal odor
has been found to be difficult to assess when sensed by people with normal sense of smell whereas olfactory
stimuli when perceived by an individual results in either amplification or inhibition of the effect (Kobal and
Hummel 1988). According to research done, subjects that have no sense of smell and are congenital in nature
exhibit a decreased trigeminal sensitivity (Frasnelli et al., 2007). Trigeminal odor has been known to show
cooling sensation which when given for a long time produce irritation and thus leaving a great, long impact
and pain to an individual.
Trigeminal nerve gets activated when a trigeminal odorant is being introduced. As known, trigeminal nerve is
the 5th
cranial nerve and is responsible for the facial and motoric response and activations. this nerve is the
largest cranial nerve. The trigeminal nerve has sensory as well as motor functions where sensory function
provides tactile and nociceptive movements to the face and to the mouth. Motor function activates the
motoric responses and the motor-related areas. With smelling as the exception all the sensory information is
been sent to thalamus followed by the cortex.
BACKGROUND AND AIM OF THE STUDY:
Odors quickly trigger emotional memories and feelings, and it is well known that odors are partially processed
in the information processing brain areas. Although the precise functioning and the exact brain pathways on
which odors are processed emotionally are not known in functional magnetic resonance imaging, it should be
examined whether persons with olfactory disorders process given stimuli differently than persons with
completely intact olfactory abilities.
EXPERIMENT 1:
AIM-
To study chemosensory brain activation in people with congenital anosmia and patients with idiopathic olfactory loss.

33
HYPOTHESIS-
People with olfactory loss show preserved function in the processing of trigeminal stimulus as compared to olfactory stimuli.
At the end of complete stimulatory period, participants were asked to evaluate and describe the stimuli in
terms of intensity (0-10; "not identifiable or not perceived" to "strongly perceived"), coldness, warmth, and
pleasantness (-5 to +5; "extremely unpleasant" to "extremely pleasant"). Moreover, participants especially
patients were asked to name the perceived odorants.
EXPERIMENT 2:
AIM-
To investigate top-down olfactory processing in patients with CA or IA in comparison to NC during expectancy and reading of odor associated words.
HYPOTHESIS-
Olfactory loss patients have increased activation during reading of olfactory words whereas when the
instructions are given (expectancy) controls and idiopathic patients know what to expect and so they
have more activations during expectancy.
Presentation software is used to display words to participants lying in the scanner. Twelve blocks of olfactory
words are followed by 12 blocks of neutral words. The instruction or the expectancy is taken for 2.5 seconds,
three words are displayed one at a time for 2.5 seconds. Each word is separated from the other by a inter
stimulus interval of 1 second. At the end of each block is the off period of 6 seconds where the participants
can relax. The off period is not analyzed. The total time for this experiment is 8 minutes.

34
MATERIALS AND METHODS
ETHICS STATEMENT:
The current study was approved by the Ethics Committee of the Medical Faculty at the Technical University of
Dresden and all the experiments were performed according to the principal of the world Helsinki medical
association’s declaration. Participants were asked about their willingness to take part in a study on smelling
and it was assured that they received oral and written information, and that they provided written consent.
PARTICIPANTS:
Originally 30 subjects with the olfactory disorder and 30 healthy controls should be recruited, but due to the
study criteria and demand, only 16 normosmic subjects and 22 subjects with the olfactory disorder were
analyzed for the study. There was no significant difference with respect to age group and all participants were
from 18 to 76 with a mean age of controls; 48 ± 3 years and mean age for patients being 42 ± 4 years. In other
terms, the controls and patients were age and sex matched. Eight idiopathic olfactory loss patients and 14
congenital anosmic subjects were included in the patient group.
Patients were from the center for smelling and tasting with hyposmic/ anosmic symptomatology, the ones
which had limited or lack of the smelling ability. The healthy individuals should have a normosmic or normal
smelling ability. Age over 18 years informed consent to the reporting of incidental findings on MRI healthy
individuals. Participants were asked about significant health impairments (example; diabetes mellitus, renal
insufficiency) that may be associated with disturbances of olfactory function, also information about healthy
individuals having nasal related issues in the past have been noted down.
Participants having respective olfactory disorder were diagnosed on the basis of their medical history, electro physical measurements, psychophysical testing, and magnetic resonance imaging.
Magnetic resonance imaging show that the CA subjects had no olfactory bulb whereas for the idiopathic olfactory loss subjects the OB was found to be underdeveloped or absent.(Rombaux, Grandin and Duprez, 2009)
Inclusion and exclusion criteria:
Participants were asked if they have any metal content in their bodies such as vascular clips, joint
prosthesis braces, garnet, and other metal fragments, spiral, acupunctured needles or tattoos. Persons with
claustrophobia were also not allowed to participate.

35
Figure 13) Loss of olfactory bulb in (A) image for the congenital anosmia
subject whereas (B)shows the developed olfactory bulb in a healthy
individual. (Learning about the functions of the olfactory system from people
without a sense of smell; Hummel et al., 2012)
LIST OF PHYSIOLOGICAL TESTS:
Medical history – Specific questions were asked to get a better insight into his patient's past and
present medical condition with the aim to formulate a diagnosis and providing proper medical care to the patient.
Otorhinolaryngological examination – Nasal endoscopy is done to look at the nasal and sinus passage.
Orthonasal test- German version of Sniffin’ Sticks was performed which included the tests for
olfactory threshold, discrimination and identification ability (“ Sniffin’ Sticks”, Burghart GmbH, Wedel, Germany; compare Hummel, 2007). Patients scoring on an average TDI score of 11.85 ± 0.95 indicates functional anosmia whereas controls had a mean TDI score of 34.44 ± 1.24.
Retronasal test was performed to check the flavor perception in olfactory loss patients. It is
basically olfaction through the retronasal route.
Figure 14) Differences between orthonasal and retronasal olfaction (Image source; Ohio State University)

36
Most subjects with olfactory loss report the problem of taste loss and both electrophysiological and magnetic
resonance imaging data suggest that retronasal processing is different from orthonasal odor perception. This
is why retronasal testing should be a part of general clinical assessment (Landis et al. 2005).
Taste Spray test was also done before the retronasal test so as to get information about primary
gustatory sensations and to make sure if they are able to identify the 5 basic tastes that include salt, sweet, bitter, sour, umami. Taste is the ability by which individual responds to the dissolved molecules and ions which are known as tastants. Taste buds have a number of taste receptor cells which are scattered in various body parts. In short, this test was done to make sure that subjects with olfactory loss do not have any associated impairment such as taste related issues.
Figure 15) Taste bud neuron triggers action potential and transfer to signal to the brain

37
Lateralization test was performed to process the trigeminal function. Based on previous
studies nearly pure eucalyptus (Aldrich-Chemie, Steinheim, Germany) was used for the odor localization paradigm (Doty and others 1978; Berg et al. 1998; Hummel et al. 2003).
Two high-density polyethylene bottles were used and the odors were presented to each nostril. There are 16
trials done for each chocolate and eucalyptus odor. The odor was presented to one of the nostrils at a time
and the subjects were asked to sniff when they press the bottles. After each trial subjects were asked to
identify what they smell and if they were able to identify in which nostril was a particular odor felt and
experienced. Stimulation was done in a pseudorandomized sequence. This test required approximately 20
minutes to complete and 16 is the maximum score for each of chocolate and eucalyptus. The chocolate odor
was considered as the control olfactory odor whereas the eucalyptus as the trigeminal odor. Healthy controls
were able to identify both the olfactory and the trigeminal odor whereas it was assumed that patient group
should have some cooling sensation when they sniffed eucalyptus.(Leopold, Hornung and Schwob, 1992)
LATERALISATION TEST:
Group-wise comparison was done between patient group and control group. It was assumed that eucalyptus
being a bimodal odor i.e. having qualities of both olfactory and trigeminal odor should produce a cooling
sensation and activate the trigeminal nerve and should be identified more than chocolate, whereas
chocolate being an olfactory stimulant will not be lateralized correctly by the patient group.
According to the lateralization test performed on the participants 75 percent of the patient population
identified eucalyptus through the press and sniff process, where the sequence for the lateralization
pattern was formed in a pseudo-randomized order and the odors were presented in polyethylene bottles.
25%
75%

38
Beck Depression Inventory test (BDI)
BDI is a self-assessment test to assess symptoms of depression. It is done to find out if the patient group has
influenced depression along with the olfactory loss (Jackson-Koku, 2016). It has been said that patients with
depression have been found to have reduced olfactory ability and so our purpose was to find conversely, if
patients with olfactory loss has depression symptoms associated with olfaction or not (Kohli et al. 2016).
BDI is a 21 simple multiple choice questionnaire and is also one of the most widely used psychological and
psychometric test for measuring how severe the depression is. The original version of BDI which is used in
this study has a set of four responses, ranging the levels of depression. Example:
0 I do not feel sad.
1 I feel sad
2 I am sad all the time and I cannot come out of it.
3 I am so sad and unhappy that I cannot tolerate it.
For scoring, add up the score for each of the twenty-one questions by counting the numbers to the right of each question marked. The total score decides the levels of depression for an individual. Score 1-10 indicates that there are nominal ups and down, 11-16 indicates mild mood disturbance, 17-20 indicates borderline clinical depression, 21-30 indicates moderate depression, 31-40 indicates severe depression and over 40 score indicates extreme depression. Montreal Cognitive Assessment (MoCA) test-
MONTREAL COGNITIVE ASSESSMENT (MOCA) TEST is a test done to access the cognitive abilities of an individual. It is a brief 15 minutes questionnaire which has 30 questions to answer. MoCA is a test given by McGill University in Montreal in 2005. It is a simple test which helps in quickly determining if the patients have normal cognitive functioning. Also, it has been found that olfactory dysfunction is the early symptom of Parkinson and Alzheimer disease and so following this report, MoCA test is also important to find out the patients with associated disorders. It has been used for Parkinson patients to access their cognitive ability affected. It is available in many different languages and is also available for blind people (Fullard et al. 2016). MoCA test is divided into 7 levels and an extra point is given to an individual having less than or equal to 12 years of educational background.

39
How to score your own Moca test:
1. Visuospatial and executive function (5 points) 2. Animal name (3 points) 3. Attention (6 points) 4. Language (3 points) 5. Abstraction (2 points) 6. Delayed STM (5 points) 7. Orientation (6 points)

40
INSTRUMENTATION AND TECHNIQUES:
OLFACTOMETER-
Olfactometers are devices built to present odor stimuli in a standardized computer-controlled manner with
determined airflow, odor concentration, odor dilution, onset and offset. (Aïn et al., 2017) One of the basic
application of olfactometer is to determine the intensity and presence of odors. The odormeter (initial name
given to olfactometer) is an example of the largest type apparatus whereas illustration of the small type of
olfactometer is the Zwaardemaker Olfactometer (Zwaardemaker et al. 1889). Olfactometer is not only used
for humans but also a number of scientists used the term olfactometer for studying insect behavior when an
odorous stimulus is given. It is used to humidify and modify the temperature of the air flow to avoid any kind
of thermal or mechanical stimulation(MartÍnez and Hardie, 2009).
FLOW OLFACTOMETER:
It is another kind of instrument which provides continuous warm and humidified flow of air. Air is delivered to
subject's nostril via a teflon pipe. It is a complex type of olfactometer which produces nociceptive or olfactory
stimuli in the nose without any thermal or without any kind of tactile movement (Brämerson et al., 2008).
SPECIFIC ISSUES RELATED TO OLFACTOMETRY:
1. Olfactometer produces constant heat and also humidified air flow which is delivered to an individual nose. Depending on the length of pulse the air flow is replaced by the phase of odorous stimulus(MartÍnez and Hardie, 2009).
2. Less maintenance 3. Humidifies, maintains pressure and regulates the temperature of the olfactory stimuli 4. Can be used for a long time and easy breakdown is avoided
5. Is used especially for olfactory-related studies where people have olfactory dysfunction; their
sensitivity towards trigeminal odor (CO2) in comparison to olfactory stimulus is compared as
the people without or less sense of smell has been known to show trigeminal
sensitivity.(Lundström, Boesveldt and Albrecht, 2011)s
In this study, computer-based chemosensory stimulator was used to trigger the stimulus with air flow
involved (Olfactometer OM2S, Burghart Instruments, Wedel, Germany). It is a device which has small filter
pads which lets the air pass through it and also measures and detects the air flow.

41
Figure 16) 8 channel olfactometer; image source (article from Wageningen University and research)
The olfactometer has been used for a number of functional neuroimaging studies where they are combined with fMRI.
It is used in congenital anosmic or idiopathic anosmic subjects to find out the trigeminal sensitivity in comparison to olfactory odor.(Leopold, Hornung and Schwob, 1992)
Burghart olfactometer is used even for behavioral studies along with the use of electroencephalography (EEG).
Olfactometer can use up to 8 odorants which could be in the gaseous or liquified state which is controlled by a computer-based system which has a function of temperature regulation and air humidification.

42
ELECTROENCEPHALOGRAPHY-
Recording of brain activity is done after the olfactory stimulation. For example, olfactory evoked potentials are
recorded for subjects with an olfactory loss to find out the trigeminal responsiveness. Usually to get a better
understanding of a person's responsiveness to odors, brain activity in the form of electroencephalography is
recorded. In response to chemical stimulation the so-called "event-related potentials" (ERP) are recorded
which represent cerebral responsiveness with respect to the given sensory stimuli such as odorous stimuli
(Frasnelli, Wohlgemuth and Hummel, 2006). EEG records and tracks the brain activity in the form of brain wave
patterns. Thin wire electrodes are placed on the scalp. It should be noted that the position of the respective
electrode should be at its correct location as it can affect the result. Electrodes are small metal discs attached
with thin wires. Electrical fileds are recorded with these electrodes. The signal is amplified, filtered (30 Hz low-
pass fliter), digitized (250 Hz sampling frequency), and then is stored on disk for further analysis. Looking at the
brain waves, a doctor can easily find if the patterns look abnormal and the individual has some chances of a
disorder. Mostly EEG is done for the analysis of seizure or mental instability, behavioral changes, olfactory
dysfunctioning, after a head injury or also done before transplants (Sheehy, 2008).
Olfactory evoked potentials (OEP) is used to diagnose subjects with any kind of olfactory loss and also methods have been found to diagnose the chemosensory perception of the receptors for trigeminal nerve (Brämerson et al., 2008).

43
Figure 17) Negative and Positive peaks (N1, N2, P1, P2 and P
300(Measurements of olfactory evoked potentials and event-related
potentials using odorant stimuli; Tonoike et al., 1990)
Specific Issues related to EEG-
1. ERP yields accurate results as compared to any other method.(Leicht and Mulert, 2014) 2. Non-invasive(Lopes da Silva, Gonçalves and De Munck, 2010) 3. Low maintenance and low cost.(Lopes da Silva, Gonçalves and De Munck, 2010) 4. Provide excellent temporal resolution (Leicht and Mulert, 2014).
5. Useful in clinical research such as in fields of injuries, dementia, Parkinson disease, multiple
sclerosis, stroke, OCD.(Michel and Murray, 2012) 6. Extensively used in neuroscience, cognitive neuropsychology, cognitive psychology.(Sheehy, 2008)
7. It has the P300 component which is recorded at around 300 ms after the stimulus presentation and is
recorded for auditory stimuli.(Lopes da Silva, Gonçalves and De Munck, 2010)
8. In the field of olfaction, it is used to find out if an olfactory loss patient has proper sensitivity in response to CO2 which is a trigeminal odor.(Lorig, 2000)
Analysis: Single response to a particular response is not visible in the recording, therefore, several trials are done and
the averaging cancels out random events, like background EEG waves. Changes that are above chance comes
out and are visible in the average as event- related potential. This averaging process increases the signal to
noise potential and can be measured in terms of amplitudes and latencies. (Sheehy, 2008)
Electrode Placement:

44
Figure 18) International 10-20 System Placement System (Courtesy of Grass Astro-Med. Inc. Product Group)
10 -20 electrode system is the standard electrode placement technique used, in which distance between
the points on a head is calculated from anterior to posterior direction. In the figure above, the uppercase
letter denote the position of the electrode whereas the odd number indicates left hemisphere and all the
even numbers are used to place electrodes in the right hemisphere.
FUNCTIONAL MAGNETIC RESONANCE IMAGING –
Magnetic resonance imaging (MRI), is a noninvasive medical imaging technique used in radiology to image the
anatomical and physiological process of the body in both health and disease.(Lin and Monica Way, 2014) MRI
provided much greater contrast between the different tissues of the body than computed tomography (CT),
making it especially useful in neurological (brain) musculoskeletal, cardiovascular, and oncological (cancer)
imaging (Poldrack, Nichols and Mumford, 2011) It does not use ionizing radiation, but use a powerful magnetic
field to align the nuclear magnetization of a hydrogen atom in water in the body (Lin and Monica Way, 2014).
HISTORY OF MRI:
Paul C. Lauterbur invented the magnetic resonance imaging technique in September 1971; he published the
theory behind it in March 1973. The factors leading to images contrast (differences in tissue relaxation time
values) had been described by Erik odeblad (scientist). At Stony Brook University, Carr's technique was used by
Paul Lauterbur to generate the first MRI images, in 2D and 3D, using gradients. In 1973, Lauterbur published
the first nuclear magnetic resonance image and the first cross-section image of a living mouse in January 1974.
On July 3, 1977 the first MRI scan was performed on a human body. In 1979, Richard S. likes to field a patent
on k- space U.S. patent in 1980 they used this machine to obtain the first clinically useful image of a patient's
internal tissues using magnetic resonance imaging(MRI), which identified a primary tumor in the patient's
chest, and abnormal liver, and secondary cancer in the bones after starting a collaboration on heart
application. Although MRI is most commonly performed at 1.5 T, higher fields such as 3T are gaining more
popularity because of their increased sensitivity and resolution. In research laboratories, human studies have
been performed at up to 9.4T and animal studies have been performed at up to 21.1T.
SPIN PHYSICS:
Magnetic nuclei, like 1H and 31P, could absorb RF energy when placed in a magnetic field of strength specific
to the identity of the nuclei. The nucleus is defined to be in resonance when absorption occurs. Different
atomic nuclei resonate at different frequencies for the same magnetic field strength.
PRECESSION: Two things happen when the nuclear magnetic dipole is subject to an external field.
1. The dipole aligns at an angle to the direction of applied magnetic field. 2. The dipole will ‘process' around the direction of the applied magnetic field.
The rate of precession is measured in Hertz (i.e. cycles per second) and is called the Larmor frequency.

45
LARMOR FREQUENCY:
Figure 19) The absorption of radiation by a nucleus in a magnetic field (Image source: teaching.shu.ac.uk)
The frequency of precession w the Larmor frequency depends on:
1. The strength of applied external magnetic field B (measured in Tesla) 2. The gyromagnetic ratio of the nuclei concerned.
W = r B ……………………………………………. (Grachev et al., 2000)
The relationship between g, w, and B is the simple linear relationship shown a static magnetic field an
individual nuclear dipole can take up one of a number possible orientation to the static magnetic field.
In quantum physics terms, these orientations correspond to “spin states”. The number of orientation is
determined by the spin quantum number l of the nucleus and is (2l+1)
No of spin states = (2l+1)
The possible spin states for a proton in a static magnetic field are ‘parallel' and ‘anti-parallel'. In the parallel
state, the dipole processes around the direction the applied field at angle of 55 degrees pointing with an
applied field.
In the anti-parallel state the dipole processes around the direction the applied field at an angle of ~ 55
degrees pointing against the applied field. the parallel state is also called the spin up state or the low energy
state. The anti-parallel state is also called the spin down state or the high energy state.
The energy difference E, is given by E = B0……………………………………………… (Spielberger et al.,, 1983)

46
SPIN EXCESS : Once a static field is applied the proton can be thought of as individually moving to either the high energy state or the low energy state. This phenomenon is called Zeeman splitting.
A tiny excess of the photon will exist in the low energy state compared to the high energy state. This is called
‘spin Excess’. The individual’s proton cannot be probed to look at their dipoles. The resultant of these
millions of proton dipoles is a vector quantity called the Bulk magnetization.
MRI HARDWARE:
The magnet is the most expensive as well as the largest component of the scanner and the rest of the parts are
built around it. The strength of the magnet is measured in units of Tesla (T)(Poldrack, Nichols and Mumford,
2011). Clinical magnets have their field lengths in the range of 0.1 to 0.3 T where it has to be important that for
humans the strength of the main magnet should be its precision. The magnetic lines which are squarely within
the center have to be perfect, this phenomenon is known as homogeneity and fluctuations within the region
should always be less than three parts per million (3ppm).
MR COMPONENTS- A static field is a very strong and stable magnetic field which sets up the condition for the magnetic resonance.
1. Gradient field system 2. RF transmit system 3. Receive system 4. Computer system
Gradient coils: These coils are used to encode the positions of protons by varying linearly the magnetic field
across the imaging field and the Larmor frequency varies as a function of x, y, and z-axis. Gradient coils are
electromagnets that are powered by sophisticated amplifiers which allow rapid and precise adjustments to the
field strength and direction. A gradient coil will create an additional, linearly varying magnetic field that adds or
subtracts from the main magnetic field which has its components in all the three directions x, y and z;
however, the components along the magnetic field ( usually called the z-axis is denoted as Gz ) is used for
imaging. Along with any given axis, the gradient will add to the magnetic field on one side of the zero position
and subtract from it on the other side. Since the additional field is a gradient, it has units of Gauss per
centimeter or Mille Tesla per meter (MT/m). In MRI high-performance gradient coils are used which are
capable of producing a magnetic field of approximate 30 MT/m or may be higher for a 1.5 T MRI.
Scan speed is dependent on the performance of the gradient system. Stronger gradients are used for faster
imaging, higher resolution; similarly, gradient systems which are capable of fast switching can also permit
faster scanning.

47
RF Transmitter-
The RF (radio frequency) transmitter is switched on/off many times during a pulse sequence. It sends a burst
of radio waves into the patient which has the effect of rotating the net (bulk) magnetization vector through an
angle which varies from sequence type to type, in many cases it can be chosen by the operator during can set
up. The bulk magnetization vector processes at the Larmor frequency. The amplitude of the vector carries
information on the tissues characteristics (T1, T2, T2*, proton density)
The RF transmission system includes a synthesizer, power, a transmitting coil, and an amplifier. The
transmitting coil is in the body of the scanner and the power of the transmitter can have different where a
high-end body of the scanner may have a power of up to 35 kW which is capable of sustaining 1kW of average
power. The electromagnetic fields range from tens of megahertz at powers which usually exceed the highest
powers which are used by amateur radio. MRI is not a radio transmitter in a way that it has a very low radio
transmitter. Thus, the electromagnetic field which is highly powered and produced in the MRI transmitter coil
does not produce magnetic radiation. The power is not radiated as the radio waves and is confined to the coil
space. Therefore we can say that the transmitting coil is a good EM filed transmitter at radio frequency but also
it is a poor EM radiation transmitter at radio frequency.
The radio frequency receiver has a coil followed by a pre-amplifier and a signal processing system. The EM
radiation leaves the individual as the radio frequency radiation which also has low power and is not able to
generate interference that can be picked by the radio tuners. A recent study has been known about the
development of MRI technology which shows the development of multi-element coils which produce
multiple channels which are in parallel. This technique can be called the parallel imaging technique that uses
different and unique schemes of acquisition and allows accelerated imaging. It replaces spatial coding from
the gradients. Moreover, the increased acceleration also reduces the SN (signal to noise ratio) and can
produce some residual artifacts while in the image reconstruction.
RF receiver-
Magnetization vector leads to a rapidly changing magnetic field. This field is spatially produced in the
transverse plane. This field comes from the radio waves by which an image can listen for the waves
which come from the patients along with a radio receiver coil with it. This coil takes a signal proportional
to an amplitude which is in the transverse component to the magnetized vector.
The signals are at the end processing on a computer screen where it does the construction of the MR images.

48
Figure 20) Block diagram of MR components (image source:
Functional MRI; Clare et al., 1997)
How Does MRI work?
The human body is composed of 50- 60 % of water molecules which has two hydrogen or proton nuclei.
When a person goes inside the room where a magnet is kept these protons align themselves along the
direction of the field.
The second electromagnetic field is also applied by which the protons absorb some of its energy. Protons
release the energy when the field is removed because of which an additional magnetic field is applied and
allows to the image of the body to be built. Diseased tissues are easily detected as the protons return to the
equilibrium position at different rates. MRI is an imaging technique which is used to image every part of the
body, especially for the neurological disorders, disorders of the joint and muscles, to find out the
abnormalities of the heart and the blood vessel, majorly to evaluate tumors (Lin and Monica Way, 2014).

49
T1 in soft tissues is around one second whereas T2 and T2* is around tens of milliseconds. It should be noted
that the values can differ on the basis of tissues; this factor is responsible to give MRI its tremendous soft
tissue contrast.
Differences in the strength of the NMR signal which is recovered from various locations leads to the image
contrast. Image contrast depends on the relative density of water protons, on T1, T2, T2* which is the
relaxation times and also on the other parameters which come under specialized MR scans. Contrasts are a
mixture of all of the above parameters. When we talk about the brain, T1 weighting helps the nerve
connections of white matter appear white, congregations of the grey matter to look grey in contrast and also
the cerebrospinal fluid to have a dark appearance. With the use of T2 or T 2* imaging the contrast of white
matter, grey matter and CSF is reversed whereas the proton density weighted imaging leads to very little
contrast in control healthy subjects. Moreover, functional parameters which include cerebral blood flow
(CBF), blood oxygenation or the cerebral blood volume (CBV) affect T1, T2, T2*((Lewin, 2003))
Recent studies show that superparamagnetic contrast agents have been available. Examples of these are;
iron oxide nanoparticles. They appear very dark when it is on T2* weighted images and are used for liver
imaging where the normal tissue agent retains the agent and the scars or tumors do not. If these are taken
orally they help in improving visualization of the gastrointestinal tract and from obscuring any other organ
such as the pancreas. Diamagnetic agents are also known for their potential use in the gastrointestinal tract
but still they are less frequently used.
Basic MRI scans
T1 weighted MRI
T1 weighted scans use a gradient echo (GRE) sequence along with short TE and also short TR. This contrast is
one of the most basic types of MR contrast and also is the most common run scan. The contrast can be
increased with the use of the inversive plane. Due to short TR i.e. the repetition time the scan can be run
very fast following the collection of high-resolution datasets in 3D.
T2 weighted MRI
T2 weighted image is where the contrast depends on the differences between the fat and water. To have the
T2 weighted image the TE should be long enough so as to give both fat and water time to delay and the
differences between them are not then visualized. T2 is identified by bright water and dark fat. Thus we can
say that TE is directly proportional to T2 weighting.

50
Figure 21) T1 weighted image with fat and CSF; image source; mrimaster.com
Figure 22) T2 weighted image with CSF and fat; image source:
mrimaster.com

51
T2* weighted MRI
It uses the gradient echo sequence with a long TR and a long TE. The GRE used seems to not have the extra
refocusing pulse used in the spin echo. Because of it not having the pulse it losses the normal T2 decay and also
more prone to increase contrast for certain venous blood.
Spin density weighted MRI
Spin density also is known as the proton density weighted scans make it possible to have no contrasts from
whether it is a T2 or a T1 decay. It also uses GRE sequence of short TE and long TR. Researchers use it to
make maps of brain filters which examine connectivity of various regions of the brain. Another use is to
examine areas of neurodegenerative disorders and demyelination like that of multiple sclerosis. This
technique is combined with spectroscopic and imaging methods.
Figure 23) Proton density image; image source: mrimaster.com

52
STIMULUS DELIVERY
Two odors were chosen as stimulusi out of which one was used as the olfactory stimuli and the other as the
bimodal odor which has the property of interacting with the olfactory system and the trigeminal system.
“Chocolate odor” was used as the control or the olfactory odor whereas 99% of eucalyptus with composition of
1,2,2-Trimethyl-2-oxabicyclo (2.2.2.) octane, 1,8-Cineole, 1,8- Epoxy-p-menthane is used as the bimodal, olfactory-
trigeminal stimulant. To test the trigeminal factor of chocolate a pilot study was done in 12 healthy controls
inclusive of all age groups. It was performed as a mock fMRI test where both the odors were given two times
alternatively for both chocolate and eucalyptus for 4 minutes each. The duration was decided based on previous
studies done which concludes that some odors when perceived for a longer duration produce irritability and
sensitivity giving it a trigeminal effect (Frasnelli, Wohlgemuth and Hummel, 2006). Lateralization test was
done to check the trigeminality of the odors and it was found that chocolate at its undiluted concentration did
not elicit a trigeminal sensation whereas eucalyptus did.
A block design was set for odor stimulation during the fMRI measurement. The experiment was divided into two parts where the purpose for both the experiments was different.
Experiment 1-
Brain activation in response to trigeminal and olfactory stimuli in subjects with olfactory loss
Figure 24) Experimental block design for olfactory and trigeminal odor

53
Out of the total number of participants recruited, data of 14 participants with CA and 8 patients with IA was
analyzed in comparison to 16 HC. All measurements were carried on a 3T scanner (Siemens- Prisma). Stimuli were
presented within a block design of 4-minute duration per odor where the odors were given birhinally, using a
computer-based olfactometer. Both odors were delivered at a flow rate of 2 liters/min. One ON phase of 8
seconds was followed by an OFF phase of 12 seconds. The whole pattern lasted for 240 seconds in which for each
functional run, the chocolate run was directed to either left or right in order to minimize adaptation to the odors.
Chocolate odor was delivered for the first ON session which was followed by eucalyptus for the second, whereas
the off block receives pure humidified air flow.
At the end of the complete stimulatory period, participants were asked to evaluate and describe the stimuli
in terms of intensity (0-10; "not identifiable or not perceived" to "strongly perceived"), coldness, warmth, and
pleasantness (-5 to +5; "extremely unpleasant" to "extremely pleasant"). Moreover, participants especially
patients were asked to name the perceived odorants.
Experiment 2-
Top-down olfactory processing in subjects with olfactory loss
The second experiment was followed after the first experiment within the MR scanner (3T) where
participants were shown words with or without olfactory association, for example "banana" or "chair". Blocks
with odor-associated words were alternated with blocks of neutral words.
We investigated 3 different groups: CA (N= 14) which are born with a life- long inability to smell, IA (N=8) with past experience of smell and NC (N =16).
In Bottom- up olfactory perception, the odor molecules are released from the odor source which then travel
to the olfactory epithelium. We perceive the odor and correctly identify the smell of the flower, for example, as
something familiar. This is known as the bottom up olfactory activation whereas the other route to activate the
olfactory system is top- down olfactory perception, which activates the brain olfactory network without any
actual physical odor stimuli. Previous studies suggest that the top- down pathway activate the primary
olfactory cortex (Gonzalez et al., 2006), (Bensafi et al., 2007).
Less is known about the olfactory imagery condition in olfactory loss patients where the olfactory words are
compared with the neutral words. The words have been checked by ratings for their olfactory associations. The
participants were asked to read the words silently paying full attention to the difference between olfactory words
and neutral words. Data was analyzed in terms of (A) expectancy (instructions to read odor- associated words) and (B) response when reading odor associated words. Olfactory words are compared to the baseline when the non- olfactory words are displayed.

54
Figure 25) Experimental block design of olfactory and neutral words
Presentation software is used to display words to participants lying in the scanner. Twelve blocks of olfactory
words are followed by 12 blocks of neutral words. The instruction or the expectancy is taken for 2.5 seconds
and three words are displayed one at a time for 2.5 seconds. Each word is separated from the other by a inter
stimulus interval of 1 second. At the end of each block is the off period of 6 seconds where the participants
can relax and this off period is not analyzed. The total time for this experiment is 8 minute.

55
IMAGING DATA ACQUISITION AND
ANALYS
Imaging data was obtained using a sixteen- channel receiver head coil on a Siemens Prisma 3 Tesla scanner (Germany). Spin echoplanar imaging was applied for the functional images with the echo time (EP) of 40 millisecond and repetition time (TR) = 2000 millisecond. Fmri data was analyzed using SPM12 (Wellcome Trust Centre for Neuroimaging, London, United Kingdom) implemented in Matlab (version 2013a, Mathworks, USA). Preprocessing of functional image volume is followed by realignment and unwarp. Apart from it the high-resolution T1 image was co-registered to the mean image for all the participants. Co registered images are then segmented for gray and white matters to compute spatial transformation for the next step normalization. The registered functional images were then further normalized to a standard Montreal Neurological Institute (MNI) template. Normalized images were smoothed with 8 mm FWHM Gaussian kernel. Head movement artifacts were further removed using ArtRepair (version 4, Stanford University) which was applied to the pre-processed images based on few rules: image to image motion upto 0.5 mm/TR and total images repaired were always less than 25% (Poldrack, Nichols and Mumford, 2011).
First level analysis was done individually for all the participants with the standard canonical haemodynamic
response function in SPM. Suitable contrasts were made for both the experiments in which comparison was
done between control group and patient group and also within the groups for both the odors. For second
experiment, contrasts like" olfactory words expectation to show more activations as compared to non
olfactory words expectation" and "olfactory words read to show more activations then non olfactory words
read" was taken.
For the second level analysis, these images were subjected to a random effect analysis using independent
sample T- test for the odors, groups and also between neutral and olfactory words. Age and sex was also kept
as covariates for main group effect. ROIs including the medial OFC (mOFC), lateral OFC (lOFC), insula, anterior
cingulate cortex (ACC), hippocampus, parahippocampal gyrus, temporal lobe pole, caudate, and putamen were
anatomically defined with masks from the WFU_PickAtlas toolbox for SPM (ANSIR, Wake Forest University,
Winston-Salem, NC, USA) [Maldjian et al., 2003] based on the “automated anatomical labeling (aal)” atlas
[Tzourio- Mazoyer et al., 2002].

56
RESULTS-
17 healthy controls and 20 patients including CA (14) and IA(8) patients were recruited. Age and sex
matched patients participated in the study. Psychological examination was performed using Sniffin’
Sticks test, where odor threshold is followed by odor discrimination and identification testing for patient
group in comparison to healthy controls.
CONTROL GROUP PATIENT GROUP
• Age = 48.0 ± 3.0 yrs Age = 42 ± 4.0 yrs
• TDI = 34.44 ± 1.24 TDI = 11.85 ± 0.95
• Gender = 11f / 6m Gender = 11f / 11m
Sniffin‘ Sticks Test Congenital Anosmia Idiopathic Anosmia Healthy Control
Threshold 1.46 +/- 0.389 1.19 +/- 0.15 8.22 +/- 0.64
Discrimination 5,71 +/- 0.46 5.88 +/- 1.26 12 +/- 0.74
Identification 4.78 +/- 0.52 3.88 +/- 0.91 13.29 +/- 0.58
TDI score 11.95 +/- 1.39 10.95 +/- 2.32 34.44 +/- 1.24
Table 3) Sniffin‘ Sticks test results for study groups
People are said to be normosmic if they score a total TDI score of > 32 (16-35 yrs), > 29 (36 – 53 yrs), > 28
(>53 yrs).
People with no sense of smell (anosmic) have a TDI score of < 16 (16-35 yrs,36-53 yrs and > 53 yrs).

57
TDI, combined score for odor threshold, discimination and identification: Maximum score for
each subset test is 16.
LATERALIZATION TEST: Significant results were found when comparing patients and controls at
p less than 001. Lateralization test was done to characterize trigeminal function. Two odors chocolate and eucalyptus were used, one with little or no trigeminal activation (chocolate) and other with bimodal
properties.nControls report better lateralization and they were very well able to identify the olfactory odor, chocolate as well as the birhinal odor, eucalyptus.
me
an
sco
re
30
25
20
15
10
5
0
Lateralization
p < 0.001
**
Patient group Control group
Figure 26) Comparison of patient group and control group with regard to lateralization score (bars indicate the mean and SEM)
LATERALZATION PATIENT GROUP CONTROL GROUP
MEAN 10.2 25.6
STDEV 5.51 6.37
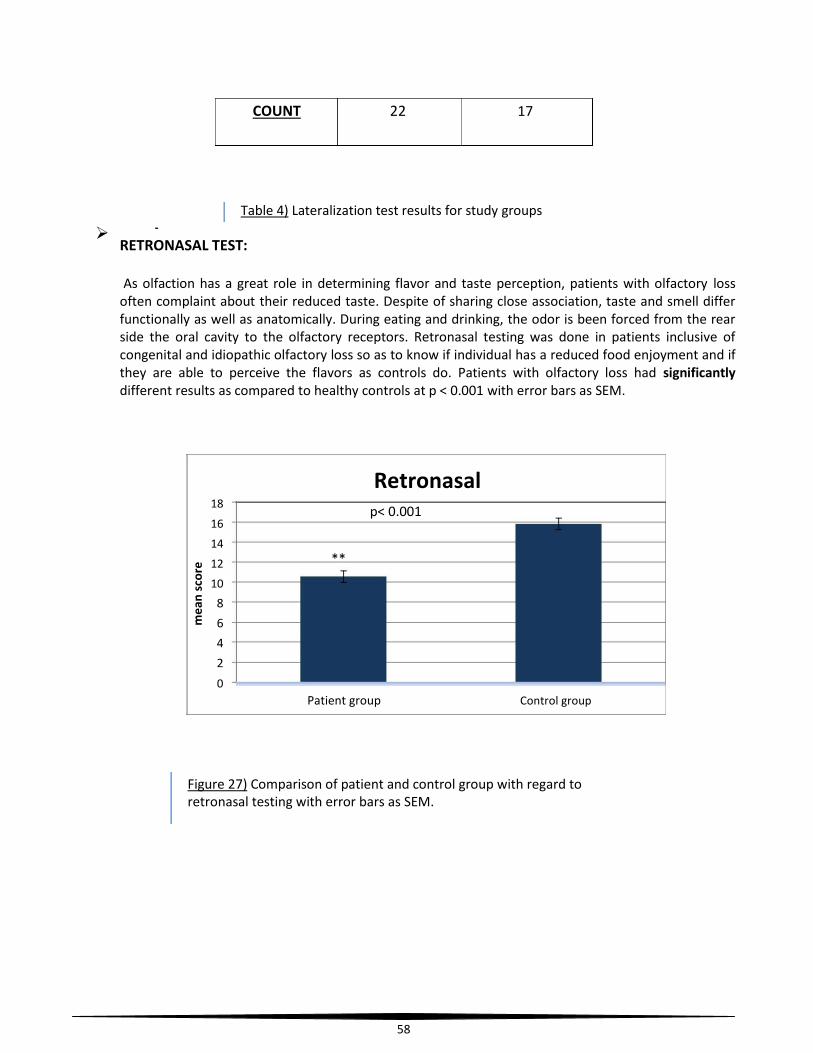
58
COUNT 22 17
Table 4) Lateralization test results for study groups
RETRONASAL TEST:
As olfaction has a great role in determining flavor and taste perception, patients with olfactory loss often complaint about their reduced taste. Despite of sharing close association, taste and smell differ functionally as well as anatomically. During eating and drinking, the odor is been forced from the rear side the oral cavity to the olfactory receptors. Retronasal testing was done in patients inclusive of congenital and idiopathic olfactory loss so as to know if individual has a reduced food enjoyment and if they are able to perceive the flavors as controls do. Patients with olfactory loss had significantly
different results as compared to healthy controls at p < 0.001 with error bars as SEM.
me
an
sco
re
18 16 14 12 10
8
6
4
2
0
Retronasal
p< 0.001
**
Patient group Control group
Figure 27) Comparison of patient and control group with regard to retronasal testing with error bars as SEM.

59
RETRONASAL PATIENT GROUP CONTROL GROUP
MEAN 10.54 15.82
STDEV 2.38 2.34
COUNT 22 17
Table 5) Retronasal test results for study groups
Significant difference between patient group and control group with regard to retronasal
effect suggests that for the people with decreased or no sense of smell, the perception of
odors emanating from the mouth or oral cavity can be affected.
BECK DEPRESSION INVENTORY TEST: Studies suggest that there is always a close relationship between
depression and olfaction and in people with primary olfactory dysfunction symptoms
of depression is been found to affect their daily life and their social insecurities (Croy and Hummel, 2017). The 21 question test was done to measure the severity of depression in people with olfactory loss. And another aspect of this case can be considered where depressive patients have been found to have olfactory dysfunction which if ignored can be an early symptom of severe neurological symptom such as Parkinson or Alzheimer’s disease. This test monitors individual changes with time and also provides more subjective description. No significant differences were found when patients were compared with healthy controls.

60
BDI
6
5
4
3
2
1
0 Patient group Control group
Figure 28) Comparison of patient and control group with regard to BDI with error bars as SEM
Table 6) BDI test results for study groups
MOCA TEST: Montreal cognitive assessment test developed in 2005 is done to assess the cognitive
domains of an individual as subjects recruited for MRI experiments had to be with core olfactory loss patients without any cognitive impairments. MoCA evaluates various cognitive abilities inclusive of orientation, short term memory, language abilities, abstraction, animal naming, attention and orientation considering their educational level. As analyzed all individuals were found to be cognitively stable and no significant results were found when patient and control groups were compared.
BDI PATIENT GROUP CONTROL GROUP
MEAN 4,31818182 2,47058824
STDEV 5,16753938 2,34834109
COUNT 22 17

61
MoCA
me
an
sco
re
28.5
28 27.5
27 26.5
26 25.5
25 24.5
24 PATIENT GROUP
Figure 29) Comparison of patient group and control group with regard to MoCA test.
MoCA PATIENT GROUP CONTROL GROUP
MEAN 26.31 27.29
STDEV 2.47 2.30
COUNT 22 17
Table 7) MoCA test results for study groups
Patient Group control group

62
NEUROIMAGING RESULTS
Experiment 1
Brain activation in response to trigeminal and olfactory stimuli in subjects with olfactory loss
CONTROL GROUP
Chocolate odor when given birhinally to the healthy population showed olfactory related activations
in the right amygdala (p unc < 0.005), while the CA patients did not show significant olfactory related
activations in response to control odor (chocolate). Amygdala is said to be the primary olfactory area
and is associated with a number of cognitive functions; such as learning, memory and emotion.
Figure 30) Brain activations in response to chocolate odor
# of cluster P (uncorrected) T value MNI (x,y,z) Brain area
7 0.002 3.343 28 2 -20 Right amygdala

63
Table 8) Statistical significantly activated voxels following chocolate odor for control group (n=16)
PATIENT GROUP
a) WHOLE GROUP ANALYSIS: As per our hypothesis, people with olfactory loss should show preserved
function in processing of trigeminal stimulus (eucalyptus) as compared to olfactory stimulus chocolate.
Results show the response of patient group (inclusive of congenital and idiopathic olfactory loss
subjects) observed at contrast when Chocolate show less activation than eucalyptus.
The trigeminal stimulant elicited selective activations in brain areas bilaterally in the insular cortex,
right premotor cortex and the right primary olfactory areas. Moreover, right inferior frontal gyrus
and parts of superior temporal gyrus also showed activations in response to the trigeminal stimulus
given. This was because the trigeminal stimulation produces bilateral activations in insular cortex as a
secondary chemosensory area, whereas cooling sensation of eucalyptus leads to motoric responses.
Figure 31) Brain activations in response to trigeminal odor (eucalyptus)

64
# of cluster P (uncorrected) T value MNI (x,y,z) Brain area
102 0.0001 3.90 -38 -10 10 Left Insula
87 0.0002 3.87 62 4 16 Right BA 6
50 0.0004 3.63 44 8 -12 Right Insula
42 0.0009 3.34 28 30 -12 Right Prim Motor
12 0.001 3.07 -58 2 16 Right BA 47
7 0.002 2.98 -58 2 16 Left BA 6
Table 9) Statistical significantly activated voxels for the patient group (n=20)
b) CONGENITAL ANOSMIA < IDIOPATHIC ANOSMIA: Group-wise comparison between congenital
anosmic and idiopathic olfactory loss subjects was done with regard to olfactory odor (chocolate)
and trigeminal odor (eucalyptus). This was done hypothesizing if idiopathic have improved trigeminal
chemosensory activations.
With respect to contrast CA < IA, superior temporal gyrus (BA 22) show activations in response to
trigeminal free odor (chocolate); whereas in response to the trigeminal stimulant, idiopathic subjects
show more activations in the pre-frontal cortex along with the primary motor areas.
# of cluster P (uncorrected) T value MNI (x,y,z) Brain area
39 0.0001 4.55 70 -36 8 Right BA 22
Table 10) CA < idiopathic for chocolate odor ( NCA= 13; NIA=7)
# of cluster P (uncorrected) T value MNI (x,y,z) Brain area
133 0.0002 4.18 -46 -14 38 Left PrimMotor

65
Pre- frontal 11 0.002 3.18 20 60 18 cortex
Table 11) CA < idiopathic for eucalyptus odor (NCA =13; NIA =7))
EXPERIMENT 2
Top-down olfactory processing in subjects with olfactory loss
Neuroimaging results suggest a group difference during expectancy and reading of odor related words.
Analysis A - “ EXPECTANCY ”
Group-wise comparison was done between normosmic controls, congenital anosmic and idiopathic
anosmic subjects. Results suggest that when expectancy (instructions to read the words) is concerned,
normosmic control and idiopathic anosmic subjects showed more activations as compared to
congenital anosmic participants in the anterior cingulate gyrus along with the middle frontal gyrus and
the anterior most portion of the prefrontal cortex, suggesting their olfactory related experiences as
they know what to expect when the instructions are given. The contrast chosen for expectancy is
olfactory words expectancy > non olfactory words expectancy with neutral or non- olfactory words
as baseline.
Olfactory words expectancy_CA (congenital anosmia) < olfactory words expectancy_IA
(idiopathic anosmia)Idiopathic anosmic (IA) subjects show more activations as compared to congenital ansomic
(CA) subjects, this could be due to their past knowledge and experience about smell. The areas
activated are anterior most part of the prefrontal gyrus, gyrus rectus and anterior cingulate
gyrus.

66
Figure 32) Brain activations during expectancy ( CA < IA)
# of cluster P (uncorrected) T value MNI (x,y,z) Brain area
8 9,3232E-05 4.568 -14 38 -8 Gyrus rectus
Anterior cingulate
27 0,00015542 4,349 -2 30 -2 gyrus
35 0,00019402 4,254 -14 60 14 Prefrontal cortex
10 0,00041253 3,93 8 58 0 Prefrontal cortex
Table 12) Statistical significantly activated voxels for contrast expectancy CA< IA

67
Olfactory words expectancy_CA < olfactory words expectancy_NC
Normosmic controls (NC) showed more activations as compared to congential anosmic (CA)
subjects when expectancy of olfactory related words are concerned. The areas activated are
anterior most part and the middle frontal gyrus part of the prefrontal gyrus which is related to
execution of multiple tasks and the way an individual prepare themselves for the scheduled
operations. According to the MRI task, expectancy gives the opportunity to an individual to
prepare themselves for the forth coming operation.
Figure 33) Brain activations during expectancy (CA < NC)

68
Analysis B- “Reading odor associated odors”
Group-wise comparison was done between CA, NC and IA subjects. Results suggest that overall
congenital patients exhibited more activation in the right insular cortex and the right caudate when
compared to both IA and NC. Activation in CA patients seem to indicate that the anterior insular cortex
is strongly involved in the processing of olfactory information even though they had no previous
experience with any king of odor stimuli.
Olfactory words reading_CA > olfactory words reading_IA
Congenital anomic subjects when compared to idiopathic anosmics, show more activations
during reading of olfactory related words. This shows that patients with olfactory loss had
larger brain activation in memory/ olfactory related regions during “reading odor” as
compared to people who have past experience and knowledge of smell. The area activated
was right caudate which is related to reward functioning and motor processes.
# of cluster P (uncorrected) T value MNI (x,y,z) Brain area
289 7,1704E-06 5,24132538 -2 60 -8 Prefrontal cortex(anterior)
13 2,7456E-05 3,52954364 -4 56 16 Prefrontal cortex (anterior)
13 0,00021708 4,7501235
Prefrontal cortex(middle frontal gyrus) 14 56 32
Table 13) Statistical significantly activated voxels for contrast expectancy CA< NC

69
Figure 34) Brain activations during reading of olfactory associated words (CA > IA)
# of cluster P (uncorrected) T value MNI (x,y,z) Brain area
11 0.0001 4.49 20 8 16 Right caudate
Table 14) Statistical significantly activated voxels for reading contrast CA > IA

70
Olfactory words reading_CA > olfactory words reading_NCCongenital anomic subjects were compared with normosmic subjects when olfactory
associated words were displayed to them. This indicates that people with olfactory loss
have increased activation when reading olfactory words. Strong activations were seen in
the right insular cortex which is the key region to olfaction and act as a secondary
chemosensory area.
# of cluster P (uncorrected) T value MNI (x,y,z) Brain area
137 7,7702E-06 5.21 34 16 -18 Right insular cortex
Table 15) Statistical significantly activated voxels for reading contrast CA > NC
Figure 35) Brain activations during reading of olfactory associated words (CA > NC)

71
CONCLUSION
Brain activation in response to trigeminal and olfactory stimuli in subjects with olfactory loss was
compared with normosmic controls. The study shows that trigeminal stimulation produced bilateral
activations in insular cortex as a secondary chemosensory area whereas are activations are also seen
in the inferior frontal gyrus. Further activations in the Brodmann area 34 may be related to
autonomic processes together with motoric responses. Control group also showed activations in the
primary olfactory area, amygdala in response to olfactory odor. Only 25% of the patient population
were able to identify chocolate (olfactory odor) at the end of each stimulation period whereas 75% of
the patient population were able to identify eucalyptus (trigeminal odor) according to the
lateralization test done, thus proving our hypothesis we can say that people with olfactory loss have
preserved function in processing of trigeminal stimulus.
Odor imagery approach also very well explained the top- down olfactory processing in subjects with
olfactory loss. Neuroimaging results suggested a group difference during expectancy and reading of
odor related words where IA and NC subjects show more activation in anterior cingulate gyrus and in
the middle frontal gyrus, suggesting their olfactory related experience. On the other hand, activations
in CA patients seem to indicate that the anterior insular cortex is strongly involved in the processing of
olfactory information even if there was no previous experience with odorous stimuli. This can be
explained in a way that as the words are displayed CA subjects are more active and try memorizing
them. Therefore, we can say that olfactory imagery brain activation share the common areas with
actual odor perception.
FUTURE ASPECT-
Comparisons between congenital and idiopathic olfactory loss subjects addressing the trigeminal chemosensory activations.
Brain response towards reading of olfactory related words in olfactory loss patients would vary with
the duration of dysfunction and so more idiopathic subjects need to be recruited so as to investigate
this approach.
Less is known about the olfactory imagery condition and so focus needs to be drawn about the mechanisms which also leads to plasticity.

72
BIBLIOGRAPHY
1. Ahmed Kassab, MD,Friederike Schaub,Julia Vent,Karl-Bernd Hüttenbrink &Michael Damm (2009), “ Effects of short inter- stimulus intervals on olfactory and trigeminal event related potentials".
2. Bailey, J.O. and Bailenson, J.N., 2017. Immersive virtual reality and the developing child. In Cognitive Development in Digital Contexts (pp. 181-200). Academic Press
3. Basile Nicolas Landis, MD; Johannes Frasnelli, MD; Jens Reden, MD; et al (2005), “Differences between orthonasal and retronasal olfactory functions in patients with loss of the sense of sense of smell”, Arch Otolaryngol Head Neck Surg. 2005;131(11):977-981.
4. Berg J, Hummel T, Huang G, Doty RL. 1998. Trigeminal impact of odorants assessed with lateralized stimulation. Chem Senses. 23:58.
5. Brämerson, A. et al. (2008) ‘Eventrelated potentials in patients with olfactory loss’, Acta
Oto-Laryngologica. doi: 10.1080/00016480801891702. 6. Brand G. (2006), “Olfactory/ Trigeminal Interactions in nasal chemoreception”,
Neuroscience and behavioral reviews, Volume 30, Issue /, 2006, Pages 908-917. 7. Bromley SM. (2000), “The simplified ill.ustration of olfactory processing in the brain”. 8. C. Huart, T. Meusel, J. Gerber, T. Duprez, P. Rombaux, T. Hummel (2011), “The depth of the
olfactory sulcus is an indicator of congenital anosmia”. 9. C.Güdücü, B.O.Olcay, L.Schäfer , M.Aziz , V.A.Schriever , M.Özgören, T.Hummel (2009) 10. Cain, W.S. and Rabin, M.D., 1989. Comparability of two tests of olfactory
a. Carmen Sandi, Gal Richter- Levin (2009), “From high anxiety trait to depression: a neurocognitive hypothesis”, Trends in neuroscience, Volume 32, Issue 6, 312-320.
b. Clare, Stuart John (1997), “Functional magnetic resonance imaging: methods and applications” Ph. D thesis, University of Nottingham, Access from the University of Nottingham repository,conditioning is not unique”. J. Exp. Psychol. Learn. Mem. Cogn. 2000;26: 423–440.
11. Croy, I. and Hummel, T. (2017) ‘Olfaction as a marker for depression’, Journal of Neurology. doi: 10.1007/s00415-016-8227-8
12. Croy, I., Nordin, S. and Hummel, T., 2014. Olfactory disorders and quality of life—an updated review. Chemical senses, 39(3), pp.185-194.
13. Delon-Martin, C., Plailly, J., Fonlupt, P., Veyrac, A. and Royet, J.P., 2013. Perfumers'
expertise induces structural reorganization in olfactory brain regions. Neuroimage, 68,
pp.55-62.
14. Doty, R. L. et al. (1984) ‘University of pennsylvania smell identification test: A rapid
quantitative olfactory function test for the clinic’, Laryngoscope. doi: 10.1288/00005537-
198402000-00004.

73
15. Doty, R. L., Marcus, A. and William Lee, W. (1996) ‘Development of the 12-item cross-
cultural smell identification test(cc-sit)’, Laryngoscope. doi: 10.1097/00005537-199603000-
00021.
16. Doty, R.L., Shaman, P., Kimmelman, C.P. and Dann, M.S., 1984. University of Pennsylvania
Smell Identification Test: a rapid quantitative olfactory function test for the clinic. The
Laryngoscope, 94(2), pp.176-178.
17. Flohr EL, Arshamian A, Wieser MJ, Hummel C, Larsson M, Mühlberger A, Hummel T, (2014), Neuroscience; 268:118-27.
18. Frasnelli, J. and Hummel, T. (2005) ‘Olfactory dysfunction and daily life’, European Archives of Oto-Rhino-Laryngology. doi: 10.1007/s00405-004-0796-y.
19. Frasnelli, J., Lundström, J.N., Boyle, J.A., Djordjevic, J., Zatorre, R.J. and Jones-Gotman, M.,
2010. Neuroanatomical correlates of olfactory performance. Experimental brain research,
201(1), pp.1-11. 20. Frasnelli, J., Schuster, B. and Hummel, T. (2007) ‘Subjects with congenital anosmia have larger
peripheral but similar central trigeminal responses’, Cerebral Cortex. doi: 10.1093/cercor/bhj154.
21. Frasnelli, J., Wohlgemuth, C. and Hummel, T. (2006) ‘The influence of stimulus duration on odor perception’, International Journal of Psychophysiology. doi: 10.1016/j.ijpsycho.2005.11.006.
22. Fullard, M.E., Tran, B., Xie, S.X., Toledo, J.B., Scordia, C., Linder, C., Purri, R., Weintraub, D.,
Duda, J.E., Chahine, L.M. and Morley, J.F., 2016. Olfactory impairment predicts cognitive
decline in early Parkinson's disease. Parkinsonism & related disorders, 25, pp.45-51.
a. functioning. Chemical Senses, 14(4), pp.479-485.
b. G2019S associated Parkinson’s disease. PloS one, 9(10), p.e108982.
23. Gaig, C., Vilas, D., Infante, J., Sierra, M., García-Gorostiaga, I., Buongiorno, M., Ezquerra, M.,
Martí, M.J., Valldeoriola, F., Aguilar, M. and Calopa, M., 2014. Nonmotor symptoms in LRRK2 24. Heilmann, S. and Hummel, T. (2004) ‘A New Method for Comparing Orthonasal and
Retronasal Olfaction’, Behavioral Neuroscience. doi: 10.1037/0735-7044.118.2.412. 25. Hummel (2018), “Impaired brain responses to odors in patients with varied severity of
olfactory loss after traumatic brain injury”, Volume 265, Issue 10, 2322-2332. 26. Hummel, T. and Nordin, S. (2005) ‘Olfactory disorders and their consequences for quality of
life’, Acta Oto-Laryngologica. doi: 10.1080/00016480410022787. 27. Hummel, T., Sekinger, B., Wolf, S.R., Pauli, E. and Kobal, G., 1997. ‘Sniffin’sticks': olfactory
performance assessed by the combined testing of odor identification, odor discrimination and
olfactory threshold. Chemical senses, 22(1), pp.39-52.
28. I D Grachev; B E Fredrickson; A V Apkarian, (2000) “Abnormal brain chemistry in chronic back pain: an in vivo proton magnetic resonance spectroscopy study”, Pain, 89(1): 7-18.
29. Ilona Croy, Viola Bojanowski, Thomas Hummel (2012), “Men without a sense of smell exhibit
a strongly reduced number of sexual relationships, women exhibit reduced partnership
security
30. Ilona Croy; Simona Negoias, Lenka Novakova, Basile N. Landis, Thomas Hummel (2012),
31. J. F. Mateson (1955), “Olfactometry: Its Techniques and Apparatus”, Journal of the Air
32. J. Frasnelli, B Schuster, T Hummel (2006), “Subjects with congenital anosma have larger Peripheral but Similar Central Trigeminal Responses”.
33. Jackson-Koku, G. (2016) ‘Beck Depression Inventory’, Occupational Medicine. doi: 10.1093/occmed/kqv087.

74
34. Johannes Frasnelli, Benno Schuster Thomas Hummel (2007), “Interactions between
olfaction and the trigeminal System : What can be learned from Olfactory Loss”, Cererabral
Cortex
35. Johannes Frasnelli, Therese Frak, Jacqueline Lehmann, Johannes Gerber, Thomas Hummel
36. Jonas K. Olofsson, Jay A. Gottfried, (2016), “The muted sense: neurocognitive limitations of 37. Joseph Maldjian, MD, WFU Pickatlas version 3.0 User Manual, ANSIR Laboratory Wake
Forest University School Of Medicine. 38. Joseph P. Hornak, Ph.D., (1997- 2017), “The basics of NMR”, Chapter 3: Spin Physics. 39. Karstensen, H.G. and Tommerup, N., 2012. Isolated and syndromic forms of congenital
anosmia. Clinical genetics, 81(3), pp.210-215. 40. Kobal, G. et al. (1996) ‘“Sniffin” Sticks’: Screening of olfactory performance’, Rhinology. 41. Kobal, G., Barz, S. and Hummel, T., 1992. A combined psychophysical and
electrophysiological olfaction test. Chem. Senses, 17, pp.850-851. 42. Leicht, G. and Mulert, C. (2014) ‘EEG-fMRI’, in MRI in Psychiatry. doi: 10.1007/978-3-642-
54542-9_4. 43. Leopold, D. A., Hornung, D. E. and Schwob, J. E. (1992) ‘Congenital lack of olfactory ability’,
Annals of Otology, Rhinology & Laryngology. doi: 10.1177/000348949210100306. 44. Levinson SC, Majid A. “Differential ineffability and the senses”, Mind Language 2014; 29:407-
427. 45. Lewin, J. S. (2003) ‘Functional MRI: An introduction to methods’, Journal of Magnetic
Resonance Imaging. doi: 10.1002/jmri.10284. 46. Lin, A. L. and Monica Way, H. Y. (2014) ‘Functional Magnetic Resonance Imaging’, in
Pathobiology of Human Disease: A Dynamic Encyclopedia of Disease Mechanisms. doi: 10.1016/B978-0-12-386456-7.07610-3.
47. Liyun Zhu and Jiao Wang (2018), “Calculating the free energy difference by applying the Jarzynki equality to a virtual integrable system”, Physi. Rev. E 98, 022117.
48. Lopes da Silva, F. H., Gonçalves, S. I. and De Munck, J. C. (2010) ‘Electroencephalography (EEG)’, in Encyclopedia of Neuroscience. doi: 10.1016/B978-008045046-9.00304-1.
49. Lorig, T. S. (2000) ‘The application of electroencephalographic techniques to the study of human olfaction: A review and tutorial’, International Journal of Psychophysiology. doi: 10.1016/S0167-8760(99)00104-X.
50. Lötsch, J. and Hummel, T. (2006) ‘The clinical significance of electrophysiological measures of olfactory function’, Behavioural Brain Research. doi: 10.1016/j.bbr.2006.02.013.
51. Lundström, J. N., Boesveldt, S. and Albrecht, J. (2011) ‘Central processing of the chemical senses: An overview’, ACS Chemical Neuroscience. doi: 10.1021/cn1000843.
52. Manzini, I., Frasnelli, J. and Croy, I. (2014) ‘[How we smell and what it means to us: basic principles of the sense of smell]’, HNO.
53. Merkelt Judith, August, 2017. How the emotions of others Influence our Olfactory Sense, Neuroscience News.
54. Michel, C. M. and Murray, M. M. (2012) ‘Towards the utilization of EEG as a brain imaging tool’, NeuroImage. doi: 10.1016/j.neuroimage.2011.12.039.
55. N.Tzourio, Mazoyer, B.Landeau , D.Papathanassiou , F.Crivello , O.Etard , N.Delcroix ,
B.Mazoyer , M.Joliot (2002),”Automated Anatomical Labeling of activations in SPM using a
macroscopic Anatomical Parcellation of the MNI MRI single- subject Brain”, NeuroImage,
Volume 15, Issue 1, 273-289.
56. Nasreddin D. Abolmaali, Volker Hietschold, Thomas J. Vogl, Karl-Bernd Hu ttenbrink,̈ and
a. October 2007; 2268- 2275.
b. olfactory language”, Trends Cognitive Science, 19(6): 314-321.
57. Pengfei Han, Nicole Winkler, Cornelia Hummel, Antje Hähner, Johannes Gerber, Thomas

75
58. Poldrack, R. A., Nichols, T. and Mumford, J. (2011) Handbook of Functional MRI Data Analysis, Handbook of Functional MRI Data Analysis. doi: 10.1017/cbo9780511895029.Pollution Control Association, 5:3, 167-170.
59. Preeti Kohli, Zachary M. Soler, Shaun A. Nguyen, John S. Muus and Rodney J.A reanalysis of previously published data” ((2013), “Brain structure is changes in congenital anosmia".
60. Roberts KE, Hart TA, Eastwood JD (2015), “Factor structure and validity of the state- Trait
Inventory for Cognitive and somatic Anxiety”, American Psychological Association, 28(2): 134-
146. 61. Rombaux, P., Grandin, C. and Duprez, T. (2009) ‘How to measure olfactory bulb volume and
olfactory sulcus depth?’, B-ENT. 62. S. Al Aïn, J.A. Frasnelli, (2017), “ Intranasal Trigeminal Chemoreception” Conn's Translational
Neuroscience (2017). 63. Sarafoleanu, C., Mella, C., Georgescu, M. and Perederco, C., 2009. The importance of the
olfactory sense in the human behavior and evolution. Journal of medicine and life, 2(2), p.196. 64. Schellinck, H. M. and Brown, R. E. (2015) ‘Olfactory System’, in International Encyclopedia of
the Social & Behavioral Sciences: Second Edition. doi: 10.1016/B978-0-08-097086-8.55042-9. 65. Schlosser (2016), “The association between olfaction and depression: A systematic Review 66. Seubert, J., Freiherr, J., Djordjevic, J. and Lundström, J.N., 2013. Statistical localization
of human olfactory cortex. Neuroimage, 66, pp.333-342. 67. Sheehy, N. (2008) ‘Electroencephalography: Basic Principles, Clinical Applications and Related
Fields’, Journal of Neurology, Neurosurgery & Psychiatry. doi: 10.1136/jnnp.47.6.654-a. 68. Shepherd, G.M., 2011. Neurogastronomy: how the brain creates flavor and why it matters.
Columbia University Press. 69. Sorokowska, A., Sorokowski, P. and Hummel, T., 2014. Cross-cultural administration of an
odor discrimination test. Chemosensory perception, 7(2), pp.85-90. 70. Stevenson, R.J., 2009. An initial evaluation of the functions of human olfaction. Chemical
senses, 35(1), pp.3-20. 71. Stockhorst, U. and Pietrowsky, R. (2004) ‘Olfactory perception, communication, and the nose-
to-brain pathway’, Physiology and Behavior. doi: 10.1016/j.physbeh.2004.07.018. 72. T. Hummel, E. Iannilli, J. Frasnelli, J. Boyle, and J. Gerber (2009), International Symposium
on Olfaction and Taste: Ann. N. Y. Acad. Sci. 190- 195. 73. Thomas Hummel (2002), “MR Evaluation in patients with isolated anosmia since birth or
early childhood”, AJNR Am J Neuroradiol 23: 157-163.