toolsfornetworkbiology 2
TRANSCRIPT


관심 있는 Gene Set에서 시작하는 일반적인 네트워크 분석(MONGKIE)

관심있는 Gene Set에서 시작하는 일반적인 네트워크 분석(sample gene set)
Example set을 만들어 분석한 내용을 토대로 자료를 만든다.
Seeding : Gene set(DEGs, Mutation Gene list, Fusion Gene list)
Expanding : 어떤 관계 데이터를 이용하여 네트워크를 그릴 것인가?
PPI
TF(transcription factor) : TG(target gene)
miRNA : TG
canonical pathway를 이루는 relation
Network Visualization
MONGKIE
Network Clustering
clique percolation method (소개만)
MCODE
MCL
Sub-network annotation
Sub-network를 이루는 유전자들의 개별조사(NCBI EntrezGene)
생물학자의 조언
관련 Canonical pathway 조사 (Enrichment Analysis)
text mining을 이용한 문헌조사,,,,,,

Sample Network
SP1 Gene TF ESC
SMAD3 Gene TF ESC
RELA Gene TF ESC
hsa-miR-34a miR miR ESC
hsa-miR-34a miR miR ESC
hsa-miR-34a miR miR ESC
DLX1 soxTarget ESC
SSR4 soxTarget ESC
NFKB1 RELA Dimer ESC
NFKB1 NFKB1 Dimer ESC
SP1 PDPN TFregulation ESC
SP1 SLC39A1 TFregulation ESC
hsa-miR-34a E2F3 miRregulation ESC
hsa-miR-34a NOTCH1 miRregulation ESC
Node Property

Gene Set
Table S3.Promoter Regions bound by Sox2 in ES cells
Sample data

hESC :1750
SOX2 Target Predictionhttp://en.wikipedia.org/wiki/ChIP-on-chip
hESC : Young Lab(MIT)
Data generationChIP-on-chip
- Used to investigate interactions between proteins and DNA in vivo

Protein A
SOX2TSS
OR
mi RNA
ESC Regulation
Gene a
- TRANSFAC Annotation Data
- TRANSFAC
Match(Prediction)
SOX2 Cofactor Analysis

platform - Illumina HumanRef-8 v3.0 expression beadchip
GSE1535
5
Expression Data

ESC - Significant Cofactor

• Data Import
• Data-to-Visual Mapping and Editors
• Network Layout
• Network Clustering and Grouping
• GO Enrichment Analysis
• Expression Overlay
• Data Export

• 실행파일
– Desktop\Mongkie_20120228\mongkie\bin\mo
ngkie.exe
• 다운로드
– http://wiki.kobic.re.kr/display/openspace/Mong
kie

Data Import

Import CSV: Node table

Import CSV: Edge table

Import Report

Imported Network

Data-to-Visual Mapping
• Map data attributes of nodes and edges to
the visual properties
– Continuous map
– Discrete map

Continuous Visual Mapping: Import expression data

Continuous Visual Mapping: Color

Continuous Visual Mapping: Color

Continuous Visual Mapping: Size

Continuous Visual Mapping: Size

Continuous Visual Mapping: Spline Editor

Discrete Visual Mapping

Discrete Visual Mapping

Visual Editors for Nodes and Edges

Global Display Options

Node, Edge and Group Display Options
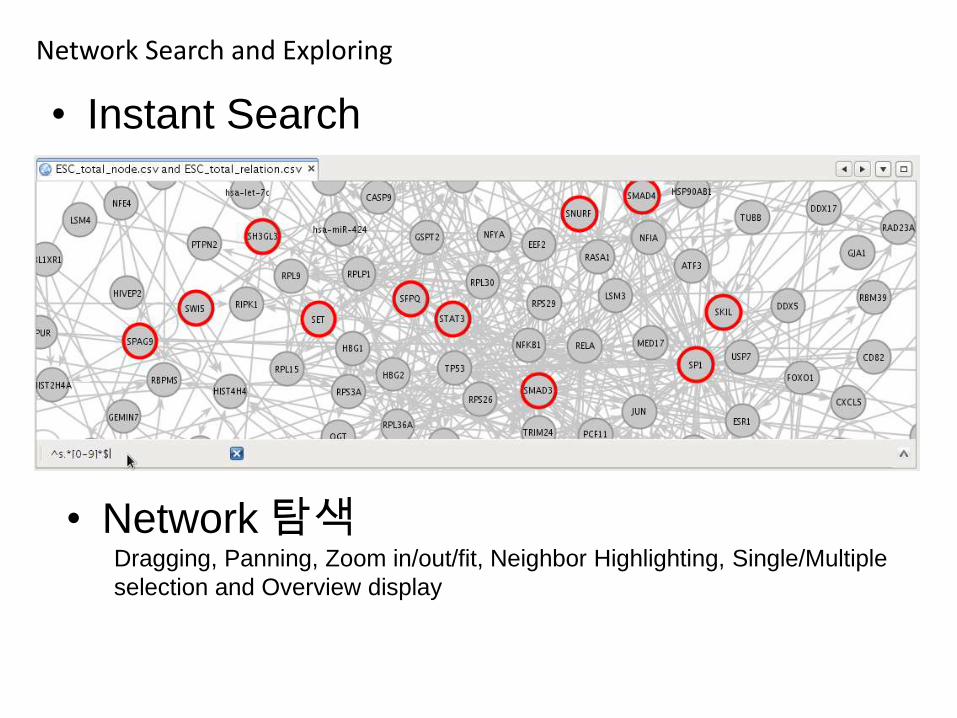
Network Search and Exploring
• Instant Search
• Network 탐색Dragging, Panning, Zoom in/out/fit, Neighbor Highlighting, Single/Multiple
selection and Overview display

Data Table

Network Layout
• Grid
• Circle
• Force Directed
• Radial Tree
• Random

Force Directed Layout

Force Directed Layout

Radial Tree Layout

Radial Tree Layout

Network Clustering
• MCODE
– Molecular COmplex Detection algorithm -
Bader and Hogue(2003)
• MCL
– Markov CLustering Algorithm

Step 1. Vertex Weighting
Step 2. Complex Prediction Step 3. Post-Processing
1-1. Finding neighber 1-2. Get highest k-core graph 1-3. Calculate density of k-core graph
1-4. Calculate vertex weight
2-1. Seed complex by nodes with highest weight
2.2. Include neighbors if the vertex weight is above
threshold(VWP) : vertex weight percentage
2-3. Repeat step 2 until no more nodes can be included
3-1. Complex must contain at least a 2-core graph
3-2. Include neighbors if the vertex weight is above the fluff parameter(Optional)
3-3. Haircut : Remove nodes with a degree less than
two(Optional)
MCODE

MCODE

MCODE

MCL

MCL

Group Editor

GO Enrichment Analysis

GO Enrichment Analysis

GO Enrichment Analysis

GO Enrichment Analysis

Expression Overlay

Expression Overlay

Export: XML, CSV and Images
