tool 1.6: sensitivity matrix tool for assessing ... of climate change on urban infrastructure &...
TRANSCRIPT

Impacts of Climate Change on Urban Infrastructure & the Built Environment
A Toolbox
Tool 1.6: Sensitivity Matrix Tool for
Assessing Vulnerability of Urban
Environments to Climate Change
Authors
S. Oldfield1
S. Allan2
Affiliations
1 MWH (NZ) Ltd., PO Box 9624, Te Aro, Wellington
2 Allan Planning and Research Ltd, 26 Patrick St, Petone, Lower Hutt
Contents
1. Introduction 1
1.1 Background 1
1.2 Purpose of Tool 2
2. Overview of the Sensitivity Matrix Tool 2
2.1 The Basic Matrix 2
2.2 The Decision Conferencing Method 3
2.3 Data Needs 4
2.4 Tool Outputs 5
2.5 Assumptions and Limitations 5
3. Examples of Application of the Sensitivity Matrix Tool 6
3.1 Organisation and Conduct of Workshops 6
3.2 Populating the Sensitivity Matrix 7
3.3 Overall Findings from Application of Sensitivity Matrix 8
4. Conclusion 9
References 11
Appendix A 12
All rights reserved. The copyright and all other intellectual property rights in this
report remain vested solely in the organisation(s) listed in the author affiliation list.
The organisation(s) listed in the author affiliation list make no representations or
warranties regarding the accuracy of the information in this report, the use to which
this report may be put or the results to be obtained from the use of this report.
Accordingly the organisation(s) listed in the author affiliation list accept no liability
for any loss or damage (whether direct or indirect) incurred by any person through the
use of or reliance on this report, and the user shall bear and shall indemnify and hold
the organisation(s) listed in the author affiliation list harmless from and against all
losses, claims, demands, liabilities, suits or actions (including reasonable legal fees) in
connection with access and use of this report to whomever or how so ever caused.

Tool 1.6 Senisitivity Matrix Tool FINAL.doc 1
1. Introduction
This document gives details of one of a number of Tools developed to assist Councils,
and others, in taking account of long-term climate change effects in their on-going
management of the urban environment, with the aim of making the built environment
more resilient to climate change effects.
The Tool described here [Tool 1.6] is included within a Toolbox Framework of
various reference and guidance documents and software tools. These are designed to
assist in assessing risks and development responses in a way that will reduce risks and
lead to more resilient urban areas in the face of climate changes which include
increasingly extreme weather events.
This and other documents within the Toolbox are specifically concerned with the risks
that will arise from climate change effects and uncertainties, and not with the risks and
uncertainties associated with the drivers of climate change.
The Sensitivity Matrix Tool described here [Tool 1.6] will assist councils to determine
the priorities for their areas in facing climate change, and adapting to its consequences.
1.1 Background
The reality of climate change creates additional challenges for Councils and others
charged with the responsibility of shaping and maintaining our urban areas. The
effects of climate change will threaten existing infrastructure and buildings and create
additional challenges in the decisions that have to be made in planning. These relate
both to maintaining and/or retro-fitting existing urban areas, and in planning for future
“greenfield” developments.
These challenges arise principally because of uncertainty in the following, both at a
global and local scale:
a) The long-term trends (rates of change) in environmental stressors (either
positive or negative);
b) The frequency and severity of climate extremes;
c) The impact that (a) and (b) above will have on the vulnerability and durability
of urban infrastructure and buildings;
d) The medium- and longer-term socio-economic and behavioural responses to
(a) to (c) above.
More particularly, the adverse effects of climate change can cause the following (other
things being equal):
• A reduction in design life of public assets

Tool 1.6 Senisitivity Matrix Tool FINAL.doc 2
• Increased chance of premature failure of assets
• Higher demands on resources
• Greater exposure to adverse effects and their consequences in both the public
and private sector.
The Sensitivity Matrix Tool described here is used at the start of an overall process of
decision-making. It aims to help local authorities understand the aspects of greatest
vulnerability for their urban communities in a relatively straight-forward and rapid
manner, and thus to identify priorities and target resources into adaptive responses.
1.2 Purpose of Tool
The Sensitivity Matrix Tool enables a council to understand and summarise their
current understanding of the sensitivity1 of a region’s urban infrastructure and
buildings to the full range of potential climate change effects. The Tool also allows the
relevant issues to be scoped and investigated in a preliminary way, and provides a
basis for identifying priorities for a particular area.
2. Overview of the Sensitivity Matrix Tool
The Sensitivity Matrix Tool involves both a matrix and a methodology for eventually
populating the matrix. The basis of the Tool is that the community of people working
in areas of the urban environment are knowledgeable about these areas, whether they
specialise in single-purpose asset planning and management, or whether they are
involved in integrated landuse or strategic planning. This knowledge can be shared
and drawn together in a way that assists in prioritising actions for an urban (or other)
community.
2.1 The Basic Matrix
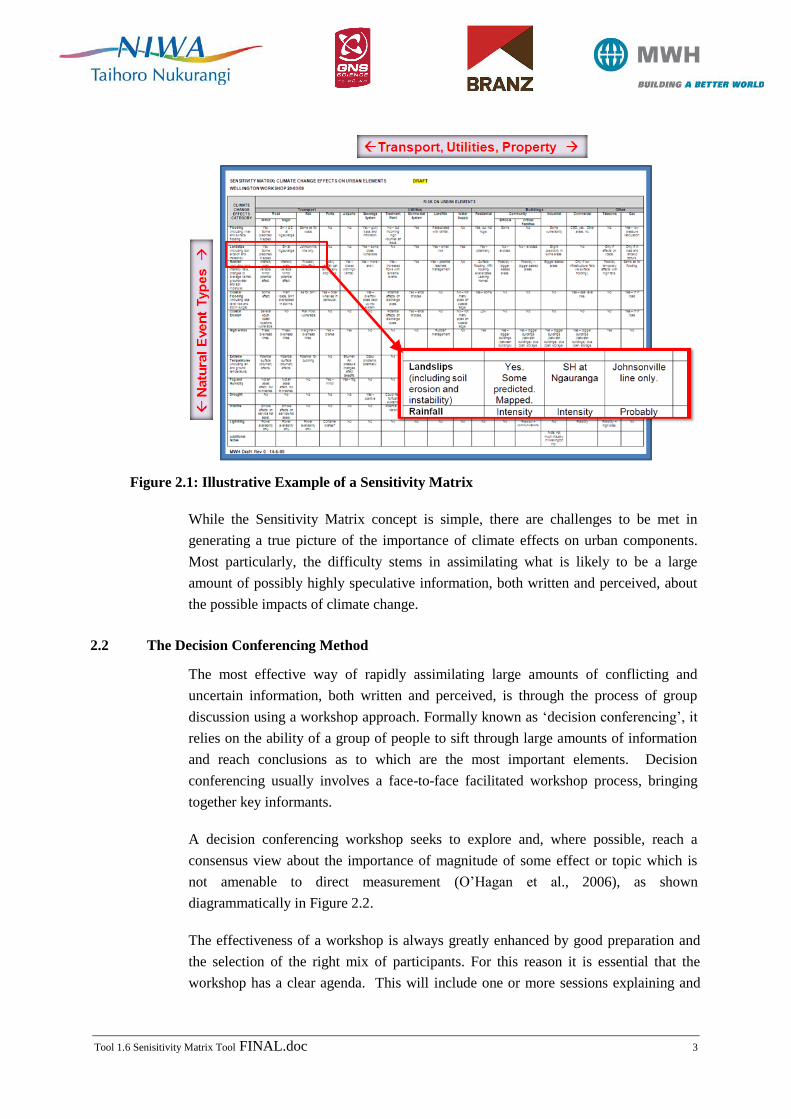
A Sensitivity Matrix (see example in Figure 2.1) comprises a two-dimensional matrix
(spreadsheet) with climate change effects listed down the left hand side, and urban
infrastructure and buildings potentially vulnerable to these effects across the column
headings.
Key sensitivities are noted in each cell of the matrix for each combination of climate
change effect and infrastructure/buildings element. The climate change effect(s) that
have the greatest impact, or multiple significant impacts, on urban infrastructure and
buildings are then prioritised for assessment using other tools.
1 The word sensitivity is used, recognising that priorities should be based on more than just the
physical vulnerability of assets to climate change effects.
Tool 1.6 Senisitivity Matrix Tool FINAL.doc 3
Figure 2.1: Illustrative Example of a Sensitivity Matrix
While the Sensitivity Matrix concept is simple, there are challenges to be met in
generating a true picture of the importance of climate effects on urban components.
Most particularly, the difficulty stems in assimilating what is likely to be a large
amount of possibly highly speculative information, both written and perceived, about
the possible impacts of climate change.
2.2 The Decision Conferencing Method
The most effective way of rapidly assimilating large amounts of conflicting and
uncertain information, both written and perceived, is through the process of group
discussion using a workshop approach. Formally known as ‘decision conferencing’, it
relies on the ability of a group of people to sift through large amounts of information
and reach conclusions as to which are the most important elements. Decision
conferencing usually involves a face-to-face facilitated workshop process, bringing
together key informants.
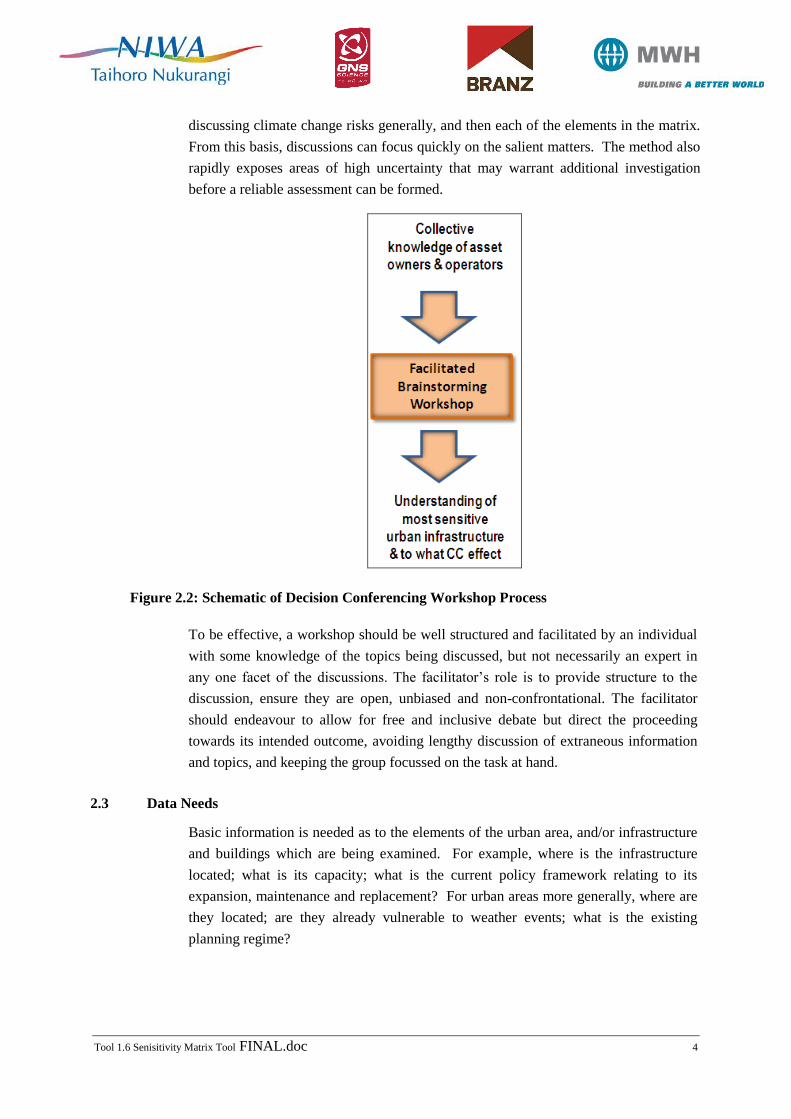
A decision conferencing workshop seeks to explore and, where possible, reach a
consensus view about the importance of magnitude of some effect or topic which is
not amenable to direct measurement (O’Hagan et al., 2006), as shown
diagrammatically in Figure 2.2.
The effectiveness of a workshop is always greatly enhanced by good preparation and
the selection of the right mix of participants. For this reason it is essential that the
workshop has a clear agenda. This will include one or more sessions explaining and
Tool 1.6 Senisitivity Matrix Tool FINAL.doc 4
discussing climate change risks generally, and then each of the elements in the matrix.
From this basis, discussions can focus quickly on the salient matters. The method also
rapidly exposes areas of high uncertainty that may warrant additional investigation
before a reliable assessment can be formed.
Figure 2.2: Schematic of Decision Conferencing Workshop Process
To be effective, a workshop should be well structured and facilitated by an individual
with some knowledge of the topics being discussed, but not necessarily an expert in
any one facet of the discussions. The facilitator’s role is to provide structure to the
discussion, ensure they are open, unbiased and non-confrontational. The facilitator
should endeavour to allow for free and inclusive debate but direct the proceeding
towards its intended outcome, avoiding lengthy discussion of extraneous information
and topics, and keeping the group focussed on the task at hand.
2.3 Data Needs
Basic information is needed as to the elements of the urban area, and/or infrastructure
and buildings which are being examined. For example, where is the infrastructure
located; what is its capacity; what is the current policy framework relating to its
expansion, maintenance and replacement? For urban areas more generally, where are
they located; are they already vulnerable to weather events; what is the existing
planning regime?

Tool 1.6 Senisitivity Matrix Tool FINAL.doc 5
An understanding of the likely climate changes over the next 50 to 100 years is also
necessary, drawing on existing guidance (e.g. see [Tool 1.2] or MfE, 2008a,b and
MfE, 2010). This should be identified, as far as possible, in terms of the area of
interest. In addition, it will be necessary to take into account non-climate related
aspects such as topography, elevation in relation to sea level, vegetation cover, density
or intensity of urban development.
While there may be numerous limitations in the data at the time of undertaking the
sensitivity assessment, this is not a reason to delay or defer consideration and
prioritisation. There will be future opportunities to revisit this stage, ideally
approximately every five years or so, as part of overall long-term council community
planning under the Local Government Act, and/or as part of reviews of resource
management planning in terms of the Resource Management Act.
2.4 Tool Outputs
The output of the Sensitivity Matrix Tool is a completed matrix which captures the
range of elements which make up the urban area (transport, utilities and buildings) and
the range of climate change effects they are potentially exposed to.
Along with the matrix is a preliminary risk assessment (based on a red-yellow-green
colour-based hierarchy to add clarity), and a set of notes that provide an estimate of
extent and limitations – for example if only some areas are vulnerable to a type of
effect, this should be noted.
The completed matrix should form a basic resource for other decisions, providing
context and continuity across the multitude of council activities and responsibilities,
and community interests.
2.5 Assumptions and Limitations
The use of the Tool will only be as good as the knowledge of those who are involved
in developing the matrix. For that reason it is important that the decision conferencing
workshop is inclusive. For example, it should include representatives of regional and
district local government and representatives of different infrastructure components, as
well as those responsible for planning the area’s urban future. It should also involve
people reasonably knowledgeable about climate change effects and how these may
affect the area of interest.
In building up the matrix it is anticipated that the attendees will bring information
about community views and broad planning and policy information. Legacy issues
can also be important, for example, issues around closed landfills or remediated
contaminated sites.

Tool 1.6 Senisitivity Matrix Tool FINAL.doc 6
As Sensitivity Matrix development should be regularly repeated over time, lack of
detailed information is not a critical issue. The first matrix can be improved upon at a
future iteration.
3. Examples of Application of the Sensitivity Matrix Tool
This tool was used early in the overall Impacts of Climate Change on Urban
Infrastructure and the Built Environment Project, working with people from the four
geographic areas from which case study examples were expected to be drawn, to help
identify suitable examples for further study.
The decision conferencing workshops were held between November 2008 and April
2009 with local government agencies in Christchurch, Wellington, Auckland and
Westport. The areas were selected as being representative of a range of potential
climate change issues in terms of built environments, but also were all areas with
significant existing capability and interest in managing the effects of future changes in
climate variables.
This section outlines the methodology and summarises the findings from this series of
workshops. The four Sensitivity Matrices so derived are given in Appendix A.
3.1 Organisation and Conduct of Workshops
In advance of each workshop, background information was provided about their
purpose, and the involvement and input of appropriate local authority representatives
was sought. Representatives of the project research team also attended.
All workshops involved representatives of both territorial and regional councils in the
area. Elected representatives were present at two of the workshops. Other agencies,
including consultants and agencies with related statutory responsibilities, attended
workshops on the invitation of the local authorities initially contacted.
Several of the local authorities involved had key staff allocated to a co-ordinating and
facilitating climate change policy and practice role, and these people were particularly
helpful in identifying who should attend the workshops and ensuring distribution of
material.
While the scope of the workshops was broader than just developing a Sensitivity
Matrix, workshop time was spent directly on discussion and populating the matrices of
potential effects of climate change on the built environment.

Tool 1.6 Senisitivity Matrix Tool FINAL.doc 7
The Sensitivity Matrix component proceeded along the lines of short presentations by
key council representatives on their agency’s approach to climate change with
reference to the relevant policies and current priorities, followed by a more general
discussion on the potential effects of climate change.
All councils involved in the workshops are engaged in climate change responses at
policy and practice level. They use the currently available guidance material on
climate change and seek more refined information on variability and improved
decision tools. Most consider that their communities are not yet fully aware of climate
change or are not convinced of climate change as an issue.
The Sensitivity Matrices developed at the workshops were intended to be very much a
‘first cut’ of potential issues, and a tool that would highlight possible case studies.
There was no attempt to capture the extent or scale of risk elements or to define them
geographically beyond a broad level or area of interest.
Basically, the process was to be a “brain dump” of knowledge that the councils have
about their own community and private assets, and their potential vulnerability to
different potential aspects of climate change. The timeframe applied was in relation to
the “life” of urban assets – thus some assets would not be at risk now, but may be in
50 to 100 years.
3.2 Populating the Sensitivity Matrix
At each workshop, the items on the vertical (potential climate change effects) and
horizontal (elements of the urban environment) axes were discussed, comments noted
and subsequent changes made if needed. It was acknowledged that all items on the
vertical axis were not mutually exclusive, but most were. Councils variously
expanded the horizontal axis to include further elements of importance to their
communities.
In practice, the collective knowledge enabled each matrix to be populated to a
reasonable extent with the people involved, as can be seen in the completed matrices
provided in Appendix A.
The following approach to the notes assembled from each workshop was applied in
filling out the matrix for each area:
• Where there was expected to be a potential issue, its existence and any
comments that the workshop wished to record was noted;
• Where there was expected not to be an issue, this was recorded as a “no”, or
“unlikely”;

Tool 1.6 Senisitivity Matrix Tool FINAL.doc 8
• Where the participants felt that there was insufficient information available to
them, but nevertheless an effect was unlikely (as most councils had identified
aspects of vulnerability through civil defence or lifeline-related
responsibilities), a question-mark was used to indicate this.
As a second stage, the project team colour-coded the matrix as follows:
• red: high impacts possible;
• orange: medium impacts, localised impacts, or uncertain impacts possible
• green: no or low impacts most probable.
While a simplification, this method has the benefit of clearly highlighting the most
obvious issues for each urban area, and assisting in identifying the most appropriate
subjects for case studies that could be used from each area. The ensuing colour-coded
matrix was checked back with the local authority involved after the workshop, for
their agreement on the colours used for each component of the matrix.
3.3 Overall Findings from Application of Sensitivity Matrix
The four urban areas considered in the case studies yielded results which were quite
varied. There were some similarities, but more marked differences.
It is also noted that participants were generally aware of the current expectations of
physical effects of climate change for their urban areas under consideration and these
were therefore built into their assessment of vulnerability. For example, Christchurch
workshop participants acknowledged the likelihood of increasing drought in the
future, but also the likelihood of increasing rainfall intensities in the catchments which
serve the large Canterbury Rivers.
The scale of the urban areas considered varied greatly, and this was also reflected in
the vulnerability. For example, flood risks facing communities in Auckland or
Wellington urban areas would be experienced by only small parts of the overall
community, whereas virtually the whole of the Westport urban area is potentially at
risk from flooding.
Some general comments have been made below in relation to each of the four urban
areas, reflecting the collective thoughts of participants at each of the council
workshops:
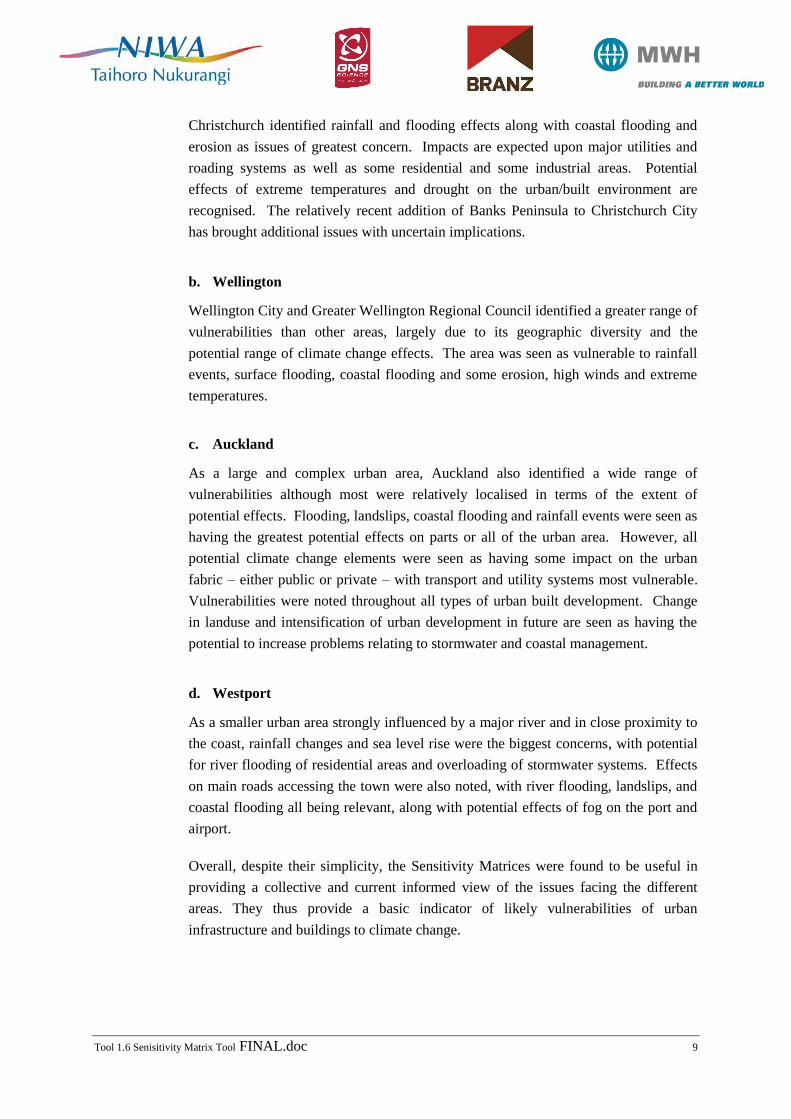
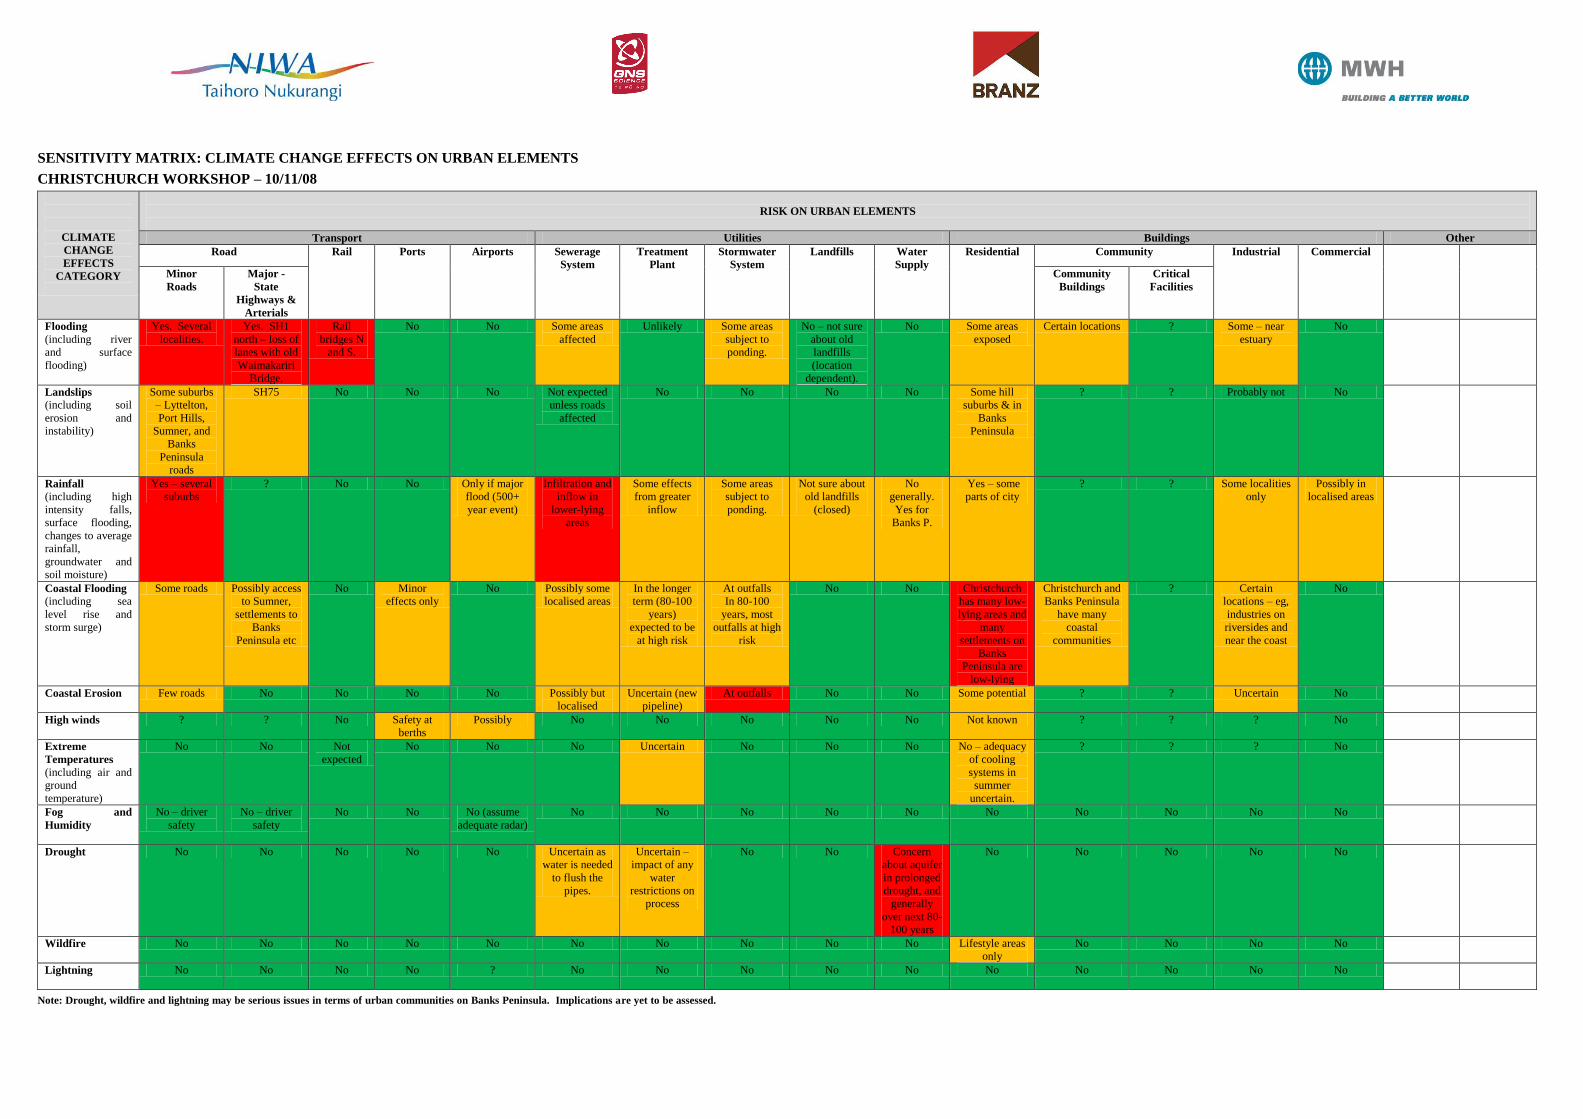
a. Christchurch
Tool 1.6 Senisitivity Matrix Tool FINAL.doc 9
Christchurch identified rainfall and flooding effects along with coastal flooding and
erosion as issues of greatest concern. Impacts are expected upon major utilities and
roading systems as well as some residential and some industrial areas. Potential
effects of extreme temperatures and drought on the urban/built environment are
recognised. The relatively recent addition of Banks Peninsula to Christchurch City
has brought additional issues with uncertain implications.
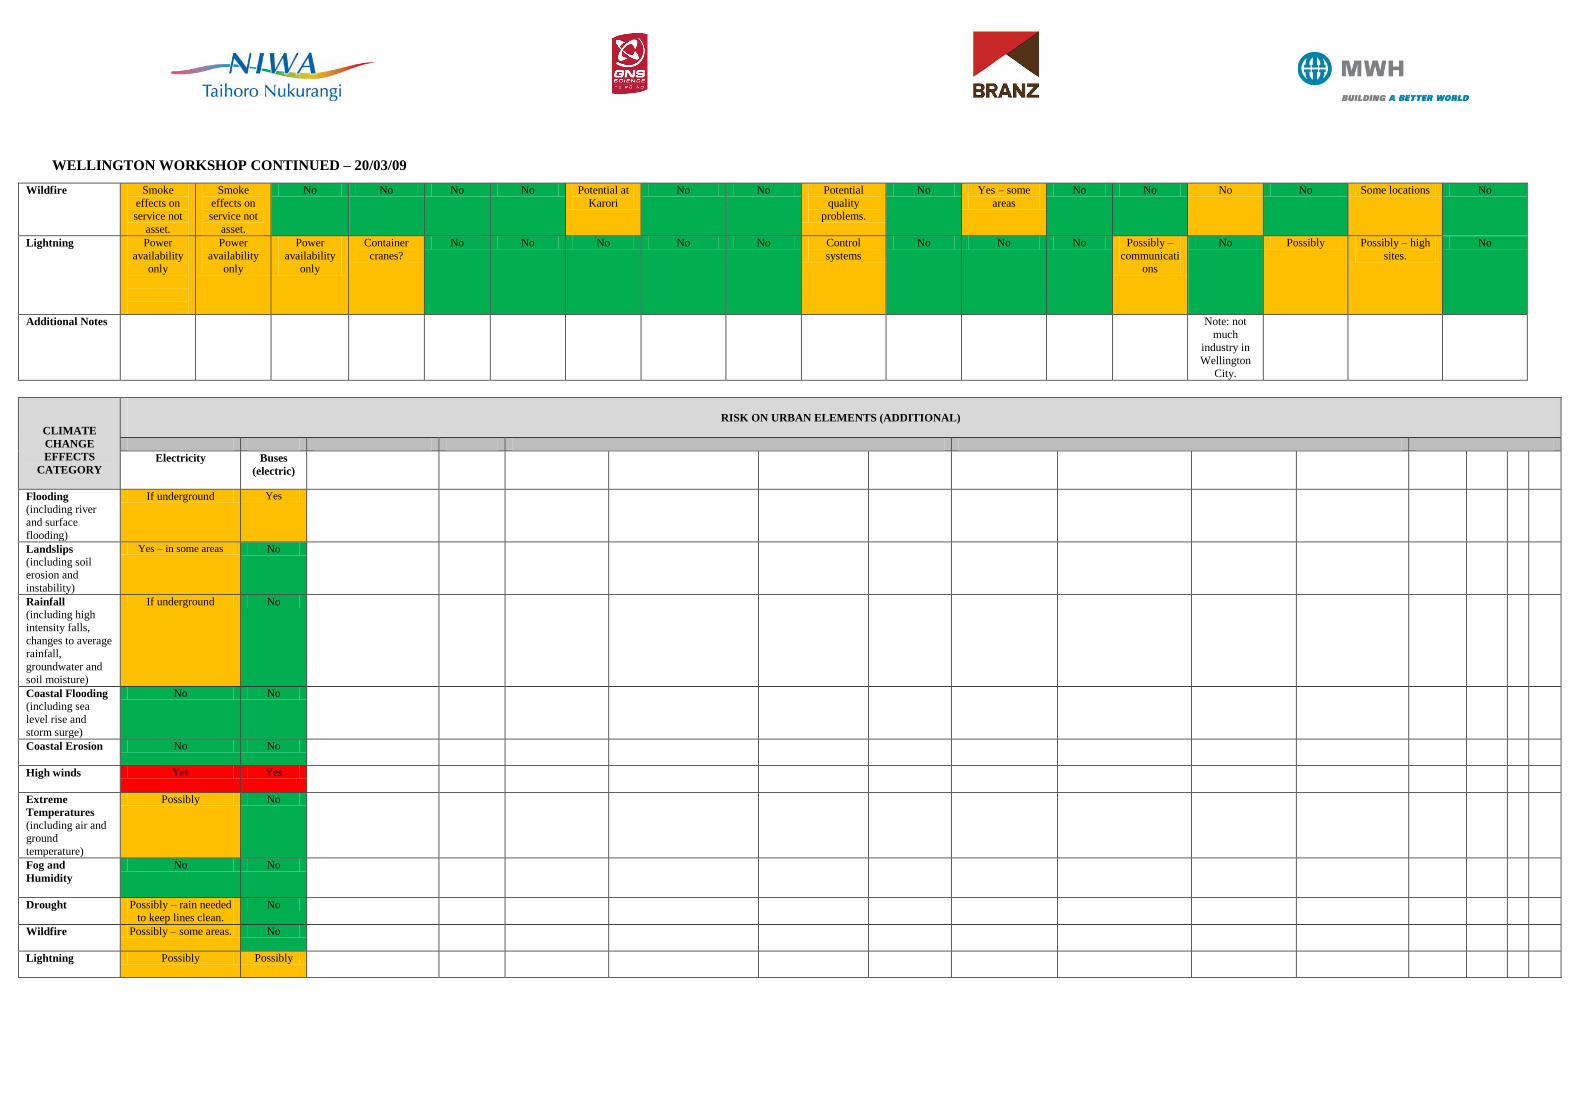
b. Wellington
Wellington City and Greater Wellington Regional Council identified a greater range of
vulnerabilities than other areas, largely due to its geographic diversity and the
potential range of climate change effects. The area was seen as vulnerable to rainfall
events, surface flooding, coastal flooding and some erosion, high winds and extreme
temperatures.
c. Auckland
As a large and complex urban area, Auckland also identified a wide range of
vulnerabilities although most were relatively localised in terms of the extent of
potential effects. Flooding, landslips, coastal flooding and rainfall events were seen as
having the greatest potential effects on parts or all of the urban area. However, all
potential climate change elements were seen as having some impact on the urban
fabric – either public or private – with transport and utility systems most vulnerable.
Vulnerabilities were noted throughout all types of urban built development. Change
in landuse and intensification of urban development in future are seen as having the
potential to increase problems relating to stormwater and coastal management.
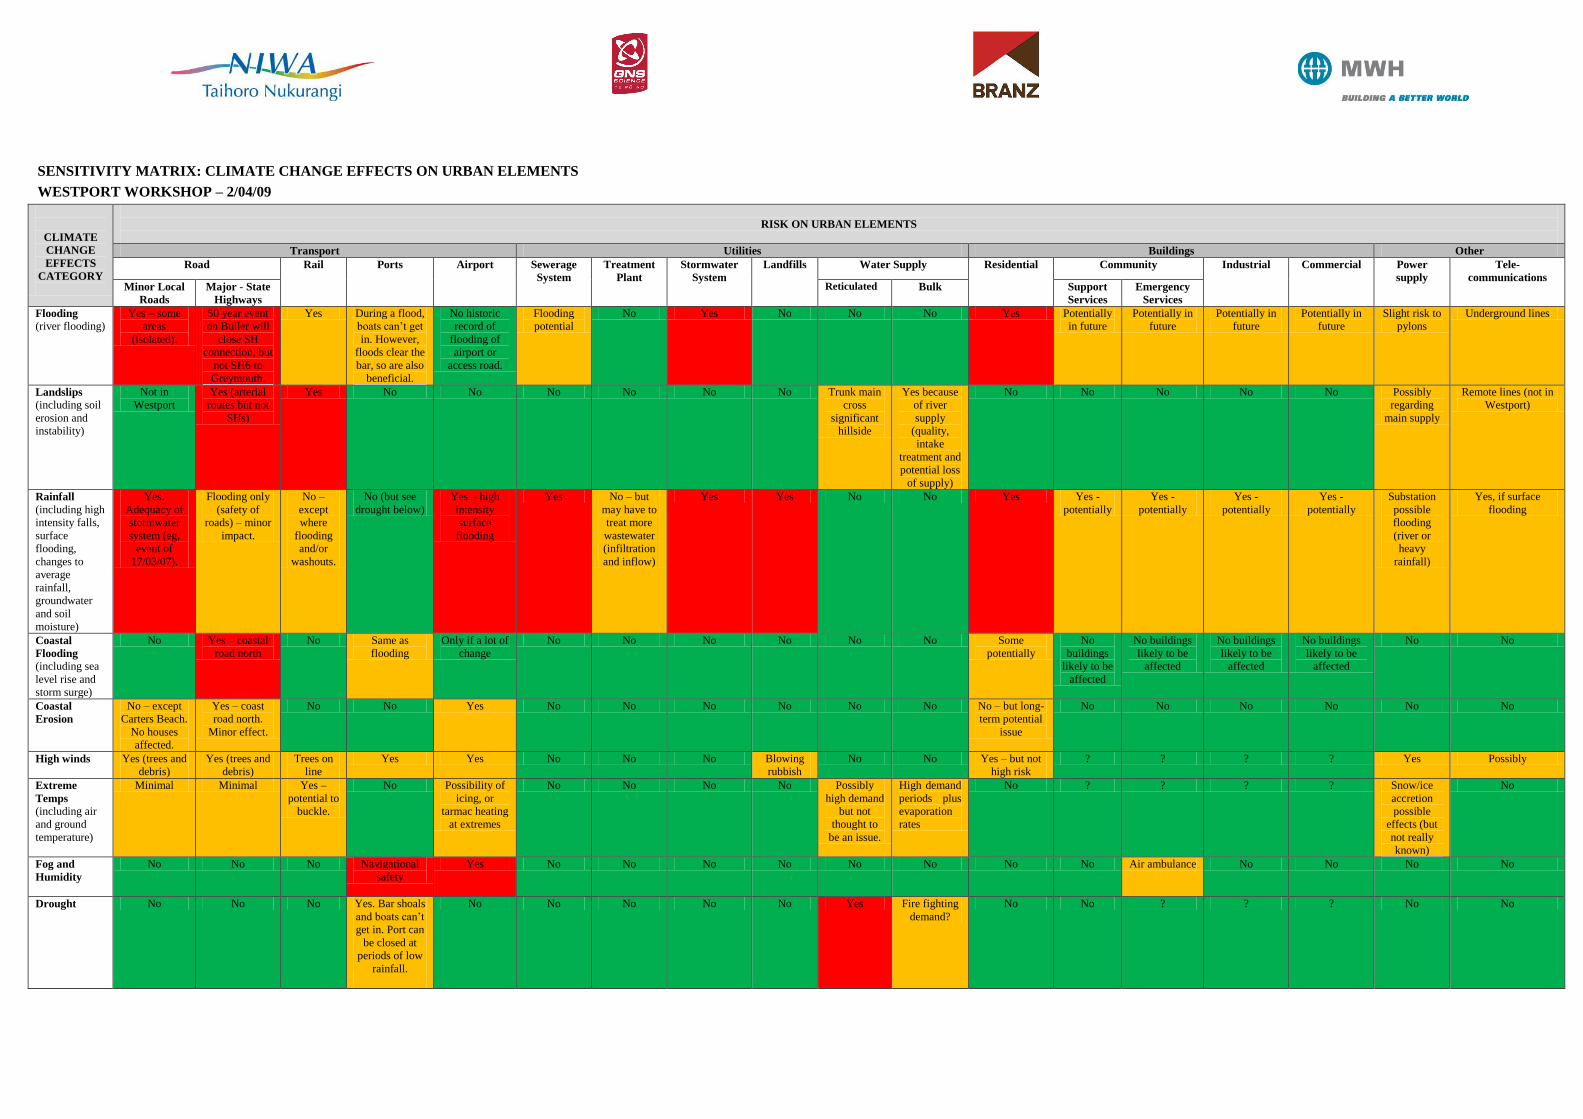
d. Westport
As a smaller urban area strongly influenced by a major river and in close proximity to
the coast, rainfall changes and sea level rise were the biggest concerns, with potential
for river flooding of residential areas and overloading of stormwater systems. Effects
on main roads accessing the town were also noted, with river flooding, landslips, and
coastal flooding all being relevant, along with potential effects of fog on the port and
airport.
Overall, despite their simplicity, the Sensitivity Matrices were found to be useful in
providing a collective and current informed view of the issues facing the different
areas. They thus provide a basic indicator of likely vulnerabilities of urban
infrastructure and buildings to climate change.

Tool 1.6 Senisitivity Matrix Tool FINAL.doc 10
4. Conclusion
As a useful tool in climate change impacts investigations, the Sensitivity Matrix seeks
to establish preliminary priorities for councils considering impacts of climate change
on their urban infrastructure and built environment. For example, the Tool may be
used to distinguish whether higher projected flood levels rather than increasing
numbers of landslides are of greater concern for a particular asset or infrastructure
type.
In reaching conclusions about these concerns, workshop participants take account of
not just the physical effects, but also community views, legacy and planning issues, as
well as the amenability of the issues to affordable and acceptable resolution. As a
consequence, a populated Sensitivity Matrix provides useful ongoing guidance. The
exercise of developing such a matrix should be repeated every five to 10 years for
most urban environments.
Overall, the application of climate change related Sensitivity Matrices to urban areas
identified by councils demonstrates an appropriate way of bringing together and
analysing current information at an early stage and at a preliminary level, thus helping
begin the process of assessing the vulnerability of infrastructure and buildings to
climate change. The use of this Tool enables identification of priorities for further
investigation and possible emphasis in future planning documents.

Tool 1.6 Senisitivity Matrix Tool FINAL.doc 11
References
MfE, 2008a, Climate Change Effects and Impacts Assessment – A Guidance Manual
for Local Government in New Zealand (2nd
Edition), Ministry for the Environment,
Wellington, May 2008.
MfE 2008b, Coastal Hazards and Climate Change – A Guidance Manual for Local
Government in New Zealand, Ministry for the Environment, Wellington, July 2008.
MfE 2010, Tools for Estimating the Effects of Climate Change on Flood Flow,
Ministry for the Environment, Wellington, May 2010.
O'Hagan A, Buck C.E, Daneshkhah A, Eiser J.R, Garthwaite P.H, Jenkinson D.J,
Oakley J.E and Rakow T, 2006, Uncertain Judgements - Eliciting Experts'
Probabilities, John Wiley & Sons Ltd., London.

Appendix A
SENSITIVITY MATRIX: CLIMATE CHANGE EFFECTS ON URBAN ELEMENTS
CHRISTCHURCH WORKSHOP – 10/11/08
CLIMATE
CHANGE
EFFECTS
CATEGORY
RISK ON URBAN ELEMENTS
Transport Utilities Buildings Other
Road Rail Ports Airports Sewerage
System
Treatment
Plant
Stormwater
System
Landfills Water
Supply
Residential Community Industrial Commercial
Minor
Roads
Major -
State
Highways &
Arterials
Community
Buildings
Critical
Facilities
Flooding
(including river
and surface
flooding)
Yes. Several
localities.
Yes. SH1
north – loss of
lanes with old
Waimakariri
Bridge.
Rail
bridges N
and S.
No No Some areas
affected
Unlikely Some areas
subject to
ponding.
No – not sure
about old
landfills
(location
dependent).
No Some areas
exposed
Certain locations ? Some – near
estuary
No
Landslips
(including soil
erosion and
instability)
Some suburbs
– Lyttelton,
Port Hills,
Sumner, and
Banks
Peninsula
roads
SH75 No No No Not expected
unless roads
affected
No No No No Some hill
suburbs & in
Banks
Peninsula
? ? Probably not No
Rainfall
(including high
intensity falls,
surface flooding,
changes to average
rainfall,
groundwater and
soil moisture)
Yes – several
suburbs
? No No Only if major
flood (500+
year event)
Infiltration and
inflow in
lower-lying
areas
Some effects
from greater
inflow
Some areas
subject to
ponding.
Not sure about
old landfills
(closed)
No
generally.
Yes for
Banks P.
Yes – some
parts of city
? ? Some localities
only
Possibly in
localised areas
Coastal Flooding
(including sea
level rise and
storm surge)
Some roads Possibly access
to Sumner,
settlements to
Banks
Peninsula etc
No Minor
effects only
No Possibly some
localised areas
In the longer
term (80-100
years)
expected to be
at high risk
At outfalls
In 80-100
years, most
outfalls at high
risk
No No Christchurch
has many low-
lying areas and
many
settlements on
Banks
Peninsula are
low-lying
Christchurch and
Banks Peninsula
have many
coastal
communities
? Certain
locations – eg,
industries on
riversides and
near the coast
No
Coastal Erosion
Few roads No No No No Possibly but
localised
Uncertain (new
pipeline)
At outfalls No No Some potential ? ? Uncertain No
High winds
? ? No Safety at
berths
Possibly No No No No No Not known ? ? ? No
Extreme
Temperatures
(including air and
ground
temperature)
No No Not
expected
No No No Uncertain No No No No – adequacy
of cooling
systems in
summer
uncertain.
? ? ? No
Fog and
Humidity
No – driver
safety
No – driver
safety
No No No (assume
adequate radar)
No No No No No No No No No No
Drought No No No No
No Uncertain as
water is needed
to flush the
pipes.
Uncertain –
impact of any
water
restrictions on
process
No No Concern
about aquifer
in prolonged
drought, and
generally
over next 80-
100 years
No No No No No
Wildfire
No No No No No No No No No No Lifestyle areas
only
No No No No
Lightning
No No No No ? No No No No No No No No No No
Note: Drought, wildfire and lightning may be serious issues in terms of urban communities on Banks Peninsula. Implications are yet to be assessed.

SENSITIVITY MATRIX: CLIMATE CHANGE EFFECTS ON URBAN ELEMENTS
WELLINGTON WORKSHOP – 20/03/09
CLIMATE
CHANGE
EFFECTS
CATEGORY
RISK ON URBAN ELEMENTS
Transport Utilities Buildings Other
Road Rail Ports Airports Sewerage
System
Treatment
Plant
Stormwater
System
Landfills Bulk water
supply
Water
Supply
Residential Community Industrial Commercial Telecoms Gas
Minor
Roads
Major -
State
Highways &
Arterials
Schools Critical
Facilities
Flooding
(including river
and surface
flooding)
Yes. Some
predicted.
Mapped.
SH 1 & 2 at
Ngauranga
Same as for
roads.
No No Yes – gully
traps and
infiltration.
No – but
incoming
high
volumes an
issue.
Yes If associated
with rainfall.
Could be –
pipelines
across rivers.
No Yes, but not
huge.
Some No Some
vulnerability
CBD, yes.
Other areas,
no.
No Yes – low
pressure
reticulation.
Landslips
(including soil
erosion and
instability)
Yes. Some
predicted.
Mapped.
SH at
Ngauranga
Johnsonville
line only.
No No Yes – some
pipes
vulnerable.
No Yes Yes – small
risk
Some – not an
issue.
Yes Yes –
potentially.
No –
avoided.
No –
avoided.
Slight
possibility in
some areas.
No Only if effects on
roads.
Only if in road
and landslip
occurs.
Rainfall
(including high
intensity falls,
changes to average
rainfall,
groundwater and
soil moisture)
Intensity
main
variable.
Minor
potential
effect.
Intensity
main
variable.
Minor
potential
effect.
Probably
little effect.
Heavy
rainfall can
temporarily
stop work.
Yes –
closes with
high
rainfall.
Yes – more I
and I.
Yes –
increased
flows with
extreme
events.
Yes Yes –
potential
leachate
mgmt
Yes – potential
groundwater
effects.
No Surface
flooding, infill
housing
exacerbates.
Leaking
homes.
Possibly –
bigger
sealed
areas.
Possibly –
bigger sealed
areas.
Bigger
sealed areas.
Only if our
infrastructure
fails (re surface
flooding).
Possibly
temporary effects
with high falls.
Same as for
flooding.
Coastal Flooding
(including sea
level rise and
storm surge)
Some effect
– south coast
roads
potentially
high risk
from sea
level rise and
storm surge
Main roads,
SH1
overtopped
in storms.
As for SH1 Yes – older
wharves in
particular.
No Yes –
overflow
pipes back
up into
system.
Potential
effects on
discharge
pipes.
Yes – ends of
pipes.
No No No – not
many pipes
on coastal
edge.
Yes –
especially
south coast
suburbs
including
Kilbirnie
subject to sea
level rise and
storm surge.
No No No Yes – sea level
rise.
No Yes – if in
road.
Coastal Erosion
Several
south coast
locations
vulnerable.
No Rail most
vulnerable
No No No Potential
effects on
discharge
pipes.
Yes – ends of
pipes.
No Small effect
possible.
No – not
many pipes
on coastal
edge.
No No No No No Yes – if in
road.
High winds
Trees,
overhead
lines.
Trees,
overhead
lines.
Marginal –
overhead
lines.
Yes – cranes Yes No No No Rubbish
mgmt
Control
systems
No Yes Yes –
bigger
buildings
(between
buildings)
plus open
storage.
Yes – bigger
buildings
(between
buildings)
plus open
storage.
Yes – bigger
buildings
(between
buildings)
plus open
storage.
Yes – bigger
buildings
(between
buildings) plus
open storage.
Yes No
Extreme
Temperatures
(including air and
ground
temperature)
Potential
surface
(bitumen)
effects.
Potential
surface
(bitumen)
effects.
Potential for
buckling
No Bitumen.
Air
pressure
changes
affect
takeoffs.
Odour
problems,
potentially.
No No Odour
possible
Increased
demand
No No No No No No Need to cool
roadside
cabinets.
No
Fog and
Humidity
Not an asset
effect, but
possibly
crashes.
Not an asset
effect, but
possibly
crashes.
No Yes – minor Yes – fog No No No No No No No No No No No No No
Drought
No No No No No Yes –
positive
Could need
to flush
systems.
No No Yes –
increased
supply needed.
No No No No No No No No
Wildfire
Smoke
effects on
service not
asset.
Smoke
effects on
service not
asset.
No No No No Potential at
Karori
No No Potential
quality
problems.
No Yes – some
areas
No No No No Some locations No
Lightning
Power
availability
only
Power
availability
only
Power
availability
only
Container
cranes?
No No No No No Control
systems
No No No Possibly –
communicati
ons
No Possibly Possibly – high
sites.
No
Additional Notes Note: not
much
industry in
Wellington
City.
CLIMATE
CHANGE
EFFECTS
CATEGORY
RISK ON URBAN ELEMENTS (ADDITIONAL)
Electricity Buses
(electric)
Flooding
(including river
and surface
flooding)
If underground Yes
Landslips
(including soil
erosion and
instability)
Yes – in some areas No
Rainfall
(including high
intensity falls,
changes to average
rainfall,
groundwater and
soil moisture)
If underground No
Coastal Flooding
(including sea
level rise and
storm surge)
No No
Coastal Erosion
No No
High winds
Yes Yes
Extreme
Temperatures
(including air and
ground
temperature)
Possibly No
Fog and
Humidity
No No
Drought
Possibly – rain needed
to keep lines clean.
No
Wildfire
Possibly – some areas. No
Lightning
Possibly Possibly
WELLINGTON WORKSHOP CONTINUED – 20/03/09

SENSITIVITY MATRIX: CLIMATE CHANGE EFFECTS ON URBAN ELEMENTS
AUCKLAND WORKSHOP – 24/03/09
CLIMATE
CHANGE
EFFECTS
CATEGORY
RISK ON URBAN ELEMENTS
Transport Utilities Buildings Other
Road Rail Ports Airport Sewerage
System
Treatment
Plant
Stormwater
System
Landfills Water Supply
(Bulk)
Residential Community Industrial Commercial Tele-
communications
Minor Roads Major - State
Highways,
Motorways,
Major Arterials
Schools Essential
Services (eg,
hospitals)
Flooding
(including
river and
surface
flooding)
Yes.
Vulnerable to
local drainage
inadequacies.
Parts of SH1, 16,
20 under water at
times of surface
flooding. (SH1
already affected at
1% flood)
Britomart Station
potentially
affected by less
than 10 year
event. Onehunga
line on reclaimed
land and subject
to surface
flooding.
Yes Yes Yes Increased
inflow and
infiltration
(ie, I&I), so
potentially. Possible
Mangere
overflow (untreated?).
Yes. May cause
erosion of pipes
and other system
components.
Several closed
landfills
(Oakley,
Motions,
Meola) next to
streams New
ones are more
secure.
Pipe bridges
vulnerable.
Dam safety.
Quality could
be reduced,
but possible to
cope.
Yes. But info
hard to get.
Probably a small
percentage in
whole region, but
a lot of people.
Accesses also
vulnerable.
As for
residential.
Some risk.
Potential Yes. Some
areas, eg,
Wairau
Valley,
Onehunga.
Typical
problem.
Yes. Some
areas, eg,
Wairau Valley,
Onehunga.
Typical
problem.
Yes. Road cabinets.
Landslips
(including soil
erosion and
instability)
Yes. Local
roads in many
places.
Not for motorway,
but yes for some
arterials.
No No No Yes No Yes – can affect
structures (and
vice versa).
One closed
(Newmarket)
could be
exacerbated
As with
stormwater for
pipe systems.
Potential for
total failure of
eg, Hunua,
Waitakere
dams.
Some. As above. Yes – some
potential.
Yes – some
potential.
Potential for
some to be at
risk.
Potential for
some to be at
risk.
? ?
Rainfall
(including high
intensity falls,
surface
flooding,
changes to
average
rainfall,
groundwater
and soil
moisture)
All minor
roads
vulnerable.
? Britomart
Station. Water
can’t get out.
Yes Yes Yes. More I&I
leakage,
pipeline
collapse, some
small pumps at
risk. Potential
public health
issues.
Yes.
Increased
flow so more
overflows.
Overland flow
paths add to
resilience, but
some areas
already at risk.
Infiltration
issues, leachate.
Droughts,
average
changes a
problem.
Spillway
performance –
100 year flood
passage.
Surface flooding
a patchy issue.
Some but
less than
residential.
Some
potential but
less than
residential.
Greater
awareness
Same as for
flooding.
Possibly
worse for
some
pockets in
flood prone
areas.
Same as for
flooding.
Possibly worse
for some
pockets in
flood prone
areas.
Yes, for above
ground services.
Coastal
Flooding
(including sea
level rise and
salt water
intrusion
effects, storm
surge)
Yes, plus salt
water intrusion
effects on
surfaces.
Parts of SH1, 16,
20, plus Tamaki
Drive.
No. Britomart
below sea level,
but safe.
Onehunga
Wharf
potentially
subject to
100 year
event.
Yes Yes. Sea level
intrusion –
pipeline delay
plus odour.
Pipe bridges
more at risk.
Hobson Tunnel
may have
odour
problems.
Possible
pipeline
corrosion (but
short
underground
system).
Potentially May cause
erosion of
systems.
Yes. Some
closed landfills
at coastal fringe
(Meola,
Motions).
No Some areas at
1/100 surge.
Yes – some Yes - some Yes – some Yes - some Sea water intrusion
Coastal
Erosion
Minor but
some potential
cliff issues.
Potential SH16.
Armoured but a
bad storm event
could affect it.
No, except
possibly
Onehunga
Wharf.
No, except
possibly
Onehunga
Wharf.
Possibly Yes No (Mangere
balancing
tank).
Yes – coastal
and stream
outfalls.
Yes. Some
closed landfills
at coastal fringe
(Meola,
Motions).
No – but
system does
cross bridges.
Some areas Yes – some Yes - some Yes – some Yes - some ?

High winds
Yes. Exposed. SH1 Harbour
Bridge lanes close
at 80km/hr. Expect
more closures.
Only electrified
services
vulnerable.
Yes Yes No No Causes storm
surge. Effects as
above.
Blown rubbish
at transfer
stations.
No Standard of
construction -
risk increased
with high winds.
Adequate
design
standard
? More so than
other
categories
because of
building
size.
? Yes
Extreme
Temps
(including air
and ground
temperature)
Yes. Expect
more
maintenance
needed.
Yes. Expect more
maintenance
needed.
Yes. Potential
buckling.
No No No System
works better
at slightly
warmer
levels
(standard 16-
18o)
Water quality
effects. Higher
temperatures,
less movement
can exacerbate
poor quality. A
treatment issue.
Could crack
capping and
lead to
infiltration.
Algal blooms.
Increased
demands.
Increased energy
demand. Some
materials may
not be robust
with increased
occurrence of
high
temperatures.
As for
residential
As for
residential
Potential Potential Yes. Cooling
needed for cabinets.
Fog and
Humidity
Potential minor
effects (affects
drivers).
Potential minor
effects (affects
drivers).
? ? No, because
of adequate
technology
No No No No No No No No ? ? Corrosion
susceptibility
Drought
No No No No No Probably not.
But clay
shrinkage could
break lines in
some areas.
No
(domestic
water supply
would be last
to go).
No Longer
droughts could
lead to more
infiltration.
Yes.
Vulnerable to
1/200 year
drought.
Soils, gardens. No No ? ? No
Wildfire
No No ? No No No No No No Hunua dams
Waitakeres?
Waitakeres No No ? ? ?
Lightning
No No ? No No, because
of protection
and warning
systems
No No No No No ? No No ? ? Yes, re overhead
system.
Additional
Notes
Current pumps
designed for
15-20 years.
Pipes for 80
years plus.
Some areas
already have
inadequate
soakage for
current rainfall.
Subject to
specific on-site
Council
requirements.
Note:
Onehunga has
a local aquifer
supply
(possibility of
salt water
intrusion).
The islands
have their own
tank supply.
AUCKLAND WORKSHOP CONTINUED – 24/03/09

AUCKLAND WORKSHOP CONTINUED – 24/03/09
CLIMATE
CHANGE EFFECTS
CATEGORY
RISK ON URBAN ELEMENTS (ADDITIONAL)
Gas Supply Fuel Pipelines Water Supply
Reticulation
Electricity
supply
Flooding
(including river and
surface flooding)
Potential ? Pipe bridges - erosion Yes. Some
potential. Lines
and substations
Landslips
(including soil erosion
and instability)
Potential Yes (not in Auckland
city)
Some areas already
susceptible
Possibly. Some
poles/pylons.
Rainfall
(including high
intensity falls, changes
to average rainfall,
groundwater and soil
moisture)
Potential ? No Yes, for above
ground services.
Coastal Flooding
(including sea level
rise and storm surge)
Potential ? No Especially in
CBD
Coastal Erosion
Potential No No No
High winds
No ? No Yes
Extreme
Temperatures
(including air and
ground temperature)
? ? Demand increase adds
risk
Yes. Affect
systems.
Fog and Humidity
No ? No No
Drought
No ? Shrinkage of soils may
lead to problems.
No
Wildfire
No ? No ?
Lightning
No ? No Yes, re overhead
system.
Additional Notes Underground
supply.
Vulnerabilities
similar to water
supply reticulation
Risk issues around
current supply related
to limits getting into
port at present.
Expect greater
diversity of sources
in future. Loss of
power to pumps is a
risk.
Note: external
effects on hydro
lakes. Waikato
river temperature
re Huntly
discharge.
SENSITIVITY MATRIX: CLIMATE CHANGE EFFECTS ON URBAN ELEMENTS
WESTPORT WORKSHOP – 2/04/09
CLIMATE
CHANGE
EFFECTS
CATEGORY
RISK ON URBAN ELEMENTS
Transport Utilities Buildings Other
Road Rail Ports Airport Sewerage
System
Treatment
Plant
Stormwater
System
Landfills Water Supply Residential Community Industrial Commercial Power
supply
Tele-
communications Minor Local
Roads
Major - State
Highways
Reticulated Bulk Support
Services
Emergency
Services
Flooding
(river flooding)
Yes – some
areas
(isolated).
50 year event
on Buller will
close SH
connection, but
not SH6 to
Greymouth.
Yes During a flood,
boats can’t get
in. However,
floods clear the
bar, so are also
beneficial.
No historic
record of
flooding of
airport or
access road.
Flooding
potential
No Yes No No No Yes Potentially
in future
Potentially in
future
Potentially in
future
Potentially in
future
Slight risk to
pylons
Underground lines
Landslips
(including soil
erosion and
instability)
Not in
Westport
Yes (arterial
routes but not
SHs)
Yes No No No No No No Trunk main
cross
significant
hillside
Yes because
of river
supply
(quality,
intake
treatment and
potential loss
of supply)
No No No No No Possibly
regarding
main supply
Remote lines (not in
Westport)
Rainfall
(including high
intensity falls,
surface
flooding,
changes to
average
rainfall,
groundwater
and soil
moisture)
Yes.
Adequacy of
stormwater
system (eg,
event of
17/03/07).
Flooding only
(safety of
roads) – minor
impact.
No –
except
where
flooding
and/or
washouts.
No (but see
drought below)
Yes – high
intensity
surface
flooding
Yes No – but
may have to
treat more
wastewater
(infiltration
and inflow)
Yes Yes No No Yes Yes -
potentially
Yes -
potentially
Yes -
potentially
Yes -
potentially
Substation
possible
flooding
(river or
heavy
rainfall)
Yes, if surface
flooding
Coastal
Flooding
(including sea
level rise and
storm surge)
No Yes – coastal
road north
No Same as
flooding
Only if a lot of
change
No No No No No No Some
potentially
No
buildings
likely to be
affected
No buildings
likely to be
affected
No buildings
likely to be
affected
No buildings
likely to be
affected
No No
Coastal
Erosion
No – except
Carters Beach.
No houses
affected.
Yes – coast
road north.
Minor effect.
No No Yes No No No No No No No – but long-
term potential
issue
No No No No No No
High winds
Yes (trees and
debris)
Yes (trees and
debris)
Trees on
line
Yes Yes No No No Blowing
rubbish
No No Yes – but not
high risk
? ? ? ? Yes Possibly
Extreme
Temps
(including air
and ground
temperature)
Minimal Minimal Yes –
potential to
buckle.
No Possibility of
icing, or
tarmac heating
at extremes
No No No No Possibly
high demand
but not
thought to
be an issue.
High demand
periods plus
evaporation
rates
No ? ? ? ? Snow/ice
accretion
possible
effects (but
not really
known)
No
Fog and
Humidity
No No No Navigational
safety
Yes No No No No No No No No Air ambulance No No No No
Drought
No No No Yes. Bar shoals
and boats can’t
get in. Port can
be closed at
periods of low
rainfall.
No No No No No Yes Fire fighting
demand?
No No ? ? ? No No

Wildfire
No Very low No No Minimal No No No Yes No Plant small
risk – quality
issue
No No No No No Possibly for
remote mains
Possibly for remote
mains
Lightning
No Very low No No No (unless
power out –
would affect
communicatio
n)
No. Pump
station risk if
electricity
supply
affected.
No No No No Plant small
risk – quality
issue
No No If power
supply
affected.
No No Possibly for
remote mains
Possibly for remote
mains
Additional
Notes
River flooding is main issue.
Landslips contribute to bed load.
More floods equal more sediment
movement. This could affect the
bar and bed level of river.
Sea level rise would have a big
effect on sediment transport to
sea and subsequent flooding
potential which could exacerbate
other effects.
Note: small community, so
buildings tend to be mixed in
with other buildings.
Undulating topography
means complex potential
effects.
WESTPORT WORKSHOP CONTINUED – 2/04/09