tonbridge town centre masterplan technical note on trip ... · 6 future factors affecting trip...
TRANSCRIPT

Tonbridge Town Centre Masterplan Technical Note on Trip Generation, Distribution and Assignment
August 2007


Contents
1 Introduction 1-1
1.1 Background 1-1
2 Trip Generation 2-3
2.1 Background Growth 2-3
2.2 Deriving Trip Rates for New Developments 2-4
2.3 Residential Land Uses 2-4
2.4 Town Centre Retail 2-5
2.5 Restaurants 2-6
2.6 Leisure 2-6
2.7 Employment 2-6
2.8 Education - College 2-7
2.9 Community 2-7
2.10 Car Show Room (Sui Generis) 2-8
2.11 Summary 2-8
3 Trip Distribution 3-10
3.1 Introduction 3-10
3.2 Primary Trips 3-10
3.3 Non-Primary Trips 3-11
4 Trip Assignment 4-12
4.1 Gravity Model – Basic Introduction 4-12
4.2 The Retail Gravity Model 4-12
4.3 The Employment Gravity Model 4-13
4.4 The Residential Gravity Model 4-13
4.5 Assignment of Trips to the Network 4-14
4.6 Car Parks 4-14
5 Reassignment as a result of possible New Highway Links 5-16
5.1 Introduction 5-16

5.2 Lansdowne Road Link 5-16
5.3 Medway Wharf Road traffic management options 5-16
5.4 Hadlow Road to London Road Link 5-17
5.5 Hadlow Road to London Road Link and closure of Hadlow Road (South) 5-17
6 Future Factors Affecting Trip Generation 6-19
6.1 Future Development of Travel Plans at Existing Schools and Colleges 6-19
6.2 Development Travel Plans 6-21
6.3 ‘Smarter choices’ initiatives to affect existing travel patterns 6-21
List of Figures
Figure 1-1: Proposed Developments within the Tonbridge Town Centre Area 1-2
List of Tables
Table 2-A: Tonbridge & Malling Tempro adjusted NRTF factors (2006 to
various years) 2-3 Table 2-B: TRICS Modal Split Results and Vehicle Occupancies – Daily
Averages 2-8 Table 2-C: TRICS Modal Split Results and Vehicle Occupancies – AM peak
(0800-0900) Averages 2-9 Table 2-D: TRICS Modal Split Results and Vehicle Occupancies – PM peak
(1700-1800) Averages 2-9 Table 4-A: Summary statistics from the 2005 National Travel Survey 4-12 Table 6-A: The influence of Travel Plans on the modes used to access
educational facilities within Tonbridge 6-20 Table 6-B: Guidance on Travel Plan Measures and Probable Trip Reduction 6-21
List of Appendices
Appendix A - Summary of Development Trip Rates

1 Introduction
1.1 Background
Jacobs have been commissioned by the West Kent Division of Kent Highway Services (WKDO) and Tonbridge & Malling Borough Council (TMBC) to create a development control tool that will enable the impact of a range of future development scenarios on the highway infrastructure in the town centre to be tested. The profile of developments that is likely to be progressed between 2006 and 2021 has been agreed with Tonbridge and Malling Borough Council. The vast majority of these developments are found in the town centre and these sites are illustrated in Figure 1-1. Two models have been created for the key time periods. These are: • •
• •
• • •
Monday to Friday AM peak: 0800-0900. Monday to Friday PM peak: 1700-1800.
This Note summarises the methodology used to incorporate these developments in the model. This has involved:
Calculation of the Vehicle Trip Rate – See Chapter 2 Determining the proportion of trips that are new to the model network, and those that would be on the road network regardless of whether the development went ahead. For more details see Chapter 3. Manual Assignment of the trips to the model network – See Chapter 4. How new highway links have been modelled – See Chapter 5. How account has been taken of measures to reduce existing traffic flows, such as School Travel Plans and Softer Measures/ Smarter Choices – See Chapter 6.
3 Development assumptions.doc/Aug-07 1-1

�
KeyDevelopment
Avebury Avenue
Avenue De Puy
Botany
Former Colas Site
Gas Works
Iceland Waitrose
Lyons Crescent
Medway Wharf
Quarry Hill
River Walk
Sovereign Way
Station
Strawberry Vale
Priory Road/Goldsmith Road Junction EastPriory Road/Goldsmith Road Junction West
Tonbridge Library and Adjacent Area
Cannon Lane
Proposed Developments within the Tonbridge Town Centre Area Figure 1-1
Riverdale Estate

2 Trip Generation
2.1 Background Growth
TEMPRO 5 adjusted National Road Traffic Forecasts (NRTF) growth factors have been used to establish background growth rates in traffic. Care has been taken to avoid any significant double counting of traffic resulting from applying Tempro and calculating trip rates for new developments. The Government’s Guidance Note1 on TEMPRO has been used as a source of good practice. The following equation has been used to derive adjusted NRTF growth factors:
AM peak example: NRTF growth factor for road type x (TEMPRO AM peak hour car driver trip end growth for Tonbridge & Malling/ TEMPRO average day car driver trip end growth for Great Britain)
The Tonbridge & Malling district wide factor was used for background traffic growth as it was the lowest and would thus help to minimise double counting. The factor for the Tonbridge urban area is marginally higher as it includes all the development growth as well. However it was found that the resultant growth factors in conjunction with flows associated with new developments would result in substantial increases in traffic that appear unrealistic in view of the existing congestion on the local highway network. In order to calculate a more realistic lower background growth rate the percentage increase from TEMPRO was therefore divided by 4. The resulting percentage increase when added to development traffic was then very similar to the unrestrained TEMPRO growth factor.
The low and high factors calculated for 2006 to the key intermediate years of 2011, 2013, 2016 and 2021 are shown in Table 2-A.
Table 2-A: Tonbridge & Malling Tempro adjusted NRTF factors (2006 to various years)
Urban Trunk/ Primary Urban Other Road Date Range and Time Low Growth High Growth Low Growth High Growth
2006 – 2011 AM 1.009 1.034 1.020 1.079 2006 – 2011 PM 1.010 1.039 1.021 1.085 2006 – 2013 AM 1.012 1.046 1.027 1.109 2006 – 2013 PM 1.013 1.053 1.029 1.117 2006 – 2016 AM 1.016 1.064 1.039 1.154 2006 – 2016 PM 1.018 1.073 1.041 1.164 2006 – 2021 AM 1.024 1.096 1.058 1.230 2006 – 2021 PM 1.027 1.109 1.061 1.245
For this model the low growth factors have been used. The urban trunk road/ primary factor has only been used for traffic on the A26 primary route denoted by green traffic signs.
1 Department for Transport (April 2003): Tempro Guidance Note.
3 Development assumptions.doc/Aug-07 2-3

2.2 Deriving Trip Rates for New Developments
Generally, TRICS® 2006b (Trip Rate Information Computer System) has been interrogated to derive representative trip rates for new developments planned in Tonbridge over the next 15 years. The database generally gives a trip rate for arrivals and departures for commonly used units such as gross floor area in m2, plot size in hectares and number of households. For each development, the database has been used to find closely matched sites, which have been used to calculate an average trip rate. As only a small number of sites have been utilised, and following accepted practice, the 85th percentile approach (which is sometimes used in traffic impact assessments) has not been used. Vehicle trip rates have been calculated as an initial stage. Multimodal data has then been used to assess the likely modal split at the developments used in TRICS®. This is useful since it allows realistic travel plan targets to be set to the developments in the model. TRICS® produces a ‘pie’ chart for site selections illustrating the average modal split over the course of the day. This information has been used to provide summary tables of the modal splits likely at the sites, given their town centre location and access to good public transport. In many cases, the cycling and public transport modal share have been found to be very low, and there is scope to improve accessibility by these modes. It is important to recognise that vehicle trips include those where the trip is made either as a car passenger or as the driver of the vehicle, except where the driver is merely picking up or dropping someone off at the site. The extent of car sharing will therefore not be picked up in the TRICS® data since the summary charts aggregates drivers and passengers. As a result, the database has been interrogated further and average car occupancy calculated by dividing the number of vehicle occupants by the number of the vehicles during the AM and PM peaks, as well as over the course of the day. As the multi-modal element of TRICS® is not as developed as the traditional vehicle trip element, it has not always been possible to use multi-modal data for every site in the model. 2.3 Residential Land Uses
2.3.1 Flats (≤ 50 Households)
A similar site accommodating 30 households is located within the North Yorkshire county town of Northallerton (NY-03-C-01). Despite being located in a Suburban Area (Out of Centre) the site is applicable to this study as the flats are privately owned and lie adjacent to Northallerton Railway Station and the A167 Boroughbridge Road, which leads directly into the nearby town centre. 2.3.2 Flats (≥ 100 Households)
These sites fall within the town centre, or edge of town centre areas of Tonbridge. Three corresponding sites have been found on the TRICS® database in Liverpool (MS-03-C-01; 114 households), Leeds (WY-03-C-01; 127 households) and Kingston-Upon-Thames (GL-03-C-03; 132 households). The first two sites fall into the edge of town centre category with the latter being classed as a town centre site. All of the flats are privately owned. 3 Development assumptions.doc/Aug-07 2-4

2.3.3 Mixed Private Housing (50-200 households)
Seventeen days of data were chosen from the following mixed private housing locations: • • • • • • • • • • • • •
• • • • • • • •
Cambridge (CA-03-K-01); Gloucester (GS-03-K-01); Welwyn Garden City (HF-03-K-01); Lincoln (LN-03-K-01); Norwich (NF-03-K-01); Mansfield (NT-03-K-03); Gedling, Nottingham (NT-03-K-04); Ashfield, Nottingham (NT-03-K-05); Ipswich (SF-03-K-01); Bridgnorth (SH-03-K-01); Stratford Upon Avon (WK-03-K-01); Worcester (WO-03-K-03); and Chichester (WS-03-K-03).
For the multi-modal calculations a smaller subset was chosen with sites in central locations from Welwyn Garden City (HF-03-K-01) and Norwich (NF-03-K-01).
2.4 Town Centre Retail
2.4.1 Sainsbury’s Supermarket & Beales Department Store
The existing c.5000m2 supermarket is to be replaced with a larger facility elsewhere on the site. The size of the replacement superstore has yet to be confirmed, but, for the purposes of this study the facility is assumed to be c.8500m2. A range of supermarket sites, located in town centre and edge of town centre locations, have been taken from the TRICS® database. These are as follows:
Morrisons, Bishop Auckland (DH-01-A-01); Morrisons, Bolton (GM-01-A-20); Sainsburys, Fareham (HC-01-A-02); Sainsburys, Norwich (NF-01-A-03); Asda, Stafford (ST-01-A-01); Sainsburys, Nuneaton (WK-01-A-01); Tescos, Wrexham (WR-01-A-02);and Safeway, High Wycombe (BU-01-A-01).
Analysis of two ranges of Gross Floor Area (GFA), 4000m2 to 8000m2 and 6000m2 to 10,000m2, revealed similar trip rates. An average trip rate, taken from sites between 4000m2 and 10,000m2, has been applied to the existing and proposed supermarket sites. The outcome of Beales department store is yet to be determined. For the purposes of this study, a like for like replacement (c.3500m2) will be redeveloped alongside the replacement Sainsbury’s. TRICS does not include specific data for department stores and therefore trip rates identified in Section 2.4.2 have been applied.
3 Development assumptions.doc/Aug-07 2-5

2.4.2 Retail Mix Malls 4,000 – 18,000 m2
Developments of this size are proposed at the Avebury Avenue; Botany; Station; Quarry Hill and the Iceland/ Waitrose sites. The following relevant examples have been found in the TRICS® database: • • • •
Eastbourne (ES-01-M-02); Hampshire (HC-01-M-01); Dublin (IR-01-M-01); Belfast (NI-01-M-01)
These developments are from either town centre or edge of town centre locations.
2.5 Restaurants
The restaurant used in this instance is located on the edge of Aberdeen City Centre (AD-06-C-01). Unfortunately there are no sites closer to Tonbridge in a geographical context; however, its edge of town centre classification means it is representative of the proposed restaurants in the study area. It has a gross floor area of 315 m2 and seats 140 people. 2.6 Leisure
Gloucester Leisure Centre (GS-07-C-01) is situated to the east of the town centre within a mixed development area. Several museums and shopping areas are present nearby. The Leisure Centre has a gross floor area of 5,886 m2 and provides a diverse range of facilities including a sports hall, indoor bowls rinks, squash courts, a gymnastics hall and a martial arts area. 2.7 Employment
2.7.1 Offices (11,616 m2) – Former Colas Site
Two similar sites have been found in Peterborough (CA-02-A-02) and Blackburn (LC-02-A-06). The Peterborough offices are situated on the edge of the town centre, whilst the Blackburn offices are situated in the town centre. Their location and size (12,500 m2 and 11,225 m2 respectively) make them the most suitable sites within TRICS® for the development proposed.
2.7.2 Offices (2,500 – 4,000 m2)
Three sites have been found in Middlesborough (TV-02-A-01; 4,100 m2), Oxford (OX-02-A-01; 2,633 m2) and Wrexham (WR-02-A-01, 2,500 m2). Both the Middlesborough and Oxford sites are situated in edge of town centre locations, whereas the Wrexham office is classified as being in a town centre location.
2.7.3 Industrial Estate (500 – 7,500 m2)
Future development in the vicinity of Cannon Lane and to the west of Woodgate Way, will include this form of land use. Both of these areas are situated on the outskirts of Tonbridge and the following examples have been downloaded from TRICS®: 3 Development assumptions.doc/Aug-07 2-6

• • • • • • • • • •
• • • •
Ferndown (DC-02-D-19); Dumfries (DG-02-D-01); Barrhead (ER-02-D-01); Giffnock (ER-02-D-02); Hastings (ES-02-D-04); Hull (KH-02-D-02); Grantham (LN-02-D-01); Birmingham (WM-02-D-01); Pulborough (WS-02-D-04); and Burgess Hill (WS-02-D-05).
In total, eighteen day’s worth of data is represented by these examples, which are from edge of town, suburban, free standing and neighbourhood centre locations. 2.7.4 Warehousing (3,000, 11,000 m2)
Warehousing 7,574 m2 in size is proposed at the Wallace and Tiernan site, west of Woodgate Way. Four similar edge of town sites have been found in the TRICS® database:
Dunstable (BD-02-F-01); Kent (KC-02-F-01); Thetford (SF-02-F-01) Worcester (WO-02-F-02)
2.8 Education - College
The college/university sub land use in TRICS® has been interrogated to provide details of the likely trip generation for the sites identified for education provision. Data has been calculated for a small and a large college, which have similar accessibility characteristics to those found on the edge of Tonbridge Town Centre. The smaller Epsom Art and Design College (SC-04-C-01), covers 7,135 m2 and is located a short distance to the south of Epsom Town Centre, in a largely residential area. Wandsworth College (WH-04-C-01) is much larger (19,600 m2) and is located in Wandsworth High Street. The area to the west of the site contains Wandsworth Shopping Centre and other superstores, which makes it comparable to Tonbridge Town Centre.
2.9 Community
Existing and proposed community land uses within Tonbridge include a library, young persons' community centre and an elderly person drop in centre. The TRICS® database provides limited data on such land uses. Libraries in St Austell (CW-16-A-01) and Edinburgh (EB-16-A-02) provide examples closest in size to Tonbridge library with a town centre location. Mudeford Community Centre in Christchurch (DC-16-A-10) and Ladywell family Community Centre (GM-16-A-02) in Manchester are the only two examples, of community centre, included on the TRICS® database. The two sites vary in size, activities and parking provision and neither accurately reflects sites within Tonbridge. An average trip rate has been taken from the two sites to provide a generic rate for Tonbridge Community Centre sites. 3 Development assumptions.doc/Aug-07 2-7

2.10 Car Show Room (Sui Generis)
A 1,038m2 car showroom, classified Sui Generis in the LDF, is to be replaced. Trip rate data has been taken from the following similar sized facilities: • • • • •
Vauxhall, Cambridge (CA-14-A-01); Motorworld, Rochdale (GM-14-A-01); Car Showroom, Leicester (LE-14-A-03); Dagenham Motors, L.Ditton (SC-14-A-01); and Ford, Wrexham (WR-14-A-01)
These sites are representative of edge of town centre and neighbourhood/local centre locations. 2.11 Summary
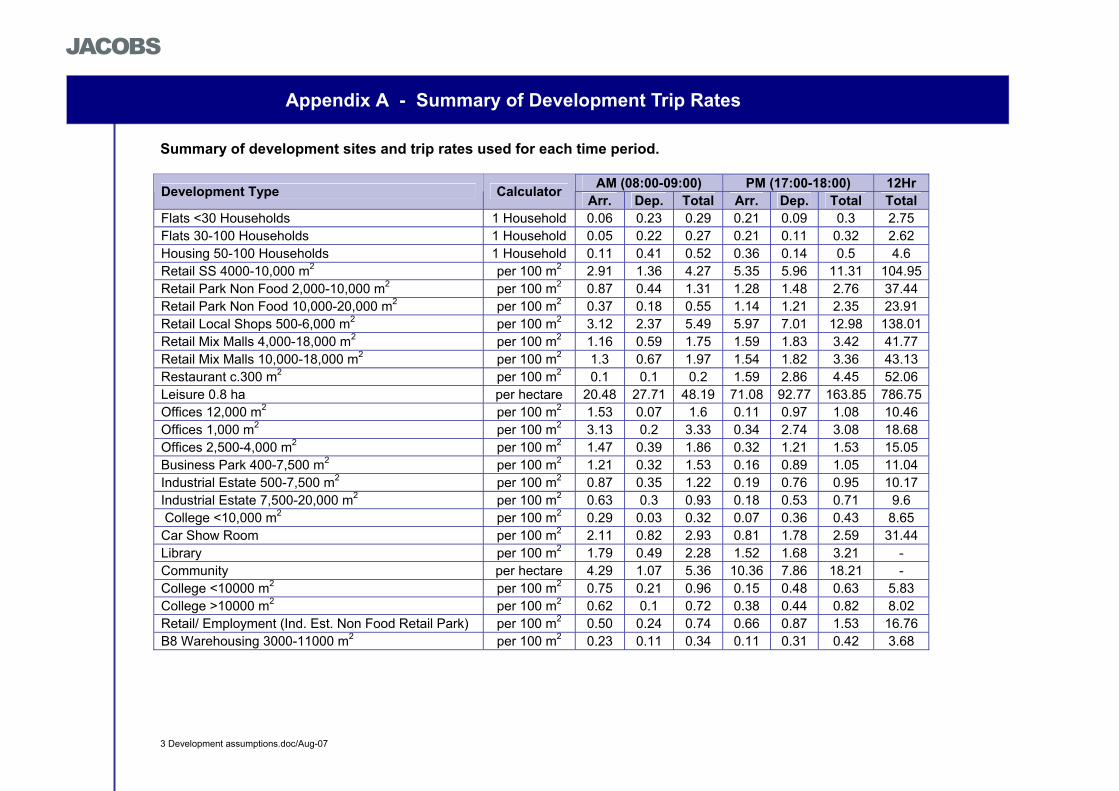
Appendix A contains two tables. The first provides a summary of all the development sites and the trip rates used for each time period. The second presents the net vehicle trips (excluding pass-by, diverted and linked trips that are not new to the Town centre network) calculated for each of the development sites.
Tables 2-B, C and D shows the average daily modal splits for all the land uses where relevant multi-modal data is available in TRICS. The average daily car occupancy has also been calculated and this is shown in the summary table too. This information will be useful when formal planning applications are received; the modal splits suggested in the Transport Assessment can be compared with these three tables, and appropriate changes to the vehicle trip rate can then be made to the development using the “front page” of the spreadsheet model.
Table 2-B: TRICS Modal Split Results and Vehicle Occupancies – Daily Averages
Modal Split Land Use Private
Vehicle Public
Transport Pedestrians Cycles
Private Vehicle
Occupancy Mixed Shopping
Mall 75% 4% 20% 1% 1.26 Retail
Superstore 69% 2% 28% 1% 1.54 Restaurant 58% 4% 37% 1% 1.63
1,000 m2 39% 22% 39% 0% 1.00 Offices
11,000 m2 48% 8% 44% 0% 1.09 Business Park 85% 2% 12% 1% 1.37
500-7,500 m2 93% 1% 5% 1% 1.11 Industrial Estate 7,500-20,000 m2 98% 0% 1% 1% 1.24 Leisure Sports Centre 62% 9% 24% 5% 1.57
Mixed Private 55% 2% 40% 3% 1.26 Private Flats (30) 63% 2% 32% 3% 1.18 Housing
Private Flats (100) 59% 9% 31% 1% 1.22 Small 33% 16% 50% 1% 1.20
College Large 14% 49% 35% 2% 1.07
3 Development assumptions.doc/Aug-07 2-8

Table 2-C: TRICS Modal Split Results and Vehicle Occupancies – AM peak (0800-0900) Averages
Modal Split Land Use Private
Vehicle Public
Transport Pedestrians Cycles
Private Vehicle
Occupancy Mixed Shopping
Mall 64% 4% 30% 2% 1.14 Retail
Superstore 48% 5% 42% 5% 1.23 Restaurant - - - - -
1,000 m2 39% 53% 8% 0% 1.08 Offices
11,000 m2 80% 8% 12% 0% 1.01 Business Park 84% 3% 10% 3% 1.29
500-7,500 m2 92% 2% 5% 1% 1.11 Industrial Estate 7,500-20,000 m2 97% 1% 1% 1% 1.22 Leisure Sports Centre 70% 3% 17% 10% 1.10
Mixed Private 58% 8% 30% 4% 1.28 Private Flats (30) 26% 11% 53% 10% 1.00 Housing Private Flats (100) 58% 12% 28% 2% 1.18
Small 54% 23% 18% 5% 1.05 College
Large 36% 56% 6% 2% 1.08
Table 2-D: TRICS Modal Split Results and Vehicle Occupancies – PM peak (1700-1800) Averages
Modal Split Land Use Private
Vehicle Public
Transport Pedestrians Cycles
Private Vehicle
Occupancy Mixed Shopping
Mall 76% 3% 21% 0% 1.23 Retail
Superstore 70% 2% 27% 1% 1.59 Restaurant 52% 16% 32% 0% 1.64
1,000 m2 31% 38% 31% 0% 0.63 Offices
11,000 m2 79% 7% 13% 1% 1.03 Business Park 85% 6% 7% 2% 1.35
500-7,500 m2 91% 2% 6% 1% 1.16 Industrial Estate 7,500-20,000 m2 96% 0% 2% 2% 1.24 Leisure Sports Centre 70% 4% 23% 3% 1.93
Mixed Private 71% 0% 25% 4% 1.21 Private Flats (30) 53% 0% 47% 0% 1.15 Housing
Private Flats (100) 57% 4% 37% 2% 1.34 Small 36% 14% 49% 1% 1.14
College Large 19% 64% 15% 2% 1.08
3 Development assumptions.doc/Aug-07 2-9

3 Trip Distribution
3.1 Introduction
The Tonbridge Model assesses the impact of future planned residential, employment, retail and leisure development within the town centre area. The TRICS® 2006(b) trip rate data base provides appropriate examples of individual sites and average trip generation for the proposed classification of development. The TRICS® data is taken from individual sites and does not take full account of the interactive travel behaviour of grouping similar land uses within close proximity such as in town centre development. Travel demand to retail and leisure developments can therefore be separated into Primary and Secondary trips. MacIver (1999)2 provides a suitable methodology on which to assess the following: • • • •
Primary Trips – i.e. those new to the network under study. Non-Primary Trips: Diverted Trips. Pass-by Trips.
For the purposes of this study, trip generation for proposed employment and residential developments has been assumed to be 100% primary. This section outlines the methodology used to determine travel demand for future development and the distribution of trips on the local highway network.
3.2 Primary Trips
The primary trip generation of all developments has been derived from the TRICS 2006(b) database from sample sites that best reflect the planned Tonbridge development (see Chapter 2). The planned Tonbridge development will potentially introduce 2,200 new jobs to the town centre area, based on 1 job/20m2 of new A1 & B1 space and 1job/50m2 of new A2, A3, B2 and B8. The population will potentially increase by approximately 6500 should all planned residential developments proceed, based on 2.5 occupants per house and 1.3 occupants per flat. It must be noted that these population and employment projections assume that all allocated sites are developed to the capacities detailed in Annex A of Tonbridge Central Area Action Plan 2006 (TCAAP). The level of unemployment, surveyed in the 2001 Census, for the Tonbridge and Malling Borough is relatively low at 2.7%. Furthermore, Tonbridge is located at the junction of the Ashford and Hastings to Charing Cross railway lines and is considered a desirable location for commuters to London and other employment centres within the south east. The model assumes that, while some new residents will meet a proportion of the increasing job market, the majority of residents will travel out of Tonbridge to other
2 MacIver, A (1999): “Transportation Impact Assessment: Forecasting travel demand” in Traffic Engineering and Control, May 1999.
3 Development assumptions.doc/Aug-07 3-10

employment centres. The remaining jobs will be filled by employees travelling into Tonbridge from the surrounding area.
This methodology assumes a worse case scenario to assess the traffic impact of residential and employment development. It is possible that a number of these trips already exist on the highway network. Furthermore, the provision of jobs near to housing developments may initiate a reduction in vehicle trips through the promotion of more sustainable travel. The model includes a Travel Plan factor that can reduce the default trip generation for each development at user discretion to avoid double counting or acknowledge improved sustainable travel behaviour.
3.3 Non-Primary Trips
Trip generation for retail, leisure and community land uses will include an element of primary trips. However a discount to the data derived from TRICS has been applied to acknowledge non-primary trips. Enhancements to the level of retail and services in Tonbridge Town Centre are likely to divert an element of trips from neighbouring retail centres or other trips that already exist on the local road network. MacIver (1999) identifies that a proportion of trip generation at retail sites can be classed as pass-by and diverted trips, using the following rules: •
•
•
• • • •
For superstores located on major commuting routes in larger urban areas, the pass by proportion may range from 25-35% depending on the levels of traffic flow. For other less significant commuting routes, in out-of-town locations and in urban areas with smaller populations, the pass-by proportion can be assumed to be in the range of 15-25%. For town centres and on non-primary routes the proportion of pass-by will be approximately 10%.
While primarily focused on superstores the definitions and trip proportions are also relevant to other land uses such as leisure and smaller retail units. The precise origin and destination of diverted and pass-by trips could not be determined within the timescales of this study. Furthermore it is likely that trips divert from roads outside of the town centre on the wider highway network and only a limited element would be accounted for within the base line data. For assessment purposes pass-by and diverted trips have been disregarded, which will result in an element of double counting of trips. As stated in the previous section, the model includes a factor for travel plans allowing the user to manually reduce or increase trip rates for different developments and assess the resulting impact.
An additional element unaccounted for by the TRICS® trip derivation are those trips linked to other new and existing developments. It can reasonably be assumed that a significant proportion of visitors to Tonbridge will take advantage of the proximity of other services. The following trip generation discounts have been applied to account for linked trips at each land use:
Retail – 35% reduction; Community – 30% reduction; Restaurant – 30% reduction; and Leisure – 30% reduction.
3 Development assumptions.doc/Aug-07 3-11

4 Trip Assignment
4.1 Gravity Model – Basic Introduction
The basis of a gravity model is that the numbers of movements between zone i and zone j is dependent on: a the characteristics of zone i; b the characteristics of zone j; and f the characteristics of the separation between zones i and j, e.g. distance, time, cost or generalised cost. Therefore the total number of trips (T) between i and j is equal to the number generated by i, the number attracted by j and a function of the attraction between i and j. A commonly used form of the function is: Fij = exp(-λcij), where cij is the generalised cost between i and j The following statistics were found in the most recent UK National Travel Survey – 2005 (DfT, 2006). Table 4-A: Summary statistics from the 2005 National Travel Survey 3
Journey Purpose Average Distance (Km)
Ave retail trip (UK) 6.966 Ave commute (UK) 14.094 Leisure 12.312
4.2 The Retail Gravity Model
This model uses the population of each ward to represent the characteristics of zone i. The population is based on that recorded in the 2001 census plus the expected number of residents from new developments in each ward. The expected number of residents has been calculated by multiplying the number of new households by the average household size for that ward from the 2001 census.
The distance between zones i and j has been measured simply by using straight line distances between the centroids in each ward. Given the results from the national travel survey, and the existence of competing retail centres, such as Tunbridge Wells, Sevenoaks and Maidstone, the models have focussed on wards within 7km of the development (i.e. South Tonbridge & Malling Borough and Southborough).
The gravity model used the following equation:
Proportion of development trips to/from ward = Ward population % of total * exp(λcij), where λ =-0.4 and c = distance (km).
The actual number of trips to that development from each ward was then calculated by multiplying the total number of trips by the proportion calculated.
3 http://www.dft.gov.uk/stellent/groups/dft_transstats/documents/page/dft_transstats_612468.hcsp
3 Development assumptions.doc/Aug-07 4-12

Separate models have been created for the wards expected to have retail developments, namely Castle and Medway. 4.3 The Employment Gravity Model
The employment model follows a similar basis to the retail model described. The main differences are as follows: •
•
The detail is focussed on wards within 14km of the development (i.e. South & Central Tonbridge & Malling Borough; Tunbridge Wells/ Paddock Wood; and SE Sevenoaks District). 14km was chosen as a limit to reflect the average commute. However as a sizable proportion of people commute more than 14km, these trips have not been discounted. The 2001 Census travel to work statistics indicated that 45% travel more than 10km by car to work in Medway and 40% more than 10km by car to work in Castle. Given that the catchment used was slightly greater than 10km, it has been assumed that 60% of the vehicle trips to the new employment opportunities will be from the wards described above.
The equation was calibrated to ensure that the proportion of people travelling by car less than 2km; less than 5km and less than 10km was reasonably consistent with the Census statistics. This resulted in different equations for the Medway and Castle wards by varying constants and the exponential function. These are as follows:
Proportion of Medway development trips to/from ward = Ward population % of total * exp(λcij+a), where λ =-0.3, c = distance (km) and a (constant) = +0.15.
Proportion of Castle development trips to/from ward = Ward population % of total * exp(λcij), where λ =-0.25 and c = distance (km).
4.4 The Residential Gravity Model
Data from the 2004 Annual Business Inquiry (from NOMIS) was used to calculate the number of employees in each ward. While there are other important journey purposes in the AM and PM peak (e.g. education), for simplicity it was decided to concentrate the gravity model on employment trips. The basis of this model was that wards with more employment would be more attractive to new residents all other things being equal. Again wards within 14km of Tonbridge town centre were selected. Separate models were created for each of the wards experiencing residential development, namely Medway, Castle, Judd and Cage Green. Data from the 2001 census was again used to calibrate the model. This time travel to work statistics for residents of the four above wards was used. Again it was found that approximately 60% of residents travel less than 10km to work, so 60% of the vehicle trips from these new homes. The gravity model equation was calibrated to ensure that the proportion travelling by car less than 2km; less than 5km and less than 10km was reasonably consistent with the census data. Each ward’s gravity model equation is illustrated below:
3 Development assumptions.doc/Aug-07 4-13

Proportion of Castle development trips to/from ward = Ward population % of total * exp(λcij), where λ =-0.25 and c = distance (km). Proportion of Medway development trips to/from ward = Ward population % of total exp(λcij+a), where λ =-0.35, c = distance (km) and a (constant) = +0.025. Proportion of Judd development trips to/from ward = Ward population % of total * exp(λcij), where λ =-0.24 and c = distance (km). Proportion of Cage Green development trips to/from ward = Ward population % of total * exp(λcij), where λ =-0.26 and c = distance (km).
4.5 Assignment of Trips to the Network
The assignment process has incorporated the following principles: •
•
• •
Each of the wards has been assigned to one or more of the network nodes. The proportion of traffic using each node has been estimated based on standard of the roads and the location of them relative to the centre of the ward. Each node may carry traffic to/from the development to/from more than one ward. The total proportion of development traffic has been calculated. The proportions are then assigned to the road network, reaching 100% at the development.
There are few alternative routes within the Tonbridge highway network for drivers to take between origins and destinations. The following assumptions have been made on specific links regarding new development traffic: A26 Vale Road – Traffic originating from the north east is generally directed to the High Street via Cannon Lane. The model assumes that this traffic will access developments to the north of the High Street using Sovereign Way. Developments to the south of the High Street will be accessed via Vale Road. Tonbridge Station Development – The retail elements of the Station Redevelopment are likely to be located off Railway Approach within the existing station. The residential element will be located on the opposite side of the railway to the south of Vale Road. Traffic relating to the two different elements of development has been assigned to the appropriate links within the model.
4.6 Car Parks
The location of car parking is an important factor relating to the assignment of trips within the town centre. In the absence of a definitive future parking strategy the TCAAP provides an indication of any changes to car park distribution. The majority of developments will provide appropriate levels of parking and therefore a significant level of trips will be to/from these sites rather than freestanding public car parks. Capacity is likely to be removed at the existing Iceland and Waitrose car parks and trips will divert to increased capacity at the Station and 3 Development assumptions.doc/Aug-07 4-14

Botany Quarter. The reassignment of existing trips will have little impact on the modelled network due to the proximity of the two locations. It is likely that shoppers will park in a central location and access a number of retail developments as linked trips. A minor element of parking to the west of the High Street is to be removed at the Bradford Street area. This will be replaced by short stay on street parking in the High Street area that will have little impact on the assignment of trips. Generally there are no significant plans to relocate parking provision within the town that will impact on the assignment of existing trips. On completion of a town centre parking strategy it is recommended that any significant future changes are considered within the application of the model.
3 Development assumptions.doc/Aug-07 4-15

5 Reassignment as a result of possible New Highway Links
5.1 Introduction
The spreadsheet model includes the ability to test the impact of a number of different highway improvement options. The impact of each option has been assessed manually, on the basis of data from the Automatic Number Plate Recognition (ANPR) survey carried out as part of this study. The impact on each turning movement has then been collated into the models’ master sheet and the facility for the user to toggle the option on or off provided. The following improvement options have been built into the model: • • • •
•
Lansdowne Road Link; Medway Wharf Road traffic management; Hadlow Road – London Road Link; Hadlow Road – London Road Link and closure of Hadlow Road (South).
5.2 Lansdowne Road Link
This link road will improve access to The Slade from the High Street and relieve narrow streets around the Castle and the northern end of the High Street of some traffic. In the traffic reassignment it has been assumed that 95% of turning movements to Castle St from the north will now use Lansdowne Road and 95% of left turns from Bank Street will now use Lansdowne Road. In doing this it is assumed that signal phase timings would be altered at the Lansdowne Road, High Street, Bordyke junction to ensure that traffic from Lansdowne Road does not face long delays. 5.3 Medway Wharf Road traffic management options
The two options explored for Medway Wharf Road include allowing left turn one-way entry only from the High Street junction or complete closure of the road between the High Street and Sovereign Way. It is noted that right turns from the High Street into Medway Wharf Road are already prohibited.
A gravity model approach was followed for each option by drawing out a plan of the road network and reassigning traffic as a proportion of the existing turning movements using the Medway Wharf Road/High Street junction. 5.3.1 Medway Wharf – no exit
The following trip reassignment assumptions have been made for the scenario where only left turn one-way entry is permitted from the High Street:
100% of the right turners between Medway Wharf Road and the High Street would reassign to different routes, with 45% using a route encompassing Vale Road and the B2260 High Street to the south. The remaining 55% would divert to the A26 Vale Road/Cannon Lane, with 5% turning north east onto the A26 Hadlow Road and 50% using the A227 Hadlow Road/Bordyke/High Street route.
3 Development assumptions.doc/Aug-07 5-16

•
•
100% of existing left turners into the High Street would reassign to Vale Road, south of Medway Wharf Road. 50% would then head northbound along the B2260 High Street and park in car parks to the west of this. The remaining 50% would turn southbound along the B2260 Railway Approach.
5.3.2 Medway Wharf Road – Complete Closure at the High Street junction
For the scenario involving the complete closure of Medway Wharf Road at its junction with the High Street, the reassignment would be the same as the left turn one-way entry from the High Street scenario plus the following:
100% of the existing left turners into Medway Wharf Road from the High Street would divert to other routes. 55% would use the A227 Bordyke/Cannon Lane as an alternative and 45% would transfer to Vale Road, south of Medway Wharf Road.
The changes in turning proportions at junctions along the impacted routes were then input into the “Improvement” worksheet to calculate the change in vehicle flows. 5.4 Hadlow Road to London Road Link
Land has been safeguarded in the Tonbridge and Malling Borough Council Local Plan for the creation of the London Road/Hadlow Road Link. The link road would run from the A26 Cannon Lane/Hadlow Road junction in the east, to the A227/B245 London Road in the west. Two options are being considered for the layout of these junctions, with Option 1 involving roundabouts and Option 2, traffic signals. To test the impact of the link road, a new worksheet has been created for each of the possible new junctions. The new worksheets contain both Option 1 and Option 2 with junction parameters altered appropriately. The geometries associated with the different options have been measured from plans produced by Ove Arup and Partners in 1996. The ANPR data has been used to assess how flows on the existing routes within the network would change if the Hadlow Road- London Road Link was opened. The trips that would divert have then been reassigned to the new link road in the “Improvements” worksheet. Reassigned flows are linked to the “Master” spreadsheet and are toggled on and off depending on whether the Hadlow Road-London Road link is selected on the “front sheet”.
5.5 Hadlow Road to London Road Link and closure of Hadlow Road
(South)
Initial testing of the Hadlow Road London Road Link showed that there was still a sizeable volume of traffic using Hadlow Road South at the Cannon Lane junction. However little of this traffic then reappeared at the Bordyke, High Street junction. This is because traffic that already uses Hadlow Road (South) and East Street/ Lyons Crescent to access the High Street and/or employment in this area would be very likely to continue to do so if Hadlow Road (South) remained open.
3 Development assumptions.doc/Aug-07 5-17

A further option, with the Hadlow Road – London Road Link provided and access to Hadlow Road (South) at the Cannon Lane junction removed, has been tested. At the East Street junction the following assumptions have been made. •
•
•
•
•
•
•
90% of the remaining turning movements between Hadlow Road (South) and East Street would transfer elsewhere. For instance, 30% of the Hadlow Road (South) to East Street movement would become a Link Road – High Street – Bordyke – East Street movement to access properties on East Street/ Lyons Crescent. 30% of the Hadlow Road (South) to East Street movement would become a Link Road – High Street movement to Bank Street where it is currently assumed to join the High Street. 30% of the Hadlow Road (South) to East Street movement would become a Hadlow Road (north) – Cannon Lane – Sovereign Way movement to access the eastern town centre. At the Sovereign Way, Avenue le Puy junction it has been assumed that half the traffic goes to the Angel Centre and half to car parks off Sovereign Way. 30% of the East Street to Hadlow Road (South) movement would become an East Street – Bordyke – High Street – Link Road movement. 30% of the East Street – Hadlow Road (South) movement would continue on the High Street north of Lyons Crescent and then follow the Link Road. 30% of the East Street – Hadlow Road (South) movement would become a Sovereign Way – Cannon Lane – Hadlow Road (north) movement.
In each case the remaining 10% of traffic travelling between Hadlow Road (South) and East Street is assumed to be local and therefore remains on this part of the network.
3 Development assumptions.doc/Aug-07 5-18

6 Future Factors Affecting Trip Generation
6.1 Future Development of Travel Plans at Existing Schools and Colleges
The future influence of School/College Travel Plans has been investigated within the spreadsheet model. Travel Plans aim to reduce the number of car journeys and can therefore play an important role in reducing the strain on the road network. A popular Travel Plan measure applied to primary schools is the Walking Bus, which is a supervised group of children walking to or from school. Car Sharing is another option which can be promoted for pupils travelling over greater distances. The following schools and colleges are located within Tonbridge:
Primary Schools Cage Green Primary School Hilden Grange School (Private School) Hilden Oaks School (Preparatory School) Long Mead Community Primary School Slade Primary School St Margaret Clitherow Catholic Primary School St Stephen’s Primary School Sussex Road Community Primary School Woodlands Infants School Woodlands Junior School Secondary Schools Hillview School for Girls The Hayesbrook School The Judd School (Boys Grammar) Tonbridge Grammar School for Girls Tonbridge School (Boys Private Boarding School) Weald of Kent Grammar School for Girls
Special School Ridge View School College/Higher Education West Kent College The Hugh Christie Technical College
Travel Plans are currently in place for Slade Primary School, St Margaret Clitherow Catholic Primary School, Hillview School for Girls and The Hugh Christie Technical College. The Kent Highway Services Sustainable Transport Team has been responsible for the implementation of School Travel Plans and has undertaken surveys in 2004-2005 and 2005-2006 to assess their influence. Table 6-A illustrates how the modal share percentages have changed between the two survey years. 3 Development assumptions.doc/Aug-07 6-19

Table 6-A: The influence of Travel Plans on the modes used to access educational facilities within Tonbridge
With the exception of The Hugh Christie Technical College the main impact of the Travel Plans has been a reduction in car/van travel. This is particularly evident for the St Margaret Clitherow Catholic Primary School and Hillview School for Girls with car/van travel falling by 14% and 12% respectively. These results suggest that increased bus use, walking and more specifically, car sharing are behind this change. The methodology used for assessing the impact of future School/College Travel Plans, within the Spreadsheet Model, is as follows: •
•
•
•
•
•
•
It has been assumed that no further modal shift will be achieved at either LEA supported schools where a Travel Plan is already in place or at Private Schools. The TRICS® database has been interrogated to derive trip rates for schools/colleges, similar to those within Tonbridge. The trip rates exported from TRICS® are per pupil and have, therefore, been multiplied by the number of pupils attending each school to ascertain the total trips generated by each. The results have then been added into a worksheet titled “School Travel Plans” in the Spreadsheet Model. The schools/colleges within the “School Travel Plans” worksheet have been divided into seven groups (depending on location) and the total trips have been calculated for each group. For example, the Woodlands Infants and Junior Schools have been grouped together as their close proximity means that similar routes will be used to access them. A School Travel Plan factor has been built into the model to represent the likely percentage reduction in existing private vehicle school journeys. This has initially been set at 11%, which is the average percentage reduction in car/van trips actually achieved in the first full year by Travel Plans at the Slade Primary School, St Margaret Clitherow Catholic Primary School and Hillview School for Girls. This has been done by using a gravity model to provide an indication of the routes taken by different proportions of traffic accessing each group. A “School Travel Plans” column has then been added into the “Improvements” worksheet, which aggregates the number of vehicles performing turning movements at each junction along the routes. An “IF” function in the “School Travel Plans” column of the “Master” worksheet, allows the flows associated with the Travel Plans from the “Improvements” worksheet to be toggled on and off by selecting 1 or 0 in the “Front” sheet. If 1 is selected the DS Future Flows columns in the “Master”
3 Development assumptions.doc/Aug-07 6-20

worksheet deducts these values from the overall future traffic flows. The RFC’s associated with each junction are then automatically updated.
6.2 Development Travel Plans
The model provides the ability for the user to reduce the number of trips associated with a development by applying a travel plan factor. Currently, for each development, a cell is set at 95%, which would result in 5% reduction in trips. This is now deemed to be conservative and if measures were being promoted to reduce car trips below the level associated with the TRICS® sites for which the ‘base’ modal splits (see Table 2-B to 2-D) have been obtained, then a lower factor such as 80% or 90% could be input. New guidance from the Department for Transport4 accordingly indicates higher guideline car trip reduction targets, relative to different levels of travel plan investment and measures, as being potentially achievable within 3 to 5 years of implementing a travel plan. The revised Department for Transport figures are summarised in Table 6-B. Table 6-B: Guidance on Travel Plan Measures and Probable Trip Reduction
Probable Car Trip Reduction
Travel Plan Measures
0% A plan containing marketing and promotion only 5% A plan with the above plus car sharing and cycle measures
10% A plan with the above plus large public transport discounts and works buses/additional public transport links
15-30% A plan with a combination of all the above measures plus a disincentives to car use (e.g. parking charges)
When planning applications are made, the data in the model can be updated according to the modal splits being proposed in the transport assessments. 6.3 ‘Smarter choices’ initiatives to affect existing travel patterns
Other Demand Management Measures highlighted in the scoping report can potentially reduce the number of car trips currently made to/from and within Tonbridge town centre. Therefore a facility to reflect the impact of possible future Smarter Choices initiatives (based on research by Halcrow (2002) and Cairns et al. (2004)) on background trips has been provided on the model “front page”. The work by Cairns et al. (2004)5 presented a literature review of a number of studies into the impact of soft measures. This concludes that Halcrow’s (2002) estimate of a 5% reduction in vehicle trips attributable to ‘softer measures’ is reasonable if these initiatives continue to be implemented piecemeal as normally happens at the moment. However it concludes that there is potential to reduce traffic further if soft measures are introduced with higher intensity and supported by control measures to prevent induced traffic swallowing the released capacity. For instance the authors suggest that peak period traffic could be reduced by 14% for non urban areas to 21% for urban (i.e. large cities).
4 Department for Transport (2005): Guidance on Assessment of Travel Plans.
5 Cairns, S et al. (2004): Smarter Choices – Changing the way we travel.
3 Development assumptions.doc/Aug-07 6-21
To achieve this, Cairns et al. suggest that a comprehensive package of demand management measures would have to be adopted. For Tonbridge these could include: •
• • • • • •
Re-allocation of road capacity and other measures to improve public transport service levels; Parking control; Traffic calming; Pedestrianisation; Improved Cycle networks; Use of transport prices and fares; and Better public transport information.
The character of development proposed in Tonbridge town centre, in parallel with some work already in place will help to achieve these demand management measures. For example, the Borough Council has rationalised the management of its off-street parking stock to make a clearer distinction between short and long stay parking, and as part of that process has rebalanced the amount of parking to make more spaces available for short stay parking at locations convenient for, and close to, the town centre shops. Measures promoted in the 2002 High Street Study looked actively at the reallocation of road space to pedestrians in the High Street. In addition to this there is also scope to deliver pedestrian improvements in other parts of the town. It is also important to realise that the nature of the development proposed in the Botany area of Tonbridge will, if realised, promote an improved pedestrian environment, with all parking on the east of the site and uninhibited pedestrian routes between the new retail development, relocated Sainsbury’s store and the existing High Street, and new residential development. Possible road links such as the Hadlow Road to London Road link will provide the opportunity to reduce the impact of traffic flows on Bordyke and East Street, making these parts of the historic town centre, more pedestrian friendly. The Hadlow Road London Road link should also remove traffic from residential roads such as Dry Hill Road, Yardley Park Road and The Ridgeway. In conjunction with the link road the opportunity should be taken to change the character of these relieved roads to ensure that induced traffic does not swallow this released capacity.
The model therefore provides an option for the user to model a level of background traffic reduction for future years. The user is free to choose whatever percentage reduction they feel is appropriate based on the policy scenarios in Tonbridge. However it is felt that a maximum reduction of 14% is likely (the lower range of Cairns et al. work) given that Tonbridge does have a significant rural catchment where there will be fewer alternatives to the car.
3 Development assumptions.doc/Aug-07 6-22
Appendix A - Summary of Development Trip Rates
Summary of development sites and trip rates used for each time period.
AM (08:00-09:00) PM (17:00-18:00) 12Hr Development Type Calculator Arr. Dep. Total Arr. Dep. Total Total Flats <30 Households 1 Household 0.06 0.23 0.29 0.21 0.09 0.3 2.75 Flats 30-100 Households 1 Household 0.05 0.22 0.27 0.21 0.11 0.32 2.62 Housing 50-100 Households 1 Household 0.11 0.41 0.52 0.36 0.14 0.5 4.6 Retail SS 4000-10,000 m2 per 100 m2 2.91 1.36 4.27 5.35 5.96 11.31 104.95Retail Park Non Food 2,000-10,000 m2 per 100 m2 0.87 0.44 1.31 1.28 1.48 2.76 37.44 Retail Park Non Food 10,000-20,000 m2 per 100 m2 0.37 0.18 0.55 1.14 1.21 2.35 23.91 Retail Local Shops 500-6,000 m2 per 100 m2 3.12 2.37 5.49 5.97 7.01 12.98 138.01Retail Mix Malls 4,000-18,000 m2 per 100 m2 1.16 0.59 1.75 1.59 1.83 3.42 41.77 Retail Mix Malls 10,000-18,000 m2 per 100 m2 1.3 0.67 1.97 1.54 1.82 3.36 43.13 Restaurant c.300 m2 per 100 m2 0.1 0.1 0.2 1.59 2.86 4.45 52.06 Leisure 0.8 ha per hectare 20.48 27.71 48.19 71.08 92.77 163.85 786.75Offices 12,000 m2 per 100 m2 1.53 0.07 1.6 0.11 0.97 1.08 10.46 Offices 1,000 m2 per 100 m2 3.13 0.2 3.33 0.34 2.74 3.08 18.68 Offices 2,500-4,000 m2 per 100 m2 1.47 0.39 1.86 0.32 1.21 1.53 15.05 Business Park 400-7,500 m2 per 100 m2 1.21 0.32 1.53 0.16 0.89 1.05 11.04 Industrial Estate 500-7,500 m2 per 100 m2 0.87 0.35 1.22 0.19 0.76 0.95 10.17 Industrial Estate 7,500-20,000 m2 per 100 m2 0.63 0.3 0.93 0.18 0.53 0.71 9.6 College <10,000 m2 per 100 m2 0.29 0.03 0.32 0.07 0.36 0.43 8.65 Car Show Room per 100 m2 2.11 0.82 2.93 0.81 1.78 2.59 31.44 Library per 100 m2 1.79 0.49 2.28 1.52 1.68 3.21 - Community per hectare 4.29 1.07 5.36 10.36 7.86 18.21 - College <10000 m2 per 100 m2 0.75 0.21 0.96 0.15 0.48 0.63 5.83 College >10000 m2 per 100 m2 0.62 0.1 0.72 0.38 0.44 0.82 8.02 Retail/ Employment (Ind. Est. Non Food Retail Park) per 100 m2 0.50 0.24 0.74 0.66 0.87 1.53 16.76 B8 Warehousing 3000-11000 m2 per 100 m2 0.23 0.11 0.34 0.11 0.31 0.42 3.68
3 Development assumptions.doc/Aug-07

Net vehicle trips for each site (including pass-by, diverted and linked trips)
AM (0800-0900) PM (1700-1800) Development site Arr. Dep. Total Arr. Dep. Total
Botany 115 85 200 228 256 485 Station 28 92 120 95 57 152 River Walk -15 3 -12 25 28 52 Avebury Avenue -11 18 7 22 1 23 Quarry Hill -41 14 -27 10 -33 -23 Iceland/ Waitrose 52 46 98 54 67 121 Sovereign Way -47 38 -10 43 -30 13 Lyons Crescent -3 4 1 4 -2 3 Avenue de Puy 108 12 120 75 63 138 Medway Wharf 18 79 96 75 39 114 Gas Works 4 18 22 17 9 26 Cannon Lane 45 57 102 66 67 133 Riverdale Colas 209 14 223 20 138 157 Priory Road -28 6 -23 10 -22 -11 Market 6 23 29 22 10 31 Tonbridge Girls Grammar School 11 41 52 36 14 50 Woodgate Way 170 70 240 42 157 198 Tonbridge Industrial Estate 25 10 34 5 21 27 Hugh Christie 2 9 11 8 4 13 Hadlow Road 2 8 10 7 3 10 West Kent College 6 21 26 18 7 25 Rowan House 1 6 7 5 2 7
3 Development assumptions.doc/Aug-07