tomorrow’s energy scenarios 2017 locations · eirgrid – tomorrow’s energy scenario 2017...
TRANSCRIPT

EirGrid – Tomorrow’s Energy Scenario 2017 Locations • Planning our Energy Future • Page a
Tomorrow’s Energy Scenarios 2017
Locations
Planning our Energy Future

EirGrid – Tomorrow’s Energy Scenario 2017 Locations • Planning our Energy Future • Page b
DisclaimerEirGrid has followed accepted industry practice in the collection and analysis of data available. While all reasonable care has been taken in the preparation of this data, EirGrid is not responsible for any loss that may be attributed to the use of this information. Prior to taking business decisions, interested parties are advised to seek separate and independent opinion in relation to the matters covered by this document and should not rely solely upon data and information contained herein. Information in this document does not amount to a recommendation in respect of any possible investment. This document does not purport to contain all the information that a prospective investor or participant in the Single Electricity Market may need.
For queries relating to this document please contact: [email protected]
COPYRIGHT NOTICEAll rights reserved. This entire publication is subject to the laws of copyright. This publication may not be reproduced or transmitted in any form or by any means, electronic or manual, including photocopying without the prior written permission of the Transmission System Operator.
©EirGrid Plc. 2018
The Oval, 160 Shelbourne Road, Ballsbridge, Dublin 4, D04 FW28, Ireland.

EirGrid – Tomorrow’s Energy Scenario 2017 Locations • Planning our Energy Future
Table of contentsDocument structure ....................................................................................................................1
Glossary of terms .......................................................................................................................2
Executive summary .....................................................................................................................3
1. Key changes ...........................................................................................................................5
1.1. Locations consultation ................................................................................................ 5
1.2. Summary .................................................................................................................... 5
2. Introduction ............................................................................................................................6
2.1. Report purpose ........................................................................................................... 6
2.2. Why we use scenario planning .................................................................................... 6
2.3. TES and the grid development process ........................................................................ 6
2.4. EirGrid planning publications ...................................................................................... 6
3. Tomorrow’s energy scenarios 2017 .........................................................................................8
3.1. Our scenarios .............................................................................................................. 8
3.2. Scenario development ................................................................................................ 8
3.3. TES 2019 .................................................................................................................... 8
3.4. Continuing the conversation ........................................................................................ 8
4. Focus areas ...........................................................................................................................11
4.1. Introduction ..............................................................................................................11
4.2. Technologies driving future change ...........................................................................11
4.3. Timeframe .................................................................................................................11
4.4. Ireland’s regions .......................................................................................................12
4.5. Information sources ..................................................................................................13
5. Electricity demand ................................................................................................................14
5.1. Data centres ..............................................................................................................14
5.2. Electric vehicles ........................................................................................................17
5.3. Heat pumps ..............................................................................................................19
6. Electricity supply ..................................................................................................................21
6.1. Onshore wind............................................................................................................21
6.2. Offshore wind ...........................................................................................................24
6.3. Solar PV ....................................................................................................................25
6.4. Fossil fuel generation ................................................................................................27
7. Electricity storage and interconnection .................................................................................29
7.1. Electricity storage ......................................................................................................29
7.2. Interconnection .........................................................................................................31
Appendix 1 – Demand data .......................................................................................................32
Appendix 2 – Generation data ...................................................................................................33
References ................................................................................................................................34

EirGrid – Tomorrow’s Energy Scenario 2017 Locations • Planning our Energy Future • Page 1
Document structureThis document contains a glossary of terms, an executive summary, seven main chapters and appendices. The structure of the document is as follows:
The Glossary of terms explains some technical terms used in the document.
The Executive summary gives an overview of the main highlights of the document.
Chapter 1 summarises the key changes made as a result of the locations consultation.
Chapter 2 explains the purpose of the locations report, how our scenarios are used in the grid development process and lists other EirGrid planning publications.
Chapter 3 describes the stories behind the four scenarios and explains the scenario development cycle.
Chapter 4 introduces some of the focus areas of the locations consultation and discusses where key information is sourced from and how it is presented.
Chapter 5 focuses on the future locations of the technologies which make up electricity demand and explains how these locations have been determined.
Chapter 6 focuses on the future locations of the technologies which make up electricity supply and explains how these locations have been determined.
Chapter 7 focuses on the future locations of the technologies which make up electricity storage and interconnection and explains how these locations have been determined.

EirGrid – Tomorrow’s Energy Scenario 2017 Locations • Planning our Energy Future • Page 2
Glossary of termsCapacity factorThe ratio of a generators actual power output over a period of time, to its potential output, if it were possible for it to operate at full capacity continuously over the same period of time.
Combined Cycle Gas Turbine (CCGT)A collection of gas turbine(s) and steam unit(s); waste heat from the gas turbine(s) is passed through a heat recovery boiler to generate steam for the steam turbine(s).
DemandThe amount of electrical power that is consumed by a customer, typically measured in megawatts (MW), in a general sense, the amount of power that must be transported from connected generation stations to meet all customers’ electricity requirements.
EirGridEirGrid plc is the state-owned company established to take on the role and responsibilities of Transmission System Operator in Ireland as well as market operatorof the wholesale trading system.
Electric vehicleA vehicle driven by an electric motor that is powered by a battery. The battery is typically charged by plugging into the low voltage electricity distribution system.
Embedded generationRefers to generation that is connected to the distribution system or at a customer’s site.
European Union (EU)A political and economic union of 28 member states that are located in Europe.
Greenhouse gasA gas in the atmosphere that absorbs and emits radiation within the thermal infrared range.
Heat pumpA device that provides heat energy from a source of heat to a destination called a ‘heat sink’.
InterconnectorThe tie line, facilities and equipment that connect the transmission system of one independently supplied transmission system to that of another.
Maximum export capacityThe maximum export value, measured in megawatts, provided in accordance with a generator’s connection agreement. The maximum export capacity is a contract value which the generator chooses as its maximum output.
Megavolt Ampere (MVA)1,000,000 volt amperes, a unit of apparent power.
Megawatt (MW)1,000,000 watts, a unit of active power.
Megawatt hour (MWh)1,000,000 watts hours, a unit of energy.
Open Cycle Gas Turbine (OCGT)A type of electricity generator that combines gas and compressed air in a combustion chamber to drive a turbine.
Peak demandThe maximum electricity demand in any one fiscal year. Peak demand typically occurs at around 5:30pm on a week day between November and February. Different definitions of peak demand are used for different purposes.
Single electricity marketThe single electricity market is the wholesale electricity market operating in Ireland and Northern Ireland.
Solar Photovoltaic (PV)Solar PV technologies produce electrical energy from solar radiation directly by converting light to electricity.
Transmission systemThe transmission system is a meshed network of high-voltage lines and cables (400 kV, 275 kV, 220 kV and 110 kV) for the transmission of bulk electricity supply around Ireland and Northern Ireland.
Transmission system operatorIn the electrical power business, a transmission system operator is the licensed entity that is responsible for transmitting electrical power from generation plants to regional or distribution operators.

EirGrid – Tomorrow’s Energy Scenario 2017 Locations • Planning our Energy Future • Page 3
Executive summary Scenario planning
At EirGrid, one of our roles is to plan the development of the electricity transmission system to meet the future needs of society. Key to this process is considering a range of possible ways that energy usage may change in the future. We call this scenario planning.
In 2017 we introduced scenario planning into our grid development process as a way of ensuring the electricity grid continues to support Ireland’s economic growth and expanding population.
We developed a set of four scenarios outlining four possible futures for the supply and consumption of electricity out to 2040. Our scenarios are:
• Steady Evolution
• Low Carbon Living
• Slow Change
• Consumer Action
Locations This document, Tomorrow’s Energy Scenarios (TES) 2017 Locations, proposes assumptions about where various demand and generation technologies may connect in the future. Modelling future locations enables us to identify potential areas of stress on the network which require further investigation.
We have used Ireland’s regions to present our locations in a concise and consistent way. We have taken electricity demand, electricity supply, electricity storage and interconnection figures presented in TES 2017 and disaggregated these by region.
This locations report reflects feedback received as part of the TES 2017 Locations Consultation which took place over a nine week period beginning in April 2018. Changes made as a result of the consultation are summarised in Chapter 1.
Electricity demandUnderstanding the future locations of electricity demand is an important step in testing that the transmission system of tomorrow can support this growth.
There is approximately 250 MVA [EirGrid (2017a)] of data centre capacity installed in Ireland at present. Data centres account for over 75% of new electricity demand growth in our scenarios. Future data centre locations have been assumed primarily based on connection offers and enquiries. However, other information sources have also influenced locations in some scenarios.
Dublin has become a hub for data centre development to date. Other locations in Ireland, such as Cork, Limerick and Galway are expected to experience some growth in data centre development. Low Carbon Living assumes the highest level of data centre growth outside of Dublin. This growth is expected to be driven by increased investment in regional infrastructure supported by the National Planning Framework (NPF) [Government of Ireland (2018)], and facilitated by new policy and regulatory measures.
Electricity demand for electric vehicles is expected to be heavily concentrated in urban areas. This is because urban areas are more densely populated, resulting in higher volumes of electric vehicles charging via the electricity distribution system.
Higher concentrations of heat pump demand are also assumed for urban areas due to higher proportions of new housing stock expected in these regions. A review of plans for strategic development zones has underpinned this approach, as the majority of new housing is planned for urban areas.
Electricity supply Grid connection applications received are central to our assumptions for future renewable energy technologies such as onshore wind, offshore wind and solar PV capacities. This information source is a strong indicator of future connection locations. We have also used Government policy publications and regulatory guidelines to assess the likelihood of connections occurring.
The Government’s Renewable Electricity Support Scheme (RESS), the Renewable Electricity Policy and Development Framework (REPDF) and the NPF may influence future locations of renewable electricity developments. Our scenarios align with various energy policy proposals as a means of preparing for changes to current connection patterns.

EirGrid – Tomorrow’s Energy Scenario 2017 Locations • Planning our Energy Future • Page 4
There is currently 3,200 MW1 of onshore wind generation capacity in Ireland with the vast majority situated on the south, west and north coasts reflecting the high availability of wind resource in these areas.
Our Steady Evolution and Slow Change scenarios assume that future onshore wind connections will follow a similar pattern to those observed in recent times. Our Low Carbon Living scenario considers a different development pattern reflecting a plan-led approach to future wind energy development. It assumes that energy policy developments and changes to planning guidelines lead to a broader regional spread of onshore wind development.
Our Consumer Action scenario aligns with increased community participation in onshore wind projects. This community participation is assumed to be supported by the Government’s future RESS, and is reflected by the assumed regional distribution of future onshore wind capacity.
EirGrid has received a number of applications from offshore wind farms seeking connection to the transmission system. These applications form the basis for assumed future locations with the majority on the east coast of Ireland.
The assumed future locations of large-scale solar PV generation capacities are also influenced by connection applications. Rates of uptake of rooftop solar PV, or micro generators, affect the
1 As of, January 2018
future locations of small-scale solar PV capacity. We have assumed that the mix of large and small-scale generators and the associated rates of connection vary depending on the scenario.
Low Carbon Living accounts for the highest levels of large-scale solar PV, predominantly based in southern regions of Ireland where sun exposure is highest. Consumer Action assumes the highest levels of rooftop solar PV, which is most concentrated in urban areas.
The amount of energy produced by fossil fuel generators in Ireland is expected to reduce in the future [EirGrid (2017b)]. Assumptions relating to the future locations of fossil fuel generators are based on information provided by our stakeholders as part of the TES 2017 consultative process. A number of existing fossil fuel generators are expected to repower to gas or biomass and other generators will close.
Electricity storage and interconnection New energy storage locations are expected in the future, primarily as a result of battery energy storage systems connecting to the transmission and distribution systems. Locations of future battery energy storage connections are scenario dependent and have been primarily based on connection applications received by EirGrid and ESB Networks.
Ireland is currently interconnected with Great Britain through the East West Interconnector and to Northern Ireland via a 275 kV double circuit line. Further interconnection with Northern Ireland is planned with the high voltage alternating current North South Interconnector planned to be completed in 2023. This project will increase the total transfer capacity between Ireland and Northern Ireland to 1,200 MW.
The expected quantity of High Voltage Direct Current (HVDC) interconnections by 2030 varies from one to three depending on the scenario. Low Carbon Living assumes the highest level of HVDC interconnection by 2030 including the existing East West Interconnector, the proposed Celtic Interconnector, and the proposed Greenlink Interconnector with Great Britain connecting in the South-East region. However, Slow Change assumes that East West Interconnector is the only interconnector location in Ireland by 2030.

EirGrid – Tomorrow’s Energy Scenario 2017 Locations • Planning our Energy Future • Page 5
1. Key changes1.1. Locations consultationIn April 2017, we published the TES 2017 Locations Consultation, a report detailing the future locations of electricity infrastructure in Ireland. We requested feedback on the assumptions used to determine these future locations.
We experienced a high level of engagement from a wide range of stakeholders and received a lot of useful feedback. This feedback has been reviewed and used to prepare this TES 2017 Locations report. We will also use this feedback to help shape future TES publications.
1.2. SummaryA summary of changes made to the report, as a result of the locations consultation, is provided below in Table 1.
Chapter Key changes
Introduction • A new section titled “Why do we use scenarios” explains EirGrid’s role as the transmission system operator and why EirGrid uses scenarios.
• A new section titled “Report purpose” outlines the document motivation.
• A new section titled “TES and the grid development process” explains the role of scenarios in the grid development process.
• A new section titled “EirGrid planning publications” lists other EirGrid publications, summarises the information contained within them and how they relate to TES.
Electricity demand • We have revised our data centre locations for the Low Carbon Living scenario reflecting further alignment with the NPF and the Government’s recent statement on data centres.
Electricity supply • We have revised our onshore wind locations for the Low Carbon Living scenario reflecting further alignment with the NPF.
Electricity Storage and Interconnection
• We have revised our interconnector capacity for the Low Carbon Living scenario to reflect the project details of the Greenlink Interconnector.
Table 1 – Summary of changes
EirGrid – Tomorrow’s Energy Scenario 2017 Locations • Planning our Energy Future • Page 6
2. Introduction 2.1. Report purposeThe purpose of the TES 2017 Locations report is to detail the future locations of electricity infrastructure for each scenario and the assumptions used to determine these locations.
2.2. Why we use scenario planningEirGrid is the licensed transmission system operator on the island of Ireland. As the licence holder we are required to secure the ongoing operation, maintenance and development of the electricity transmission system.
Scenario planning allows us to assess the performance of the electricity system against four credible futures, helping to maintain required levels of system safety, security and reliability over the long-term.
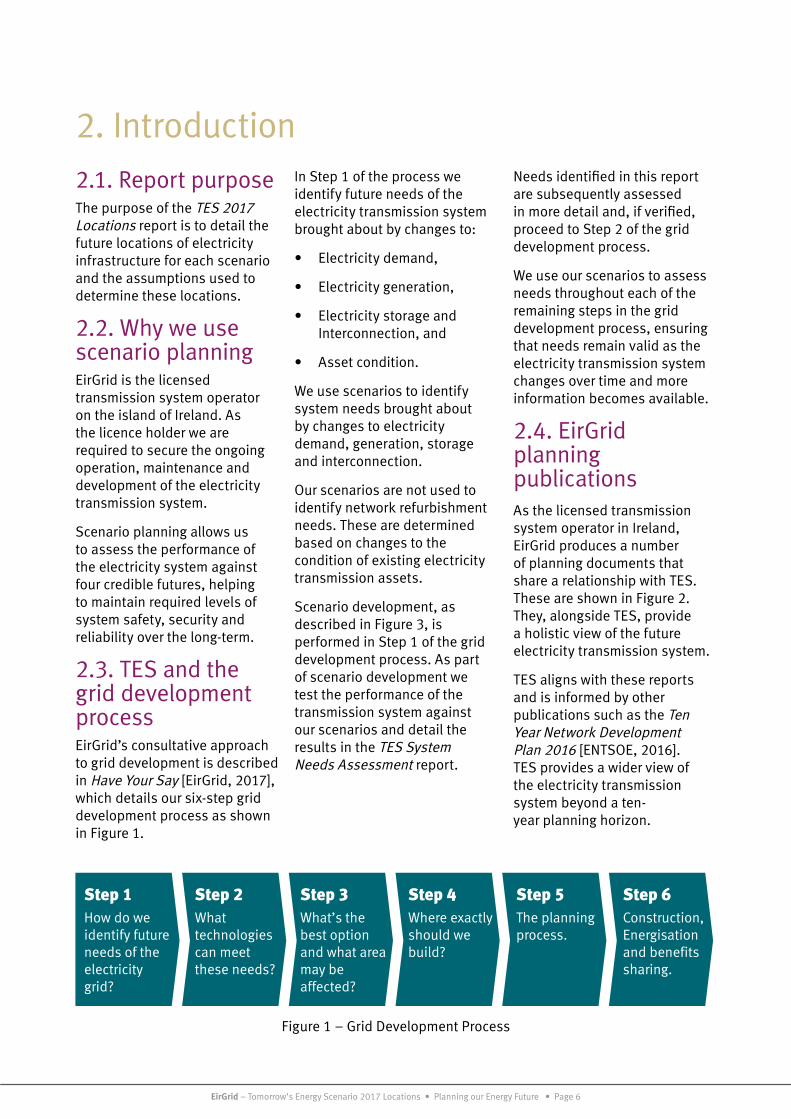
2.3. TES and the grid development processEirGrid’s consultative approach to grid development is described in Have Your Say [EirGrid, 2017], which details our six-step grid development process as shown in Figure 1.
In Step 1 of the process we identify future needs of the electricity transmission system brought about by changes to:
• Electricity demand,
• Electricity generation,
• Electricity storage and Interconnection, and
• Asset condition.
We use scenarios to identify system needs brought about by changes to electricity demand, generation, storage and interconnection.
Our scenarios are not used to identify network refurbishment needs. These are determined based on changes to the condition of existing electricity transmission assets.
Scenario development, as described in Figure 3, is performed in Step 1 of the grid development process. As part of scenario development we test the performance of the transmission system against our scenarios and detail the results in the TES System Needs Assessment report.
Needs identified in this report are subsequently assessed in more detail and, if verified, proceed to Step 2 of the grid development process.
We use our scenarios to assess needs throughout each of the remaining steps in the grid development process, ensuring that needs remain valid as the electricity transmission system changes over time and more information becomes available.
2.4. EirGrid planning publicationsAs the licensed transmission system operator in Ireland, EirGrid produces a number of planning documents that share a relationship with TES. These are shown in Figure 2. They, alongside TES, provide a holistic view of the future electricity transmission system.
TES aligns with these reports and is informed by other publications such as the Ten Year Network Development Plan 2016 [ENTSOE, 2016]. TES provides a wider view of the electricity transmission system beyond a ten-year planning horizon.
Step 6Construction, Energisation and benefits sharing.
Step 5The planning process.
Step 4Where exactly should we build?
Step 3What’s the best option and what area may beaffected?
Step 2What technologies can meet these needs?
Step 1How do weidentify future needs of the electricity grid?
Figure 1 – Grid Development Process

EirGrid – Tomorrow’s Energy Scenario 2017 Locations • Planning our Energy Future • Page 7
All-IslandGeneration
CapacityStatement
2017-2026
Figure 2 – EirGrid planning publications
Transmission Development Plan
Ten year network and interconnection development plan.
Transmission Forecast Statement
All-Island Ten Year
2016
EIRG044_10yr_Transmission_Forecast_Statement.indd 1 17/08/2017 18:27
All Island Ten Year Transmission
Forecast Statement
Detailed information on demand and generation
opportunities.
All Island Generation Capacity
Statement
Ten year electricity demand forecast.

EirGrid – Tomorrow’s Energy Scenario 2017 Locations • Planning our Energy Future • Page 8
3. Tomorrow’s energy scenarios 20173.1. Our scenariosEirGrid is responsible for the ongoing development of the transmission system so that it continues to meet the needs of electricity consumers into the future. The factors that influence the future usage of the transmission system are changing and becoming more varied. The level of uncertainty of each of these factors can be high.
The electricity industry is undergoing change driven by the adoption of new technologies and by new consumer behaviours. In 2017 we introduced scenario planning as a way of developing the transmission system so that it continues to support Ireland’s economic growth and expanding population in the face of an uncertain future.
We published Tomorrow’s Energy Scenarios 2017 [EirGrid (2017b)] – a document outlining four possible futures for the supply and consumption of electricity in Ireland out to 2040.
Tomorrow’s Energy Scenarios 2017 brought together a wide range of factors that may shape the future electricity sector into a set of four discrete scenarios.
Our final scenarios are described in Figure 4.
3.2. Scenario developmentWe take a cyclic approach to scenario development. Involving our stakeholders
in the development cycle is key to ensuring continuous improvement of our scenarios.
Figure 3 illustrates the consultation milestones and publications as part of the current scenario development cycle.
This locations report is phase four of the current development cycle. It details finalised assumptions and methods relating to our future locations.
With the final assumptions, we will conduct a technical assessment. This will be achieved by performing a number of different power system studies for each scenario out to 2040.
These studies will help us identify any future needs on the transmission system brought about by changes in electricity generation, electricity demand, electricity storage or interconnection.
The results will be presented in Tomorrow’s Energy Scenarios 2017 System Needs Assessment report which will be published towards the end of 2018. This report will conclude the current scenario development cycle.
3.3. TES 2019 Our scenario development cycle will begin again in spring 2019. We will streamline TES development in 2019 by combining consultations on scenarios and locations and producing one consolidated report. We look forwarding to engaging with our stakeholders as part of TES 2019 scenario development.
3.4. Continuing the conversationFor more information on TES, or to access other TES publications, please visit our website.
Alternatively, you can email your views on TES to: [email protected] and one of our team will be in touch.
1. Scenarios Consultation
2. PublishScenarios
3. Locations Consultation
5. Needs Assessment Publication
Consultation
Publication
Current phase
4. Locations Publication
Figure 3 – Scenario development cycle

EirGrid – Tomorrow’s Energy Scenario 2017 Locations • Planning our Energy Future • Page 9
Onshore wind generation increases to approximately
5,200 MW by 2030
New 700 MW interconnector to Europe is
in place by 2025
Ireland’s 2030 emissions targets are met
Steady EvolutionRenewable electricity generation maintains a steady pace of growth. This is due to steady improvements in the economy, and in the technologies which generate electricity. New household technologies help to make electricity consumers more energy aware. This increases energy efficiency in homes and businesses. Over time, electricity consumers gradually begin to make greater use of electric vehicles and heat pumps. This means that, over time, electricity powers a larger proportion of transportation and heating.
Coal generation is repowered to Gas and Peat generation is repowered to
Biomass by 2025
The total demand for electricity increases by 53% by 2030 compared
to today
Data Centre connections reach 1950 MVA in 2030 - most of these
are based in Dublin
Low Carbon LivingThe economy enjoys high economic growth. This encourages the creation and rollout of new technologies for low carbon electricity generation. There is strong public demand to reduce greenhouse gas emissions. In addition to high carbon prices and incentives for renewables, this creates a high level of renewable generation on the grid. This clean energy then combines with improvements to broadband and transport to drive growth in large data centres.
Figure 4 – Tomorrow’s Energy Scenarios

EirGrid – Tomorrow’s Energy Scenario 2017 Locations • Planning our Energy Future • Page 10
Fossil fuel generation capacity remains over 5,000 MW by 2030
The total demand for electricity increases by 22% by 2030 compared to today
Ireland’s 2030 emissions targets are missed
Slow ChangeThe economy experiences very slow growth. Investment in new renewable generation is only in established, low risk technologies. Due to poor economic growth, new technologies that could increase the use of renewable generation at household and large-scale levels are not adopted. Overall there is little change in the way electricity is generated when compared to today. Domestic consumers and commercial users are also avoiding risk and uncertainty. The only source of demand growth is the connection of new data centres but the level of investment slows down significantly after 2025.
There are almost 560,000 electric vehicles on the
road by 2030
17% of residential houses are heated through heat
pumps by 2030
Household batteries and Solar PV help to increase self-
consumption of electricity
Consumer ActionA strong economy leads to high levels of consumer spending ability. The public want to reduce greenhouse gas emissions. Electricity consumers enthusiastically limit their energy use and generate their own energy. This results in a large number of community-led energy projects and a rapid adoption of electric vehicles and heat pumps in the home.

EirGrid – Tomorrow’s Energy Scenario 2017 Locations • Planning our Energy Future • Page 11
4. Focus areas4.1. IntroductionTo assist with presenting the information in this locations report in a concise way we have focused on certain aspects of Tomorrow’s Energy Scenarios 2017. This approach enables a deeper examination of the assumptions and methodologies used to determine our future locations.
4.2. Technologies driving future changeIn this document we consider generation, demand and interconnection and storage developments whose locations, either individually or in aggregate, can have a significant influence on the future usage of the transmission system.
Data centres, electric vehicles and heat pumps account for the majority of future electricity demand growth as described in Tomorrow’s Energy Scenarios 2017 and each technology is given a section in this document. Assessments of generation developments have focussed on the potential locations of offshore wind, onshore wind, solar PV and fossil fuel generation technologies. Ireland’s transmission system is expected to have more interconnection with other countries in future along with an increase in levels of electricity storage and both of these are also examined.
These technologies will influence Ireland’s future transmission system and therefore it is important that our assumptions are validated. We have outlined the assumptions used to determine future locations for these technologies and welcome your feedback as part of this consultation.
4.3. TimeframeTomorrow’s Energy Scenarios 2017 presented demand, generation and interconnection information for four different time periods; 2020, 2025, 2030 and 2040. However, this document concentrates on 2030 and uses this year to demonstrate our approach to determining locations for all Tomorrow’s Energy Scenarios study years. The 2030 information is sometimes compared against current data as a way of gauging levels of change for different technologies.
We have selected 2030 because it is an important year for a number of reasons. The level of certainty of the future energy system decreases over time. To account for this we consider more scenarios the further into the future we look. This is the first year that all four of our scenarios are used.
Further, 2030 is relevant in terms of energy policy as performance against EU emission targets will be assessed in 2030. The Government’s Energy White Paper [Department of Communications, Energy & Natural Resources (2015)] set out a framework to help guide energy policy in Ireland out to 2030, highlighting 2030 as a ‘milestone’ in Ireland’s journey towards a low carbon future.
Finally, 2030 is important from a grid development perspective as system needs that require grid reinforcements to be in place by 2030 may need to begin to develop solutions in the short term. Costs and benefits associated with potential grid development projects can be quantified with confidence within this 10 – 15 year planning horizon.

EirGrid – Tomorrow’s Energy Scenario 2017 Locations • Planning our Energy Future • Page 12
4.4. Ireland’s regionsEirGrid uses regions to plan the development of the transmission system in Ireland as described in the Transmission Development Plan 2015-2025 [EirGrid (2015)]. These regions, known as Nomenclature of Territorial Units for Statistics (NUTS) 3 regions [Ordnance Survey Ireland (2017)], have been in use in Ireland since 1994 and comprise the eight regional authorities established under the local Government act, 1991.
NUTS 3 regions are also used by Government agencies in Ireland, including IDA Ireland and the Central Statistics Office. The eight regions are illustrated in Figure 5. These regions will be used within this report to disaggregate information presented at a national level in Tomorrow’s Energy Scenarios 2017.
West
Border
DublinMidland
Mid-East
South-East
South-West
Mid-West
Figure 5 – Ireland’s regions

EirGrid – Tomorrow’s Energy Scenario 2017 Locations • Planning our Energy Future • Page 13
4.5. Information sourcesOur assumptions for future locations of electricity supply, generation and storage and interconnection are underpinned by a number of sources of information. These have been identified through comparison with our peers, consultation with our stakeholders during the scenario development phase and through research of available internal and external information sources. We have explained the role of these information sources in forming our future locations in chapters 5, 6 and 7 of this document. Some of the key sources are listed below.
• Transmission and distribution grid connection applications
• Electrical load data at transmission substations
• Renewable Electricity Suport Scheme (RESS)
• Ireland’s National Planning Framework (NPF)
• County development plans and energy strategies
• Interconnector project plans
• Population growth projections
• Government energy policy development and energy position papers
• Energy asset owner plans and statements
• Transmission system operator plans in other jurisdictions
We have used this information and our experience as the transmission system operator to develop what we believe to be the most credible locations for future electricity generation, demand and storage and interconnectors in Ireland.
In April 2017, we launched an open consultation to help us improve our locations based assumptions. Our stakeholders have helped us identify additional information sources which have been used to further refine our future locations.

EirGrid – Tomorrow’s Energy Scenario 2017 Locations • Planning our Energy Future • Page 14
5. Electricity demand 5.1. Data centresIreland supports a growing digital economy and is recognised as a “digital gateway to Europe” for many US-based companies [Host in Ireland (2017)]. Ireland’s attractiveness as a destination for digital infrastructure investment can be attributed, in part, to the availability of skilled English speaking workers, fibre connectivity, power availability and reliability of the electricity network.
There is approximately 250 MVA of data centre capacity installed in Ireland at present. These large facilities house computer servers used to store and process data and requires uninterrupted supply of electricity to ensure data is secure. The Irish Government has recently signalled an intention to include data centres in the Strategic Infrastructure Act [eISB (2006)]. This measure is expected to streamline the future development of new data centre facilities. Data centres account for over 75% of new electricity demand growth in our scenarios.
Data centre developers assess the suitability of potential locations in Ireland against a number of key criteria including the availability of the five Ps: People, Policy, Pedigree, Power and Pipes [Host in Ireland (2017)]. EirGrid is currently processing multiple data centre connection enquiries indicating that suitable development sites are available in a number of locations. Current forecasts suggest data centre capacity will marginally exceed 1,400 MVA by 2026 [EirGrid (2017a)].
Connection offers and enquiries form the basis for the assumed future locations of data centres. However, other supplementary information sources have also influenced locations in some scenarios.
Dublin has become a hub for data centre development and is recognised as a destination possessing all the required attributes. Other locations in Ireland, such as Cork, are developing these attributes [Host in Ireland (2017)] and are starting to experience growth in data centre development. The Government’s NPF [Government of Ireland (2018)] supports ambitious growth and introduces a strategy to increase investment in regional infrastructure. A recent statement on The Role of Data Centres in Ireland’s Enterprise Strategy [Department of Business, Enterprise and Innovation (2018)] reinforces the Government’s commitment to continued development in Ireland and discusses the need for a plan-led approach.
Future data centre locations are primarily based on connection offers and enquiries. Some of our scenarios forecast data centre capacities in 2030 and 2040 in excess of our data centre demand forecast of 1,400 MVA.
Slow Change and Steady Evolution forecast data centre capacity in 2030 of 850 MVA and 1,100 MVA respectively which are both lower than 1,400 MVA. Regional data centre investment patterns are not expected to deviate from current trends with assumed locations for these scenarios in 2030 solely based on the connection offers and material enquiries.
Low Carbon Living and Consumer Action forecast data centre capacity in 2030 of 1,950 MVA and 1,675 MVA respectively. The assumed locations for capacities in these scenarios have been determined based on a combination of connection applications, scenario storylines and assumed investment patterns for each scenario.
Current connection offers and material enquiries suggest that the majority of data centre capacity growth, over the next ten years, is expected in the Dublin region.
Slow Change forecasts 850 MVA in 2030, all of which is assumed to locate in Dublin. Meanwhile, 1,030 MVA is assumed to be located in Dublin in our Steady Evolution scenario with the remaining 15 MVA and 60 MVA situated in the West and South-West regions respectively.
EirGrid – Tomorrow’s Energy Scenario 2017 Locations • Planning our Energy Future • Page 15
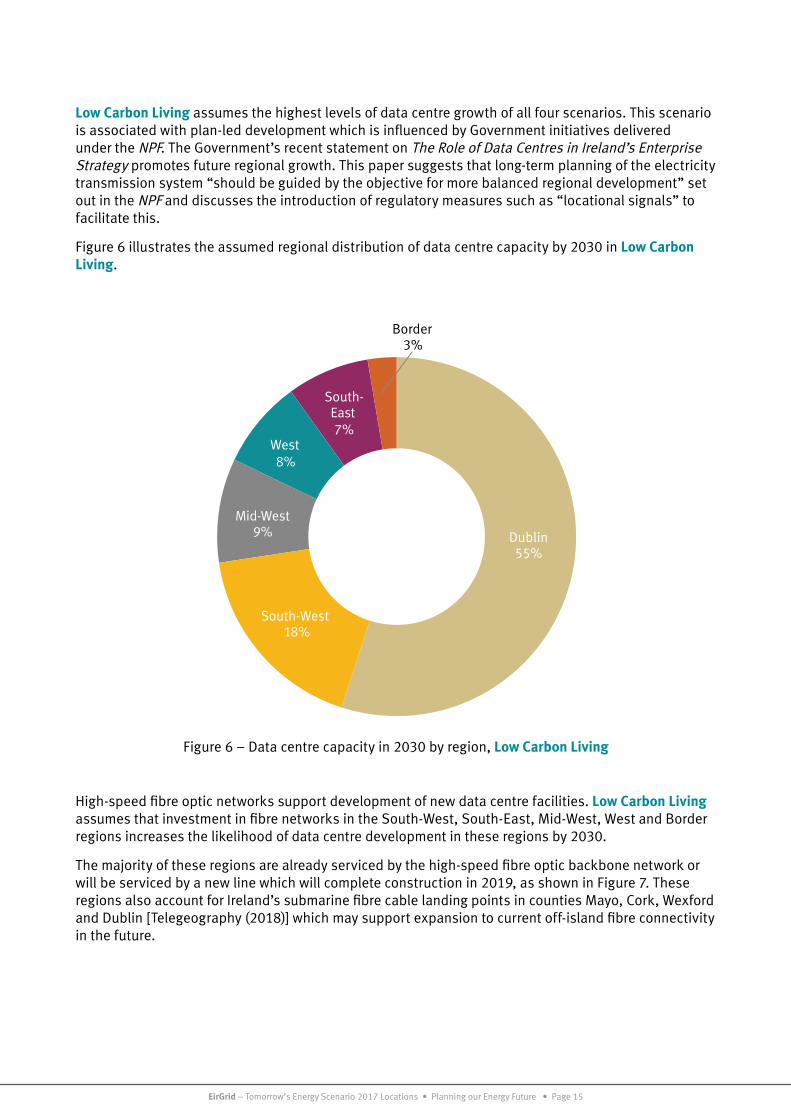
Low Carbon Living assumes the highest levels of data centre growth of all four scenarios. This scenario is associated with plan-led development which is influenced by Government initiatives delivered under the NPF. The Government’s recent statement on The Role of Data Centres in Ireland’s Enterprise Strategy promotes future regional growth. This paper suggests that long-term planning of the electricity transmission system “should be guided by the objective for more balanced regional development” set out in the NPF and discusses the introduction of regulatory measures such as “locational signals” to facilitate this.
Figure 6 illustrates the assumed regional distribution of data centre capacity by 2030 in Low Carbon Living.
Dublin 55%
South-West 18%
Mid-West 9%
West 8%
South- East7%
Border 3%
Figure 6 – Data centre capacity in 2030 by region, Low Carbon Living
High-speed fibre optic networks support development of new data centre facilities. Low Carbon Living assumes that investment in fibre networks in the South-West, South-East, Mid-West, West and Border regions increases the likelihood of data centre development in these regions by 2030.
The majority of these regions are already serviced by the high-speed fibre optic backbone network or will be serviced by a new line which will complete construction in 2019, as shown in Figure 7. These regions also account for Ireland’s submarine fibre cable landing points in counties Mayo, Cork, Wexford and Dublin [Telegeography (2018)] which may support expansion to current off-island fibre connectivity in the future.

EirGrid – Tomorrow’s Energy Scenario 2017 Locations • Planning our Energy Future • Page 16
Figure 7 – National high speed fibre optic network [Aurora Telecom (2017)]
Consumer Action differs somewhat from our other scenarios in terms of the scale and types of data centres connecting to Ireland’s electricity infrastructure in the future. Consumer Action assumes that approximately 7% of new data centre capacity in 2030 (105 MVA) will be small-scale distributed data centres connected to the distribution electricity network in our cities.
Expansion of these small-scale facilities, known as edge data centres, is reliant on the maturity of 5G communications networks in our cities and more widespread use of controllable smart devices in homes and businesses. Adoption of these technologies aligns with Consumer Action as electricity users proactively leverage smart devices to limit their energy use and reduce their carbon footprint. We have assumed that edge data centres will exist in the cities of Dublin, Cork, Galway and Limerick by 2030.
Consumer Action assumes the highest levels of data centre capacity in Dublin (1,358 MVA) by 2030 based primarily on connection offers and material enquiries. Growth is also forecast in the South-West, South-East and West regions due to a combination of large and small-scale data centre developments in the three largest cities outside of Dublin.

EirGrid – Tomorrow’s Energy Scenario 2017 Locations • Planning our Energy Future • Page 17
Dublin 81%
West 10%
South- West 8%
Mid-West 1%
Figure 8 – Data centre capacity in 2030 by region, Consumer Action
5.2. Electric vehiclesFuture electricity demand for electric vehicles will vary across the transmission system. This variation will depend on the points of the distribution network that the fleet of electric vehicles connect to for charging. It is expected the charging locations will be reflective of population densities with most charging occurring over night at the homes of electric vehicle owners.
We have distributed future electricity demand for electric vehicle to transmission stations on a pro-rata basis based on distribution demand readings. These readings are taken as an approximation of the number of domestic consumers fed by each transmission station. We have discussed this approach with the distribution asset owner, ESB Networks. ESB Networks has endorsed the method and provided feedback on ways to refine future calculations of electric vehicle demand.
Figure 9 provides a spatial view of electric vehicle capacity in 2030. The regions with the highest population densities, such as Dublin, the South-West, the Mid-West and the Mid-East, are expected to account for the largest proportion of electric vehicle demand. These four regions make up just less than three quarters of the average demand across the four scenarios.
Figure 9 illustrates a clustering of future capacity around the major cities in these regions. This is most pronounced in Consumer Action which assumes there will be 560,000 electric vehicles on our roads in 2030 – the highest levels of all four scenarios. The largest electric vehicle electricity demand in 2030 is assumed to occur in Dublin. This region accounts for an average of 38% of electric vehicle demand.
Slow Change assumes the lowest levels of electric vehicle uptakes in all regions by 2030 resulting in an overall quantity of 309,000. Low Carbon Living and Steady Evolution assume the second and third highest numbers of electric vehicles in all regions by 2030 respectively.

EirGrid – Tomorrow’s Energy Scenario 2017 Locations • Planning our Energy Future • Page 18
Figure 9 – Electric vehicle capacity in 2030 by transmission station
Steady Evolution
Slow Change
Low Carbon Living
Consumer Action
1 2 4MW

EirGrid – Tomorrow’s Energy Scenario 2017 Locations • Planning our Energy Future • Page 19
5.3. Heat pumpsExpectations for heat pump capacity growth are supported by the volume of new houses required to be built to meet Ireland’s growing population demands. Ireland’s population is expected to increase by 15% in 2030 [Central Statistics Office (2013a)]. Approximately 33% [PWC (2017)] of the housing stock in 2050 has not yet been built yet and it is expected that most new homes will be building energy rated ‘A’ homes with high quality insulation that will be heated using heat pumps.
Future growth of heat pump capacity is assumed to correlate with locations of new housing stock in areas zoned for future residential development. Land zoning [Department of Housing, Planning, and Local Government (2017)] conducted by the Government indicates that new housing development will be concentrated in urban centres.
We expect that 60% of all future heat pump demand will be fed from transmission stations situated in the urban centres and commuter areas of Dublin, Cork, Galway and Limerick. The commuter areas were assumed to be within a 50 kilometre radius of each city centre. The remaining 40% of heat pump capacity was assumed to be situated outside of these four major urban centres and commuter areas.
The heat pump capacity was then distributed across individual transmission stations on a pro-rata basis using distribution demand recorded at each station. The method used to allocate heat pump capacity to transmission stations is illustrated in Figure 10.
Total Scenario Capacity
Rural areas(40%)
Station n+1 demand
(% of total rural demand)
Station n+1 demand
(% of total urban demand)
Station n+2… Station n+2...
Station n demand
(% of total rural demand)
Station n demand
(% of total urban demand)
Major urban centres and commuter areas
(60%)
Figure 10 – Allocation of heat pump capacity to transmission stations
Figure 11 illustrates the assumed heat pump capacity in 2030. Dublin’s population is set to grow faster than any other region [Central Statistics Office (2013b)] which will drive the construction of new buildings that are heated using heat pumps. This explains the high concentration of heat pump capacity shown in Dublin.
Other regions such as the South-West, Border and South-East are also expected to see increases in new housing stock by 2030. High concentrations of heat pump capacity are expected in towns and cities within these regions.
The highest levels of heat pump capacity growth are consistent with Consumer Action as individual electricity consumers seek to reduce their carbon emissions by electrifying the heating of their homes. Consumer Action includes the highest volumes of heat pumps across all eight regions followed by Low Carbon Living, Steady Evolution and Slow Change.

EirGrid – Tomorrow’s Energy Scenario 2017 Locations • Planning our Energy Future • Page 20
Figure 11 – Heat pump capacity in 2030 by transmission station
Steady Evolution
Slow Change
Low Carbon Living
Consumer Action
1 2 4MW

EirGrid – Tomorrow’s Energy Scenario 2017 Locations • Planning our Energy Future • Page 21
2 As of, January 2018
6. Electricity supply6.1. Onshore windThere is currently 3,200 MW2 of onshore wind generation capacity connected in Ireland. Figure 12 displays existing onshore wind capacities by region. Ireland’s wind resource availability is highest on the north, west and south coasts of Ireland. This is reflected in the location of existing capacity with the majority of wind farms situated in the regions on these coasts.
Figure 12 – Current onshore wind capacity by region
The pipeline of connection projects suggests that 1,100 MW of onshore wind generation capacity will connect to the electricity distribution and transmission networks in the coming years. This 1,100 MW of new capacity is made up of applications in advanced stages of the connections process with signed contracts and approved planning permission. Combining these new connections with existing connections provides locations for 4,300 MW [EirGrid (2017d)] [ESB Networks (2018)] of onshore wind generation2.
Our scenarios forecast onshore wind capacities in excess of the 4,300 MW from 2025 onwards and so we must assume future generator locations based on best available information sources.

EirGrid – Tomorrow’s Energy Scenario 2017 Locations • Planning our Energy Future • Page 22
Future locations of onshore wind generators are assumed predominantly based on generation connection applications [EirGrid (2017c)]. Connection applications include information about the proposed location, maximum export capacity and date of connection.
We have also used additional information sources, such as the Government’s NPF, proposed changes to wind energy guidelines [Department of Environment, Community and Local Government (2013)] and the RESS to determine the most likely onshore wind connection patterns for each of our scenarios. These information sources have been used to allocate capacities up to the capacity limit for each scenario.
Slow Change and Steady Evolution scenarios are closely aligned with an industry-led approach to wind energy development. These scenarios both suggest a continuation of current connection patterns. Slow Change and Steady Evolution forecast capacities of 4,640 MW and 5,140 MW in 2030. Capacities above 4,300 MW are made up of contracted connection applications only, with application connection dates used to determine the connection timing.
Low Carbon Living is associated with a shift towards a plan-led approach to future wind energy development. As part of this scenario we assume that the Government’s NPF and the Governments planned REPDF influence future patterns of wind energy development. Under this scenario investments are directed to sites deemed suitable for wind energy development under the new wind energy development guidelines.
Modelling performed by the Sustainable Energy Authority of Ireland (SEAI) indicates that there will be a limited number of sites suitable for development under the new guidelines. This will mean that regions, such as the South-West, may experience a deceleration in development due to the unavailability of suitable sites. However, other regions with a higher proportion of suitable sites may see an increase in wind energy development.
The Government’s NPF discusses an intention to explore the viability of state-owned peatlands for renewable energy development. Low Carbon Living assumes that the relatively high availability of suitable sites in the West, Midland and Mid-East regions will result in connections in these areas. Improvements in wind turbine technologies may support this shift by increasing generator output in areas with relatively lower wind resources. We also assume some repowering of existing wind farms that have reached end of life in the South-West, West, South-East and Border regions.
In 2018, the Government released a high level design of the RESS. The RESS is intended to assist Ireland in meeting its 2020 renewable energy targets and 2030 energy ambitions by providing support for the development of renewable energy. Increased community participation in, and ownership of, renewable electricity projects is a key feature of the high level RESS design. Proactive involvement in renewable energy projects is consistent with Consumer Action as individuals and groups, seek to reduce their carbon footprint.
Although the size and scale of future onshore wind generators are expected to remain mostly consistent with recent experience, Consumer Action assumes a small increase in the number of community-led projects. This shift towards smaller scale distributed wind generation is expected in response to the new RESS. Community-led projects are expected to be relatively small capacities, less than 30 MW, and will connect to the distribution electricity network.
We have assumed that locations with existing applications, consistent with community-led projects, are likely to connect as part of our Consumer Action scenario. This results in a more balanced regional spread of community-led projects consistent with the SEAI’s experience to date with projects of this nature.
Figure 13 provides a spatial view of assumed onshore wind capacity growth, from current levels, by 2030 for each of our scenarios. The magnitude and regional distribution of capacity growth varies across our regions depending on the scenario. Steady Evolution and Slow Change assume continued growth on the west coast, whilst Consumer Action and Low Carbon Living assume a more ‘balanced’ regional spread.

EirGrid – Tomorrow’s Energy Scenario 2017 Locations • Planning our Energy Future • Page 23
Figure 13 – Onshore wind capacity growth, from current levels, by 2030 by region
Steady Evolution
Slow Change
Low Carbon Living
Consumer Action

EirGrid – Tomorrow’s Energy Scenario 2017 Locations • Planning our Energy Future • Page 24
6.2. Offshore windWe have received applications for offshore wind farms to connect to the transmission system. These applications provide the basis for assumed locations. Figure 14 displays offshore wind generation capacities in 2030 by region.
-
200
400
600
800
1,000
1,200
1,400
1,600
1,800
Dublin South-East Mid-West Border Mid-East West
MW
Low Carbon Living Consumer Action Steady Evolution Slow Change
Figure 14 – Offshore wind capacity in 2030 by region
Shallow water depths and sheltered conditions in the Irish Sea make the east coast more favourable for wind farm development. This is reflected in connection applications with an average of 73% of offshore wind capacity seeking to connect on the east coast in 2030. There are a number of proposed wind farm developments at discrete locations off the coasts of Louth, Wicklow, Dublin and Wexford.
The highest levels of offshore wind generation are associated with Low Carbon Living. This scenario assumes that offshore wind technology may assist Ireland to meet its EU carbon emission targets and links offshore wind farm development in the Irish Sea with further interconnections to Great Britain. This scenario assumes an overall offshore wind capacity of 1,600 MW will connect in the Dublin area by 2030.
The remaining three scenarios also assume the majority of capacity growth to occur on the east coast, although, the magnitude of capacity growth is much lower.

EirGrid – Tomorrow’s Energy Scenario 2017 Locations • Planning our Energy Future • Page 25
6.3. Solar PVConnection applications for solar PV generators are most frequent in southern regions of Ireland where sun exposure is highest resulting in greater solar PV generation capacity factors. Figure 15 demonstrates this with the highest assumed growth in capacities shown in the South-East, South-West, Mid-East and Midland regions. This is most pronounced in our Low Carbon Living scenario which assumes the largest levels of large-scale connections to the transmission network.
Solar PV capacities were distributed across the transmission system in two ways depending on the scale of the generation. Large-scale solar PV generators connected directly to the distribution or transmission systems were allocated to different regions in Ireland based on connection applications. Small-scale solar PV generators located on domestic or commercial rooftops, also known as micro or embedded generators were distributed across the network based on distribution demand profiles.
The profile of regional capacities is different in our Consumer Action scenario, as shown in Figure 15 and 16. Consumer Action assumes the highest amount of rooftop solar PV or embedded generation. Although the expected capacities in the South-East, Mid-East and South-West are higher than other regions, the overall spread is flatter across the regions when compared to the three other scenarios. This is due to greater levels of roof-top solar PV up-take in our Consumer Action scenario leading to higher capacities in regions with dense populations such as Dublin, the South-East and the Mid-East.
-
100
200
300
400
500
600
700
800
South-East South-West Mid-East Midland Dublin West Border Mid-West
MW
Low Carbon Living Consumer Action Steady Evolution Slow Change
Figure 15 – Solar PV capacity in 2030 by region

EirGrid – Tomorrow’s Energy Scenario 2017 Locations • Planning our Energy Future • Page 26
Figure 16 – Solar PV capacity growth, from current levels, by 2030 by region
Steady Evolution
Slow Change
Low Carbon Living
Consumer Action
EirGrid – Tomorrow’s Energy Scenario 2017 Locations • Planning our Energy Future • Page 27
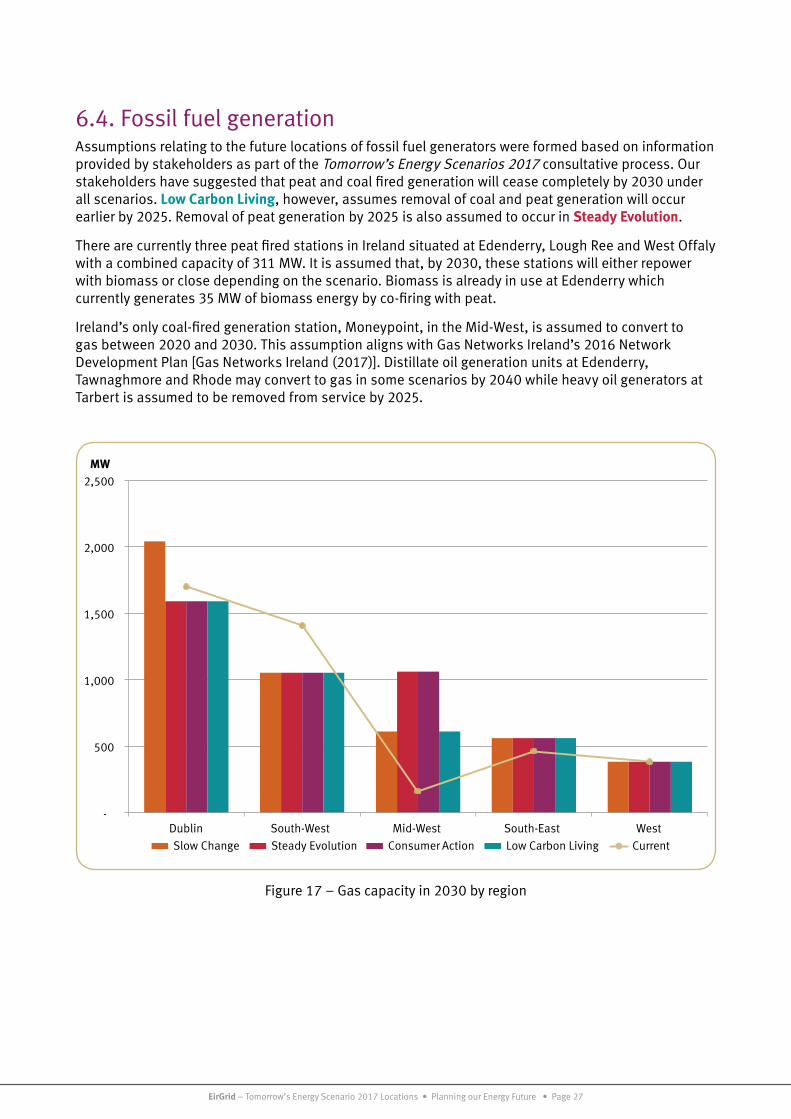
6.4. Fossil fuel generationAssumptions relating to the future locations of fossil fuel generators were formed based on information provided by stakeholders as part of the Tomorrow’s Energy Scenarios 2017 consultative process. Our stakeholders have suggested that peat and coal fired generation will cease completely by 2030 under all scenarios. Low Carbon Living, however, assumes removal of coal and peat generation will occur earlier by 2025. Removal of peat generation by 2025 is also assumed to occur in Steady Evolution.
There are currently three peat fired stations in Ireland situated at Edenderry, Lough Ree and West Offaly with a combined capacity of 311 MW. It is assumed that, by 2030, these stations will either repower with biomass or close depending on the scenario. Biomass is already in use at Edenderry which currently generates 35 MW of biomass energy by co-firing with peat.
Ireland’s only coal-fired generation station, Moneypoint, in the Mid-West, is assumed to convert to gas between 2020 and 2030. This assumption aligns with Gas Networks Ireland’s 2016 Network Development Plan [Gas Networks Ireland (2017)]. Distillate oil generation units at Edenderry, Tawnaghmore and Rhode may convert to gas in some scenarios by 2040 while heavy oil generators at Tarbert is assumed to be removed from service by 2025.
-
500
1,000
1,500
2,000
2,500
Dublin South-West Mid-West South-East West
MW
Slow Change Steady Evolution Consumer Action Low Carbon Living Current
Figure 17 – Gas capacity in 2030 by region

EirGrid – Tomorrow’s Energy Scenario 2017 Locations • Planning our Energy Future • Page 28
The effect of gas repowering is demonstrated in Figure 17 , which displays gas capacities today and in 2030 by region. We can see an increase in the Mid-West region due to gas repowering of Moneypoint. The South-West sees a reduction in gas capacity in 2030 compared to today as aged gas fired generators are removed from service.
Closure of a Open Cycle Gas Turbine (OCGT) unit is assumed [EirGrid, (2017a)] in the Dublin region for all scenarios by 2030. However, gas capacities are assumed to increase in the Dublin region, by 2030, in Slow Change due to comparatively lower levels of renewable generation on the transmission system.
Although some regions may experience decreases in gas capacity an overall net increase in gas capacity is assumed in Ireland by 2030.

EirGrid – Tomorrow’s Energy Scenario 2017 Locations • Planning our Energy Future • Page 29
7. Electricity storage and interconnection7.1. Electricity storageIreland has traditionally used pumped hydro energy storage; however, battery energy storage and compressed air energy storage technologies are becoming more widely used in transmission systems around the world.
Ireland’s Turlough Hill station in Wicklow uses pumped hydro energy storage technology and has a maximum export capacity of 292 MW. A second pumped hydro energy storage facility is assumed to connect to the transmission system by 2030 as part of our Low Carbon Living scenario. This facility is expected to have a maximum export capacity of 360 MW and connect to the grid in the Midland region.
Large-scale battery energy storage systems are assumed to have capacities of 10 MW or greater and are connected directly to transmission or distribution systems or installed within wind or solar PV farms. EirGrid has received applications for a number of large-scale battery energy storage facilities to connect the transmission system. We have used these applications to determine our future battery energy storage locations. The upcoming DS3 volume capped procurement process may affect the future locations of battery energy storage, however, this is not reflected in our Tomorrow’s Energy Scenarios locations.
Figure 18 displays large-scale battery energy storage capacities in 2030 by region. Low Carbon Living assumes significantly more capacity than the other three scenarios in all regions. For instance, capacities for Low Carbon Living are 24 times that of the Slow Change which assumes an overall capacity of 50 MW in 2030. This reflects the scale of renewable generation expected in the Low Carbon Living scenario compared to the other scenarios.
0
100
200
300
400
500
600
Midland South-East West Mid-East South-West
MW
Low Carbon Living Consumer Action Steady Evolution Slow Change
Figure 18 – Large-scale battery storage capacity in 2030 by region

EirGrid – Tomorrow’s Energy Scenario 2017 Locations • Planning our Energy Future • Page 30
Our scenarios assume that less small-scale battery storage capacity is expected to connect to the transmission system compared to large-scale systems. Small-scale batteries are considered to be domestic household batteries or battery banks with capacities less than 10 MW. We expect that these storage solutions will augment rooftop solar PV generators or small wind and solar PV farms connected to the distribution system.
It is assumed that small-scale batteries will somewhat offset, at times, existing distribution load and so capacities have been allocated to transmission stations on a pro rata basis based on the recorded distribution load readings. This is illustrated in Figure 19 as the concentrations of small-scale battery capacities in 2030 are highest in regions with high population densities and the largest proportions of distribution load.
-
50
100
150
200
250
Dublin South-West Border South-East Mid-East Mid-West West Midland
MW
Consumer Action Low Carbon Living Steady Evolution Slow Change
Figure 19 – Small-scale battery storage capacity in 2030 by region
Small-scale batteries are most prominent in Consumer Action as households seek to better utilise rooftop solar PV generators. Capacities are highest in all regions for this scenario, although, more sparsely populated regions are assumed to experience marginal growth in all scenarios. The Midlands region, for example, is expected to contain maximum capacities ranging between 49 MW and 3 MW under our Consumer Action and Slow Change scenarios respectively. This is because distribution load levels are relatively low in these regions suggesting that low growth of small-scale battery capacities can be expected.

EirGrid – Tomorrow’s Energy Scenario 2017 Locations • Planning our Energy Future • Page 31
7.2. InterconnectionIreland is currently interconnected with Great Britain through the East West Interconnector and to Northern Ireland via a 275 kV double circuit line. There are also two 110 kV tie lines between Northern Ireland and Ireland. However, these tie lines are not interconnectors as they do not, on their own, have sufficient power carrying capacity to securely hold the two transmission systems together.
The East West Interconnector uses HVDC technology and connects Deeside in Wales to the Woodland substation in Meath. The maximum transfer capacity of this interconnector is 500 MW. Further interconnection with Northern Ireland is planned with the high voltage alternating current North South Interconnector planned to be completed in 2023. This project will increase the total transfer capacity between Ireland and Northern Ireland to 1,200 MW. This transfer capacity is lower than the combined design capacities of both interconnectors. This is because power flows on these interconnectors must be limited so that the transmission systems, both sides of the border, remain stable if one of the interconnectors were to go down unexpectedly.
Table 2 displays HVDC interconnector capacities in 2030 by region. The expected quantity of HVDC interconnections varies from one to three depending on the Scenario. Slow Change assumes that the East West Interconnector provides Ireland’s only HVDC transfer capacity in 2030 and that no further interconnectors have been commissioned. This is due to a lack of capital funding caused by unfavourable economic conditions. Under this scenario Ireland does not meet its EU interconnection targets.
Consumer Action and Steady Evolution assume that an additional interconnector is built in addition to the East West Interconnector. This second interconnector has a capacity of 700 MW and is assumed to connect the electricity transmission systems of Ireland and France. Low Carbon Living assumes that an additional interconnector will connect Ireland with Great Britain by 2030. This interconnector is assumed to have a total transfer capacity of 500 MW and connects to the Irish transmission system in the South-East region. This would take Ireland’s total HVDC interconnector transfer capacity to 1,700 MW in Low Carbon Living by 2030.
Region Low Carbon Living Consumer
Action Steady
Evolution Slow
Change
Mid-East 500 500 500 500
South-West 700 700 700
South-East 500
Table 2 – HVDC Interconnection capacity (MW) in 2030 by region

EirGrid – Tomorrow’s Energy Scenario 2017 Locations • Planning our Energy Future • Page 32
Appendix 1 – Demand dataDemand technology Region Steady
Evolution Low Carbon
Living Slow
Change Consumer
Action
Data Centre (MVA) Border - 49 - -
Dublin 1,026 1,073 850 1,358
Mid-West - 184 - 19
South-East - 147 - -
South-West 60 342 - 124
West 14 155 - 174
Data Centre Total (MVA) 1,100 1,950 850 1,675
Electric Vehicle (MW) Border 27 46 10 61
Dublin 66 114 24 150
Mid-East 21 36 8 47
Midland 14 24 5 31
Mid-West 19 33 7 44
South-East 26 45 9 59
South-West 34 58 12 77
West 18 31 6 41
Electric Vehicle Total (MW) 225 388 81 510
Heat Pump (MW) Border 37 52 18 63
Dublin 85 118 42 144
Mid-East 27 37 13 45
Midland 19 27 10 33
Mid-West 25 35 13 43
South-East 37 52 18 63
South-West 45 63 22 76
West 25 35 12 42
Heat Pump Total (MW) 299 420 150 509
Table 3 – Electricity demand in 2030 by region and technology

EirGrid – Tomorrow’s Energy Scenario 2017 Locations • Planning our Energy Future • Page 33
Appendix 2 – Generation dataGeneration Technology Region Steady
Evolution Low Carbon
Living Slow
Change Consumer
Action Onshore Wind Border 1,049 1,081 905 1,053 Dublin 10 8 10 7 Mid-East 109 204 109 150 Midland 186 486 186 118 Mid-West 589 404 451 521 South-East 671 703 665 770 South-West 1,564 1,349 1,458 1,666 West 962 1,265 856 1,095 Onshore Wind Total 5,140 5,500 4,640 5,380 Offshore Wind Border 70 311 23 102 Dublin 363 1,601 121 525 Mid-East 74 243 41 96 Mid-West 72 319 24 104 South-East 72 319 24 104 West 49 207 17 69 Offshore Wind Total 700 3,000 250 1,000 Solar PV Border 27 95 11 112 Dublin 30 181 12 168 Mid-East 114 509 46 313 Midland 53 255 21 143 Mid-West 11 68 4 52 South-East 135 717 54 339 South-West 99 551 40 269 West 31 124 12 104 Solar PV Total 500 2,500 200 1,500 Gas Dublin 1,593 1,593 2,043 1,593 Mid-West 1,062 612 612 1,062 South-East 562 562 562 562 South-West 1,055 1,055 1,055 1,055 West 388 388 388 388 Gas Total 4,660 4,210 4,660 4,660 Large-Scale Battery Mid-East 23 110 5 37 Midland 103 495 21 165 South-East 73 352 15 117 South-West 5 22 1 7 West 46 221 8 74 Large-Scale Battery Total 250 1200 50 400 Small-Scale Battery Border 24 60 6 96 Dublin 59 147 15 235 Mid-East 18 46 5 74 Midland 12 30 3 49 Mid-West 17 43 4 69 South-East 23 58 6 93 South-West 30 75 8 121 West 17 41 3 63 Small-Scale Battery Total 200 500 50 800
Table 4 – 2030 Electricity generation capacity (MW) in 2030 by region and technology

EirGrid – Tomorrow’s Energy Scenario 2017 Locations • Planning our Energy Future • Page 34
ReferencesAurora TELECOM. National Network. Aurora TELECOM. 2017. https://www.auroratelecom.ie/network-maps/national-network/.
Department of Business, Enterprise and Innovation. The Role of Data Centres in Ireland’s Enterprise Strategy. Department of Business, Enterprise and Innovation, 2018.
Department of Communications, Climate Action and Environment. National Energy Efficiency Plan for Ireland #4 2017-2020. Department of Communications, Climate Action and Environment, 2017.https://www.dccae.gov.ie/documents/NEEAP%204.pdf
Department of Communications, Energy & Natural Resources, Ireland’s Transition to a Low Carbon Energy Future. Department of Communications, Energy & Natural Resources, 2015.
Department of Communications, Energy and Natural Resources. Offshore Renewable Energy Development Plan. Department of Communications, Energy and Natural Resources, 2014.
Department of Housing, Planning & Local Government. myplan.ie. Ordnance Survey Ireland. 2017. http://www.myplan.ie/webapp/.
Department of the Environment, Community and Local Government, Proposed revisions to Wind Energy Development Guidelines 2006. Department of the Environment, Community and Local Government, 2013.
EirGrid. All Island Generation Capacity Statement 2017-2026. Dublin: Eirgrid, 2017a.
EirGrid. Connected and Contracted Generators - Ireland. EirGrid, 2017d. http://www.eirgridgroup.com/customer-and-industry/general-customer-information/connected-and-contracted-generators/.
EirGrid. Have Your Say. EirGrid, 2016.
EirGrid. Offer Process Transmission Connection Applicant List. EirGrid, 2017c.
EirGrid. Tomorrow’s Energy Scenarios 2017. EirGrid, 2017b.
EirGrid. Transmission Development Plan 2015-2025. EirGrid, 2015.
electronic Irish Statute Book (eISB). “Planning and Development (Strategic Infrastructure) Act 2006.” electronic Irish Statute Book (eISB), 2006. http://www.irishstatutebook.ie/eli/2006/act/27/enacted/en/print.html.
ENSTOE. TYNDP 2018, Scenario Report, Main Report. ENTSOE, 2016. https://docstore.entsoe.eu/Documents/TYNDP%20documents/TYNDP2018/Scenario_Report_2018_Final.pdf
ESB Networks. Connected and Contracted Generators - Statistics. ESB Networks, 2018. https://www.esbnetworks.ie/new-connections/generator-connections/generator-connection-statistics.
Gas Networks Ireland. Network Development Plan 2017. Gas Networks Ireland, 2017.
Government of Ireland. Project Ireland 2040, National Planning Framework. Government of Ireland, 2018.
Host In Ireland. Ireland’s Data Hosting Industry. Host In Ireland, 2017.
International Energy Agency. Renewables 2017. International Energy Agency, 2017. https://www.iea.org/publications/renewables2017/#section-1-3.
Ordnance Survey Ireland. NUTS3 Boundaries Ungeneralised - OSi National Statistical Boundaries. Ordnance Survey Ireland, 2017.

EirGrid – Tomorrow’s Energy Scenario 2017 Locations • Planning our Energy Future • Page 35
https://data.gov.ie/dataset/nuts3-boundaries-ungeneralised-osi-national-statistical-boundaries.
Central Statistics Office. Population and Labour Force Projections. Central Statistics Office, 2013a.
Central Statistics Office. Regional Population Projections. Central Statistics Office, 2013b.
PWC. Transitioning to a low carbon energy system. PWC, 2017.
TeleGeography. Submarine Cable Map. TeleGeography. 2018. https://www.submarinecablemap.com/#/.

EirGrid – Tomorrow’s Energy Scenario 2017 Locations • Planning our Energy Future • Page 36
Notes:

EirGrid – Tomorrow’s Energy Scenario 2017 Locations • Planning our Energy Future • Page 37
Notes:

EirGrid – Tomorrow’s Energy Scenario 2017 Locations • Planning our Energy Future • Page 38

EirGrid – Tomorrow’s Energy Scenario 2017 Locations • Planning our Energy Future • Page 39EirGrid – Tomorrow’s Energy Scenarios • Planning our Energy Future • Page 30
The Oval, 160 Shelbourne Road, Ballsbridge, Dublin D04 FW28 • Telephone: 01 677 1700 • www.eirgrid.com
7241 EirGrid - Generic Community & Proximity (FA).indd 8 12/09/2016 17:59
Printed on recycled paper